biogeographical patterns of variation, and taxonomy. - WUR ...
Upload
khangminh22Category
view
1download
0
Original article
Biogeographical correlates of population variancein the honeybees (Apis mellifera L) of Africa
HR Hepburn SE Radloff
1Department of Zoology and Entomology;2Department of Statistics, Rhodes University, Grahamstown 6140, South Africa
(Received 9 September 1996; accepted 5 March 1997)
Summary — Multivariate analyses of morphometric characteristics of worker honeybees from fivetransects through northwestern, northeastern, west central, southwestern and southeastern Africayielded sequences of statistically defined morphoclusters (= subspecies) alternating with heteroge-neous zones of introgression. All transects contain areas of significantly high variance. High intra-colonial variance indicates localised genetic variation and out-cross matings. Regions of high inter-colonial variance occur at and between subspecific boundaries. These are typical of transitionsbetween, and rainfall-temperature discontinuities within, different ecological-climatological zones.They constitute areas of ecological instability amidst otherwise contiguous populations.
honeybee / populations / morphometrics / variance / phenology / Africa
INTRODUCTION
From a factor plot of a principal componentanalysis of morphometric characters Rut-tner et al (1978) deduced that Apis mellif-era comprises three lineages, a conclusionsupported by mtDNA analyses (Comuet andGamery, 1991a, b; Gamery et al, 1992). Ofthese, honeybees of the African lineage areclassified as several subspecies and/or eco-types at a continental macrolevel (Ruttner,1988, 1992; Kerr, 1992). More refined,
mesolevel sampling in a spatial context hasbegun to illuminate previously undetectablevariations in honeybee populations (Lebdi-Grissa et al, 1991; Smith et al, 1991; El-Sarrag et al, 1992; Crewe et al, 1994; Hep-burn et al, 1994, 1997; Moritz et al, 1994,1997; Garnery et al, 1995).
While the discrimination of honeybeeraces (Ruttner et al, 1978; et alii), ecotypes(Louis and Lefebvre, 1968; Tomassone andFresnaye, 1971) and genetic lines (Louis et
* Correspondence and reprintsTel: (27) 461 318098; fax: (27) 461 24377; e-mail: [email protected]

al, 1968) can be achieved by principal com-ponent analysis, explanations of statisticalinferences about honeybee populationsshould ultimately be interpreted in a con-text of topography and climate on the onehand and the phenologies of flowering andcolony cycles on the other (Ruttner, 1988,1992). For Africa, another layer of com-plexity comes with colony movements(reproductive swarming, but especiallymigrations and amalgamation) that alter theprobability of gene flow within and betweenpopulations. In this report we define thevariance distributions within and betweenthe clusters of several African subspeciesof honeybees and indicate probable zonesof introgression. These data are then dis-cussed with reference to the biogeographi-cal contexts in which the bees actually live.
MATERIALS AND METHODS
Worker honeybees were sampled from thecolonies of small scale, fixed-site beekeepersalong five transects in northwestern, northeastern,west central, southwestern and southeasternAfrica representing all major ecological-clima-tological zones of the continent (fig 1). Individ-ual localities and inter-locality distances for eachregion are indicated in the tables for each transect.
Four to six colonies were sampled at eachlocation along each of the transects. Andersonand van Schalkwyk (1977) and Ruttner (1988)demonstrated that between 10 and 20 bees wouldbe a sufficient sample size for morphometric sta-tistical analysis. Thus, morphometric measure-ments were made on samples of 20 workerbees/colony. Although Ruttner (1988) employed36 morphometric characters in his global analy-sis of honeybees, he also indicated that as fewas ten characters were adequate to resolve thehoneybees of Africa using stepwise discriminantanalysis. Crewe et al (1994) confirmed this resultand showed that a suite of only 11 charactersprovided the same level of discrimination forAfrican bees as had the original suite of 36 char-acters. Therefore, for all honeybee workers ofall transects a standard suite of 11 morphometriccharacters was measured. Their Ruttner (1988)numbers are given in brackets [except the wingangle MJI, see Ruttner (1988) fig 6.9, p 73) as
follows: length of cover hair on tergite 5 (1),length of proboscis (4), width of wax plate onsternite 3 (11), length of wax plate on sternite 3(13), wing angle B4 (22), wing angle N23 (30),wing angle 026 (31), pigmentation of abdominaltergite 2 (32), pigmentation of scutellum (35)and pigmentation of scutellar plate (36).
The means and variances of each morpho-metric character were calculated for each colony.Multivariate statistical analysis of the colonymean data included principal component analy-sis (PCA), factor analysis (FA) and stepwise lin-ear discriminant analysis (DA). The last proce-dure, however, may provide an overly optimisticestimate of the probability of correct classifica-tion. A jackknife procedure was therefore car-ried out which classified each colony into a groupwith the highest posterior probability accordingto the discrimination functions computed fromall the data except the colony being classified.This is repeated for each colony left out in turn(Lachenbruch and Mickey, 1968).
Wilks’ lambda statistic was used to test for
significant differences in the cluster vector ofmeans of the characters entered into the dis-criminant functions. The distribution of the Astatistic was approximated by the F distribution(Mardia et al, 1979). Mahalanobis distances werecalculated between the clusters and 100(1-α)%confidence ellipses constructed for each clusterfor various values of α (Cornuet, 1982).A factor analysis procedure using the char-
acter measurements of each bee was carried outto determine the first factor scores of each bee.The intracolonial variances were computed ateach locality from the factor scores. The inter-colonial variances were computed by the samemethod but this time the colony means were usedto determine the first factor scores of each colony.Levene’s F statistic was used to test for homo-
geneity of the intra- and intercolonial variances.This test procedure is based on an analysis ofvariance using the absolute deviation of eachcase from its locality mean (Brown and Forsythe,1974). Because of serious implications that mayarise from small sample sizes when comparingvariances, the localities with fewer than fivecolonies are indicated for each transect in tablesI-V.
The relations of population morphologicalvariation with environmental variables were
investigated by canonical correlation analyses.The significance of each canonical variable wastested using Bartlett’s statistic approximated by

a chi-square distribution. The environmental vari-ables used were temperature, rainfall and alti-tude at each location. Rainfall and temperaturedata were taken from Jackson (1961) and Muller(1982). Data on swarming/migration wereobtained from beekeepers at the different local-
ities and from the literature (Hepburn andRadloff, 1995). The basic data on morphometricsused in this analysis were obtained from Hep-burn and Radloff (1996), Radloff and Hepburn(1997a, b), Radloff et al (1996, 1997).


RESULTS
Northwestern Africa and southern
Europe
Comprehensive multivariate analyses of theworker honeybees along a transect from theSahara to the Pyrénées (fig 1) unequivocallyestablished the occurrence of three majormorphoclusters that are classified assahariensis, intermissa and iberica (tableI). In addition, the iberica cluster could befurther resolved into three biometric sub-
groups. Moreover, when the originalmtDNA data of Garnery et al (1995),obtained from different localities but in thesame region, was subjected to Greenacre’s(1988) method of analysis, six distinct andsignificantly different mtDNA subgroupswere obtained (table I).
When the variances of the morphometriccharacters were tested for homogeneity, asignificant difference was found betweenthe intracolonial variances over all locali-ties (table I, Levene’s test F = 4.54 with12,730 df, P < 0.0001). In pair-wise testsbetween localities the variances obtainedfor Tan Tan, S Rabat, Ksar-El-Kebir,Tetouan (small sample) and Montblanc weresignificantly different from the other local-ities along this transect (table I). There wereno significant differences in the intercolonialvariances between localities (table I, F =1.57 with 12,60 df, P = 0.1239); however,large values of variance were obtained forTan Tan, Tetouan (small sample) and Ksar-El-Kebir (Hepburn and Radloff, 1996).
A canonical correlation analysis revealeda significant correlation (R = 0.97) betweenthe set of morphological characters and theset of environmental variables (table VI).The largest squared multiple correlation wasfound between temperature and the set of
morphometric variables (R2 = 0.93, P <
0.0001).
Northeastern Africa
Multivariate analyses of worker honeybeesalong a north-south transect through thehighlands of Ethiopia (fig 1) yielded threemorphometrically distinct clusters, whichare classified as jemenitica, bandasii andsudanensis (table II). This represents a sub-division of jemenitica (Ruttner, 1988) sub-sequent to the availability of considerablyenhanced data bases for this region (Mogga,1988; El-Sarrag et al, 1992; Radloff andHepburn, 1997a). The variances of the firstfactor scores of the morphometric charac-ters were used to test for homogeneity ofthe intracolonial variances at each locality.A significant difference was found betweenthe variances (Levene’s test F = 15.00 with7,825 df, P < 0.0001) and concentratedbetween Adi Arkay and Gonder (table II).The intercolonial variances were computedfor each locality and Levene’s test used totest for heteroscedasticity. A significant dif-ference at the 10% level of significance wasestablished between the intercolonial vari-ances (F = 2.10 with 7,34 df, P = 0.0704).Large values of variance were noted forGonder and Holeta (table II).A significant canonical correlation (R =
0.83) was established between the set ofmorphological characters and the set of envi-ronmental variables (table VI). The largestsquared multiple correlation was foundbetween rainfall and the set of morphomet-ric variables (R2 = 0.69, P = 0.0026).
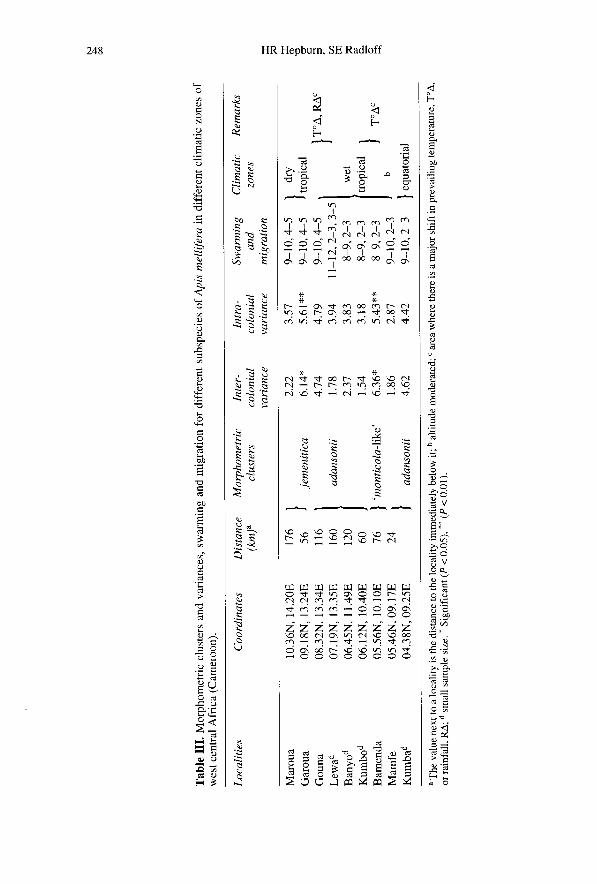
West central Africa
Multivariate analyses of worker honeybeesalong a transect from southwestern to north-eastern Cameroon (fig 1) showed that thesehoneybees resolved into three distinct mor-phoclusters. The honeybees of southern andcentral Cameroon are classified as adan-sonii whose distribution is intruded in thesouthern Bambouto mountains by a large,monticola-like bee, while those in the north

consist of a discrete population of thesmaller jemenitica (table III).
In tests for homogeneity of the variancesof the morphometric characters at each local-ity significant differences were found forall intracolonial variances (table III, Lev-ene’s test F = 8.38 with 8,771 df, P <
0.0001). Intercolonial variances computedby the same method resulted in significantdifferences between localities, notablyBamenda and Garoua (table III, F = 2.22with 8,31 df, P = 0.0529).
A canonical correlation analysis was usedto assess the environmental variability inhoneybees along the transect. A significantcanonical correlation (R = 0.83) wasobtained between the set of morphologicalcharacters and the set of environmental vari-ables (table VI). Larger squared multiplecorrelations were detemined between rain-fall and temperature and the set of morpho-metric variables (rainfall: R2 = 0.85, P <
0.0001; temperature: R2 = 0.75, P < 0.0001).
Southwestern Africa
Multivariate analyses of worker honeybeesalong a transect from the Cape peninsula inSouth Africa to northern Namibia (fig 1)established the occurrence of three distinctand homogeneous morphoclusters. Theseare classified as capensis in the southern-most Cape, scutellata in northern SouthAfrica and southern Namibia, and adansoniiin the far north (table IV).
In tests of homogeneity of the variancesof the morphometric characters, intracolonialvariances for all localities differed signifi-cantly (table IV, Levene’s test F = 1.89 with6,553 df, P = 0.0808). While there were nosignificant differences between the inter-colonial variances, notably high values wereassociated with Citrusdal, Mariental andWindhoek (table IV, F= 1.29 with 6,21 df,P = 0.3052).
A canonical correlation analysis showedno significant correlation between the setof morphological characters and the set ofenvironmental variables (table VI).
Southeastern Africa
Multivariate analyses of worker honeybeesalong a transect from coastal Mozambiquethrough the highlands of Zimbabwe and onto northwestern Zambia (fig 1) indicate thatthese honeybees morphometrically resolveinto three distinct populations. These groupsare respectively classified as litorea, scutel-lata and adansonii and are distributed asshown in table V.
When homogeneity of the variances wasassessed a significant difference was foundbetween the intracolonial variances over allthe localities (table V, Levene’s test F =2.30 with 7,752 df, P = 0.0251). Larger vari-ances were found at Karoi and Kitwe.
While, no significant difference was foundin the intercolonial variances between local-ities (table V, F = 1.40 with 7,30 df, P =0.2415), the intercolonial variation was againhigher between the Karoi and Kitwe regions.A significant canonical correlation (R =
0.89) was found between the set of mor-phological characters and the set of envi-ronmental variables (table VI). The largestsquared multiple correlation was betweentemperature and the set of morphometicvariables (R2 = 0.76, P = 0.0008).
Inter-transect correlations and variances
A canonical correlation analysis performedon all five transects (fig 1) yielded a signif-icant correlation between the full set of mor-
phological characters and the full set of envi-ronmental variables (table VI). In thesecomparisons, temperature variation was themost significant factor in the relationship(R2 = 0.62, P < 0.0001). Similarly, Levene’s


test was used to test for significant differ-ences in the variations in temperature, rain-fall and altitude over all five transects. Sig-nificantly larger variations in temperature(F = 10.6, P < 0.0001), rainfall (F = 56.4, P< 0.0001) and altitude (F = 13.3, P < 0.0001)were found along the west central transectand in temperature along the northwesterntransect.
DISCUSSION
A morphometrically discrete honeybee pop-ulation is based on group homogeneityobtained through multivariate analysis (Rut-tner et al, 1978; Ruttner, 1988). In theabsence of physical, phenological or repro-ductive barriers, clinal changes betweenadjacent populations may be reflected intheir variance spectra (Futuyma, 1986). Thevariance may also indicate the ’genetic per-meability of statistical boundaries’ betweenneighbouring populations and sometimesalso the direction of flow at a point in time.The interpretation of population variancebecomes more meaningful in a biogeo-graphical context.
In northwest Africa the structure and vari-ance characteristics of the honeybee popu-lations extending between the Sahara andthe Pyrenees can be related to prevailingclimatic and biological factors (table I). The
area is a winter rainfall region but withnotable discontinuities (Jackson, 1961;Muller, 1982). There is a phase change inthe dry season from months 5 to 9 in thesouth to 7-9 in the north of Morocco; that ofSpain is further reduced to months 6-8.There are also discontinuities in rainfall,which is most intense for months 10-4 inthe south and north but compressed tomonths 11-2 in the central area of Morocco;a similar pattern occurs in Spain (Jackson,1961; Muller, 1982). These factors of cli-mate are reflected in the flowering phe-nologies of the principal bee plants, which inturn drive the annual colony cycle (Hep-burn and Radloff, 1995).
Similarly there are important disconti-nuities in the temperature profiles of thetransect (S Rabat and Puerto de Sagunto)where equableness for honeybee flight issignificantly reduced. The swarming sea-son begins early in southern Morocco, grad-ually shifting over the 1 000 km to the northcoast (table I); the same sequence is repeatedin southern and eastern Spain (Verdu Gal-lardo, Garcia Raso, pers comms). Thedegree of overlapping of swarming seasonsbetween adjacent localities varies from yearto year. The general trend of the data showsthat centroids of high variance (near edges ofclusters defined morphometrically or bymtDNA analysis) are typically associatedwith climatic and biological areas of transi-
tion (table I), which are regions of ecologi-cal instability from the perspective of a con-tiguous population.
In northeast Africa (fig 1) Ethiopia is amountainous country of tortuous relief. Thecentral highlands are well-watered and thetemperatures are moderated by altitude,which averages more than 2 000 m. Whilethe highlands lack large variations in tem-perature, rainfall discontinuities and transi-tions along the transect are pronounced (fig1, table II). Rainfall diminishes from southto north and is intense during months 6-10with a correspondingly long dry season,months 11-5 (Jackson, 1961; van Chi-Bon-nardel, 1973). Despite widespread bee-keeping activity in this region, it is extremelysparsely documented in the apicultural lit-erature.
There are two major centroids of signif-icantly high variance for this region (tableII). The most notable one, to the north,occurs within the jemenitica morphoclus-ter and transgresses into the sudanensis mor-
phocluster. The boundary between the twoclusters is climatically transitional betweendry tropical and sahelian zones. The secondcentroid, at Holeta (very near Addis Ababa),is associated with a thin wedge of sahelianclimate between two dry tropical zones.
In west central Africa the populationstructure of the honeybees can be related tothe climatic and biological conditions of theregions studied (fig 1). Cameroon is transi-tional between the equatorial and the drytropical zones, a physiographic ensembleextending from sea level, through moun-tains and massif, gradually descending intodepressed alluvial plains in the northern inte-rior (van Chi-Bonnardel, 1983). These phys-ical transitions are associated with differ-ent ecological-climatological zones (Walter,1973, 1976) and significant differences inthe honeybee populations of the regionreflect the environmental variation (tableIII).
There are two centroids of significantlyhigh variance in the region; the first is cen-tred on Garoua and the second in theMamfe-Bamenda area (table III). The twocentroids are interpreted, respectively, aszones of hybridization between adansoniiand the monticola-like group to the southand between adansonii and jemenitica tothe north. It is evident from table III that the
high variance distribution in the honeybeesis coincident with ecological-climatologi-cal transitions and their associated discon-tinuities in temperature and rainfall, indica-tors of ecological instability. Obviouslyhybridization between adjacent localities isfacilitated by the extent to which theirswarming and migration periods overlap(table III).
In southwestern Africa (fig 1) the mul-tivariate analyses of the bees show a north-ward progression from capensis at the Capepeninsula, through scutellata and to adan-sonii in northern Namibia (table IV). Areasof introgression and hybridization can beanticipated from the variance distributions inrelation to the climatic zones (table IV).High variances are associated with edgeeffects between different climatic zones aswell as at areas where there are local dis-continuities in the rainfall and temperatureprofiles. The honeybee populations of thisregion of southwestern Africa appear farless stable than the others studied as evi-denced by the distribution widths of highvariance values and relatively small mor-phocluster areas. It is also evident that over-lap in swarming also shifts in conjunctionwith climatic transition.
In southeastern Africa the whole of the
Beira-Ikelenge region falls in the same drytropical climatic zone (fig 1; Walter, 1973;Cole, 1986) but variations occur. The plainsof Mozambique are +8 °C above the Zim-babwe highveld and the temperature tran-sition at the Mutare escarpment is abrupt.The temperature profile across the highveldis rather uniform except for an interesting
+6 °C discontinuity at the Zambezi RiverValley (Jackson, 1961). This area is a cen-troid of high variance values and of intro-gression between adansonii and scutellata(table V).
The temporal distribution of swarmingand migration shows considerable overlapacross the transect (table V) but a secondswarming season (months 2-4) has devel-oped in recent decades with the introduc-tion of Eucalyptus plantations into the Karoiregion (Coleman, pers comm). The interca-lation of another swarm period, coupled tothose of south central Zambia, provides aconsiderable corridor for gene flow and fur-ther instability in a region that is already acentroid of high variance. Reduced contactthrough swarming and migration in the beesof Zambia can be related to flowering. Inthe Lusaka-Kitwe area Brachystegia andJulbernardia support two swarm periods;but Brachystegia is virtually absent fromthe Solwezi-Ikelenge area, leaving a singleswarming season (table V, Silberrad 1976;Chupa, pers comm) and, notably lower lev-els of variance.
Statistically derived and homogeneousmorphoclusters (= subspecies sensu Rut-tner, 1988) occur in all of the transects ofAfrica investigated (tables I-V). The lineardistance occupied by each subspecific mor-phocluster, where two boundaries could bemeasured (n = 7), averages 475 ± 282 kmand the width of introgression zonesbetween two adjacent populations 125 ±146 km, a distance within the annual dis-persal capacity of these honeybees. Nonethe-less different honeybee traits (nuclear andmtDNA, pheromones, flight capacity) dis-perse between these populations to differ-ing distances and, presumably, at differentrates (Hepburn et al, 1994, 1997; Garnery etal, 1995; Moritz et al, 1994, 1997).
All of the transects contain areas of sig-nificantly high intracolonial and intercolo-nial variance. The former are interpreted asevidence pointing to a high intrinsic genetic
variation in localised drone congregationsites, hence similar percentage of out-crossmatings (Moritz and Southwick, 1992). Cen-troids of high intercolonial variance suggesta high genetic ’permeability’ in the statisti-cal boundaries of populations resulting inintrogression zones between neighbouringpopulations. Centroids of high variance areclosely associated with transitions between,and discontinuities of rainfall and tempera-ture within, the different ecological-clima-tological zones. Finally, high levels of sta-tistical heterogeneity within and betweenpopulations go hand-in-hand with ecologi-cal instability (table VI).
Résumé — Corrélats biogéographiquesde la variance de la population chezl’abeille mellifère (Apis mellifera L)d’Afrique. Des ouvrières d’abeilles ont étéprélevées le long des transects suivants, fai-sant chacun plus de 1000 km :
Maroc-Espagne, Éthiopie, Cameroun,Afrique du Sud-Namibie et Mozam-bique-Zimbabwe-Zambie (fig 1). Onzecaractères morphométriques ont été analyséspar des méthodes statistiques multivariées.On a obtenu des groupes définis morpho-métriquement (tableaux I-V), qui ont étéconsidérés comme des sous-espèces (Rutt-ner, 1988). Une attention particulière a étéportée à l’estimation de la variance commemoyen d’établir les zones de répartition dessous-espèces et de définir les zones d’intro-gression entre elles.Les populations d’abeilles des cinq tran-sects montrent une alternance séquentielle derégions ayant une homogénéité statistique(sous-espèces) et de zones de forte varianceet d’hétérogénéité (tableaux I-V). Ces der-nières sont interprétées comme étant deszones d’introgression entre populations sub-spécifiques adjacentes. Des régions locali-sées de forte variance intracoloniale exis-tent et sont considérées comme une preuvede l’ample variation génétique sur les sites

de rassemblement de mâles et d’un nombreélevé de croisements entre les sous-espèces.Il existe aussi des centres de forte varianceintercoloniale le long de chacun des tran-sects (tableaux I-V) ; ils sont interprétéscomme des zones d’introgression. Ils sontétroitement associés à des transitions entredifférentes zones écoclimatologiques(fig 1) et à des discontinuités précipita-tions/températures à l’intérieur de ces zones.Ainsi sont associés de façon caractéristiqueun fort degré d’hétérogénéité au sein despopulations, et entre elles, et des régionsd’instabilité écologiques.Une analyse de corrélation a montré l’exis-tence d’une relation forte variance-instabi-lité écologique (tableau VI). Elle a mis enévidence des corrélations significatives entrel’ensemble des caractères morphologiques etl’ensemble des variables du milieu (tempé-rature, précipitation et altitude). Parmi cesdernières, la température est le facteur leplus significatif.
Apis mellifera / génétique des populations /morphométrie / variance / phénologie /Afrique
Zusammenfassung — BiogeographischeKorrelation von Populationsvarianzenbei Honigbienen (Apis mellifera L) vonAfrika. Proben von Honigbienen wurdenentlang von fünf Schnittlinien mit Längenvon über 1 000 km in folgenden Gebietengesammelt: Marokko-Spanien, Athiopien,Kamerun, Süd Afrika-Namibia und
Mozambique-Simbabwe-Sambia (Abb 1).Elf morphologische Merkmale wurden mitmultivariablen statistischen Methoden ana-
lysiert. Es wurden morphometrische defi-nierte Cluster gefunden (Tab I-V) und Ras-sen (Ruttner, 1988) zugeordnet. BesondereAufmerksamkeit galt der Bestimmung derVarianz als Mittel, um die Reichweite derRassen festzulegen und um Zonen ihrerHybridisierungen zu definieren.
Die Honigbienenpopulationen dieser fünfSchnittlinien zeigten einen aufeinanderfol-genden Wechsel von Regionen statistischerEinheitlichkeit (Rassen) mit Gebieten mithoher Varianz und Verschiedenheit (TabI-V). Letztere werden als Überlappungszo-nen zwischen den benachbarten rassetypi-schen Populationen interpretiert. BegrenzteRegionen mit hoher Varianz innerhalb einesVolkes wurden als Beweis für eine großegenetische Variation auf den Drohnensam-melplätzen und für hohe Anteile von Aus-kreuzungspaarungen angesehen.Entlang aller Schnittlinien gab es Schwer-punkte mit hoher Varianz zwischen den Völ-kern (Tab I-V), die als Zonen der Hybridi-sierung angesehen werden. Diesehochvariierenden Schwerpunkte sind mitÜbergängen zwischen den verschiedenenökologisch-klimatologischen Zonen undunregelmäßigen Temperaturen während derRegenfälle (Abb 1) klar verbunden. Dem-nach ist ein hoher Grad der Verschiedenar-
tigkeit innerhalb und zwischen den Popu-lationen typischerweise mit Regionen vonökologischer Instabilität assoziiert.Eine hohe varianz-ökologische Beziehungder Instabliltät wurde in einer kanonischen
Korrelationsanalyse gezeigt (Tab VI), diesignifikante Korrelationen zwischen derWertmenge der morphologischen Merkmaleund der Wertmenge der Variablen derUmwelt (Temperatur, Regenfall und Höhe)ergab. Von diesen Variablen war die Tem-peratur der bedeutendste Faktor (R2 = 0.62,P < 0.001).
Honigbienen / Population / Morphome-trie / Varianz / Phänologie / Afrika
REFERENCES
Anderson RH, van Schalkwyk DJ (1977) Biometricalanalysis of the Cape honey-bee Apis melliferacapensis Esch. Phytophylactica 9, 41-46
Brown MB, Forsythe AB (1974) Robust tests for theequality of variances. JAm Stat Assoc 69, 364-367

Cole MM (1986) The Savanna, Biogeography andGeobotany. Academic Press, London
Cornuet JM (1982) Représentation graphique de pop-ulations multinormales par des ellipses de confi-ance. Apidologie 13, 15-20
Cornuet JM, Garnery L (1991a) Genetic diversity inApis mellifera. In: Diversity in the Genus Apis (DRSmith, ed), Westview, Boulder, 103-115
Cornuet JM, Garnery L (1991b) Mitochondrial DNAvariability in honeybees and its phylogeographicimplications. Apidologie 22, 627-642
Crewe RM, Hepburn HR, Moritz RFA (1994) Mor-phometric analysis of 2 southern African races ofhoneybee. Apidologie 25, 61-70
El-Sarrag MSA, Saeed AA, Hussein MA (1992) Mor-phometrical study on the Sudanese honeybees. JKing Saud Univ 4, 99-108
Futuyma DJ (1986) Evolutionary Biology, 2nd ed. Sin-auer, Sunderland
Garnery L, Cornuet JM, Solignac M (1992) Evolu-tionary history of the honey bee Apis melliferainferred from mitochondrial DNA analysis. MolEcol 1, 145-154
Garnery L, Mosshine FH, Oldroyd BP, Cornuet JM(1995) Mitochondial DNA variation in Moroccanand Spanish honey bee populations. Mol Ecol 4,465-471
Greenacre MJ (1988) Clustering the rows and columnsof a contingency table. J Classification 5, 39-51
Hepburn HR, Radloff SE (1995) First approximation toa phenology of the honeybees (Apis mellifera) andflora of Africa. Oecologia 101, 265-273
Hepburn HR, Radloff SE (1996) Morphometric andpheromonal analyses of Apis mellifera L. along atransect from the Sahara to the Pyrenees. Apidolo-gie 27, 35-45
Hepburn HR, Jones GE, Kirby R (1994) Introgressionbetween Apis mellifera capensis Eschscholtz andApis mellifera scutellata Lepeletier: the stingpheromones. Apidologie 25, 557-565
Hepburn HR, Radloff SE, Steele GR (1997) Dimen-sional aspects of flight efficiency in honeybee pop-ulations of Africa. J Apic Res (submitted)
Jackson SP (1961) Climatological Atlas of Africa.CCTA/CSA, Lagos
Kassaye A (1990) The honeybees (Apis mellifera) ofEthiopia - a morphometric study. MSc thesis, Agri-cultural University of Norway, As
Kerr WE (1992) Abejas Africanas su introduccion yexpansion en el continente Americano. Subespeciesy ecotipas Africanos. Indust Apic 13, 12-21
Lachenbruch P, Mickey RM (1968) Estimation of errorrates in discriminant analysis. Technometrics 10,1-11
Lebdi-Grissa K, M’ Sadda K, Cornuet JM, Fresnaye J(1991) Influence des races d’abeilles étrangèresintroduites en Tunisie sur la race tunisienne Apismellifera intermissa. Rev Agric 44, 632-636
Louis J, Lefebvre J (1968) Étude quantitative de ladivergence dans l’évolution morphologique de cer-taines entités infraspécifiques d’abeilles domes-tiques (A. mellifica L.). CR Acad Sci, Paris, 266,Série D, 1131-1133
Louis J, Lefebvre J, Moratille R, Fresnaye J (1968)Essai de discrimination de lignées consanguinesd’abeilles domestiques (A.m. mellifica L.) obtenuespar insémination artificielle. CR Acad Sci, Paris,267, Série D, 526-528
Mardia KV, Kent JT, Bibby JM (1979) MultivariateAnalysis. Academic Press, London
Mogga JB (1988) The taxonomy and geographicalvariability of the honeybee Apis mellifera L. inSudan. MSc thesis, Faculty of Agriculture, Uni-versity of Khartoum, Sudan
Moritz RFA, Southwick EE (1992) Bees as Superor-ganisms. Springer-Verlag, Berlin
Moritz RFA, Cornuet JM, Kryger P, Garnery L, Hep-burn HR (1994) Mitochondrial DNA variability inSouth African honeybees (Apis mellifera L.). Api-dologie 25, 169-178
Moritz RFA, Beye M, Hepburn HR (1997) Estimat-ing the contribution of laying workers to populationfitness in African honeybees Apis mellifera withmolecular markers. Mol Ecol (submitted)
Muller MJ (1982) Selected Climatic Data for a GlobalSet of Standard Stations for Vegetation Science.Junk, The Hague
Radloff SE, Hepburn HR (1997a) Multivariate analy-sis of honeybees, Apis mellifera L, of the Horn ofAfrica. Afr Entomol 5, 57-64
Radloff SE, Hepburn HR (1997b) Multivariate analy-sis of honeybee populations (Apis mellifera L.)from western central Africa: morphometrics andpheromones. Afr Entomol (in press)
Radloff SE, Hepburn HR, Robertson MP, van Hille R,Davidson Z, Villet MH (1996) Discriminant anal-ysis of the honeybee populations of southwesternAfrica. Afr Entomol 4, 1-6
Radloff SE, Hepburn HR, Villet MH (1997) Honeybees(Apis mellifera L.) of the woodland savanna ofsoutheastern Africa. Afr Entomol 5, 19-27
Ruttner F (1988) Biogeography and Taxonomy of Hon-eybees. Springer-Verlag, Berlin
Ruttner F (1992) Naturgeschichte der Honigbienen.Ehrenwirth, München
Ruttner F, Tassencourt L, Louveaux J (1978) Biomet-rical-statistical analysis of the geographic vari-ability of Apis mellifera L. Apidologie 9, 363-381
Silberrad REM (1976) Bee-Keeping in Zambia. Api-mondia, Bucharest
Smith DR, Palopoli MF, Taylor BR, Garnery L, Cor-nuet JM, Solignac M, Brown WM (1991) Geo-graphical overlap of the two mitochondrial genomesin Spanish honeybees (Apis mellifera iberica). JHered 82, 96-100

Tomassone R, Fresnaye J (1971) Étude d’une méth-ode biométrique et statistique permettant la dis-crimination et la classification de populationsd’abeilles (Apis mellifica L.). Apidologie 2, 49-65
van Chi-Bonnardel R (1973) The Atlas of Africa. JeuneAfrique, Paris
Walter H (1973) Die Vegetation der Erde in Öko-phy-siologischer Betrachlung. I: Die Tropischen undSubtropischen Zonen. Fischer, Jena
Walter H (1976) Vegetationszonen und Klima. Ulmer,Stuttgart
Copyright © 2022 FDOKUMEN