Row planting teff in Ethiopia: Impact on farm-level profitability ...
26
Row planting teff in Ethiopia: Impact on farm-level profitability and labor allocation Joachim Vandercasteelen, Mekdim Dereje, Bart Minten, and Alemayehu Seyoum Taffesse June 2016 ESSP WORKING PAPER 92
-
Upload
khangminh22 -
Category
Documents
-
view
3 -
download
0
Transcript of Row planting teff in Ethiopia: Impact on farm-level profitability ...

Row planting teff in Ethiopia: Impact on farm-level profitability and labor allocation Joachim Vandercasteelen, Mekdim Dereje, Bart Minten, and Alemayehu Seyoum Taffesse
June 2016
ESSP WORKING PAPER 92

TABLE OF CONTENTS Abstract ........................................................................................................................................................................................ 2 1. Introduction ..................................................................................................................................................................... 2 2. Teff Production and Row Planting in Ethiopia ................................................................................................................ 3 3. Survey Design and Data ................................................................................................................................................. 5
3.1. Randomized control trial .............................................................................................................................................. 5 3.2. Biases in self-reported labor inputs.............................................................................................................................. 7
4. Methodology ................................................................................................................................................................... 9 4.1. Impact evaluation ......................................................................................................................................................... 9 4.2. Balancedness............................................................................................................................................................. 10
5. Labor Use and Profitability in Teff Production .............................................................................................................. 11 5.1. Labor use per activity ................................................................................................................................................. 11 5.2. Inter and intra-household labor shares ...................................................................................................................... 13 5.3. Teff productivity and profitability ................................................................................................................................ 15
6. Conclusions .................................................................................................................................................................. 16 References ................................................................................................................................................................................. 18 Appendices ................................................................................................................................................................................ 21
Appendix I: Issues with survey implementation ..................................................................................................................... 21 Appendix II: Effect of row planting (ATE) on labor requirements in teff production ............................................................... 24
LIST OF TABLES
Table 3.1: Outcomes of interest ................................................................................................................................................... 7 Table 3.2: Labor input for teff production for traditional broadcasting farmers, person-days per hectare................................... 9 Table 4.1: Comparison of control versus treated farmers in the randomized control trial ......................................................... 11 Table 5.1: Effect of row planting on total labor use by teff production activity, person-hours per hectare ................................ 12 Table 5.2: Robustness checks for treatment effects.................................................................................................................. 13 Table 5.3: Effect of row planting on use of inter- and intra-household labor, shares of total labor, in percent ......................... 14 Table 5.4: The effect of row planting on yield, labor productivity, and profitability of teff production ........................................ 15 Table 5.5: Determinants of teff yields, labor productivity, and profits ........................................................................................ 16 Appendix Table A.1: Survey implementation issues, number of sample farmers involved ....................................................... 22 Appendix Table A.2: Estimates of likelihood to comply with treatment, non-attrition in the crop-cut data, non-attrition in the
self-reported data, and to be treated ............................................................................................................................ 23 Appendix Table A.3: Effect of row planting on use of inter- and intra-household labor in levels, person-hours per hectare .... 24
LIST OF FIGURES Figure 3.1: Map of woredas included in the experiment .............................................................................................................. 5 Figure 3.2: Timing of survey and of activities in teff production in survey areas ......................................................................... 8

2
ABSTRACT
Improved technologies are increasingly promoted to farmers in sub-Saharan-African countries to address low agricultural productivity in their staple crops. There is, however, a lack of evidence on how adoption affects farmers’ labor use and profitability at the farm level, as well as the importance gender roles play, all essential drivers for the successful up-scaling of the use of the improved technologies. This paper analyses the labor and profitability impact of the recently introduced row planting technology in teff production in Ethiopia. Based on agronomic evidence in experimental settings, the Government of Ethiopia has focused extension efforts on promoting the widespread uptake of row planting to address low teff yields, replacing the traditional broadcasting method of plant teff. Using an innovative Randomized Controlled Trial set-up, we show that the implementation of row planting at the farm level significantly increases total labor use, but not teff yields, relative to broadcast planting, resulting in a substantial drop in labor productivity when adopting row planting. Moreover, the implementation of row planting has important consequences for inter- and intra-household labor allocation, with relatively more use of non-family labor. The adoption of row planting was further found not to be profitable for farmers in the first year of the promotion campaign, seemingly explaining the limited success in up-scaling the adoption of the technology by farmers in the second year of the program.
Keywords: Sub-Saharan-Africa; Ethiopia; Teff; Row planting; Impact evaluation; Randomized Controlled Trial
JEL codes: Q12; Q15; Q16
1. INTRODUCTION
While agriculture remains the main income source of many farm households in sub-Saharan Africa (SSA), productivity levels are low and growth rates have recently stagnated (World Bank 2008; Alston and Pardey 2014). Increased uptake of improved crop varieties, inorganic fertilizer, and irrigation is therefore promoted to farmers to achieve similar yield benefits in SSA as observed during Asia’s Green Revolution (Evenson and Gollin 2003; Kabunga et al. 2012; deGraft‐Johnson et al. 2014; Zeng et al. 2015). However, adoption rates of these improved technologies have been disappointingly low in SSA, seemingly related to the complex and heterogeneous agro-ecological systems; lack of credit, poor infrastructure, weak institutions; and underdeveloped agricultural research and extension systems (Ehui and Pender 2005; Diao et al. 2008; Barrett et al. 2010; World Bank 2008; Kijima et al. 2011).1 As a consequence, development practitioners, researchers, and policymakers are increasingly looking for other approaches to address low agricultural productivity in SSA (Gollin et al. 2005; Doss 2006; Lee et al. 2005; Erenstein et al. 2008).
There is widespread belief that “Improved Land Management (ILM)” technologies are a viable alternative to boost agricultural production in SSA. The adoption of these technologies might be more suitable for the farming context in SSA because they substitute the use of capital intensive modern inputs, e.g., modern varieties, with the use of improved land or production management practices (Ehui and Pender 2005; Knowler and Bradshaw 2007). However, such technologies are complex because they require adequate understanding of the technology and significant management skills by the adopting farmer to be employed profitably (Gollin et al. 2005). As a consequence, available empirical evidence on the productivity benefits of ILM technologies over conventional practices points to unclear and inconsistent results. Recent empirical assessments of Conservation Agriculture, Integrated Pest Management (IPM), and the System of Rice Intensification (SRI) technologies – all ILM technology packages – have found that their impacts on crop productivity are ambiguous and context specific (Stoop et al. 2002; Dobermann 2004; Giller et al. 2009; Brouder and Gomez-Macpherson 2014; Stevenson et al. 2014). Moreover, the debate about these improved technologies has been mainly shaped by agronomists, with little evidence on how the adoption of these technologies affects the socio-economic outcomes of adopting farmers in developing countries.2
In the paper, we contribute to this literature by evaluating the farm level impact of the introduction of row planting in teff production in Ethiopia. Teff is a major staple crop for Ethiopian farmers, but national yield levels are low. The traditional broadcast sowing method has been identified as one of the major constraints to increased teff yields. Therefore, attention has now shifted to alternative sowing technologies which focus on row planting and reduced seeding rates to allow for more 1 Moreover, in areas with higher adoption rates of the Green Revolution technologies, famers face high input costs, diminishing returns, and sustainability and environmental concerns; calling for alternative technologies (Gollin et al., 2005; Knowler and Bradshaw, 2007).
2 Exceptions are – among others – Orr (2003) and Moser and Barrett (2006) who have looked at farm level impacts of these technologies.

3
optimal tillering and branching out of the teff plants. In field experiments conducted in highly controlled research settings, the row planting sowing technique has been found to substantially increase teff yields. From 2012, the Government of Ethiopia (GoE) started a widespread promotion campaign to stimulate the adoption of row planting by farmers; and substantial yield benefits have been claimed (ATA 2013). To date, however, there has been no rigorous empirical evidence obtained on the impact of row planting of teff for adopting farmers in Ethiopia or elsewhere. To the best of our knowledge, this paper is the first to provide an in-depth labor and profitability assessment of row planting of teff at the farm level.
To this end, a unique data collection effort was conducted in villages of one of the major teff growing regions (Oromia) in Ethiopia. Specifically, we assess the impact of promoting row planting during the pre-scale-up phase of the government promotion campaign in 2012. To do so, a large-scale Randomized Controlled Trial (RCT) was implemented by randomizing both the selection of farmers in the experiment as well as the assignment of the different sowing technologies to participating farmers. Even though the technology was promoted as a package (together with improved seeds), all farmers received identical inputs, i.e., improved seed, fertilizer, and training on row planting, which enabled us to precisely identify and measure the impacts of the sowing method. The design of our study is in line with other experimental studies, (e.g., Duflo et al. 2008) in which the data collection method is used to overcome identification issues in technology impacts due to selection biases and unobserved farm heterogeneity.3
We provide a detailed assessment of the impact of adopting row planting on different outcomes in teff production. First, we measure treatment effects over different production activities to assess peak moments in the teff cropping season in which labor constraints are the most binding. Next, we present the impacts of the technology on inter-household labor use to see whether any additional labor must be supplied either from within the farm household or by hiring-in labor. Then we document intra-household labor impacts to see whether the adoption of row planting teff affects the gendered division of labor within the household.4 This study expands what limited evidence there is on how new technologies affect labor usage (Ilahi 2000; Doss 2001; Lee 2005). Finally, most impact evaluations do not collect detailed data on the cost of production. This information gap undermines understanding of the conditions under which the profitability of a new technology can be assessed (Doss 2006). We therefore collected data on farmers’ inputs and teff output to assess the broader impacts of adopting row planting on teff productivity and profitability at the farm level.
Our results have important implications for the adoption of row planting in Ethiopia or for other labor-intensive land management technologies in general. The inter-household and gender impacts provide insights into which types of farmers are in a better position to adopt or to continue to adopt the row planting technology. If much of the additional labor associated with row planting is needed early in the season, households with less family labor might be more unlikely to adopt the new technology because of seasonal labor scarcity (Alwang and Siegel 1999; Moser and Barrett 2006).5 Similarly, farmers without access to family labor or constrained by imperfections in credit and labor markets might face difficulties in hiring or reallocating family labor away from wage employment (Feder et al. 1985; Lapar and Pandey 1999).6 Hence, our results show that in the case of knowledge and labor intensive technologies, there is a need to carefully assess on-farm constraints to adoption before promoting the technology to farmers on a wide scale.
2. TEFF PRODUCTION AND ROW PLANTING IN ETHIOPIA
Teff is one of the most important staple crops in Ethiopia. In the main production season (meher) of 2012-2013, teff was produced by more than 6 million farmers, resulting in total production of over 4 million metric tons on 2.7 million hectares of land. This accounted for the largest share of cereals cultivated in Ethiopia (CSA 2012). Teff is a major staple food with
3 Impact evaluations usually rely on observational non-experimental data, which, even if advanced econometric methods are applied, often tend to suffer from selection biases and unobserved heterogeneity in technology adoption (Barrett et al., 2004). Any measured treatment effect might therefore be attributed to sample selection biases or unobserved farming ability of adopting farmers, rather than to the technology itself. Our robust methodology allows to identify the un-confounded effect of row planting.
4 Depending on which tasks males and females perform within the household and how woman’s time is valued, the adoption of labor intensive technologies might put a greater burden on females or children, as their time might be reallocated from other household (income generating) activities or schooling (von Braun and Webb, 1989; Doss, 2001; Quisumbing and Pandolfelli, 2009; Takahashi and Barrett, 2014).
5 Studies on SRI in Madagascar have shown that due to the high labor use early in the season, farmers lacking assess to inter-seasonal credit are unable to reallocate labor away from cash generating wage employment and therefore dis-adopt the SRI technology (Barrett et al., 2004; Moser and Barrett, 2006).
6 If credit and labor markets function well, households can reallocate family labor from wage employment or hire labor to meet the increased labor demands of the new technology (Barrett et al., 2004; Moser and Barrett, 2006; Kijima et al., 2011). Poor households that are constrained by credit and labor market imperfections or find hiring laborers to be risky can substitute hired labor by non-market labor sharing arrangements (Tu and Bulte, 2009; Takasaki et al., 2014).

4
excellent nutritional value (high protein and fiber content, complex carbohydrates and gluten free). It accounts for 11 to 15 percent of all calories consumed and 23 percent of urban food consumption (Berhane et al. 2011). Per capita consumption has grown by 4 percent over the last 5 years (ATA 2013) and is likely to continue to grow because of increases in average incomes and fast urbanization. In urban areas, teff accounts for a higher share in the per capita cereal consumption compared to rural areas, and teff is also relatively more consumed by richer households (Berhane et al. 2011). International demand for teff is also increasing due to its high nutritional value and its potential as water efficient fodder for livestock.
The agronomic practices of teff production have changed relatively little over time (Ketema 1997). Teff is usually planted in July or August (shortly after the start of the rainy season) after the land has been prepared by removing stones, plowing (3 to 6 times), and leveling the field. Because of its small seed size, teff is almost exclusively sown through broadcasting, i.e., scattering by hand at a high seed rate (up to 50 kg per hectare). This sowing technique makes it difficult to achieve a uniform plant stand over the field, and also forces farmers to use more seeds to suppress weed growth. Most farmers apply DAP and urea as fertilizer during the growing period, mainly because of the plant-nutrient impoverished soil. Farmers weed their teff plots several times. Harvesting is carried out after three to five months, and the teff output is then threshed using oxen.
The traditional sowing method used for teff is considered as one of the main reasons why teff yields are low in Ethiopia. Therefore, research has been conducted on improving sowing technologies in teff production, with special attention to row planting. Row planting is a knowledge intensive – but not capital demanding – technology in which (i) seeds are sown in rows and (ii) the seed rate is reduced according to scientific recommendations. It requires extra labor that is mainly required early in the season, because of additional tilling for seedbed preparation and to construct rows in which the seeds are carefully sown. Moreover, fertilizer application is more labor intensive because – instead of broadcasting the fertilizer – farmers have to apply the fertilizer more carefully in the planted rows at appropriate rates. On the other hand, row planting is believed to make weeding easier, requiring less labor.
Row planting of teff seed is considered to be superior compared to the traditional broadcasting method because a reduced seed rate decreases competition between the seedlings for water and nutrients. Moreover, the even distribution of the teff seedlings makes weeding easier and less costly. In research trials, row planting has been shown to increase teff yields up to three times average yields and lowers seed costs, making it seemingly a good value proposition for teff farmers (Berhe et al. 2011).
In light of these research results, the Government of Ethiopia rolled out a nationwide campaign to promote the use of improved teff sowing technologies. In the promotion campaign, farmers were offered the TIRR package – Teff, Improved seed (Quncho), Reduced seed rate, and Row planting. Extension agents taught farmers about the agronomic benefits and the recommendations for the use of these new technologies. Farmers were advised to implement row planting with a seed rate of 5 kg per hectare (instead of the traditional 25 kg per hectare), construct parallel rows with 20 cm between the rows, and to plant seeds at a depth between 2 and 3 cm below the soil surface (ATA 2013). Field demonstration days were held with teff farmers at which specialists demonstrated the proper implementation of the technologies. In 2012, the Ministry of Agriculture (MoA), with the support of the Agricultural Transformation Agency (ATA), provided this TIRR package with the requisite extension knowledge to 70,000 farmers. In the years that followed, the program was scaled up nationwide to almost 2.5 million (2013) and 3.5 million (2014) teff farmers through the national extension and farm radio systems (ATA 2013).
Even though the TIRR package consists of several elements, subsequent media (and policy) attention has focused on the impact of row planting, because of the doubling of teff yields in research trials. The data collected from a sample of farmers participating in the 2012 pre-scale-up phase showed that these farmers were able to achieve a substantial 65 percent increase of teff yield over the national average. In the following two years, similar productivity increases of 70 percent were measured. However, without constructing a proper counterfactual, the true yield benefits of row planting at the farm level remain unclear. Moreover, as observed for other labor intensive technologies, promoting labor intensive technologies to farmers can be risky when farmers are labor constraint (Barrett et al. 2004; Doss 2006). This concern was reflected in farmers’ perceptions about row planting collected through community surveys. While most farmers believe in the yield benefits of row planting (the expected yield increase stated by farmers interviewed is on average over 150 percent), labor requirements are considered the most important constraint to adoption of row planting. Notably, 85 percent of the community questionnaire respondents considered that the additional labor for row planting to be a major disadvantage. Hence, even though farmers expressed a belief in the yield benefits of row planting, they were also skeptical about the labor implications of adoption.

5
3. SURVEY DESIGN AND DATA
In developing countries, empirical impact assessment of new technologies on farming systems is a tedious process, as the survey design has to accommodate at least two potential sources of error in the data collection. First, if farmers who have higher yields anyway are more likely to adopt new technologies, the treatment effect of the technology is confounded by observed and unobserved farm characteristics of these better performing farmers. Failing to control for these selection biases makes it impossible to identify the treatment effect (Cavatassi et al. 2011). Second, when farmers are asked about labor inputs for many different activities in smallholder agriculture, farmers may inaccurately recall their supply of labor inputs during the past production season. Most of the evidence shows that farmers tend to systematically overestimate their labor inputs, and the quality of self-reported labor critically depends on appropriate survey design, recall period, and timing of the questionnaires (Duncan and Hill 1985; De Nicola and Giné 2004; Beegle et al. 2012).
3.1. Randomized control trial To analyze the impact of row planting on teff production, we randomly surveyed farmers that were part of the “pre-scale-up” phase of the public promotion campaign in 2012. The survey collected experimental data at the farm level using a Randomized Control Trial (RCT), in which several levels of randomization were applied to avoid problems of selection biases and unobserved heterogeneity. First, the selection of villages and farmers within the promotion campaign sample was conducted randomly. The pre-scale-up phase was rolled out in 23 Agricultural Growth Program (AGP) woredas (district-level administrative unit) in Oromia region. 7 The survey randomly selected 10 woredas from these AGP woredas (Figure 3.1). Within the selected woredas, four Farming Training Centers (FTCs, we will refer to them as villages) were randomly selected out of all FTCs. Within each village, 60 farmers had been randomly selected to be part of the pre-scale-up phase. 8 From these 60 farmers, 20 farmers were then randomly selected to participate in the experiment in each village.
Figure 3.1: Map of woredas included in the experiment
7 AGP is a five-year program aimed at reducing poverty by increasing agricultural productivity and improving market access for smallholders in 83 woredas in Amhara, Oromia, SNNP, and Tigray (Berhane et al., 2011).
8 The farmers targeted in the promotion campaign are all progressive, so-called model farmers, with whom extension agents work closely.
Woreda 1 – Adea 2 – Gudru 3 – Gomma 4 – Girar Jarso 5 – Yaya Gulele 6 – Becho 7 – Weliso 8 – Ambo 9 – Dendi

6
Next, the allocation of the treatment, i.e., the sowing technology, was randomized over participating farmers. Ten farmers were selected to implement the row planting technique on their experimental plot (treated group), while the remaining ten farmers were instructed to implement traditional broadcasting to plant their teff (control group). Row planting farmers received 150 grams (5 kg per hectare) and traditional broadcasting farmers received 900 grams (30 kg per hectare) of improved teff seed (Quncho) for free. Both groups also received identical fertilizer packages (3 kg each of both urea and DAP) at no cost to ensure that the same amount of inputs was used by each farmer on the designated experimental plot involved in the study. Local extension agents, Development Agents (DAs), were responsible for selecting, training, and assisting participating farmers, who were instructed to row plant teff on a small experimental plot of 300 m².
However, due to several implementation issues, the actual number of farmers included in the sample was lower than planned. A detailed overview of the sample selection issues is provided in Appendix I. During the roll-out of the pre-scale-up phase of the promotion campaign, one woreda did not follow instructions and was therefore omitted, leaving nine woredas in which our sample of farmers were located. Moreover, in the remaining 36 villages, the allocation of technologies to farmers was only successfully randomized in 19 villages, forcing us to drop the 17 villages in which some farmers might have been purposefully selected by extension agents to implement the row planting technology. As a consequence, we focus on the sub-sample of randomly selected farmers from 19 villages.9
However, in some of these villages, the actual number of farmers interviewed was not equal to the target of 20. Some of the selected farmers did not prepare their experimental plot in line with MoA’s recommendations, e.g., experimental plots were too large or too small or seed rates applied were not appropriate. The DA randomly replaced these selected farmers with other farmers from the remaining group of 40 in the village, but failed to gather a total of 20 farmers in some villages, as it proved difficult to engage additional broadcasting farmers in the experiment.10 Enumerators identified the farmers that were initially selected to be interviewed, but were not covered during the survey (we refer to them as ‘non-visited’ farmers) in the random villages and revisited them afterwards.11 As a consequence, the random sample consists of 537 farmers, which included both initially selected farmers (410) as well as replacement farmers (127).
Table 3.1 provides an overview (definition and unit of measurement) of farmers’ production inputs and output on the experimental teff plot.12 The teff output harvested on the experimental plot – after drying and threshing of the teff – was collected both using farmers’ recall in the impact survey and by directly measuring the output during a separate crop-cut exercise. We focus on the farmers’ recall output because this data is only missing for six farmers. In contrast, the crop-cut data could not be collected for 137 ‘non-visited’ farmers, i.e., an attrition rate of 25 percent.13 Based on the input and output data on teff production, we calculate several measurements of teff profitability as the difference between gross income and total costs in teff production.14 Teff output prices and DAP and urea input prices were collected during the impact survey in each village through community questionnaires. Data on daily wage rates for labor over the different activities in teff production were taken from the AGP community questionnaires for the AGP villages in Oromia. Wages are measured as daily wages for each production activity averaged over the production season 2011-2012 and averaged over all villages in one district (woreda).15
9 In this paper, we present the results for the randomly selected farmers (537) only. In a working paper version (Vandercasteelen et al., 2013), we apply the Propensity Score matching technique on the whole sample of farmers to control for potential selection biases and find similar results.
10 Out of the 60 farmers that were part of the of the pre-scale-up phase, 40 farmers were assigned to row planting and 10 to broadcasting. As a result, there were insufficient control farmers to replace the traditional broadcasting farmers if they did not implement their plot in line with the MoA’s recommendation. 11 Randomization ensures the accuracy of the estimated effect, but the precision of the estimation depends on the sample size. Ex ante power calculations were conducted to select an optimal number of farmers in the experiment. The power calculations showed an optimal sample size of about 500 farmers, but this sample size was increased to anticipate potential survey implementation problems that we indeed faced. For a detailed assessment of the power calculations, see Appendix I. Post-hoc power calculations of the effect size show that the experiment design allows the detection of large changes in teff yield due to row planting (more specifically, an increase of almost 0.2 ton).
12 ETB = Ethiopian Birr, 1 USD = ETB 18 on January 1, 2013 13 The crop-cut output was only collected for 403 farmers in the random sample for two reasons: the crop-cut data was not measured for the ‘non-visited’ farmers (127) and 7 farmers sold their teff output on the experimental plot before the crop-cut measurement was conducted. Therefore we focus on the self-reported data and used the crop-cut data only for robustness check in the working paper version (Vandercasteelen et al. 2013). The attrition rates in the crop-cut output data could be problematic for inference, but Vandercasteelen et al. (2015) show that the (yield) results are robust when controlling for attrition.
14 Even though fertilizers and seed were given for free in the experiment in order to control for possible input-use differences between control and treated farmers, the profit calculation takes into account the cost associated as if farmers had to buy the seed and fertilizer themselves.
15 As prices were reported in person-days, we converted the unit of labor input into person-days (by assuming a workday of 7 hours). The AGP community questionnaire did not cover all villages that took part in our experiment and missing data were replaced by woreda averages.

7
Table 3.1: Outcomes of interest Variable Description
Plot size Size of the experimental plot in hectares measured using the triangulation method Labor use Total person-hours of labor per hectare of teff land Seed use Total kg of seed per hectare of teff land Fertilizer use Total kg of fertilizer (DAP and urea) per hectare of teff land Herbicides use Total ETB monetary value of herbicides per hectare of teff land Teff output Total metric tons of teff harvested on experimental plot Land productivity Teff output (mt) per hectare of teff land Labor productivity Teff output (kg) per person-hour of labor Gross income Total ETB monetary value of teff production per hectare of teff land Variable cost Total ETB monetary value of the use of seed, fertilizer, and labor per hectare of teff land Profits Total net returns in ETB per hectare of teff land Profits per capita Profits divided by the number of household members Alternative profits Total net returns in ETB per hectare of teff land with only hired (and shared) labor costs Teff price Average price (ETB) of one metric ton of white teff Fertilizer price Average prices (ETB) of one kg of DAP and urea Wage Average wage (ETB) for hiring labor
3.2. Biases in self-reported labor inputs Since labor outcomes are one of the main treatment effects of interest, the survey questionnaire was carefully designed to collect rigorous labor data. To simplify the requests for data on labor supplied by the household, rather than asking the farmers for one representative figure of total labor for the whole productive season, the farmers were asked for the labor inputs for different activities in teff production. The questionnaire contained one section exclusively on characteristics of the experimental plot, and farmers were asked to report separately on the labor used for land preparation, sowing, applying fertilizer, harvesting, and threshing.16 For each activity, farmers also were requested to provide the source of the labor in order to distinguish between labor supplied from family, hired-in, or communal labor arrangements (dabo labor sharing with neighbors).17
To minimize the recall bias in the labor data, the time period between the collection of the labor data and the execution of the different activities by farmers was kept short. The farmers were interviewed twice about their labor use in teff cultivation (Figure 2). First, farmers were visited in September 2012 by survey enumerators, just after they had planted their experimental plot. During this ‘baseline’ survey, information was collected on the experimental plot characteristics, teff production over 2011-2012, and general household and background information. Second, an impact survey was fielded after the teff was harvested on the experimental plot in February 2013, with additional information collected on teff production and management practices on the experimental plot.
Depending on the timing of the activities in teff production, we combined the labor data from the baseline and impact survey to construct our main labor variables of interest in the following way. The data covering the first three activities in teff production, i.e., land preparation, sowing and fertilizer application, were taken from the baseline survey, as teff is planted during July and August. Similarly, the last three activities, i.e., weeding, harvesting, and threshing, were taken from the impact survey, as farmers harvested the teff from their experimental plots in November and December. This strategy ensures internal consistency because the time gap between planting and the baseline survey and between harvesting and the impact survey are both about three months apart. Therefore, we believe that this approach provides reasonably accurate estimates of farmers’ labor input into their teff plots.
16 Note that labor data is usually distinguished over only three activities: land preparation and planting; weeding, fertilizing, and non-harvest activities; and harvesting (e.g. Palacios-Lopez et al., 2015)
17 Inter-household labor refers to the exchange of labor between households in teff production, either by hiring labor or by sharing arrangements (dabo). Intra-household labor refers to the division of family labor over the different members in the households, i.e. male, female, and children.

8
Figure 3.2: Timing of survey and of activities in teff production in survey areas
In the experimental plot section of the impact survey, farmers were also asked to provide the intra-household allocation of supplied family labor (male, female and children). Unfortunately, because the gender disaggregated data was only collected during the impact survey, the above recall strategy could not be applied. Hence, the sum of the intra-household labor numbers does not necessarily add up to the total inter-household family labor, especially not for the first three activities in teff production. However, as it turns out, the sum of the intra-household labor data is in total larger than the inter-household family labor, highlighting that farmers overestimated the gender-disaggregated labor data. We cannot explain any obvious reason for this, except for the fact that there are greater issues with recall in the impact survey. Also, given that the household head (mainly males, see Table 4.1) answered the intra-household labor questions, data on the labor input of females and children were only indirectly collected. Therefore, caution should be taken when interpreting the treatment effects on the gender-disaggregated data, especially for the first three activities.
To account for potential misreporting of levels in the labor data, we take two precautions. First, to control for outliers, all labor data was trimmed by replacing the lower and top 5 percent of the labor data distribution by village averages. Second, when assessing the impacts on inter- and intra-household labor allocation, we look at the treatment effects on the shares of labor allocated to each inter- and intra-household sources, i.e. relative numbers with respect to the total.
The analysis of inter- and intra-household labor data is further complicated by the inherent difficulties associated with collecting such data (Bardasi et al. 2011). Farmers might simultaneously apply family labor for several activities in teff production, and hence it might be difficult to disentangle the labor input for each activity. Moreover, it also is often difficult to separate the actual time that farmers have worked on an activity from other time uses in teff production, such as plot or labor supervision, as well as for leisure. However, the treatment effects will only be confounded if we believe that there are systematic differences in labor responses by treatment status.
One final issue of concern might be reporting errors related with plot sizes. The instructed experimental plot size was relatively small (300m²) and self-reported labor data might be overestimated because of mean-reverting measurement error and rounding effects when scaling these numbers on a per hectare basis. To assess this problem, we compare the labor input on the experimental plot reported by traditional broadcasting farmers with other data sources that contain labor input data in teff production and check for substantial differences, as shown in Table 3.2.18 The first row of Table 3.2 reports the labor input on the experimental plot (converted to person-days) for control farmers. The second and third row respectively report labor input on all plots, excluding the experimental plot, collected in the agricultural section included in both the baseline (meher 2011) and impact (meher 2012) questionnaires.19 Since labor input on threshing was not collected, column 3 compares total labor inputs without threshing, and we find that these to be very similar to the experimental plot data.
18 To date, there is no alternative data available on labor use for row planting farmers. Therefore, we focus on traditional broadcast planting by farmers. While we would prefer to report on labor inputs per specific activity, this is not possible because the different data sources combine different activities in teff production into different categories and different units. For example, in the agricultural section of the survey questionnaire, the labor input is requested for land preparation and planting together, while in the experimental section of this survey, this was done separately. Therefore, we only report total labor inputs, applying the same outlier trimming procedure.
19 In the baseline survey, it is safe to assume that all participating farmers (both those assigned to follow the traditional broadcasting method and those assigned the row planting treatment) had only used the traditional broadcasting method on their plots, because this was before the row planting promotion

9
Table 3.2: Labor input for teff production for traditional broadcasting farmers, person-days per hectare
Survey data Observa-
tions
Total labor without threshing,
person days/ha
Family labor as proportion of total labor
without threshing, %
Total labor with threshing,
person days/ha Experimental plots of controls 195 94 88 124 Teff plots cultivated in meher 2011 945 92 86 Teff plots cultivated in meher 2012 1,509 92 77 Teff plots from teff value chain (meher 2012) 1,200 125 Notes: ‘Total labor without threshing’ (column 3) refers to the sum of all teff production activities, excluding threshing, and is reported in persons days per hectare of cultivated teff land. ‘Total labor with threshing’ (column 5) refers to the sum of all teff production activities, including threshing, and is reported in persons days per hectare of cultivated teff land. ‘Meher’ is the main production season in Ethiopia. “Experimental plot of controls” refers to the labor input on teff plots for traditional broadcasting farmers participating in the experiment. This data was measured in person hours of labor (converted into person days per hectare by assuming that farmers work 7 hours per day) and collected on the teff production operations of land preparation, planting, fertilizer application, weeding, harvesting, and threshing. ‘Teff plots cultivated in meher 2011’ refers to the labor data on teff plots of all participating farmers that were cultivated during meher 2011 and collected in the ‘Agricultural Production’ section in the Baseline survey. ‘Teff plots cultivated in meher 2012’ refers to the labor input on teff plots of all participating farmers that were cultivated during meher 2012 and collected in the ‘Agricultural Production’ section in the Impact survey. The Agricultural Production section measured labor input in person days (converted in per hectare) and collected on the teff production operations of land preparation and planting, weeding and herbicide application, applying chemical fertilizer, applying manure and other organic inputs, pest control, and harvest and post-harvest activities. Finally, ‘Teff plots from teff value chain (meher 2012)’ refers to the labor data collected on plots of the teff farmers surveyed by Minten et al. (2015) in the same geographical area. This data was measured in person hours of labor (converted to per hectare) and collected on the teff production operations of tilling, manure and organic fertilizer use, sowing and fertilizer use, weeding, herbicide or pesticide application, harvesting, post-harvest activities, and threshing.
Row 4 in Table 3.2 reports labor inputs from alternative plot level data in teff production, collected through the Teff Value Chain survey (Minten et al. 2016) in the same geographical zone. The average labor requirement per hectare in teff production (125 person-days) is very similar to the labor input reported by the control farmers in our survey (124). This number is also close to alternative estimates by Hailu et al. (forthcoming) who estimate median labor use in major teff producing areas at 112 person-days per hectare. We performed a two sample t-test on all of these differences, but none of the test statistics turned out to be significant.
4. METHODOLOGY
4.1. Impact evaluation The survey design described above provides a robust framework to identify the impact of row planting on the teff outcomes for farmers, i.e., labor use, productivity, and profits. Ti is individual (i)’s treatment (Ti=1 for a row planting farmer; 0 otherwise), and Yi(Ti) indicates the observed teff outcome given treatment: Yi = Yi (0) + [Yi(1) - Yi(0)]*Ti. The term [Yi(1) - Yi(0)] is referred to as the Average Treatment Effect (ATE), the average gain in farmers’ teff outcome from adopting row planting. To identify this treatment effect, we need information on the outcome of row planting farmers in the non-treated state (the counterfactual outcome). However, this is not observed as farmers in our experiment were assigned to one technology only. However, the random assignment of farmers to different sowing practices and the identical distribution of teff production inputs allows us to use the observed teff productivity from traditional broadcasters as the counterfactual of row planters (Blundell and Dias 2009).20 Hence, the treatment effect of row planting is the difference between the expected mean of the teff outcome of traditional broadcasting and row planting farmers: 𝜏𝜏𝐴𝐴𝐴𝐴𝐴𝐴 = 𝐸𝐸[𝑌𝑌𝑖𝑖(1)] − 𝐸𝐸[𝑌𝑌𝑖𝑖(0)].
The implementation of row planting on the experimental plot could not be enforced, and potentially some initially assigned row planting farmers may have shifted to the traditional broadcasting technology, or vice versa. This presents a problem if selection occurs on the expected gains, i.e., higher returns, to row planting and adopting farmers systematically differ from those that refuse or are unable to adopt (Blundell and Dias 2009). During the impact survey, careful compliance checks were made. From the ‘non-visited’ farmers in the random sample we identified 20 farmers that refused to take up the assigned technology and instead shifted to the opposite technology – 18 farmers shifted from row planting to broadcasting
campaign was rolled out. In the impact survey, it might be possible that some of the participating farmers used the row planting technology on their plot, having been exposed to the method. If this were the case, our results suggest that labor inputs should be higher, which is not the case in Table 3.1. Finally, in the Teff Value Chain survey (Minten et al., 2016), less than one percent of the surveyed farmers reported to have implemented row planting, so we can safely assume that the reported numbers reflect the labor input using the traditional broadcasting planting method.
20 All treated and control farmers in our sample are assumed to be statistically identical in their characteristics relevant to teff production, which ensures that any difference between treated and control farmers can be attributed solely to the sowing method and not to farmer or plot specific characteristics. This allows for identification and unbiased estimates of causal impacts (Rubin 1978).

10
while two farmers did the opposite. This mainly ‘one-sided non-compliance’ rate is small at only 4 percent and might be explained by the fact that farmers were not familiar with row planting before the experiment.21
Given the presence of non-compliers in our sample, we compare farmers based on their initial random assignment of technology (Si) rather than actual uptake Ti. This estimates the Intention-To-Treat (ITT) effect, i.e., the effect of row planting on teff yield for those farmers who were initially assigned to row planting, irrespective of the actual implementation on their experimental plot. The ITT is measured by estimating the following regression:
𝑌𝑌𝑖𝑖 = 𝛼𝛼 + 𝛽𝛽 ∗ 𝑆𝑆𝑖𝑖 + 𝜀𝜀𝑖𝑖 (1)
Then, we explicitly take non-compliance into account by using the initial technology assignment, Si, as an instrument for the actual technology take-up, Ti. This allows us to estimate the Local Average Treatment Effect (LATE), which is the treatment effect for compliers.22 The ITT and LATE estimates will be reported for several teff outcomes. First, we measure treatment effects on total labor use and on the labor use for different activities in teff production separately. Second, we distinguish labor impacts over the inter-household labor sources used by the household. Third, we measure disaggregated gender impacts (male, female, and children) on family labor use. Then, we will look at the treatment effects of row planting on productivity and profitability.
To assess how robust our findings are with respect to the different issues encountered in the experiment, we run several additional specifications when estimating equation (1). First, because non-compliance is small, we estimate the potentially biased ATE by comparing farmers based on their actual uptake of the technology Ti, and check whether it is substantially different from the ITT and LATE. Second, to take into account some of the imbalances in characteristics between treated and control farmer (see below), we include the covariates that are significantly different between the two groups of farmers as control variables in the regression. Third, to check whether the outlier trimming procedure affects our results, we replace the top and bottom 1 percent of the labor distributions by village averages (instead of replacing the top and bottom 5 percent). Fourth, given that the selection of farmers and assignment of technologies was done within each village, we include village fixed effects in the last specification.
4.2. Balancedness The effect of row planting can only be identified if the two groups of farmers are balanced in terms of their characteristics that determine teff yield. We therefore perform balancedness tests by comparing the means of general and experimental plot characteristics of traditional broadcasting farmers and row planting farmers based on the initial treatment assignment, Si (see Table 4.1) We start with general farm characteristics to test whether row planting farmers are systematically different from farmers who were assigned to broadcasting teff. Table 4.1 looks at the different household head (panel 1) and household (panel 2) characteristics that were measured during the baseline survey, and thus not affected by the treatment assignment. The two groups of farmers are similar in age, literacy, education, household size and non-farm income, as shown by insignificant t-values for most of the coefficients in column 5 of Table 4.1.
Table 4.1 also reports the balancedness test for experimental plot characteristics of the selected farmers (panel 3). These variables might potentially be affected by the treatment assignment. A significant difference in the means between treated and control farmers could indicate that row planting farmers tend to put more effort or better management into their plots (Barrett et al. 2004; Bulte et al. 2013). Table 4.1 shows that – by design – seed rates are significantly different between control and treated farmers. Row planting farmers on average apply more urea in relative terms, but are less likely to use herbicides. Other than these important differences, the experimental plot characteristics, input usage and production practices, extension on experimental plot received, and production shocks seem to be fairly similar between the two groups. However, as a check of robustness, we will control for observable differences between both groups of farmers.
21 Appendix I (column 1) estimates the probability of being a complier. The results illustrate that initial assignment to treatment is negatively correlated with compliance, and older farmers are less likely to comply, while the total land owned by the household has the reverse effect.
22 The ITT is identified if two assumptions are imposed (Blundell and Dias, 2009). First, the potential assignment, outcomes, and treatment uptake are independent among farmers; and second, all farmers had the same probability to be assigned as row planting farmers, i.e., random assignment to treatment. To identify the LATE, the additional assumption of strong monotonicity has to be imposed.

11
Table 4.1: Comparison of control versus treated farmers in the randomized control trial
Table panel
Household (head) and experimental characteristics
Control group mean
Difference between treatment group
mean and control group mean t-value
(1) Age (years) 44.00 -1.04 -0.84 Gender (male=1) 99.40 -2.79 -1.89* Can write (yes=1) 31.80 -6.42 -1.22 Literacy (yes=1) 68.20 5.59 1.04 Primary education (yes=1) 77.10 1.96 0.43
(2) Distance to FTC (minutes) 33.90 -0.40 -0.16 Household size (members) 7.13 -0.22 -1.06 Total agricultural assets value (ln of ETB) 6.79 -0.02 -0.16 Total assets value (ln of ETB) 7.25 0.09 0.44 Total land owned by household (ln of ha) 5.87 -0.12 -1.05 Income from other activities (yes=1) 75.40 -7.54 -0.83 Household asked for loan (yes=1) 14.00 4.47 1.49 Member of Iqub (financial association) group (yes=1) 35.80 0.28 0.06
(3) Area (m²) 719.00 -111.00 -0.99 Distance to plot from house (minutes) 11.10 0.33 0.19 Sloped plot (yes=1) 17.30 -2.51 -0.85 High soil quality (yes=1) 36.30 0.00 0.00 Number of plows (number) 4.98 -0.01 -0.06 Number of weeding (number) 1.88 0.08 0.46 Seed rate used (kg/hectare) 27.52 -17.00 15.30*** Organic input used (yes=1) 11.20 -2.23 -0.71 Inorganic fertilizer used (yes=1) 99.40 -0.28 -0.36 Manure used (yes=1) 10.10 -3.35 -1.08 Rate of Manure used (g/m²) 0.12 0.45 1.02 Urea used (yes=1) 96.10 1.12 0.80 Rate of urea used (g/m²) 0.09 0.01 2.18** DAP used (yes=1) 98.90 0.00 0.00 Rate of DAP used (g/m²) 0.12 0.01 0.92 Herbicides used (yes=1) 77.70 -8.66 -2.22** Rate of herbicides used (100 ETB/m²) 0.02 0.00 -0.55 Problems of pests (yes=1) 22.90 2.79 0.87 Problems of diseases (yes=1) 11.20 -2.23 -0.89 Problems of late inputs (yes=1) 22.30 -5.59 -0.96 Days of training received on technologies (number) 2.20 -0.03 0.00 Visits by expert on experimental plot (number) 2.21 0.05 0.00 Observations 195 342
Notes: Panel (1): Household head characteristics. Panel (2): Household characteristics. Panel (3): Experimental plot characteristics. ∗p<0.10, ∗∗p<0.05, ∗∗∗p<0.01. ETB = Ethiopian Birr, 1 USD = ETB 18 on January 1 2013.’t-value refers to the t-statistic of a t-test with null hypothesis that the difference in means between the two farmer groups is zero.
5. LABOR USE AND PROFITABILITY IN TEFF PRODUCTION
5.1. Labor use per activity We start the empirical analysis by looking at the general treatment impact of row planting on labor use in teff production. Table 5.1 compares labor inputs (person-hours per hectare of cultivated teff land) for traditional broadcasting farmers (‘control’) with the labor use of row planting farmers (‘row planting’). Each row represents the different activities in teff production, with the last row providing a sum of total labor use over all activities. The first column of Table 5.1 shows that the largest labor input for broadcasting teff is required for land preparation, planting, and weeding – when combined, they

12
account for half of the labor used in teff production. However, the most labor intensive teff activity is threshing, which requires on average about 217 person-days when cultivating one hectare of teff. In total, traditional broadcasting farmers spend 884 person-hours of labor per hectare on their teff production.
Table 5.1: Effect of row planting on total labor use by teff production activity, person-hours per hectare
Labor supplied for: Control ITT
Row planting LATE
Row planting Land preparation 109.1 4.0 (5.8) 4.3 (6.2) Planting 42.2 138.7*** (14.8) 147.8*** (15.2) Fertilizer application 14.6 40.6*** (5.8) 43.2*** (6.1) Weeding 265.8 34.8* (20.7) 37.1* (22.2) Harvesting 175.7 -0.0 (9.9) -0.0 (10.5) Threshing 217.2 -2.0 (12.6) -2.1 (13.4) Total 884.2 255.3*** (48.7) 272.1*** (50.0) Notes: ‘Control’ is the average labor input for traditional broadcasting farmers in person-hours per hectare. ‘Row planting’ is the coefficient of the treatment effect of row planting on labor use (person-hours per hectare). Bootstrapped standard errors are clustered at the village level and reported next to the coefficients in parentheses. ∗p<0.10, ∗∗p<0.05, ∗∗∗p<0.01. ITT=Intention-To-Treat effect measured by comparing farmers on the initial technology assignment. LATE= Local Average Treatment Effect measured by instrumenting technology uptake with initial assignment. The number of observations is 537 farmers.
The next columns of Table 5.1 report the results for the row planting treatment effects (ITT and LATE) and their estimated (bootstrapped) standard errors. We focus in the main text on the ITT estimates (column 3 and 4) by comparing treated and control farmers based on initial assignment; but the results for the LATE estimation (column 5 and 6) are similar. We start by looking at total labor input required to produce one hectare of teff, i.e., combining the labor inputs over all the production activities. The last row shows that the total labor input applied by row planting farmers is estimated to increase over that of broadcast planting farmer by, on average, 255 person-hours of additional labor. The adoption of row planting implies that total labor in teff production increases by almost 30 percent.23
The results presented in Table 5.1 further show that the row planting technology does not significantly increase the labor input required for preparing the experimental teff plot. This could be related to the fact that treated and control farmers do not differ in the number of times they ploughed their experimental plot (Table 4.2). Stronger impacts on labor increase are found for labor used to sow the teff seed and apply fertilizer on the experimental plot. As expected, the labor input for row planting teff seeds increases significantly because of the extra effort needed to carefully construct the rows. Broadcast planting one hectare of teff land on average takes 42 person-hours, but row planting triples the labor input for sowing to 138 person-hours, i.e., 20 person-days extra per hectare. Similarly, the labor input for applying fertilizer increases by 41 person-hours because the fertilizer has to be carefully applied to the constructed rows, rather than by scattering the fertilizer by hand.24 Surprisingly, the labor use for weeding also increases, but this effect is only weakly significant. This finding is in contrast to our prior expectations, but may confirm statements from some farmers during focus group discussions that high teff seeding rates of traditional broadcasting help in controlling weeds. Finally, the labor input for harvesting and threshing does not significantly change when implementing row planting.
In Table 5.2 we report the estimation results of the robustness checks outlined in the previous section. Each column reports the estimation results of one specification, which can be compared with the original ITT estimation results reported in the 3rd column of Table 5.1. First, we look at the ATE coefficients by comparing farmers based on actual technology uptake in column 2. Second, the 3rd column reports the ITT, in which we include those experimental plot variables in which treated and control farmers are significantly different, i.e., relative use of urea and a dummy whether herbicides were used. Third, the ITT coefficients of the treatment effects when using an alternative trimming procedure, are reported in column 4. Finally, because the technology assignment was randomized at the village level, column 5 reports the ITT coefficients when village fixed effects are included in the regression. In general, the estimated ITT effects in the different sensitivity specifications have the same signs as the original ITT estimates. Also the estimated magnitude are similar to the Table 5.1 results,
23 If we were to assume that farmers work seven hours a day, row planting increases labor inputs by 36 person days. Given that this is the first paper to measure the farm level labor impacts of row planting, we can only compare our results with the labor implications of the SRI technology in Madagascar. Barrett et al. (2004) document that non-harvest labor (day/ha) applied in rice production increased by over 30 percent over the traditional technology during the first year of experimentation, and most of this increased labor demand was needed for field preparation, transplanting, weeding, and water management. The authors also report that 30 percent or more of the SRI adopters faced a doubling of their per hectare labor demand, while in our data less than 20 percent of the row planting farmers saw a doubling of labor input.
24 These results are in line with Pypers et al. (2011) who found that row planting mainly increased labor for preparatory activities in cassava production.

13
although a bit higher. Overall, it seems that the main results of Table 5.1 are confirmed, implying that the original ITT estimates are robust to different specifications.
Table 5.2: Robustness checks for treatment effects
Robustness check ATE ITT with controls ITT with alternative
outlier trimming ITT with village
fixed effects Land preparation 6.0 0.7 4.3 1.6
(6.0) (5.4) (6.2) (6.4) Planting 145.6*** 138.4*** 147.8*** 145.4***
(14.4) (14.1) (15.2) (15.3) Fertilizer application 43.2*** 38.9*** 43.2*** 41.6***
(5.8) (6.0) (6.1) (5.9) Weeding 34.2 28.8 37.1* 37.4
(23.9) (20.4) (22.2) (22.1) Harvesting 3.0 -5.2 -0.0 -4.2
(9.1) (9.2) (10.5) (9.5) Threshing 7.0 -9.6 -2.1 -7.8
(13.7) (11.6) (13.4) (13.6) Total 288.8*** 227.9*** 272.1*** 266.0***
(49.7) (45.2) (50.0) (50.7) Notes: Each column reports the coefficient of the treatment effect of row planting on labor use (person-hours per hectare) for different robustness checks. Bootstrapped standard errors are clustered at the village level and reported under the coefficients in parentheses. ∗p<0.10, ∗∗p<0.05, ∗∗∗p<0.01. ATE= Average Treatment Effect measured by comparing farmers based on technology uptake (column 2). ITT=Intention-To-Treat effect measured by comparing farmers on the initial technology assignment. ‘ITT with controls’ (column 3) controls for the following variables in the regression: plot size, relative use of urea and a dummy whether herbicides were used (the results for the additional controls are not reported). ‘ITT with alternative trimming’ (column 4) uses an alternative outlier trimming procedure where top and bottom 1 percent of outliers are replaced by village averages. ‘ITT with village fixed effects’ (column 5) includes the village dummies in the regression model. The number of observations is 537 farmers.
5.2. Inter and intra-household labor shares This section analyzes how the adoption of row planting affects inter- and intra-household labor allocation in teff production. Table 5.3 reports the ITT coefficients on the shares of each labor source within the total labor supply for a particular teff activity. In Appendix II, a similar table is presented for the ITT coefficients on labor use in levels (person-hours per hectare), and we refer to that table throughout this section. The left panel of Table 5.3 displays the results for the inter-household allocation of labor over family, hired, and dabo sources in teff production on the experimental plot. The right panel reports the results for the allocation of family labor within the household, i.e., male, female, and child labor. Each row blocks represent the different activities in teff production, and each row within a block represents the different inter- and intra-households outcomes. The average shares of traditional broadcasting farmers are reported first (‘control’) and next to it the treatment effect of row planting with bootstrapped standard errors.
We start by looking at the mean values of the inter- and intra-household shares reported by traditional broadcasting farmers in Table 5.3. The large majority (91 percent) of labor applied to teff production is supplied by the family (last row of left panel), which in absolute numbers corresponds to 797 person-hours. The same holds true for each specific activity, although relatively more hired and dabo labor is used for harvesting teff. Traditionally, males supply most of the family labor input in teff cultivation (right panel). On average, males are responsible for about 80 percent of the labor, with females and children each supply 10 percent of the labor in teff production.25 Males are almost exclusively responsible for preparing, sowing, and applying fertilizer to teff plots with shares are above 95 percent and a total of 720 person-hours. However, females and children are more active in weeding the cultivated plots and in threshing the teff output.
What happens to the allocation of labor between households when adopting row planting? All inter-household labor inputs significantly increase in absolute numbers for planting and fertilizer application (Appendix II); while external labor is used significantly more for weeding and threshing. As a consequence, the total labor use (in levels) of family, hired, and dabo labor increases significantly.26 Table 5.3, however, shows that the adoption of row planting affects the family, hired and
25 This number is significantly lower than the average female labor share of 29 percent reported by Palacios-Lopez et al. (2014). 26 Combined over all activities, the largest absolute increase is measured for family labor (153 person-hours), but the relative increases in hired and dabo labor input are much higher (respectively 85 percent and 106 percent).

14
dabo labor shares (column 4) differently. For the pre-harvest activities, the share of family labor in total household labor use decreases; which is compensated by an increase in hired and (especially) dabo labor. The share of family labor also decreases for harvesting and threshing teff output, but this is compensated by increased usage of hired labor. When totaled over all activities, the last row of Table 5.3 shows that the share of family labor drops by 6 percent, while the share of hired and dabo labor significantly increases by 2 percent and 4 percent. Hence, it seems that teff farmers’ own labor force remains the major labor source when adopting row planting, but a (small) part of the increased labor for row planting has to be supplied from shared and hired labor.
Table 5.3: Effect of row planting on use of inter- and intra-household labor, shares of total labor, in percent Share of inter-household labor Share of intra-household labor
Activity Source Control Row planting Source Control Row planting Land preparation family 97.1 -3.0** (1.3) male 95.5 0.9 (1.3) hired 2.1 0.9 (1.1) female 2.4 -1.3 (0.9) dabo 0.7 2.1*** (0.8) child 2.1 0.4 (1.0) Planting family 93.5 -10.8*** (3.0) male 97.3 -16.9*** (2.5) hired 0.3 1.2** (0.6) female 1.8 8.8*** (1.6) dabo 6.3 9.5*** (2.8) child 0.9 8.0*** (1.3) Fertilizer application family 97.3 -4.8** (2.3) male 99.2 -7.7*** (1.7) hired -0.0 0.9*** (0.3) female -0.0 4.4*** (1.2) dabo 2.8 4.0* (2.1) child 0.9 3.4*** (0.9) Weeding family 95.3 -4.2*** (1.4) male 73.2 2.3 (2.4) hired 2.3 2.7** (1.1) female 20.4 -3.6** (1.7) dabo 2.8 1.8* (1.0) child 9.3 0.4 (1.9) Harvesting family 83.4 -4.7 (3.4) male 91.0 0.4 (1.4) hired 7.8 8.0** (3.5) female 3.2 -0.5 (0.7) dabo 9.3 -2.9 (1.8) child 6.0 0.2 (1.3) Threshing family 94.0 -5.1** (2.4) male 76.6 -0.1 (2.4) hired 2.7 5.7*** (2.0) female 10.1 1.0 (1.9) dabo 3.6 -0.4 (1.3) child 14.5 -0.9 (2.2) Total family 91.1 -6.1*** (1.6) male 81.1 -2.0 (1.5) hired 3.8 2.4** (1.2) female 9.7 1.3 (1.1) dabo 5.0 3.7** (1.5) child 9.2 0.7 (1.4) Notes: ‘Control’ is the average share of labor for each inter or intra-household source for traditional broadcasting farmers (%). ‘Row planting’ is the coefficient of the treatment effect of row planting on labor shares (%). The bootstrapped standard errors for these coefficients are clustered at village level and reported with the coefficients in parentheses. ∗p<0.10, ∗∗p<0.05, ∗∗∗p<0.01. The coefficients estimated are Intention-To-Treat effect, measured by comparing farmers on their initial technology assignment. The number of observations is 537 farmers.
Next, we analyze how row planting affects the shares of intra-household labor use. In absolute numbers (Appendix II), the total amount of labor applied by each family labor category increases significantly by 29 percent for males, 39 percent for females, and 44 percent for children. Most of this increased labor is a consequence of the substantial increase in the person-hours of labor applied by each household member to sowing and fertilizing. The increase in levels is the highest for males, but the relative burden is higher for females and children because they traditionally are not involved in these activities. Therefore, Table 5.3 (right panel) shows that the share of labor supplied by males for sowing and fertilizing decreases, while for females and children the shares increase. While females and children are traditionally not involved in sowing and applying fertilizer, they are becoming relatively more active in these activities when implementing row planting and their shares increase at the expense of those of males. Interestingly, when labor inputs are combined over all activities, the shares of labor supplied by males, females, and children do not change significantly when adopting row planting on the experimental plot.
In conclusion, our results show that total labor use in teff production significantly increases when farmers row plant teff compared to traditional planting using seed broadcasting. Moreover, the adoption of row planting seems to have differential implications for inter-household labor allocation. While all inter-household labor inputs increase in levels, the share of external labor in total labor significantly increases for land preparation, sowing, and weeding. Males are traditionally responsible almost exclusively for teff production, but the adoption of row planting forces females and children to supply
15
labor to teff sowing and applying fertilizer. However, the intra-household allocation outcomes do not show a gender effect when looking at total labor usage in teff production.
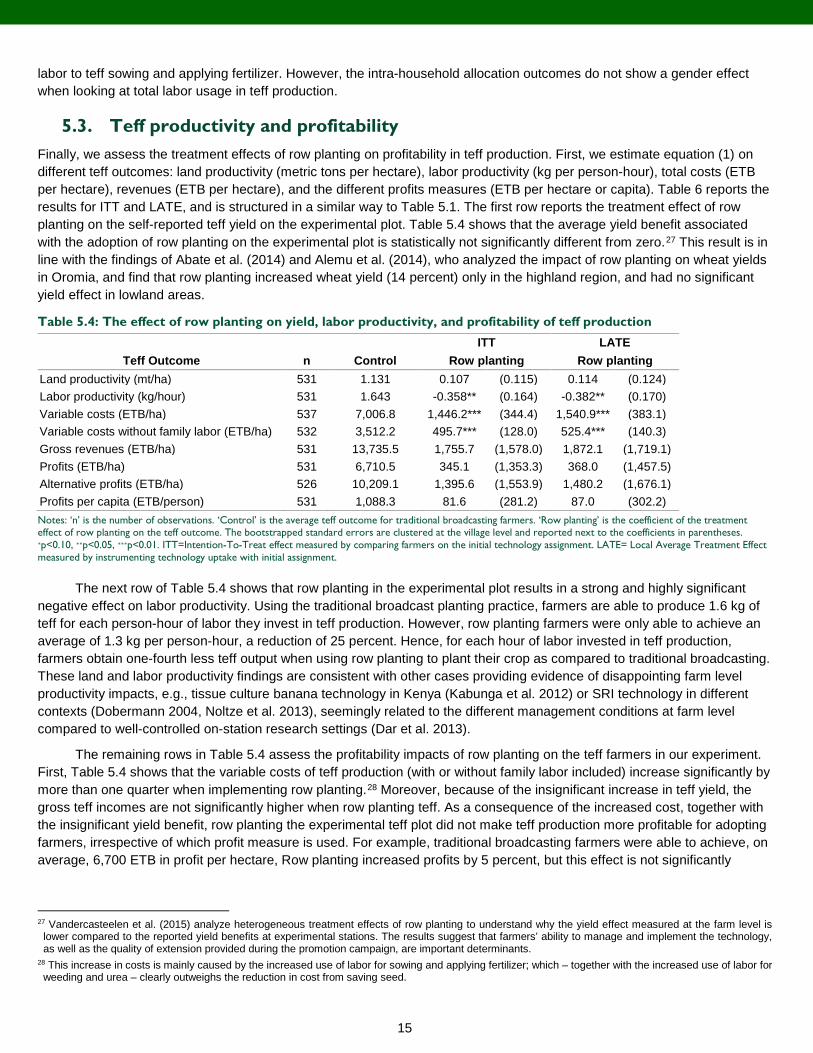
5.3. Teff productivity and profitability Finally, we assess the treatment effects of row planting on profitability in teff production. First, we estimate equation (1) on different teff outcomes: land productivity (metric tons per hectare), labor productivity (kg per person-hour), total costs (ETB per hectare), revenues (ETB per hectare), and the different profits measures (ETB per hectare or capita). Table 6 reports the results for ITT and LATE, and is structured in a similar way to Table 5.1. The first row reports the treatment effect of row planting on the self-reported teff yield on the experimental plot. Table 5.4 shows that the average yield benefit associated with the adoption of row planting on the experimental plot is statistically not significantly different from zero.27 This result is in line with the findings of Abate et al. (2014) and Alemu et al. (2014), who analyzed the impact of row planting on wheat yields in Oromia, and find that row planting increased wheat yield (14 percent) only in the highland region, and had no significant yield effect in lowland areas.
Table 5.4: The effect of row planting on yield, labor productivity, and profitability of teff production
Teff Outcome ITT LATE
n Control Row planting Row planting Land productivity (mt/ha) 531 1.131 0.107 (0.115) 0.114 (0.124) Labor productivity (kg/hour) 531 1.643 -0.358** (0.164) -0.382** (0.170) Variable costs (ETB/ha) 537 7,006.8 1,446.2*** (344.4) 1,540.9*** (383.1) Variable costs without family labor (ETB/ha) 532 3,512.2 495.7*** (128.0) 525.4*** (140.3) Gross revenues (ETB/ha) 531 13,735.5 1,755.7 (1,578.0) 1,872.1 (1,719.1) Profits (ETB/ha) 531 6,710.5 345.1 (1,353.3) 368.0 (1,457.5) Alternative profits (ETB/ha) 526 10,209.1 1,395.6 (1,553.9) 1,480.2 (1,676.1) Profits per capita (ETB/person) 531 1,088.3 81.6 (281.2) 87.0 (302.2) Notes: ‘n’ is the number of observations. ‘Control’ is the average teff outcome for traditional broadcasting farmers. ‘Row planting’ is the coefficient of the treatment effect of row planting on the teff outcome. The bootstrapped standard errors are clustered at the village level and reported next to the coefficients in parentheses. ∗p<0.10, ∗∗p<0.05, ∗∗∗p<0.01. ITT=Intention-To-Treat effect measured by comparing farmers on the initial technology assignment. LATE= Local Average Treatment Effect measured by instrumenting technology uptake with initial assignment.
The next row of Table 5.4 shows that row planting in the experimental plot results in a strong and highly significant negative effect on labor productivity. Using the traditional broadcast planting practice, farmers are able to produce 1.6 kg of teff for each person-hour of labor they invest in teff production. However, row planting farmers were only able to achieve an average of 1.3 kg per person-hour, a reduction of 25 percent. Hence, for each hour of labor invested in teff production, farmers obtain one-fourth less teff output when using row planting to plant their crop as compared to traditional broadcasting. These land and labor productivity findings are consistent with other cases providing evidence of disappointing farm level productivity impacts, e.g., tissue culture banana technology in Kenya (Kabunga et al. 2012) or SRI technology in different contexts (Dobermann 2004, Noltze et al. 2013), seemingly related to the different management conditions at farm level compared to well-controlled on-station research settings (Dar et al. 2013).
The remaining rows in Table 5.4 assess the profitability impacts of row planting on the teff farmers in our experiment. First, Table 5.4 shows that the variable costs of teff production (with or without family labor included) increase significantly by more than one quarter when implementing row planting.28 Moreover, because of the insignificant increase in teff yield, the gross teff incomes are not significantly higher when row planting teff. As a consequence of the increased cost, together with the insignificant yield benefit, row planting the experimental teff plot did not make teff production more profitable for adopting farmers, irrespective of which profit measure is used. For example, traditional broadcasting farmers were able to achieve, on average, 6,700 ETB in profit per hectare, Row planting increased profits by 5 percent, but this effect is not significantly
27 Vandercasteelen et al. (2015) analyze heterogeneous treatment effects of row planting to understand why the yield effect measured at the farm level is lower compared to the reported yield benefits at experimental stations. The results suggest that farmers’ ability to manage and implement the technology, as well as the quality of extension provided during the promotion campaign, are important determinants.
28 This increase in costs is mainly caused by the increased use of labor for sowing and applying fertilizer; which – together with the increased use of labor for weeding and urea – clearly outweighs the reduction in cost from saving seed.

16
different from zero. Similarly, the effect of row planting on profits without family labor or calculated on per capita basis is small and non-significant.
Finally, we look at other determinants of teff productivity and profitability by adding various household and household head characteristics and experimental plot characteristics to equation (1). Table 5.5 reports the ITT estimates for land productivity (columns 2 and 3), labor productivity (columns 4 and 5), and profits (column 6 and 7).29 The estimation results show that the same set of variables have either a positive or negative effect, respectively, on teff yield, labor productivity, and profits. On the one hand, these outcomes are positively related with education level of the household head, value of agricultural assets, high quality soils, and on-time seed germination. On the other hand, receiving inputs (as part of the promotion campaign) too late, rains arriving earlier than normal, and harvesting teff earlier than normal have a significant negative effect on teff productivity and profitability.
Table 5.5: Determinants of teff yields, labor productivity, and profits Household (head) characteristics Land productivity Labor productivity Profits
Assigned to row planting (yes=1) 0.096 (0.093) -0.364*** (0.122) 69.7 (1,095.5) Gender of the household head (male=1) -0.374 (0.297) -0.127 (0.257) -5,715.1 (3,524.4) Age of the household head (years) 0.007* (0.004) 0.006 (0.004) 66.6 (45.8) Education of household head (grade) 0.018** (0.007) 0.026* (0.014) 283.8** (100.8) Household size (number of persons) 0.010 (0.018) 0.032 (0.023) 151.0 (204.7) Household received income from other activities (yes=1) -0.008 (0.057) 0.062 (0.058) 557.7 (602.7) Household applied for a loan/credit (yes=1) -0.040 (0.098) -0.147 (0.114) -1,342.2 (1,087.0) Household is member of an iqub (yes=1) 0.183 (0.108) 0.008 (0.118) 1,381.3 (1,479.9) Household agricultural assets (ln ETB) 0.080** (0.031) 0.123** (0.043) 525.7 (361.0) Household has access to storing facility (yes=1) -0.109 (0.267) 0.821** (0.319) 3,378.6 (3,466.8) Distance of the experimental plot (minutes) 0.003 (0.003) 0.004 (0.004) 36.0 (36.4) Soil is easy to plow (yes=1) 0.015 (0.109) -0.018 (0.103) -84.5 (1,268.4) Crop was affected by pests (yes=1) -0.010 (0.136) 0.011 (0.120) -69.2 (1,450.9) Crop was affected by diseases (yes=1) -0.059 (0.090) -0.094 (0.148) -2,197.3* (1,058.5) Household received inputs late (yes=1) -0.240** (0.084) -0.290** (0.119) -3,571.3*** (979.3) Training obtained on teff technology (days) -0.005 (0.018) 0.019 (0.037) -104.2 (210.2) Experts visited plot after training (number) -0.007 (0.018) -0.038 (0.029) -121.0 (202.0) Soil has high quality (yes=1) 0.261*** (0.079) 0.358*** (0.114) 2,530.1** (1,008.6) Seed germinated on time (yes=1) 0.473*** (0.128) 0.395* (0.193) 4,451.8** (1,694.7) Rains were later than normal (yes=1) -0.063 (0.108) -0.220 (0.129) -821.4 (1,517.9) Rains were earlier than normal (yes=1) -0.341** (0.120) -0.139 (0.262) -3,348.8** (1,549.5) Harvest was later than normal (yes=1) 0.105 (0.176) 0.080 (0.174) 1,394.7 (1,966.3) Harvest was earlier than normal (yes=1) -0.305** (0.113) -0.549*** (0.144) -4,478.4*** (879.3) Constant 0.155 (0.629) -0.807 (0.582) -3,378.6 (7,238.6) Observations 531 537 531 Notes: Estimation results of the determinants of land productivity (columns 2 and 3), labor productivity (columns 4 and 5) and profits (columns 6 and 7) are generated using OLS. Bootstrapped standard errors are clustered at the village level and reported next the coefficients in parentheses. ∗p<0.10, ∗∗p<0.05, ∗∗∗p<0.01.
6. CONCLUSIONS
This paper looks at how the adoption of row planting, as part of a government-led promotion campaign in Ethiopia, has affected labor use, productivity, and profitability in teff production. Teff is Ethiopia’s an important staple crop, but national yield levels are low. Row planting has been introduced to address these low yields. However, there is a lack of empirical evidence on the effectiveness of this technology at farm level, especially related to labor allocation and profitability issues that are ultimately the drivers for successful adoption of any technology. We find that the labor requirements associated with row planting of teff increase in total by 30 percent, especially for teff activities which take place early in the season. This leads to a higher share of external labor being used in teff production.
29 We obtain similar results for the LATE when we use alternative definitions of profit.

17
Row planting did not result in a significant increase in land productivity. However, labor productivity dropped substantially. Moreover, the adoption of row planting did not lead to significantly higher profits for the adopting farmers. While the evidence is presented for row planting in teff production, we believe that our results might be more generally applicable to other labor-intensive land management technologies that have been introduced in staple food production in Ethiopia which face low productivity levels similar to teff.
We warn against exact causal interpretation of the estimated impacts because of several caveats in the study. First, given that the experiments were conducted on small plots, there might be problems with inferences to the hectare level. We are, however, quite confident in our results as to the labor input numbers reported by broadcasting farmers. These are in line with the numbers reported in related teff literature. Second, widespread adoption of the row planting technology might have implications on overall agricultural labor markets and lead to increased agricultural wages. These effects have not been taken into account in our analysis. A final related caveat is that, due to data limitations, we cannot assess how row planting adoption has affected farmers’ non-farm and other wealth outcomes. Takahashi and Barrett (2014), for example, show that households adopting SRI enjoy no overall household income gain because labor is reallocated from non-farm activities to agricultural production. However, because our experiment was conducted on a small plot, we believe that there were no substantial wider economic effects.
As the design of the experiment was rolled out in line with the government-led promotion campaign, our results have important policy implications for the adoption of row planting in Ethiopia. As row planting is very labor intensive, adoption might be difficult for labor-constrained households which are unable to invest more person-hours of labor in teff production. Our results show that because row planting increases labor use during peak times, i.e., at the beginning of the production season, seasonal labor constraints might be another important constraint to the adoption of row planting (Hailu et al. forthcoming). Our results further suggest that the adoption of row planting has important inter-household labor consequences. Even though more labor is used from all inter-household sources, exchange and hired labor is used relatively more, and, hence, households with access to exchange or hired labor seem to be in a better position to adopt row planting.
Moreover, our results contribute to the policy discussion on how to promote new agricultural technologies like row planting in Ethiopia and elsewhere. Farmers will only adopt a new technology if it is profitable, but we show that during the first year that the teff row planting technology was promoted to farmers, profitability levels did not improve. These results illustrate that there is a need for a careful on-farm assessment of the constraints to adoption, especially the labor implications, when starting up widespread promotion campaigns to scale up adoption of such technologies (Orr 2003; Moser and Barrett 2006). However, as this data is a cross-section of the short-run impacts of adoption, we cannot generalize that the long-run returns to row planting will be insignificant. Continued experimentation and learning-by-doing with the row planting technology are likely to improve farmers’ implementation and management of the technology and, hence, their profitability outcomes, as has been observed for other technologies (Foster and Rosenzweig 1995; Barrett et al. 2004; Brouder and Gomez-Macpherson 2014).
Finally, we acknowledge that because this study was purposely designed to rigorously measure the productivity and profitability impacts of row planting, our results cannot be interpreted as a program evaluation of the complete TIRR package. The advantage of our RCT design – random farmer selection and technology assignment – allows us to construct a proper counterfactual and to avoid sample selection biases, but this comes at the cost of being unable to assess the different components of the TIRR package. However, the availability of panel data on teff production practices will allow future research to assess dynamics in the adoption of the different elements of the TIRR package. Moreover, other studies have focused on improved access to and promotion of improved seeds and fertilizer in Ethiopia. While initial adoption rates were promising, farmers have tended to dis-adopt the fertilizer and seed packages because of high cost, lack of credit, and delivery problems (Spielman et al. 2010; Krishnan and Patnam 2014). Similarly, the functioning of the recently renewed national extension and training program is currently being evaluated (Davis et al. 2010).

18
REFERENCES
Abate, G. T., de Brauw, A., Minot, N., and T. Bernard. 2014. The impact of the use of new technologies on farmers wheat yield in Ethiopia: Evidence from a Randomized Control Trial. REAP/IFPRI. [Downloaded from: http://reap.ifpri.info/files/2014/11/ATA-wheat-report-.pdf]
Alston, J. M., and P. G. Pardey. 2014. “Agriculture in the Global Economy.” Journal of Economic Perspectives 28 (1): 121-146.
Alemu, T., B. Emana, J. Haji, and B. Legesse. 2014. “Impact of Wheat Row Planting on Yield of Smallholders in Arsi Zone of Ethiopia.” International Journal of Economics and Empirical Research 2 (12): 510-517.
Alwang, J., and P. B. Siegel. 1999. “Labor shortages on small landholdings in Malawi: Implications for policy reforms.” World Development 27 (8): 1461-1475.
ATA (Agricultural Transformation Agency). 2013. Results of 2012 New Tef Technologies Demonstration Trials Draft Report VF. Addis Ababa, Ethiopia.
Bardasi, E., K. Beegle, A. Dillon, A., and P.M. Serneels. 2011. Do labor statistics depend on how and to whom the questions are asked? Results from a survey experiment in Tanzania. Results from a Survey Experiment in Tanzania. World Bank Policy Research Working Paper Series.
Barrett, C. B., M. R. Carter, and C. P. Timmer. 2010. “A Century-long Perspective on Agricultural Development.” American Journal of Agricultural Economics 92 (2): 447–468.
Barrett, C. B., C. M., Moser, O. V., McHugh, and J. Barison. 2004. “Better Technology, Better Plots, or Better Farmers? Identifying Changes in Productivity and Risk among Malagasy Rice Farmers.” American Journal of Agricultural Economics 86 (4): 869-888.
Beegle, K., C. Carletto, and K. Himelein. 2012. “Reliability of recall in agricultural data.” Journal of Development Economics 98 (1): 34-41.
Berhane, G., Z. Paulos, and K. Tafere. 2011. Foodgrain Consumption and Calorie Intake Patterns in Ethiopia. ESSP II Working Paper 23. Addis Ababa, Ethiopia: International Food Policy Research Institute (IFPRI).
Berhe, T., Z. Gebretsadik, S. Edwards, and H. Araya. 2011. “Boosting Tef Productivity Using Improved Agronomic Practices and Appropriate Fertilizer.” In Achievements and Prospects of Tef Improvement. Proceedings of the Second International Workshop, edited by K. Assefa, T. Solomon, and Z. Chanyalew, 133–140. November 7–9, 2011, Debre Zeit, Ethiopia,
Bezu, S., G. T. Kassie, B. Shiferaw, and J. Ricker-Gilbert. 2014. “Impact of Improved Maize Adoption on Welfare of Farm Households in Malawi: A Panel Data Analysis.” World Development 59: 120-131.
Blundell, R., and M. C. Dias. 2009. “Alternative Approaches to Evaluation in Microeconomics.” Journal of Human Resources. 44(3): 565-640.
Brouder, S. M., and H. Gomez-Macpherson. 2014. “The impact of conservation agriculture on smallholder agricultural yields: A scoping review of the evidence.” Agriculture, Ecosystem and Environment 187: 11-32.
Bulte, E., G., S. Beekman, J. Di Falco, J. Hella, and P. Lei. 2014. “Behavioral Responses and the Impact of New Agricultural Technologies: Evidence from a Double-blind Field Experiment in Tanzania.” American Journal of Agricultural Economics 96(3): 813-830.
Cavatassi, R., L. Salazar, M. GonzálezFlores, and P. Winters. 2011. “How do Agricultural Programmes Alter Crop Production? Evidence from Ecuador.” Journal of Agricultural Economics 62 (2): 403-428.
CSA (Central Statistical Agency). 2012. Agricultural Sample Survey: Area and Production of Major Crops, Meher Season. Vol. I. Addis Ababa, Ethiopia.
Dar, M. H., A. de Janvry, K. Emerick, D. Raitzer, and E. Sadoulet. 2013. Flood-tolerant rice reduces yield variability and raises expected yield, differentially benefitting socially disadvantaged groups. Scientific reports, 3.
Davis, K., B. Swanson, D. Amudavi, D. A. Mekonnen, A. Flohrs, J. Riese, C. Lamb, and E. Zefru. 2010. In-Depth Assessment of the Public Agricultural Extension System of Ethiopia and Recommendations for Improvement. IFPRI Discussion Paper 01041. International Food Policy Research Institute (IFPRI). Washington, DC, USA.
De Nicola, F. and X. Giné.2014. “How accurate are recall data? Evidence from coastal India.” Journal of Development Economics 106: 52-65.
deGraft‐Johnson, M., A. Suzuki, T. Sakurai, and K. Otsuka. 2014. “On the transferability of the Asian rice green revolution to rainfed areas in sub‐Saharan Africa: an assessment of technology intervention in Northern Ghana.” Agricultural Economics 45 (5): 555-570.
Diao, X., D. Headey, and M. Johnson. 2008. “Toward a green revolution in Africa: what would it achieve, and what would it require?” Agricultural Economics 39 (s1): 539-550.
Dobermann, A. 2004. “A critical assessment of the system of rice intensification (SRI).” Agricultural Systems 79 (3): 261-281.

19
Doss, C. R. 2001. “Designing agricultural technology for African women farmers: Lessons from 25 years of experience.” World Development 29 (12): 2075-2092.
Doss, C. R. 2006. “Analyzing Technology Adoption using Microstudies: Limitations, Challenges, and Opportunities for Improvement.” Agricultural Economics 34 (3): 207-219.
Duflo, E., M. Kremer, and J. Robinson. 2008. “How High are Rates of Return to Fertilizer? Field Experiments in Evidence from Kenya.” American Economic Review 98 (2): 482–488.
Duncan, G. J. and D. H. Hill. 1985. “An investigation of the extent and consequences of measurement error in labor-economic survey data.” Journal of Labor Economics 3 (4): 508-532.
Ehui, S., and J. Pender. 2005. “Resource degradation, low agricultural productivity, and poverty in sub‐Saharan Africa: pathways out of the spiral.” Agricultural Economics 32 (s1): 225-242.
Erenstein, O., K. Sayre, P. Wall, J. Dixon, and J. Hellin. 2008. “Adapting no-tillage agriculture to the conditions of smallholder maize and wheat farmers in the tropics and sub-tropics.” No-till Farming System: 253-278.
Evenson R. E. and D. Gollin. 2003. “Assessing the Impact of the Green Revolution, 1960 to 2000.” Science 300 (5620): 758-762.
Feder, G., Just, R. E. and D. Zilberman. 1985. “Adoption of agricultural innovations in developing countries: A survey.” Economic Development and Cultural Change 33 (2): 255-298.
Foster, A. D., and M. R. Rosenzweig. 1995. “Learning by Doing and Learning from Others: Human Capital and Technical Change in Agriculture.” Journal of Political Economy 103 (6): 1176-1209.
Gollin, D., Morris, M., and D. Byerlee. 2005. “Technology adoption in intensive post-green revolution systems.” American Journal of Agricultural Economics 87 (5): 1310-1316.
Giller, K. E., E. Witter, M. Corbeels, and P. Tittonell. 2009. “Conservation agriculture and smallholder farming in Africa: the heretics’ view.” Field Crop Research 114 (1): 23-34.
Hailu, G., A. Weersink, and B. Minten. (forthcoming). Determinants of the productivity of teff in Ethiopia, mimeo. lahi, N. 2000. The intra-household allocation of time and tasks: what have we learnt from the empirical literature? Gender
and Development Working Paper Series 13. World Bank, Washington DC, USA [downloaded at: www.worldbank.org/gender/prr].
Kabunga, N. S., T., Dubois, and M. Qaim. 2012. “Yield effects of tissue culture bananas in Kenya: accounting for selection bias and the role of complementary inputs.” Journal of Agricultural Economics 63(2): 444-464.
Ketema, S. 1997. Tef, Eragrostis tef (Zucc.) Trotter. Promoting the Conservation and Use of Underutilized and Neglected Crops 12. Rome, Italy: Institute of Plant Genetics and Crop Plant Research, Gatersleben/International Plant Genetic Resources Institute.
Kijima, Y., K. Otsuka, and D. Sserunkuuma. 2011. “An inquiry into constraints on a green revolution in Sub-Saharan Africa: the case of NERICA rice in Uganda.” World Development 39 (1): 77-86.
Krishnan, P., and M. Patnam. 2014. “Neighbors and Extension Agents in Ethiopia: Who Matters More for Technology Adoption?” American Journal of Agricultural Economics 96 (1): 308–327.
Knowler, D., and B. Bradshaw. 2007. “Farmers’ adoption of conservation agriculture: A review and synthesis of recent research.” Food policy 32 (1): 25-48.
Lee, D. R. 2005. “Agricultural sustainability and technology adoption: Issues and policies for developing countries.” American Journal of Agricultural Economics 87 (5): 1325-1334.
Lapar, M. L. A., and S. Pandey. 1999. “Adoption of soil conservation: the case of the Philippine uplands.” Agricultural Economics 21 (3): 241-256.
Minten, B., and C. Barrett. 2008. “Technology adoption, productivity, and poverty in Madagascar.” World Development 36 (5): 797-822.
Minten, B., S. Tamru, E. Engida, and T. Kuma. 2016. “Feeding Africa’s cities: The case of the supply chain of teff to Addis Ababa.” Economic Development. and Cultural Change 64 (2): 265-297.
Moser, C.M., and C.B. Barrett. 2006. “The Complex Dynamics of Smallholder Technology Adoption: The Case of SRI in Madagascar.” Agricultural Economics 35(3): 373–388.
Noltze, M., S. Schwarze, and M. Qaim, 2013. “Impacts of natural resource management technologies on agricultural yield and household income: The system of rice intensification in Timor Leste.” Ecological Economics 85: 59-68
Orr, A. 2003. “Integrated pest management for resource-poor African farmers: Is the emperor naked?” World Development 31 (5): 831-845.
Palacios-Lopez, A., L. Christiaensen, and T. Kilic. 2015. How much of the labor in African agriculture is provided by women? Policy Research working paper WPS 7282. Washington, D.C.: World Bank Group.

20
Pypers, P., J. M. Sanginga, B. Kasereka, M. Walangululu, and B. Vanlauwe. 2011. “Increased productivity through integrated soil fertility management in cassava–legume intercropping systems in the highlands of Sud-Kivu, DR Congo.” Field Crop Research 120 (1): 76-85.
Quisumbing, A. R., and L. Pandolfelli. 2010. “Promising approaches to address the needs of poor female farmers: Resources, constraints, and interventions.” World Development 38 (4): 581-592.
Rubin, D.B. 1978. “Bayesian Inference for Causal Effects: The Role of Randomization.” Annals of Statistics 6: 34-58. Spielman, D. J., D. Byerlee, D. Alemu, and D., Kelemework 2010. „Policies to promote cereal intensification in Ethiopia: The
search for appropriate public and private roles.” Food Policy 35 (3): 185-194. Stevenson, J. R., R. Serraj, and K. G. Cassman. 2014. “Evaluating conservation agriculture for small-scale farmers in Sub-
Saharan Africa and South Asia.” Agriculture, Ecosystem and Environment 187: 1-10. Stoop, W. A., N. Uphoff, and A. Kassam. 2002. “A review of agricultural research issues raised by the system of rice
intensification (SRI) from Madagascar: opportunities for improving farming systems for resource-poor farmers.” Agricultural Systems 71 (3): 249-274.
Takahashi, K., and C. B. Barrett. 2014. “The System of Rice Intensification and its Impact on Household Income and Child Schooling: Evidence from Rural Indonesia.” American Journal of Agricultural Economics 96 (1): 269-289.
Tu, Q., and E. Bulte. 2010. “Trust, market participation and economic outcomes: Evidence from rural China.” World Development 38 (8): 1179-1190.
Vandercasteelen, J., M. Dereje, B. Minten, and A. S. Taffesse. 2013. LICOS DP 350: Perceptions, impacts and rewards of row planting of teff. LICOS Discussion paper series 350/2014: 1-50. Leuven, Belgium.
Vandercasteelen, J., Dereje, M., Minten, B., and A. S. Taffesse. (forthcoming). The effect of technology promotion on farmers' adoption decision: The case of row planting teff in Ethiopia, mimeo.
Von Braun, J., and P. J. Webb. 1989. “The impact of new crop technology on the agricultural division of labor in a West African setting.” Economic Development and Cultural Change 37 (3): 513-534.
Zeng, D., J. Alwang, G. W. Norton, B. Shiferaw, M. Jaleta, and C. Yirga. 2015. “Ex post impacts of improved maize varieties on poverty in rural Ethiopia.” Agricultural Economics 46 (4): 515-526.

21
APPENDICES
Appendix I: Issues with survey implementation The power calculation, in order to determine the sample size, used the following parameters:
• Yield (primarily crop yield) measured from survey data is the primary outcome indicator;
• The desired minimum detectable size effect is equivalent to 40 percent of the standard deviation of teff yield. This amounts to 17 percent of the mean teff yield achieved in Oromia region.30 This is lower than the 4.3 quintals per ha average gain associated with row planting that was reported for the 2011 farmers’ field trials in Amhara; Southern Nations, Nationalities, and Peoples' (SNNP); and Tigray regions.
• The intra-cluster correlation (ICC) of teff yields within a village is 0.5. This is calculated as an average for the CSA Agricultural Sample Survey over a number of years.
• The levels of statistical power and significance are 80 percent and 5 percent (two-tailed), respectively.
• 90 percent of the households asked will agree to an interview (in other words, the response rate is 90 percent).
• As the village represents the cluster being targeted, the sample proposed was 20 households in each village (or Enumeration Area (EA)) – ten row planting (treatment) households and ten broadcasting (control) households.
• With ICC=0.5, village-level clustering, and 20 households sampled from each village, the design effect is 10.5, i.e., the complex sampling design requires a sample size 10.5 times larger than that required by a simple random sampling design.
With these parameters, the sample size required becomes 572 households over 29 villages using the following formula appropriate to a continuous variable such as yield.
𝑛𝑛 = 𝑑𝑑𝑟𝑟∗ �
𝑧𝑧𝛼𝛼 2⁄ +𝑧𝑧𝛽𝛽𝑒𝑒 𝜎𝜎⁄
�2∗ 1𝑎𝑎∗(1−𝑎𝑎)
where n is the sample size; d is the design effect and is given as 𝑑𝑑 = 1 + 𝜌𝜌(𝑚𝑚 − 1), where 𝜌𝜌 is the inter-cluster correlation and 𝑚𝑚 is the within cluster sample size; 𝑟𝑟 = the response rate (or fraction of sample agreeing to interview); 𝑧𝑧𝛼𝛼 2⁄ and 𝑧𝑧𝛽𝛽 are the cumulative probability for the significance and power of 𝛼𝛼 (two-tailed) and (1-β), respectively; 𝑒𝑒 is the minimum detectable effect and 𝜎𝜎 is the standard deviation of teff yields; and 𝑎𝑎 is the proportion of sample that is treated. In anticipation of non-compliance and other challenges of implementation, the actual sample was increased to 1000 households over 40 villages.
Appendix Table A.1 reports the implementation issues of the survey. First, the design of the pre-scale-up phase of the promotion campaign could not be implemented in some villages. One woreda was dropped because it did not follow instructions. Because the local agricultural extension Development Agents (DA) were responsible for selecting the farmers, we had no direct control of the randomization process. After the baseline survey, we identified 17 villages where farmers were potentially not randomly selected by the DAs. Therefore, in this paper we focus on the farmers from villages where the assignment of teff planting technologies to farmers occurred randomly. In another working paper (Vandercasteelen et al. 2013), all villages are analyzed, but the results are not very different from the results reported here.
Second, there were sample selection issues during the baseline and impact survey. Some of the farmers that were selected for interview were not covered during the baseline survey because their experimental plot (preparation) was out of line with the MoA’s recommendations. Most of them had an experimental plot that was either too large or too small, used a seed rate that was not in line with the recommendations, etc. The DA randomly replaced the non-interviewed control and row planting farmers with some of the remaining 40 (random) farmers in the village that were part of the promotion campaign. However, among these farmers, the majority was (randomly) assigned to row planting, so the number of traditional broadcasting (row planting) farmers fell below (above) the target number. Moreover, in some villages, there was not a
30 Authors’ calculations using the Ethiopian Agricultural Sample Survey farmer-level data for the Oromia region 2010/11 from CSA (2011) show that the standard deviation of teff yields was around 3.8 quintals such that a yield increase equivalent to 50 percent is the same as a 17 percent increase to the mean levels of teff yield.

22
sufficient number of remaining farmers to replace the non-interviewed farmers. As a consequence, the total number of interviewed farmers in the baseline survey (410) falls below the experimental target (800).
Appendix Table A.1: Survey implementation issues, number of sample farmers involved
Farmers in the sample Broadcasting
farmers Row planting
farmers Total
farmers Sampling issues Target sample of pre-scale-up phase 400 1,600 2,000 Target sample of experiment 400 400 800 Random sample of baseline survey a 157 253 410 Random sample of impact survey b 195 342 537 Other problems Attrition in self-reported data 2 4 6 Non-compliance in assigned treatment 18 2 20 Attrition in crop-cut data because not covered in baseline survey 20 87 107 Attrition in crop-cut data because not covered in crop-cut survey 3 4 7 Notes: a The Baseline Survey sample is smaller than the target sample because of problems in the pre-scale-up phase: one woreda dropped out, resulting in a total of 36 villages. b The Impact Survey sample is larger than the Baseline Survey sample because of problems in the survey implementation. The allocation of farmers over different technologies was not achieved and row planting farmers were randomly added to the sample to achieve target numbers. Also, some farmers, who were initially selected but not interviewed in the baseline survey, were visited during the impact survey.
Even though this replacement strategy was conducted randomly, we wanted to assure that our experimental design was not flawed. Therefore, enumerators revisited the ‘non-visited’ farmers in the random villages. As a consequence, the ‘impact survey sample’ consists of 537 farmers as it includes both the baseline farmers (410) as well as replacement farmers (127).
Finally, the second panel of Table AI shows the other problems with our sample. First, six farmers did not report any output during the impact survey. Second, 20 farmers out of the 127 ‘non-interviewed’ farmers refused or did not implement the assigned technology, but instead adopted the opposite technology and are, therefore, considered as non-compliers. Third, these and the remaining ‘non-interviewed’ farmers have no crop-cut output. Additionally, seven farmers did not report any output during the crop-cut survey.
Table A.2 reports the regression coefficients for different Probit models that were constructed to determine whether there were any systematic factors associated with any of the survey implementation issues encountered. In the first column, we estimate the likelihood that a farmer is complying with the assigned technology. We see that the initial assignment to treatment is negatively related with the probability to be in compliance, possibly related to the fact that non-compliance was one sided, i.e. farmers assigned to row planting were less likely to uptake the technology. In the second and third columns, we assess the determinants of the probability to have non-missing data, i.e., that there was not systematic attrition in the sample from which data was collected for the crop-cut and self-reported teff output. In both cases, treatment uptake is not related with non-attrition. Finally, the last column of Table A.2 reports the probability to be treated, i.e., the propensity score estimation of row planting. None of the potential determinants are associated systematically with the probability of a sample famer being assigned to the row planting treatment group.

23
Appendix Table A.2: Estimates of likelihood to comply with treatment, non-attrition in the crop-cut data, non-attrition in the self-reported data, and probability to be treated
(1) (2) (3) (4)
Compliance
with treatment Non attrition in
crop-cut Non attrition in self-reported
Probability to be treated
Initially selected to do row planting (yes=1) -0.628*** (0.225)
Row planting uptake (yes=1) -0.201 0.009 (0.150) (0.343)
Age of household head (years) -0.018*** -0.004 -0.029** -0.002 (0.006) (0.005) (0.011) (0.004)
Household head can write (yes=1) 0.076 -0.212 -0.070 -0.074 (0.206) (0.146) (0.457) (0.114)
Size of the household (number of persons) 0.012 0.014 -0.148** -0.009 (0.033) (0.033) (0.062) (0.021)
Household had non-agricultural income (yes=1) 0.067 0.057 0.049 -0.073 (0.119) (0.055) (0.132) (0.060)
Household is an iqub member (yes=1) -0.134 -0.142 -0.123 0.172 (0.345) (0.160) (0.540) (0.136)
Household owns a mobile phone (yes=1) -0.322 -0.414** -0.034 0.159 (0.393) (0.202) (0.191) (0.120)
Total value of household assets (ln ETB) -0.025 0.024 -0.099 0.010 (0.083) (0.050) (0.105) (0.023)
Total value of agricultural assets (ln ETB) -0.112 -0.047 0.400*** 0.039 (0.149) (0.096) (0.153) (0.045)
Total land owned by household (ln of ha) 0.180** 0.151* 0.298*** (0.091) (0.089) (0.087)
Gender of household head (male=1) 0.431 (0.281)
Is household head active in crop production (yes=1) -0.206 (0.305)
Household asked for a loan (yes=1) -0.055 (0.102)
Constant 3.160*** 0.545 1.261 -0.074 (0.572) (0.566) (1.316) (0.485)
Observations 537 537 537 872 Notes: Standard errors are clustered at village level and reported in parentheses; ∗p<0.10, ∗∗p<0.05, ∗∗∗p<0.01.

24
Appendix II: Effect of row planting (ATE) on labor requirements in teff production Appendix Table A.3: Effect of row planting on use of inter- and intra-household labor in levels, person-hours per
hectare
Input of inter-household labor, in levels
Input of intra-household labor, in levels
Activity Source Control Row planting Source Control Row planting Land preparation family 100.0 6.0 (5.6) male 118.8 12.7* (7.2)
hired 1.9 1.8 (1.4) female 3.3 -1.6 (1.2) dabo 9.3 2.0 (3.7) child 2.9 2.0 (2.4)
Planting family 35.1 101.7*** (9.9) male 43.2 112.6*** (11.0) hired 0.4 2.4** (1.0) female 3.1 28.8*** (4.5) dabo 8.2 34.4*** (8.7) child 1.6 30.3*** (6.4)
Fertilizer application family 13.4 32.2*** (4.0) male 21.6 46.2*** (5.6) hired -0.0 3.8** (1.5) female 0 8.2*** (1.6) dabo 1.5 10.5** (4.2) child 1 6.2*** (1.7)
Weeding family 245.2 23.8 (21.3) male 172.8 19.2 (19.1) hired 5.2 6.5** (2.9) female 54.3 6.6 (7.9) dabo 10.4 10.2* (5.3) child 28.8 6.4 (5.5)
Harvesting family 138.8 -4.3 (9.9) male 142.1 8.4 (9.3) hired 15.6 10.9 (7.1) female 5.5 0.0 (1.2) dabo 14.9 -3.4 (3.0) child 14.3 -1.5 (3.6)
Threshing family 192.5 0.2 (11.5) male 144.3 11.1 (6.9) hired 7.5 11.5** (5.6) female 21.4 1.2 (2.7) dabo 10.4 -1.1 (3.8) child 35 1.4 (7.0)
Total family 797.7 153.2*** (43.2) male 720.1 211.1*** (41.2) hired 35.0 30.2** (13.0) female 91.9 35.5*** (10.7) dabo 50.8 54.3*** (16.9) child 85.8 37.8** (16.3)
Notes: ‘Control’ is the average level of labor use for each source for traditional broadcasting farmers in percent. ‘Row planting’ is the coefficient of the treatment effect of row planting on labor use in person-hours per hectare. The bootstrapped standard errors are clustered at the village level and reported next to the coefficients in parentheses. ∗p<0.10, ∗∗p<0.05, ∗∗∗p<0.01. The coefficients estimated are Intention-To-Treat effect, measured by comparing farmers on the initial technology assignment. The number of observations is 537 farmers.

INTERNATIONAL FOOD POLICY RESEARCH INSTITUTE 2033 K Street, NW | Washington, DC 20006-1002 USA T: +1.202.862.5600 | F: +1.202.457.4439 Skype: ifprihomeoffice | [email protected] | www.ifpri.org
ETHIOPIAN DEVELOPMENT RESEARCH INSTITUTE P.O. Box 2479, Addis Ababa, Ethiopia T: +251.11.550.6066; +251.11.553.8633 | F: +251.11.550.5588 [email protected] | www.edri-eth.org
IFPRI–ESSP ADDIS ABABA P.O. Box 5689, Addis Ababa, Ethiopia T: +251.11.617.2000 | F: +251.11.646.2318 [email protected] | http://essp.ifpri.info
The Ethiopia Strategy Support Program (ESSP) is financially supported by the United States Agency for International Development (USAID) and the Department for International Development (DFID) of the government of the United Kingdom and is undertaken as part of the CGIAR Research Program on Policies, Institutions, and Markets (PIM) led by the International Food Policy Research Institute (IFPRI). This publication has been prepared as an output of ESSP and has not been independently peer reviewed. Any opinions expressed here belong to the author(s) and do not necessarily reflect those of IFPRI, the Ethiopian Development Research Institute, USAID, DFID, PIM, or CGIAR.
Copyright © 2016 International Food Policy Research Institute. All rights reserved. To obtain permission to republish, contact [email protected].
About the Authors
Joachim Vandercasteelen, is a PhD candidate at LICOS – Center for Institutions and Economic Performance, University of Leuv en, Leuven, Belgium; Mekdim Dereje, is Research Officer at the Ethiopia Strategy Support Program-Ethiopian Devel opment Research Institute, Addis Ababa; Bart Minten is the ESSP Program Leader and a Senior Research Fellow in the Development Strategy and Governance Division of IFPRI-Ethiopia Strategy Support Program, based in Addis Ababa; and Alemayehu Seyoum Taffesse is a Senior Research Fellow in the Development Strategy and Governance Division of IFPRI-Ethiopia Strategy Support Program, based in Addis Ababa.
About ESSP
The Ethiopia Strategy Support Program is an initiative to strengthen evidence-based policymaking in Ethiopia in the areas of rural and agricultural development. Facilitated by the International Food Policy Research Institute (IFPRI), ESSP works closely with the government of Ethiopia, the Ethiopian Development Research Institute (EDRI), and other development partners to provide information relevant for the design and implementation of Ethiopia’s agricultural and rural development strategies. For more information, see http://www.ifpri.org/book-757/ourwork/program/ethiopia-strategy-support-program; http://essp.ifpri.info/; or http://www.edri-eth.org/.
About these working papers
The ESSP Working Papers contain preliminary material and research results from IFPRI and/or its partners in Ethiopia. The papers are not subject to a formal peer review. They are circulated in order to stimulate discussion and critical comment.