Review of Water Supply Reliability Estimation Related to the ...
192
Review of Water Supply Reliability Estimation Related to the Sacramento-San Joaquin Delta JUN 2022
-
Upload
khangminh22 -
Category
Documents
-
view
0 -
download
0
Transcript of Review of Water Supply Reliability Estimation Related to the ...

Review of Water Supply Reliability Estimation
Related to the Sacramento-San Joaquin Delta
JUN
20
22

Review of Water Supply Reliability Estimation
Related to the Sacramento-San Joaquin Delta
Suggested Citation Delta Independent Science Board. 2022. Review of Water Supply Reliability Estimation Related to the
Sacramento-San Joaquin Delta. Report to the Delta Stewardship Council. Sacramento, California.
Report Cover Figure
Metropolitan Water District of Orange County Delivery Shortage Probabilities for Different Regional
Portfolios in Year 2040, in acre-feet per year (modified for accessibility from MWDOC, Orange
County Water Reliability Study, 2016)
Photo Credits
Unless noted otherwise, photos throughout this document are courtesy of the Delta Stewardship
Council’s staff and the California Department of Water Resources.
Report Hyperlinks
All links in this report have been created with meaningful text. If you have a printed version of this
document, you can find the electronic copy of the report at Delta ISB products web page:
https://deltacouncil.ca.gov/delta-isb/products.

Review of Water Supply Reliability Estimation
Related to the Sacramento-San Joaquin Delta
Created by the Delta Reform Act of 2009 and appointed by the Delta Stewardship
Council, the Delta Independent Science Board is a standing board of nationally and
internationally prominent scientists that provide oversight of the scientific research,
monitoring, and assessment programs that support adaptive management of the
Sacramento-San Joaquin Delta through periodic reviews.
Stephen Brandt, Ph.D., Chair
Professor, Department of Fisheries and Wildlife, Oregon State University
Lisa Wainger, Ph.D., Chair Elect
Research Professor, University of Maryland Center for Environmental Science
Jay Lund, Ph.D., Past Chair
Director, Center for Watershed Sciences; Professor of Civil and Environmental
Engineering, University of California, Davis
Virginia Dale, Ph.D.
Adjunct Professor, University of Tennessee
Harindra Joseph Shermal Fernando, Ph.D.
Wayne and Diana Murdy Professor of Engineering and Geosciences, University of
Notre Dame
Tanya Heikkila, Ph.D.
Co-Director, Center for Policy and Democracy; Professor, School of Public Affairs,
University of Colorado Denver
Thomas Holzer, Ph.D., CEG
Scientist Emeritus, United States Geological Survey
Diane McKnight, Ph.D.
Professor in the Department of Civil, Environmental and Architectural Engineering,
University of Colorado Boulder
Robert Naiman, Ph.D.
Emeritus Professor, School of Aquatic & Fishery Sciences, University of Washington

Review of Water Supply Reliability Estimation
Related to the Sacramento-San Joaquin Delta
The following former members of the Delta Independent Science Board contributed
to the development of this review from 2017 until the end of their term.
Contributors:
Tracy Collier, Ph.D. (until August 2020)
Science Director for the Puget Sound Partnership, Retired
Richard Norgaard, Ph.D. (until August 2020)
Professor Emeritus, Energy and Resources Group, University of California, Berkeley
Vincent Resh, Ph.D. (until August 2020)
Professor of the Graduate School, Department of Environmental Science, Policy,
and Management, University of California, Berkeley
John Wiens, Ph.D. (until August 2020)
Emeritus Distinguished Professor, Colorado State University; Courtesy Faculty,
Oregon State University

Review of Water Supply Reliability Estimation
Related to the Sacramento-San Joaquin Delta
Table of Contents Acknowledgements ............................................................................................................ 9
Preface ................................................................................................................................ 9
Executive Summary ......................................................................................................... 10
Findings and Recommendations ............................................................................ 12
Recommendations ................................................................................................... 15
1. Introduction .................................................................................................................... 17
1.1: Delta ISB Mandate and Scope of this Review ................................................. 17
1.2: Water Supply in California ................................................................................ 19
1.3: Overview of Water Supply Reliability Estimation ........................................... 21
2. Water Supply Reliability Analysis in California .......................................................... 27
2.1: Causes of Water Supply Unreliability .............................................................. 29
2.2: Selective Inventory of Reliability Estimation Efforts ....................................... 30
2.3: Delta Water Supply Reliability .......................................................................... 35
3. Major Scientific and Technical Challenges ................................................................ 40
3.1: Climate Change and Ecology ............................................................................ 41
3.2: Technical and Management Issues ................................................................. 48
3.3: Environmental Adaptive Management ........................................................... 54
3.4: Multiple Objectives and Conflicts in Water Management ............................. 55
3.5: Forecast-Informed Operations......................................................................... 56
3.6: Improved Regional Management .................................................................... 57
3.7: Uncertainty Analysis and Preparations ........................................................... 58
3.8: Hydrologic Data and New Analysis and Management Technologies ........... 61
4. Metrics of Water Supply Reliability ......................................................................... 63
4.1: Common Metrics of Water Supply Reliability ................................................. 63
4.2: Technical Metrics ............................................................................................... 65
4.3: Fundamental Performance Metrics ................................................................. 69
4.4: Metrics for Environmental Water Supply Reliability ...................................... 71

Review of Water Supply Reliability Estimation
Related to the Sacramento-San Joaquin Delta
5. Quality Control in Reliability Estimation .................................................................... 75
5.1: Why Water Supply Reliability Estimates Differ ............................................... 75
5.2: Making Analysis Transparent, Documented, Replicable, and Accessible .... 80
5.3: Common Basis for Water Supply Reliability Estimates .................................. 85
5.4: Model Updating and System Learning ............................................................ 86
6. Reliability Estimation in Decision-making .................................................................. 87
6.1: Organizing the Problem and Solutions ........................................................... 88
6.2: Short-term Operation Decisions ...................................................................... 89
6.3: Long-term Planning and Policy Decisions ....................................................... 89
6.4: Long-term Education and Insights for Policymakers ..................................... 90
7. Conclusions and Moving Forward .............................................................................. 92
Appendix A. Some Technical Issues in Estimating Water Supply Reliability .............. 94
A.1: Representing Hydrology in Estimating Water Supply Reliability .................. 94
A.2: Climate Change and Hydrology ....................................................................... 97
A.3: Representing Human Water Demands ......................................................... 101
A.4: Representing Time .......................................................................................... 103
Appendix B. Questionnaire Responses and Interviews ............................................. 106
B.1: Data Summary ................................................................................................. 106
B.2: Analysis of Responses ..................................................................................... 140
B.3: Interview Responses ....................................................................................... 144
Appendix C. Acronyms/Glossary .................................................................................. 160
References ...................................................................................................................... 162
Other Reviews ................................................................................................................ 191

Review of Water Supply Reliability Estimation
Related to the Sacramento-San Joaquin Delta
List of Figures Figure 1. California has the nation's most variable annual precipitation. Annual
coefficient of variation for precipitation stations in the continental US. ................... 19
Figure 2. Main components of a typical water supply reliability analysis. ................. 22
Figure 3. Water supply management portfolio for Municipal Water District of
Orange County ................................................................................................................. 49
Figure 4. Illustrative portfolio components of annual water delivery shown as
cumulative non-exceedance reliability for an agricultural user .................................. 51
Figure 5. San Joaquin Basin July Water Right Shortage Probabilities .......................... 66
Figure 6. Estimated likelihood of SWP Table A Water Deliveries ................................. 67
Figure 7. Example of a Position Analysis display of water storage trace results for
Shasta Reservoir in 2011 (wet year) and 2015 (dry year) ............................................. 68
Figure 8. Functional flow components for California depicted on a representative
hydrograph ....................................................................................................................... 74
Figure 9. Comparison of Delta water export reliabilities estimated in 2015 with
actual severe drought year exports 2014, 2015, and 2021 ......................................... 76
Figure 10. California becomes warmer in all of 43 global climate models with
moderate greenhouse gas emissions ............................................................................ 98
Figure 11. Lack of clear average precipitation trend for California from 33 models
with modest warming ...................................................................................................... 99
List of Boxes
Box 1. Adaptive Management and Water Supply Reliability ........................................ 23
Box 2. Challenges of High-impact, Unlikely (Black Swan) Events (i.e., Surprises) ...... 26
Box 3. Water Supply Reliability and the Ongoing 2020 - 2022 Drought ..................... 28
Box 4: Reduce Reliance on the Delta and Water Supply Reliability ............................ 39
Box 5. Uncertainties in Studies of Climate Change and Water Supply ....................... 60
Box 6. Some Water Supply Reliability Questions Arising in the Course of this Revie 87
Box 7. Some Common Questions on Water Supply Reliability.................................... 93

8
Review of Water Supply Reliability Estimation
Related to the Sacramento-San Joaquin Delta
List of Tables Table 1. Selected water supply reliability estimation efforts in California (see
acronym list in Appendix C) ............................................................................................ 31
Table 2. Approximate average Delta water balance, 2010-2018. (Reis et al. 2019) ... 37
Table 3. Summary of major scientific and technical challenges .................................. 40
Table 4. Portfolio elements available for managing modern water supply systems 50
Table 5. Summary of common water supply reliability performance metrics .......... 64
Table 6. Some metrics of environmental water supply reliability ............................... 72
Table 7. Why water supply reliability estimates differ ................................................. 77
Table 8. Common quality control efforts for components of water supply reliability
analyses ............................................................................................................................ 81
Table 9. Common approaches to representing hydrology for water supply reliability
studies ............................................................................................................................... 95
Table 10. Approaches to Representing Human Water Demands for Water Reliability
Studies ............................................................................................................................. 102

9
Review of Water Supply Reliability Estimation
Related to the Sacramento-San Joaquin Delta
Acknowledgements
The Delta Independent Science Board thanks the many panelists, workshop
participants, questionnaire responders, interviewees, and reviewers of report drafts
for their extensive thoughts, insights, and comments.
Preface
Managing water in California is becoming more challenging as changes in climate,
ecosystems, water demands, technology, and regulations alter water availability,
variability, and costs. California’s complex water system has helped the state thrive
economically for a century, and this system has adapted with some successes in
recent decades despite some glaring shortfalls. The most successful parts of
California’s water system have managed supplies and demands conjunctively for
planning and operational horizons, which is known as portfolio management.
Water management portfolios increasingly include groundwater banking, water
market transfers, joint facilities, and integrated system operations. Central to the
large investments and integration are assessments of the likelihoods and
probabilities of benefits and costs from various actions and investments in terms of
overall system performance over a range of wet and dry conditions, and with a
changing climate.
These management successes require assessments of water supply reliability.
California’s future water management, with less certain and more variable
conditions, will place greater demands on estimation of water supply reliability for
both traditional human purposes (cities, agriculture, hydropower, etc.) and highly
disrupted and vulnerable ecosystems. The policy and operational discussions
needed for adaptation can be improved with systematic, transparent, and shared
system and reliability analyses.
This report reviews the scientific and practical condition of water supply reliability
assessments in California for its ever-evolving water uses and systems. The focus is
on water supply reliability estimation because a forward-looking and more
common understanding of reliability estimation is an essential foundation for
management and policy assessments, discussions, and solutions.

10
Review of Water Supply Reliability Estimation
Related to the Sacramento-San Joaquin Delta
Executive Summary
The Sacramento-San Joaquin Delta Reform Act of 2009 mandates the balancing of
the coequal goals for the Delta: providing a reliable water supply for California and
protecting, restoring, and enhancing the Delta ecosystem and the Delta as an
evolving place. Of these coequal goals, water supply reliability might be the most
amenable to quantitative assessment by formal water supply reliability estimation.
This review by the Delta Independent Science Board (Delta ISB) presents findings
and recommendations on the science and practice of estimating water supply
reliability for both the Delta and California.
This report responds to the Delta ISB’s legislative mandate to review the adequacy
of science supporting adaptive management for the Delta. Accordingly, the Delta
ISB undertook a review of formal methods and underlying science used to estimate
water supply reliability. The review sought perspectives from stakeholders,
managers, and experts by formal presentations and questionnaires, a workshop,
and interviews. It draws heavily from these forums and the scientific literature.
A reliable water supply for California is defined in the Delta Plan as “better
matching the state’s demands for reasonable and beneficial uses of water to the
available supply.” Water supply reliability estimation, the subject of this review, is

11
Review of Water Supply Reliability Estimation
Related to the Sacramento-San Joaquin Delta
the formal process of quantitatively predicting the variable performance and
delivery from a water supply system. Estimates of reliability usually are expressed
as probabilities of achieving water system performance objectives. The most
common performance metric is a probability distribution of water delivery quantity
for either seasonal operations or long-term policy and planning horizons. A variety
of engineering, public health, economic, social, and ecosystem health metrics,
however, are increasingly in use.
A reliable water supply is critical to California’s public health, economic prosperity,
ecosystem health, and social well-being. Achieving a reliable supply, however, is
challenging because of California’s diverse landscape and climate, unequally
distributed and variable precipitation, complex infrastructure, decentralized
institutions, and competing water demands from agriculture, cities, and
ecosystems. In addition, California’s climate is undergoing major long-term change
from global greenhouse gas emissions.
Extreme events, such as droughts, test water management systems and require
public and political authorities to consider, adopt, and invest in new solutions and
approaches. Droughts always focus attention on the need to improve California’s
water reliability (Pinter et al. 2019). Recent droughts show that water supplies are
more reliable in communities and regions that have made effective long-term
preparations and investments (Lund et al. 2018). Improvements in runoff and water
quality predictions with a warmer climate also are urgent. Reliability estimation is
fundamental to reasoned design of investments and preparations across the wide
range of water management events, actions, and purposes.
This review identifies two major challenges for water supply reliability analyses:
(1) addressing climate change and environmental concerns, and (2) improving
technical and management aspects of water management portfolios. The first
major challenge, which is primarily scientific, includes anticipating and preparing for
changes in water and environmental systems caused by a warming climate and
incorporating management of water flows to support ecosystems into water
reliability analysis. Supporting aquatic habitats and ecosystems adds a new type of
reliability assessment as flows and water quantity, quality (e.g., salinity, nutrients,
and temperature), and physical habitat combine to affect the ability of species to
survive and reproduce.

12
Review of Water Supply Reliability Estimation
Related to the Sacramento-San Joaquin Delta
Meeting this ecological challenge requires improved understanding and
quantification of environmentally needed flows and their management with
changing and variable conditions. The second major challenge consists primarily of
technical elements in an institutional context. It includes multiple efforts to improve
water supply reliability estimates and extend their use in management and policy
making for water supplies at local, state, and regional scales. This requires
increasing the breadth and realism of water management portfolios (i.e., multiple
water sources, operations, and demand management) represented in in water
supply reliability analyses. These portfolios also must support implementation of
adaptive management. Modeling of water supply reliability for such complex and
changing conditions can be more useful by: a) applying risk based decision making,
particularly given the uncertain and non-stationary aspects of climate change; b)
including more formal analysis of multiple performance objectives that are inherent
in water planning and operations; c) introducing forecast-informed reservoir
operations (FIRO) to accommodate multiple reservoirs and portfolio elements; and
d) adopting new technologies to develop and share data and models.
Findings and Recommendations
This review led to the following findings and recommendations on the science and
practice of water supply reliability estimation and analysis. Implementing the
recommendations will improve reliability estimates and their communication for
policy and management discussions and decisions, as well as help identify
promising alternatives for managing water.

13
Review of Water Supply Reliability Estimation
Related to the Sacramento-San Joaquin Delta
Findings
Broad Importance of Water Supply Reliability and Estimations
1. Water supply reliability estimation and analyses are increasingly being
applied to adaptively manage water supplies in systems with interacting
changes in climate, water demands, regulations on water quality and
environmental flows, and system disruptions from extreme events.
2. Most major water suppliers (urban and state projects) and regulators employ
formal reliability analyses to improve water operations, planning, and policy
decision-making in California and the Delta.
3. Meeting ecological goals requires reliable water supplies and will require
reliability analyses for environmental purposes. Methods to quantify water
reliability to meet ecological goals, including recently developed methods,
need significant improvement and wider application.
4. Reducing risks to human, agricultural, and ecological systems from drought
under changing future climates is a major motivation of current efforts to
improve water supply reliability analyses.
Water Supply Reliability Estimation and Analysis
5. Improving reliability estimation and analysis for water supplies will require
managing many risks and uncertainties. These risks include drought, natural
catastrophes (such as floods, wildfires, and earthquakes), mechanical
breakdowns, chemical contamination, and changing climate. It also will
require addressing maladapted or inflexible management systems designed
for past conditions including regulatory restrictions, over-allocation of water,
and human water use behavior.
6. A portfolio approach, i.e., integrated management of both demands and
supplies, has a long history of effectiveness in California. Urban water
systems, particularly in southern California, are international leaders in
combining portfolio management and reliability analysis. Agricultural users
are moving in this direction by using new water management approaches.
Water systems that support ecosystems could become more adaptable,
resilient, and effective by employing portfolio management of supplies and
demands for water and habitats. Water management portfolios often include
cooperation across water use sectors, regional and statewide.

14
Review of Water Supply Reliability Estimation
Related to the Sacramento-San Joaquin Delta
7. Reliability under a changing climate depends on early and effective
preparations by local and regional water agencies. In particular, both sea
level rise in the Delta (and its effects on encroaching salinity, flooding, and
water quality) and increased water temperatures affecting ecosystems will
have wide-ranging implications on the reliability of water supplies in
California for all water uses.
8. Many approaches have been used in California to estimate water supply
reliability. Each approach has advantages and limitations. Methods
developed for narrow applications tend to be more rigorous but are not
easily adapted to other applications.
9. Two approaches to estimate water supply reliability are in use. Probabilistic
approaches capture much of the variability of changing conditions and,
therefore, support development of balanced water management portfolios.
Non-probabilistic scenarios and sensitivity analyses are useful to explore the
stability, impacts, and adaptability of water management solutions under
uncertainties that cannot be reliably predicted. Results from both
approaches may be challenging to communicate with decision-makers,
stakeholders, and the public.
Reliability Analyses for Management and Policy
10. Water supply reliability estimates are sensitive to underlying assumptions,
but the potential impacts of uncertainty on management recommendations
are rarely made clear and explicit to managers and stakeholders.
11. Water supply reliability analyses are widely employed but could be better
integrated into and communicated to water operations, planning, and policy
decision-making to improve, focus, and structure deliberations on
performance and trade-offs among multiple objectives.
12. State, regional, and local agency expertise in water supply reliability
estimation is scarce and often not current with the state of the science and
escalating challenges and opportunities. This staffing problem is likely to
worsen as demands on agencies increase and senior staff retire.

15
Review of Water Supply Reliability Estimation
Related to the Sacramento-San Joaquin Delta
Recommendations
Practice
1. Most water supply reliability analyses in California should reflect more
complex portfolio-based water management to improve cost-effectiveness
and equity of regional water management among diverse entities. Portfolio
management includes evaluating interacting surface-water and groundwater
sources, infrastructure operations, and water demand management within
and across water use sectors. (Findings 3,4,5,6,9,10)
2. Performance assessment of water system reliability should be broadened
beyond technical reliability to include multiple benefits that support public
health, economic, ecological, and social objectives. Performance-oriented
assessments are particularly urgent for ecological objectives and will require
co-development of performance indicators among stakeholders, regulators,
modelers, and system managers. (Findings 1,2,3,10)
3. More formal quality control and documentation of water supply reliability
analyses should be encouraged and sometimes required. More formal
documentation, testing, and data and model availability would improve
compatibility of results among studies and alternatives, and aid in integrating
water supply reliability estimation into decision-making and policy
discussions. (Findings 1,2,3,7,10,11,12)
4. A common State water accounting system that includes documentation,
interpretation, testing, and standardization should be developed to improve
analysis quality, comparability, and communication for technical and non-
technical audiences. The California Department of Water Resources and the
State Water Resources Control Board could jointly administer such an
accounting system and its technical expectations. Other states, such as
Colorado, provide good examples. (Findings 1,2,5,8,9,10,11)
5. The next generation of State-sponsored water supply system models for
reliability estimation should be developed, updated, and evaluated by a
broad consortium of State and federal agencies and external experts that
applies the best feasible science and addresses regional needs. Well-led
collaboration and coordination could reduce costs of development while
improving model utility and coordination across regional operations and
management issues. The ongoing need for system-specific models and
expertise for some decisions favors a layered approach to model integration.

16
Review of Water Supply Reliability Estimation
Related to the Sacramento-San Joaquin Delta
Developing system specific models with different but interconnected levels of
sophistication would increase model comparability, facilitate upgrades, and
broaden the scope of analyses. (Findings 5,8,9,10,11)
Research
6. Specific performance metrics and analysis methods for water supply
reliability estimation for environmental purposes should be further
developed and employed to better inform policies that support the Delta’s
coequal goals. An approach based on functional flows, assessed empirically
or mechanistically, shows promise to reflect the reliability of meeting
ecosystem water demands spatially and temporally and improving water
management for ecosystems. In addition, meaningful engagement with
additional cultural, commercial and recreational stakeholders would deepen
understanding of broader environmental flows in water operations
compatible with a range of water system users. (Findings 1,3,4,6)
7. Estimation methods should be updated to reflect accumulated and expected
climate change effects and combined with uncertainty analysis. This would
improve long-term planning and policymaking as well as seasonal operations
planning. Combining scenario-based and probabilistic analyses can quantify
uncertainties and identify promising adaptable portfolios of management
actions. (Findings 1,4,5,7,9)
8. Investment in research and education should increase to improve water
supply reliability estimation science and practice. Some recommended areas
of research and funding emphasis include: a) nexus of water quality and
water supply reliability; b) modeling portfolio planning and operation for
large regional water systems with local water systems and climate
uncertainties; c) applications of ecosystem performance indicators in water
and environmental management; d) applying and communicating
uncertainty analyses in planning and policy decisions; and e) education of
staff in State agencies to promote more rigorous, advanced, and insightful
analyses. (Findings 2,3,4,5,6,9,10,11,12)

17
Review of Water Supply Reliability Estimation
Related to the Sacramento-San Joaquin Delta
1. Introduction
“The present only touches you:
But oh! I backward cast my eye,
On prospects dreary!
And forward, though I cannot see,
I guess and fear!”
To a Mouse, Robert Burns 1785
California’s prosperity, ecosystems, and quality of life depend on water. Yet, it is not
always feasible to eliminate all water scarcity without incurring excessive financial,
environmental, and opportunity costs. Thus, the estimation of water supply
reliability is central for balancing water policy and management discussions and
decisions for the Sacramento-San Joaquin Delta and California. This report
examines the supporting science and methodology of water supply reliability
estimation to help improve these public and management discussions and
decisions.
Water supply reliability estimation, as discussed here, is the formal process of
quantitatively predicting the variable performance and water delivery from a water
supply system. Reliability usually is expressed as a probability of achieving water
system performance objectives. The most common performance metric is a
probability distribution indicating the relative likelihood of the range of possible
water delivery quantities, but other technical, public health, economic, social, and
ecosystem health metrics also are used.
1.1: Delta ISB Mandate and Scope of this Review
The Sacramento-San Joaquin Delta Reform Act of 2009 mandates the balancing of
two coequal goals for the Delta: providing a reliable water supply for California and
protecting, restoring, and enhancing the Delta ecosystem and the Delta as an
evolving place. This report responds to the legislative mandate to the Delta
Independent Science Board (Delta ISB) to review the adequacy of science
supporting adaptive management for the Delta to achieve these goals. This report
reviews scientific and formal methods to estimate water supply reliability as
practiced in the Delta and California. Water supply reliability touches a broad and
diverse range of issues in the Delta and California.

18
Review of Water Supply Reliability Estimation
Related to the Sacramento-San Joaquin Delta
This report, the first Delta water supply review by the Delta ISB, focuses on the
methodology of estimating water supply reliability so that future water supply
reliability reviews might focus more on other aspects and applications of water
supply reliability. This report presents findings and recommendations on the
science and practice of estimating water supply reliability. It is based on
perspectives of stakeholders, managers, and experts and draws significantly from
formal presentations and questionnaires, a workshop, and interviews. It also draws
heavily from the scientific literature.
Formal performance assessments help improve management and policy
discussions and actions. This is particularly true for complex and changing
situations involving many managers and stakeholders with diverse objectives. Of
the state legislated coequal goals under the Delta Reform Act, providing a reliable
water supply for California might be the most amenable to formal quantitative
assessment.
This report is organized in seven sections. Following this introduction, Section 2
reviews sources of water supply unreliability and provides a partial inventory of
water supply reliability estimation efforts in California. Section 3 reviews major
scientific and technical challenges for water supply reliability estimation with
particular emphasis on climate change, portfolio management, water quality and
quantity, environmental water supply reliability, uncertainty analysis, and analysis
for multiple-objectives and conflict management. Section 4 summarizes commonly
employed metrics to assess water supply reliability.

19
Review of Water Supply Reliability Estimation
Related to the Sacramento-San Joaquin Delta
Section 5 presents methods and considerations to improve quality control of
reliability estimation and its effectiveness. Section 6 focuses on water supply
reliability in decision-making. And finally, Section 7 includes overall concluding
remarks. Three appendices present some important technical issues for water
supply reliability modeling and analyses, summarize insights from the pre-
workshop questionnaire and post-workshop interviews, and define acronyms used
in the review.
1.2: Water Supply in California
California is semi-arid with highly variable precipitation across seasons, years, and
geography. Its Mediterranean climate delivers almost all precipitation from
November to March, with much stored seasonally as snow at higher elevations.
However, California’s April to October dry season is generally drier and longer than
the worst drought ever experienced historically in the eastern United States.
California’s annual precipitation also is the country’s most variable, with far more
dry and wet years (Figure 1, Dettinger 2011).
Figure 1. California has the nation's most variable annual precipitation. Annual
coefficient of variation for precipitation stations in the continental US. (Coefficient of
variation = standard deviation/average) (Dettinger 2011).

20
Review of Water Supply Reliability Estimation
Related to the Sacramento-San Joaquin Delta
In California, water supplies and demands are mismatched in space and time for
human uses: about 70 percent of the state’s precipitation falls in the north while
water demands are mostly in the south; and the winter precipitation season does
not coincide with the summer season of highest water demand. Unreliability in
water supplies is unavoidable with California’s great hydrologic variability, diverse
water demands, and allocated water rights that greatly exceed average water
availability (Grantham and Viers 2014).
The location of the Delta makes it the major hub of California’s water system (Lund
2016). Upstream reservoirs and aquifers are managed to shift water availability
from winter and spring to summer and fall, and from wet to dry years. These
reservoirs and associated conveyance infrastructure support large water diversions
upstream of the Delta and alter seasonal inflow patterns to the Delta, from which
additional water is diverted for state, federal, and local water projects. In wetter
years and seasons, some Delta water diversions are stored in reservoirs and
aquifers in the southern Central Valley, Southern California, and the Bay Area.
Local water agencies and water users manage local and imported water sources to
fulfill water needs. These operations are often coordinated with near and distant
neighbors, by using contracts, water market transactions, and government
regulations, to better serve economic, public health, and ecological objectives.
Shortages of water to local water users are common and become deeper and more
widespread during droughts. Such water shortages often can be addressed by re-
managing local and regional water supplies and demands, including infrastructure
re-operation, water market transfers or agreements, and reductions in water use
by additional conservation and land fallowing.
The Delta and its management are critical to this intricate and dynamic water
supply system. There is often not enough freshwater available to the Delta to fully
supply all water uses, including environmental needs. Continuous balancing of
widespread and diverse water supplies and demands under widely varying weather
and other time-varying conditions is essential. Achieving this balance falls under the
state goal of Water Supply Reliability (in the Delta Reform Act of 2009), which
receives intense interest from policymakers, stakeholders, water managers, and
researchers alike.

21
Review of Water Supply Reliability Estimation
Related to the Sacramento-San Joaquin Delta
1.3: Overview of Water Supply Reliability Estimation
A reliable water supply for California is defined in the Delta Plan as “better
matching the state’s demands for reasonable and beneficial uses of water to the
available supply.” Water supply reliability estimation, the subject of this review and
as previously noted, is the formal process of quantitatively predicting performance
and water delivery from a water supply system under a variety of conditions.
Reliability usually is expressed as a probability of achieving water system
performance objectives. The most common performance metric is a probability
distribution of water delivery quantity, but a variety of engineering, public health,
economic, social, and ecosystem health metrics are in use. Reliability is commonly
estimated for seasonal water operations in each year and for various long-term
water and environmental policy and planning horizons.
Formal water supply reliability estimation originated in civil engineering in the late-
19th century to size new reservoirs to meet urban and agricultural demands that
would supply water with 100% reliability based on the historical streamflow record
(Rippl 1883). This approach estimated the so-called “firm yield” of a stream and
reservoir, the maximum annual demand that could be supplied without shortage
under variable annual weather conditions (Linsley et al. 1992). “Firm yield”
approaches were used to design most major water projects during the early and
mid-20th century. Many water project delivery contracts in California have been
based on providing high-priority deliveries from a project’s firm yield, while lower-
priority contracts only receive deliveries when the firm yield is exceeded in wetter
years.
The firm-yield approach has been replaced by a more probabilistic understanding
of relationships between variable streamflow, water storage capacity, and water
delivery, given fluctuating water supplies and demands (Hazen 1914; Hirsch 1978;
Klemes 1987). This approach recognizes that 100% reliability is infeasible to
guarantee given the many sources of variability in the supply system and instead
aims to estimate the relative likelihoods (probabilities) of the range of plausible
water deliveries today or in the future. Probabilistic estimation of reliabilities for
major water supplies was introduced in California in the 1970s and became
common by the 1980s. However, many water contracts retain elements of the older
approach (DWR 1983; Barnes and Chung 1986).

22
Review of Water Supply Reliability Estimation
Related to the Sacramento-San Joaquin Delta
Figure 2 shows the main components and data flow of a typical model for modern
water supply reliability analysis. Such modeling requires representation and
integration of hydrologic, water demand, infrastructure capacity, component
connections and interactions, and management aspects of water supplies, including
their variability and uncertainty over time (see Appendix A for details). Because
many highly variable factors are used to estimate probabilities, different
approaches to estimating future behavior will lead to differences in reliability
estimates.
Figure 2. Main components of a typical water supply reliability analysis.

23
Review of Water Supply Reliability Estimation
Related to the Sacramento-San Joaquin Delta
Water demands and hydrology of water sources are the major inputs to water
supply reliability analyses and are usually represented as time series to represent
variability seasonally and between years. The model representation of the water
management system includes the capacities and connectivity of infrastructure
elements among each other and with water sources and demands, as well as
diverse policies for long-and short-term management of water infrastructure
operations, conservation, and allocations. Water inflows, demands, and operating
decisions are modeled as an inter-connected series of daily, weekly, or monthly
time-steps extending over decades of varying hydrologic and operating conditions.
Model outputs can include time series of water deliveries, flows, storages,
shortages, quality, and costs. Model outputs are then further examined and
interpreted in terms of performance metrics, such as probability distributions of
water delivery or water shortages. These details are discussed in Appendix A.
Over time, water supply reliability analysis and management have adapted to
changing conditions, as discussed in Box 1.
Box 1. Adaptive Management and Water Supply Reliability
The Delta Reform Act of 2009 establishes adaptive management as the guiding approach for managing the
Delta. Much has been written about adaptive management since the approach was originally presented for
environmental management (Holling 1978), including its application to Delta ecosystems (Wiens et al., 2017;
Delta ISB 2016).
How does adaptive management apply to the state’s Delta water supply reliability objectives? In practice,
traditional water supply agencies have long employed many aspects of adaptive management for their
water supply missions. Large agencies have extensive monitoring and modeling, and analysis of their
system’s behavior and performance, which they use to update their understanding of current and potential
conditions and problems and to improve management. Monitoring and modeling are used to compare
alternative management decisions for a range of policy, planning, and operational conditions and contexts
to support decision making.
Water supply reliability estimation is a routine part of water supply agency modeling and analysis for
understanding how these systems work, how they fail (and how likely it is), and what might be done to
improve performance. Such analyses help assess the adequacy of water supplies and overall system
management, and better understand vulnerabilities, opportunities, and their likelihoods. Reliability
estimation helps identify more promising solutions as conditions evolve over planning and operational time
frames. As such, water supply reliability estimation has long been vital to the adaptive operation and
management of major water supply systems.

24
Review of Water Supply Reliability Estimation
Related to the Sacramento-San Joaquin Delta
Modern water supply reliability estimation methods have evolved and broadened
considerably since the early emphasis on urban and agricultural supplies. Water
supply reliability and its estimation in California face many new challenges:
● Adapting California’s extensive statewide, regional, and local water systems
that transport and store water.
o Further development of integrated portfolios of management activities
- including diverse surface, aquifer, desalinated, and reused water
sources, as well as management of water demands, including long-
term and drought use reductions.
o Changes in water storage, conveyance, and treatment infrastructure
and technologies, and water management improvements (e.g.,
reoperation of reservoirs to balance flood management and water
supplies; restoration of floodplains and wetlands; groundwater
recharge; some capacity improvements).
o Greater awareness of potential system failures from catastrophic
events, such as major earthquakes, floods, contaminant seepage,
water-supply terrorism, pandemics, and facility failures.
o Increasing concerns for drinking water quality and treatment.
o Complex interactions among the many parts and objectives in
California’s water system.
● Water flows have environmental consequences.
o Recognition of the importance of environmental impacts of water
supply and management decisions, and the needs of ecosystems for
adequate amounts and timing of water availability.
o Broader and deeper water quality considerations for ecosystems.
o Environmental regulations that alter urban and agricultural water
supplies and demands.
● Increased recognition of social justice concerns.
o Water availability, safety, and quality for rural drinking water supplies.
o Employment impacts on rural and urban residents.
o Costs and affordability for lower income water users.
o Increased appreciation of implications for Delta, tribal, and small
communities, including related social justice concerns.
● Climate change.
o Ecosystems and hydrologic systems will experience changing thermal
and weather regimes.

25
Review of Water Supply Reliability Estimation
Related to the Sacramento-San Joaquin Delta
o Historical records of unimpaired flows will have diminishing value for
estimating water supply availability for both long-term planning and
seasonal operations.
o The ability of the Delta to supply water of suitable quality for urban
and agricultural water diversions will be diminished.
● Regional and global changes affect water demands.
o Factors outside of the water management system often affect water
demands and performance, including changes in societal and
environmental attitudes, human behavior, land use, population
growth and migration, technology, law, and crop and energy prices.
● Overall water demands will often exceed available and economically feasible
water supplies.
o In much of California, water demands often exceed water supplies,
particularly during drought.
o Limits on groundwater overdraft from the Sustainable Groundwater
Management Act, increases in both environmental flows and
traditional water demands, and over-allocation of available water
supplies increase the need for water scarcity management.
Although water supply reliability estimation in California is among the most
sophisticated in the nation, water supply reliability estimation has not traditionally
incorporated most of these factors. Adding them into estimates should improve
estimates and their value for policy and management decision-making, but brings
new technical challenges. As an example, water quality, timing, and spatial
distribution of flows are important to species in ecosystems, but specific
requirements are highly uncertain and sometimes unknown. Modifying design
needs to address climate changes and future human adaptations further
compounds uncertainties. Making long-term water supply estimates involves many
unknowns, but better analysis is often insightful and sets a more solid base for
making controversial decisions and major public investments.
Another important consideration is surprises. Surprises happen in water
management and should be considered and be prepared for in water supply
reliability estimation, analyses, and planning. In fact, surprises are inevitable (Box 2)
and can be overlooked in water supply reliability estimation. Decision makers need
to be prepared to consider a wide range of expected and novel extreme events
using both probabilistic and robust sensitivity analyses (e.g., Marchau et al. 2019).

26
Review of Water Supply Reliability Estimation
Related to the Sacramento-San Joaquin Delta
Box 2. Challenges of High-impact, Unlikely (Black Swan) Events (i.e., Surprises)
The novel coronavirus (COVID-19) pandemic illustrates a major challenge for uncertainty methods. How can system
analysts anticipate and treat very low probability events with major impacts that are difficult to identify and
characterize in advance? Their omission in design is often excused by their small probability, but they are real and,
may overwhelm human and natural systems.
Rare and often poorly characterized (or unknown) high impact events fall into two major categories. The first
category consists of imaginable events. These are based on historic precedent or a causal understanding for their
anticipation. The second category consists of events not imagined by most planners, engineers, experts, leaders, or
the public due to a lack of precedents in human history or inadequate understanding for developing meaningful
scenarios. Events in the former category are sometimes developed to test project robustness or resiliency.
Ironically, such tests are often called worst-case scenarios, although they reflect only imaginable dire circumstances
(Brown et al. 2012).
Many events could significantly degrade water supply reliability by damaging larger water projects and systems in
Delta. These include climate changes, “megadroughts,” sea level rise, failures from earthquakes and floods, volcanic
ash, water contamination, increased ecological uses, political upheaval, and terrorism. Once recognized, challenges
arise in characterizing these events. The first major challenge is estimating their frequency needed to calculate risk.
This is especially true for events known primarily from geologic and historical records. Second, their magnitude may
be difficult to assess. For example, coring in today’s Delta reveals volcanic ash layers from large Cascadian volcanic
eruptions that once choked the modern Delta region in the Pleistocene. Although many details are unknown, a
reoccurrence would be a hazard to turbine pumps, human health, water quality, agriculture, and ecosystems today
(Maier et al. 2015). Third, some scenarios are based on nonstationary processes. For example, a recent
investigation used dendrochronology in the American West to identify megadroughts that occurred on the average
approximately every 240 years (Williams et al. 2020). While this information is useful to estimate their frequency,
climate change may alter this frequency. Indeed, anthropogenic warming strengthened the 2000 to 2018 Western
drought. Finally, human responses to extreme events are often highly uncertain, particularly in decentralized
managed systems, where many actors must overcome diverse perspectives to agree on management objectives
and approaches.
Unimagined surprise events, the second category, are the unknown unknowns popularized by former U.S.
Secretary of Defense, Donald Rumsfeld. In Nassim Talib’s The Black Swan (2007), these are unpredictable events
with massive consequences that can be rationalized only retroactively. Although unimagined events are inherently
difficult to accommodate in engineering design, their existence may expose a system vulnerability caused by
ignorance or human limitations. Humans tend to focus on things they know and disregard things they do not know.
Acceptance of ignorance or limitations of thinking capacity and controllability of events may encourage increased
resiliency and preparation for adaptation in designs. Multiple component failures might wreak havoc even in well-
engineered systems, as in the 2011 Tohoku, Japan, earthquake and tsunami.
The COVID-19 pandemic and low-probability, high-impact events in general beget humility. Operational success is
not fully guaranteed regardless of how well a probabilistic method for design is formulated. History is replete with
catastrophic events, imagined and unimagined, that with advantage of hindsight fell in the tails of prior probability
distributions. History also shows numerous cases where well organized, adaptable, and well-prepared systems
responded effectively, despite damages and losses, to large unpleasant surprises.

27
Review of Water Supply Reliability Estimation
Related to the Sacramento-San Joaquin Delta
2. Water Supply Reliability Analysis in California
Many human and environmental water users in California draw their water directly
from the Delta (averaging about 5 million acre-ft/year). Still greater volumes of
water are drawn indirectly from the Delta by upstream surface and groundwater
users. The Delta is the major hub of the Central Valley Project (CVP) and State Water
Project (SWP), the backbone of California’s water supply network. Thus, the Delta is
central to the extensive and often overlapping integrated portfolios of water
supplies, demands, and infrastructure managed by hundreds of agencies and
millions of users. Today, water in and from the Delta is becoming more important
and increasingly threatened by droughts, floods, climate change, groundwater
depletion, population growth, vulnerable infrastructure, and deteriorating
ecosystem health (Lund 2016; Schwarz et al. 2020).
Regulatory requirements add to the water management challenge by allocating
water to meet new objectives. The federal Endangered Species Act and Clean Water
Act required increasing the dedicated water supply for fish, other organisms, and
ecosystem processes. California’s Sustainable Groundwater Management Act
(SGMA) will end groundwater overdraft and further shrink supply to more
sustainable levels. The expected increase in surface water demands on the Delta
and other sources due to implementation of SGMA is about 2 million acre-feet/year
(maf/yr), and the sources for meeting this demand have not been identified (Dogan
et al. 2019). New proposals for Delta and tributary environmental flows or voluntary
agreements could further modify water operations and Delta water availability for
diversions.
Three successive droughts with accompanying water delivery cutbacks, declining
fish populations, deteriorating environmental conditions, increased attention to
levee fragility (Roe et al. 2016), and increased litigation and demands for greater
environmental regulations, led California’s legislature to pass the Sacramento-San
Joaquin Delta Reform Act in 2009 (Frank 2010). The Act declares two coequal goals
for the Delta: (1) provide a more reliable water supply for California and (2) protect,
restore, and enhance the Delta ecosystem, while protecting and enhancing the
unique cultural, recreational, natural resources and agricultural values of the Delta
as an evolving place. Reliable water supplies are critical to meet the coequal goals,
and to successfully manage California’s water resources. Droughts continue to
highlight diverse water supply reliability concerns in California (Durand et al. 2020;
Box 3).

28
Review of Water Supply Reliability Estimation
Related to the Sacramento-San Joaquin Delta
Box 3. Water Supply Reliability and the Ongoing 2020 - 2022 Drought
The 2021 water year (October 1, 2020 – September 30, 2021) was the 3rd driest year in more than
100 years of precipitation record. The 2020 water year was the 9th driest year in the precipitation
record. The resulting drought has affected available water supplies for a wide range of agricultural,
environmental, and urban water users and could continue for several more years.
So far, major cities have been mostly well prepared for this drought with long-term water use
reductions, groundwater banking, initially full reservoirs, better connections to external water
supplies, and water market agreements with farmers. Some smaller towns have been less well
prepared with several towns requiring 30-40% reductions in water use. Larger cities could follow suit
if the drought continues and requires mandatory water rationing.
Agriculture has seen large surface water reductions, especially in the San Joaquin Valley, but also in
the Sacramento Valley and smaller river valleys statewide such as the Russian and Klamath river
basins. Farmers have increased groundwater use to reduce drought impacts, but this often affects
shallower rural domestic water supply wells.
Under the Sustainable Groundwater Management Act (SGMA), farmers will need to replenish the
additional groundwater pumped during the drought, meaning some reductions in lower-valued
crops in wetter years so that aquifers can recover to sustain permanent crops in future droughts.
Few basins can sustain aquifers with managed aquifer recharge alone; many will need deep
reductions in aquifer pumping in wetter years. This reduced groundwater supply will increase
pressure to sustain or increase water diversions from the Delta.
Forests and aquatic ecosystems are experiencing major impacts, especially wildfires and salmon
runs (including near-elimination of naturally-spawning winter-run salmon in 2021) and re-installation
of the Delta salinity barrier at West False River. Gartrell et al. (2022) has an excellent analysis of Delta
operations and flows from 1980-2021. Because the 2022 water year is also dry, agricultural and
environmental impacts will increase and urban impacts will expand for some larger urban areas.
The 2020-2022 drought, like the 2012-2016 drought, has been much warmer than previous droughts
because of global warming caused by climate change. Higher temperatures worsen droughts by
increasing evapotranspiration and reducing the proportion of precipitation that becomes runoff
available to fill reservoirs and recharge aquifers (Shukla et al. 2015). Higher temperatures also
lengthen wildfire seasons, and worsen conditions for cold-water fish species, such as salmon. Water
supply reliability estimation and management will need to address these changes.

29
Review of Water Supply Reliability Estimation
Related to the Sacramento-San Joaquin Delta
2.1: Causes of Water Supply Unreliability
It is rarely possible to identify and anticipate all possible failure mechanisms, and
practically impossible to accurately represent all failure mechanisms explicitly in
models. This problem is chronic for California’s complex water systems. Complexity
often brings flexibility and robustness, but sometimes introduces new sources of
unreliability.
Estimations of water supply reliability tend to emphasize reductions of inflow,
caused by drought and changes in regional climate and water demands. However,
local water shortages may arise from diverse drivers such as from wildfires
(Paradise, California), floods (disabling intakes and water treatment plants), internal
management and operational failures (Flint, Michigan), upstream water quality
declines, harmful algal blooms (Toledo, Ohio in 2014), contamination, black-swan
events (Box 2; Chan and Ho 2019; Howe et al. 2018), mechanical and electrical
infrastructure failure, earthquakes and limitations to operations from complex
environmental and water rights regulations (Grantham et al. 2014, 2018).
Delta water source reliability is unusual compared to a typical water supply system.
Because the Delta is connected to the ocean and is mostly at or below sea level, the
Delta always has water available. However, the quality of this water at distribution
points is unreliable due primarily to salinity concerns when Delta inflows are
insufficient and exports are too great, among other factors. These water quality
effects can limit water uses from western Delta diversion (such as the City of
Antioch) and progressively affect additional in-Delta and Delta export diversions
when net outflows diminish enough to allow ocean salts to intrude further into the
Delta with tidal mixing (Young 1929; Fleenor et al. 2008; Jayasundara et al. 2020;
Medellín-Azuara et al. 2014).
An ongoing example of infrastructure failure is the reduced capacity of the CVP’s
Friant-Kern Canal. Over-pumping of groundwater and land subsidence have
lowered reaches of the canal and reduced its capacity (Borchers et al. 2014). Water
shortages for human uses also may occur from any combination of increased
demand, diminished supplies, new environmental and water quality regulations,
and failure of agreements or institutional rules (such as failed water trades).

30
Review of Water Supply Reliability Estimation
Related to the Sacramento-San Joaquin Delta
All estimates of reliability are fallible, so additional stress-testing analyses for
improbable, but plausible, events can explore the robustness of designs and
adaptations (Dittrich et al. 2016; Groves et al. 2019). Even imperfect water supply
reliability analyses can help organize and focus discussions and planning as well as
inform reasoned decisions on California’s difficult water and environmental
problems.
2.2: Selective Inventory of Reliability Estimation Efforts
California’s largest water supply systems routinely estimate water supply reliability
for policy, planning, and operational decision-making (Jackson 2006). Table 1 is a
selective summary of many of these efforts.
Water supply unreliability does not usually translate directly into water shortages or
large economic or environmental losses. Water supply reliability analyses fall into
two categories: 1) examinations of source delivery reliability (DR-delivery reliability
in Table 1) and 2) examinations of integrated system reliabilities (ISR-integrated
system reliability in Table 1). Water source reliability estimates (category 1) are
more limited than overall supply reliability (category 2) and focus only on the
probability distribution of water available for delivery from a single source or
project, such as the SWP.
Photo Credit: California Water Foundation

31
Review of Water Supply Reliability Estimation
Related to the Sacramento-San Joaquin Delta
Water system performance reliability estimates (category 2) combine reliabilities of
various water sources and system components, as well as the significance of any
resulting economic, human, or environmental losses, often mitigated by
infrastructure operation and demand management activities, such as that done by
the Metropolitan Water District of California (MWDSC). Every integrated system
reliability study includes estimates of source reliability, as well as supply and
demand adaptability to water availability conditions.
SWP and CVP source reliability studies are often employed within more
comprehensive regional or local system reliability studies. For example, MWDSC
(2015) integrates SWP and CVP source reliabilities and models into a wider portfolio
of supplies and demand management activities to reduce overall losses and water
shortages. Some examples are identified in Table 1.
Table 1. Selected water supply reliability estimation efforts in California (see
acronym list in Appendix C).
Entity System Description (DR=delivery
reliability; ISR = integrated
system reliability)
California DWR
SWP Planning SWP + CVP DR - CalSim, CalLite (DWR
2017, 2020)
SWP Operations SWP ops. DR - Delta Coordinated
Operations (DCO)
SWP MWQI DR - DSM2 and CalSim
(Hutton & Roy, in review)
Calif. Water Plan Statewide DR – WEAP
SWP ISR - WEAP/ CalSim, LCPSIM,
SWAP
Climate Change SWP, or CVP+SWP DR - CalLite (Wang et al.
2018; Ray et al. 2020;
Schwartz 2018, 2020)
SGMA Central Valley DR - Recharge availability
(DWR 2018)
California SWRCB
Water rights Statewide DR - Water balance analyses
for water rights
Environmental flows Sac. Valley +Delta DR - SacWAM (WEAP) (SWRCB
2020)

32
Review of Water Supply Reliability Estimation
Related to the Sacramento-San Joaquin Delta
Entity System Description (DR=delivery
reliability; ISR = integrated
system reliability)
Federal Agencies
US Bureau of Reclamation CVP DR - CalSim, USBR CalLite
(USBR 2004, 2016)
Local and Regional Agencies
CCWD Contra Costa area DR - CalSim and others
EBMUD East Bay ISR - (EBMUD 2021)
SFPUC, BAWSCA Bay Area ISR - (BAWSCA 2015)
SCVWD Santa Clara Valley ISR - (SCVWD 2003, 2012,
2019)
MWDSC So. California ISR - IRPSIM (MWDSC 2015),
Calsim (DWR), CRSS (USBR)
MWDOC Orange County ISR - WEAP version, MWDSC
modeling (MWDOC 2016,
2018)
CCWD Contra Costa area DR - CalSim and others
EBMUD East Bay ISR - (EBMUD 2021)
NGO Studies
TNC water storage SWP + CVP DR - CalLite (Lund et al 2014)
Restore Hetch Hetchy Tuolumne + SF Bay Area DR - Simulation and
optimization
Academic Studies
UCLA CVP DR- System optimization
(Becker et al 1976)
Water supply, UCD Statewide ISR - Hydro-economic
optimization, CALVIN (many
applications, Dogan et al.
2018, 2019; Arnold 2021)
Water supply, UCD EBMUD ISR - Spreadsheet (Lund et al.
1998)
Water supply, UCLA Los Angeles ISR - (Porse et al. 2017, 2018)
Hydropower, UCD California DR - Climate change (Madani
2009, 2010)
Conjunctive use, UCD Central Valley DR - Recharge availability
(Kocis and Dahlke 2017)
Conjunctive use, PPIC Central Valley ISR - Recharge availability
(Escriva-Bou & Hanak 2018)

33
Review of Water Supply Reliability Estimation
Related to the Sacramento-San Joaquin Delta
Entity System Description (DR=delivery
reliability; ISR = integrated
system reliability)
SGMA reliability, UC Central Valley DR - Simulations (Escriva-Bou
et al. 2020a)
Dracup, UC Berkeley Merced R., American R. ISR - (Vicuna et al. 2007)
Fish flows, UC Statewide DR - CEFF
Fish ops., UC Davis Folsom, Shasta ISR - (Adams 2017, 2018)
UCLA CVP DR- System optimization
(Becker et al 1976)
Water supply, UCD Statewide ISR - Hydro-economic
optimization, CALVIN (many
applications, Dogan et al.
2018, 2019; Arnold 2021)
Note: DR=delivery reliability, examines only the reliabilities of water delivered; ISR = integrated
system reliability, examines the reliabilities of a broader management portfolio, including sources,
infrastructure, agreements, and demands.
The California Department of Water Resources has separate organizational units
that estimate water supply reliability for seasonal State Water Project operations,
State Water Project Planning (DWR 2017, 2020), the California Water Plan (DWR
1983, and later plans), climate change (Ray et al. 2020; Schwarz et al. 2018, 2020),
and Sustainable Groundwater Management implementation (DWR 2018). The
California Department of Water Resources in conjunction with the United States
Bureau of Reclamation has developed sophisticated software called the Water
Resources Integrated Modeling System (WRIMS), which support their CalSim and
CalLite models (Barnes and Chung 1986; Draper et al. 2004; Islam et al. 2011). This
modeling usually includes representations of salinity in the Delta, modeled using
hydrodynamic (DSM2) or faster artificial neural network models (Jayasundara et al.
2020).
The California Department of Water Resources also has a capability to do more
integrated system performance reliability assessments for SWP service areas, using
CalSim or WEAP models for water source reliability, and economic models of local
agricultural and urban water source and demand management.
The State Water Resources Control Board independently estimates water supply
reliability for water rights in its Water Rights Division (river basin water balance
calculations, SWRCB 2020) and environmental flow regulations (SacWAM, SEI 2019).

34
Review of Water Supply Reliability Estimation
Related to the Sacramento-San Joaquin Delta
Water supply reliability estimates for Federal water projects in California are
performed primarily by the U.S. Bureau of Reclamation in its operations and
planning units, but sometimes they are performed by other Department of Interior
agencies. Modeling for planning in the last 20 years has historically used versions of
CalSim II, but USBR’s CalLite is implemented in another simulation package. CalSim
3.0 is a newer model expected to replace CalSim II (DWR and USBR 2017). Some
regional modeling studies use WEAP software (Mehta et al. 2013; Joyce et al. 2011).
Local and regional water utilities in California individually estimate water supply
reliability in various ways for planning, policy, and operational purposes (e.g.,
EBMUD 2021, SFPUC, BAWSCA 2015, SCVWD 2003, 2012, MWDSC 2010, 2015,
MWDOC 2016, 2018, SDCWA 2017, 2020). Southern California’s urban water
systems have tended to be leaders in portfolio management and more integrated
system analyses. Environmental organizations also have done water supply
reliability assessments for policy and planning purposes (e.g., The Nature
Conservancy, Restore Hetch Hetchy, Environmental Defense Fund). Water supply
reliability studies are conducted by both the sponsoring organizations themselves
and partly or wholly by consultants that specialize in such studies. Cost, data
availability, and technical staff capability are barriers for small water suppliers,
which usually are more vulnerable to unreliability, particularly during droughts.
Academic studies have advanced methods and insights for water supply reliability
estimation in case studies of several water systems in California. These have
examined:
● Reliability and operations for CVP and SWP water deliveries (Becker et al.
1976; Mariño and Loaiciga 1985; Roche 2020)
● Water markets, conjunctive use, and integrated management (Jenkins and
Lund 2000, 2004; Medellín-Azuara et al. 2008; Lund et al. 1998; Tanaka et al.
2006, 2011; Dogan et al. 2018; Arnold 2021)
● Regional water portfolio reliability (Porse et al. 2017, 2018; Howe et al. 1994;
Groves et al. 2014)
● Sensitivity to hydrologic foresight and reservoir operations (Arnold 2021)
● Aquifer recharge with flood waters (Kocis and Dahlke 2017; Escriva-Bou and
Hanak 2018)
● Aquifer recovery reliability under SGMA (Escriva-Bou et al. 2020)
● Distribution system reliability (Gheisi et al. 2016)
● Reliability of evapotranspiration estimates (Medellín-Azuara et al. 2018)

35
Review of Water Supply Reliability Estimation
Related to the Sacramento-San Joaquin Delta
● Institutional reliability in conflict resolution (Al-Juaidi & Hegazy 2017)
● Climate change (Dogan et al. 2018; Medellín-Azuara et al. 2008, 2009;
Kiparsky et al. 2014; Tanaka et al. 2006, 2011; Vicuna, et al. 2007; Joyce et al.
2011; and others).
Although beyond the scope of this review, reliability studies are common for major
water supply systems globally and domestically as well. Globally, water supply
reliability estimates increasingly take one of many variants on an integrated system
approach, as described here. Examples include planning and operation analyses for
New York City (Porter et al. 2015; NASEM 2018, 2020), South Florida (SFWMD 2020),
Las Vegas (Ahmad 2016), Sidney (Australia) (Kidson et al. 2013), London (Matrosov
et al. 2013, 2015; Morley and Savić 2020), northeastern Colorado (Michelsen and
Young 1993), and other systems (Raucher and Raucher 2015). Lessons and
methods for reliability estimation from outside California generally reinforce and
support the points made in this review.
2.3: Delta Water Supply Reliability
The Sacramento-San Joaquin Delta is a major hub for water movement and water
supply in California. The Delta, directly or indirectly (from upstream water
diversions), is the exclusive water supply for many agricultural, urban, and
environmental water uses, and a variable partial water supply for many more water
users, including most the Central Valley, Bay Area, and Southern California, as well
as Central Valley and San Francisco Bay ecosystems.
The availability of water in the Delta, even after management by sizable upstream
reservoirs, is often not enough to fully supply all water demands by the state’s
agriculture, ecosystem, and urban water users. There are times when Delta inflows
exceed all water demands, mostly in wet years (including floods). Even during
drought, some winter storms generate enough runoff below major reservoirs to
exceed local water uses and export pump capacities.
Every two years, the California Department of Water Resources estimates the
reliability of SWP water deliveries and overall Delta water exports (DWR 2019).
These estimates show highly variable water delivery availability from the Delta for
water export users, as shown in Figure 6. This hydrologic variability also affects
environmental and other water uses.

36
Review of Water Supply Reliability Estimation
Related to the Sacramento-San Joaquin Delta
Inflows to the Delta supply water support various functions:
• In-Delta human and environmental consumptive uses (agriculture, urban,
riverine, wetland, and open water evapotranspiration)
• Delta water exports (agriculture, urban, and some managed wetlands)
• Delta outflows to hold back seawater and Delta salinity (supporting local
water quality for western Delta diversions and water quality within the Delta
for interior Delta users and water export projects, a so-called “hydraulic
salinity barrier”)
• Delta outflows for ecosystem management
• Uncaptured storm or snowmelt outflows (which are often uneconomical to
capture)
These functions are represented in water rights and contracts (riparian and
appropriative water rights, water project contracts, and legal judgements), various
state and federal water operation regulations (federal and state project authorizing
and regulating legislation, State Water Resources Control Board water quality
regulations and decisions, and federal and state endangered species regulations),
and various water project operating agreements (such as the CVP-SWP Coordinated
Operating Agreement – COA) (DWR 2019).
It is popular to debate the causes of this variability of water available for uses in the
Delta. Major flows into and out of the Delta (its “water balance”) and the regulations
that limit them have been quantified by two independent groups, who came to
similar conclusions (Gartrell et al. 2017, 2022; Reis et al. 2019). Table 2 presents the
Delta’s average water balance from 2010-2018 (Reis et al. 2019). Of estimated Delta
unimpaired inflow over this period, on average 30% was diverted before reaching
the Delta, 16% was pumped from the Delta, 4% was net use in the Delta, and 55%
became Delta outflow.
Of Delta outflows during this period, almost two thirds are during wet periods when
flows exceed capacities to store or pump water for export, 25% is managed to repel
seawater from the Delta so that water exports (and in-Delta water diversions)
remain fresh, and about 10% is for regulatory fish and ecosystem flows. In contrast,
when the limiting factor was identified for each day’s water export operations from
2011-2018, exports were limited in roughly 29% of days by the need to maintain
outflows for repelling seawater from the Delta, in 25% of days by general state-
mandated environmental flows (state water quality control plans, etc.), in 27% of

37
Review of Water Supply Reliability Estimation
Related to the Sacramento-San Joaquin Delta
days by federal endangered species restrictions for salmon or Delta Smelt, and in
16% of days by water diversion or storage infrastructure (Reis et al. 2019). Although
such water accounting can provide insights, it is subject to different interpretations
and controversies because much Delta outflow serves multiple purposes and
regulations, sometimes muddying allocation of “responsibility” for outflows (similar
to allocating water system fixed costs among customers). Gartrell et al. (2022) have
updated this type of analysis from 1980-2021, including detailed and thoughtful
analyses of implications for policy and management.
Table 2. Approximate average Delta water balance, 2010-2018. (Reis et al. 2019)
(Note: sums sometimes exceed 100%).
2010–2018 flow
Ave.
Volume
(maf/yr)
Ave.
Volume (109
m3/yr)
% unimpaired
Delta outflow
% actual
Delta
outflow
Unimpaired Delta outflow 27.0 33.2 100
Upstream net use 8.1 10.0 30.1
Delta inflow 20.2 25.0 75.1
Delta net use 1.0 1.2 3.6
Water project exports 4.2 5.2 15.6
Other exports 0.2 0.2 0.6
Delta outflow 14.9 18.4 55.3 100.0
Hydraulic Salinity Barrier 3.7 4.5 13.7 24.7
WQCP F&W 0.8 1.0 3.0 5.4
CVPIA b(2) 0.05 0.06 0.0 0.0
ESA RPAs 0.8 1.0 2.9 5.3
Anadromous fish RPA 0.4 0.5 1.5 2.8
Delta Smelt RPA 0.2 0.2 0.7 1.2
Simultaneous fish RPAs 0.1 0.2 0.5 0.9
Voluntary reductions 0.1 0.1 0.2 0.3
Other uncaptured outflow 9.6 11.9 35.7 64.6
Clearly, there are many causes for water scarcity and its variability in the Delta.
There are considerable uncontrolled outflows from the Delta, most of which would
be uneconomical to capture. Some uncontrolled outflows occur from local storms
even in drought years (Gartrell et al. 2017, 2022).

38
Review of Water Supply Reliability Estimation
Related to the Sacramento-San Joaquin Delta
Changes in climate will further decrease the reliability of water available to the
Delta (Lettenmaier and Sheer 1991; DSC 2020; and others) and ending groundwater
overdraft in the San Joaquin Valley increases unrequited water demands by about 2
maf/year (Escriva-Bou et al. 2018). Decreases in urban water use, new local sources
and reuse, groundwater banking, and water markets somewhat reduce this water
scarcity for urban areas.
As the major junction of California’s water supplies, the Delta is a major balancing
component for variability and imbalances between local and regional water
supplies and demands – all of which are seeing challenges of local, regional, and
statewide water scarcity. Another state policy in the 2009 Delta Reform Act is to
reduce reliance on Delta water supplies generally. This policy is discussed in Box 4
in terms of its interactions with water supply reliability.
Eliminating all water scarcity at the Delta for all times would require great expense,
and might not be economically worthwhile. Just as money and land are scarce in
California, California will have to manage in perpetuity with water scarcity at the
Delta in most years. How water users, water projects, and water and environmental
regulators manage this scarcity is a major and growing challenge, punctuated
emphatically during droughts. Such decision-making can be improved with
information on water supply reliability.

39
Review of Water Supply Reliability Estimation
Related to the Sacramento-San Joaquin Delta
Box 4: Reduce Reliance on the Delta and Water Supply Reliability
Water Code section 85021: The policy of the State of California is to reduce reliance on the Delta in meeting
California’s future water supply needs through a statewide strategy of investing in improved regional
supplies, conservation, and water use efficiency. Each region that depends on water from the Delta
watershed shall improve its regional self-reliance for water through investment in water use efficiency,
water recycling, advanced water technologies, local and regional water supply projects, and improved
regional coordination of local and regional water supply efforts.
State policy to reduce reliance on the Delta for water supply is incorporated into the state’s Delta Plan
(Chapter 3) and in DWR’s guidebook for urban water management plans (DWR 2021). DWR interprets
reliance on the Delta for water in terms of the absolute or percent volume of average total water use
derived from the Delta watershed (including water use efficiency improvements as a non-Delta source).
Policies that reduce reliance on Delta water supplies tend to improve the average reliability of remaining
Delta water supplies. (Conversely, reducing non-Delta water sources, such as the appropriate elimination of
groundwater overdraft under state law, will increase reliance on remaining Delta water supplies). Other
actions to increase Delta water availability for export (such as by importing more water from the Trinity
River, increasing water storage capacity, or increasing Delta pumping capacity) would in theory improve
Delta water supply reliability, but increase reliance on Delta water supplies.
Defining reliance based on average use of Delta supplies does not address the reliability of Delta water
supplies in more than an average sense. For example, to achieve ecological, water supply, and community
objectives, reliance on Delta supplies in dry seasons or years might be more important than average
reliance on Delta supplies.
For example, consider two users that on average receive the same percentage of their use from the Delta
watershed, but one user takes water more in summer seasons and in dry years. The dry-period user has a
greater impact on Delta water supply reliability and other Delta objectives because water is scarcer and
harder to supply at these times. In a sense this user relies more on Delta supplies because fewer alternative
water supplies are available and reduced deliveries are likely to incur higher costs and impacts for
alternative supplies or foregone water use. Most state policy objectives would be better met if users shifted
their use of Delta water to wetter seasons or years, even if their average use of Delta water remained the
same.
As weather extremes become more frequent in California’s changing climate, it might be prudent to revise
policy implementations to reflect performance for a range of conditions rather than less-frequent average
conditions.
Reference: DWR (2021), Urban Water Management Plan Guidebook 2020, California Department of Water
Resources, Sacramento, CA, March.

40
Review of Water Supply Reliability Estimation
Related to the Sacramento-San Joaquin Delta
3. Major Scientific and Technical Challenges
The workshop, questionnaire, and interviews conducted for this review highlighted
scientific and technical challenges in water supply reliability estimation (Appendix
B). Topics that received the most attention in the three forums include: impacts
from climate change on water supply; planning and management of multiple
sources of water supply; environmental adaptive management, environmental
water supply performance metrics; water quality; and methods to address multiple
objectives and conflicts in water planning and operation. This section organizes
these topics into two broad challenges for water supply reliability modeling and
analyses: 1) climate change and ecology and 2) technical and management issues.
Topics discussed here under each challenge are listed in Table 3.
Table 3. Summary of major scientific and technical challenges.
Topic Challenge
Climate Change and Ecology
Climate Change Predict and prepare for a changing climate and
hydrology
Ecological and Environmental Water Supply Better represent and balance human and
environmental water supplies. Better prepare for
ecological changes.
Water Quality Anticipate and prepare for changes in salinity,
nutrients, contaminants, etc.
Technical and Management Issues
Portfolios for Water Management Integrated management of multiple water
sources/locations and demands
Environmental Adaptive Management Adjust management in response to changes,
improved understanding, and real-time conditions
Multiple Objectives and Conflicts in Water
Management
Optimize across multiple objectives and resolve
conflicts
Forecast-Informed Operations Incorporate real-time forecasts into system
operations
Improved Regional Management Integrate water supply reliability analysis and
operations from local to state-wide scales,
technically and institutionally
Uncertainty Analysis and Preparations More widely employ risk-based analysis and
decision making
Hydrologic Data and New Analysis and
Management Technologies
Improve hydrologic data collection, synthesis,
adjustment, and reporting, as well as modeling
techniques

41
Review of Water Supply Reliability Estimation
Related to the Sacramento-San Joaquin Delta
3.1: Climate Change and Ecology
3.1.1: Climate Change
“Another area that remains to be addressed is the management
response to long term climate change.” Lettenmaier and Sheer,
1991
Climate change was the most frequently cited concern affecting future water supply
reliability estimates in the questionnaire distributed before the review workshop
(Appendix B). Seven of 17 respondents indicated that climate change uncertainty is
a major factor limiting conventional reliability estimation for long-term
management and decision-making. Climate change at local and statewide scales is
increasingly being incorporated into water planning, but details of the climate’s
future remain significantly uncertain (Robinson et al. 2021; Le Bars 2018; Ruckert et
al. 2017; Swain et al. 2020).
State and local governments in California have been remarkably progressive in
considering future climate change in long-term water planning. California’s Fourth
Climate Change Assessment (2018) and a recent Delta vulnerability study (Schwarz
et al. 2020) specifically address impacts on water supply. Temperatures are
forecasted to increase by 3.1 degrees to 4.9 degrees C (5.6 degrees to 8.8 degrees
F) by 2100, and sea levels are forecasted to rise by ~50 cm (~20 in) by 2050. Higher
temperatures increase agricultural and urban water demands, and challenge water
temperature management for cold-water species, such as salmon. Higher sea levels
threaten Delta levee stability and management of the Delta’s salt/freshwater
interface during low river flows.
In addition, changes in weather dynamics are expected to increase the severity of
both floods and droughts, even though mean precipitation might remain
unchanged. Atmospheric rivers, which currently deliver 25 to 50 percent of
California’s annual precipitation, are forecasted to decrease in number by 10
percent, but become longer and wider because warmer air can carry more
moisture. These changes coupled with shifts in seasonal spring runoff from
diminishing winter snowpack are prompting water managers to make water supply
forecasts based on different and nonstationary climates.

42
Review of Water Supply Reliability Estimation
Related to the Sacramento-San Joaquin Delta
Most current modeling for water supply reliability estimation includes effects of
climate change based on scenarios. Uncertainty of future greenhouse gas
emissions, the main driver of climate change, along with other sources of
uncertainty hinders conventional probabilistic estimates for decision making, (Box
5). A USBR (2016) investigation on change and variability in total Delta exports for
multiple climate scenarios is one example. Basically, a sensitivity study, it indicates
that climate change will likely reduce Delta exports. Another recent study found
likely reductions in SWP exports over a wide range of plausible climate changes
(Ray et al. 2020).
Substantial management and policy insights can be gained from analysis of single
future scenarios (Tanaka et al. 2006; Dogan et al. 2019). However, examination of
multiple climate scenarios improves understanding of uncertainties and identifies
promising and robust actions. Alternatively, Bayesian approaches can more
rigorously account for the relative likelihood of different scenarios, and how
scenario likelihoods will change with time and experience (Fletcher et al. 2019; Hui
et al. 2018; Herman et al. 2020). Stress testing management alternatives with
diverse extreme scenarios also provides a prudent form of evaluation (Marchau et
al. 2019).
Estimating the severity of droughts in future climate regimes is a particular
challenge for scenario-based planning. East Bay Municipal Utility District, for its
assessments of future droughts, relied on the historical record of droughts and
then postulated hypothetical increases in drought duration and severity. Schwarz et
al. (2018) conducted a simulation-based assessment of drought impacts on
Sacramento and San Joaquin River flows in the Central Valley using a 1,100-year
natural flow record (reconstructed from a dendrochronology record) to analyze
vulnerability to low frequency climate variability. Their results indicated likely
declines in many technical indicators of performance (e.g., supply, storage, Delta
outflow).
Reductions in Delta water exports have been predicted in essentially every major
study of climate change impacts on California water management. These studies
use a wide range of scenarios, models, methods, and assumptions (Gleick 1987,
1989; Lettenmaier et al. 1988; Lettenmaier and Gan 1990; Lettenmaier and Sheer
1991; Tanaka et al. 2006; Vicuna and Dracup 2007; Ray et al. 2020; USBR 2016;
Schwartz et al. 2018, 2020; Dogan et al. 2018, 2019; Medellín-Azuara et al. 2008;
Connell-Buck et al. 2011).

43
Review of Water Supply Reliability Estimation
Related to the Sacramento-San Joaquin Delta
3.1.2: Climate-Change Science in Water Supply Reliability Estimation
Basic methods for climate change analysis and implications for management in
California began more than 30 years ago (Gleick 1987, 1989; Lettenmaier et al.
1988; Lettenmaier and Gan 1990; Lettenmaier and Sheer 1991). The main impacts
identified have not changed fundamentally, although analyses are becoming more
extensive and sophisticated (Herman et al. 2020; Schwarz et al 2018; Lettenmaier
and Lund 2020). One limitation to most studies of climate change impact is that
they examine effects of non-stationary hydrology with stationary water
management policies in a system that is (and must be) managed adaptively. Water
management might continue to be the most important non-stationary aspect of
water supply reliability, as it has been for over 150 years in California. Analyses that
address management dynamically over time with uncertain future climate and
other conditions have only recently been formally considered (Herman et al. 2020)
but could be used to identify policy options that are promising for improving social
efficiency, including addressing inequities, in water allocation under climate change.
While scenarios and historical hydrologic observations will continue to be important
in long-term water planning, scientific understanding of climate change and global
climate models will continue to improve and provide useful directions and
predictions of California’s future climate. Hybrid approaches that combine the
historical record and long-term climate models hopefully can provide useful
insights to better estimate likely and extreme future hydrologies (Lund 2021).

44
Review of Water Supply Reliability Estimation
Related to the Sacramento-San Joaquin Delta
The future climate of the Delta and California will progressively differ from the
current one underscoring a need for ongoing adaptive management. Precipitation,
evapotranspiration, water quality and timing of river discharge (Dettinger et al.
2015) and sea levels will all change. The actual future climate, however, will depend
on how global society addresses greenhouse gas emissions, which is unknowable
at present. The magnitude of climate change will require modifications in water
system operations, regulations, infrastructure, demand management, and public
policies to serve diverse users and adapt to changing needs. More integrative
modeling of management and water supply reliability that includes the hydrologic
impact of climate change will be critical to identify effective policies and to design
infrastructure that meets performance objectives.
New and repeatedly updated understanding of climate must become the lynchpin
of water supply reliability estimation, ultimately replacing stationary historical
records. Huang et al. (2020) provide an example of how this approach prompted
insights into precipitation changes of future extreme atmospheric river (AR) storms
in a warming climate if business-as-usual greenhouse-gas emissions continue. They
estimated that annual precipitation from ARs, which already provide much of
California’s annual precipitation, will increase substantially. Siirila-Woodburn et al.
(2021) describe the impact of warming on future snowpacks. California’s snowpack
stores more water seasonally than all its surface reservoirs, delaying natural runoff
by a few months into the dry season. The authors estimate that if greenhouse-gas
emission remain unabated, snow water will decline ~25% by 2050, and no- to low-
snow conditions will persist through the winter in ~35 to 60 years. Finally, Williams
et al. (2020) shows how warming can intensify megadroughts (severe and
persistent dryness for ~20 years). Using hydrologic modeling and a tree-ring
reconstruction to infer soil moisture, they conclude that the 2000-2018 drought in
southwestern North America was worsened by anthropogenic warming from a
moderate drought to one of the worst droughts in the last 1200 years. Shukla et al.
(2015) have similar findings for California’s drought in 2014.
3.1.3: Ecological and Environmental Water Supply
Balancing ecological and human water uses to meet the mandated coequal goals of
the 2009 Delta Reform Act continues as a major challenge to Delta management.
Population levels of many native fish species are at dire levels, prompting listings as
threatened or endangered species (Moyle et al. 2013). A wide variety of flow and
habitat management responses are being proposed and implemented.

45
Review of Water Supply Reliability Estimation
Related to the Sacramento-San Joaquin Delta
Considerable uncertainty remains in the effectiveness of many proposed actions.
Operating favorable flow regimes will be challenging in a constantly changing
backdrop of new biological opinions, engineered systems, public perceptions, and
state and federal priorities and regulations. No single optimal solution exists to
meet all water management objectives (Alexander et al. 2018). Multiple-objective
optimization methods can help identify alternatives that maximize benefits or
minimize losses across diverse stakeholders, but ultimately can only identify
efficient trade-offs among imperfect alternatives (Null et al. 2021). These trade-offs
will change over time with climate and other nonstationary conditions. When such
methods include broad and diverse engagement of affected communities, they can
improve both fairness and allocation of resources.
3.1.4: Science for Improving Environmental Water Supply Reliability
Management tools to achieve more favorable flow regimes for ecological systems
are improving rapidly but require further development for policy application.
Guidelines are needed for ecological flows that consider timing, inter-annual
hydrologic variability, water scarcity, and water quality, and how to operationally
integrate environmental objectives into water system decision-making (Davies et al.
2014; Arthington et al. 2018).
More mechanistic fish and ecosystem models based on habitat and flow conditions
over seasonal life stages show some promise and should be actively extended
(Delta ISB 2015; van Winkel et al. 1998; Bellido-Leiva et al. 2021; Tonkin et al. 2021).
These should provide more solid means to estimate or quantitatively forecast
species and ecosystem performance from water and habitat operations and
investments.
“Reconciliation” approaches to ecosystem management seek to greatly expand
habitat for native species living outside of protected areas by modifying human
land and water use in coordinated ways to accommodate the most important
benefits to each interest. Such approaches should be considered and developed for
balancing water usage and ecological protection (Sommer et al. 2001; Rosenzweig
2003; Grimm and Lund 2016).

46
Review of Water Supply Reliability Estimation
Related to the Sacramento-San Joaquin Delta
3.1.5: Water Quality
Water quality is fundamental to Delta water source and system reliability (Lund
2016) and involves multiple water quality parameters. Salinity (and its
management) is an important Delta water quality reliability consideration. Intrusion
of ocean water via San Francisco Bay and agricultural drainage water can be
detrimental for environmental, in-Delta, and Delta export water uses (Gartrell et al.
2017, 2022; Reis et al. 2019). Operations and planning models sometimes have
sophisticated representations of water quality aspects of system reliability
(Jayasundara et al. 2020). A major concern as sea level rises is that greater Delta
outflows or new infrastructure will be needed to prevent sea water dispersion into
the Delta (Fleenor et al. 2008; Ruckert et al. 2017). Delta salinity barriers, other
channel modifications, island failures, diversion locations, and diversion and
channel gate operations all affect water quality and flows that support
environmental and human water uses.
Harmful algal blooms (HABs), triggered by adverse nutrient concentrations and
extended water residence times, are an increasing concern for recreational,
municipal, and environmental water quality in the Delta. Real and potential HAB
occurrences in reservoirs also affect water system operations and introduce human
health risks, if not properly managed.

47
Review of Water Supply Reliability Estimation
Related to the Sacramento-San Joaquin Delta
Water temperature is important to protect species, as demonstrated by failures in
managing reservoir water temperatures during the drought of 2012-2016 (Durand
et al. 2020). Omission of water temperature in models or inaccuracies in data and
modeling for temperature can lead to overestimates of water availability that result
in fish kills such as occurred in 2014 and 2015 for endangered winter-run salmon
downstream of Shasta Dam. Water temperature increases from climate change
could change water demands for ecosystems and affect water operations.
Disinfection byproduct precursors (especially
bromide and dissolved organic carbon),
pesticides, mercury, and other contaminants
are additional water quality concerns that
affect the reliability and impacts of water
supplies for ecosystems and human purposes.
Detection and toxicology advances are likely to
increase future water quality requirements and
costs (Delta ISB 2018; Hutton and Chung 1991;
Chen et al. 2010). A previous Delta ISB review of
water quality science in the Delta provides a
broader discussion of Delta water
contaminants (Delta ISB 2018).
3.1.6: Science for Water Quality Reliability
The ability to regulate, forecast, and operate while simultaneously addressing water
quality concerns is important for urban and agricultural water supplies as well as
environmental water supplies. The California Department of Water Resources
already conducts water quality forecasting for municipal supply (Municipal Water
Quality Investigations (MWQI)). Improved ability to quantify water quality effects on
water supply is essential to develop and assess appropriate water quality
investments, operations, and regulations (Kumpel and Nelson 2016).
Combined hydrodynamic and water quality modeling is the most rigorous and
transparent way to understand water quality in the context of flows and habitat
development. The California Department of Water Resources, private consultants,
and academic research centers have developed extensive Delta flow and water
quality modeling capabilities based on a range of 1-dimensional to 3-dimensional
hydrodynamic models.

48
Review of Water Supply Reliability Estimation
Related to the Sacramento-San Joaquin Delta
Improving such modeling will be essential for adapting the Delta and its water
operations for sea level rise, new infrastructure, island failures, habitat restoration,
and improving the health of ecosystems. Such modeling capability also provides a
framework for integrating and applying scientific results, as well as identifying
important science and data needs, in an adaptive management sense, and
designing effective monitoring programs (Delta ISB 2018).
3.2: Technical and Management Issues
3.2.1: Portfolios for Water Management
Water supply systems traditionally have consisted of reservoirs on a single stream
designed to supply a single fixed water demand and target delivery. Much of the
success of California’s modern water systems stems from incorporating water
sources from multiple storage locations (surface and groundwater) combined with
long-term and episodic management of water demands, a process known as
portfolio management. This evolution of water system management as a portfolio
of source and demand actions has been growing for decades and was formalized
as State policy in 2019 when Governor Gavin Newsom issued executive order N-10-
19 to State agencies to prepare a water resilience portfolio for California.
Potential portfolio elements are summarized in Table 4. Their adoption can create
complex water supply systems that involve water trading, flexible operations, water
conservation, and contracts or agreements with neighboring and distant water
systems. This complexity creates water systems that are far more reliable,
adaptable, and cost-effective than isolated water systems. Figure 3 illustrates the
broad portfolio of sources and infrastructure involved in water supply reliability
analysis for the Municipal Water District of Orange County.

49
Review of Water Supply Reliability Estimation
Related to the Sacramento-San Joaquin Delta
Figure 3. Water supply management portfolio for Municipal Water District of Orange County (MWDOC 2016, 2018,
modified for accessibility).

50
Review of Water Supply Reliability Estimation
Related to the Sacramento-San Joaquin Delta
Table 4. Portfolio elements available for managing modern water supply systems.
Type Portfolio Elements Available
Water supplies Water source availability
● Precipitation, streams,
groundwater, wastewater
reuse
● Protection of source water
quality
Conveyance capacities
● Canals, pipelines, aquifers,
tankers (sea or land),
bottles, etc.
Storage capacities
● Surface reservoirs,
aquifers and recharge,
tanks, snowpack, etc.
Treatment
● Water and wastewater
treatment
● New treatment capacity
● Wastewater reuse
● Brackish and ocean
desalination
● Contaminated aquifers
Operations
● Reoperation of storage and
conveyance
● Conjunctive use with
groundwater
Water demands
and allocations
Long-term and episodic water use efficiencies and reductions in
agricultural, urban, ecological, and other uses.
Incentives to
cooperate in
management
● Education
● “Norming”, shaming
● Pricing
● Regulations
● Markets
● Contracts
● Subsidies, taxes
● Regulatory requirements
● Insurance
Water supply reliability results for such complex systems involve operating
decisions for each of the portfolio elements. This is illustrated in Figure 4 for an
agricultural water user. With low annual surface water delivery rates, the
agricultural user may purchase water for trees. At slightly higher rates of annual
delivery, the same user may fallow annual crops, or pump more groundwater. At
even high levels of annual surface water delivery, the water user may have surplus
water to bank, sell, or exchange.

51
Review of Water Supply Reliability Estimation
Related to the Sacramento-San Joaquin Delta
Figure 4. Illustrative portfolio components of annual water delivery (in thousand-
acre feet) shown as cumulative non-exceedance reliability for an agricultural user.
Managers of water projects, water and irrigation districts, and farms and
households all can act to reduce water shortages and minimize economic and other
damages from droughts and other forms of unreliability. In the 2014 to 2015
drought year, farmers statewide lost about 30 percent of normal water supplies,
but expanded groundwater pumping and water trades reduced shortages to about
10 percent of crop water demands. By allocating this on-farm shortage to less
profitable crops, farmers further reduced loss of net farm revenues to only about 3
percent, including additional costs to pump groundwater (Howitt et al. 2015).
This portfolio of potential interactive actions by multiple water systems highlights
the importance of agreements, contracts, regulations, and forms of persuasion that
help coordinate a water system’s many parts, with resulting interdependence for
overall and individual water supply reliability. This is particularly true for joint
facilities, conjunctive use, and water market actions, which involve multiple
institutions. Modeling such complex and extensive systems, as well as systems of
systems, is challenging given unavoidable discrepancies and errors in data and
model representations, but is usually useful (MWDSC 2015).
The economic ability of any water provider or project to support a portfolio of
activities varies regionally and institutionally. Each region has different access to
diverse surface and groundwater sources, mixes of sometimes competing water
uses and demands, economic costs for reducing or shifting water use (such as from
Surplus water to
bank, sell, or
exchange
Pump more
groundwater
Fallow annual crops
Purchase water for trees
Surface water delivery

52
Review of Water Supply Reliability Estimation
Related to the Sacramento-San Joaquin Delta
fallowing or reducing landscape irrigation), geologic access to groundwater storage,
surface storage capacity, conveyance connections internally and outside the region
(and the costs of their development and use), and willingness-to-pay for water.
Diversified supplies and demands also can support internal or inter-regional water
markets, which add flexibility and adaptability. All of these activities can be
motivated, shaped, and limited by state, local, and federal regulatory requirements.
Access to water supplies from the Delta and through-Delta conveyance capacity
often supplements other regional water sources, and allows imports and exports of
water and greater flexibility to adapt across wet and dry conditions, and with
evolving economic and climate conditions. Thus, the Delta, and its water and
infrastructure has become important in the water management portfolios of most
large urban and agricultural water users throughout the state. These Delta users
include sellers of water and groundwater managers in the Sacramento Valley, cities
in the Bay Area, farmers in the southern Central Valley, and cities in Southern and
Central California. In California, MWDSC’s integrated water planning analyses come
closest to routinely representing the broadest range of portfolio and reliability
elements (MWDSC 2015). Urban water systems, particularly in southern California,
have been leaders in explicitly combining portfolio management and reliability
analysis (MWDSC, MWDOC, SDCWA, CCWD, EBMUD, SCVWD, etc.). Agricultural
systems in California also benefit from the adaptability of more diversified water
supply portfolios (Mukherjee and Schwabe 2015). Broad portfolio approaches also
have been applied in academic studies to London (Matrosov et al. 2013, 2015);
Sydney, Australia (Kidson et al. 2013; Sahin et al. 2017); Baja California, Mexico
(Medellín-Azuara et al. 2009); Los Angeles (Porse et al. 2017, 2018); and California
overall (Tanaka et al. 2006; Dogan et al. 2019; Arnold 2021).
California has greatly benefitted from a portfolio approach to water management
(Lund 2016). Sophisticated integration of water supply, demand management, and
incentive policies provide more reliable, economical, and environmentally effective
performance of water systems. Portfolio-based systems can be far more adaptable
and encourage agencies to collaborate. The mix of actions and policies improves
physical and institutional flexibility to adapt to changing conditions from droughts,
new regulations, and climate change, and has potential to further improve the
performance and reduce conflicts with more explicit and complete analyses.

53
Review of Water Supply Reliability Estimation
Related to the Sacramento-San Joaquin Delta
3.2.2: Portfolio Analysis Research
Despite the advantages of an integrated portfolio approach, discussions and
surveys for this review confirmed that modeling efforts focus mainly on surface
water delivery reliability, particularly in state and federal agencies, rather than
including groundwater, which is the largest water storage for major droughts.
Despite useful movement in this direction in recent decades, both water demand
management and groundwater management could often be better included in
analyses and discussions.
Explicit analysis of management portfolios would identify more promising sets of
activities and provide insights for their selection (Lund 2016), but will require better
representations for some portfolio elements. A more holistic approach would
better represent actual water management conditions, options, and decisions.
More transparent, collaborative, and publicly-available data, models, and model
development and testing should allow more agencies and water users to benefit,
negotiate, and collaborate as a more common technical enterprise.
The 2014 Sustainable Groundwater Management Act (SGMA) is placing new
pressure on water users and regions that have depended on groundwater
overdraft to apply a portfolio approach for their water supply planning
(Questionnaire #6). Conjunctive use of surface water and groundwater has ancient
roots in California, dating back to the establishment in 1929 of the Santa Clara
Valley Water District (now known as Valley Water). SGMA brings new demands and
opportunities for improving integration of groundwater modeling and management
in regional and statewide water systems (Dogan et al. 2019; Escriva-Bou et al. 2020;
Arnold 2021). Implementation of Governor Newsom’s 2019 executive order for
water resilience and implementation of SGMA should encourage water systems to
adopt more complex management portfolios.
Much of California’s recent water supply successes have been due to aggressive
development of portfolios of water supply, infrastructure, and demand
management locally, regionally, and statewide. Many urban water supply modeling
and reliability studies include these approaches explicitly. However, many state,
agricultural, and regulatory analyses include a narrow range of management
options. This also is true for ecosystem and environmental management where
representation of ecosystem performance also needs further development.

54
Review of Water Supply Reliability Estimation
Related to the Sacramento-San Joaquin Delta
Droughts, reduced surface water availability, and overuse of groundwater stress
the Delta and other water supplies. These and tightening regulations from SGMA
encourage water managers to diversify supplies and management and reduce
demands. Diversification includes underground and surface storage, water
transfers and markets, conservation, recycling, storm water capture, desalination,
oil-field produced water, and desalination (Arnold 2021). Major water infrastructure
projects, such as the long proposed cross-Delta conveyance have seen little
progress and are still being revised, but might slow or arrest reductions in water
supplies for the Bay Area, the southern Central Valley, and southern California.
3.3: Environmental Adaptive Management
Recent declines of populations of native species in the Delta indicate that managing
water and habitat for most ecosystems has been unsuccessful. Ecosystems are
complex and understanding of interrelationships is often incomplete (Yarnell et al.
2015; Whipple and Viers 2019). Defining precise ecosystem objectives can be
politically controversial; sometimes water supply conflicts occur among ecosystem
objectives in addition to conflicts with urban and agricultural water supplies.
Water supply reliabilities often are over-estimated, which prompts concerns for
curtailment of environmental flows when water shortages occur. There is a need to
conceptualize and analyze more adaptively with all water uses, including
contingencies for shortage management to avoid repeated failures in supplying
water for ecosystems and species. Drought effects on ecosystems have not been
comprehensively investigated and incorporated into environmental management
(Durand et al. 2020; Stein et al. 2021). Because droughts in the future are predicted
to be more extreme, adaptive systems that monitor and model ecosystem
responses and provide data and management guidance for water managers will be
needed to support the intended benefits of environmental flows (Kimmerer et al.
2019).
3.3.1: Research to Implement Adaptive Management
Integration of water supply reliability modeling for environmental water uses with
adaptive management decision-making is needed. This approach brings many
scientific and management challenges for representing ecosystem performance
and demands in system models, including better representing the combined effects
of habitat and flows on ecosystems.

55
Review of Water Supply Reliability Estimation
Related to the Sacramento-San Joaquin Delta
Applied dynamic ecosystem models will be needed to support adaptive
management, most likely starting with simplified models and growing in complexity
to improve accuracy with understanding. Forecasting applications for such
modeling might be the best approach for applied ecosystem model development
(DISB 2015; Holling 1978; Bellido-Leiva et al. 2021; Davies et al. 2014). Efforts
beginning with grander conceptual models have been slow to yield numerical fruits
and syntheses (Williams 2010).
3.4: Multiple Objectives and Conflicts in Water Management
Conflicts among social and personal objectives are common in water management.
Many aspects of water planning can be treated as multi-objective problems with
tradeoffs (Cohon and Marks, 1975; Brill et al. 1982). Multi-objective analysis and
planning is especially useful to balance public investments for performance across
multiple-objectives. Modeling methods that explore approaches to address
multiple goals simultaneously have been used to support decision making by
identifying options that improve multiple goals simultaneously or minimizing harm.
They can be particularly useful for meaningfully engaging stakeholders to balance
competing objectives, based on a transparent discussion that includes scientific
information on system constraints (Cohon and Marks, 1975; Null et al. 2021).
Models presenting multi-objective results and optimization have become more
sophisticated in recent decades, but are not applied widely in water planning and
decision making for the Delta (Alexander et al. 2018). The models have limitations
for representing the complexity of systems, can require substantial data and
knowledge to build, and may have trouble incorporating many policy constraints.
Nonetheless, even in a simplified form, they offer tools for in-depth stakeholder
engagement, scenario analysis, and tradeoff analyses that can improve decisions by
lowering the cognitive burden of considering many processes simultaneously.
Efficient (Pareto-optimal) trade-offs for water allocations among agricultural and
environmental water uses have been demonstrated, but are not typical in California
studies (Homa et al. 2005; Vogel et al. 2007). Potential tradeoffs also exist for
ecosystem and environmental flows among different species and ecosystem
locations, such as between Delta outflows for Delta smelt and cold-water flows for
salmon at different times and locations during drought (Durand et al. 2020).

56
Review of Water Supply Reliability Estimation
Related to the Sacramento-San Joaquin Delta
3.4.1: Research for Employing Multi-Objective Analysis
For multi-objective modeling to be useful, the data and system understanding
needs to be further developed to ensure that models incorporate major processes
and feedbacks. In addition to biophysical studies, a wide variety of social analyses
may be needed to characterize likely benefits and harms to people from
management choices. Further, quantifying, depicting, and communicating
uncertainties in trade-offs among objectives is an area where more research is
needed (Arnold 2021).
Incorporating multi-objective analyses into transparent decision processes is a
difficult institutional challenge that requires cooperation of government agencies,
non-governmental organizations, key stakeholders and others. Many studies have
tested approaches to engaging stakeholders using collaborative modeling
approaches. They have shown promise for applying these tools to identify
management outcomes that reduce burdens of regulation, increase benefits, and
increase perceptions of fairness and legitimacy of management processes. Yet,
many approaches are ad hoc and have mixed success. There is a need to identify
and design elements of these institutional processes to improve confidence in
models and lead to informed and balanced management solutions.
3.5: Forecast-Informed Operations
Forecast-informed Reservoir Operations (FIRO) use real-time data from monitoring
stations and weather forecasts to improve reservoir management mostly by
allowing more water supply storage to be retained during flood seasons (FIRO
Steering Committee 2017). Success rests on the reliability of weather forecasts and
the operational ability to take advantages of opportunities presented by forecasts
for storing water and making flood pre-releases. Ideal FIRO applications are for
moderate-to-large reservoirs with ample reservoir and downstream flood-release
capacity, allowing appreciable flood control storage space to be evacuated within
the flood forecast period (Yao and Georgakakos 2001; Nayak et al. 2018; Delaney et
al. 2020).
As noted, much of California’s annual precipitation and streamflow derive from
large atmospheric rivers. These storms are somewhat predictable with a lead-time
of several days (Lavers et al. 2015). This has inspired integration of atmospheric
river forecasts with reservoir management (Delaney et al. 2020).

57
Review of Water Supply Reliability Estimation
Related to the Sacramento-San Joaquin Delta
3.5.1: Research for Applying Forecast-informed Operations
A challenge is to identify specific reservoirs and precipitation intensities and
durations where and when atmospheric rivers come ashore (Lamjiri et al. 2017).
Studies of spatial-temporal variability of atmospheric rivers on a hierarchy of scales
and attendant inland precipitation and runoff have potential to improve operations
and performance.
Greatly broadening forecast-informed operations beyond single reservoirs to more
integrated forecast-informed operations of more complex systems is a promising
research area. Complexities include multiple reservoirs, support for environmental
flows, upstream and Delta diversions, and groundwater recharge.
3.6: Improved Regional Management
“Any system of water works must be accompanied by a system of
human enterprise that involves the allocation, exercise and control
of decision-making capabilities in the development and use of water
supplies.” Ostrom, V. and E. Ostrom (1972)
The Delta’s complexity requires integrated efforts to manage limited water
resources subject to many jurisdictions. In managing this complex physical,
environmental, and institutional system, agency authorities must deal with complex
and interdependent administrative and technical authorities and capabilities.
Organized science, modeling, and analysis can help adapt and coordinate
management under changing conditions and uncertainties, particularly in providing
estimates of likely trade-offs for alternative actions (Holling 1978).
Improved management, somewhat greater standardization, and co-development of
analytical studies and expertise might help the Delta’s many agencies more
effectively employ science to manage the Delta’s changing problems, including
those related to water supply reliability.
Information on interdependencies between critical water infrastructure elements -
including ecological and human intervention responses - during system failure is a
critical need for fragility and response modeling. System modeling of water
management portfolios for diverse and changing conditions with optimization and

58
Review of Water Supply Reliability Estimation
Related to the Sacramento-San Joaquin Delta
probabilistic uncertainty where appropriate can help focus decision and policy
discussions on promising alternatives.
Arnold (2021) and Nayak et al. (2018) provide useful examples for optimization
modeling of complex water supply portfolios with multiple objectives and imperfect
foresight. Dietze (2017) provides useful examples for ecosystem forecasting
applications using ensemble models and computations.
To adapt to California’s evolving water challenges, a better quantitative
understanding of the integration of water supply reliability estimation with strategic
and technical water management at local, regional, and statewide scales is needed.
Achieving this understanding would be more likely and effective if it deeply involved
a variety of major state and regional water agencies.
3.7: Uncertainty Analysis and Preparations
All estimates involve uncertainties. Analysis of uncertainties can be important for
discussions and decision-making. However, it is often difficult to communicate and
incorporate uncertainties and their analysis in deliberations and decision-making.
Analysis, preparations, and data management are important aspects of managing
water given the many uncertainties involved.
Risk = Probability X Consequence

59
Review of Water Supply Reliability Estimation
Related to the Sacramento-San Joaquin Delta
Managers of critical infrastructure must prepare for risks involving a wide range of
contingencies, ranging from routine emergencies and opportunities to unusual,
rare, and even surprise events. These contingencies can involve any event that
threaten a system’s performance (droughts, floods, chemical spills, a wide range of
accidents, mis-operation, labor strife, sabotage, regulations, lawsuits, etc.). Routine
and periodic maintenance, training, inspections, and other actions can reduce the
likelihood of unfavorable events.
Analysis for preparing, planning, and allocating resources for the many forms of
unreliability should be based substantially on the relative likelihood of each
contingency, particularly for the most threatening and damaging events (i.e., with
the highest risk). Reliability estimation assesses the probabilities of such events.
Because there is uncertainty in both probability estimates and event identifications,
there is a substantial likelihood of error in probabilistic analysis and surprise from
unexpected events. Thus, it is wise to prepare for a range of especially threatening
contingencies, even some beyond what might be justified by probabilistic risk
analyses. Organizations prepare for expected and unexpected contingencies by
modeling and in-person emergency response exercises, stocking spare equipment
and parts, training, maintaining a network of suppliers, experts, arranging mutual
aid with nearby systems, and maintaining individual and organizational capacities
for responsiveness and effective action.
For operations, planning, and policy purposes, four types of events can be
considered, each of which requires different types of analysis:
1. Routine events are so frequent that we prepare for them without feeling a
need to estimate their frequency or probability. Stocking routine spare parts,
basic safety preparations, communications systems, and personnel training are
often in this category. Many pipeline and mechanical failures fall into this
category.
2. Probabilistic events can be frequent and infrequent but are usually fairly well
defined. Relative frequencies are estimated using historical or modeling
analyses for balancing outcomes and costs in planning, preparation, and
operational decision-making. Maximum-entropy and Bayesian methods can
estimate probabilities with very little data (Jaynes 2003; Hui et al. 2018; Fletcher
2019). Most drought and flood planning falls into this category, probabilistically
considering hydrologic uncertainty, and sometimes other uncertainties.

60
Review of Water Supply Reliability Estimation
Related to the Sacramento-San Joaquin Delta
3. Identified events are analyzed as contingencies, and can include probabilistic
events as well as events rare or ill-defined enough that we do not estimate
probabilities. However, we often give forethought and prepare for such events
if their consequences would be great. For example, few water utilities do
explicit probabilistic planning for earthquakes, but most have contingency
plans for earthquake response.
4. Surprise events are events we have not identified, but we prepare for
generally through other emergency training and response exercises, stocking of
tools and materials, and mutual aid arrangements with other agencies. For
example, most water agencies lacked contingency plans for a COVID-19 event,
but other contingency planning and general preparations helped provide
capabilities and disaster-response thinking that could be adapted to an
unforeseen surprise to prevent it from becoming a worse catastrophe.
Box 5 summarizes many of the sources of climate change uncertainty in water
supply reliability estimation.
Box 5. Uncertainties in Studies of Climate Change and Water Supply
Estimation of water supply reliability will need to evolve with California’s changing climate even though the
details of climate changes remain substantially uncertain. Temperatures are getting warmer with greater
watershed evaporation and runoff shifting from spring to winter. Weather extremes also have become more
frequent and extreme.
Most climate change estimates are based on a series of model results and statistical corrections, each of
which can be done in different ways, and have somewhat different results, and are detailed in Appendix A
(Barsugli et al. 2009; Lynam and Piechota 2021).
1. Climate change estimates begin with one of many potential future greenhouse gas emission
scenarios.
2. General circulation models (GCMs) then estimate future global climate impacts, usually in terms of
temperature, precipitation, and wind results (Sarofim et al. 2021). There are many such models, which
give somewhat different results for California.
3. These model results tend to differ from recent climate records, and so are often “bias corrected” in
one of various ways to better match recent observations (Bane 2020; Teutschbein and Seibert 2012).
4. The resulting temperature, precipitation, and wind time series results are coarse, determined by each
GCM’s computation grid (50-100km). To be used for water supply reliability analyses, GCM results
must be then downscaled, by one of various methods, to finer watershed scales for water studies
(Wood et al. 2004).

61
Review of Water Supply Reliability Estimation
Related to the Sacramento-San Joaquin Delta
A major difficulty facing water managers is how to prepare for new and sometimes
unanticipated events or conditions. Extraordinary events such as natural disasters
(floods, extreme droughts, earthquakes, wildfires, harmful algal blooms, etc.),
terrorist attacks, war, epidemics, and human error can drastically affect water
supply systems. Vulnerability to such events occurs both for individual components
and in overall water systems with cascading failures. Further development of tools
to prepare and respond to emergencies is useful to resist, absorb, accommodate
and quickly recover from catastrophic events.
Each component of a system responds in specific ways, affecting others, and the
integrated response is complex and often nonlinear. Environmental fragility models
focus on this integrated response, while including individual system elements.
Some such analyses are often probabilistic, but many take the form of contingency
scenario planning. Modeling for general adaptive capacity is likely to be valuable.
A range of numerical experiments using mostly Monte Carlo type techniques can
give analysts and decision-makers much better feel for the range of likely outcomes
and largest and most important uncertainties in major models and common
important problems. The lessons from these numerical experiments should be
useful to both understand uncertainties and prepare recourse options for both
favorable and unfavorable circumstances.
3.8: Hydrologic Data and New Analysis and Management Technologies
3.8.1: Data Fundamentals, Adjustments, and Error Analysis
Various new approaches are available for making consistent and systematic
adjustments to hydrologic data to reduce and characterize error (Kadir 2017). There
is a difference between raw data (e.g., point field precipitation or
evapotranspiration (ET) data) and processed data (which can be spatially distributed
estimates of precipitation or ET for use in models). Systematic data adjustments
and input data modeling can improve water accounting and form a better basis for
Monte Carlo studies involving hydrologic errors. These efforts should also include
closer and more consistent linkages between groundwater and surface water
models and data.
A wide variety of approaches can be taken to error analysis for water supply
reliability studies. These include various statistical (analytical, Monte Carlo,

62
Review of Water Supply Reliability Estimation
Related to the Sacramento-San Joaquin Delta
sensitivity, etc.) and stress-test techniques (Kadir 2017; Pasner 2021; Kuria and
Vogel 2015).
A standard multi-agency State water accounting framework would improve the
technical coordination and quality control for water supply reliability modeling, as
well as a host of other regulatory and operations concerns in California. Such a
framework might be standardized through the water data SCADA systems already
employed by major local and regional water agencies (Escriva-Bou et al. 2020).
Establishing a basic standard for error analysis would help analysts and decision-
makers understand the importance (or unimportance) of various likely sources of
error in water supply reliability and other analyses. An interagency technical
standards board, including outside experts, would help establish and oversee
research for such purposes.
Although each of the preceding trends is generally treated independently, the
review discussions and survey results confirm that water planning and operations
would benefit by explicitly considering these trends together in an integrated way.
For example, development of complex portfolios (and even simple portfolios) often
must consider environmental flows and their impacts on species and ecosystems,
water quality, and climate change. The future must be managed with these
collective trends in mind, as most manager and policy-makers realize.
3.8.2: New Technologies
Many new technologies, methods, and practices are available to improve data,
models, and model runs that are the backbone of water supply system reliability
analysis (Brown et al. 2015; Herman et al. 2020). These include: improved
approaches and documentation for data management, access, and transparency;
use of web services to share data, model runs, and post-processing; machine
learning (learning empirically from the vast amounts of data available as opposed
to explicit model formulations); and approaches to test performance over wide
ranges of system conditions.
Advances in computing are making it possible to perform sensitivity and Monte
Carlo analyses, as well as more sophisticated optimization analyses that would have
been impossible a few years ago. Web services such as GitHub make it far easier to
disseminate version-controlled code, documentation, and data that allows many
contributors to test and improve code and methods.

63
Review of Water Supply Reliability Estimation
Related to the Sacramento-San Joaquin Delta
4. Metrics of Water Supply Reliability
“When you get rid of what you don’t want, you do not necessarily
get what you do want and you may get something you want a lot
less.” Russell Ackoff
Many metrics of water supply reliability are in use. Most metrics have been
developed for urban and agricultural water systems. However, there have been
important efforts to develop indicators of water supply reliability for environmental
purposes (Stein et al. 2021). Use of well-developed metrics helps analysts,
managers, and policy-makers understand and explore both water system
performance and alternative solutions.
Metrics for complex systems always overlook some (sometimes important) details.
It is tempting to summarize indices to an extreme, such as developing indices of
indices. The best metrics improve management and understanding by focusing
voluminous modeled or observed results into a few informative statistics or
depictions.
The definition and use of a metric itself can be complex and controversial. Indeed,
social indicators used for decision-making become subject to corrupting pressures
– Campbell’s Law (1979). In essence, good metrics provide management or
scientific insights by summarizing performance or conditions for the decision-
maker or analyst. Poor metrics and poor use of metrics can mislead or distract
management and scientific discussions from more important aspects of problems
or solutions.
Assessment of metrics also rests on the accuracy of the data, models, and methods
used to calculate them. Because all metrics have uncertainty, analysts should
explore, identify, and quantify major uncertainties. Decision-making deliberations
should keep these uncertainties and limitations in mind, and consider
consequences and contingencies.
4.1: Common Metrics of Water Supply Reliability
Dozens of metrics have been proposed to assess water supply reliability for urban,
agricultural, navigation, and hydropower performance (Rippl 1883; Riggs and
Hardison 1973; USACE 1975; Hirsch 1978; Klemes 1987; Basson et al. 1994;

64
Review of Water Supply Reliability Estimation
Related to the Sacramento-San Joaquin Delta
Hashimoto et al. 1982a, b). Table 5 summarizes some common metrics. Many
additional metrics exist for evaluating water distribution system performance
(USEPA 2015). Each metric provides insights into different aspects of desirable
water supply performance, but no single metric provides a complete picture of
water supply reliability.
This table and discussion distinguish between technical and fundamental
performance metrics. Ecologic or environmental performance objectives are
relatively new and are discussed in a later section.
Table 5. Summary of common water supply reliability performance metrics.
Metric Type Description
Technical
Averages Average water delivery, storage, or shortage (e.g., acre-feet per year)
Design drought
delivery
Delivery in a particular one-year or multiple-year drought, as is
common and required for UWMPs
Firm yield Highest 100% reliable delivery for historical hydrology (Rippl 1883;
Lindsey et al. 1991)
Shortage
probability
Probability of water shortage
Delivery
probability
Probability distribution of water delivery or storage (Hazen 1914; Hirsch
1978)
Reliability Probability that delivery is not less than a delivery or storage volume
target
Resilience Time needed for delivery or storage to return to target level after
“failure”
Robustness Range of conditions for which delivery or storage targets are attained
Fundamental
Public Health
Public Health
Direct: minimum safe water availability, waterborne illnesses, deaths,
or days lost
Indirect: public health water quality indicators
Economic Direct: Net economic benefits or costs
Economic Indirect: costs and/or raw sectoral or economically valued outputs from
selected economic sectors (agriculture, urban, recreation, navigation,
etc.)
Social Social objectives are usually in terms of health, prosperity, and well-
being of disadvantaged or under-represented groups.
Environmental/
Ecosystem
Direct: Species populations and compositions, numbers or individual
health
Environmental/
Ecosystem
Indirect: Flow characteristics desired to support ecosystem
characteristics

65
Review of Water Supply Reliability Estimation
Related to the Sacramento-San Joaquin Delta
4.2: Technical Metrics
Technical metrics typically summarize current or forecast water deliveries or
storage conditions (Table 5). These metrics are convenient for system operators to
assess likely performance, usually in the context of their water management
experience, and so help with operational or system design decisions. Some
common metrics are:
Average delivery capability is the mean annual or seasonal water volume
available for delivery from a water supply system. Although this calculation is
straightforward, it is rarely used alone in practice because variability in delivery
capability is crucial for the success of a water supply system, particularly in
Mediterranean climates like that in California with large annual and seasonal
variability.
Design drought delivery is common for water systems designed to accommodate
specific design droughts. California’s larger urban water suppliers, with more than
3,000 customers, are required to produce Urban Water Management Plans
(UWMPs) every 5 years, which describe “the reliability of the water supply and
vulnerability to seasonal or climatic shortage” for an average year, a single dry year,
and multiple dry years (CWC 10631 (c)(1)). UWMPs also must specify actions to
accommodate up to a 50 percent reduction in water supply (CWC 10632 (a)(1)).
Firm yield (sometimes misleadingly called “safe yield”) is the amount of water that
can be supplied without any shortage for a repeat of the historical hydrologic
record (using the critical drought of record as a design drought). It is a classical
conservative water supply reliability metric (Rippl 1883; Linsley et al. 1992).
Historically, firm yield was the primary metric used for the design and assessment
of United States reservoir systems, including major projects in California. The
metric remains useful to indicate if water shortages are likely to be a problem.
When a system’s water use exceeds its “firm yield,” drought concerns rise and more
elaborate performance metrics and system contingencies and plans are needed.
Probability of shortage is the likelihood that a particular water right or use will
experience a shortage in a planning or seasonal timeframe. Figure 5 shows the
results of a water rights analysis using historical flow estimates, indicating the
probabilities of each of roughly 800 San Joaquin Basin surface water rights being
curtailed (Walker 2017). The probability of being curtailed varies greatly with the

66
Review of Water Supply Reliability Estimation
Related to the Sacramento-San Joaquin Delta
type and priority of water right and its location in the basin. Upstream tributary
users, even those with high priority, are more likely to be curtailed for lack of local
water availability, whereas downstream users, even those with lower priority, tend
to have more reliable supplies because they can be supplied from several
tributaries.
Figure 5. San Joaquin Basin July Water Right Shortage Probabilities (from Walker
2017).
Delivery-reliability distributions (Hazen 1914) arose from a deeper
understanding of reliability, particularly the realization that a range of water
volumes can be provided with different probabilities or likelihoods. Instead of being
a single number (e.g., firm yield), water supply delivery-reliabilities are calculated
and presented as a probability distribution. Water supply deliver-reliability
distributions are computed for most of California’s major water systems today
(DWR 1983, 1987). Management targets might be expressed as average probability
performance, such as some probability of failure to meet a delivery target (such as
a 5 percent annual chance of exceeding a 20 percent shortage). However, the entire
distribution of delivery-reliability also can be used for further risk and response
analysis for management and evaluation of broader and more complex portfolios
of actions.

67
Review of Water Supply Reliability Estimation
Related to the Sacramento-San Joaquin Delta
Figure 6 shows estimated delivery-reliability distributions for the SWP, comparing
2015 and 2017 analysis results (DWR 2017). Various depictions of delivery-reliability
include cumulative and density distributions of deliveries or water delivery
shortages (Figures Cover, 4, and 5). (Table A water is the amount of water that can
be requested by SWP water contractors based on long-term water contracts with
SWP.)
Figure 6. Estimated likelihood of SWP Table A Water Deliveries by increments of 500
taf (excluding Butte County and Yuba City). The dashed box shows there is a 77 percent
chance of SWP Table A water delivery of more than 2,000 thousand acre-feet (taf) in 2017
(from DWR 2017 Delivery Capability Report - DCR; modified for accessibility).
Position analyses are a common variant of delivery reliability plots (Hirsch 1978;
FitzHugh 2016), which plot and compare operational results from a set of equally-
likely input or hydrologic scenarios, e.g., Figure 7. Such plots and analyses are
common for seasonal and real-time operation delivery and performance reliability.

68
Review of Water Supply Reliability Estimation
Related to the Sacramento-San Joaquin Delta
Figure 7. Example of a Position Analysis display of water storage trace results for
Shasta Reservoir in 2011 (wet year) and 2015 (dry year). (FitzHugh 2016, modified for
accessibility)
Engineering performance indices (Table 5) are a subset of technical metrics that
focus on different aspects of water supply reliability performance (Hashimoto, et al.
1982a, b; Shamir and Howard 1981; Vogel and Castellarin 2017; Vogel et al. 2007;
Homa et al. 2005; Kuria and Vogel 2015). Management targets might be expressed
as average performance or some exceedance probability of an index target (such as
no more than a 5 percent annual chance of exceeding a 20 percent shortage).
Examples of engineering performance indices include:
● Reliability – Percentage of years or time that a water supply system can or
cannot meet a target delivery (or other target metric such as storage balance,
groundwater elevation, etc.).

69
Review of Water Supply Reliability Estimation
Related to the Sacramento-San Joaquin Delta
● Vulnerability – The magnitude of shortage that occurs when a system cannot
supply its delivery target, often the average or extreme shortage.
● Resilience – The amount of time likely needed for a system to return to
supplying a delivery target, after it has failed. A resilient system tends to
quickly return to a functioning one after a failure. Recent diverse usage of
“resilience” has made this technical metric less useful.
● Robustness – The amount of disturbance a system can accommodate before
it fails to supply a target delivery (Hashimoto et al. 1982b). More recently, this
approach has broadened to take advantage of the surge in computational
capabilities, to identify the range of conditions or disturbances for which
target deliveries are attained based on hundreds or thousands of future
scenarios. Sometimes statistics are calculated on the percentage of scenarios
that fail to achieve different levels of performance (Herman et al. 2016, 2020;
Erfani et al. 2018).
4.3: Fundamental Performance Metrics
A variety of performance metrics are available to reflect the fundamental societal
objectives affected by water management and supply reliability.
Public health indicators can be specific in terms of days of illness, deaths, average
annual years-of-life lost, life expectancy, or other terms. However, public health
indicators are usually less direct and reflect concentrations or exceedances of
standards for water quality constituents or inability to provide minimal water
quantities needed for human health.
Economic indicators recognize that not all reliability failures are equally
undesirable. Some failures are more economically damaging than others. As water
economists have noted, “There is rarely a shortage of water, but often a shortage of
cheap water.” Economic loss or benefit functions often are employed, or a
subsidiary set of economic impact and adaptation models (Howe and Smith 1994;
Jenkins et al. 2003; Howitt et al. 2012). Economic indicators can be summarized
rigorously as the expected value of net benefits, balancing most of the above
considerations in economic terms (Arrow and Lind 1970). Often estimates of
variance and extremes of economic losses are useful for assessing economic or
financial stability, potential roles for insurance, and more dire effects of drought on
vulnerable social groups.

70
Review of Water Supply Reliability Estimation
Related to the Sacramento-San Joaquin Delta
Social indicators for the health, prosperity, and well-being of social groups are
sometimes used to characterize effects of decisions and assess equity in the
distribution of benefits and risks (USEPA 2021; Teodoro and Saywitz 2020).
Environmental justice and social vulnerability indicators can assess equity concerns
among socio-demographic groups or places. Social objectives for water
management also may be procedural, such as according with principles for the rule
of law, property rights, and democratic governance. Metrics can be directly related
to resource use by examining the frequency of being unable to meet specific needs
or wants.
Environmental indicators represent the environmental and ecological impacts of
system performance and reliability. This newer area of water supply reliability
metrics is discussed in the next section.

71
Review of Water Supply Reliability Estimation
Related to the Sacramento-San Joaquin Delta
4.4: Metrics for Environmental Water Supply Reliability
Performance metrics for environmental objectives continue to evolve to reflect new
information and understanding of species and ecosystem water demands.
Quantitative characterization for environmental and ecological performance is still
evolving in water planning and management and has less history and
methodological development, with sizable uncertainties and ethical quandaries on
the ecological effectiveness of specific flow regimes under local conditions.
Quantitative characterization is hindered by the many factors affecting many local
ecosystems and species, including a wide range of habitats and water qualities
affected by seasonal and inter-annual water operations (Arthington 2012;
Arthington et al. 2018; Stein et al. 2021; Yarnell, et al. 2020; Bellido-Leiva et al.
2021). Requirements of different species also can conflict. But, but these difficulties
do not obviate the value of environmental metrics.
Many metrics of traditional (urban, agricultural, etc.) water supply performance
have been applied to environmental water supply performance. The frequency and
reliability of a system’s ability to deliver instream or wetland flows or water levels
are common for assessing if systems have environmentally supportive hydrologic
conditions (Singh 2015; Grantham et al. 2014; Stein et al. 2021).
Several approaches have been proposed to represent ecosystem/environmental
objectives in water supply reliability analyses (Arthington 2012; Yarnell et al. 2015;
Williams et al. 2019). Environmental water objectives usually are represented as
constraints on system operations, implying that minimal environmental targets are
met first, with remaining water available for non-environmental purposes.

72
Review of Water Supply Reliability Estimation
Related to the Sacramento-San Joaquin Delta
Common approaches to metrics of environmental water system reliability (which
can overlap) are summarized in Table 6 and described in the discussion below.
Table 6. Some metrics of environmental water supply reliability.
Metric Description
Simple flow targets Usually a fixed instream flow or water delivery target
(Tennant 1976)
Composite habitat
suitability objectives
Flows based on interactions of flow and habitat selection
preference ideas (PHABSIM) (Railsback 2016; Bovee 1982)
Natural flow regime
standard
Environmental flow variations based on pre-development
natural flows (Poff et al. 2010; Poff 2018)
Environmental flow
targets
The functional flows approach develops seasonally-varying
flow targets to provide particular ecological functions (Yarnell
et al. 2020; King; Stein et al 2021; Poff 2017, Poff et al. 2010)
Species and population
indicators
Population indicators, usually from integrating population
dynamics models with habitat and flow models. (Bellido-Leiva
et al. 2021; van Winkle et al. 1998)
Simple environmental flow targets are common as constraints or reliability
targets on water supply operations. While preventing complete drying of streams,
minimum flows are often insufficient to achieve broader ecological objectives.
Simple flow targets can be established systematically (Tennant 1976) but are not
always sufficient.
Composite habitat suitability objectives recognize the importance of
interactions between flow and habitat in supporting species and ecosystems. A
variety of interacting habitat and hydrologic models have been developed and
applied to set composite habitat objectives for flow and habitat management
(Williams et al. 2019). Flow and habitat specifications often are developed for
specialized stream, riparian, wetland, or floodplain habitats preferred by one of
more desired species (Whipple 2018; Williams et al. 2019). PHABSIM is a
widespread early example of this approach (Bovee 1982). Implementing these
approaches can be computationally complex and data-intensive, and may not be
particularly successful when they estimate only one component (habitat) of the
ecological needs of species. They also often cannot incorporate the benefits of flow
variability across seasons (Williams et al. 2019; Whipple and Viers 2019).

73
Review of Water Supply Reliability Estimation
Related to the Sacramento-San Joaquin Delta
Natural flow regime standards usually base environmental flows on a historical
pre-development flow regime, allowing some diversions or alterations from these
historical flows. The idea is to create an environmentally effective flow regime by
setting the percentage of natural flow to remain instream for desirable species
(usually native fish, trees, etc.) adapted to the natural variability in flows (Poff et al.
2010; Poff 2018). This approach is simple to understand and implement, but faces
many challenges. Historical goals are more difficult, and perhaps impossible or less
relevant due to extreme alterations of the physical landscape (e.g., levees, wetland
and floodplain development, and channel hardening), composition of species in the
local ecosystem, and climate change. Perhaps the most successful development of
this approach is the ELOHA (Ecological Limits of Hydrologic Alteration), because its
final results ultimately depend on stakeholder inputs (Poff et al. 2010).
Environmental functional flow targets can be expressed as a set of seasonally
varying instream flow targets that support a variety of specific ecological functions.
These can include minimum instream flows, flow or flow rate change targets to
support specific ecological functions (spawning or rearing habitats, fish passage,
migration cueing, etc. for specific species or ecosystems), allowable streamflow
alterations from unimpaired flow, or allowable water quality conditions
(temperature, dissolved oxygen, etc.) assessed empirically or mechanistically (King
and Louw 1998; Stein et al. 2021; Yarnell et al. 2015, 2020; Fleenor et al. 2010;
CEFF.ucdavis.edu), as shown in Figure 8. Recent functional environmental flow
efforts incorporate landscape changes and modification efforts in flow-setting
analyses. Functionally-developed, seasonally-varying environmental flow targets
have succeeded in improving ecosystem conditions in several applications, and are
widely proposed for streams in California (Kiernan et al. 2012; CEFF.ucdavis.edu).

74
Review of Water Supply Reliability Estimation
Related to the Sacramento-San Joaquin Delta
Figure 8. Functional flow components for California depicted on a representative
hydrograph. Blue line represents median (50th percentile) daily discharge. Gray shading
represents 90th to 10th percentiles of daily discharge over the period of record (Yarnell et
al. 2020, modified for accessibility).
Species and population indicators use estimates of species population or
biomass dynamics to explicitly represent ecological objectives of flow and habitat
management. This is similar to using economic benefit estimates to more directly
represent objectives for societal prosperity. These approaches explicitly represent
life-cycle continuity and population dynamics of species, such as found in Individual
Based Models (van Winkle et al. 1998; Cardwell, et al. 1996; Williams et al. 2019;
Adams et al. 2017; Bellido-Leiva et al. 2021). Using more direct population estimates
as a metric is less common and requires more mechanistic ecosystem
representations but could be combined with a functional environmental flows
approach to quantify the ecological functionality of particular seasonal flows.
Representations of environmental flows or their performance may require very
short modeling time steps (15-minutes or hourly) when rapid flow or ecological
processes need to be captured. For planning purposes, time increments simplified
to daily, weekly, or monthly flow requirements often are deemed sufficient to
provide water for finer-scale ecological operation decisions. Environmental flow
reliability then can be estimated as probability distributions of the likelihood of
desired flow, habitat, or population conditions.

75
Review of Water Supply Reliability Estimation
Related to the Sacramento-San Joaquin Delta
Given the approximate, uncertain, and complex relationships between desired
environmental objectives and actual ecosystem conditions and lack of monitored
experience with environmental flows, there is often uncertainty in the actual
ecosystem outcomes from implementation. This imposes a need for adaptive
management and field-testing and improvements of models used for
environmental flows (Dietze 2017; Davies et al. 2014).
5. Quality Control in Reliability Estimation
“In all hydraulic data the probable error of measurement is
considerable. There is, therefore, no justification for the application
of extreme refinements in methods of calculation.” Allen Hazen
(1914, p. 1541)
Water supply reliability estimates are important for project planners, water
managers and users, regulators, and a wide variety of decision-makers faced with
evaluating and judging the performance and trade-offs of decision alternatives.
These important, expensive, and often time-consuming decisions typically involve
difficult and complex discussions, multiple proposal iterations, and technical
controversies regarding supply reliability for various water uses. Decisions usually
are implemented with specific agreements or requirements informed by reliability
estimates.
This section reviews and examines unreliability in estimates of water supply
reliability, and discusses approaches to quality control in water supply reliability
estimation.
5.1: Why Water Supply Reliability Estimates Differ
Analyses to estimate water supply reliability require an organized representation of
water sources, water demands, and the water management system (as shown in
Figure 2). Each representation usually requires many subsidiary representations
and judgements. These representations are approximate, especially when they
apply to the future. Thus, any two modelers will likely make different estimates of
water supply reliability, even where they agree substantially in their
representations (Lund 2016). Future reliability estimates are uncertain and
probabilistic. Even with little data, probability distributions can be estimated (for
example, with Bayesian and maximum-entropy techniques, Jaynes 2003).

76
Review of Water Supply Reliability Estimation
Related to the Sacramento-San Joaquin Delta
Water supply reliability estimates also can vary from actual experienced water
supply reliability, particularly under unusual circumstances, such as droughts, as
shown in Figure 9.
Figure 9. Comparison of Delta water export reliabilities estimated in 2015 with actual
severe drought year exports 2014, 2015, and 2021 (after Lund 2016).
The quality and uncertainty of water supply reliability estimates depend on the
representation of inputs, infrastructure and its operations, and demand
expectations. In California, traditional water delivery reliability estimates employ
water system models, e.g., CalSim II, CalSim 3.0, CalLite, WEAP, SACWAM, and CV
mod. All these models have some accounting for water demands, regulations,
network dynamics, infrastructure, and operating policies (Lund 2016). Because
these models and their variants are specialized, a potential vulnerability is that
modelers may become preoccupied with learning and running the model without
being critical of the broader realism of model outputs for decision-making.
Turnover of modelers in agencies has been an annoyance, as has been retaining
experienced personnel and developing a cadre of modelers who are at different
career-stages.

77
Review of Water Supply Reliability Estimation
Related to the Sacramento-San Joaquin Delta
Estimations of water supply reliability can diverge with representations in the broad
components in Figure 2, as summarized in Table 7 and discussed below.
Table 7. Why water supply reliability estimates differ.
Source of differences Improvements
Hydrology of water sources Common hydrologic accounting and
assumptions, documentation, sensitivity or
error analysis, explicit interpretation
Water demands Documentation of demands, sensitivity or
error analysis
Model structure and representation of the
water system, infrastructure, operating
rules, etc.
System, model, and decision
documentation; sensitivity or error
analysis; explicit interpretive discussion
Modeler and modeling practices Documentation of modeling and
interpretation of results, external review,
sensitivity or error analysis
Hydrology of water sources. Water supply systems can have multiple surface
water, groundwater, and reuse sources, which may be represented in different
ways, especially when considering different future climate and regulatory scenarios.
Water accounting is imperfect with many estimated components (Escriva-Bou et al.
2020b; Ariyama et al. 2019). Quantities, such as precipitation, streamflow and water
exports are relatively well measured/estimated and documented for the Delta, and
extensive water monitoring networks cover most large watersheds, but even small
uncertainties can have high decision value, when the market value of water in
drought exceeds $1000/acre-ft (DWR 2018). The hydrology of each source must be
represented and estimated, usually as a time series of available streamflow, runoff,
aquifer pumpage, or reuse water availability. Estimating these quantities over time
is particularly approximate for extreme wet and dry conditions, especially with a
changing climate.
Hydrologic inflows usually are based on historical records of unimpaired
streamflow or a synthesis from outputs of climate models. Most water supply
reliability modeling considers only the historical hydrology with little account of
anthropogenic changes in demands, regulations, and operations and other
uncertainties in upstream and downstream inflows. An ensemble (e.g., Monte
Carlo) approach might better represent a diverse set of dynamic scenarios.

78
Review of Water Supply Reliability Estimation
Related to the Sacramento-San Joaquin Delta
Currently MWDSC runs as many as 17,000 plausible, but not probabilistically
representative, future scenarios (MWDSC 2015). MWDSC and Santa Clara Valley
Water District also have in the past run probabilistic scenarios based on re-
sequencing the historical hydrologic record (MWDSC 2010; SCVWD 2003).
More substantial hydrologic gaps and uncertainties exist for groundwater storage,
flows, pumping, basin evapotranspiration, snow cover, melt rates and upstream
precipitation (Medellín-Azuara et al. 2018). Water use by surface water rights
holders is often poorly reported. Typically, only applied and not consumptive use is
reported, and groundwater withdrawal is not reported at all. Return water to the
system after usage is sometimes not properly reported (Lund 2016). High
frequency (e.g., sub-monthly) data are more prone to error than monthly or annual
counterparts. Synthesis between data sources, identification of flaws of
measurements leading to divergent data, and stronger error estimations and
documentation may help improve input data quality (Kadir 2017; Pasner 2021). The
monitoring tool that ESSA developed for Delta Science Program can be useful for
some data gaps, duplication, and uncertainty and quality estimates (Alexander et al.
2018). Appendix A further discusses some issues in representing hydrologic inputs
for water supply reliability analyses.
Currently federal and state agencies in California maintain multiple computer
models, but coordination in their development and use could be improved.
Establishing a common or standardized water accounting framework for water (in
and outside the Delta) with consistent and contextual monitoring, evaluating and
reporting protocols is highly desirable (Escriva-Bou et al. 2020b).
Water demands. Water supply systems for the various urban, agricultural, and
environmental uses tend to have fluctuating and changing water demands. Major
urban areas are seeing diminishing per-capita water use rates and commonly
manage water demands by voluntary or mandatory rationing during drought to
shape the frequency and depth of water shortages and use of alternative water
sources. Some agricultural water users reduce water use in lower-valued crops
differentially across wet and dry years to increase aquifer recharge, shift water to
higher valued crops, or sell water (Howitt et al. 2012, 2015).
Water demands are simplified for modeling, but become more complex when
water conservation/demand management activities are considered in the reliability
analysis. Greater testing and documentation of water demand representations

79
Review of Water Supply Reliability Estimation
Related to the Sacramento-San Joaquin Delta
would help in understanding the likely range of model reliability. Water demands in
models usually are based on populations, climate, land uses, and other factors, that
are frequently considered fixed. Agricultural water demand estimation is hampered
by lack of field data at appropriate space-time scales. Remote sensing of land uses
and evapotranspiration have been helping greatly here, and has continued future
potential (Medellín-Azuara et al. 2018). Appendix A further discusses some issues in
representing water demands for water supply reliability analyses.
Model structure and representation of the water supply system. Models used
for water supply reliability have structural and detailed differences, often including
different portfolio elements and representing their interactions differently.
Different modelers also usually apply these models differently. As a result, there
can be a significant spread in water supply reliability predictions, despite
reasonable differences in modeling assumptions (Lund 2016).
More detailed internal water network reliability assessments are common. Simpler
analyses estimate the probability that all users are connected to at least one
source, based on combining probabilities of individual network component failures.
This topological reliability uses network theory. In more elaborate hydraulic
reliability estimates, the probability that a water supply system provides adequate
supplies to each user is estimated using stochastic (Monte Carlo) simulations,
where random events out of the component reliabilities are generated, and the
cumulative performance of the system is summarized with performance statistics.
Hybrid methods combine the two approaches (ASCE Task Committee on Risk and
Reliability Analysis of Water Distribution Systems 1989; Hossain et al. 2020).
Water supply reliability estimation is challenged by random and non-stationary
processes such as population growth, land use change, climate variability and
change and unexpected (black swan - surprise) events. Models often need to be
nudged to account for these. Climate change effects on the Delta water supplies
are likely to be significant, including water export reductions of about half-a-million
of acre feet and diminishing north-of-Delta carryover storage (Fleenor et al. 2008;
Wang et al. 2018; Knowles et al. 2018; Schwartz et al. 2021). Additional non-
hydrologic non-stationarity in operations, regulations, ecosystems, and water
demands has potential to change model details, capacities, portfolio structure, and
operating rules over time.

80
Review of Water Supply Reliability Estimation
Related to the Sacramento-San Joaquin Delta
Modeler and modeling practices. Historically, model errors have been attributed
to error in model structure (formulation), model parameter estimates, model input
values, solution method, and results interpretation. All of these are under the
domain of the modeler and the modeling culture of the performing organization.
Despite efforts at convergence, water supply reliability modeling organizations have
different modeling cultures and individual modelers have different experiences and
judgements. Many water supply reliability studies are minimally documented or
inaccessible, making it difficult to assess their structure and reliability. Model
results rarely include substantial error analysis. Given the sophistication of
reliability estimation models, agencies often are reluctant to invest in laborious and
expensive efforts to analyze and document model performance and improve
models.
The water management community might benefit from some broader expectations
and efforts that include quality assurance, error analysis, and evaluation. Quality
control for modeling, system analysis, and their applications to California water
problems are long-standing topics (Tetratech 2019a, b; CWEMF 2021; DIB 2019;
ongoing USBR and DWR efforts for CalSim). Almost all modeling efforts have some
quality control. Recent years have seen increasing professional expectations for
quality control in model development and applications, with related expectations
for documentation of models and data, transparency, reproducibility, accessibility,
as presented below.
5.2: Making Analysis Transparent, Documented, Replicable, and Accessible
Desirable modeling practices are well described (Tetratech 2019a, b; CWEMF 2021).
Today, most quality controls on water supply reliability modeling are internally
facing for the conducting organization, not reflecting explicit external technical
expectations. No method is universally accepted to quantify the quality of water
supply reliability analyses (Thissen et al. 2017).
Professional expectations for water supply reliability studies, and technical studies
in general, tend to be based on the professional culture of individual and collective
practices. In fields without a common modelling institution or professional
organization where expectations can form and perhaps be codified, divergent
quality control efforts often take root.

81
Review of Water Supply Reliability Estimation
Related to the Sacramento-San Joaquin Delta
Expectations for professional practice can be informal, often patterned after
templates or exemplars of practice or more formal, but less flexible standards, or
regulatory requirements, and contract language. Professional practices often are
manifest in model, data, and analysis documentation, testing, and availability. The
state-of-practice of quality control for various components of water supply
reliability analysis based on our experience is summarized in Table 8 and discussed
below.
Table 8. Common quality control efforts for components of water supply reliability
analyses.
Quality Control
Action
Model Input data Model Results Studies/
reports
Documentation Sometimes Usual Sometimes Sometimes
Testing Usual Usual Informal Rare
Interpretation Sometimes Informal Sometimes Sometimes
External Review Informal Informal Unusual Unusual
Data and Code
Availability
Sometimes Usual Sometimes Sometimes
Documentation. Models dealing with complex coupled natural-human-engineered
systems have unavoidable deficiencies, uncertainties and quality of data, so it is
useful to have public documentation of modeling methods, assumptions, building
blocks, and underlying uncertainties available and, where appropriate, published
peer-reviewed results.
The availability of documentation for studies and models in California has improved
markedly in recent years, with the posting of such reports on agency web sites
becoming a common practice. However, there has been a nearly wholesale removal
of such reports and documents from State agency websites because the historical
documents did not comply with accessibility requirements for persons using
assistive technology (Venteicher 2019). Much of the details of California’s water
system, history, and analyses are increasingly inaccessible, difficult to discover, and
susceptible to becoming lost.
Testing. System models for water supply reliability estimations can be tested in
multiple ways. These include model-data comparisons, model code verification,
sensitivity studies, and formal error analyses.

82
Review of Water Supply Reliability Estimation
Related to the Sacramento-San Joaquin Delta
Models can be tested against field data and logic. For routine short-term operating
purposes, comparisons of field data with model results provide timely insights to
assess and improve model accuracy and use. However, for longer-term policy and
planning application, comparisons of model and field data are largely unavailable
until long after planning decisions must be made. Thus, field data for longer-term
planning analyses must be extrapolated from historical or recent conditions, usually
for component process models (such as household or crop water demand models).
Models also can be tested based on the logic, theoretical, and literature validity of
their structure and parameter values, and assumed inputs. These can be vetted
with experts and stakeholders, particularly if they are well documented. Error
analyses can propagate presumed or estimated errors in model components to
estimate likely errors in model outputs. When models are applied to more distant
futures or operating conditions further outside their range of calibration, larger
errors should be expected and testing must be based more on logic, error analyses
and formal reviews.
The logic and behavior of most models are tested primarily by comparing their
assumptions and results against the understanding of the system by the modelers
involved, as well as operators, managers, stakeholders, and sometimes external
reviewers. Some tests are extensive, prolonged, and iterative processes, with some
documentation, culminating in a more accurate and trusted model.
Sensitivity analysis is a process that varies various model assumptions to assess
how much model results and conclusions might change. This is a common
approach to testing model results and conclusions (Vicuna et al. 2007).
Error analysis is a more formal type of sensitivity analysis, which makes
probabilistic assumptions about the likelihood of various model input or parameter
conditions (Hazen 1914; Shuang et al. 2014). Error analysis can be done analytically
(Hazen 1914) or more flexibly as Monte Carlo studies (Klemes 1987; Nayak et al.
2018). A limitation of both sensitivity and error analysis approaches is how to
handle the many (often hundreds or more) assumptions involved in reliability
estimation, and how these conditions might be correlated across variables and in
space and time.

83
Review of Water Supply Reliability Estimation
Related to the Sacramento-San Joaquin Delta
To better test and compare models and model results, standardization of data and
modeling is needed, discouraging the current closed in-house models that are black
boxes to outsiders. American Water Works Association (AWWA) and International
Water Association (IWA) have developed standardized methods for water audits
that assist completing water balances. Periodic audits can be a part of reliability
estimates (Sturm et al. 2015). Documenting such results can be helpful.
Expert Interpretation. Initial model testing already employs the scrutiny of model
and domain experts. Routine model results, and reliability estimations, also can
benefit by adding written interpretations and discussions of results by model and
problem experts for problem-oriented managers. The documentation of
interpreted results can make their reasoning more explicit and useful for a broader
range of interested parties.
Interpretations of well-crafted sensitivity results can be insightful, especially when a
wide range of possible future conditions are explored. Such results have been used
and developed extensively as “decision-scaling” or “robustness” analyses (Brown et
al. 2012; Wilby and Dessai 2010). Most “robustness” planning examines the
performance of alternatives based on many possible future scenarios (usually not
probabilistic) to assess ranges of unfavorable and favorable future conditions
(Wilby and Dessai 2010; Means et al. 2010). The “decision-scaling” approach is
especially promising in that it uses fewer, more artfully designed scenarios
representing sequentially more dire conditions to assess the range of stable and
desirable performance for a system or a proposed alternative (Brown et al. 2012).
Review. Internal technical reviews of water supply reliability studies almost always
occur, including the system models used to produce them. Most regard the
representation of operations. However, external reviews are less uniformly applied
but may be advisable to promote use of current science. For example, in California,
the CalSim and CalLite models have been formally reviewed externally for journal
publication (Draper et al. 2004; Islam et al. 2011) and sometimes in more depth,
sponsored by the California Water and Environment Modeling Forum (CWEMF)
(Ford et al. 2006; Close et al. 2003). Local system models are sometimes also
reviewed externally (Randall, et al. 1997). Elsewhere, the major water supply
reliability modeling system used by New York City recently was reviewed by the US
National Academy of Sciences, Engineering, and Medicine (NASEM 2018).

84
Review of Water Supply Reliability Estimation
Related to the Sacramento-San Joaquin Delta
External Replication. Replicability is a staple of testing scientific work. Sometimes
replication efforts are made of water supply reliability and other analyses. An
example is MBK Engineers and Steiner’s (MBK 2014) report on their attempt to
repeat several BDCP water supply reliability modeling analyses done for the
Department of Water Resources (DWR 2015). Another example is a recent re-
analysis of San Diego County Water Authority proposals for a second Colorado
River Aqueduct (Elmer 2020). Some recent efforts have been made in the water
engineering profession to make replication testing of modeling and technical work
less onerous and more common (Stagge et al. 2019; Rosenberg and Watkins 2018).
Some comparisons are adversarial reviews intended for regulatory or court
proceedings or negotiations.
For long-term planning studies, such re-analyses often give substantially different
results, which is not surprising given the many assumptions and uncertainties
involved over long-term planning horizons. There is often a tendency to over-
interpret reasonable but substantial differences in results in adversarial
discussions, rather than using these differences as indications of inherent
uncertainties in the estimation problem and the wider range of contingencies that
should be prepared for.
Data and Model Codes Availability. Having documentation, data, and models
available are important aspects of quality control. These are necessary to directly
support other quality control processes (replicability, etc.) and to improve
understanding of water supply reliability results and their limitations.
Data availability in California is much better than elsewhere, with streamflow,
modeling and other data often being posted by some agency programs. California’s
Open and Transparent Water Data Act (AB 1755) has furthered these efforts. The
broader profession also has devoted some efforts to document and standardize
data and data management, which should speed new model development, as well
as testing and improvement of existing models and model results (Harou et al.
2010b; Rosenberg and Watkins 2018; Knox et al. 2019; Abdallah and Rosenberg
2019; Stagge et al. 2019).
Although publishing system model codes has not been common, it is becoming a
common expectation in California and elsewhere. The modeling software for
CalSim (as well as its input data sets) are often available from DWR. The newest
Python version of the CALVIN network optimization model for California is available

85
Review of Water Supply Reliability Estimation
Related to the Sacramento-San Joaquin Delta
on GitHub (Dogan et al. 2018). Elsewhere in the profession, a generalized water
resource network modelling Python library, Pywr, is now available (Tomlinson et al.
2020).
As indicated in Table 7, quality control for technical work has many facets,
especially for controversial public policy problems. Considerable progress is being
made in quality control for water supply reliability estimation in California, but
additional benefits for technical efficiency, understanding, and improved discourse
will result from further informal and organized efforts in this direction.
5.3: Common Basis for Water Supply Reliability Estimates
Various agency efforts have been made to support more of a common approach to
water supply reliability estimation. Some such efforts are discussed by Jackson
(2006, 2005). Several multi-agency efforts in California include:
1. The California Water and Environment Modeling Forum (CWEMF): The Forum
meets regularly in annual meetings and workshops to discuss modeling
advances and issues. The Forum fosters technical information exchange
among agencies, and has organized several modeling reviews for CalSim
(Ford et al. 2006; Close et al. 2004). It currently is finalizing modeling
guidelines (CWEMF 2021).
2. California’s DWR and the federal USBR: These two large state and federal
agencies jointly developed the largely open-source CalSim models used in
the SWP and CVP water projects. After 20 years, this model is on its third
basic revision. They have a joint effort, the CalSim Model Maintenance
Management (CM3) group, to coordinate development and documentation
of these models.
3. “Common assumptions” efforts: Following development of CalSim II, there
was a multi-agency (DWR and USBR) effort for several years that was staffed
by consultants, to standardize land use, inflows, groundwater modeling,
water demands, and portfolio characterization for modeling. Similar efforts
continue informally.
Other efforts to provide a common basis for modeling include:
1. Standard model test data sets: Algorithmic and historical test sets sometimes
are developed and used. Several professional efforts have sometimes been
proposed or utilized to improve quality control and documentation of water
supply reliability estimates.

86
Review of Water Supply Reliability Estimation
Related to the Sacramento-San Joaquin Delta
2. Separation of models from input and parameter data: This is a further
extension of the long-standing philosophy of CalSim of avoiding hard-coding
of operating parameters and rules as much as possible. Here, data for the
model is stored in separate explicit data bases, often including
documentation of the data (much like Draper et al. 2003 for CALVIN). This
can greatly improve model and data documentation and ease its
understandability and ability to upgrade.
3. Software-neutral modeling and data standards: These have been suggested
and developed to encourage development, testing, comparison, and
documentation of models (Knox et al. 2019; Tomlinsom et al. 2020).
4. Common water accounting: An example is the state of Colorado’s
maintenance of common water accounting across basins for models for
water right and water supply reliability (Escriva-Bou et al. 2020b).
5. Common efforts to estimate uncertainty: Uncertainty analysis is common in
water supply reliability estimation, particularly for seasonal (within-year)
operations. However, different agencies perform such analyses very
differently. More common efforts to estimate uncertainties in reliability
might be useful (MWDSC 2015; Hirsch 1978). In some cases, machine
learning methods might be helpful (Lingireddy and Brion 2005).
Integration of various models under a unified framework is a possibility, but would
be time consuming. Integration needs to be a parallel effort in conjunction with
ongoing water supply reliability estimates and modeling upgrades. Integration
requires expertise from multiple agencies. Integration itself may produce
uncertainties, and an evaluation of return on investment is needed.
5.4: Model Updating and System Learning
Modeling and analyses will need updating as water systems and problems change
in California. Classically (Hollings 1978), adaptive management is based on updating
models in an organized way to combine scientific efforts, management problems,
and solution development.
More transparent, science-based, collaborative, and open-source modeling will help
agencies, stakeholders, and the public be more aware of the intricacies, value, and
limitations of water supply reliability estimates (Sarofim et al. 2021). Such an
approach may help reduce litigation and better support healthy partnerships.
Building trust on the quality of water supply reliability estimates should support
science-based Delta management in the near-term and long run.

87
Review of Water Supply Reliability Estimation
Related to the Sacramento-San Joaquin Delta
6. Reliability Estimation in Decision-making
“The best-laid schemes of mice and men go often awry.” Robert
Burns 1785
Although water supply reliability estimation is broadly important for water planning
and operations in California, ideas of how to characterize and estimate water
supply reliability vary widely. Today it is easy to produce a plethora of numbers and
statistics on water supply reliability. It is a challenge institutionally and technically to
develop reliability estimates that are insightful for diverse policy-makers, managers,
and the public.
Several policy and management questions regarding water supply reliability arose
in the course of discussions and presentations for this report, with examples in Box
6. These illustrate the wide range of questions of concern. Formal water supply
reliability studies can be designed to formalize and answer such questions.
Box 6. Some Water Supply Reliability Questions Arising in the Course of this Review
• Could water quality reliability contracts between the State Water Project and various in-Delta
water agencies better coordinate in-Delta operations?
• How would a western Delta tunnel diversion location affect Delta export supply reliability?
• What is the reliability of attaining Delta water quality standards under various future and
management conditions and Delta water export levels?
• How is Delta water diversion reliability affected by various Shasta operations for winter-run
salmon?
• How do alternative out-of-Delta water supply and demand management portfolios affect the
frequencies of Delta water demands for various operating, environmental, and climate
conditions?
• How do various Delta salinity or fish barriers affect Delta water quality and diversion reliabilities?
• How can California climate change predictions be effectively incorporated into water supply
reliability estimation for the Delta?
• What are the implications of California’s Sustainable Groundwater Management Act (SGMA) for
water supply reliability estimates?

88
Review of Water Supply Reliability Estimation
Related to the Sacramento-San Joaquin Delta
6.1: Organizing the Problem and Solutions
Formal water supply reliability analysis can help structure and organize complex
and difficult technical problems for decision-making. Although the problems remain
difficult and complex, organizing them and providing decision-relevant analyses can
improve policy and management discussions and decisions. Conversely, poor
analysis can obscure and obfuscate problems and solutions (Rosenberg and
Madani 2014). Scientific and technical work is most effective when the analysis is
tailored to the decision-making problem and context. Decision-making also benefits
when the institutionalized decision process is tailored to employ scientific and
technical information that can be used to meaningfully compare likely outcomes of
alternative management strategies.
Formal water supply reliability estimation provides a rough common structure for
organizing problems and solutions. Many details, which involve technical and policy
assumptions for future conditions must be specified in each model component
representation. Some details are based on socio-economic models, designed to
maximize benefits. A range of detailed representations can be employed for any
system component, providing precision where needed to estimate likely system
behavior.
Water supply reliability analyses tend to be more useful when they have co-evolved
interactively with structured water management decision-making as is the case with
more routine operational decision-making. As operational decisions come to
include more environmental objectives, it will be important to adapt reliability
analyses to better represent these objectives.
Longer-term planning efforts (such as the Delta Plan
and the State Water Resources Control Board’s
Delta water quality planning) would benefit from a
more explicit common foundation for reliability
analyses in their broader deliberations, as it would
provide a more scientific structure for the
development, understanding, and evaluation of
solution alternatives.

89
Review of Water Supply Reliability Estimation
Related to the Sacramento-San Joaquin Delta
6.2: Short-term Operation Decisions
Short-term water supply decisions include water diversion, conveyance, storage,
and delivery operations. These decisions usually extend from daily to seasonal
(within-year) periods, and sometimes extend to limited multi-year planning
operations for ongoing or hypothetical droughts. Most short-term operating
decisions are routine procedures informed by recent experience and are agreed
upon in advance to represent regulatory requirements, daily and seasonal
fluctuations in demand, and hydrologic cycles. Both analysts and decision-makers
often use modeling estimates to refine and test different management ideas, based
on their expertise and experiences. Because the analysts and decision-making
users of model results have worked together for some time, they often have
adapted their work and deliberations to be mutually-informative.
Water supply reliability analyses for these short-term decisions commonly use
some variant of position analysis or other probabilistic representations of how
conditions could likely evolve (Figure 3) (Hirsch 1978; FitzHugh 2016). The results
embody many likely uncertainties explicitly, and contingencies for unusual
extremes are considered with various forms of sensitivity analysis and informed
professional judgement.
Sharing techniques and management results through routine reporting could help
decision-makers, regulators, and other stakeholders better understand and employ
these methods. Retrospective analyses could help refine operations, particularly
following extreme events. In addition, more rapid incorporation of short-term
forecasts and improved modeling techniques could improve operations for
multiple purposes (Nayak et al. 2018; Doering et al. 2021).
6.3: Long-term Planning and Policy Decisions
Decision-making over long time-frames have inherent modeling limitations and
must accommodate less accurate modeling forecasts. Although improvements in
model reliability may be gained through model refinement and data collection,
decisions will necessarily require choosing among options with less certain
outcomes. Several approaches to choosing options, despite performance
uncertainty, have been advanced. Most approaches are based on various
structured decision analysis methods (Keeney and Raiffa 1993), often based on
historical experiences, often represented as a range of events with probabilities.

90
Review of Water Supply Reliability Estimation
Related to the Sacramento-San Joaquin Delta
Several Delta problems have been organized and addressed with simple decision
analyses (Suddeth et al. 2010; Lund et al. 2010). For instance, Bayesian analyses use
historical data to update expectations of future change to estimate probabilities
and outcomes with changing conditions (Fletcher et al. 2019).
Some variants on this approach omit probability estimation to assess benefits and
contingent regrets under a wide range of future scenarios, while others aim to
reduce stranded assets (and sunk costs) by implementing management options in
stages that are triggered as risk increases (Marchau et al. 2019). Exploratory
sensitivity and robustness analyses of models under creative future scenarios also
can be insightful for long-term planning (Brown et al. 2013; Herman et al. 2020).
The discussions and structuring of problems needed for reliability analyses can be
more important to resolving policy problems than the numerical results of the
analyses. Poorly formulated models tend to solve the wrong problem.
6.4: Long-term Education and Insights for Policymakers
Well-crafted modeling analyses and studies have become important for educating
people involved in water management, and for preparing them for operational,
planning, and policy challenges. Decision-makers, policymakers, regulators,
stakeholders, operators, and modelers often lack deep background in the breadth
of water delivery and water management systems. Further, changes over time in
these systems and their problems makes it difficult for the many groups and
people involved in water management decisions to remain informed and explore
solutions.
Well-executed, documented, communicated, and available water supply reliability
studies all can help educate these groups and provide a more common
understanding and ability to communicate in policy and planning deliberations.
Complex analyses including Monte Carlo analyses are most directly useful to
decision makers if they are led to actionable advice, but they sometimes have
greater indirect value if they increase decision-makers’ understanding of problems,
vulnerabilities, and potential solutions. Modelers must do more than represent
system variability and interpret findings in terms of how systems and people will be
affected. For instance, risk levels can be characterized in terms of ability to manage
risk with contingency planning.

91
Review of Water Supply Reliability Estimation
Related to the Sacramento-San Joaquin Delta
Model and model result documentation should serve both detail-oriented
audiences (e.g., regulators and analysts interested in replicating and interpreting
results) and broader management and policy audiences, who need to easily
interpret and act on the policy implications. Documentation for policy makers will
need to communicate useful model results, and assure audiences that the
understanding and modeling of the system has been appropriately thorough.
Research and co-development can be used to design outputs and visual
interpretations of results (e.g., color-coded risk levels). More detailed
documentation should include all materials needed to replicate the analysis and
educate new policy-making staff and modelers.
When addressing uncertainty, it is tempting to include elaborate and complex
decision analyses. However, complex decision analyses and analyses at finer
geographic scales and shorter time steps are time-consuming to develop, hard to
interpret and trust, and subject to high error. Simple decision analyses are often
better for developing useful insights for managing a problem and serve as a
foundation for additional refinements. Complex analyses, when needed, are often
completed more quickly, rigorously, and insightfully when grown from simpler
analyses. Much can be learned from parsimonious models tailored for a specific set
of problems, but more complex problems and solutions often must be analyzed or
tested with advanced modeling.

92
Review of Water Supply Reliability Estimation
Related to the Sacramento-San Joaquin Delta
7. Conclusions and Moving Forward
Most large water systems in California have matured and adapted to include
integrated portfolios of water supply and demand management actions to improve
their performance. Estimating the reliability of such complex and often-
interconnected systems typically requires computer model representations of
interacting physical supplies, infrastructure, operations, institutional priorities and
regulations, and diverse human and environmental water demands that vary in
space and time. Expansion from water source reliability to estimation of integrated
water system performance reliability often involves a combination of technical and
fundamental performance objectives.
Water supply reliability estimation needs to be better incorporated into decision-
making processes. Improved documentation, model testing, multi-agency
modeling, and continuous adaptation would facilitate the application of such
modeling to decision-making.
Water supply reliability estimation in California and the Sacramento-San Joaquin
Delta will have to adapt to many changes including climate, human and ecosystem
water demands, infrastructure, environmental regulations, and probably a few
surprises. Water supply reliability estimates are vital to prepare, plan, and negotiate
for these changes, individually and collectively. These estimates must be done in
the context of California’s extreme and growing hydrologic variability, complex and
extensive infrastructure systems, changing water demands, and decentralized
institutions that bless and curse water management in California.
Many questions for estimating water supply reliability confront us today and many
new ones will emerge. Some examples are summarized in Boxes 6 and 7. It
behooves California to strengthen its comparatively strong capabilities to estimate
water supply reliability and to integrate such analyses into its dynamic and evolving
systems of policy- and decision-making.

93
Review of Water Supply Reliability Estimation
Related to the Sacramento-San Joaquin Delta
Box 7. Some Common Questions on Water Supply Reliability
Is there potential for long-term seasonal and multi-year forecasting?
Short-term forecasts of a few days often provide the greatest improvements in performance, with longer
forecasts generally providing diminishing increments of improvement (Doering et al. 2021). Longer-term
forecasts also usually tend to be less accurate. In most of California, precipitation forecasts beyond about two
weeks are generally show little predictive skill beyond that of historical climate statistics. Long-term seasonal
and multi-year forecasts are usually much less accurate than short-term weather forecasts. Seasonal and
multi-year weather patterns for some parts of the world do seem correlated with ocean conditions
(Chikamoto et al. 2020). For southern California, annual precipitation is mildly correlated with ENSO ocean
conditions (Schonher and Nicholson 1989). Long-term forecast accuracy faces a fundamental problem of the
chaotic nature of most weather forecasting (Lorenz 1993, Slingo and Palmer 2011; Cao et al. 2021). All
forecasts are imperfect, with potential to mislead and distract, as well as to provide management insights. For
the foreseeable future, historical records, perhaps modified statistically to account for a range of climate
change estimates, appear to be the most promising basis for developing forecast scenarios.
Does the export or import of water-intensive products affect water supply reliability?
The fate of products produced using water is usually not included in estimates of water supply reliability.
”Virtual water” is the water use embodied in goods which are traded across borders, and is a rough indicator
of the amount of water used goods which are exported and imported. The production of water-intensive
products does affect water supply reliability, although their export can provide greater economic advantages
than producing other products using an equivalent amount of water, particularly in poor rural areas. For
economic prosperity in a non-subsistence economy, the economic value of goods produced using water is the
same if they are exported or consumed locally (Pfister et al. 2009; Wichelns 2010; Neubert 2008).
How does water storage expansion affect water supply reliability?
Having additional water storage capacity usually requires some, often large, costs for construction,
operations, permitting, etc. The additional water supply reliability from these investments varies considerably
with the availability of water to fill that capacity, and the conveyance capacities and costs to move water into
and out of the storage location to serve water demands. Additional water storage capacity theoretically
improves water supply reliability, but not always enough to justify the necessary investment (Hazen 1914;
Arnold 2021).
What is the potential for artificial recharge of flood waters for improving water supply reliability?
The recharge of flood waters to aquifers is perhaps the most popular solution for eliminating overdraft in
California’s groundwater basins. Several analyses of this source have found that it has some value for this
purpose, but that it is unlikely to be able to eliminate most groundwater overdraft in most groundwater
basins in California (Alam et al. 2020; Escriva-Bou and Hanak 2018; DWR 2018). Flood waters in California are
infrequent, hard to capture, and tend to occur in locations far from areas with the greatest groundwater
overdraft.

94
Review of Water Supply Reliability Estimation
Related to the Sacramento-San Joaquin Delta
Appendix A. Some Technical Issues in Estimating Water Supply
Reliability
This appendix briefly reviews approaches for representing hydrology, human water
demands, time, and decision-making in water supply reliability analysis. The
appendix also summarizes approaches to uncertainty analysis in estimating water
supply reliability.
A.1: Representing Hydrology in Estimating Water Supply Reliability
Hydrology is the most commonly explored proximate cause of unreliability in water
systems. Several approaches are used to representing hydrologic uncertainty and
variability in water supply reliability studies.
Future water availability estimates are based on historical records and/or different
climate models as summarized in Table 9.
Climate models generally have a course geographic resolution, with results based
on a particular global emissions scenario. These coarse spatial results must be
downscaled, by one of several approaches, to produce regional and local
precipitation and temperature results. These local results are then input into
models for estimating stream runoff and groundwater infiltration from
precipitation, sometimes with climate-dependent vegetation and land cover. High
resolution multi-ensemble models coupled with innovative downscaling techniques
to high space-time frequency hydrologic projections can characterize the range and
probabilities of future climate results (Pagán et al. 2016; Grantham et al. 2018). Yet
high resolution and large ensembles without better process understanding might
not be more accurate.
Traditional delivery capabilities reports from the California Department of Water
Resources are updated every two years (DWR 2020). Climate change scenarios are
being introduced into these studies, having importance for long-term planning.
Climate change is affecting current seasonal operations, due to warmer
temperatures at least. There is some discussion, and a variety of approaches, on
how historical hydrologic flow estimates might be adjusted for observed and likely
changes in climate. Long term planning (e.g., decadal) should incorporate the range
of reasonable projections of climate change, with consideration that these
projections are themselves uncertain. Current seasonal operation plans and

95
Review of Water Supply Reliability Estimation
Related to the Sacramento-San Joaquin Delta
policies might benefit from adjusting historical climate estimates for recent changes
in climate (Lund 2021).
Several approaches to representing hydrologic extremes and variability are
summarized in Table 9 and discussed below.
Table 9. Common approaches to representing hydrology for water supply reliability
studies
Approach Description
For Current Studies
Design drought A specific extreme drought hydrology is used.
Historical unimpaired
flows
Hydrologic flows are developed from historical records,
often with considerable estimation to fill and correct gaps.
Re-sequenced historical
flows
Historical flows are re-sampled to create longer synthetic
flow records which can include more severe extreme
conditions.
Statistically synthesized
streamflows
Statistical characteristics of historical flows (means,
variance, correlations) are used to create multiple longer
representative flow time series.
Broad range of scenarios A wide range of design droughts, developed to represent a
wider range and types of extreme events.
Hydrologic forecasts Statistical or mechanistic estimates of future flows.
For Climate Change Studies
Paleohydrology Paleohydrologic observations are used to estimate
hydrology.
Climate model
precipitation and runoff
Local hydrologies developed by downscaling climate model
results and running through precipitation-runoff models.
Continuous adjustment
of historical flows
Historical streamflows are adjusted to reflect major
statistical shifts seen from aggregate climate change
models.
Parametric climate
representation
Essentially inverse-scenarios, increasing climate change
characteristics (temperature, seasonal shift, extreme
events) until system performance suffers.
“Design drought” – Many water supply systems evaluate their system
infrastructure and operations based on a repeat of the most severe drought of
record, akin to “firm yield” analysis (Linsley et al. 1992). Many urban areas use

96
Review of Water Supply Reliability Estimation
Related to the Sacramento-San Joaquin Delta
design droughts as specified in state law for Urban Water Management Plans,
mandated for all large urban water suppliers. East Bay Municipal Utility District
(EBMUD) has developed a drought somewhat more severe than that seen
historically to assess the ability of their system to weather severe droughts. The
EBMUD design drought is a three-year sequence where the first and second years
have runoff from years 1976 and 1977 (the driest two-years on record), plus a third
year with the average runoff from these two years (EBMUD 2021).
Historical unimpaired flows – In California, most large water supply systems use
estimates of historical unimpaired streamflows (and sometimes groundwater
inflows) in evaluating water supply reliability. DWR’s series of water delivery
capability reports (since 2002) mostly takes this approach (DWR 2017, 2020). In
early times, such analyses were used to identify system “firm yield” deliveries.
Today, most analyses develop water delivery-reliability distributions and curves
(Hirsch 1978). DWR has an extensive and formal hydrology development process to
adjust historical records for changes in land and water use upstream. Such
accretions/depletion adjustments have been developed by DWR-USBR more than
50 years ago as their basis for planning and operation models (DWR 2016). Recent
work further refines the calibration of historical unimpaired flows and allows better
statistical characterization of likely statistical errors in these flows (Kadir 2017).
Re-sequenced historical flows – Resequencing historical streamflows by varying
the starting year or by bootstrapping can, in principle, produce larger statistically
representative samples of streamflows that include more extreme events (Tasker
and Dunne 1997). Because the historical streamflow record represents only one
realization of the many sequences that could occur in the future, MWDSC has used
more of combinatorial approach that develops additional hydrologic time series,
with each time series beginning in one year from the hydrologic record, followed by
the remaining years of record, followed abruptly by the earlier years of record
before the starting year (MWDSC 2010; 2015). Santa Clara Valley Water District also
had employed a similar approach (SCVWD 2003). This allowed MWDSC and SCVWD
to statistically include drought periods more extreme than experienced historically
in its water supply reliability estimates. This is probably the most sophisticated
routine representation of hydrologic variability in water supply reliability analysis by
a California water agency.

97
Review of Water Supply Reliability Estimation
Related to the Sacramento-San Joaquin Delta
Statistically synthesized streamflows – Hydrologic records are often short and
under-represent the range of extreme events that water supply systems need to be
prepared for. A large literature exists on statistical methods that use local and
regional hydrologic observations to develop and calibrate stochastic models for
generating large ensembles of long statistically representative scenarios of
streamflows or other hydrologic conditions (Tasker and Dunne 1997; Hirsch 1979;
Lamontagne 2017).
Broad range of scenarios – Another approach to representing a broader range of
hydrologic scenarios than have been experienced historically is to rely on a broader
but less statistically careful range of hydrologic events, generated by various
means. MWDSC also uses this approach, which has value for stress testing system
operations under a wide range of plausible, but not statistically representative,
conditions (Herman et al. 2016; MWDSC 2010).
Hydrologic forecasts – Forecast inflows using a combination of NWS, CNRFC, DWR,
and other forecasts, and modified historical streamflows are commonly used by
local, state, and federal water projects for near-term and seasonal operational
reliability analyses. “Position analysis” or similar “spaghetti curve” analyses are
commonly fed hydrologically with such inflows (Hirsch 1978; Tasker and Dunne
1997; DWR Bulletin 120, FitzHugh 2016). These often use model-based weather
forecasts for a few weeks of foresight and then transition to historical hydrologic
estimates (Cao et al. 2021).
A.2: Climate Change and Hydrology
Several decades of many modeling studies almost all agree that California will see
higher temperatures, but among the many models, there is a considerable range of
results in how much and how fast temperatures will increase, as shown in Figure
10, even for one emissions scenario. California should prepare for a warmer
climate with less snow, more rain, and less snowpack, shifting runoff from spring
and summer to winter. This seasonal runoff shift can be seen in the hydrologic
record in recent decades (Aguado et al. 1992). Higher temperatures also are
increasing watershed evapotranspiration, which reduces the amount of rain and
snow precipitation which becomes streamflow or aquifer recharge (Albano et al.
2022).

98
Review of Water Supply Reliability Estimation
Related to the Sacramento-San Joaquin Delta
Figure 10. California becomes warmer in all of 43 global climate models with moderate greenhouse gas emissions
(IPCC CMIP 6).

99
Review of Water Supply Reliability Estimation
Related to the Sacramento-San Joaquin Delta
There is less modeling consensus on future changes in overall precipitation. For some parts of the world, the
consensus of global climate models shows decreasing or increasing overall precipitation. This is not clear for
California, as seen in Figure 11. However, the many models of California’s future climate do show an increase in
precipitation variability, with bigger flood events and deeper droughts (Swain et al. 2020, 2018).
Figure 11. Lack of clear average precipitation trend for California from 33 models with modest warming (IPCC CMIP 6
global precipitation) .

100
Review of Water Supply Reliability Estimation
Related to the Sacramento-San Joaquin Delta
Four approaches have been taken to represent changes in future climate in water
supply reliability studies:
Paleohydrology – Several studies have employed representations of severe,
prolonged distant past droughts for water supply reliability analysis (Harou et al.
2010a; Woodhouse and Lukas 2006). These paleorecords are usually based on tree-
ring studies or records of distant past lake levels and sediments (Adams et al. 2015;
Meko et al. 2001; Stine 1994).
Climate model precipitation and runoff – Sometimes hydrologic inflows for
water supply analyses are taken from one or more sequential climate change and
hydrologic models. This process introduces several sources of uncertainty from the
selection and use of:
a) Particular global circulation models
b) Greenhouse gas emission scenarios
c) Bias correction method used to post-process global climate model results,
d) downscaling method used to take coarser climate model results to finer
scales needed for water resource studies
e) Hydrologic, snowmelt, and groundwater models needed to develop
streamflow and aquifer inflows from precipitation, temperature, and other
climate conditions.
These methods are resource-intensive and produce compounded uncertainties
which are rarely explored (Mehta et al. 2013; Joyce et al. 2011).
Climate change adjusted historical inflows – Historical inflows are commonly
adjusted to match statistical differences with climate change hydrologic outputs
from paired climate change and hydrologic models, usually representing changes in
seasonal shifts in flow means and variance. This approach better preserves
observed spatial and temporal auto-correlations in streamflow and experienced
hydrologic persistence in extremes, but also can be limiting in these regards (Zhu et
al., 2005; Willis et al. 2011; DWR 2018b, 2019; Lund 2021; Aguado et al. 1992).
Continuous adjustment of historical flows – To represent the likely future
evolution of streamflow or conditions with climate change, some authors have
represented climate change as a continuous change in the mean and standard
deviation of historical conditions or streamflow (Hui et al. 2018). This can efficiently
summarize the effects of climate change without more awkward and

101
Review of Water Supply Reliability Estimation
Related to the Sacramento-San Joaquin Delta
computationally burdensome use of an ensemble of GCM and derivative results,
but limits climate change to a few statistical parameters.
Parametric climate representation – Because climate change is uncertain, it can
be insightful to represent major aspects of climate in a few parameters, and then
systematically change the parameter values to assess the vulnerability and
responses of the water system under a range of conditions. Several such studies for
water supply systems have been done in California (Kiparsky et al. 2014; Willis et al.
2011).
A more systematic version of this approach, sometimes called “Decision-scaling”
where the performance of particular decisions is assessed to identify the scale of
climate and other changes under which a system or decision performs well (Brown
et al. 2012; Albano et al. 2021; DWR 2018b, 2019). This is essentially an inverse-
scenario approach that requires generating fewer, but smarter, scenarios to assess
system performance.
The representation of potential climate changes into the future can be as a single
climate change scenario, fixed weighted multiple climate change scenarios, or
multiple scenarios with Bayesian updating of their probabilities. Of these, the
examination of a single scenario has been most common, and has shown many
consistent impacts and insights for policy and management. Recently, reliability
results for multiple scenarios have become more common, and better shows where
and how reliability results and policies might diverge with future climate.
Over time, observations of changes in climate might narrow the scattering of
potential climate futures produced today, and could help in updating water
management plans, infrastructure decisions, and policies. Two recent papers have
examined the use of Bayes’ Theorem to update probabilities of climate scenarios
for the future based on future climate observations, and integrated these
calculations into reliability optimization studies for long-term water infrastructure
(Fletcher et al. 2019; Hui et al. 2018).
A.3: Representing Human Water Demands
Representing humans and their water use decisions is important in water supply
reliability estimations and analyses (Madani and Shafiee-Jood 2020). Several
approaches are summarized in Table 10 and discussed below.

102
Review of Water Supply Reliability Estimation
Related to the Sacramento-San Joaquin Delta
Table 10. Approaches to representing human water demands for water reliability
studies.
Approach Description
Delivery targets Fixed desired water deliver volumes, often varying in time
Water demand curves Economic values of delivered water, often varying in time to
better represent the variable values of water delivery
Uncertainties in water
demands
Probabilistic or multiple scenario variations on water delivery
targets or economic values of delivered water
Climate change and
water demands
Modifications of water delivery targets or economic values
for changed climate conditions
Delivery targets – Classically, water supply reliability analyses represent water
demands as target delivery quantities. These will often vary by month (and
sometimes by smaller time-steps) and sometimes vary by year-type (dry versus
wetter years). Small and large failure to be able to provide these target deliveries
are all counted as equally unreliable.
Water demand curves – However, because different amounts of water shortage
incur different levels of economic or other losses, economists and engineers have
long suggested the use of economic demand curves (Dupuit 1853; Howe and Smith
1994; Harou et al. 2009). Water demand curves often vary seasonally (sometimes
with time of day and sometimes by year-type). In modeling, they are often recast as
economically-based penalty functions with growing amounts of shortage resulting
in greater economic losses.
Uncertainties in water demands – Most representations of water demands in
water supply reliability analyses are fixed deterministic. However, particularly in
planning time frames, water demands often have considerable uncertainty
(Whitford 1972). Sometimes these uncertainties are represented as an ensemble of
equally-probable water delivery targets, or potentially as an ensemble of equally-
probable water demand curves. San Diego County Water Authority has taken this
approach in planning (Kiefer and Porter 2000).
Climate change and water demands – Climate change will affect water demands
as well as water availability, particularly for agriculture. Higher temperatures
increase evaporation and evapotranspiration rates, and will lengthen growing
seasons in some areas, increasing water use, but also decrease the time needed for

103
Review of Water Supply Reliability Estimation
Related to the Sacramento-San Joaquin Delta
crops to mature, potentially decreasing irrigation water demands. Higher carbon
dioxide concentrations also are likely to affect crop maturity, yields, and selection
(Pathak and Stoddard 2018; Pathak et al. 2018; Lee et al. 2011; Lobell et al. 2007).
Climate impacts on water use and demands might differ between annual and
perennial crops.
A.4: Representing Time
Static future conditions – Most water supply analyses estimate reliability for a
particular slice of time, present or future, usually representing water demands
expected for a specified time in the future. So, it is common for studies estimating
reliability for estimated 2020, 2040, 2050, or 2100 conditions, often referred as a
future “level of development.” The system simulation model then examines these
estimated future conditions using historical or other hydrologies to estimate the
probability distributions of water deliveries for these future conditions.
Continuous simulation – A more elaborate and time-consuming representation of
time estimates reliability in each year from the present into the future. This is done
by running a system simulation model many times using randomly estimated
hydrologic, water demand, and other operating conditions, including how these
conditions are thought to change into the future. This requires characterizing the
randomness in hydrology/climate, water demands, and other important reliability
factors, and how this randomness changes with time. This approach is essentially
the “plotting position” approach, common for seasonal water supply reliability
analysis, applied to longer-term planning (Hirsch 1978). These results become
harder to generate and explain, and can introduce new spurious sources of error.
The Bayesian approached described above are a more sophisticated form of
continuous modeling (simulation or optimization) (Fletcher et al. 2019; Hui et al.
2018).
A.4.1: Representing Decision-making
System modeling for water supply reliability also requires representation of
operational decisions over the course of hydrologic events. These include reservoir
releases, water rights administration and curtailments, implementation of drought
water conservation actions, changes in crop mix, groundwater recharge, and other
decisions that affect the portfolio of management activities available for the water
system. Because these operating decisions usually vary each year with hydrologic,

104
Review of Water Supply Reliability Estimation
Related to the Sacramento-San Joaquin Delta
water demand, and other conditions, some representation of decision-making must
be included in system models. Several approaches are common.
Some models represent operating decisions during their simulations with a series
of rules, representing established or expected policies for operating each element
of water management portfolios included in the model over the range of hydrologic
and other conditions. Such fixed operating rules could include reservoir releases as
a function of water stored in the reservoir, groundwater pumping as a function of
the difference between water demands and surface water availability, or the
implementation of water conservation actions based on the amount of water
stored in reservoirs. Although there is a vast and insightful literature on water
system operating rules (Macian-Sorribes and Pulido-Velazques 2019), such rules
can prove inflexible and difficult to adapt to new conditions, such as climate
change.
More recent water supply simulation models embed an optimization algorithm that
makes such operational decisions based on prioritized technical objectives, such as
implementation of seniority-based water rights or contractual obligations, within
capacity, water availability, and other constraints. This approach is much more
flexible and adaptable, and usually easier to implement in software, than direct
rule-based simulations. CalSim, WEAP, and many other contemporary water system
simulation models take this priority optimization approach, which is usually
implemented for each time-step individually (including New York City’s Operation
Support Tool (NASEM 2018, using OASIS software) and ModSIM (CSU 2017).
A third approach to representing decision-making is explicit optimization of
technical or fundamental objectives, within constraints (Lefkoff and Kendall 1996).
Some such models minimize overall economic costs (or maximize overall economic
value) within other physical and policy constraints. Optimization-based operations
are the most flexible and adaptable operations for scenarios which diverge from
current operating experiences, but can be over-optimistic in terms of actual
decisions made (Harou et al. 2009; Tanaka et al. 2006).
A fourth approach, sometimes used in decision-making exercises, is to have actual
or surrogate human decision-makers make decisions during each time step, or at
crucial time-steps (say, during drought) (Werick et al. 1994). This can help decision-
makers think through decisions in a simulated context. Although this is perhaps the
most adaptable way to represent decision-making in system models, model run-

105
Review of Water Supply Reliability Estimation
Related to the Sacramento-San Joaquin Delta
times are much slower when humans must make decisions, greatly restricting the
range of conditions which can be examined in this way. It is also possible, and
perhaps likely, that human decision-makers would make different decisions if
presented with the same conditions a second time, perhaps reducing the
replicability and transparency of the modeling results. Although this approach is
rarely used, and even more rarely documented, it can be useful for integrating
modeling and decision-making.
Sometimes hybrid approaches are used to represent decision-making. There is no
perfect representation of decision-making in system modeling.

106
Review of Water Supply Reliability Estimation
Related to the Sacramento-San Joaquin Delta
Appendix B. Questionnaire Responses and Interviews
To help inform its review of water supply reliability estimation (see prospectus) the
Delta ISB released a questionnaire to survey applications and issues with water
supply reliability estimation and to develop an inventory of water supply reliability
estimation efforts. The board also conducted a series of 30-minute interviews with
multiple practitioners of water supply reliability estimation.
The questionnaire was released to the e-mailing lists of the California Water
Environmental Modeling Forum and California Water Quality Monitoring Council on
December 13, 2018, the California Water Plan eNews on December 19, 2018, and
the Integrated Modeling Steering Committee on December 21, 2018, and the Delta
Stewardship Council on December 31, 2018.
Responses to the questionnaire that were received through January 25, 2019, are
compiled and analyzed in appendix sections, B.1 and B.2. Section B.1 is a summary
of data from completed questionnaires. The section consists of two parts. Part 1
lists the organizations of the individuals who responded to the questionnaire and
compiles responses to questions about applications of and issues with water
supply reliability estimation. Part 2 inventories water supply reliability estimation
efforts. Section B.2 presents an analysis of the responses in Section B.1. It includes
discussions of potential bias in the responses to the questions caused by the small
sample size.
Section B.3 summarizes responses to interviews conducted after the workshop on
September 13, 2019, by Delta ISB members with a diverse variety of practitioners.
Interviewees were asked the same set of questions and responses are compiled
without attribution.
B.1: Data Summary
B.1.1 (Part 1): Applications and Issues with Water Supply Reliability Estimation
Twenty-two individuals responded to the questionnaire from a range of
organizations:
● Berkeley National Laboratory
● California Department of Water Resources (DWR; N=3)
● Central Delta Water Agency
● California Water Research

107
Review of Water Supply Reliability Estimation
Related to the Sacramento-San Joaquin Delta
● East Bay Municipal Utility District
● GEI Consultants
● Metropolitan Water District of Southern California
● MBK Engineers
● North Delta Water Agency
● One-Water Hydrologic
● San Francisco Bay Chapter of the Sierra Club
● Santa Clara Valley Water District
● Stantec
● State Water Resources Control Board (SWRCB; N=2)
● Watercourse Engineering, Inc.
● Westlands Water District
● United States Geological Survey (USGS)
● UC Davis
● UC Merced
Individuals were not asked to respond on behalf of their organizations. The
respondent’s length of involvement with water supply reliability estimation is
documented in the figure below.
All responses are included, and no edits were made to the responses.

108
Review of Water Supply Reliability Estimation
Related to the Sacramento-San Joaquin Delta
1. In general, are water supply reliability estimates and studies done in a rigorous
technical way (N=17)?
Respondent
#
Response (Please Explain) Rating
1 Reported results are useful, but often incomparable
due to lack of standardization. Still, even variable
results give a hint of how actual results can vary from
those estimated.
Somewhat
2 Difficult to accommodate the multiple uses of water
when assessing reliability. A few challenges include (a)
reliability is measured/defined differently among uses
(finding a common metric can be difficult) or objectives,
(b) reliability can (and probably should) change with
space and time, (c) there is often no common "rigorous
technical" methodology or approach to estimate or
study reliability.
Somewhat
3 That depends on the group that is doing and the level
of funding.
Somewhat

109
Review of Water Supply Reliability Estimation
Related to the Sacramento-San Joaquin Delta
Respondent
#
Response (Please Explain) Rating
6 There is a long history of monthly forecasts, which
become more reliable as the wet season progresses.
Future precipitation and snow from the time of forecast
are highly variable but this becomes a smaller factor as
the wet season progresses.
Yes
8 Delta consumptive use estimates could be refined by
actual land use and satellite technology
Somewhat
9 We use a linear programming-based model to portray
operations, supplies, and demands on a monthly
timestep. We run a range of scenarios to understand
uncertainty.
Yes
10 There are wide range of methods employed to estimate
water supply reliability because term “reliability” can
have different meanings based on the perspective of
the water user. In general, these studies are very
important for organizations that deliver water because
if demands are not met there can be large costs
incurred, the scientific basis for the Bay-Delta Plan
amendments as well as the tools used to estimate
water supply reliability go through peer review.
Yes
13 Subjectivity and professional judgment are required to
interpret Level of Development / demand data and
simulating operational decision rationales. Consistent
published estimates would help (common assumptions
framework, etc.)
Somewhat
15 There are uncertainties in the estimates of available
water in the surface, actual water demand from
agriculture and cities and environment and also water
allocation decisions.
Somewhat
16 Typically, based on simulation models of water
resources that explore reliability under a range if
hydrologic conditions.
Somewhat

110
Review of Water Supply Reliability Estimation
Related to the Sacramento-San Joaquin Delta
Respondent
#
Response (Please Explain) Rating
17 Fairly comprehensive integration across many different
departments and divisions, intensive technical
components to understand demand and project
demand as well as raw water system modeling of
supplies and infrastructure components with
regulatory and contractual constraints. Typically
includes additional sensitivity analysis of key
components to understand their effect on the outcome
and develop a manageable range of likely outcomes.
Yes
18 CalSim 2 provided "big picture" estimates. Somewhat
19 These are all computer models Yes
20 Integrating regional or statewide data into a trend
analysis for the basins supplying a particular water
agency is a broad-brush approach but probably
suitable for a 20- 40- or 60-year planning horizon.
No
21 More detail needed as is being developed in CVHM-2 Somewhat
22 There have been some significant recent improvements
in analysis of shifts in hydrology due to climate change
and drought impacts. But the lack of validation of the
CalSim modeling of reservoir operations remains a
major issue for all reliability studies with the model.
Calibration data and error estimates for the model are
also unavailable. The impacts of high sea level rise due
to accelerated disintegration of the polar ice sheets
have also not been considered and will have major
impacts on the SWP and CVP.
Somewhat

111
Review of Water Supply Reliability Estimation
Related to the Sacramento-San Joaquin Delta
2. In general, are reliability estimates sufficiently understood, communicated to,
and applied by managers and decision-makers (N=17)?
Respondent
#
Response (Please Explain/How Can
Communication be Improved?)
Rating
1 Reliability results are probably taken too seriously by
negotiators taking their numbers too seriously. Some
standardization and more interpretation might be
helpful.
Somewhat
2 Same reason as above. Item (c), above would be a
place to start.
Somewhat
3 More engagement with stakeholders and general
public
Somewhat
5 Improved visualization as aid to understanding Somewhat
6 Provide opportunities for forecasters and users to
huddle and review how things went at the end of the
season; also make sure of access of users to
forecasters, via telephone and computer.
Yes
7 Requirement of Monterrey agreement that results are
easily understandable. However, other groups use
results beyond intention of studies.
Yes

112
Review of Water Supply Reliability Estimation
Related to the Sacramento-San Joaquin Delta
Respondent
#
Response (Please Explain/How Can
Communication be Improved?)
Rating
9 It can be difficult to clearly explain study results,
especially when they have interest groups making
contradictory claims or a misunderstanding of the
background science or data.
Somewhat
10 The term “reliability” can have different meanings to
different people. I think a clear definition of the goal of
“increasing water supply reliability” would be helpful.
Somewhat
11 Understanding among decision-makers varies
significantly. Some decision makers with the most
decision making power have the least understanding
and this has led to wrong decisions.
Somewhat
13 Need to develop linguistic proficiency in reliability
concepts for both analysts and decision-makers so that
reliability concepts can be understood in terms of
effective tradeoffs, more so than just exceedance plots.
Somewhat
14 Water supply estimates provided to the SWRCB and
other State agencies are skewed to only identify
impacts to SWP and CVP water users and omit/ignore
the impacts to in-Delta water rights holders or other
beneficial uses such as habitat projects and other
environmental purposes.
No
15 Most managers would understand probabilities for
water shortage yet tradeoffs associated with these
shortages and system operation decisions may use
some improvements.
Somewhat
16 Better communication of limitations of models Somewhat

113
Review of Water Supply Reliability Estimation
Related to the Sacramento-San Joaquin Delta
Respondent
#
Response (Please Explain/How Can
Communication be Improved?)
Rating
17 Formal planning studies are completed every 5 years
as part of the update process. Estimates are revisited
frequently-at least annually-and assumptions or
possible portfolio changes are constantly revisited,
revised, and reanalyzed. Due to close coordination
between technical staff and management/decision
makers, there is a good flow of communication and
good understanding on both sides with respect to
reliability outcomes and context of the estimates
provided. The challenge sometimes is scenario
management or prioritizing scenarios where there are
multiple-often competing-objectives as well as working
through assumptions in planning study design to avoid
arriving at unrealistic or infeasible outcomes through
compounded "conservative" assumptions. Sometimes
dual time bases that is a feature of the fixed level-of-
development approach can be a source of confusion
for new managers or stakeholders not familiar with the
approach.
Yes
19 I think communication can be improved by creating a
clearinghouse (webpage) for estimates.
Yes
20 Water agency managers tend to follow what
consultants advise and consultants and managers tend
to repeat past practices to minimize change and avoid
"selling" new ideas or solutions. Water agencies should
be "ordered" to focus on managing demand rather
than planning to increase supply by draining ever more
from streams, rivers, deltas and bays. Increasing the
salinity of coastal shores is also not the best solution.
No
21 Use estimates beyond those developed by DWR Somewhat
22 Limitations of the estimates need to be clearly
understood and communicated.
Somewhat

114
Review of Water Supply Reliability Estimation
Related to the Sacramento-San Joaquin Delta
3. In general, are water supply reliability estimates and studies employed in policy
and management discussions and decisions (N=17)?
Respondent # Response (Please Explain) Rating
1 So I hear. Yes
2 The overall answer is yes. However, they are often
incomplete because of challenges listed above. (I
guess I could answer "see question 1" to all these
questions...I will try to do better below).
Somewhat
6 We do provide a range of outlooks, basically median
and 90 and 10 percent likely.
Yes
7 Used in Urban Water Management Plans. Yes
9 Management and the Board of Directors listens to
the results of the water supply modeling.
Yes
13 Water supply reliability has been a central metric for
the SWRCB Bay-Delta Basin Plan revision SED
impacts analysis.
Yes

115
Review of Water Supply Reliability Estimation
Related to the Sacramento-San Joaquin Delta
Respondent # Response (Please Explain) Rating
14 Studies presented to State agencies (WaterFix EIR,
CVP/SWP water rights petition, drought plans, etc)
appear to only analyze water supply impacts to
CVP/SWP water contractor or whether D-1641
standards are being met and modeling conducted
ignores whether the the year-round and daily
variations in salinity levels affect agricultural or other
water users in the Delta.
No
15 It is my impression that water districts and utilities
follow water management plans that indicate the
procedure to follow in the event of water shortages.
However, it is also my understanding that water
curtailments at the state level during droughts would
use some improvements.
Yes
16 Not responsible for policy-level decisions within
water agencies.
Don’t Know
17 Water supply reliability is one of a handful of core
duties that integrate a lot of internal and external
information. Conditions are always changing, such as
new partnerships or new regulatory requirements
that were not anticipated a few years ago and there
is always interest at management and policy levels to
understand how these changes affect the water
supply picture. These analyses are used to inform
further action, advocacy, and/or significant
investments.
Yes
19 see #5 Yes
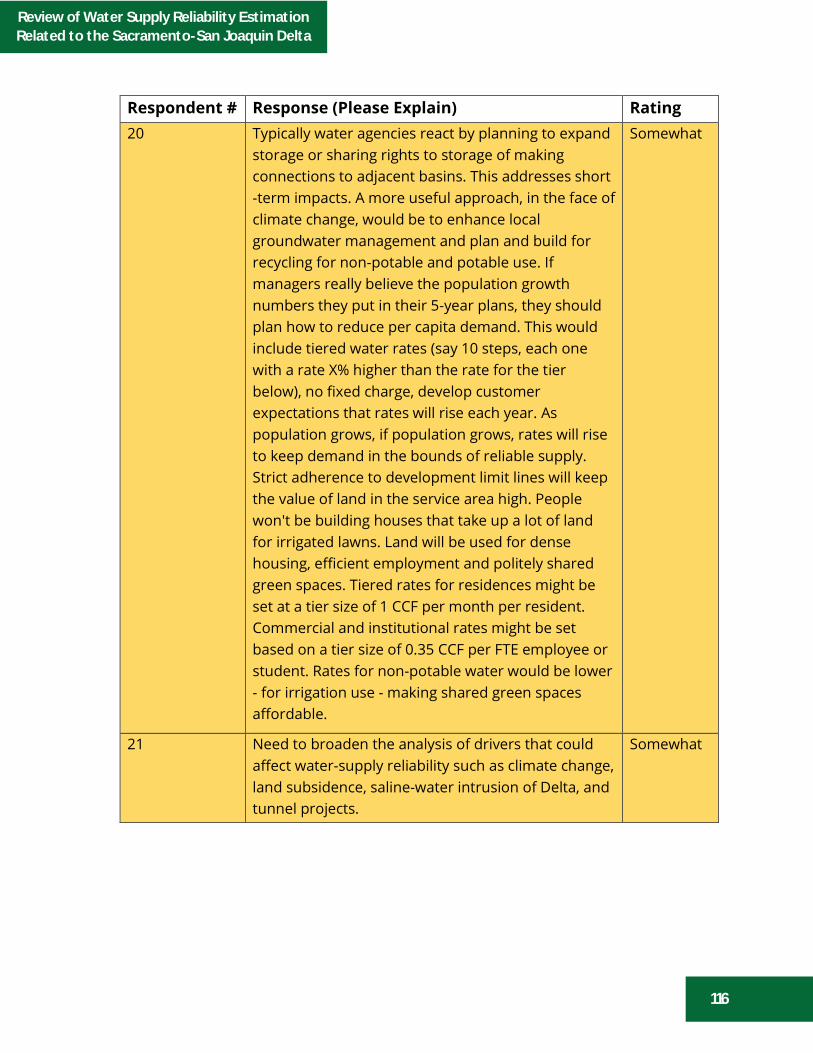
116
Review of Water Supply Reliability Estimation
Related to the Sacramento-San Joaquin Delta
Respondent # Response (Please Explain) Rating
20 Typically water agencies react by planning to expand
storage or sharing rights to storage of making
connections to adjacent basins. This addresses short
-term impacts. A more useful approach, in the face of
climate change, would be to enhance local
groundwater management and plan and build for
recycling for non-potable and potable use. If
managers really believe the population growth
numbers they put in their 5-year plans, they should
plan how to reduce per capita demand. This would
include tiered water rates (say 10 steps, each one
with a rate X% higher than the rate for the tier
below), no fixed charge, develop customer
expectations that rates will rise each year. As
population grows, if population grows, rates will rise
to keep demand in the bounds of reliable supply.
Strict adherence to development limit lines will keep
the value of land in the service area high. People
won't be building houses that take up a lot of land
for irrigated lawns. Land will be used for dense
housing, efficient employment and politely shared
green spaces. Tiered rates for residences might be
set at a tier size of 1 CCF per month per resident.
Commercial and institutional rates might be set
based on a tier size of 0.35 CCF per FTE employee or
student. Rates for non-potable water would be lower
- for irrigation use - making shared green spaces
affordable.
Somewhat
21 Need to broaden the analysis of drivers that could
affect water-supply reliability such as climate change,
land subsidence, saline-water intrusion of Delta, and
tunnel projects.
Somewhat

117
Review of Water Supply Reliability Estimation
Related to the Sacramento-San Joaquin Delta
4. What major technical and application problems and uncertainties do you see in
water supply reliability estimation that limit their utility for management and
decision-making?
Respondent # Response
1 Non-standardized or absent documentation and reporting of
model inputs; lack of explicit model testing and error analysis.
2 Technical/application:
● information availability
● coordination/communication
● transparency
● Buy-in. I mean real buy-in, where entities are not just going
through the motions, but have some real commitment to
the outcome and to making clear progress.
3 Lack of consistent approach, lack of open and accessible data, lack
of trust in data and methods among stakeholders.
5 Increased frequency of catastrophic events creates a new "normal"
and can throw off reliability estimation activities.
6 Raw input variable access, including mountain wilderness areas;
data sharing between a multitude of users and forecasters.
7 Water supply reliability estimates are used for different purposes
with different assumptions. Communicating those
assumptions/purposes of the different applications would help in
understanding the larger picture. This workshop hopefully will
provide a way to do that. It doesn't necessarily mean that one
method is wrong or better than another. It depends on the
application. Additionally, some of the agreements or legal
requirements for reliability estimates do not include Climate
change or Paleo data. That data/information will provide additional
uncertainties in reliability estimation. The difficulty is in how to
bracket that uncertainty for near- and longer-term decisions.

118
Review of Water Supply Reliability Estimation
Related to the Sacramento-San Joaquin Delta
Respondent # Response
9 1. Clear and succinct communication of complex results to a
diverse audience.
2. Data uncertainties due to unknowns related to climate
change, population growth, environmental regulations, and
future innovations.
3. Determining commonly agreed upon metrics that identify
potential future water supply shortages
13 Reliability depends a lot on operational decisions and demand
estimation. Further standardization of model operations decision
envelope and levels of demand met (changing effects with
increasing shortage) would contribute to analytical consistency
(and not just decisions that suit USBR or DWR).
14 Modeling results presented to the SWRCB and other State agencies
only analyze impacts to CVP/SWP water exporters and fail to
analyze degradation of water quality for in-Delta water
users/diversions or determine whether compliance with water
rights contracts such as the NDWA 1981 Contract can be
maintained under existing CVP/SWP operations or expansion of
SWP with construction of WaterFix intakes and tunnels. D-1641 is
only April thru August 15th and therefore is not relevant to year-
round salinity criteria contained in the 1981 NDWA-DWR Contract.
15 While there are some good estimates of the potential water supply
for a given month or a year, net water use in cities and agriculture
is often a big unknown. This makes it difficult to properly plan and
reconfigure system operations especially during droughts.
16 Climate change and population growth.

119
Review of Water Supply Reliability Estimation
Related to the Sacramento-San Joaquin Delta
Respondent # Response
17 I will provide a list of about six that I came up with in preparation
for the workshop: (1) Climate change and non-stationarity of
hydrologic distribution where the hydrology of the past is less
reliable for representing hydrology of the future; (2) Regulatory
uncertainty such as SWRCB curtailments that were a feature of the
recent drought that are inherently unpredictable; (3) Policy "off-
ramps" such as public health and safety and unanticipated yet
legally valid deviations from defined policies; (4) Scenario
management can become a problem with so many components to
the process where the number of scenarios or alternatives can
easily grow large resulting in making decisions more difficult
and/or finding common ground between disparate views more of a
challenge; (5) Compounded uncertainty where there can, again, be
several components to the analysis where information from the
different sources can be correlated or synergistic; (6) Variability in
risk tolerance either because of changes in circumstance over time
or as a function of changes in decision makers or agency objectives
in the short or long term.
18 Not as useful for project-specific analysis. sometimes not enough
detail (nodes).
19 People need to understand that CalSim and other models are used
for comparative purposes to generally evaluate the differences
between proposals and may not be effective for real time
evaluation.
20 Supply reliability is challenged by seasonal variations (in which
month will it rain?), by cyclical fluctuation based on our less than
150 year window of history, political transformation as we see the
human impact on the water cycles at and below the ground level,
political transformation as we react to the impact of climate
change on the evaporation-transpiration-precipitation cycles over
every region and every basin. The failure of political animals -
Future Farmers of America, voters, politicians and scientists to
think long means that we are usually working today to solve
yesterday's problem, not tomorrow's. We need to make sure we
are ready to do more with less - water.
21 Future changes in land use and climate change.

120
Review of Water Supply Reliability Estimation
Related to the Sacramento-San Joaquin Delta
Respondent # Response
22 Interannual water supply reliability is closely tied to reservoir
operations. Reservoir operations are changed regularly in ways
which are non-transparent, and may not be optimal for all
beneficial uses. River reaches often have significant losses to
groundwater in critically dry years or extended droughts, which
may not be reflected in hydrologic models based on average flows.
5. What are some major technical or institutional innovations that would improve
the use of water supply reliability studies in the future?
Respondent # Response
1 Documentation expectation standards for models and
applications.
2 Technical
• higher resolution data (spatially and temporally) so that
water use studies could directly address demand and use,
both critical elements in determining reliability.
• data management and visualization tools - both on the front
and back end of analyses. This would allow better
understanding and quality control of data (front end), as
well as interpreting output and analysis results, and ease
conveying approaches and results to managers and
decision makers
Institutional
is this a trap? There are so many points here. Coordination among
and within institutions is a huge challenge. Funding is likewise a
constraint for institutions. There is also a tendency for institutions
and institutional processes to lack flexibility, to be nimble, and to
evolve - not all institutions, but these elements are common. This is
kind of vanilla pudding and probably not much help. However,
developing and maintaining in-house expertise is remarkably
effective when and where it happens
3 High resolution data that is federated. Open source models.
5 Better estimates of groundwater contribution to annual water
supply. Modeling capability has lagged surface water modeling.
Integrated models needed.

121
Review of Water Supply Reliability Estimation
Related to the Sacramento-San Joaquin Delta
Respondent # Response
6 Funds and technical training, and ability to attend technical
conferences, and opportunities for staff participation in technical
discussions with researchers, sometimes out of state.
7 Hard to say. Continued improvement in data and modeling
studies. Better communication. Ways to present uncertainty or
ranges of estimates that are understandable to managers.
Normally it is difficult to get beyond a "one answer" approach for
decision makers.
8 Opportunities for reservoir reoperation in conjunction with ground
water recharge methodologies can stabilize the supply/demand
equation
9 1. Improved certainty of the local climate model projections
for precipitation timing, precipitation volume, and
temperature.
2. Improved understanding of how different types of water
supply projects may help (or not help) with climate change.
3. Improved approaches for water demand modeling
4. Improved communication and/or collaboration across
agencies (i.e., through institutional support and funding for
Integrated Regional Water Management)
11 Common sense!!!! Also, political agendas and egos often override
technical information
13 1. Standardization of demands and operations as above,
2. development of the language/vernacular of major reliability
dynamics and causal relationships, and
3. further examples of "objective" basin wide analysis or a
trusted entity to conduct unbiased analysis that can
withstand cross-examination in evidentiary proceedings.
14 Independent modeling conducted separate from the one-sided
SWP/CVP affects conducted by DWR/USBR is necessary to show the
impacts to the other hundreds of smaller agricultural diversion
pipes in the Delta (25 cfs and less) that pre-exist the CVP and SWP
water rights.

122
Review of Water Supply Reliability Estimation
Related to the Sacramento-San Joaquin Delta
Respondent # Response
15 A coherent and standardized water accounting system, that
identifies major elements in regional water balance, and
uncertainties. In the case of agriculture, a comprehensive land use
survey program would also be beneficial.
16 Accessibility of models to a broader water community.
17 Big data analysis methods such as machine learning that may be
helpful in identifying important patterns in large data sets that
ultimately may reduce uncertainty or improve precision of demand
estimates or consumption patterns. Building in flexibility into
existing or proposed/future regulations. Perhaps obvious would be
improving both short term and long term forecasting to reduce
water supply uncertainty inter- and intra-annually.
19 Continued refinement of CalSim and groundwater models. Needs
to be better short-term modeling. Efficient dissemination of results
and in a manner that does not require modeling expertise.
20 The institutional innovation needed is to recognize that raising the
marginal price is the best way to reign in demand. Tier pricing can
be used to make wasted water - that "unnecessary" drop -
expensive, whoever you are, even while complying with the need
to avoid surplus income.
21 Continued refinement of CVHM-2 such as projections in land-use
changes and climate change.
22 Machine learning techniques could significantly improve mid-range
forecasts of water supply. Temporal and spatial distribution of
snowpack is also changing with climate change, and mid-range
forecasts need to be adjusted accordingly.
6. Science needs. What are some research directions that might support
improvements in water supply reliability estimates and the use of such
estimates for management and decision-making?
Respondent # Response
1 Error analysis templates regarding demand, inflow, and regulatory
uncertainties.

123
Review of Water Supply Reliability Estimation
Related to the Sacramento-San Joaquin Delta
Respondent # Response
2 Quantitative tools of all types. This includes data (see above). Also,
effective methods to quantify uncertainty in estimates AND
guidance for decision makers on using those uncertainty
estimates. This uncertainty quantification and guidance may be
specific to projects, certain analysis approaches, etc. Include an
"expiration date." Water reliability analyses have a shelf life.
Develop approaches to assess performance and provide direction
on when to update water supply reliability plans and analyses.
3 Quantification of managed aquifer recharge potential, supporting
science to show that recharge is a beneficial use.
5 Publicly accessible monitoring networks - data updates to models
in real-time.
6 New and simpler remote measuring devices or tools, possibly from
space via satellites; better long range weather forecasting.
7 Improved data, data management, transparency of data.
Continued development of better hydrologic, water system, and
Climate modeling. Ways to manage to a range of uncertainty.
8 See response to question 5
9 1. Research on water conservation technologies and
effectiveness
2. Research on how to improve community water
conservation
3. Research on maximizing stormwater capture and recharge
in a Mediterranean climate
4. Research on how and to what extent new water supply
technologies may help with adapting to climate change
5. Research on emerging water supply technologies and an
assessment of their potential for meeting future demands
13 There are glaring gaps in existing streamflow data collection
networks, and for temperature. Construction of next-generation
basin wide models with common-assumptions frameworks for
LOD/demand and operational prioritization could help.

124
Review of Water Supply Reliability Estimation
Related to the Sacramento-San Joaquin Delta
Respondent # Response
14 DWR modeling on WaterFix, drought plans presented to SWRCB,
and others venues only analyzes water supply impacts to CVP/SWP
water contractors and ignores water supply and quality impacts to
in-Delta water users. Independent modeling is necessary to
provide more comprehensive impacts to other water users besides
SWP/CVP water contractors. Research should also determine the
amount of water that is used, excess put back into the rivers and
then re-used downstream in order to get a better handle on
consumptive use in watersheds. In other words, the amount of
diverted is not the same as the final amount used because a
portion is put back into the rivers/channels.
15 Surface water supply information has improved substantially over
the past few decades, also the SGMA will improve groundwater
information and planning as the state achieves sustainability.
Further studies on net water use from all sectors including
environmental flows would greatly improve the demand side water
needs estimates which conform the other side of the reliability
estimates. Standardization and transparency of some of this
information would be also beneficial.
16 Agricultural water use under increased temperature and CO2
scenarios. Changes in reservoir flood control operations under
climate change scenarios.
17 Continued multi-disciplinary research of climate change and
improvements in scientific understanding of our climate system.
Retrospective studies to show water supply effects-both intentional
and unintentional-of past regulations and regulatory interactions
using models. Continued research to continue developing scientific
understanding to the Sacramento San-Joaquin ecosystem.
Exploring possible policy tweaks to the California water rights
system. More monitoring and scientific studies to advance
understanding of a range of water quality effects on water systems
and ecosystems.
18 fish flow modeling
19 There needs to be a shift in focus away from flow based solutions
to environmental concerns.

125
Review of Water Supply Reliability Estimation
Related to the Sacramento-San Joaquin Delta
Respondent # Response
20 There is no improvement in weather forecasting that really
matters. Better science around groundwater resources and making
aquifer protection more important than oil and gas production
would be useful. Learning to price a product to reduce
consumption requires a psychological transformation from the
goal being to lower prices to maximize sales. Water was never in
the Sears Roebuck Catalog.
21 Water reuse, drains, and flood flow capture for recharge
22 Complete and accurate streamflow gage data is critical, as are fully
calibrated models. Decision-making research is also needed. 1.
Economic research on optimization of reservoir carryover storage
rules for avoidance of direct and indirect economic loss. 2. For
retail water agencies, research on optimal balancing of revenue
loss from delivery curtailments vs. risk of running out of water
during extended droughts.
7. Please add any other comments or suggestions you would like to make on water
supply reliability estimation.
Respondent
#
Response
1 Gosh, this is a messy topic. But if they could do a good job with water
quality, we should be able to do something useful here too.
2 See question 1 (just joking:)). I think my reliability thinking is quite
different than what this questionnaire has in mind. I am looking at (a)
minimum flows in streams to ensure discharge reliability, (b) flow
reliability for hydropower production under water quality constraints
(regulatory), (c) minimum instream flows for a specific life stage of
anadromous fish (which may include how flow and quality impact
habitat), (d) water quality reliability to maintain or reduce treatment
costs for drinking water. These are different than: is City A or Farmer
B going to get the desired water quantity in 8 out of 10 years? That is
why I think this is a challenging problem - nothing like a good
challenge though!

126
Review of Water Supply Reliability Estimation
Related to the Sacramento-San Joaquin Delta
Respondent
#
Response
14 Water supply reliability in the Delta is affected not only by water
quality but by changes in water elevations because most local
agricultural diversions are siphons that rely on gravity and "head"
dynamics that affect the volume of water that can be diverted and
may necessitate installation of electrical pumps that increase GHG
emissions for water supply deliveries. To avoid increased GHG
emissions from installation of water pumps, the water surface
elevations must not be lowered by water management decisions.
15 Have a group of experts to come up with a framework to estimate
water supply reliability that is relevant over a wide range of planning
stances (local, regional, statewide) and uses (agricultural, urban,
environmental). As part of it develop a platform that can host this
information and that can be accessible to water managers,
academics, and stakeholders at various temporal scales (eg, daily,
monthly, annually).
16 Better integration of surface and groundwater resources.
20 We can't really manage water supply, we can only manage water use.
21 Better estimates of land use and application of water for agriculture
as well as better estimates of climate change with 6-month to one-
year forecasts could help refine operational decisions.

127
Review of Water Supply Reliability Estimation
Related to the Sacramento-San Joaquin Delta
B.1.2 (Part 2): Inventory of Water Supply Reliability Estimation Efforts
The table below is an inventory of water supply reliability estimation efforts in California. The inventory was compiled based on
what was provided in the questionnaire responses with limited modifications. The order of the inventory is based on the
alphabetical order of the group conducting or employing the estimation efforts. It does not correspond to respondent number in
Part 1 of Section B.1. Because of the amount of information presented, the State Water Resources Control Board’s inventory
information is presented as a fact sheet (see end of table) and is not in the table below.
# Group Purpose of
Underlying
Estimates
Frequency
Estimates are
Updated
Computer Models or Modeling
Groups Used
Key References Application of Estimates Best Use of
Estimates
1 Berkeley
National
Laboratory
Agency
contractor
water supply
deliveries
Annually and
updated
monthly
CalSim, integrated groundwater models
WESTSIM, CVHM
No journal articles
specifically related to water
supply reliability. Reliability
assessment is a secondary
output of the analysis
performed.
N/A N/A
2 California
Water
Research
History of CVP
and SWP water
supply
reliability,
impacts of
climate change
and climate
shifts on CVP
and SWP water
supply
reliability,
reliability of
meeting Bay-
Delta WQCP
requirements &
environmental
needs, reservoir
carryover target
effects
As needed Primarily CalSim
Testimony for Friends of the
River / Sierra Club in
WaterFix Water Right
Change Petition Hearing on
SWP Water Supply History &
Water Supply Reliability
Letter -- Changes to SWP
operational criteria appear
to have greatly increased
risks of draining Oroville
reservoir in droughts, and
greatly diminished the ability
of the State Water Project to
meet water quality and
ecosystem flow obligations
in dry and critically dry years.
August 2012
Recommendations to DWR
Incorporating Drought Risk
From Climate Change Into
California Water Planning
Analyses for NGOs, Delta,
and fishing groups for
comments on new
infrastructure and
regulatory processes
Recommended that DWR's
Climate Change Adaptation
Strategy use all available
information about
increased drought risk due
to climate change,
reevaluate prior studies on
climate impacts to the State
Water Project and Central
Valley Project to incorporate
this information, and
consider strategies for
reducing risk of interruption
of water supplies.
(Recommendations were
ignored at the time.)
Better incorporation
of climate change
into water resources
planning, better
understanding of
climate shift impacts
on water supply,
better planning to
meet all beneficial
use needs

128
Review of Water Supply Reliability Estimation
Related to the Sacramento-San Joaquin Delta
# Group Purpose of
Underlying
Estimates
Frequency
Estimates are
Updated
Computer Models or Modeling
Groups Used
Key References Application of Estimates Best Use of
Estimates
3 DWR Bay-Delta
Office
To satisfy a
contractual
obligation
Every 2 years CalSim/WRIMS Delivery Capability Report
and Studies
They are used by our
contractors to provide
estimated supply for
planning purposes
Planning
4 DWR Division
of Flood
Management
Estimate how
much water can
be delivered
yearly for some
historic period
of record.
Historic dry
periods provide
an important
measure of
supply
dependability.
Also, annually
forecast during
the wet season
the expected
natural runoff
of major rivers
in the Snow
Surveys
program, with
the better
forecasting
beginning
February 1.
Yearly at about
the halfway
point in the
wet season;
monthly and
weekly,
continuing into
early summer.
Various models; the workhorse is
regression models based on
precipitation, snow. last year's runoff
and current year runoff to date. The
challenge is to obtain an accurate
measure and evaluation of parameters
for the watershed.
Bulletin 120 and weekly
updates during the season
They provide guidance for
reservoir and water agency
managers and operators,
and in some cases, criteria
for project and in-stream
requirements.
Water and power
project operations
and setting criteria
for instream and
Delta environmental
needs

129
Review of Water Supply Reliability Estimation
Related to the Sacramento-San Joaquin Delta
# Group Purpose of
Underlying
Estimates
Frequency
Estimates are
Updated
Computer Models or Modeling
Groups Used
Key References Application of Estimates Best Use of
Estimates
5 GEI
Consultants
Estimate
benefits for
water
infrastructure
projects that
our clients
design and
build. Support
grant funding
benefit
determination
and operations
analysis.
Annually CalSim 2 Willow Springs and Chino
Basin Prop 1 Grants
Determination of project
benefits and avoidance of
potential impacts. Support
water transfer agreements.
Supporting grant
proposals. Showing
public benefit.
6 MBK Engineers There are
numerous
purposes.
Agricultural,
M&I, ecosystem,
hydropower,
groundwater
sustainability,
recreation, and
more.
Estimates are
made for every
operating
season for all
purposes.
Long-term
planning
estimates are
made
whenever key
operating/regu
lation criteria
changes (this
seems to
happen on a
continual
basis) for all
purposes.
Customized models are used for all
proposes. Industry standard models are
also used, CalSim is often used. When
CalSim is used other models and
analysis are ALWAYS used to
check/verify results. Historical
operations data are used to support all
reliability analysis.
None provided Supply estimates are used
in multiple ways.
● Determining crop
acreage each year
● Estimating water
transfer volumes
(buying and selling)
● Temperature
compliance estimates
● Reservoir operation
strategies
● Conjunctive
management
strategies
● Water right
curtailment forecasting
Flood forecasting and
management
Many others
See “Applications of
Best Estimates”

130
Review of Water Supply Reliability Estimation
Related to the Sacramento-San Joaquin Delta
# Group Purpose of
Underlying
Estimates
Frequency
Estimates are
Updated
Computer Models or Modeling
Groups Used
Key References Application of Estimates Best Use of
Estimates
7 MWD Water
Surplus and
Drought
Management
Planning
Provides intra-
year support for
short-term
seasonal water
operations and
water
management
decision
making.
Estimates are
produced
weekly or
more
frequently
during the
winter and
spring runoff
season.
The short-term decision-making process
is supported by a number of analytical
tools:
• SWP Runoff Model – Regression
model that estimates current
water-year runoff for the Northern
Sierra watersheds.
• System Router Model –
Spreadsheet model that evaluates
impacts of potential water
operations on Metropolitan’s
distribution system.
• Resource Simulation Model –
Indexed-sequential mass-balance
model that simulates annual water
supply and demand, resource and
storage operation and produces
estimates of surplus and shortage.
1998 WSDM Plan (upon
request)
Metropolitan 2015 UWMP
Chapter 2.4
Shorter term water supply
availability (including
conveyance and distribution
constraints, water quality
issues) are compared to
water demand projections
to determine resource
operation plans and storage
use.
Establishing
preferred water
resource
management
strategies to be
carried out over the
course of a year.
8 MWD Drought
Contingency
Planning
Provides inter-
year support for
water
management
decision making
and indicates
water resource,
demand
management
and program
development
needs.
Estimates are
produced
annually or
more
frequently
during actual
drought
events.
The Drought Contingency Planning
Process is supported by analytical tools
used for both Water Surplus and
Drought Management Planning and
Long-term Water Supply Reliability
Planning.
Metropolitan 2015 UWMP
Chapter 2.4
Ongoing SWRCB reporting
Water supply availability
estimates for single and
extended-year drought
conditions (including
conveyance and distribution
constraints) are compared
to water demand
projections over periods of
extended drought to
determine resource
development needs and to
inform resource operation
strategies and storage use.
Developing drought
contingency plans
and water resource
and operational
strategies for use
during deep or
extended drought.

131
Review of Water Supply Reliability Estimation
Related to the Sacramento-San Joaquin Delta
# Group Purpose of
Underlying
Estimates
Frequency
Estimates are
Updated
Computer Models or Modeling
Groups Used
Key References Application of Estimates Best Use of
Estimates
9 MWD
Emergency
Planning
Provides
planning for
dedicated water
supply and
system
resiliency under
emergency/
seismic events
System
reliability and
storage needs
are
reevaluated
every few
years or with
planned new
facilities
The Emergency Planning Process is
supported by analytical tools used for
both Water Surplus and Drought
Management Planning and Long-term
Water Supply Reliability Planning.
Seismic Resilience Report
Metropolitan 2015 UWMP
Chapter 2.5
Estimates of water supplies
limited by
emergency/seismic
planning scenarios are
compared to water demand
projections to determine
the duration and extent of
potential water shortages
and the need for dedicated
emergency storage
Establishing
dedicated
emergency storage
requirements.
Determining
resiliency and
recovery plans for
distribution system
and facilities
10 MWD Robust
Decision
Making
Applies a wide
range of
additional
uncertainty to
test long-term
water supply
reliability
strategies.
The impacts of
additional
uncertainties
are evaluated
every 5 years
following the
IRP
Update/UWMP
process
Robust Decision Making utilizes Long-
term Water Supply Reliability Planning
analytical tools and a process and tools
developed by RAND that integrates and
runs long-term planning models, creates
a database of scenario results, and
applies a statistical algorithm to identify
vulnerabilities within scenario results.
Groves et al. (2014)
Lempert et al. (2011)
Water supply estimates
under a wide range of
uncertainties (climate
change, development risk,
losses in yields) are
compared to ranges of
water demand projections
under similar or additional
uncertainties to develop
estimates of vulnerability
and risk.
Determine areas of
uncertainty that
pose the largest risk
and vulnerability to
long-term water
supply reliability.

132
Review of Water Supply Reliability Estimation
Related to the Sacramento-San Joaquin Delta
# Group Purpose of
Underlying
Estimates
Frequency
Estimates are
Updated
Computer Models or Modeling
Groups Used
Key References Application of Estimates Best Use of
Estimates
11 MWD Long-
term Water
Supply
Reliability
Planning
Provides
forecasts of
water supplies
and demands to
support long-
term planning
processes and
guide water
resource,
demand
management
and program
development
needs.
Individual
model
assumptions
and input data
are updated as
available.
Reliability
estimates are
produced to
inform water
resource
management
decisions as
needed, and
every 5 years
for the
Integrated
Water Resource
Plan (IRP)
Update/ UWMP
development
process.
Long-term planning processes are
supported by a number of analytical
tools:
● Conservation Savings Model –
Spreadsheet model that produces
annual estimates of future savings
from active (conservation
incentives) and code-based
(plumbing/landscape codes)
conservation.
● Local Supply Forecast – Regression
model that produces annual
estimates of supplies from
groundwater recovery, recycling,
and sea water desalination
produced Metropolitan’s member
agencies. Local groundwater and
Los Angeles Aqueduct supply
forecasts are produced through a
survey of Metropolitan’s member
agencies and groundwater basin
managers.
● Retail Demand Model –
Econometric model that produces
estimates of future demands for
Metropolitan’s service area and
price-based conservation.
● Sales Model – Indexed sequential
mass-balance model that produces
estimates of demand for
Metropolitan supplies, applies a
range of hydrologic impacts to
retail demand estimates, and
provides a forecast of service area
distribution of demands.
Resource Simulation Model – Indexed-
sequential mass-balance model that
simulates annual water supply and
demand, resource and storage
operation and produces estimates of
surplus and shortage.
IRPSIM Reference Manual
(upon request)
2015 IRP Update Technical
Appendices:
● Appendix 7:
Methodology for
Generating MWDSC
Water Demand
Forecasts
● Appendix 8: Demand
Forecasting
● Appendix 9:
Metropolitan
Conservation Savings
Model
● Appendix 10:
Imported Supply
Forecasts
● Appendix 11: IRPSIM
(upon request)
Ranges of water supply
estimates under varying
hydrologic and climatic
conditions are compared to
ranges of water demand
projections to determine
the need for water
resource, demand
management and program
development.
Determining
preferred water
resource, demand
management and
program
development
strategies to guide
long-term regional
investments.

133
Review of Water Supply Reliability Estimation
Related to the Sacramento-San Joaquin Delta
# Group Purpose of
Underlying
Estimates
Frequency
Estimates are
Updated
Computer Models or Modeling
Groups Used
Key References Application of Estimates Best Use of
Estimates
12 One-Water
Hydrologic
Helped develop
CVHM model at
USGS
Annually CVHM-1 and CVHM-2
USGS professional paper
on Central Valley
Used for Valley-wide
analysis
Climate change
analysis, subsidence
analysis, agricultural
water-supply
analysis
13 North Delta
Water Agency
(NDWA)
The NDWA does
not delivery
water, but
monitors DWR's
compliance with
water quality
standards
specified in the
NDWA-DWR
1981 Contract.
Therefore, we
do not collect or
maintain any
records on
estimates or
water delivery
records relates
to water supply
reliability.
NDWA
engineer
monitors
water quality
at seven
monitoring
stations
specified in the
NDWA 1981
Contract, but
we do not
collect or
maintain any
data on the
amount of
water diverted
or used by
individual
water users
within the
Agency's
jurisdiction.
No response No response No response No response

134
Review of Water Supply Reliability Estimation
Related to the Sacramento-San Joaquin Delta
# Group Purpose of
Underlying
Estimates
Frequency
Estimates are
Updated
Computer Models or Modeling
Groups Used
Key References Application of Estimates Best Use of
Estimates
14 Westlands
Water District
(WWD)
To provide
information to
customers/grow
ers for their
crop planning,
to assess
shortages and
how to fill them,
to assess capital
projects, to set
water rates and
land
assessments.
Annually and
whenever
there is a
proposed
regulatory
change or
capital project
under
consideration.
WWD relies on CalSim modeling for
comparative analyses of those items
listed in question 2. It also relies on
shorter term operational projections
from Reclamation and DWR for those
items listed in question 1.
WWD has relied on data
provided in the EIS on
Long Term Operations of
the CVP and SWP and on
Reclamation's operational
forecasts when posted
The supply estimates are
used by the WWD
management and Board to
make decisions about
projects and water transfers
to pursue and how to set
rates. The estimates are
also used to inform WWD
growers so that they can
make cropping decisions.
Most recently, they have
been used to evaluate
changes under the COA
addendum and we
anticipate referring to them
when the LTO re-
consultation is complete.
WWD also uses them to
develop a computer model
for its groundwater basin.
All of the above.
15 San Francisco
Bay Chapter
Sierra Club
Understanding
appropriate
water agency
adjustments for
cyclical and
non-cyclical
water supply
change.
Review of
statewide and
regional data
collected by
others.
Simple charting of data to visualize
trends.
Western Region Climate
Center Tracker
Encouraging water agencies
to shift from fixed charges
and shallow tiered water
pricing wholly to adjustable,
more-steeply tiered water
pricing for all customer
classes.
Long-term thinking.

135
Review of Water Supply Reliability Estimation
Related to the Sacramento-San Joaquin Delta
# Group Purpose of
Underlying
Estimates
Frequency
Estimates are
Updated
Computer Models or Modeling
Groups Used
Key References Application of Estimates Best Use of
Estimates
16 Santa Clara
Valley Water
District
The purpose of
the water
supply reliability
estimates that
the Santa Clara
Valley Water
District (District)
conducts is to
ensure a
reliable water
supply in the
future. The
water reliability
estimates are
used to help
plan for
investments in
new
infrastructure
and the
maintenance of
existing
infrastructure.
The estimates
also inform the
level of service
the District aims
to meet through
investments
and the risk of
water supply
shortages
during
droughts.
The water
supply
estimates for
the purposes
explained
above are
made every 3-
5 years.
However,
demands and
supplies are
tracked
throughout
each year to
ensure our
operations
allow us to
meet water
supply
demands.
The District uses the Water Evaluation
and Planning (WEAP) software, the
Department of Water Resources CalSim
II modeling, the Alliance for Water
Efficiency Conservation Tracking Tool,
and numerical models in excel.
The Water Supply and
Infrastructure Master Plan
Urban Water Management
Plan
General Link
The District applies water
supply estimates to
determine when, what type,
and how many future
investments will be
necessary to meet demands
through the mid-century.
The District also uses water
supply estimates to
determine the range of
potential impacts related to
the uncertainty in future
supplies owing to climate
change and changing
environmental regulations.
The two best uses
are:
1. To determine
how future
uncertainties in
supplies (e.g.,
climate change,
changing
regulations)
may impact the
District’s ability
to meet future
demands.
2. To determine
investment
approaches for
meeting future
demands.

136
Review of Water Supply Reliability Estimation
Related to the Sacramento-San Joaquin Delta
# Group Purpose of
Underlying
Estimates
Frequency
Estimates are
Updated
Computer Models or Modeling
Groups Used
Key References Application of Estimates Best Use of
Estimates
18 UC Merced In my group
and through
collaboration
with other
academics,
water
professionals
and agency
staff, I conduct
research on
water supply for
agriculture,
cities and the
environment. A
good portion of
my research is
devoted to
economic
analysis of
water supply for
these main
users, to
estimate water
shortage and
water supply
operating costs.
I do not
conduct these
water supply
reliability
analyses or
research on a
routine basis.
Rather I
employ
existing
hydrologic
models to
economically
assess costs
and benefits of
specific
policies or
water supply
conditions
such as
droughts, or
environmental
flow
regulations.
I often use the CALVIN model, the SWAP
model for agricultural production and
other regional models publicly available.
UC Davis CALVIN Website
UC Davis SWAP Website
UC Davis Drought Impacts
Website
UC Davis Integrated
Modeling Website
Studies I have participated
in provide some insights for
water management and
planning. As such, these are
not directly employed in
day-to-day operations but
are rather used for long
term system management.
In particular, these provide
a quantification of potential
shortages and costs of
systemwide decisions.
Long term planning,
identification of
promising water
infrastructure, and
trade among users.
17 UC Davis
Policy and
public insights,
theoretical and
methodological
insights,
graduate and
undergraduate
education.
Sometimes
several times a
year,
depending on
the number of
graduate
student theses
and projects
needing such
analyses.
Sometimes
less often.
CALVIN, Excel, sometimes post-
processing of CALSim or other results
UC Davis CALVIN Website
Far too many to read
Graduate theses, academic
journal papers, PPIC reports
to enliven policy discussions
Enlivening policy
discussions and
graduate and
undergraduate
education.

137
Review of Water Supply Reliability Estimation
Related to the Sacramento-San Joaquin Delta
# Group Purpose of
Underlying
Estimates
Frequency
Estimates are
Updated
Computer Models or Modeling
Groups Used
Key References Application of Estimates Best Use of
Estimates
19 USGS
California
Water Science
Center
Groundwater
overdraft,
climate
variability and
change
Current
projects
evaluate both
at monthly
scale and
another
project is
forecasting to
2100
GSFLOW, MODFLOW-OWHM, HSPF,
PRMS
Total Management
Website
Plan of Study: Salina and
Carmerl Rivers Basin
Hanson et al. (2010)
Hanson et al. (2014)
Used in decision making Water supply
reliability forecasting

138
Review of Water Supply Reliability Estimation
Related to the Sacramento-San Joaquin Delta
State Water Resources Control Board Division of Water Rights
Purpose Underlying Estimates
The State Water Resources Control Board and 9 Regional Water Quality Control
Boards (Water Boards) are tasked with protecting the quality of California’s water
resources and drinking water for the protection of the environment, public health,
and all beneficial uses, including public trust uses. The Water Boards are also
tasked with administering the State’s water rights system. In doing this work, the
Water Boards employ water supply reliability estimates when: developing and
implementing regulatory requirements related to flows, including in flow
dependent water quality control plans like the Bay-Delta Plan and associated
environmental analyses; in determining water availability for new water rights; in
determining when water is not available for diversion during times of shortage; and
in the regulation of drinking water systems.
Water supply reliability estimates are specifically used by Water Boards staff in
updating the Bay-Delta Plan to understand the range of potential effects from
changes in flows and flow dependent water quality requirements. The Water Board
considers the benefits of proposed regulations and the water supply costs when it
makes decisions regarding the reasonable protection of all beneficial uses.
When making decisions about whether to grant new water rights, the Water Boards
also consider water supply reliability in determining whether to grant new water
rights, the season of diversion, and other conditions. During times of water scarcity,
the Water Board must also determine when water is not available for water users
based on their water right priority. While these analyses do not incorporate water
supply reliability explicitly, they do incorporate the same information; water supply
estimates and demand estimates.
Water supply reliability is generally defined as the fraction of time that a specified
level of demand can be met. Water supply reliability depends on available supply,
demand, and reservoir management choices that are based on the risks and
rewards of short-term and future use. Typically, water users make decisions based
on these factors in how to allocate water use to meet demands. In planning
scenarios, Water Board staff are tasked to develop sufficiently accurate
representations of baseline water use patterns and operational decisions in order

139
Review of Water Supply Reliability Estimation
Related to the Sacramento-San Joaquin Delta
to evaluate likely changes in reliability for certain policy alternatives. This reliability
manifests in fractions of baseline water demand that can be met for municipal,
agricultural, and fish and wildlife beneficial uses, and subsequent potential
economic and environmental impacts.
Reservoirs improve reliability for consumptive uses by storing natural supply that
exceeds demand for use later in the season or in future years. Reservoir operators
balance the need to release water from the reservoir to fulfill seasonal water
demand with the need to retain water in the reservoir to be available for future
demand, considering the uncertainty of future inflows and the risk of drought.
Multiple, successive dry years present difficult choices between releasing reservoir
water to meet a portion of immediate demand or storing reservoir water for a
future year with the risk of additional shortage. The Water Board’s authority
primarily affects users’ available supply through conditions on the exercise of water
rights, while reservoir operational decisions and demand management are typically
controlled by water users.
Water supply reliability is also a consideration in the regulation of drinking water
systems, including decisions about regulatory requirements that are needed to
protect public health and ensure the efficient use of water resources.
Frequency Estimates are Updated
Time periods for the above water supply estimates vary based on the
circumstances. For the Bay-Delta Plan they coincide with the planning cycles which
can be from 3 to 10 years. For water right applications they occur once per
application. During times of drought, for short term planning and enforcement
purposes, water supply estimates are employed monthly or more frequently.
Computer Models or Modeling Groups Used
In Bay-Delta planning, the Water Supply Effects (WSE) model (based on the
CalSim II water balance framework) was used for the San Joaquin update of the
Bay-Delta Plan, and the Sacramento Water Allocation Model (SacWAM), an
application of the WEAP model (see below), is being used for the Sacramento/Delta
update of the Bay-Delta Plan. For water supply shortage analyses spreadsheet
models have been employed.

140
Review of Water Supply Reliability Estimation
Related to the Sacramento-San Joaquin Delta
Key References
● Lower San Joaquin River and Southern Delta Update of the Bay-Delta Basin
Plan: 2018 Amendments and Substitute Environmental Document (See
Chapters 4 & 5 for general hydrologic overview; Appendix F.1 and Master
Response 3.2 for documentation and details of modeling approach and
responses to frequent comments)
● Sacramento/Delta Update of the Bay-Delta Plan: Framework Document (See
section 3.3): SacWAM Website
● State Water Board: Drought Year Watershed Analysis
● Drought Water Right Curtailment and Analysis Tool (DWRAT)
Application of Estimates
They are applied in regulatory and planning processes as discussed above.
Historically, the State Water Resources Control Board has relied on other
organizations such as USGS, NOAA and DWR to produce real-time and historical
water supply estimates. These estimates of streamflow forecasts (e.g. DWR Bulletin
120 and Water Supply Indices) and unimpaired flow (DWR 2016) are used to inform
instream flow requirements and water quality objectives.
Best Use of Estimates
The uses of water supply reliability estimates depend upon the context in which
they are being applied. They can be used for planning or regulatory purposes. For
planning purposes, they are best used in a comparative sense. (e.g., WSE and
SacWAM).
B.2: Analysis of Responses
This section analyzes the 22 responses to the questionnaire that were completed in
conjunction with the January 10, 2019, Delta ISB Workshop on Water Supply
Reliability Estimation. Respondents from State and Federal agencies, local agencies,
and consulting organizations dominated the responses with six in each of the three
categories. Only four individuals, two each, respectively, responded from academic
and nongovernmental institutions. The respondents were an experienced cadre,
with 12 of the 22 having 10 or more years involvement in the field. The names of
the organizations represented by the respondents are listed in Section B.1. The
analysis here compiles and identifies general trends.

141
Review of Water Supply Reliability Estimation
Related to the Sacramento-San Joaquin Delta
Because of the small sample size and professional diversity of responders, potential
bias in the response are evaluated particularly for the first three questions. The
reader is referred to Appendix B.1 for individual comments numbered in order of
their submittal. The Appendix does not identify responders, but their identity was
used for the analysis of potential bias in Section B.2.
Question 1: In general, are water-supply reliability studies done in a rigorous technical way?
Seventeen of the 22 respondents answered this question. The bottom line is that
59% of the respondents did not answer yes with most (50%) of the respondents
answering somewhat. Evaluation of potential bias: Of the 17 respondents, five were
consultants and six represented government agencies. Four of the five consultants
and three of the six government employees answered somewhat or no, which is
probably not a significant difference. Thus, the 59% based on all 17 respondents
seems to reflect the opinions of engineers on the front line.
Written responses: The negative tone of the overall response is reflected in the
comments. Absence of standards, need for competence and judgement in model
operation, and inadequate estimates of uncertainty were the most common
comments.
Question 2: In general, are reliability estimates sufficiently understood, communicated to, and applied by managers and decisionmakers?
Seventeen of the 22 respondents answered this question, but the 17 respondents
did not completely overlap with those answering question 1. The bottom line is that
73% of the respondents did not answer yes. Evaluation of potential bias: Of the 17
respondents, five were consultants and eight represented government agencies. All
five consultants and four of the eight government employees answered somewhat
or no. Thus, the 73% overall response roughly reflects the opinions of engineers on
the front line although there may be a difference of opinion between consultants
and employees of government agencies, with the consultants being more skeptical.
Written Responses: Lack of understanding and the communication challenge were
overwhelmingly cited as the basis for the negative tone of the overall response.
Standardization and decreased bias were proposed as partial solutions.

142
Review of Water Supply Reliability Estimation
Related to the Sacramento-San Joaquin Delta
Question 3: In general, are water supply reliability estimates and studies employed in policy and management discussions and decisions?
Seventeen of the 22 respondents answered this question, but as noted previously,
the respondents do not completely overlap with respondents in questions 1 and 2.
The bottom line is that 50% of the respondents answered yes with an additional
36% answering somewhat. This yields 86% with a positive response. Only 5%
answered no. Evaluation of potential bias: Of the 17 respondents, only three were
consultants and seven represented government agencies. Two of the three
consultants answered somewhat with third not expressing an opinion. Six of the
seven responders from government agencies answered yes. Thus, the 86% overall
response roughly reflects the opinions of consultants and engineers on the front
line.
Written Responses: Despite the positive tone of the responses, there seemed to be
some detachment from technical findings and the application or decision-making
process; both parties are not in the room together.
Question 4: What major technical and application problems and uncertainties do you see in water supply reliability estimation that limit their utility for management and decision-making?
Climate change was the most cited limitation by the 17 respondents, being
referenced seven times. Standardization and transparency were also cited, but less
frequently. There were a few references to uncertainty and they included both
input data and regulatory uncertainty. A potential bias caused by sampling was not
evaluated because individual respondents commonly identified multiple limiting
factors. Thirteen of the respondents were either consultants or employees of
government agencies.
Question 5: What are some major technical or institutional innovations that would improve the use of water supply reliability studies in the future?
This question produced a variety of suggestions by 18 respondents. Innovations
mentioned by multiple respondents included:
● Standards
● Inclusion of groundwater
● Improved models with more transparency, and
● Acquisition of hi-resolution data.

143
Review of Water Supply Reliability Estimation
Related to the Sacramento-San Joaquin Delta
Question 6: Science needs. What are some research directions that might support improvements in water supply reliability estimate and use of such estimates for management and decision-making?
A variety of scientific research directions were proposed by the 18 respondents.
Data was the only theme that stood out, being mentioned by five respondents. It
included a range of aspects including improved data collection, management and
transparency, and uncertainty analyses. Other directions mentioned two or more
times included:
● How to incorporate groundwater resources in models
● Water conservation
● Better estimates of uncertainty, and
● Accounting for climate change.
Question 7: Other comments or suggestions on water supply reliability estimation.
Only seven respondents contributed to this section. Two of the respondents
commented on the wide range of application of models for water supply reliability
estimation and one of these recommended that experts provide a framework that
is applicable at all scales. Better management of water use (conservation),
documentation of land use, prediction of climate change, and inclusion of water
quality were all referenced.
Inventory of water supply reliability estimation efforts
Nineteen respondents completed the inventory of purpose, frequency of estimates,
and application of water supply reliability estimates. Only the purpose of the
estimation effort and frequency are compiled here.
The predominant (11 respondents) purpose of most efforts is to support planning
or policy development. Only three respondents mentioned that they were used
directly for delivery decisions.
The frequency of updates is dominated (11 respondents) by annual or longer
(typically five years) time periods. Three respondents indicated updates were
performed monthly or weekly.

144
Review of Water Supply Reliability Estimation
Related to the Sacramento-San Joaquin Delta
B.3: Interview Responses
As part of its information gathering process for this review, Delta ISB members
conducted interviews with a broad spectrum of scientists and engineers engaged in
water supply reliability estimation. This section summarizes comments and
observations gleaned from those interviews. The comments and observations are
not verbatim, but have been edited for clarity and terseness.
B.3.1: Interviewee Selection Criteria
Participants who were invited for 30-minute-long interviews were selected to reflect
a variety of perspectives based on their experience with water supply reliability
estimation and their employer. General categories of interviewees included State
and federal regulators, regional and state water agencies, and consultants.
Interviewees were informed that they would be identified as participants in the
interview process, but that specific comments would not be attributed.
B.3.2: Interviewees and Affiliations (Alphabetical Order):
Ben Bray, Ph.D., East Bay Municipal Utility District
Andy Draper, Ph.D., Stantec Consulting
Tina Leahy, State Water Resources Control Board
Scott Ligare, State Water Resources Control Board
Jennifer Nevills, Metropolitan Water District of Southern California
Nancy Parker, U.S. Bureau of Reclamation
Nicky Sandhu, Ph.D., Department of Water Resources
Robert Tull, Jacobs Engineering
Julie Zimmerman, Ph.D., The Nature Conservancy
B.3.3: Questions and Responses
All interviewees were asked the same questions during the course of their
interviews. The following interview comments are paraphrased from automated
transcripts and notes of interviewers. They are not sorted in alphabetical order by
author.

145
Review of Water Supply Reliability Estimation
Related to the Sacramento-San Joaquin Delta
Question 1. How do you use water supply reliability estimation?
Used on a 15-year cycle to plan and manage utility water supply and to fulfill state
mandated water management plans on an approximately 5-year cycle.
We use water resource reliability estimation for all sorts of resource simulation
modeling, data management, and demand forecasting. It also is used to develop
the state’s mandated water management plan.
Large scale system models for the Delta, the Central Valley, and Southern
California. These have looked at reservoir operations, stream flows, deliveries, and
groundwater pumping. We look at scenarios under different regulatory conditions.
There might be new facilities or re operation of existing facilities. There might be
climate change scenarios. There might be scenarios based on future land use and
population.
Question 2. What are your major concerns with water supply reliability estimates? What shortcomings to water supply reliability estimates limit or affect their use by managers and decision-makers? How much of the problem is communication/ understanding and how much is model deficiency? How can these concerns be addressed?
The more robust the methodology, the more challenging it is to communicate
implications to decision makers. A limited number of scenarios that are risk based
can be educational.
In California, annual variability is a major challenge. Droughts are stress tests for
both plans and the water supply system itself.
The questions that come from the water policy makers are usually straightforward
and simple. They want a number on which to base a decision. The big question is
how do you communicate that? When we do that, there are a lot of assumptions
that we make and a lot of things that we kind of gloss over. That is fine until the
point comes where they actually apply that in some way that doesn't, doesn't
match up to the assumptions we made.
It's not an integrative and integrated look at the whole system, but we do have
counseling which is another part of our branch.

146
Review of Water Supply Reliability Estimation
Related to the Sacramento-San Joaquin Delta
Upstream effects are in both the hydrology and institutional policies, regulatory
policies, and environmental flows.
We tend to look at things in isolation and we tend to focus on the things that we
understand and have data for. We really analyze those in great detail and tend to
either ignore or dismiss the things that we really can't get our hands around
because we don't have the ability to analyze.
The major concern is defining long-term reliability. We do a really good job at is
looking at metropolitan supplies versus demands and the range of future
conditions and defining future reliability under those of conditions. The limitations
have more to do with the inputs including supply estimates from other agencies
and for other water sources. Just maintaining existing supplies can be challenging,
e.g., groundwater estimates have gone down.
Just to keep maintaining existing supplies and then to keep building new supplies
on top is very challenging. In addition, water quality concerns and regulation
changes can knock out entire supplies very abruptly. So that's a lot of effort for us is
to assess risk in local supplies. We've also learned a lot about the transfer market
(or the lack of a transfer market) that was a big piece of our portfolio.
It's really just kind of repeated exposure to get our management and board
comfortable. They need to repeatedly see outputs and the tools. They used to be
really uncomfortable with exceedance curves, but we showed them enough times
that they got comfortable with them.
Environmental water supply reliability is not adequately represented in analyses
and policy discussions.
My major concern with water supply reliability estimates in the broad context of my
long career doing nothing but river system modeling is that there's this ever
increasing conflict over water supply in California. And that is coupled with an ever
broadening range of stakeholder interest. There are more people that are more
concerned about water supply reliability. From my perspective as a modeler, I see
that there's intense scrutiny of model results and what seems to be more and more
required is an intense need for personalized results of modeling.
From the modelers point of view, I believe that we work pretty diligently on ongoing
updates and upgrades. The solutions to a lot of these needs are not fundamentally

147
Review of Water Supply Reliability Estimation
Related to the Sacramento-San Joaquin Delta
technically difficult. In California where I do most of my work these days, it's the size
of the system and how complex it is that makes implementing solutions slow.
Modeling hydrology to represent one small corner of a watershed is not a daunting
task, but doing it at a scale that responds to the very picky specific question that
every single person who's concerned about what is playing in California has over
the entire state is a very big problem. My fundamental response to all this is we just
need more people.
There is a dearth of skilled modelers. It's also a double edge sword. Not many of us
(modelers) right now are taking the time to train people. This is a really big
problem. People move around and nobody stays and does the same thing for more
than five years anymore. The mobility challenge exists around the country. We're a
lot more mobile as a society. It's not a unique problem to California or water
resources in general by any stretch, but we need to either just keep training more
people so that out of the hundred people that you train, maybe five actually stick
around for the long term.
The other part of the question, how much of the problem is communication and
how much is model deficiency, is really interesting. My answer is kind of the same
as to the technical side of things. Understanding is a huge problem. Stakeholders
sometimes propose solutions that are infeasible because they either don't
understand how complicated the system is or they don't understand or don't trust
the models that produced results that they don't agree with or they don't like. If
people just understood the system and modeling better, then maybe that would
alleviate some problems with communication. Addressing this means more time
and more people to do outreach and really reach into all of the communities of
interest and stakeholder concern. We've talked about for years having monthly
counseling appreciation days, where information about the model is pitched to
perhaps a nontechnical audience or an environmental audience or something like
that. It would be great, but again, there is only so much time. It's another area
where having additional people would, would really help.
What are my major concerns about supply reliability? One of the difficult things is to
actually express reliability. How do you take the results of a model and turn it into a
number or several numbers to communicate in a report to managers? Impact
assessment? Typically our models produce monthly water supply estimates over a
range of water supply conditions or hydrologic conditions. Hydrologic conditions

148
Review of Water Supply Reliability Estimation
Related to the Sacramento-San Joaquin Delta
might be based on a cold start, or they might be based on historical conditions
transformed to take into effect climate change. My main concern is how we
quantify our model results, what should they be measured against? How do you
take results and express them in a way that is meaningful to water managers? We
need to think about how water agencies and irrigation districts react in the face of
supply reductions during dry conditions rather than thinking of them staying at a
fixed level.
When most people think about water supply reliability estimation, they tend to
think of it as really focused on water supply for agriculture and for general human
use. That gets to what I think is missing, which is really a broader definition and
understanding of the concept of the ecosystem. When most people talk about
water supply reliability, they're really thinking about one particular piece. And I
think that we need to think more collectively about all uses for water.
We need to develop flow criteria for all streams and rivers in California based on
the concept of functional flows. Try to come up with a way to define what's needed
for nature, either to be broadly ecologically protective or defining first cut
recommendations for specific management objectives, either ecological or to meet
specific needs for species. That part hasn't been adequately incorporated into the
water rely water reliability estimation. A lot of modeling just incorporates the
regulatory requirements for the environmental policy and they're treated as
constraints. Everything else is designed to meet contracts and supply. It's really
difficult in any process to have flexibility for ecosystem purposes.
Water supply reliability estimates are typically single sided. They focus on human
needs. We need a paradigm shifts so that we're thinking about it more holistically.
Regulatory constraints are a big part of it. We need to manage for an idea of
ecological sustainability rather than avoiding jeopardy. And I think that's something
that's really gotten us into, into problems in the past. When we model human
needs, they tend to be synonymous with, with contracted amounts of water.
There's no analysis of tradeoffs of different uses.
There's very little discussion of using conserved water for other purposes. We
currently have a hardened demand for water. This pops up in negotiations all of the
time including voluntary agreement discussions and collaborative discussions
about water management. There's this idea that there's a defined amount of water
that's needed for human use and that can't be changed or shouldn't be changed.

149
Review of Water Supply Reliability Estimation
Related to the Sacramento-San Joaquin Delta
We need to take a step back to really look at what the tradeoffs should be. Another
issue with current estimates is that we don't know how much water is needed to
support ecological function.
The demand side is a really big piece that is often left out of the discussions
because it's politically a difficult one to discuss.
My main concern is that models seem to sometimes or frequently overestimate
reliability. What happens then is that in times of shortage, the environment is often
the user that gets shorted. I think that way suppliers get away from better long
term planning and being explicit about assumptions. It's both a communication and
understanding problem. Sometimes it's model deficiency. An example is water
temperature planning during the drought.
In the grand scheme of things, e.g., a statewide water project like CVP operations, it
is more assumptions that go into a model before we enter drought, i.e., water that
was allocated before the drought. It is a lack of carry over storage and long term
planning for such a scenario. It's kind of a combination of all of those things. How
can the concerns be addressed? It's a tough one because of the scale at which
many of these decisions are made. It gets political and in a lot of these cases,
there's a lot of short term gain that is weighed over long term planning.
There's a lot of pressure from contractors if they see declining reservoirs to
increase their allocations. And you know where those pleas go, all the way up to the
upper echelon of government. Then the pressure comes back down to increase the
allocations where we really need to be thinking on a much longer scale than.
Contractors are just thinking one year where long term planning is what really
needs to happen. It's difficult to identify the best way to get there. One way to do it
would be to impose additional regulations and requirements within water rights
that require certain carryover storage levels for major droughts because it doesn't
seem like in the past they have been able to do it properly.
Different groups have different models doing their own analysis separately, which
can be useful by highlighting the range of, of results that can come out of these
models. It illustrates how we should not rely on one number coming out of these
models. Maybe that's the value we should expect from this modeling. There are
reductions here and there's an increase here and this is the approximate range,
these increases and decreases. We've been focused on the number. Instead, we

150
Review of Water Supply Reliability Estimation
Related to the Sacramento-San Joaquin Delta
need to be focused on what does this number mean and does this number make
sense?
Having a common model might be a benefit, particularly if it is transparent and
usable for most applications. I don't think that we have that yet.
Question 3. Are you comfortable using water supply reliability estimates to develop portfolios that include surface water, groundwater, reuse, and demand management? How could these studies be improved?
Our approach is like that in the financial world, not to have all of our eggs in one
basket. A portfolio, however, can be challenging to develop because components of
a water supply involve more than traditional water supply sources. For example,
conservation and recycled water are now important. Incorporating elasticity of
water demand in planning for demand management also can be beneficial and
needs to be included.
Modelers do what is asked of them, but they usually try to improve integration of
various models as well as seek improvements in specific models and data.
There has to be some willingness on all sides to take a little bit of risk in terms of
operating things to try to provide a, a greater overall benefit even though it may
provide some are risk and need some assurances to any particular entity that is
participating in. By drawing hard lines in terms of silos, it makes it much more
difficult to do that. In the projects that we are doing, everybody talks about multi-
benefit projects and how wonderful they are, but they're actually hard to
implement. How can we release the water or leave the water in the river to provide
flow benefits to habitat?
Groundwater is always a challenge. The capabilities are getting better. If we ever
see a CalSim3 with better integrated surface water and groundwater modelling, I
think that would be a benefit versus what we're doing now. There could be
improvement in terms of understanding the constraints that are associated with
the complex relationships between North and South and different agencies relative
to groundwater banking, how you move water around and the frequency of being
able to move that water into storage and get it out when you need it. And I think
more parties would be interested in participating in some of those projects if they
better understood the constraints and potential benefits.

151
Review of Water Supply Reliability Estimation
Related to the Sacramento-San Joaquin Delta
We have learned a lot on the local supply side. Some of the supplies that we
thought were drought proof were not as drought proof as we thought. Recycling is
easy to sell in droughts.
It's very difficult to estimate the demand responses during droughts and economic
recessions and to include the likes of emergency declaration. We've been collecting
data to try and better understand how demands come back or don't come back
from those conditions. The behavioral aspect is really hard to capture, it is really
hard to know how behavior will or won't persist beyond a drought or a recession.
You don't really put probabilities on the scenarios themselves. You put it on, for
example, how many of the scenarios are vulnerable.
The portfolio approach is a no-brainer and should be considered in the
environmental balance.
In terms of our sophistication and how we deal with that, portfolios reveal
shortcomings and where there is resilience. You can develop portfolios which we
would consider different strategies and they might see how components like
groundwater recharge interact. The conjunctive use itself or from groundwater may
be structural parts of the portfolio and reuse and water conservation nonstructural.
Put all these kinds of elements into a portfolio and you can evaluate resilience and
identify the promising portfolio. And that's the nice thing about looking at resilience
is your, your less focused on coming up with a precise or accurate estimate of both
climate change and adverse conditions. We know we're going to be wrong. We may
be wrong by everything. That's the margin. So rather than trying to come up with
the best projection of future water supplies and conditions, we just look at as a
large range as possible of future conditions. We can look for portfolios that are
resilient.
To incorporate resilience, I don’t think you're really building anything. Well, you've
got to build your management actions into the model. So there may be physical
facilitates or maybe new facilities and maybe reoperation of existing facilities such
as active groundwater management, you may be building in additional reviews.
They might, instead of assuming that title water coming off agricultural lands or
wastewater discharges to the river system, you're going to recapture those and
reuse and reuse that water. So that part is all that is big that's going to be built into
our operational models. But that I think what differentiates it is how you treat

152
Review of Water Supply Reliability Estimation
Related to the Sacramento-San Joaquin Delta
results. You identify a threshold under which when the performance if exceeded,
your system is broken down, it hasn't provided the surface water reliability that you
want. Then you look at the number of times that model results exceed a certain
threshold and you've run say hundreds of future possible conditions, under
different scenarios of climate change, sea level rise, population, and land use. And
what you're really looking at is a system that will have the smallest number of
exceedance of those thresholds. So you're not saying anything about the likelihood
of one. It just saying for all these possible scenarios, this particular portfolio of
water management actions results in only exceeding my critical threshold, let's say
at 25% shortage to an open moderation fee and only occurs one year in 94 years
or, or one month in how many months. It's more how we interpret the model
results.
A portfolio approach would be a big improvement. Conjunctively using ground
water and surface water is important. SGMA will lessen the availability of
groundwater and increase the demand for surface water which will further stress
riverine ecosystems.
There is also two sides of it, supply and demand. Portfolios should include both.
Sources should be considered holistically rather than managed separately. And I
think demand should be considered holistically as well. That would give us a better
sense of what the tradeoffs are between different types of uses and, and maybe
encourage switching between sources as well. Without integration, you're just kind
of addressing these separate needs in a vacuum.
We need to support the ability of water systems, which we between broadly
defined as rivers and streams as well as human infrastructure, to support native
biodiversity and ecosystems while meeting the needs of people. Part of that is to
have an understanding of whether our water system can meet needs into the
future under climate change scenarios. That includes periods of stress, such as
drought and flood and, fire and additional regulatory actions. Are we considering all
those things? Are we able to still meet a broad suite of needs? No way.
Maybe we're not inviting all the right people to be a part of the discussion. We focus
a lot on the water users and the agencies, and a little bit on the NGOs. Water users
are going to dominate the conversation. I think that's part of why we end up in the
same place most of the time, the same people who built the system to provide for

153
Review of Water Supply Reliability Estimation
Related to the Sacramento-San Joaquin Delta
human supply and to maximize are in charge. Those people have the strongest
voice and it's not going to change because it’s designed to meet their needs.
I think it would be really helpful if models were more holistic. Perhaps decision
analysis where you have a structure and often a structure and collaborative process
where you would build a model that can look at competing objectives. You can have
more than one model and use them structure uncertainty in your view of the
system. If we took that kind of approach, it, it would help a lot because then we
would have models that would be built explicitly to meet the objectives of the
group rather than just a water supply for human objectives.
Question 4. Are environmental and ecological flows treated adequately by water supply reliability estimation? If not, how can environmental water reliability be better addressed?
In our own planning, environmental flows are paramount. We try to meet both flow
and water quality requirements before any diversions can occur. If I put an
academic hat on for just a minute, I understand the issue around the question: fish
don't have water rights per se. Maybe California needs a steward like a Delta water
master for environmental rights or for the entire system.
Anything we do going forward has tradeoffs and risk. In order to increase water
supply reliability in terms of knowing that we are putting water to best use in terms
of priorities relative to agriculture and the environment, we really need better
information on those tradeoffs and risks. One of our, our biggest dilemmas is on
the environmental side. We don't understand well enough from fisheries,
ecosystems, and habitat standpoints what the water tradeoffs are in terms of trying
to increase supply reliability to agriculture. At the same time we are trying to
improve the environment. How do we strike the balance and how do we
understand the risks to both sides in terms of changing operations with new
projects?
Generally, the challenging part of reliability estimation is on the habitat and
ecosystem side. That is where it's very hard to identify the risk and to convince
agents to participate in something a little more creative that might lead to a larger
good and higher priority use of a block of water that they have available. They're
just not geared to thinking that way. If they did, it's a different mindset versus a
regulatory mindset or an impact mitigation mindset that they're used to dealing

154
Review of Water Supply Reliability Estimation
Related to the Sacramento-San Joaquin Delta
with. We have to move the whole discussion into a different arena in terms of what
agencies are allowed to do and, and how they can participate. I know that's all kind
of a high level, but in terms of moving forward in a meaningful way to improve
reliability and protect the environment and enhancing the environment, those are
the sorts of things that really have to happen because the current regulatory
structure and the current operational structure is just not conducive to that sort of
support for multi-benefit projects that really could have a larger benefit if there was
enough collaboration to put the pieces together and make it happen.
There's kind of two different questions here. Estimates reflect the current
regulatory regime and demand for that water first and then they produce the
estimates of supply that come after them. In the modeling, I think they treat those
flows adequately. The other question, which is a different question, is are those
existing flows adequate by themselves? I think that's a different question which I
cannot answer. But as far as the modeling, yes, I think they had a mechanism to
sort of account for those flows, if that makes sense.
Water supply reliability is a promising idea to encourage water suppliers to
diversify. But the “dark side” is that it often means “how much can I extract as often
as possible.” This perspective sees environmental water demand as antagonistic to
the whole concept of water supply reliability.
Environmental regulations are needed to show that society values the environment
– to make sure that water supply reliability is viewed holistically.
A daily model could certainly be appropriate for environmental. Environmental and
ecological flows are challenging. We do have temperature models, habitat models,
water quality, and salinity models, but the suite of modeling tools needs to be able
to talk to each other. There are daily variability components that we can build into
our monthly decisions, but for now, the lift that it would take to make this a daily
tool is beyond possible. But that's just my personal opinion. Maybe the answer is
that we build some kind of a daily operational tool that literally is used on a one-
year basis.
So typically, system or management models have 30 calls times steps in one month.
It just the first building block in a, in a heated analysis in which the upstream model
provides information to a downstream model. The problem with our current
analysis is with monthly times model times you are trying to say something about

155
Review of Water Supply Reliability Estimation
Related to the Sacramento-San Joaquin Delta
fishing fish survival. A colleague once noted that if you took the air out of the room
you're in for 15 minutes, it would not be good for your survival. But if we average
the air condition where you know the conditions on a monthly basis, there is no
problem. I think we have both temporal and spatial resolution issues in our
temporal analysis. In our management models, we're not looking at what might be
best for the environment. Where will we impose the current regulatory
requirement? And there is, there is no sort of flexibility.
The Delta is a large portfolio. A huge portion of the portfolio for one user might be
the only one for others. Keeping that in mind in the planning, framing some of the
impacts within those portfolios is one way to help mitigate conflicts. That's different
than what was done in the past. Portfolios of environmental management actions
are a little bit more tricky. There may be multiple ways we can meet the same
environmental goals. Whether it is habitat or flow, for example, we can
acknowledge that there might be different ways to meet these same goals. And so
potentially there could be this trade off. If a certain habitat is still there then, there
could be a reduction in flows. They can meet the same objectives.
It is really difficult to model and to do it accurately. It's really important to have a
discussion of climate change. With climate change and SGMA there is potential
increased environmental flows. These will have a huge impact on the water supply
available for diversion.
Question 5. Is climate change treated adequately by water supply reliability estimation? If not, how can water supply reliability estimation address climate change?
Climate change is layered on top of a portfolio that includes many components and
presents a complexity challenge for decision makers. We formerly used the
droughts of historic record to build robustness into our planning, but it appears
that is no longer adequate with climate change. Climate change is an area where
the DISB water supply reliability review might add value by sharing how new
methods approach this problem.
Hard to integrate changes in climate on decadal scale, with operations at a monthly
level and water quality and flood responses on an hourly or shorter scales.
The first challenge is understanding what the climate change models are predicting,
what is the range of variation in them, and why is that variation there?
156
Review of Water Supply Reliability Estimation
Related to the Sacramento-San Joaquin Delta
If you look at climate change, which is one of the big driving factors for future water
supply reliability estimation, models are coming. What is not clear to me is how
those models and their assumptions play into what we are looking at. Because we
are so far downstream in our modeling, we can certainly address certain issues of
operations and how to do operations at a monthly timescale. But I believe the
longer time scales are really important to assess effects of climate change. The
upstream effects are not understood in terms of what assumptions are in the
models.
With things changing under future climate change conditions and different
scenarios of the future may look like, I think it is going to be more and more
important in terms of how do we do this. It is not just the water supply side, but
also on the flood side, which is of course tied to water supply and groundwater
management. We're just not structured to really facilitate, support and develop
these multi-benefit projects. In terms of the way the agencies review things, they
are focused on regulations. We need to step back from things and look at what is
the best ways to use water and ask how do we get different agencies in water
resources management to cooperate with environmental agencies and take a little
bit of risk for the greater good.
Climate change is huge in terms of changes in precipitation, timing of runoff and
sea level rise. We include a climate change component in everything we do these
days and you're not sure exactly where things are going to go in the future. Some of
the climate change estimates, especially on the flood side, are kind of extreme and
we are trying to better understand what that really means. From water supply and
ecosystem standpoints, water temperature management strategies are a practical
concern. We have also looked at lots of different climate scenarios.
We pretty much work with the historical hydrology because that seems to be what
folks are most comfortable with. We do look at design conditions in terms of the
historical seven-year droughts in 1976 and 1977 and, and those sorts of things in
terms of looking at the historical hydrology and, and extracting pieces of it. We have
not gotten into a lot of stochastic stuff or Monte Carlo stuff. There just don't seem
to be accepted although I personally think they are needed as we go forward. And
understanding that simply looks at the last 82 years of our hydrology or a climate
perturbed 82 years is not going to be adequate because there is uncertainty in the
future and we need to take alternative approaches in terms of what is needed for

157
Review of Water Supply Reliability Estimation
Related to the Sacramento-San Joaquin Delta
design and, and planning and understanding, potential envelopes of future
reliability relative to where things are going to be going. It's kind of amazing where
we are now and kind of the traditional approaches we're still using and how hard it
is to convince folks to move outside that and do things that are a little more
unconventional. There seems to be a resistance there.
Is climate change treated adequately? I think not. We have a lot to learn about how
climate change is impacting groundwater and surface water and how to
incorporate it into our models.
Most people have one climate projection or one central tendency climate projection
to work with. Trying to get people more comfortable with that space as multiple
futures is a challenge. We have been doing this with portfolio planning since the
early nineties.
Concerned that climate change is being used to ignore ecosystems.
We've been working with climate change scenarios for well over a decade in a
variety of studies. There have been a number of climate scenario development
efforts by different agencies too. All have used completely different perspectives to
develop climate projections. What emissions scenarios? What future pathways and
adaptation strategies might be in place? I think these are at least partially policy
calls.
We already are challenged when we try to model extremes. Then you want to
address impacts caused by climate change on water supply reliability. Over the last
10 years we've taken two approaches. We take downscaled results from a particular
GCM model and apply that as one particular scenario or we take a different
approach and use a collection of GCM’s and downscaled results, which
approximately tell the same story. We take groups of model results to represent
different climate warmings or changes in precipitation. We're not only present
water supply reliability for the natural hydrologic variation, but we're also saying
this is the water supply reliability under different projections of the future. Those
aren't disentangled very well when we look at water supply reliability, but we get
from model the variability under changing climate conditions.
Climate change is a tough one. Addressing ecosystem needs has become even
more crucial when we consider climate change. There will be a whole different suite

158
Review of Water Supply Reliability Estimation
Related to the Sacramento-San Joaquin Delta
of stressors. Well not necessarily different but more intensive. One insight from the
recent drought that is when we think about climate change under drought
conditions, we think of water scarcity. But what shows up in the data is that drought
removes natural variability from a hydrograph. So as the drought continued, we
were managing straight line flows.
Question 6. How can unreliability be addressed in water supply reliability estimation? How can estimates of variability and uncertainty be improved.
Uncertainties from upstream models (hydrology, etc.) are neglected in water supply
reliability estimation. Estimating uncertainties for climate change and adaptations
to climate change are a challenge. A Monte Carlo approach might give a different
result. Currently we rely more on historical hydrology and rely less on distributions
of what could happen.
Common standards.
We definitely need better data to support the tools, and consistency of application
between tools and things. Monthly models are wonderful for some applications,
but we need to look at other applications from a daily basis when, especially when
we're looking at various and different flow regimes and the frequency and duration
of diversions into bypasses. Diversions do provide the fisheries folks and other
biologists with information to help them assess the impact of diversions. Would this
be beneficial or impactful?
Our model are monthly models. You hear a lot of talk about these big atmospheric
rivers and short time periods where you're having a lot of runoff. Those are things
that are not captured. A lot of work needs to be done to improve how the state
water project captures climate change and uncertainty.
A major concern is how to best capture uncertainty in all of the inputs. We use a
process called robust decision making, which is a way to get at uncertainty (Mankin
et al. 2020). For example, we know that there are a lot of different climate models
and a lot of assumptions go into them. And then they are down-scaled and create
uncertainty in space and how that will impact our supplies from the Colorado River,
the State Water Project, and locally. Robust decision-making aggregates and
considers the impacts of all the components of climate change. You can separate
precipitation effects, temperature effects, and expand the range of climate impact
beyond the model sets that currently exist. That takes a lot of computing power.

159
Review of Water Supply Reliability Estimation
Related to the Sacramento-San Joaquin Delta
The way that we have approached uncertainty with robust decision making is a little
bit different. You actually sort the uncertainty space by defining a range of
temperature and precipitation changes. So for instance, for the Colorado River
basin, we might look at a temperature increase ranging from zero to four degrees
Celsius. And we would look at a precipitation change of plus or minus 20%.
Sometimes it's not appreciated how sensitive model outputs can be to subjective
model inputs. The trouble is the models do well on the initial range of hydrologic
conditions. They do well in a normal year. As you stress the system, such as in
extreme droughts, they do not do as well. That is precisely the condition when
water managers are most interested.
Reliability is a major limitation for extreme conditions. That makes a lot of sense
because a model is a simplification of all operating worlds. We assume a set of
operating rules that apply under most conditions.

160
Review of Water Supply Reliability Estimation
Related to the Sacramento-San Joaquin Delta
Appendix C. Acronyms/Glossary
CalSim – California Simulation model, DWR-USBR model of Central Valley, CVP, and
SWP water supply operations and planning
CalLite – simplified CalSim model, DWR and USBR have separate versions
CALVIN – California Value Integrated Network (UC Davis – UC Merced system
optimization model)
CCWD – Contra Costa Water District
CEFF – California Environmental Flows Framework
CRSS – Colorado River Simulation System (USBR)
CVP – Central Valley Project (federal)
DCO – Delta Coordinated Operations
DSM2 – Delta Simulation Model 2 – DWR hydrodynamics and water quality model of
the Delta
DWR – Department of Water Resources, California
EBMUD – East Bay Municipal Utility District
EDF – Environmental Defense Fund
IRPSIM – Integrated Regional Planning Simulation (MWDSC model)
LCPSIM – Least-Cost Planning Simulation (DWR model of urban water service area
economics and decisions)
MWDOC – Municipal Water District of Orange County
MWDSC – Metropolitan Water District of Southern California
MWQI – Municipal Water Quality Investigations (DWR program)
SacWAM – SWRCB simulation model for Sacramento Valley and Delta
SCVWD – Santa Clara Valley Water District

161
Review of Water Supply Reliability Estimation
Related to the Sacramento-San Joaquin Delta
SDCWA – San Diego Country Water Authority
SFPUC – San Francisco Public Utility Commission
SGMA – Sustainable Groundwater Management Act, California’s 2014 legislation on
groundwater overdraft
SWAP – Statewide Agricultural Production Model
SWP – State Water Project
SWRCB – State Water Resources Control Board
TNC – The Nature Conservancy
USBR – US Bureau of Reclamation
UWMP – Urban Water Management Plan
WEAP – Water Evaluation And Planning water supply simulation model

162
Review of Water Supply Reliability Estimation
Related to the Sacramento-San Joaquin Delta
References
Adams, K.D., R.M. Negrini, E.R. Cook, and S. Rajagopal. (2015). Annually resolved
Late Holocene paleohydrology of the Southern Sierra Nevada and Tulare Lake,
California. Water Resources Research, Vol. Volume51, Issue12, December, pages
9708-9724.
Adams, L., J. Lund, P. Moyle, R. Quiñones, J. Herman, and T. O'Rear. (2017).
Environmental hedging: A theory and method for reconciling reservoir operations
for downstream ecology and water supply. Water Resources Research, 53(9), 7816-
7831.
Adams, L. (2018), Optimized Reservoir Management for Downstream
Environmental Purposes, PhD dissertation, Department of Civil and Environmental
Engineering, University of California, Davis.
Abdallah, A. and D.E. Rosenberg. (2019). A data model to manage data for water
resources systems modeling. Environmental Modelling & Software, 115, 113-127.
Aguado, E., D. Cayan, L. Riddle, and M. Roos. (1992). Climatic Fluctuations and the
Timing of West Coast Streamflow, Journal of Climate, 5(12), 1468–1483. Retrieved
Jan 12, 2022.
Ahmad, S. (2016). Managing Water Demands for a Rapidly Growing City in Semi-Arid
Environment: Study of Las Vegas, Nevada. Int. J. Water Resource. Arid Env, 5(1), 35-
42.
Alam, S., M. Gebremichael, R. Li., J. Dozier, and D.P. Lettenmaier (2020). Can
Managed Aquifer Recharge Mitigate the Groundwater Overdraft in California’s
Central Valley? Water Resources Research, 56(8).
Albano, C.M., M.I., McCarthy, M.D. Dettinger, et al. Techniques for constructing
climate scenarios for stress test applications. Climatic Change 164, 33 (2021).
Albano, C.M., J.T. Abatzoglou, D.J. McEvoy, J.L. Huntington, C.G. Morton, M.D.
Dettinger, and T. J. Ott. (2022) “A Multi-Dataset Assessment of Climatic Drivers and
Uncertainties of Recent Trends in Evaporative Demand across the Continental US.”
Journal of Hydrometeorology 1 (aop).

163
Review of Water Supply Reliability Estimation
Related to the Sacramento-San Joaquin Delta
Alexander, C.A., F. Poulsen, D.C. Robinson, B.O. Ma, and R.A. Luster. (2018).
Improving Multi-Objective Ecological Flow Management with Flexible Priorities and
Turn-Taking: A Case Study from the Sacramento River and Sacramento–San Joaquin
Delta. San Francisco Estuary and Watershed Science, 16 (1).
Al-Juaidi, A. E., and T. Hegazy (2017). Conflict resolution for Sacramento-San-Joaquin
delta with stability and sensitivity analyses using the graph model. Journal of
Advances in Mathematics and Computer Science, 1-10.
Ariyama, J.,G.F. Boisramé, and M.R. Brand (2019). Water budgets for the Delta
Watershed: Putting together the many disparate pieces. San Francisco Estuary and
Watershed Science, 17(2).
Arnold, W. (2021). The Economic Value of Carryover Storage in California’s Water
Supply System with Limited Hydrologic Foresight. MS Thesis, Department of Civil
and Environmental Engineering, University of California, Davis.
Arthington, A.G. (2012). Environmental Flows-Saving Rivers in the Third Millennium,
University of California Press, Berkeley, CA. 406 pp.
Arthington, A.H., J.G. Kennen, E.D. Stein, and J.A. Webb. (2018). Recent advances in
environmental flows science and water management-Innovation in the
Anthropocene. Freshwater Biol., 63, 1022– 1034.
Arthington, A.H, A. Bhaduri, S.E. Bunn, SE, Jackson, R.E. Tharme, D. Tickner, W.
Young, M. Acreman, N. Baker, S. Capon, A.C. Horne, E. Kendy, N.E. McClain, L.N.
Poff, B.D. Richter, and S. Ward. (2018). The Brisbane Declaration and Global Action
Agenda on Environmental Flows. Frontiers in Environmental Science, vol. 6, no. 45.
Arrow, K. J., and R.C. Lind. (1970). Uncertainty and the evaluation of public
investment decision. American Economic Review, 60, 364–378.
Bain, J.S., R.E. Caves, and J. Margolis. (1966), Northern California's Water Industry.
The John Hopkins Press, Baltimore, MD.
Bane, B. (2020). Error Correction Means California’s Future Wetter Winters May
Never Come. PNNL.
Barnes, G.W., and F.I. Chung, F. I. (1986). Operational Planning for California Water
System. Journal of Water Resources Planning and Management, 112(1), 71–86.

164
Review of Water Supply Reliability Estimation
Related to the Sacramento-San Joaquin Delta
Barsugli, J., C. Anderson, J.B. Smith, and J.M. Vogel. (2009). Options for Improving
Climate Modeling to Assist Water Utility Planning for Climate Change, Water Utility
Climate Alliance, San Francisco, CA.
Basson, M.S., R.B. Allen, G.G.S. Pegram, and J.A. van Rooyen. (1994).Probabilistic
Management of Water Resource and Hydropower Systems, Water Resources
Publications, Highlands Ranch, CO.
[BAWSCA] Bay Area Water Supply and Conservation Agency. (2015), Long-Term
Reliable Water Supply Strategy, Strategy Phase II Final Report, February.
Becker, L, W.W.G. Yeh, D. Fults, and D. Sparks. (1976). Operations models for
Central Valley Project. J. Water Resour. Plann. Manage. Div., 102, WR1 (April).
Bellido-Leiva, F.J., R.A. Lusardi, and J.R. Lund. (2021). Modeling the effect of habitat
availability and quality on endangered winter-run Chinook salmon (Oncorhynchus
tshawytscha) production in the Sacramento Valley, Ecological Modeling, 447,
109511.
Borchers, J.W., M. Carpenter, V.K. Grabert, B. Dalgish, and D. Cannon. (2014). Land
subsidence from groundwater use in California. Luhdorff and Scalmanini
Consulting Engineers, California Water Foundation.
Bovee, K. D. (1982). A guide to stream habitat analysis using the instream flow
incremental methodology. U. S. Fish and Wildlife Service, Office of Biological
Services, Instream Flow Information Paper 12, FWS/OBS-82/26, Washington, D.C.
Brill, E. D., Jr., Chang, S.-Y., and Hopkins, L. D. (1982). “Modeling to generate
alternatives: The HSJ approach and an illustration using a problem in land use
planning.” Manage. Science, 28(3), 221-235.
Brown, C.M., J.R. Lund, X. Cai, P.M. Reed, E.A. Zagona, A.Ostfeld, J. Hall, G.W.
Characklis, W. Yu, and L. Brekke.(2015). The Future of Water Resources Systems
Analysis: Toward a Scientific Framework for Sustainable Water Management. Water
Resources Research 51 (8): 6110-24.
Brown, C., Y. Ghile, M.A., Laverty, and K. Li. (2012). Decision scaling: Linking bottom-
up vulnerability analysis with climate projections in the water sector. Water Resour.
Res., 48(9), W09537.

165
Review of Water Supply Reliability Estimation
Related to the Sacramento-San Joaquin Delta
Campbell, D.T. (1979). "Assessing the impact of planned social change". Evaluation
and Program Planning. 2 (1): 67–90.
Cao, Q., S. Shukla, M.J. DeFlorio, F.M. Ralph, and D.P. Lettenmaier. 2021. “Evaluation
of the Subseasonal Forecast Skill of Floods Associated with Atmospheric Rivers in
Coastal Western U.S. Watersheds.” Journal of Hydrometeorology 22 (6): 1535–52.
Cardwell, H., H.I. Jager, and M.J. Sale. (1996), Designing Instream Flows to Satisfy
Fish and Human Water Needs. Journal of Water Resources Planning and
Management 122(5).
[CEFWG] California Environmental Flows Working Group. 2020. California
Environmental Flows Framework. California Water Quality Monitoring Council
Technical Report 37 pp.
Chan, E. Y. Y., and J. Y. E. Ho. (2019). Urban Water and Health Issues in Hong Kong.
In Urban Drought (pp. 241-262). Springer, Singapore.
Chen, W-H, K. Haunschild, J.R. Lund, and W. Fleenor, Current and Long-Term Effects
of Delta Water Quality on Drinking Water Treatment Costs from Disinfection
Byproduct Formation, San Francisco Estuary and Watershed Science, 8(3).
Chikamoto, Y., S.-Y. Wang, M. Yost, L. Yocom, and R. Gillies. (2020). Colorado River
water supply is predictable on multi-year timescales owing to long-term ocean
memory,” Communications Earth & Environment.
Close, A., W.M. Hanemann, J.W. Labadie, D.P. Loucks (Chair), J.R. Lund, D.C.
McKinney, and J.R. Stedinger. (2003). A Strategic Review of CALSIM II and its Use for
Water Planning, Management, and Operations in Central California, Report to the
California Bay Delta Authority Science Program, Sacramento, CA.
Cohon, J.L., and D.H. Marks. (1975). A review and evaluation multiobjective
programming techniques. Water Resources Research, 11(2), 208-220.
Connell-Buck, C.R., J. Medellín-Azuara, J.R. Lund, and K. Madani. (2011).Adapting
California’s water system to warm vs. warm-dry climates. Climatic Change,109 (Sup
1), S133–S149.
[CSU] Colorado State University (2017), “What is Modsim-DSS?” MODSIM-DSS.
Accessed 6 July, 2020.

166
Review of Water Supply Reliability Estimation
Related to the Sacramento-San Joaquin Delta
[CWEMF] California Water and Environmental Modeling Forum. (2021), Protocols
for Water and Environmental Modeling, Draft Final. April 7, 2021.
Davies, PM, RJ Naiman, DM Warfe, NE Pettit, AH Arthington, and SE Bunn. 2014.
Flow–ecology relationships: Closing the loop on effective environmental flows.
Marine and Freshwater Research, 65: 133–141.
Delaney, C.J., et al. (2020), Forecast informed reservoir operations using ensemble
streamflow predictions for a multipurpose reservoir in northern California,Water
Resources Research, ,56(9), e2019WR026604.
Dettinger, M., B. Udall, and A. Georgakakos. (2015). Western water and climate
change: Ecological Applications, 25(8), 2069 to 2093.
Dettinger, M. (2011). Climate Change, Atmospheric Rivers, and Floods in
California—A Multimodel Analysis of Storm Frequency and Magnitude Changes.
Journal of the American Water Resources Association, 47(3), 514 to 523.
[DIB] Defense Innovation Board. (2019). Software Is Never Done: Refactoring the
Acquisition Code for Competitive Advantage. May 3, 2019.
Dietze, M.C. (2017). Prediction in Ecology: A First-Principles Framework. Ecological
Applications 27 (7), 2048-2060.
[Delta ISB] Delta Independent Science Board (2015). Flows and Fishes in the
Sacramento-San Joaquin Delta: Research Needs in Support of Adaptive
Management. Sacramento, CA.
[Delta ISB] Delta Independent Science Board. (2016). Improving Adaptive
Management in the Sacramento-San Joaquin Delta. Sacramento, CA.
[Delta ISB] Delta Independent Science Board. (2018). Water quality science in the
Sacramento-San Joaquin Delta. Chemical contaminants and nutrients. Sacramento,
CA.
Dittrich, R., Wreford, A., Moran, D., 2016. A survey of decision-making approaches
for climate change adaptation: Are robust methods the way forward? Ecological
Economics 122, 79-89.

167
Review of Water Supply Reliability Estimation
Related to the Sacramento-San Joaquin Delta
Doering, K., J. Quinn, P. Reed, and S. Steinschneider, (2021). Diagnosing the Time-
Varying Value of Forecasts in Multiobjective Reservoir Control. Journal of Water
Resources Planning and Management, 147(7).
Dogan, M. , M. Fefer, J. Herman, Q. Hart, J. Merz, J. Medellin-Azuara, and J. Lund “An
open-source Python implementation of California's hydroeconomic optimization
model,” Environmental Modelling and Software, Vol. 108, pages 8 to13, October
2018.
Dogan, M., I. Buck, J. Medellin-Azuara, and J. Lund, (2019). Statewide Effects of
Ending Long-Term Groundwater Overdraft in California,” Journal of Water
Resources Planning and Management, 149(9).
Draper, A.J., M.W. Jenkins, K.W. Kirby, J.R. Lund, and R.E. Howitt (2003). Economic-
Engineering Optimization for California Water Management. Journal of Water
Resources Planning and Management, 123(3), 155-164.
Draper, A., A. Munévar, S. Arora, E. Reyes, N. Parker, F. Chung, and L. Peterson
(2004). CalSim: Generalized Model for Reservoir System Analysis. Journal of Water
Resources Planning and Management, 130(6).
Dupuit, J. (1853). De l'utilité et de sa mesure: de l’utilité publique", Journal des
économistes (Jul),1-27.
Durand, J., F. Bombardelli, W. Fleenor, Y. Henneberry, J. Herman, C. Jeffres, M.
Leinfelder-Miles, J. Lund, R. Lusardi, B. Milligan, A. Manfree, J. Medellín-Azuara, and
P. Moyle. (2020), Drought and the Sacramento-San Joaquin Delta, 2012-2016:
Environmental Review and Lessons. San Francisco Estuary and Watershed Science,
18(2).
[DWR] Department of Water Resources. (1930). State Water Plan, Division of Water
Resources Bulletin 25, California Department of Public Works, Sacramento, CA.
[DWR] Department of Water Resources. (1983). California Water Plan Update,
Bulletin 160-83, California Department of Water Resources, Sacramento, CA.
[DWR] Department of Water Resources. (1987). California Water: Looking to the
Future, Bulletin 160-87, California Department of Water Resources, Sacramento, CA.

168
Review of Water Supply Reliability Estimation
Related to the Sacramento-San Joaquin Delta
[DWR] Department of Water Resources. (1998). California Water Plan Update,
Bulletin 160-98, California Department of Water Resources, Sacramento, CA.
[DWR] Department of Water Resources. (2018). Water portfolios.
[DWR-BDO] California Department of Water Resources, Bay-Delta Office. (2016).
Estimates of Natural and Unimpaired Flows for the Central Valley of California:
Water Years 1922-2014, Draft. Sacramento, CA.
[DWR] Department of Water Resources. (2015). Bay Delta Conservation
Plan/California WaterFix Partially Recirculated Draft Environmental Impact
Report/Supplemental Draft Environmental Impact Statement. Sacramento (CA):
California Department of Water Resources.
[DWR] Department of Water Resources. (2017). State Water Project Delivery
Capability Report 2017. California Department of Water Resources, Sacramento, CA.
[DWR and USBR] Department of Water Resources and United States Bureau of
Reclamation. (2017). CalSim 3: A Water Resources System Planning Model for State
Water Project (SWP) & Central Valley Project (CVP).
[DWR] Department of Water Resources. (2018). Water Available for Replenishment
Report (Sacramento CA: California Department of Water Resources) (seemingly
unavailable from the DWR website).
[DWR] Department of Water Resources. (2018). Climate Action Plan Phase 2:
Climate Change Analysis Guidance (Sacramento CA: California Department of
Water Resources), September 2018.
[DWR] Department of Water Resources. (2019). Climate Action Plan, Phase 3:
Climate Change Vulnerability Assessment (Sacramento CA: California Department
of Water Resources), February 2019.
[DWR] Department of Water Resources. (2020), State Water Project Delivery
Capability Report 2019. California Department of Water Resources, Sacramento, CA.
[EBMUD] East Bay Municipal Utility District. (2021). Urban Water Management Plan
2020. Oakland, CA, Public Draft, April.

169
Review of Water Supply Reliability Estimation
Related to the Sacramento-San Joaquin Delta
Elmer, M. (2020). The Water Authority Is Resurrecting Its Pipe Dream – Again. Voice
of San Diego, 2 September.
Erfani, T., K. Pachos, and J. Harou. (2018). Real-Options Water Supply Planning:
Multistage Scenario Trees for Adaptive and Flexible Capacity Expansion Under
Probabilistic Climate Change Uncertainty. Water Resources Research, 54, 5069-
5087.
Escriva-Bou, A., R. Hui, S. Maples, J. Medellín-Azuara, T. Harter, and J. Lund (2020a)
Planning for Groundwater Sustainability Accounting for Uncertainty and Costs: an
Application to California's Central Valley. Journal of Environmental Management,
Volume 264, 110426.
Escriva-Bou, A., H. McCann, E. Hanak, J. Lund, B. Gray, E. Blanco, J. Jezdimirovic, B.
Magnuson-Skeels, and A. Tweet (2020b). Water Accounting in the Western U.S.,
Australia and Spain: a Comparative Analysis. Journal of Water Resources Planning
and Management, Vol. 146, Iss. 3, March.
Escriva-Bou, A., and E. Hanak. (2018), Appendix A: Update of the San Joaquin Valley’s
Water Balance and Estimate of Water Available for Recharge in 2017. In Hanak et al
(2018) Replenishing Groundwater in the San Joaquin Valley. PPIC.
FIRO Steering Committee. 2017. Preliminary viability assessment of Lake
Mendocino forecast informed reservoir operations.
FitzHugh, T. (2016). Quantifying Uncertainty through Position Analysis in Drought
Water Supply Planning: Examples from California. PowerPoint presentation, PNWS-
AWWA, Boise, ID.
Fleenor, W., E. Hanak, J. Lund, and J. Mount (2008). Delta Hydrodynamics and Water
Quality with Future Conditions. Appendix C to Comparing Futures for the
Sacramento-San Joaquin Delta, Public Policy Institute of California, San Francisco,
CA, July 2008.
Fleenor, W. E., W.A. Bennett, P.B. Moyle, and J.R. (2010). On developing prescriptions
for freshwater flows to sustain desirable fishes in the Sacramento-San Joaquin
Delta. Report to California Water Board, Center for Watershed Sciences, Unicersity
of California – Davis.

170
Review of Water Supply Reliability Estimation
Related to the Sacramento-San Joaquin Delta
Fletcher, S., M. Lickley, and K. Strzepek. (2019). Learning about climate change
uncertainty enables flexible water infrastructure planning. Nature Communications,
1782.
Ford, D., L. Grober, T. Harmon J.R. Lund (Chair) and D. McKinney. (2006). Review
Panel Report, San Joaquin River Valley CalSim II Model Review, CALFED Science
Program – California Water and Environment Modeling Forum, Sacramento, CA.
Frank, R.M. (2010). A new dawn for the Sacramento-San Joaquin Delta? Assessing
the 2009 California Delta/Water Legislation, Ecology Law Currents, 37(17). 17-26.
Gartrell, G., J. Mount, E. Hanak, A. Escriva-Bou, and B. Gray. (2017). Appendix B:
Water Assigned to Meeting Environmental Standards in the Delta from 1980–2016,
PPIC, San Francisco, CA.
Gartrell, G., J. Mount, and E. Hanak (2022). Tracking Where Water Goes in a
Changing Sacramento–San Joaquin Delta, Technical Appendix: Methods and
Detailed Results for 1980–2021. PPIC, San Francisco, CA.
Gheisi, A., M. Forsyth, M., and G. Naser. (2016). Water distribution systems
reliability: A review of research literature. Journal of Water Resources Planning and
Management, 142(11), 04016047.
Gleick, P. H. (2006). Water and terrorism. Water policy, 8(6), 481-503.
Gleick, P.H. (1987).The development and testing of a water balance model for
climate impacts assessment: Modeling the Sacramento Basin, Water Resour. Res.,
23, 1049-1061.
Gleick, P.H. (1989). Climate Change, Hydrology, and Water Resources. Reviews of
Geophysics, 27(3), 329-344.
Grantham, T.E., D.M. Carlisle, G.J. McCabe, and J.K. Howard. (2018). Sensitivity of
streamflow to climate change in California. Climatic Change, 149(3-4), 427 -441.
Grantham, T.E. and J.H. Viers (2014) 100 years of California's water rights system:
patterns, trends and uncertainty. Environ. Res. Lett.. 9 084012.
Grantham, T.E., J.H. Viers, and P.B. Moyle. (2014). Systematic Screening of Dams for
Environmental Flow Assessment and Implementation. BioScience, 64(11)1006-1018.

171
Review of Water Supply Reliability Estimation
Related to the Sacramento-San Joaquin Delta
Groves, D., E. Bloom, R. Lempert, J. Fischbach, J. Nevills, and B. Goshi. (2014).
Developing Key Indicators for Adaptive Water Planning. J. Water Resour. Plann.
Manage. , 10.1061/(ASCE)WR.1943-5452.0000471 , 05014008.
Groves, D.G., Molina-Perez, E., Bloom, E., Fischbach, J.R., 2019. Robust Decision
Making (RDM): Application to Water Planning and Climate Policy, in: Marchau,
V.A.W.J., Walker, W.E., Bloemen, P.J.T.M., Popper, S.W. (Eds.), Decision Making under
Deep Uncertainty: From Theory to Practice. Springer International Publishing,
Cham, pp. 135–163.
Harou, J.J., M. Pulido-Velazquez, D.E. Rosenberg, J. Medellin-Azuara, J.R. Lund, and
R.E. Howitt. (2009). Hydro-economic Models: Concepts, Design, Applications, and
Future Prospects. Journal of Hydrology, 375 (3-4), 627-643.
Harou, J.J., J. Medellin-Azuara, T. Zhu, S.K. Tanaka, J.R. Lund, S. Stine, M.A. Olivares,
and M.W. Jenkins. (2010a).Economic consequences of optimized water
management for a prolonged, severe drought in California.Water Resources
Research, 46(5).
Harou, J.J., D. Pinte, A. Tilmant, D.E. Rosenberg, D.E. Rheinheimer, K. Hansen, P.M.
Reed, A. Reynaud, J. Medellin-Azuara, M. Pulido-Velazquez, E. Matrosov, S. Padula,
and T. Zhu. (2010b). An open-source model platform for water management that
links models to a generic user-interface and data-manager, International
Environmental Modelling and Software Society (iEMSs) 2010 International Congress
on Environmental Modelling and Software Modelling for Environment’s Sake, Fifth
Biennial Meeting, Ottawa, Canada, David A. Swayne, Wanhong Yang, A. A. Voinov, A.
Rizzoli, T. Filatova (Eds.).
Hashimoto, T., D.P. Loucks, and J.R. Stedinger. (1982b). Robustness of Water
Resources Systems. Water Resources Research, 18(1), 21-26.
Hashimoto, T., J.R. Stedinger, and D.P. Loucks. (1982a). Reliability, Resiliency, and
Vulnerability Criteria for Water Resource System Performance Evaluation. Water
Resources Research, Vol. 18(1),14-20.
Hazen, A. (1914), “Storage to be provided in impounding reservoirs for municipal
water supply,” Transactions of the American Society of Civil Engineers, 77, 1542-
1669 (including discussions).

172
Review of Water Supply Reliability Estimation
Related to the Sacramento-San Joaquin Delta
Herman, J.D., J.D. Quinn, S. Steinschneider, M. Giuliani, and S. Fletcher. (2020).
Climate Adaptation as a Control Problem: Review and Perspectives on Dynamic
Water Resources Planning Under Uncertainty. Water Resources Research, 56(2).
Herman, J. D., H.B. Zeff, J.R., Lamontagne, P.M., Reed, and G.W. Characklis. (2016).
Synthetic drought scenario generation to support bottom-up water supply
vulnerability assessments. Journal of Water Resources Planning and Management,
142(11).
Hirsch, R.M. (1978). Risk Analysis for a Water-Supply System – Occoquan Reservoir,
Fairfax and Prince Williams Counties, Virginia. Open File Report 78-452, U.S.
Geologic Survey, Reston, VA, also in Hydrologic Science Bulletin, 3(4), 475-505.
Hirsch, R. (1979). Synthetic hydrology and water supply reliability,” Water Resources
Research, 15(6), 1603-1615.
Holling, C.S. (Ed.) (1978), Adaptive Environmental Assessment and Management.
Wiley, London.
Homa, E.S., R. M. Vogel, M. P. Smith, C. D. Apse, A. Huber-Lee, and J. Sieber. (2005),
An Optimization Approach for Balancing, Human and Ecological Flow Need.
Proceedings of the EWRI 2005 World Water and Environmental Resources
Congress, ASCE, Anchorage, Alaska.
Hossain, F., D. Niyogi, R.A., Pielke, J. Chen, J., D. Wegner, A. Mitra, S. Burian, E.
Beighley, C. Brown, V. Tidwell. (2020). Current Approaches for Resilience
Assessment. In Resilience of Large Water Management Infrastructure (pp. 35-43).
Springer, Cham.
Howe, C.W. and M.G. Smith. (1994). The Value of Water Supply Reliability in Urban
Water Systems,” Journal of Environmental Economics and Management, 26, 19-30.
Howitt R., J. Medellín-Azuara, D. MacEwan D, J. Lund and D. Sumner. (2015).
Economic Analysis of the 2015 Drought for California Agriculture. Center for
Watershed Sciences, UC Davis. 16 pp, August, 2015.
Howitt, R.E., J. Medellin-Azuara, D. MacEwan, and J.R. Lund. (2012). Calibrating
Disaggregate Economic Models of Agricultural Production and Water Management.
Journal of Environmental Modeling and Software, 38, 244-258.

173
Review of Water Supply Reliability Estimation
Related to the Sacramento-San Joaquin Delta
Huang, X., D.L., Swain, and A.D. Hall (2020). Future precipitation increase from very
high resolution ensemble downscaling of extreme Atmospheric River Storms in
California. Science Advances, 6, eaba1323.
Hui, R., Herman, J., Lund, J. & Madani, K. (2018), Adaptive water infrastructure
planning for nonstationary hydrology. Advances in Water Resources, 118, 83-94.
Hutton, P.H. and Roy, S.B. (In Review). The Municipal Water Quality Investigations
Program: A Retrospective Overview of the Program’s First Three Decades. San
Francisco Estuary and Watershed Science.
Hutton, P.H. and F.I. Chung (1992), Simulating THM Formation Potential in
Sacramento Delta. Part II, Journal of Water Resources Planning and Management,
118(5).
Islam, N., S. Arora, F. Chung, E. Reyes, R. Field, A. Munévar, D. Sumer, N. Parker, and
R. Chen. (2011), CalLite: California Central Valley Water Management Screening
Model. Journal of Water Resources Planning and Management, 137(1).
Jackson, S. (2006). Water Models and Water Politics: Design, Deliberation, and
Virtual Accountability. Proc. 2006 Int. Conference on Digital Government Research,
95-104.
Jackson, S. (2005). Building the Virtual River: Numbers, Models, and the Politics of
Water in California. PhD dissertation, University of California, San Diego.
Jayasundara, N.C., S.A. Seneviratne, E. Reyes, and F.I. Chung. (2020). Artificial Neural
Network for Sacramento-San Joaquin Delta Flow-Salinity Relationship for CalSim
3.0. Journal of Water Resources Planning and Management, 146(4).
Jaynes, E.T. (2003). Probability Theory-The Logic of Science, Cambridge University
Press.
Jenkins, M.W., J.R. Lund, R.E. Howitt, A.J. Draper, S.M. Msangi, S.K. Tanaka, R.S.
Ritzema, and G.F. Marques, Optimization of California’s Water System: Results and
Insights. J.l of Water Resources Planning and Management, 130(4).
Jenkins, M.W., J.R. Lund, and R.E. Howitt. (2003). Economic Losses for Urban Water
Scarcity in California. Journal of the American Water Works Association, 95(2), 58-70.

174
Review of Water Supply Reliability Estimation
Related to the Sacramento-San Joaquin Delta
Jenkins, M.W. and J.R. Lund (2000). Integrated Yield and Shortage Management for
Water Supply Planning. Journal of Water Resources Planning and Management,
126(5), 288-297.
Joyce, B. , V. Mehta, D. Purkey, L. Dale, and M. Hanemann. (2011). Modifying
agricultural water management to adapt to climate change in California’s central
valley; Climatic Change, 109, 299-316.
Kadir, T. (2017). Coupled Reservoir Operation and Integrated Hydrologic Simulation
Modeling of the SWP and CVP Systems in California with Dynamic Hydrology
Adjustment. PhD dissertation, University of California - Davis.
Kidson, R., B. Haddad, H. Zheng, R. Kasower, and R. Raucher. (2013). Optimizing.
Water Resources Management, 27(9), 1573-1650.
Kiefer, J.C. and G.A. Porter. (2000). Development of Probabilistic Water Demand
Forecast For The San Diego County Water Authority, Planning and Management
Consultants, Ltd., Carbondale, IL.
Kiernan, J.D., P.B. Moyle, and P.K. Crain. (2012). Restoring native fish assemblages to
a regulated California stream using the natural flow regime concept. Ecological
Applications, 22(5), 1472-1482.
Kimmerer, W.; F., Wilkerson, B. Downing, B.; R. Dugdale, E.S. Gross, K. Kayfetz., et al.
(2019). Effects of Drought and the Emergency Drought Barrier on the Ecosystem of
the California Delta. San Francisco Estuary and Watershed Science, 17(3).
King J.M. and D. Louw. (1998). Instream flow assessments for regulated rivers in
South Africa using the building block methodology. Aquat Ecosyst Health Manag. 1,
109-124.
Kiparsky, M., B. Joyce, D. Purkey, and C. Young. (2014). Potential Impacts of Climate
Warming on Water Supply Reliability in the Tuolumne and Merced River Basins,
California. PLOS ONE/
Klemes, V. (1987). One Hundred Years of Applied Storage Reservoir Theory .Water
Resources Management, 1, 159-175.
Klemes, V. (1979). Storage Mass-Curve Analysis in a Systems-Analytic Perspective.
Water Resources Research, 15(2), 359-370.

175
Review of Water Supply Reliability Estimation
Related to the Sacramento-San Joaquin Delta
Knowles, N., C. Cronkite‐Ratcliff, D.W. Pierce, and D.R. Cayan. (2018). Responses of
Unimpaired Flows, Storage, and Managed Flows to Scenarios of Climate Change in
the San Francisco Bay‐Delta Watershed. Water Resources Research, 54(10), 7631-
7650.
Knox, S., J. Tomlinson, J.J. Harou, P. Meier, D.E. Rosenberg, J.R. Lund, D.E.
Rheinheimer. (2019). An open-source data manager for network models.
Environmental Modelling and Software, 122,104538.
Kocis, T.N. and H.E. Dahlke. (2017). Availability of high-magnitude streamflow for
groundwater banking in the Central Valley, California. Environmental Research
Letters.
Kumpel, E. and K.L. Nelson. (2016). Intermittent water supply: prevalence, practice,
and microbial water quality. Environmental science & technology, 50(2), 542-553.
Kuria, F. and R.M. Vogel. (2015). Uncertainty Analysis for Water Supply Reservoir
Yields. Journal of Hydrology.
Lamjiri, M.A., M.D. Dettinger, F.M. Ralph, and B. Guan (2017). Hourly storm
characteristics along the US West Coast: Role of atmospheric rivers in extreme
precipitation. Geophysical Research Letters, 44(13), 7020-7028.
Lamontagne, J. (2017). Synthetic streamflow generation. Water Programming: A
Collaborative Research Blog, February 7, 2017.
Lavers DA, Villarini G. 2015. The contribution of atmospheric rivers to precipitation
in Europe and the United States. J Hydrology ,522:382-390.
Le Bars, D. (2018), "Uncertainty in Sea Level Rise Projections Due to the
Dependence Between Contributors,” Earth's Future, 6(9), 1275-1291.
Lee J., S. De Gryze, and J. Six. (2011). Effect of climate change on field crop
production in California’s Central Valley. Climatic Change.
Lefkoff, L.J. and D.R. Kendall (1996). Optimization Modeling of a New Facility for the
California State Water Project. AWRA, Water Resources Bulletin, 32(3), 451-463.
Lettenmaier, D.P. and J.R. Lund (2020). How Will Climate Change Affect California’s
Water Resources? The Bridge, 50(1), 24-32.

176
Review of Water Supply Reliability Estimation
Related to the Sacramento-San Joaquin Delta
Lettenmaier, D. and D.P. Sheer (1991), Climatic Sensitivity of California Water
Resources,” Journal of Water Resources Planning and Management, 117(1).
Lettenmaier, D. P., and T. Y. Gan. (1990). Hydrologic sensitivities of the Sacramento-
San Joaquin River Basin, California to global warming."Water Resour. Res., 26(1), 69-
86.
Lettenmaier, D. P., T. Y. Gan, and D. R. Dawdy, D. R. (1988). Interpretation of
hydrologic effects of climate change in the Sacramento-San Joaquin River basin,
California. Water Resour. Series Tech. Report No. 110, Dept. of Civ. Engrg., Univ. of
Washington, Jun.
Lingireddy, S. and G.M. Brion. eds., 2005. Artificial neural networks in water supply
engineering. ASCE Publications.
Linsley, R.K., J.B. Franzini, D.L. Freyberg, and G. Tchobanoglous. (1992). Water
Resources Engineering, McGraw-Hill, Inc., N.Y.
Lobell DB, Cahill KN, Field CB (2007) Historical effects of temperature and
precipitation on California crop yields. Climatic Change, 81(2), 187-203.
Lorenz, E. (1993). The Essence of Chaos, University of Washington Press, Seattle,
WA.
Lund, J., A. Munévar, A. Taghavi, M. Hall, and A. Saracino. (2014). Integrating storage
in California’s changing water system. Report for The Nature Conservancy, Center
for Watershed Sciences, UC Davis, 44 pp.
Lund, J. (2021). Adjusting past hydrology for changes in climate,
CaliforniaWaterBlog.com, posted on November 21.
Lund, J.R. (2016). California’s Agricultural and Urban Water Supply Reliability and the
Sacramento-San Joaquin Delta. San Francisco Estuary and Watershed Sciences,
14(3).
Lund, J.R., J. Medellin-Azuara, J. Durand, and K. Stone. (2018). Lessons from
California's 2012-2016 Drought. J. of Water Resources Planning and Management,
144(10).

177
Review of Water Supply Reliability Estimation
Related to the Sacramento-San Joaquin Delta
Lund, J., E. Hanak, W. Fleenor, W. Bennett, R. Howitt, J. Mount, and P. Moyle. (2010).
Comparing Futures for the Sacramento-San Joaquin Delta. University of California
Press, Berkeley, CA, February.
Lund, J.R., M. Jenkins, and O. Kalman. (1998). Integrated Planning and Management
for Urban Water Supplies Considering Multiple Uncertainties, University of
California Water Resources Center No. 205, Davis, CA, May.
Lynam, L and T. Piechota. (2021). California drought outlooks based on climate
change models’ effects on water availability. Water, 13(22), 3211.
Macian-Sorribes, H. and M. Pulido-Velazquez. (2020). Inferring efficient operating
rules in multireservoir water resource systems: A review. WIREs Water, 7(1).
Madani, K. and J.R. Lund. (2010). Estimated Impacts of Climate Warming on
California’s High Elevation Hydropower. Climatic Change, 102 (3-4), 521-538.
Madani, K. and J.R. Lund. 2009. Modeling California's high-elevation hydropower
systems in energy units. Water Resources Research, 45, W09413,
Madani, K. and M. Shafiee-Jood. (2020). Socio-Hydrology: A new understanding to
unite or a new Science to divide? Water 2020, 12, 194.
Maier, K., E. Gatti, E. Wan, D. Ponti, M. Pagenkopp, S. Starratt, H. Olsen, and J.
Tinsley. (2015). Quaternary tephrochronology and deposition in the subsurface
Sacramento-San Joaquin Delta, California, U.S.A. Quaternary Research, 83(2), 378-
393.
Mankin, J.S., F. Lehner, S. Coats, and K.A. McKinnon. (2020). The value of initial
condition large ensembles to robust adaptation decision-making. Earth’s Future
8(10), e2012EF001610..
Marchau, V.A., W.E. Walker, P.J. Bloemen, and S.W. Popper. (2019). Decision making
under deep uncertainty: From theory to practice. Springer Nature.
Mariño, M.A. and H. A. Loaiciga. (1985). Quadratic model for reservoir management:
Application to the Central Valley Project. Water Resources Research, 21(5), 631-641.

178
Review of Water Supply Reliability Estimation
Related to the Sacramento-San Joaquin Delta
Matrosov, E., I. Huskova, J. Kasprzyk, J. Harou, C. Lambert, and P. Reed. (2015).
Many-objective optimization and visual analytics reveal key trade-offs for London’s
water supply. Journal of Hydrology, 531(3), 040-1053.
Matrosov, E.S., S. Padula, and J.J. Harou. (2013). Selecting portfolios of water supply
and demand management strategies under uncertainty—Contrasting economic
optimization and ‘Robust Decision Making’ approaches. Water Resources
Management, 27,1123-1148.
MBK Engineers, Steiner D. 2014. Report on review of Bay Delta Conservation
Program modeling. Sacramento (CA): MBK Engineers. 101 pp.
Means, E. III, M. Laugier, J. Daw, L. Kaatz, and M. Waage. (2010). Decision Support
Planning Methods: Incorporating Climate Change Uncertainties into Water
Planning. Water Utility Climate Alliance, San Francisco, CA.
Medellín-Azuara, J., et al. (2018). A comparative study for estimating crop
evapotranspiration in the Sacramento-San Joaquin Delta. Center for Watershed
Sciences, University of California Davis.
Medellín-Azuara, J., R.E. Howitt, E. Hanak, J.R. Lund, and W.E. Fleenor. (2014).
Agricultural losses from salinity in California’s Sacramento-San Joaquin Delta. San
Francisco Estuary and Watershed Science, 12(1).
Medellín-Azuara, J., L.G. Mendoza-Espinosa, J.R. Lund, J.J. Harou, R. Howitt. (2009).
Virtues of simple hydro-economic optimization: Baja California, Mexico,
Environmental Management, 90, 3470-3478.
Medellin-Azuara, J., J.J. Harou, M.A. Olivares, K. Madani-Larijani, J.R. Lund, R.E.
Howitt, S.K. Tanaka, M.W. Jenkins, and T. Zhu. (2008). Adaptability and Adaptations
of California’s Water Supply System to Dry Climate Warming. Climatic Change,
87(Sup.1), S75-S90.
Meko, D. M., M. D. Therrell, C. H. Baisan, and M. K. Hughes. (2001). Sacramento
River flow reconstructed to AD 869 from tree rings, J. Am. Water Resour. Assoc., 37,
1029-1039.

179
Review of Water Supply Reliability Estimation
Related to the Sacramento-San Joaquin Delta
Mehta, V. Haden, B. Joyce, D. Purkey, and L. Jackson. (2013). Irrigation demand and
supply, given projections of climate and land-use change, in Yolo County, California.
Agricultural Water Management, Volume 117, 70-82.
Michelsen, A.M. and R.A. Young. (1993). Optioning agricultural water rights for
urban water supplies during drought. American Journal of Agricultural Economics,
75(4), 1010-1020.
Milly, P. C. D., J. Betancourt, M. Falkenmark, R.M. Hirsch, Z.W. Kundzewicz, D.P.
Lettenmaier, and R.J. Stouffer. (2008). Stationarity is dead: Whither water
management, Science 319, 573-574.
Morley, M. and D. Savić. (2020). Water resource systems analysis for water scarcity
management: The Thames water case study. Water 2020, 12, 1761.
Moyle P.B., J.D. Kiernan, P.K. Crain, and R.M. Quiñones. (2013). Climate change
vulnerability of native and alien freshwater fishes of California: A systematic
assessment approach. PLOS ONE 8(5), e63883.
Mukherjee, M. and K. Schwabe. (2015). Irrigated Agricultural Adaptation to Water
And Climate Variability: The Economic Value of a Water Portfolio. Amer. J. Agr.
Econ.97(3): 809-832.
[MWDOC] Municipal Water District of Orange County. (2016). Orange County Water
Reliability Study. Metropolitan Water District of Orange County, December 2016.
[MWDOC] Municipal Water District of Orange County. (2018). Orange County Water
Reliability Study, Metropolitan Water District of Orange County, 2018.
[MWDOC] Municipal Water District of Orange County. (2015). Integrated Water
Resources Plan Update and Technical Appendices 2015.
[MWDOC] Municipal Water District of Orange County. (2010). Technical Appendix,
Integrated Water Resources Plan Update 2010. (Has more modeling details)
http://mwdh2o.com/PDF_About_Your_Water/2.1.2_IRP_Appendix.pdf
http://mwdh2o.com/Reports/2.4.1_Integrated_Resources_Plan.pdf
[NASEM] National Academies of Science, Engineering, and Medicine. (2018). Review
of the New York City Department of Environmental Protection Operations Support
Tool for Water Supply, , National Academies Press.

180
Review of Water Supply Reliability Estimation
Related to the Sacramento-San Joaquin Delta
[NASEM] National Academies of Science, Engineering, and Medicine. (2020). Review
of the New York City Watershed Protection Program, National Academies Press.
Nayak, M. A., J. D. Herman, and S. Steinschneider (2018). Balancing flood risk and
water supply in California: Policy search integrating short-term forecast ensembles
with conjunctive use. Water Resour. Res., 54 (10). 7557-7576.
Neubert, S. (2008). Strategic Virtual Water Trade-A critical Analysis of the Debate. In
Water Politics and Development Cooperation (pp. 123-145). Berlin, Heidelberg:
Springer Berlin Heidelberg.
Null, S.E., M.A. Olivares, F. Cordera, and J. Lund. (2021). Pareto optimality and
compromise for environmental water management. Water Resources Research, 57,
e2020WR028296.
Ostrom, V. and E. Ostrom. (1972). Legal and Political Conditions of Water Resource
Development. Land Economics, 48(1),1-14.
Pagán, B.R., M. Ashfaq, D. Rastogi, D.R. Kendall, S.C. Kao, B.S. Naz, R. Mei, and J.S.
Pal. (2016). Extreme hydrological changes in the southwestern US drive reductions
in water supply to Southern California by mid century. Environmental Research
Letters, 11(9), p.094026.
Pasner, Y. (2021). Reproducibility of Daily Unimpaired Flow Computations: Case
Study of San Joaquin Basin Tributaries, California. MS thesis in Hydrologic Science,
University of California-Davis.
Pathak, T.B. and C.S. Stoddard (2018), Climate change effects on the processing
tomato growing season in California using growing degree day model. Modeling
Earth Systems and Environment 4 (2), 765-775.
Pathak T.B, M.L. Maskey, J.A. Dahlberg, F. Kearns, K.M. Bali, and D. Zaccaria. (2018).
Climate change trends and impacts on California agriculture: a detailed review.
Agronomy 8, 25.
Pfister, S., Koehler, A. and Hellweg, S. (2009). Assessing the environmental impacts
of freshwater consumption in LCA. Environmental science & technology, 43(11),
4098-4104.

181
Review of Water Supply Reliability Estimation
Related to the Sacramento-San Joaquin Delta
Pinter, N., J. Lund, and P. Moyle. The California Water Model: Resilience through
Failure. Hydrological Processes, Vol. 22, Iss. 12, pp. 1775-1779, 2019.
Poff, L. (2018). Beyond the natural flow regime? Broadening the hydro-ecological
foundation to meet environmental flows challenges in a non-stationary world.
Freshwater Biology, 63(8), 1011-1021.
Poff, L., et al. (2010). The ecological limits of hydrologic alteration (ELOHA): a new
framework for developing regional environmental flow standards, Freshwater
Biology, 55(1), 147-170.
Porse, E., K.B. Mika, E. Litvak, K.F. Manago, K. Naik, M. Glickfeld, T.S. Hogue, M. Gold,
D.E. Pataki, and S. Pincetl. (2017), Systems analysis and optimization of local water
supplies in Los Angeles, J. Water Resour. Plann. Manage., 143(9), 04017049
Porse, E., Mika, K.B., Litvak, E. et al. (2018) The economic value of local water
supplies in Los Angeles. Nat Sustain 1, 289-297. https://doi.org/10.1038/s41893-
018-0068-2
Porter, J.H., A.H. Matonse, and A. Frei (2015), The New York City operations support
tool (OST): Managing water for millions of people in an era of changing climate and
extreme hydrological events, Journal of Extreme Events, 2(2), 1550008
Randall, D., L. Cleland, C.S. Kuehne, G.W. Link, and D.P. Sheer. (1997). Water Supply
Planning Simulation Model Using Mixed-Integer Linear Programming "Engine.”
Journal of Water Resources Planning and Management, 116-124.
Rakhmatulina, E., G. Boisramé, S. Stephens, and S. Thompson. (2021). Hydrological
benefits of restoring wildfire regimes in the Sierra Nevada persist in a warming
climate. Journal of Hydrology, 593, 125808.
Raucher, K. and R. Raucher (2015), Embracing Uncertainty: A Case Study
Examination of How Climate Change is Shifting Water Utility Planning, Prepared for
the Water Utility Climate Alliance (WUCA), the American Water Works Association
(AWWA), the Water Research Foundation (WRF), and the Association of
Metropolitan Water Agencies (AMWA) by Stratus Consulting Inc., Boulder, CO.
Railsback, S.F. (2016). Why It Is Time to Put PHABSIM Out to Pasture. Fisheries,
41(12), 720-25.

182
Review of Water Supply Reliability Estimation
Related to the Sacramento-San Joaquin Delta
Ray, P., S. Wi, A. Schwarz, M. Correa, M. He, and C. Brown. (2020). Vulnerability and
risk: climate change and water supply from California’s Central Valley water system.
Climatic Change, 161, 177-199.
Reis, G. J, J.K. Howard, and J.A. Rosenfield. (2019). Clarifying effects of environmental
protections on freshwater flows to—and water exports from—the San Francisco
Bay Estuary. San Francisco Estuary and Watershed Science, 17(1).
Riggs, H.C. and C.H. Hardison. (1973). Storage Analyses for Water Supply, Chapter
B2 of Techniques of Water-Resources Investigations of the United States Geological
Survey, Book 4, Hydrologic Analysis and Interpretation, US Geolog. Survey, Reston,
VA.
Rippl, W. (1883). The capacity of storage-reservoirs for water-supply. Minutes of the
Proceedings of the Institution of Civil Engineers, 71(1883), 270-278.
Robinson, A., J. Lehmann, D. Barriopedro et al. (2021). Increasing heat and rainfall
extremes now far outside the historical climate. npj Clim Atmos Sci, 4(45).
Roe, E., R.G. Bea, S.N. Jonkman, H. Faucher de Corn, H. Foster, J. Radke, P.
Schulman, and R. Storesund. (2016). Risk assessment and management for
interconnected critical infrastructure systems at the site and regional levels in
California's Sacramento-San Joaquin Delta. International Journal of Critical
Infrastructures, 12(1-2), 10.1504/IJCIS.2016.075867.
Roche, W.M., 2020. Sustainable management of water in northern California, USA,
for food, energy, and environmental security. Irrigation and Drainage, 70(3), 410-
416.
Rosenberg, D.E. and K. Madani. (2014). Water resources systems analysis: A bright
past and a challenging but promising future, Journal of Water Resources Planning
and Management 140(4), 407-409.
Rosenberg, D.E. and D. Watkins. (2018).New Policy to Specify Availability of Data,
Models, and Code. J. Water Resour. Plann. Manage., Vol. 144(9): 0161800.
Rosenzweig, M. (2003). Win-Win Ecology: How the Earth’s Species Can Survive in the
Midst of Human Enterprise. Oxford University Press.

183
Review of Water Supply Reliability Estimation
Related to the Sacramento-San Joaquin Delta
Ruckert K.L., P.C. Oddo, and K. Keller. (2017). Impacts of representing sea-level rise
uncertainty on future flood risks: An example from San Francisco Bay. PLoS ONE
12(3): e0174666.
Sahin, O., R. Stewart, D. Giurco, and M. Porter. (2017). Renewable hydropower
generation as a co-benefit of balanced urban water portfolio management and
flood risk mitigation. Renewable and Sustainable Energy Reviews, 68 (Part 2),. 1076-
1087.
Sarofim, M., J.B. Smith, A. St. Juliana, and C. Hartin. (2021). Improving reduced
complexity model assessment and usability. Nature Climate Change, 11, 1-3.
Schonher, T. and S. E. Nicholson. (1989). The Relationship between California
Rainfall and ENSO Events. Journal of Climate, 2, 1258-1269.
Schreiner-McGraw, A. P., and H. Ajami. (2020). Impact of uncertainty in precipitation
forcing data sets on the hydrologic budget of an integrated hydrologic model in
mountainous terrain. Water Resources Research, 56, e2020WR027639.
Schwarz, A, P. Ray, S. Wi, C. Brown, C., M. He, and M. Correa. (2018). Climate change
risk faced by the California Central Valley water resource system: A report for
California’s Fourth Climate Change Assessment, CCCA4-EXT-2018-001.
Schwarz, A., W. Arnold, D. Constable, M. Williams, and R. Maendly. (2020). Delta
Adapts Water Supply Technical Memo. Draft, July, 122 pp.
[SCVWD] Santa Clara Valley Water District. (2019). Water Supply Master Plan 2040.
[SCVWD] Santa Clara Valley Water District. (2012). 2012 Water Supply and
Infrastructure Master Plan.
[SCVWD] Santa Clara Valley Water District. (2003). Integrated Water Resources
Planning Study 2003 and Appendices, Santa Clara Valley Water District.
[SDCWA] San Diego County Water Authority. (2021). 2020 Urban Water
Management Plan.
[SDCWA] San Diego County Water Authority. (2013). Final 2013 Regional Water
Facilities Optimization and Master Plan Update.

184
Review of Water Supply Reliability Estimation
Related to the Sacramento-San Joaquin Delta
[SDCWA] San Diego County Water Authority. (2017). Water Shortage Contingency
Plan.
[SDCWA] San Diego County Water Authority. (2002). Regional Water Facilities
Master Plan.
[SEI] Stockholm Environmental Institute. (2019). Sacramento Valley Water Allocation
Model, Model Documentation, Version 1.2. Prepared for the State Water Resources
Control Board, Sacramento, CA, by the Stockholm Environmental Institute, Davis,
CA, 815 pp.
SFWMD (2020), Dynamic Position Analysis, June 2020, South Florida Water
Management District.
Shamir, U. and C.D.D. Howard. (1981). Water supply reliability theory. Journal of the
American Water Works Association, 73(7), 379-384.
Shuang, Q., M. Zhang, and Y. Yuan. (2014). Performance and reliability analysis of
water distribution systems under cascading failures and the identification of crucial
pipes. PLOS ONE, 9(2), e88445.
Shukla, S., M. Safeeq, A. AghaKouchak, K. Guan, and C. Funk. (2015). Temperature
impacts on the water year 2014 drought in California. Geophysical Research Letters
42, (11): 4384-4393.
Siirila-Woodburn, E.R., A.M. Rhoades, B.J. Hatchett, L.S. Huning, J. Szinai, C. Tague,
P.S. Nico, D.R. Feldman, A.D. jones, W.D. Collins and L. Kaatz. (2021). A Low-to-no
Snow Future and Its Impacts on Water Resources in the Western United States.
Nature Reviews: Earth & Environment, Vol. 2, 800-819.
Singh, K. (2015). Central Valley Refuge Management under Non-stationary Climatic
and Management Conditions. Masters thesis in Civil and Environmental
Engineering, University of California-Davis, Davis, CA.
Slingo, J. and T. Palmer. (2011). Uncertainty in weather and climate prediction. Phil.
Trans. R. Soc. A., 369, 4751-4767.
Sommer, TR, Nobroga, ML, Harrell, WC, Batham, W, Kimmerer, WJ. 2001. Floodplain
rearing of juvenile Chinook salmon: evidence of enhanced growth and survival.
Canadian Journal of Fisheries and Aquatic Sciences 58, 325-333.

185
Review of Water Supply Reliability Estimation
Related to the Sacramento-San Joaquin Delta
Stagge, J., D.E. Rosenberg, A. Abdallah, H. Akbar, N. Attallah, and R. James (2019).
Assessing data availability and research reproducibility in hydrology and water
resources." Scientific Data, 6, 190030.
Stein, E.D., J. Zimmerman, S.M. Yarnell, B. Stanford, B. Lane, K.T. Taniguchi-Quan, A.
Obester, T.E. Grantham, R.A. Lusardi, and S. Sandoval-Solis. (2021). The California
Environmental Flows Framework: Meeting the Challenges of Developing a Large-
Scale Environmental Flows Program. Frontiers in Environmental Science 9, 769943.
Stine, S. (1994). Extreme and persistent drought in California and Patagonia during
Medieval Time, Nature, 369, 546-549.
Sturm R, Gasner K. and L. Andrews. (2015).Water Audits in the United States: A
Review of Water Losses and Data Validity. Denver, CO.
Suddeth, R., J.F. Mount, and J.R. Lund. (2010). Levee decisions and sustainability for
the Sacramento San Joaquin Delta, San Francisco Estuary and Watershed Science,
8(2).
Suddeth Grimm, R. and J.R. Lund. (2016). Multi-purpose optimization for
reconciliation ecology on an engineered floodplain: Yolo Bypass, California. San
Francisco Estuary and Watershed Science, 14(1).
Swain, D.L., B. Langenbrunner, J.D. Neelin, and A. Hall. (2018). Increasing
Precipitation Volatility in Twenty-First-Century California. Nature Climate Change 8
(5): 427-33.
Swain, D.L., D. Singh, D. Touma, and N. Diffenbaugh. (2020). Attributing Extreme
Events to Climate Change: A New Frontier in a Warming World. One Earth, 2(6), 522-
527.
[SWRCB] State Water Resources Control Board. (2020). State Water Board Drought
Year Water Actions - Watershed Analysis. Sacramento, California.
Taleb, N.N. (2007). The Black Swan: The impact of the highly improbable: Random
House, N.Y., 366 p.
Tanaka, S.K., C. Buck, K. Madani, J. Medellin-Azuara, J. Lund, E. Hanak. (2011).
Economic Costs and Adaptations for Alternative Regulations of California's
Sacramento-San Joaquin Delta," San Francisco Estuary and Watershed Science, 9(2).

186
Review of Water Supply Reliability Estimation
Related to the Sacramento-San Joaquin Delta
Tanaka, S.K., T. Zhu, J.R. Lund, R.E. Howitt, M.W. Jenkins, M.A. Pulido, M. Tauber, R.S.
Ritzema and I.C. Ferreira (2006), “Climate Warming and Water Management
Adaptation for California,” Climatic Change, Vol. 76, No. 3-4, pp. 361-387, June.
Tasker, G.D. and P. Dunne (1997), “Bootstrap Position Analysis for Forecasting Low
Flow Frequency,” Journal of Water Resources Planning and Management, Vol. 123
Issue 6-November.
Tennant, D. L.: Instream flow regimens for fish, wildlife, recreation and related
environmental resources, Fisheries, 1, 6-10, 1976.
Teodoro, Manuel P. & Robin Rose Saywitz. 2020. “Water and Sewer Affordability in
the United States, 2019,” AWWA Water Science 2(2): e1176
Tetratech (2019a), Memo 4. Recommendations for Modeling Best Practices, Delta
Stewardship Council Contract #17400, Sacramento, CA.
Tetratech (2019b), Integrated Modeling in the Delta: Status, Challenges and a View
to the Future, Delta Stewardship Council Contract #17400, Sacramento, CA.
Teutschbein, C. and J. Seibert (2012), “Bias correction of regional climate model
simulations for hydrological climate-change impact studies: Review and evaluation
of different methods,” Journal of Hydrology, 456-457, pp.12-29.
Thissen, W., Kwakkel, J., Mens, M., van der Sluijs, J., Stemberger, S., Wardekker, A.
and Wildschut, D., 2017. Dealing with uncertainties in fresh water supply:
experiences in the Netherlands. Water resources management, 31(2), pp.703-725.
Tomlinson, J.E., J.H. Arnott, J.J. Harou (2020), “A water resource simulator in Python,”
Environmental Modelling and Software, 126 (2020) 104635.
Tonkin, JD, JD Olden, DM Merritt, LV Reynolds, JS Rogosch, and DA Lytle. 2021.
Designing flow regimes to support entire river ecosystems. 19(6): 326-333,
doi:10.1002/fee.2348.
US Army Corps of Engineers (USACE) (1975), Reservoir Yield, Volume 8, Hydrologic
Engineering Methods for Water Resources Development, HEC-IHD-0800, A United
States Contribution to the International Hydrological Decade, Hydrologic
Engineering Center, US Army Corps of Engineers, Davis, CA, p. III-4.

187
Review of Water Supply Reliability Estimation
Related to the Sacramento-San Joaquin Delta
USBR (1976), Interim Water Supply, Total Water Management Study for the Central
Valley Basin California, Working Document No. 9, March, USBR, Mid-Pacific Region,
Sacramento, CA.
USBR (1994), Central Valley Project Estimates of Yield, USDOI, USBR, Mid-Pacific
Region, Sacramento, CA, Sept.
USBR (1997), Central Valley Improvement Act Draft Programmatic Environmental
Impact Statement, Technical Appendix, Volume 1, USBR, Mid-Pacific Region,
Sacramento, CA.
USBR (2004), Long-Term Central Valley Project Operations Criteria and Plan CVP-
OCAP, USBR, Mid-Pacific Region, Sacramento, CA.
USBR (2016) U.S. Bureau of Reclamation, 2016, Sacramento and San Joaquin basins
study technical report. Report to Congress 2015. Prepared for the U.S. Department
of the Interior, Bureau of Reclamation, Mid-Pacific Region by CH2M Hill under
Contract No. R12PD80946.
USDOI (1999a), Decision on Implementation of Section 3406 (b) (2) of the Central
Valley Project Improvement Act, October 5,
USDOI (1999b), Calculation of Central Valley Project Yield for Section 3406 (b) (2) of
the Central Valley Improvement Act, 5 Oct.,
USDOI (1999c), ACCOUNTING CVP Yield Dedicated and Managed Pursuant to CVPIA
section 3406 (b) (2) March 1, 1999 - February 28, 2000, Dated July 15, 1999, obtained
by e-mail from Chet Bowling, USBR.
USEPA (2015). Systems Measures of Water Distribution System Resilience. U.S.
Environmental Protection Agency, Washington, DC, EPA/600/R-14/383, 58 pp.
USEPA (2021), Social Indicators, web site, accessed 2 June 2021.
Venteicher, W. (2019). “California disability law has costly effects: Documents
disappear as state spends millions.” The Sacramento Bee, Sacramento, CA.
Vicuna S, and Dracup J (2007) The evolution of climate change impact studies on
hydrology and water resources in California. Climatic Change 82: 327-350

188
Review of Water Supply Reliability Estimation
Related to the Sacramento-San Joaquin Delta
Vicuna, S., Maurer, E. P., Joyce, B., Dracup, J. A., and Purkey, D. (2007), “The
sensitivity of California water resources to climate change scenarios.” J. Am. Water
Resour. Assoc., 43_2_, 482-498.
Vogel, R. M., Sieber, J., Archfield, S. A., Smith, M. P., Apse, C. D., and Huber‐Lee, A.
(2007), Relations among storage, yield, and instream flow, Water Resour. Res., 43,
W05403, doi:10.1029/2006WR005226.
Vogel, R.M. and A. Castellarin (2017), “Risk, Reliability, and Return Periods and
Hydrologic Design,” Chapter 78, in Singh, VP, (Ed.), Handbook of Applied Hydrology,
McGraw-Hill Book Company, N.Y.
von Neumann, J. and Morgenstern (1944), Theory of Games and Economic
Behavior, Princeton University Press.
Walker, W. (2017), Drought Water Right Allocation Tool Applied to the San Joaquin
River Basin, Master’s thesis, Department of Civil and Environmental Engineering,
University of California-Davis.
Wang, J., Yin, H., Reyes, E., Smith, T. and Chung, F., 2018. Mean and Extreme Climate
Change Impacts on the State Water Project. California’s Fourth Climate Change
Assessment. Publication Number: CCCA4-EXT-2018-004.
Werick, W., A. Keyes, R. Palmer, J. Lund, (1994), “Virtual Droughts and Shared
Visions-Some Innovations from the National Study”, Drought Management in a
Changing West: New Directions for Water Policy. Proceedings of a Conference.
Whipple, A. (2018). Managing flow regimes and landscapes together: Hydrospatial
analysis for evaluating spatiotemporal floodplain inundation patterns with
restoration and climate change implications. PhD dissertation, Hydrologic Sciences,
University of California-Davis.
Whipple, A.A. and J. H. Viers (2019), “Coupling landscapes and river flows to restore
highly modified rivers,” Water Resources Research, 10.1029/2018WR022783.
Whitford, P. W. (1972), Residential water demand forecasting, Water Resour. Res.,
8(4), 829-839, doi:10.1029/WR008i004p00829.

189
Review of Water Supply Reliability Estimation
Related to the Sacramento-San Joaquin Delta
Wichelns, D. (2010). Virtual Water and Water Footprints Offer Limited Insight
Regarding Important Policy Questions. International Journal of Water Resources
Development, 26(4): 639-651.
Wiens, J.A., J.B. Zedler, V.H.Resh, T. K. Collier, S. Brandt, et al. (2017). Facilitating
adaptive management in California’s Sacramento-San Joaquin Delta. San Francisco
Estuary & Watershed Science, 15(2).
Wilby, R.L. and S. Dessai (2010). Robust adaptation to climate change. Weather,
45(7), 180-185.
Williams, A.P., E.R. Cook., J.E. Smerdon., B.I. Cook, J.T. Abatzoglou, K. Bolles, S.H.
Baek, A.M. Badger, and B. Livneh. (2020). Large contribution from anthropogenic
warming to an emerging North American megadrought. Science, 368, 314-318.
Williams, G. J. 2010. Life History Conceptual Model for Chinook salmon and
Steelhead. DRERIP Delta Conceptual Model. Sacramento (CA): Delta Regional
Ecosystem Restoration Implementation Plan.
Williams, J.G., P.B. Moyle, J.A. Webb, and G.M. Kondolf. (2019). Environmental Flow
Assessment: Methods and Applications, Wiley Blackwell.
Willis, A.D., J.R. Lund, E. S. Townsley, and B. Faber. Climate Change and Flood
Operations in the Sacramento Basin, California. San Francisco Estuary and
Watershed Science, 9(2).
Wood, A.W., L. R. Leung, V. Sridhar, and D. P. Lettenmaier. (2004), Approaches To
Downscaling Climate Model Outputs. Climatic Change, 62,189-216.
Woodhouse, C.A. and J.J. Lukas. (2006). Drought, Tree Rings and Water Resource
Management in Colorado. Canadian Water Resources Journal, 31(4), 297-310.
Yarnell, S.M., G.E. Petts, J.C. Schmidt, A.A. Whipple, E.E. Beller, C.N. Dahm, P.
Goodwin, and J.H. Viers (2015), “Functional flows in modified riverscapes:
hydrographs, habitats, and opportunities,” BioScience, 65, 963-972.
Yarnell, S.M., E.D. Stein, J.A. Webb, T.E. Grantham, R.A. Lusardi, J. Zimmerman, R.A.
Peek, B.A. Lane, J. Howard, and S. Sandoval‐Solis. (2020). A functional flows
approach to selecting ecologically relevant flow metrics for environmental flow
applications. River Research and Applications, 36(2), 318-324.

190
Review of Water Supply Reliability Estimation
Related to the Sacramento-San Joaquin Delta
Young, W.R. (1929), Report on Salt Water Barrier Below Confluence of Sacramento
and San Joaquin Rivers, California, Bulletin 22, Vols. I and II, Division of Water
Resources, California Department of Public Works, Sacramento California.
Zhu, T., M.W. Jenkins and J.R. Lund. (2005). Estimated Impacts of Climate Warming
on California Water Availability. Journal of the American Water Resources
Association, Vol. 41, No. 5, 1027-1038.

191
Review of Water Supply Reliability Estimation
Related to the Sacramento-San Joaquin Delta
Other Reviews
A review of water supply reliability estimation related to the Sacramento-San
Joaquin Delta is just one of the themes/topic areas that the Delta ISB has reviewed
to meet its legislative mandate of providing oversight of the scientific research,
monitoring, and assessment programs that support adaptive management in the
Delta. Completed reviews are below.
Restoration (2013)
Habitat Restoration in the Sacramento-San Joaquin Delta and Suisun Marsh: A
Review of Science Programs
Flows and Fishes (2015)
Flows and Fishes in the Sacramento-San Joaquin Delta. Research Needs in Support
of Adaptive Management
Adaptive Management (2016)
Improving Adaptive Management in the Sacramento-San Joaquin Delta
Levees (2016)
Workshop Report – Earthquakes and High Water as Levee Hazards in the
Sacramento-San Joaquin Delta.
Delta as an Evolving Place
Review of Research on the Sacramento-San Joaquin Delta as an Evolving Place.
Water Quality
Water Quality Science in the Sacramento and San Joaquin Delta. Chemical
Contaminants and Nutrients
Interagency Ecological Program
A Review of the Interagency Ecological Program’s Ability to Provide Science
Supporting Management of the Delta
Non-Native Species
The Science of Non-native Species in a Dynamic Delta
Monitoring
Review of the Monitoring Enterprise of the Sacramento-San Joaquin Delta