Repeated geographic divergence in behavior: a case study employing phenotypic trajectory analyses
37
1 Repeated Geographic Divergence in Behavior: A Case Study 1 Employing Phenotypic Trajectory Analyses 2 3 Spencer J. Ingley 1 *, Eric J. Billman 2 , Chelsey Hancock 1 , and Jerald B. Johnson 1,3 4 1 Evolutionary Ecology Laboratories, Department of Biology, Brigham Young University, Provo, 5 UT 84602 6 2 Department of Fisheries and Wildlife, Oregon State University, Corvallis, OR 97331 7 3 Monte L. Bean Life Science Museum, Brigham Young University, Provo, UT 84602, USA 8 *Corresponding Author: 9 E-mail: [email protected] 10 Fax: (801) 422-0090 11 12 13 14 15 16 17 18 19 20
Transcript of Repeated geographic divergence in behavior: a case study employing phenotypic trajectory analyses

1
Repeated Geographic Divergence in Behavior: A Case Study 1
Employing Phenotypic Trajectory Analyses 2
3
Spencer J. Ingley1 *, Eric J. Billman2, Chelsey Hancock1, and Jerald B. Johnson1,3 4
1Evolutionary Ecology Laboratories, Department of Biology, Brigham Young University, Provo, 5
UT 84602 6
2Department of Fisheries and Wildlife, Oregon State University, Corvallis, OR 97331 7
3Monte L. Bean Life Science Museum, Brigham Young University, Provo, UT 84602, USA 8
*Corresponding Author: 9
E-mail: [email protected] 10
Fax: (801) 422-0090 11
12
13
14
15
16
17
18
19
20

2
ABSTRACT 21
Environmental effects on behavior have long been a focus of behavioral ecologists. Among the 22
important drivers of behavior is predation environment, which can include the presence/absence 23
of predators, differences in resource availability, and variation in individual density. 24
Environments with predators are often more ecologically complex and 'risky' than those without 25
predators. Populations from these environments are sometimes more active and explorative than 26
populations from low-risk, less complex environments. To date, most comparative studies of 27
behavior are limited to within species comparisons of populations from divergent environments, 28
but neglect comparisons between species following speciation, thus limiting our understanding 29
of post-speciation behavioral evolution. Brachyrhaphis fishes provides an ideal system for 30
studying correlations between divergent environments and behavior within and between species. 31
Here, we test for differences in two behavioral traits -- activity and exploration -- between sister 32
species B. roseni and B. terrabensis that occur in divergent predation environments. Species 33
differed in activity and exploration, with higher activity and exploration levels in populations 34
that co-occur with predators. Furthermore, we found drainage-by-species interactions, indicating 35
that the nature of divergence varied geographically. Using the recently-developed phenotypic 36
trajectory analysis (PTA), we quantified this difference, and found that, while the geographically 37
isolated populations of sister 38
species tended to evolve in parallel, the magnitude of divergence between species differed 39
between drainages. Our results highlight the utility of PTA for multivariate behavioral data, and 40
corroborate past predictions that complex and risky environments are correlated with increased 41
activity and exploration levels, and that divergence continues post-speciation. 42
43

3
KEYWORDS 44
Activity, exploration, behavior, Brachyrhaphis, predation, habitat complexity, phenotypic 45
trajectory analysis46

4
INTRODUCTION 47
Spatial and temporal variation in the environment has long been recognized as a major 48
driver in behavioral divergence (Foster 1999; Foster and Endler 1999). Differences in behavior 49
among populations from different selective environments can result from both biotic and abiotic 50
factors, and can represent genetic divergence, phenotypic plasticity, or both (West-Eberhard 51
2003; Foster 2013). Using a comparative framework (i.e., studying behavior in multiple 52
populations or species from different environments), behavioral ecologists can identify 53
mechanisms that result in geographic variation in behavior, and determine how this variation 54
contributes to processes such as speciation. 55
Among the most well studied drivers of phenotypic divergence among populations or 56
species from different environments is predation (Endler 1987; Huntingford et al. 1994; Reznick 57
1996; Johnson 2001a; Johnson and Belk 2001;). Predation can affect a variety of prey traits, 58
including morphology (Langerhans and DeWitt 2004; Langerhans et al. 2004), life-history 59
(Reznick and Bryga 1987; Johnson 2001a, Johnson 2002; Johnson and Zuniga-Vega 2009), and 60
behavior (Huntingford et al. 1994; Godin and Briggs 1996; Brown and Braithwaite 2005), with 61
behavioral studies receiving considerable recent attention. Although predation could directly 62
affect traits such as behavior and could serve as a strong selective force, predators can also serve 63
as a good indicator for a variety of environmental factors that are often highly correlated with the 64
presence or absence of predators (Johnson 2002; Ingley et al. 2014). For example, in many 65
aquatic ecosystems predators tend to occur in low elevation streams where habitats are more 66
complex in terms of fish and invertebrate communities, available microhabitats, and prey types 67
(Archard and Braithwaite 2011a). How behavioral traits vary among populations from different 68
‘predation environments’ (i.e., those that are predator-naïve and occur in less complex habitats 69

5
versus those that are predator-exposed and occur in more complex habitats) remains a question 70
of great interest in behavioral ecology (Archard and Braithwaite 2011a). 71
Two axes of behavior that are likely to be correlated with differences in predation 72
environment are (1) activity and (2) exploration level in a novel environment (Urban 2007; 73
Millot et al. 2009; Nomakuchi et al. 2009; Wilson and Godin 2009; Wilson et al. 2010). 74
Although patterns have been mixed, individuals from populations that occur in complex, 75
predator rich environments are often bolder, more active, and more explorative than individuals 76
that occur in less complex, predator free environments (Archard and Braithwaite 2011a), perhaps 77
in an attempt to maximize current mating and feeding opportunities (see below). However, 78
whether increased activity and exploration levels are potentially adaptive is highly context 79
specific, particularly because both predation and other environmental factors can affect boldness 80
between populations of a given species (Brydges et al. 2008). On one hand, increased activity 81
levels in prey could increase their risk of predation where prey movement facilitates prey 82
detection by predators [e.g., where predators actively pursue prey; (Kruuk and Gilchrist 1997)]. 83
On the other hand, an individual that spends more time in ‘exposed’ areas in a given habitat (i.e., 84
away from predator habitat) may be able to better avoid sit-and-wait ambush predators by 85
identifying and avoiding high-risk areas. 86
Trade-offs in life-history strategies could also explain differences in behavioral traits both 87
among and within populations or species from divergent environments (Wolf et al. 2007). For 88
example, despite the potential increase in predation risk associated with risky behaviors, more 89
bold and more active individuals could increase mating opportunities and maximize current 90
reproduction by having higher encounter rates with potential mates (Wolf et al. 2007). 91
Increasing activity levels to increase encounters with mates could be particularly important in 92

6
predator environments that are often characterized by low population densities (i.e., fewer 93
encounter opportunities with potential mates) (Abrams 1993) and high risk of predator-induced 94
mortality. Conversely, predator-free environments often have higher population densities and 95
limited resources, thus favoring less active individuals that can conserve their energy by reducing 96
their activity levels. Furthermore, an increase in activity and exploration levels in complex 97
predator environments could allow an individual to better locate and exploit the variety of 98
microhabitat and prey types that are available. Therefore, it is reasonable to hypothesize that 99
populations that occur in complex, predator rich environments with corresponding environmental 100
differences (i.e., lower population densities and higher resource availability) will show increased 101
activity and increased exploration levels compared to their predator-naïve congeners when they 102
are in a novel environment. 103
Aquatic systems are well suited for studying the processes that drive geographic variation 104
in behavioral and other traits (Riechert 1999), particularly with traits related to predation 105
environment. Abiotic and biotic factors can be characterized in aquatic systems (e.g., Johnson 106
2002), and populations within a species can often be found in numerous water bodies that 107
represent different predation environments. Among the most well studied aquatic groups are 108
live-bearing fish (Poeciliidae), which have been the focus of a diversity of ecological and 109
evolutionary studies (Johnson 2001b; Jennions and Kelly 2002; Basolo 2004; Brown and 110
Braithwaite 2005; Mateos 2005; Jones and Johnson 2009; Wesner et al. 2011). Many of these 111
studies have focused on adaptation to divergent predation environments, specifically life-history 112
evolution, morphological divergence, and behavioral differences associated with different 113
predation environments (Reznick and Bryga 1987; Reznick 1989; Rodd and Reznick 1991; 114
Johnson and Belk 2001; Reznick et al. 2001; Brown and Braithwaite 2004; Langerhans 2009a, b; 115

7
Langerhans and Makowicz 2009; Wesner et al. 2011). Members of the live-bearing fish genus 116
Brachyrhaphis have gained momentum as a model system for studying the evolution of life-117
history (Johnson 2001a, b, 2002; Johnson and Belk 2001; Jennions et al. 2006), morphology 118
(Langerhans and DeWitt 2004; Wesner et al. 2011) and behavior (Brown et al. 2004, 2005; 119
Brown and Braithwaite 2005; Archard and Braithwaite 2011a, b) associated with different 120
predation environments. Brachyrhaphis occurs primarily in lower Central America (LCA), with 121
most species endemic to Costa Rica and Panama. Numerous species of Brachyrhaphis exhibit 122
adaptation to divergent predation environments. Although predation pressure may be the 123
selective force of most importance in this system, ‘predation environment’ is characterized by 124
the presence or absence of predators and a suite of other confounded environmental factors. For 125
example, resource availability, stream gradient, and stream width could play an important role in 126
determining life-history, morphological, and behavioral evolution, and are known to co-vary 127
with presence or absence of predators where populations of Brachyrhaphis occur (Johnson 128
2002). Populations of Brachyrhaphis rhabdophora and B. episcopi, for example, show divergent 129
behavior, morphology, and life-history strategies associated with predation environment that are 130
similar to those observed in numerous other poeciliid species (Reznick 1996; Johnson and Belk 131
2001). Similar patterns are also present at deeper phylogenetic levels within Brachyrhaphis (i.e., 132
between sister species rather than among populations within a species; Ingley et al. 2014), which 133
facilitates comparative studies evaluating adaptation both between and within species, 134
particularly from divergent predation environments. Studies testing for differences in activity and 135
exploration between closely related species that remain in different predation environments 136
could provide valuable insight into the progression of divergence once speciation is complete, 137
and would be particularly useful where patterns of behavior in related species are known. An 138

8
example of this pattern is the sister species pair B. roseni and B. terrabensis. These two species 139
have similar distributions, occurring from southeastern Costa Rica to central Panama along the 140
Pacific verdant (Bussing 1998). Although they occur within the same drainages, B. terrabensis 141
occupies higher elevation headwater streams while B. roseni occupies lower elevation coastal 142
streams (Bussing 1998). Consequently, B. terrabensis occurs in streams that are primarily void 143
of piscine predators (here referred to as ‘predator-free’ sites), while B. roseni co-occurs with 144
numerous and abundant piscine predators (here referred to as ‘predator’ sites; e.g., Hoplias 145
microlepis). Brachyrhaphis roseni and B. terrabensis have evolved similarly divergent life 146
histories (M. Belk et al., unpublished data) as those observed among populations of B. 147
rhabdophora (Johnson and Belk 2001) and among populations of B. episcopi (Jennions and 148
Telford 2002). Body shape also varies within B. rhabdophora (Langerhans and DeWitt 2004) 149
and between B. roseni and B. terrabensis (Ingley et al. 2014), in each case as predicted by 150
predation environment. The fact that B. roseni and B. terrabensis are sister taxa, and that they 151
occur in geographic proximity but in divergent predation environments, suggests that the 152
selective forces that are driving divergence among populations within B. rhabdophora and 153
within B. episcopi (i.e., predator vs. predator-free) could also have driven divergence between B. 154
roseni and B. terrabensis. Here, we test for divergent activity and exploration levels in B. roseni 155
and B. terrabensis. We predict that B. roseni will exhibit higher activity and exploration levels 156
than B. terrabensis, a pattern similar to that observed in B. episcopi from divergent predation 157
environments (Archard and Braithwaite 2011a). 158
The primary purpose of our study is to evaluate exploration and activity levels in sister 159
species from divergent predation environments, and to compare them to recently published 160
patterns observed within a closely related species that occurs in both predator and predator-free 161
9
environments (Archard and Braithwaite 2011a). We test for differences in activity and 162
exploration levels between species that occur with (B. roseni) or without predators (B. 163
terrabensis). We also discuss the potential implications of these behavioral traits on differential 164
fitness and reproductive isolation between B. roseni and B. terrabensis. Finally, we use our data 165
as a case study to employ a novel technique for analyzing multivariate behavioral data, the 166
phenotypic trajectory analysis (PTA; (Collyer and Adams 2007; Adams and Collyer 2009). 167
Although PTA has been successfully used for non-behavioral data (e.g., geometric morphometric 168
data; Wesner et al. 2011; Ingley et al. 2014), its utility for multivariate quantitative behavioral 169
data sets remains unexplored. We show how cryptic patterns of behavioral variation in a data set, 170
specifically factors related to geographic variation, can be discovered using this method of 171
analyzing evolutionary trajectories. We also demonstrate how PTA can be useful in accurately 172
comparing multivariate behavioral data among multiple sample populations by quantifying the 173
magnitude and direction of phenotypic change to assess divergence, convergence, or parallelism. 174
175
MATERIALS AND METHODS 176
Live fish collection and study sites 177
In August 2011, we used hand held seine nets to collect B. roseni and B. terrabensis from 178
rivers in two drainage systems in Western Panama [Rio Chiriquí Viejo drainage (N 8.7924, W 179
82.6566; N 8.5184, W 82.7115), and the Rio David drainage (N 8.6609, W 82.5206; N 8.4251, 180
W 82.4176)]. In each drainage, B. roseni was found in downstream reaches and B. terrabensis 181
was found in upstream reaches. After capture, fish were housed temporarily (less than 30 days) 182
at the Naos Marine Lab at the Smithsonian Tropical Research Institute, Panama. Fish were then 183
transported to the Evolutionary Ecology Laboratories (EEL) at Brigham Young University. Fish 184

10
were held under a 12L:12D light cycle, with lower light levels at the start and end of the day to 185
mimic dawn and dusk. Fish were separated by population and divided among thirty-two 10 186
gallon glass tanks with power filtration and aeration, water depth at ~230 mm, and water 187
temperature at 23–24◦ C. Fish were fed flake food twice daily and supplemented every 7 days 188
with live Daphnia sp. Fish were acclimated in the lab for a period of two months to settle after 189
transport to BYU before being used in our experiments. Food was withheld the morning before 190
trials, with the last feeding taking place the afternoon prior to the experiment. To prevent testing 191
fish multiple times, individuals from a given tank were all tested sequentially. Once a fish had 192
completed the trial, it was held temporarily in an intermediate tank. Once all the fish in a tank 193
had participated in the experiment, they were transferred from the intermediate tank to their 194
original holding tank. 195
Open-field trials and data collection 196
We tested exploration and activity levels in Brachyrhaphis roseni and B. terrabensis 197
using an open-field trial approach. Open-field trials come in many forms, but they are all based 198
on placing an animal into a novel open space, from which escape is prevented by a barrier, and 199
monitoring subsequent behavior (Walsh and Cummins 1976). Recently, open-field trials have 200
been successfully conducted on other Brachyrhaphis species using clear plastic tanks (Archard 201
and Braithwaite 2011a). Previous studies on additional species have also shown that exploration 202
in the lab is correlated with exploration in the wild (Kobler et al. 2009). Because we used wild-203
caught individuals, the patterns we observe potentially reflect genetic or environmental factors, 204
or a combination of both. Likewise, our study does not attempt to determine how fish respond to 205
the immediate presence of a predator (e.g., do fish from predator environments reduce activity 206
when a predator is detected, while a predator-naïve fish does not respond), but rather how 207

11
populations behave while exploring a novel environment. In this study, we used methods similar 208
to those of Archard and Braithwaite (2011) on B. episcopi. We did this in part to facilitate 209
comparison between their study and ours, in order to examine similarities between species pairs 210
(our study) and between population pairs (Archard and Braithwaite 2011a). We used a clear, 211
plastic tank (width 400 mm × length 400 mm × height 240 mm) with water depth 100 mm, and 212
covered on all sides with black paper. Light levels were constant between all trials, and the tank 213
was situated such that no shadows fell within the arena. All trials were conducted in a sound-214
proof chamber located in the BYU EEL facilities to prevent interference from outside noise, and 215
were monitored externally by video. For each trial, we placed a clear, colorless plastic cylinder 216
of 80 mm diameter in the center of the tank. We placed each fish in the cylinder and allowed it 217
to settle for a period of 2 minutes, after which the cylinder was remotely raised via a pulley. We 218
then recorded behavior and activity of the focal fish using a video camera placed above the tank 219
for an 8-minute observation period. The base of the arena was marked with a line 50 mm in from 220
the perimeter of the tank to define an ‘edge’ zone and ‘center’ zone. We also placed two lines 221
(crossing at 90◦ to one another in the center of the box) to divide the edge and center zone into 222
quarters (Archard and Braithwaite 2011a). At the completion of each trial, standard length (SL) 223
of the focal fish was determined to the nearest 0.5 mm. The behavior of each fish was only 224
measured once. Although we recognize that individual behavioral plasticity could be present, we 225
were not interested in measuring the consistence of individual differences in behavior (i.e., 226
personalities). Our goal was to get a relative estimate of the activity and exploration levels of 227
each population for comparative purposes. 228
Once a trial was complete, we analyzed videos using Etholog v2.2.5 (Ottoni 2000) to 229
quantify fish activity and exploration levels; we focused specifically on when a fish was moving 230

12
and when a fish moved between different quarters of the tank. All videos were analyzed by the 231
same observer to ensure consistency, and the observer was blind with regards to the population 232
of origin of the test subject in order to eliminate observation bias. We used these data to calculate 233
seven measures of exploration and activity level: 1) the latency to first reach the edge zone after 234
settling; 2) the latency to then return into the center zone; 3) the proportion of time spent in the 235
center zone of the arena (not counting the time taken to first reach the edge zone); 4) the mean 236
duration of visits to the center zone; 5) the proportion of time spent motionless; 6) the rate of 237
movement between the four quarters; and 7) the rate of movement between all tank sections (i.e., 238
both within and between quarters). These variables effectively represent exploration (variables 239
1-4) and activity levels (variables 5-7), We conducted a total of 103 individual trials: 55 samples 240
of B. roseni (29 from the Rio Chiriquí Viejo drainage, 26 from the Rio David drainage) and 48 241
samples of B. terrabensis (28 from the Rio Chiriquí Viejo drainage, 23 from the Rio David 242
drainage). We used roughly equal numbers of males and females for each sample populations, 243
with at least 10 individuals from each sex for each population. All collecting and experimental 244
procedures were approved by the BYU IACUC (protocol number 11-0901). 245
Phenotypic trajectory analysis 246
Phenotypic trajectory analysis (PTA) can be used on data sets that consist of multivariate 247
data and have a two-factor design (e.g., predation environment and drainage in our study), with a 248
significant interaction between factors (Collyer and Adams 2007; Adams and Collyer 2009). To 249
our knowledge the PTA has never been used for behavioral data sets. Phenotypic trajectory 250
analysis tests whether the significant interaction between main effects and the ‘index variable’ 251
(defined below) resulted from differences in magnitude (MD) or direction (Θ) of phenotypic 252
(behavioral) change, or both (see Adams and Collyer, 2009; Collyer and Adams, 2007 for 253

13
computational details). In this study, trajectory magnitude is a measure of phenotypic change in 254
behavior; trajectories with similar behaviors for each level (e.g., drainage or species) will have a 255
smaller magnitude than trajectories with extremely different behaviors for each level. Trajectory 256
direction compares the orientation of trajectories in the multivariate trait space; those that have 257
similar behavioral changes across levels will not have significant differences in trajectory 258
direction. However, where behaviors become more similar (i.e., convergence in behavioral traits) 259
or more dissimilar (i.e., divergence in behavioral traits) across levels, the direction will be 260
significantly different between trajectories. 261
To analyze our multivariate data set, we first conducted two principal component 262
analyses (PCA): one for the four variables describing exploration and one for the three variables 263
describing activity. These PCAs were performed on a correlation matrix with standardized 264
variables. Using PC scores facilitates the visual interpretation of the phenotypic landscape 265
without altering the outcome of the PTA (Dennis et al. 2011). We then analyzed the data (using 266
all PC scores as the response variables) using mixed model multivariate analyses of variances 267
(MANOVA) using proc Mixed in SAS and used model selection techniques [i.e., AIC; (Johnson 268
and Omland 2004)] to determine the best fit model for the activity and exploration data (see 269
Online Resources 1 and 2 for model comparisons and AIC scores). Given that PC scores are 270
orthogonal and ordered according to the amount of variation they explain, they can be treated as 271
repeated measures and numbered with the use of an index variable; this variable is analogous to 272
time in a traditional repeated measures model. Thus, we treated the order number of the PC 273
scores as an ‘index variable’ and included it in the repeated statement for mixed model analyses. 274
In the MANOVA model for the activity and exploration data, we modeled six a priori 275
hypotheses based on study objectives and biological relevance. We included in the models the 276

14
main effects of species, sex, standard length, drainage, and the index variable. Interactions of the 277
index variable with main effect(s) are the terms of interest in the MANOVA because they test 278
differences in the levels of the main effect(s) while allowing the magnitude and direction of 279
differences to vary independently among principal components (Butler et al. 2009; Wesner et al. 280
2011; Hassell et al. 2012). Therefore, we also included the 2-way interactions that included the 281
index variable with other main effects (n=4 parameters). Three-way interactions that included the 282
index variable (n=6) were included in the models, but we did not include 4-way or the 5-way 283
interactions because they cannot be interpreted and thus are not biologically meaningful. The full 284
model included all 3-way interactions; the reduced model included only the 285
species*drainage*index variable. Four other models were generated that each removed all 3-way 286
interactions that included one of the main effects, e.g. one model excluded all 3-way interactions 287
that included the main effect of standard length. However, each of these reduced models retained 288
the interaction of species*drainage*index variable as this interaction tested one of our study 289
objectives. After running the full model, we ran reduced models to determine the best fit model 290
for the activity and exploration data (see Online Resources 1 and 2 for model comparisons and 291
AIC scores). 292
We used the PTA to compare two different trajectories: a ‘species’ trajectory and a 293
‘drainage’ trajectory (described below). Given that we found a significant interaction between 294
species and drainage (see Results), we used the PTA to address two different, but related, 295
questions about the evolution of activity and exploration in this group. First, our species 296
trajectory, which focused on the magnitude and direction of change between river drainages 297
within a species, addressed the questions: do B. roseni and B. terrabensis differ in the amount of 298
behavioral phenotypic change that occurs between drainages, and do they evolve in parallel 299

15
directions? Second, our drainage trajectory, which focused on the magnitude and direction of 300
change between species but within drainages, addressed the questions: do species show greater 301
behavioral phenotypic divergence in one drainage than in another, and do they evolve in parallel 302
directions? Here, we compared both size and direction of the phenotypic trajectories to test for 303
differences in magnitude and direction of behavioral divergence and to determine if local 304
environment affects species differently. We conducted the PTA using program R (R Core 305
Development Team 2010). Mixed MANOVAs for the PTA were conducted in ASREML-R 306
version 3.00 (Butler et al. 2007) within R; model results did not differ from analyses conducted 307
using proc Mixed in SAS. For the ‘exploration’ and 'activity' data sets we plotted LS means on 308
the first two PCs, which accounted for 63.52% and 17.74% of the observed variation for 309
exploration, and 86.72% and 11.95% for activity, to visualize differences in magnitude and 310
direction of behavioral change (Figures 2 and 3). For each figure we scaled the axes according to 311
the percent of variance explained in order to more accurately represent the contribution of each 312
PC. 313
314
RESULTS 315
MANOVA and PTA for Activity and Exploration: Drainage and Species Trajectories 316
As predicted, B. roseni and B. terrabensis significantly differed in both ‘activity’ and 317
‘exploration’ (Tables 1 and 2), with B. roseni being more active and explorative overall than B. 318
terrabensis. The best-fit model for ‘activity’ was: Index variable + Species + Sex + Drainage + 319
SL + Index variable x Species + Index variable x Sex + Index variable x Drainage + Index 320
variable x SL + Index variable x Species x Drainage + Index variable x Species x Sex + Index 321
variable x Drainage x Sex (for model selection details, see Online Resources 1). The interactions 322
16
of Species x Index variable and Species x Drainage x Index variable were significant predictors 323
of ‘activity’ (Table 1). This suggests that, despite overall species differences, the patterns of 324
change found in each species differed by drainage. We ran a PTA to analyze both species 325
trajectories and drainage trajectories for ‘activity.’ For species trajectories, B. roseni showed a 326
greater magnitude of change in behavior between drainages than B. terrabensis (MD = 1.089; P 327
= 0.025), with no difference in the orientation (i.e., direction) of change (θ = 168.97°; P = 0.11). 328
For drainage trajectories, there was a greater magnitude of divergence in the Rio Chiriquí Viejo 329
drainage than the Rio David drainage (MD = 1.456; P = 0.003), with no difference in the 330
orientation of change (θ = 85.848°; P = 0.72). These differences in magnitude resulted from an 331
increase in ‘activity’ in B. roseni from the Chiriquí Viejo drainage (i.e., less time spent 332
motionless and a higher rate of movement; Table 3 and Fig. 1). Despite the large angle 333
differences in the orientation of change, the PTA failed to detect any significant signal of non-334
parallel divergence. 335
The best-fit model for ‘exploration’ was: Index variable + Species + Sex + Drainage + SL + 336
Index variable x Species + Index variable x Sex + Index variable x Drainage + Index variable x 337
SL + Index variable x Species x Drainage + Index variable x Species x Sex + Index variable x 338
Drainage x Sex (for model selection details, see Online Resource 2). ‘Exploration’ differed 339
significantly for the interaction of Species x Index variable and Species x Drainage x Index 340
variable (Table 2). This suggested that, as is the ‘activity’ data, the patterns of behavioral 341
divergence differed between species or drainage. We ran a PTA to analyze both species 342
trajectories and drainage trajectories for ‘exploration.’ For species trajectories, no difference in 343
either magnitude or orientation of change was recovered (MD = 0.138, P = 0.649; θ = 140.211°, 344
P = 0.152). For drainage trajectories, there was a greater magnitude of divergence in the Rio 345

17
Chiriquí Viejo drainage than the Rio David drainage (MD = 1.606; P = 0.0001), with no 346
difference in the orientation of change (θ = 35.762°; P = 0.949). These differences were 347
attributed to an increase in ‘exploration’ in the Chiriquí Viejo B. roseni population, and a 348
decrease in ‘exploration’ in the Chiriquí Viejo B. terrabensis population (Table 4 and Fig. 2). 349
Thus, our results suggest that B. roseni and B. terrabensis differed in their ‘activity’ and 350
‘exploration’ levels, and that although the magnitude of change varied between drainages, there 351
was not support for non-parallel divergence. 352
353
DISCUSSION 354
Differential activity and exploration levels in species from divergent predation environments 355
Our results provide evidence that both activity and exploration levels in Brachyrhaphis 356
roseni and B. terrabensis are strongly correlated with, and could be driven by, divergence in 357
predation environment (i.e., the presence of predators and corresponding environmental 358
differences). Populations from more complex, predator rich environments (B. roseni) were 359
overall more active and prone to explore a novel environment than populations from less 360
complex, predator free environments (B. terrabensis). Our conclusions are largely consistent 361
with studies of activity and exploration in other taxa with populations from different predation 362
environments (Huntingford et al. 1994; Riechert and Hall 2000; Dingemanse et al. 2007), 363
although further tests are necessary to determine which environmental differences (e.g., 364
predation pressure, resource availability, or population density) act as the primary selective 365
forces driving behavioral divergence. 366
Brachyrhaphis roseni and B. terrabensis experience vastly different environments 367
throughout their range in western Panama. Brachyrhaphis roseni occupies low-elevation streams 368

18
with low stream flow, warm water, complex microhabitats, and a diverse fish community that 369
includes several types of large piscine predators (e.g., Hoplias microlepis). In contrast, B. 370
terrabensis occupies high-elevation streams with higher stream flow, cooler water, and very low 371
levels of habitat heterogeneity and fish diversity, with a lack of piscine predators (B. terrabensis 372
is often the only fish species present). We predicted that these environmental differences would 373
result in dramatically different behavioral traits, with B. roseni being more active and prone to 374
explore a novel environment than B. terrabensis. Indeed, our results largely support this 375
prediction. Overall, B. roseni spent more time actively exploring the arena (i.e., less time 376
motionless) and had an increased rate of movement throughout the arena relative to B. 377
terrabensis. Likewise, B. roseni took longer to leave the center of the arena, but returned more 378
quickly and spent more time overall in the center than B. terrabensis. In fact, B. terrabensis often 379
quickly left the center of the arena and then remained motionless along the side of the arena for 380
the duration of the trial. The time that a subject spends in the open area of an arena is a standard 381
behavioral measurement (Walsh and Cummins 1976), with the assumption that individuals 382
perceive themselves as safer when they are adjacent to a wall rather than in the open. Thus, time 383
spent in the center of an arena can be interpreted as a measure of boldness or propensity to 384
engage in ‘risky’ behavior. Hence, our results suggest that B. roseni is more prone than to engage 385
in this risky, explorative behavior than B. terrabensis when introduced to a novel environment. 386
Our findings are remarkably similar to those of a recent study on the closely related B. 387
episcopi, in which populations occur either with or without predators. Archard and Braithwaite 388
(2011a) found that populations that live in complex, predator rich environments tend to be more 389
active and prone to explore than those from less complex, predator free environments. However, 390
unlike Archard and Braithwaite (2011a), we found that fish from our study that occur in predator 391

19
environments (B. roseni) spent more time in the center of the arena than those that occur in 392
predator free environments (B. terrabensis), a pattern opposite to that observed among 393
populations of B. episcopi. Why such differences exist between these species remains unclear. 394
In addition to differences in overall activity and exploration levels between species from 395
different environments, we also found some differences among populations within each of our 396
focal species, suggesting that behavior varies geographically in these species. For example, both 397
activity and exploration levels varied significantly among species when comparing populations 398
between drainages (i.e., significant species by drainage interaction). Phenotypic trajectory 399
analyses revealed that this difference resulted from a difference in magnitude of behavioral 400
change in B. roseni and B. terrabensis, with no support found for a difference in the orientation 401
or direction of change (Tables 1 and 2; Figs 1 and 2). Similarly, interspecific levels of divergence 402
differed between drainages, with greater interspecific divergence occurring in the Chiriquí Viejo 403
drainage than in the David drainage, while the PTA found no evidence for differences in the 404
angle of divergence. Our PTA, and our plotting of PC scores for univariate comparisons, 405
revealed that B. roseni showed a greater magnitude of behavioral divergence between drainages 406
than did B. terrabensis, although we found no statistically significant evidence that the two 407
species evolved in different directions between drainages. Specifically, our findings related to 408
activity levels suggest that B. roseni from the Chiriquí Viejo drainage is dramatically divergent 409
from the other three populations sampled (Fig. 1). The pattern of divergence in exploration levels 410
differs, in that both B. roseni populations were more prone to explore than B. terrabensis 411
populations, although the magnitude of interspecific divergence in the David drainage was far 412
less than that found in the Chiriquí Viejo drainage. Together, these findings suggests that some 413
difference between drainages is driving divergence in behavioral traits in these sister species, but 414

20
that each species reacts differently in terms of the magnitude of change they show. The exact 415
cause of this difference in magnitude is unknown, yet provides an interesting avenue of future 416
research. Brachyrhaphis roseni may show this greater magnitude of divergence between 417
populations because of greater habitat heterogeneity at lower elevations than is found in 418
upstream areas where B. terrabensis occurs. Lower elevation streams are often more complex 419
ecosystems than higher elevation streams, and vary in terms of stream canopy cover and 420
vertebrate communities (Angermeier and Karr 1983). Populations of the European minnow 421
(Phoxinus phoxinus) from divergent predation environments have been shown to vary in their 422
ability to adjust their behaviors based on the environment. Specifically, laboratory reared 423
individuals derived from predation rich populations showed greater behavioral adjustment when 424
exposed to a predator at a young age than laboratory reared individuals from predator-naïve 425
populations (Magurran 1990), suggesting that populations that co-occur with predators may have 426
a higher capacity for behavioral plasticity. If this were the case with B. roseni and B. terrabensis, 427
we would predict that B. roseni would be more adept at adjusting its behavior in varying 428
environments than B. terrabensis, possibly explaining the increased magnitude of divergence 429
within B. roseni relative to B. terrabensis. Differences in behavioral divergence in populations of 430
B. roseni could also be explained by a greater period of isolation compared to populations of B. 431
terrabensis (i.e., less gene flow among populations within species), although our preliminary 432
analyses indicate that this is not the case (S. Ingley, unpublished data). Overall, these findings 433
underscore the need to evaluate behavior in multiple populations for a given species, and 434
highlight the utility of the PTA for detecting cryptic patterns in multivariate behavioral data sets, 435
such as the magnitude of change and whether species are diverging, converging, or evolving in 436
parallel. 437

21
Why do activity and exploration levels differ? 438
What underlying processes could be driving divergent behaviors in populations from 439
different predation environments? Individuals from populations or species that have experienced 440
complex, predator rich habitats are often found to be more bold and prone to explore a novel 441
environment (Krause et al. 2000; Lammers et al. 2009; Wilson et al. 2010; Archard and 442
Braithwaite 2011a; Nannini et al. 2012), consistent with the general hypothesis that an increase 443
in environmental risk and complexity is correlated with an increase in potentially risky behavior. 444
Despite significant differences in behavior between drainages, our data set provides some 445
additional support for this hypothesis, in that overall B. roseni was more active and explorative 446
in a novel environment than B. terrabensis (Table 1). Several potential advantages to these 447
behavioral types could stem from both biotic (e.g., presence of predators and community 448
diversity) and abiotic (e.g., canopy cover, stream flow, microhabitat diversity, and resource 449
availability) environmental differences in the sites where these species are found. For example, 450
B. roseni, which occurs at lower population densities than B. terrabensis, could benefit from 451
greater activity levels by increasing encounter rate with potential mates in an attempt to 452
maximize current reproduction rather than future reproduction. Moreover, given that higher rates 453
of extrinsic mortality are typically associated with increased predation threat (Johnson and 454
Zuniga-Vega 2009), individuals may benefit from being bolder in a novel environment in order 455
to maximize lifetime reproductive success by increasing mating opportunities (Lima and Dill 456
1990; Wolf et al. 2007). Theory predicts that this sort of life-history trade-off could explain 457
within-species variation in and the evolution of personality traits (Wolf et al. 2007). Although we 458
did not explicitly test for animal personality (i.e., consistent individual differences in behavior 459
across time and contexts) in these species, the overall differences in behavioral traits between 460
22
species and among populations could also be explained by differences in life-history trade-offs 461
associated with divergent environments. 462
Differences in activity and exploration levels between B. roseni and B. terrabensis may 463
also be influenced by resource availability and microhabitat complexity. Population densities are 464
often greater in predator-free environments, and this increased population density is often 465
associated with more limited resources (Reznick and Yang 1993; Grether et al. 2001; Reznick et 466
al. 2001; Walsh and Reznick 2009). Non-density dependent environmental factors (e.g., canopy 467
cover) can also contribute to decreased resource availability in predator-free environments 468
(Grether et al. 2001; Johnson 2002). Therefore, reduced activity levels may limit the quantity of 469
resources needed for growth, reproduction, and somatic maintenance, because individuals that 470
are less active have a lower metabolic rate (Careau et al. 2008). Our data also supports this 471
possibility, with individuals from predator-free environments (where resources are presumably 472
lower) exhibiting lower activity levels than individuals from predator environments. In addition, 473
differences in activity and exploration could be explained by different foraging strategies. For 474
example, B. roseni occupies low-elevation streams, which typically have a slow flow rate and 475
higher microhabitat complexity. On the contrary, B. terrabensis occupies high-elevation streams, 476
which typically have a fast flow rate and lower microhabitat complexity. Brachyrhaphis roseni is 477
known to actively forage at the water’s surface, while B. terrabensis forages in the water column 478
in high-flow areas. When not actively foraging, B. terrabensis tends to avoid the higher flow 479
areas by settling near the substrate or holding its position behind rocks (S. Ingley, unpublished 480
data). Thus, the foraging strategies of each species appear to complement the observed 481
differences in activity and exploration. 482
483

23
CONCLUSION 484
Recent work on the evolution of behavior has shown that ecological factors can be key agents in 485
driving the evolution of various behavioral traits, and that examining behavioral variation in 486
multiple populations is crucial. Here, we show that differences in environment, including the 487
presence or absence of predators and associated environmental differences, appear to be closely 488
linked to divergent patterns in activity and exploration traits between sister species of 489
Brachyrhaphis fishes, and that these patterns are consistent with those observed at the intra-490
specific level in a closely relates species. Our observations, and the use of phenotypic trajectory 491
analysis, point to several experiments that could explicitly address whether or not these 492
behaviors are genetically based and adaptive. Our study also highlights the utility of the 493
phenotypic trajectory analysis in behavioral research, a method we use here to test for shared and 494
unique patterns of behavioral divergence among populations within river drainages. A major 495
advantage of using PTA is that it allows researchers to compare phenotypic evolution across time 496
or among geographic replicates (e.g., among drainages in our study), providing added flexibility 497
and analytical power to other statistical tests, particularly when researchers are interested in 498
studying geographic variations in behavioral traits and testing for patterns such as convergence, 499
divergence, and parallelism. Hence, our work not only shows the impact that divergent 500
environments can have on behavioral traits, but it also reveals how a promising new method can 501
be applied to behavioral questions in general. 502
503
ACKNOWLEDGMENTS 504
This work was supported by the Monte L. Bean Life Science Museum; a BYU MEG grant to 505
JBJ; and the U.S. National Science Foundation (OISE 0539267, IOS-1045226 to JBJ, NSF 506
Graduate Research Fellowship to SJI). We thank P. Johnson and M. McEntire for help in the 507

24
field. Specimens were collected under ANAM permit no. SC/A-26-11 and exported under 508
ANAM permit no. SEX/A-60-11. We thank the Smithsonian Tropical Research Institute for help 509
with obtaining collecting and export permits in Panama. 510
511
ETHICAL STANDARDS 512
All the experiments in this study comply with the current laws of the country in which they were 513
performed. 514
CONFLICT OF INTEREST 515
The authors declare that they have no conflict of interest. 516
517
REFERENCES 518 519
Abrams PA (1993) Does increased mortality favor the evolution of more rapid senescence. 520
Evolution 47:877-887 521
Adams DC, Collyer ML (2009) A general framework for the analysis of phenotypic trajectories 522
in evolutionary studies. Evolution 63:1143-1154 523
Angermeier PL, Karr JR (1983) Fish communities along environmental gradients in a system of 524
tropical streams. Environ Biol Fish 9:117-135 525
Archard GA, Braithwaite VA (2011a) Increased exposure to predators increases both exploration 526
and activity level in Brachyrhaphis episcopi. J Fish Biol 78:593-601 527
Archard GA, Braithwaite VA (2011b) Variation in aggressive behaviour in the poeciliid fish 528
Brachyrhaphis episcopi: Population and sex differences. Behav Process 86:52-57 529
Basolo AL (2004) Variation between and within the sexes in body size preferences. Anim Behav 530
68:75-82 531

25
Brown C, Braithwaite VA (2004) Size matters: a test of boldness in eight populations of the 532
poeciliid Brachyraphis episcopi. Anim Behav 68:1325-1329 533
Brown C, Braithwaite VA (2005) Effects of predation pressure on the cognitive ability of the 534
poeciliid Brachyraphis episcopi. Behav Ecol 16:482-487 535
Brown C, Gardner C, Braithwaite VA (2004) Population variation in lateralized eye use in the 536
poeciliid Brachyraphis episcopi. Proc R Soc Lond B 271:S455-S457 537
Brown C, Gardner C, Braithwaite VA (2005) Differential stress responses in fish from areas of 538
high- and low-predation pressure. J Comp Physiol B 175:305-312 539
Brydges NM, Colegrave N, Heathcote RJP, Braithwaite VA (2008) Habitat stability and 540
predation pressure affect temperament behaviours in populations of three-spined 541
sticklebacks. J Anim Ecol 77:229-235 542
Bussing W (1998) Peces de las aguas continentales de Costa Rica. Editorial Universidad de 543
Costa Rica, San Jose 544
Butler DG, Cullis BR, Gilmour AR, Gogel BJ (2007) Analysis of Mixed Models for S language 545
environments. ASReml-R reference manual, version 2. Queensland Department of 546
Primary Industries and Fisheries, Brisbane 547
Butler DG, Cullis BR, Gilmour AR, Gogel BJ (2009) Analysis of Mixed Models for S language 548
environments. ASReml-R reference manual, version 3. Queensland Department of 549
Primary Industries and Fisheries, Brisbane 550
Careau V, Thomas D, Humphries MM, Reale D (2008) Energy metabolism and animal 551
personality. Oikos 117:641-653 552
Collyer ML, Adams DC (2007) Analysis of two-state multivariate phenotypic change in 553
ecological studies. Ecology 88:683-692 554

26
Dennis SR, Carter MJ, Hentley WT, Beckerman AP (2011) Phenotypic convergence along a 555
gradient of predation risk. Proc R Soc Lond B 278:1687-1696 556
Dingemanse NJ, Wright J, Kazem AJN, Thomas DK, Hickling R, Dawnay N (2007) Behavioural 557
syndromes differ predictably between 12 populations of three-spined stickleback. J Anim 558
Ecol 76:1128-1138 559
Endler JA (1987) Predation, light intensity and courtship behavior in Poecilia-reticulata (Pisces, 560
Poeciliidae). Anim Behav 35:1376-1385 561
Foster SA (1999) The geography of behaviour: an evolutionary perspective. Trends Ecol Evol 562
14:190-195 563
Foster SA (2013) Evolutionary insights from behavioural geography: plasticity, evolution, and 564
responses to rapid environmental change. Evol Ecol Res 15:705-731 565
Foster SA, Endler JA (1999) Geographic Variation in Behavior: Perspectives on Evolutionary 566
Mechanisms. Oxford University Press, Oxford 567
Godin JGJ, Briggs SE (1996) Female mate choice under predation risk in the guppy. Anim 568
Behav 51:117-130 569
Grether GF, Millie DF, Bryant MJ, Reznick DN, Mayea W (2001) Rain forest canopy cover, 570
resource availability, and life history evolution in guppies. Ecology 82:1546-1559 571
Hassell EMA, Meyers PJ, Billman EJ, Rasmussen JE, Belk MC (2012) Ontogeny and Sex alter 572
the effect of predation on body shape in a livebearing fish: sexual dimorphism, 573
parallelism, and costs of reproduction. Ecol Evol 2:1738-1746 574
Huntingford FA, Wright PJ, Tierney JF (1994) Adaptive variation in antipredator behaviour in 575
threespine stickleback. In: Bell MA, Forster SA (eds) The Evolutionary Biology of the 576
Threespine Stickleback. Oxford University Press, Oxford, pp 345-380 577

27
Ingley SJ, Billman EJ, Belk MC, Johnson JB (2014) Morphological divergence driven by 578
predation environment within and between species of Brachyrhaphis fishes. PLoS ONE 579
9:e90274 1-11 580
Jennions MD, Kelly CD (2002) Geographical variation in male genitalia in Brachyphaphis 581
episcopi (Poeciliidae): is it sexually or naturally selected? Oikos 97:79-86 582
Jennions MD, Telford SR (2002) Life-history phenotypes in populations of Brachyrhaphis 583
episcopi (Poeciliidae) with different predator communities. Oecologia 132:44-50 584
Jennions MD, Wong BBM, Cowling A, Donnelly C (2006) Life-history phenotypes in a live-585
bearing fish Brachyrhaphis episcopi living under different predator regimes: seasonal 586
effects? Environ Biol Fish 76:211-219 587
Johnson JB (2001a) Adaptive life-history evolution in the livebearing fish Brachyrhaphis 588
rhabdophora: Genetic basis for parallel divergence in age and size at maturity and a test 589
of predator-induced plasticity. Evolution 55:1486-1491 590
Johnson JB (2001b) Hierarchical organization of genetic variation in the Costa Rican livebearing 591
fish Brachyrhaphis rhabdophora (Poeciliidae). Biol J Linn Soc 72:519-527 592
Johnson JB (2002) Divergent life histories among populations of the fish Brachyrhaphis 593
rhabdophora: detecting putative agents of selection by candidate model analysis. Oikos 594
96:82-91 595
Johnson JB, Belk MC (2001) Predation environment predicts divergent life-history phenotypes 596
among populations of the livebearing fish Brachyrhaphis rhabdophora. Oecologia 597
126:142-149 598
Johnson JB, Omland KS (2004) Model selection in ecology and evolution. Trends Ecol Evol 599
19:101-108 600

28
Johnson JB, Zuniga-Vega JJ (2009) Differential mortality drives life-history evolution and 601
population dynamics in the fish Brachyrhaphis rhabdophora. Ecology 90:2243-2252 602
Jones CP, Johnson JB (2009) Phylogeography of the livebearer Xenophallus umbratilis 603
(Teleostei: Poeciliidae): glacial cycles and sea level change predict diversification of a 604
freshwater tropical fish. Mol Ecol 18:1640-1653 605
Kobler A, Engelen B, Knaepkens G, Eens M (2009) Temperament in bullheads: do laboratory 606
and field explorative behaviour variables correlate? Naturwissenschaften 96:1229-1233 607
Krause J, Cheng DJS, Kirkman E, Ruxton GD (2000) Species-specific patterns of refuge use in 608
fish: The role of metabolic expenditure and body length. Behaviour 137:1113-1127 609
Kruuk LEB, Gilchrist JS (1997) Mechanisms maintaining species differentiation: Predator-610
mediated selection in a Bombina hybrid zone. Proc R Soc Lond B 264:105-110 611
Lammers JH, Warburton K, Cribb BW (2009) Anti-predator strategies in relation to diurnal 612
refuge usage and exploration in the Sustralian freshwater prawn, Macrobrachium 613
australiense. J Crustacean Biol 29:175-182 614
Langerhans RB (2009a) Morphology, performance, fitness: functional insight into a post-615
Pleistocene radiation of mosquitofish. Biol Lett 5:488-491 616
Langerhans RB (2009b) Trade-off between steady and unsteady swimming underlies predator-617
driven divergence in Gambusia affinis. J Evol Biol 22:1057-1075 618
Langerhans RB, DeWitt TJ (2004) Shared and unique features of evolutionary diversification. 619
Am Nat 164:335-349 620
Langerhans RB, Layman CA, Shokrollahi AM, DeWitt TJ (2004) Predator-driven phenotypic 621
diversification in Gambusia affinis. Evolution 58: 2305-18 622

29
Langerhans RB, Makowicz AM (2009) Shared and unique features of morphological 623
differentiation between predator regimes in Gambusia caymanensis. J Evol Biol 22:2231-624
2242 625
Lima SL, Dill LM (1990) Behavioral decisions made under the risk of predation - a review and 626
prospectus. Can J Zool 68:619-640 627
Magurran, AE (1990) The inheritance and development of minnow anti-predator behaviour. 628
Anim Behav 39:834-842 629
Mateos M (2005) Comparative phylogeography of livebearing fishes in the genera Poeciliopsis 630
and Poecilia (Poeciliidae: Cyprinodontiformes) in central Mexico. J Biogeogr 32:775-631
780 632
Millot S, Begout ML, Chatain B (2009) Exploration behaviour and flight response toward a 633
stimulus in three sea bass strains (Dicentrarchus labrax L.). Appl Anim Behav Sci 634
119:108-114d 635
Nannini MA, Parkos J, III, Wahl DH (2012) Do behavioral syndromes affect foraging strategy 636
and risk-taking in a juvenile fish predator? T Am Fish Soc 141:26-33 637
Nomakuchi S, Park PJ, Bell MA (2009) Correlation between exploration activity and use of 638
social information in three-spined sticklebacks. Behav Ecol 20:340-345 639
Ottoni EB (2000) EthoLog 2.2: A tool for the transcription and timing of behavior observation 640
sessions. Behav Res Meth Instr 32:446-449 641
Reale D, Reader SM, Sol D, McDougall PT, Dingemanse NJ (2007) Integrating animal 642
temperament within ecology and evolution. Biol Rev 82:291-318 643
Reznick DN (1989) Life-history evolution in guppies .2. Repeatability of field observations and 644
the effects of season on life histories. Evolution 43:1285-1297 645

30
Reznick DN (1996) Life history evolution in guppies: A model system for the empirical study of 646
adaptation. Neth J Zool 46:172-190 647
Reznick DN, Bryga H (1987) Life-history evolution in guppies (Poecilia-reticulata) .1. 648
Phenotypic and genetic changes in an introduction experiment. Evolution 41:1370-1385 649
Reznick DN, Butler MJ, Rodd H (2001) Life-history evolution in guppies. VII. The comparative 650
ecology of high- and low-predation environments. Am Nat 157:126-140 651
Reznick DN, Yang AP (1993) The influence of fluctuating resources on life-history - patterns of 652
allocation and plasticity in female guppies. Ecology 74:2011-2019 653
Riechert SE (1999) The use of behavioral ecotypes in the study of evolutionary processes. In: 654
Foster SA, Endler JA (eds) Geographic Variation in Behavior: Perspectives on 655
Evolutionary Mechanisms. Oxford University Press, New York 656
Riechert SE, Hall RF (2000) Local population success in heterogeneous habitats: reciprocal 657
transplant experiments completed on a desert spider. J Evol Biol 13:541-550 658
Rodd FH, Reznick DN (1991) Life-history evolution in guppies. 3. The impact of prawn 659
predation on guppy life histories. Oikos 62:13-19 660
Urban MC (2007) Risky prey behavior evolves in risky habitats. P Natl Acad Sci USA. 661
104:14377-14382 662
Walsh MR, Reznick DN (2009) Phenotypic diversification across an environmental gradient: a 663
role for predators and resource availability on the evolution of life histories. Evolution 664
63:3201-3213 665
Walsh RN, Cummins RA (1976) Open-field test - critical-review. Psychol Bull 83:482-504 666

31
Wesner JS, Billman EJ, Meier A, Belk MC (2011) Morphological convergence during pregnancy 667
among predator and nonpredator populations of the livebearing fish Brachyrhaphis 668
rhabdophora (Teleostei: Poeciliidae). Biol J Linn Soc 104:386-392 669
West-Eberhard MJ (2003) Developmental Plasticity and Evolution. Oxford University Press, 670
New York 671
Wilson ADM, Godin JGJ (2009) Boldness and behavioral syndromes in the bluegill sunfish, 672
Lepomis macrochirus. Behav Ecol 20:231-237 673
Wilson ADM, Whattam EM, Bennett R, Visanuvimol L, Lauzon C, Bertram SM (2010) 674
Behavioral correlations across activity, mating, exploration, aggression, and antipredator 675
contexts in the European house cricket, Acheta domesticus. Behav Ecol Sociobiol 676
64:703-715 677
Wolf M, van Doorn GS, Leimar O, Weissing FJ (2007) Life-history trade-offs favour the 678
evolution of animal personalities. Nature 447:581-584 679
680
681
682
683
684
685
686
687
688
689

32
Fig. 1 Graph of least square means of principle component (PC) scores (±SE) representing 690
‘activity’ for Brachyrhaphis roseni and B. terrabensis for the Rio Chiriquí Viejo drainage and 691
the Rio David drainage. Brachyrhaphis roseni showed greater divergence in exploration levels 692
between drainages relative to B. terrabensis, and species were more divergent in the Rio Chiriquí 693
Viejo drainage than the Rio David drainage. Dotted lines represent the ‘drainage’ trajectory 694
tested with the PTA. The aspect ratio of each axis is scaled to represent the amount of variation 695
explained by each PC 696
697
698
699
700
701

33
Fig. 2 Graph of least square means of principle component (PC) scores (±SE) representing 702
‘exploration’ for Brachyrhaphis roseni and B. terrabensis for the Rio Chiriquí Viejo drainage 703
and the Rio David drainage. Brachyrhaphis roseni showed greater divergence in exploration 704
levels between drainages relative to B. terrabensis, and species were more divergent in the Rio 705
Chiriquí Viejo drainage than the Rio David drainage. Dotted lines represent the ‘drainage’ 706
trajectory tested with the PTA. The aspect ratio of each axis is scaled to represent the amount of 707
variation explained by each PC 708
709
710
711
712
713
714

34
Table 1 Results of mixed repeated measures MANOVA testing for significant interactions for all 715
combinations of species, sex, drainage, standard length (SL), and index variable for behavioral 716
variables representing activity 717
Effect DF (fm) F (a) P (a)
Index variable 2, 136 0.20 0.816
Species 1, 127 5.07 0.026
Sex 1, 127 1.28 0.260
Drainage 1, 127 5.23 0.024
Standard length (SL) 1, 127 0.31 0.578
Species × index variable 2, 136 6.37 0.002
Sex × index variable 2, 136 0.67 0.471
Drainage × index variable 2, 136 1.59 0.207
SL × Index variable 2, 136 0.21 0.810
Species x Drainage x Index variable 3, 154 3.95 0.010
Species x Sex x Index variable 3, 154 1.77 0.156
Drainage x Sex x Index variable 3, 154 0.96 0.413
718
719
720
721

35
Table 2 Results of mixed repeated measures MANOVA testing for significant interactions for all 722
combinations of species, sex, drainage, standard length (SL), and index variable for behavioral 723
variables representing exploration 724
725
Effect DF (fm) F (a) P (a)
Index variable 3, 192 0.50 0.686
Species 1, 247 24.54 < 0.001
Sex 1, 247 0.02 0.901
Drainage 1, 247 2.99 0.085
Standard length (SL) 1, 247 0.10 0.750
Species × index variable 3, 192 8.14 < 0.001
Sex × index variable 3, 192 1.26 0.290
Drainage × index variable 3, 192 0.24 0.868
SL × index variable 3, 192 0.52 0.667
Species x Drainage x index variable 4, 184 3.85 0.005
Species x Sex x Index variable 4, 184 0.98 0.420
Drainage x Sex x Index variable 4, 184 1.93 0.107
726
727
728
729
730

36
Table 3 Component score coefficients from the principal component analysis on behaviors 731
related to 'activity' of Brachyrhaphis terrabensis and B. roseni during open-field behavioral 732
assays 733
734
Variable PC 1 PC 2
Proportion of time still 0.54 0.84
Rate of movement between quarters -0.59 0.39
Rate of movement between all divisions -0.59 0.37
735
736
737
738
739
740
741
742
743
744
745
746
747
37
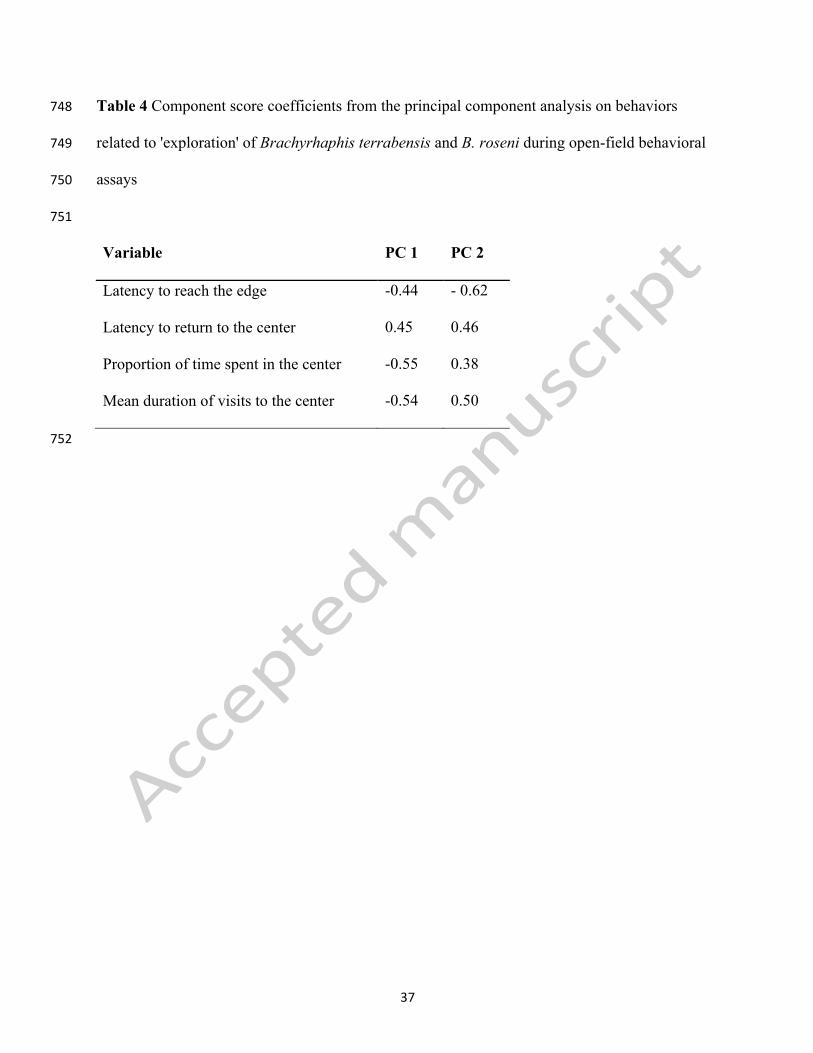
Table 4 Component score coefficients from the principal component analysis on behaviors 748
related to 'exploration' of Brachyrhaphis terrabensis and B. roseni during open-field behavioral 749
assays 750
751
Variable PC 1 PC 2
Latency to reach the edge -0.44 - 0.62
Latency to return to the center 0.45 0.46
Proportion of time spent in the center -0.55 0.38
Mean duration of visits to the center -0.54 0.50
752