
Trajectory-Based Anomalous Event Detection
11
1544 IEEE TRANSACTIONS ON CIRCUITS AND SYSTEMS FOR VIDEO TECHNOLOGY, VOL. 18, NO. 11, NOVEMBER 2008 Trajectory-Based Anomalous Event Detection Claudio Piciarelli, Member, IEEE, Christian Micheloni, Member, IEEE, and Gian Luca Foresti, Senior Member, IEEE Abstract—During the last years, the task of automatic event anal- ysis in video sequences has gained an increasing attention among the research community. The application domains are disparate, ranging from video surveillance to automatic video annotation for sport videos or TV shots. Whatever the application field, most of the works in event analysis are based on two main approaches: the former based on explicit event recognition, focused on finding high- level, semantic interpretations of video sequences, and the latter based on anomaly detection. This paper deals with the second ap- proach, where the final goal is not the explicit labeling of recognized events, but the detection of anomalous events differing from typ- ical patterns. In particular, the proposed work addresses anomaly detection by means of trajectory analysis, an approach with sev- eral application fields, most notably video surveillance and traffic monitoring. The proposed approach is based on single-class sup- port vector machine (SVM) clustering, where the novelty detection SVM capabilities are used for the identification of anomalous tra- jectories. Particular attention is given to trajectory classification in absence of a priori information on the distribution of outliers. Ex- perimental results prove the validity of the proposed approach. Index Terms—Anomaly detection, event analysis, support vector machines (SVMs), trajectory clustering. I. INTRODUCTION I N the last years, several works have been proposed on event analysis. Partial surveys on this topic can be found in the reviews by Buxton [1] and Hu et al. [2] in the field of video surveillance. Even though many different approaches have been developed, they can generally be classified in two categories, often referred to with the terms explicit event recognition and anomaly detection. In the explicit event recognition approach, the system has an explicit knowledge of the events that must be identified. Once an event is detected, it can be properly labeled with a semantic description. The fundamental part of an explicit recognition system is thus an a priori knowledge base, where all the information about the recognizable events is stored, and the system behaves as a “parser” matching the incoming data with predefined templates found in the knowledge base. Explicit event recognition has its primary strength in its expressiveness, because it allows the modeling of heterogeneous events by la- beling them with high-level semantic descriptions, thus giving a real interpretation of the analyzed scene. The main drawback of this approach is the need of a prior modeling for each possible Manuscript received February 25, 2008; revised June 20, 2008. First pub- lished September 26, 2008; current version published October 29, 2008. This work was supported in part by the Italian Ministry of University and Scientific Research within the framework of the project “Ambient Intelligence: Event Analysis, Sensor Reconfiguration and Multimodal Interfaces” (2007–2008). This paper was recommended by Associate Editor D. Schonfeld. The authors are with the Department of Mathematics and Computer Science, University of Udine, Udine 33100, Italy (e-mail: [email protected]. it). Digital Object Identifier 10.1109/TCSVT.2008.2005599 instance of any event of interest. In real-world scenarios with uncontrolled and uncooperative environments, this could imply an exponential growth of the number of models as the scene complexity increases. Because of the nature of the explicit event recognition task, it is not surprising that most works on this topic are based on stochastic parsers for the identification of known patterns of atomic events, as in the works by Ivanov and Bobick [3], Minnen et al. [4] or Moore and Essa [5]. Similar to a parser-based approach is the work of Vu et al. [6], even though in their case the language used to express complex events is not a full grammar, but rather a set of subevents subject to temporal and logical constraints. Other works are based on the integration of prior knowledge and low-level data acquired by video processing (change detection, object tracking, etc.) as in the works by Ayers and Shah [7] or Medioni et al. [8]. Wada and Matsuyama proposed a work in which raw image data are directly used to infer behavior recognition, without in- termediate processing as object detection or tracking [9]. Other works use a priori defined knowledge base partially modeled using machine learning techniques rather than being manually defined as in a stochastic grammar. Most of these works rely on the use of hidden Markov models for event recognition, as in the works by Oliver et al. [10], Galata et al. [11], Brand and Kettnaker [12], and Bashir et al. [13]. Finally, other works are based on more general stochastic models, such as Bayesian networks, as in Hongeng et al. [14] or Moënne-Loccoz et al. [15]. The other popular approach to event analysis is based on anomaly detection. In this case, the system does not require a prior knowledge base about the events that should be recog- nized. On the contrary, the event models are automatically built by the system itself in an unsupervised way, as the data are ac- quired. The models have a probabilistic nature, in the sense that the system is able to detect the most frequent patterns of ac- tivity occurred in the scene; the output of the event analysis process is no more an explicit description of the detected event (this would require a supervised learning), but only a measure of probability of that event, allowing to focus on the most rare ones (anomalies). A commonly used approach in this case is based on the clustering of the trajectories of the detected moving ob- jects; the obtained clusters are then used as a normality model for anomaly detection. For a survey on trajectory (and more gen- erally time series) clustering, see [16]. The work by Johnson and Hogg [17] was probably one of the first researches in this direc- tion, using vector quantization for the compact representation of trajectories and multilayer neural networks for the identification of common patterns. The same authors later published another work on the same topic [18], where the probability density func- tion of common patterns was approximated with a mixture of multivariate Gaussian densities. Another notable work on trajec- tory analysis has been done by Stauffer and Grimson [19], where 1051-8215/$25.00 © 2008 IEEE Authorized licensed use limited to: IEEE Xplore. Downloaded on December 12, 2008 at 08:04 from IEEE Xplore. Restrictions apply.
-
Upload
independent -
Category
Documents
-
view
0 -
download
0
Transcript of Trajectory-Based Anomalous Event Detection

1544 IEEE TRANSACTIONS ON CIRCUITS AND SYSTEMS FOR VIDEO TECHNOLOGY, VOL. 18, NO. 11, NOVEMBER 2008
Trajectory-Based Anomalous Event DetectionClaudio Piciarelli, Member, IEEE, Christian Micheloni, Member, IEEE, and Gian Luca Foresti, Senior Member, IEEE
Abstract—During the last years, the task of automatic event anal-ysis in video sequences has gained an increasing attention amongthe research community. The application domains are disparate,ranging from video surveillance to automatic video annotation forsport videos or TV shots. Whatever the application field, most ofthe works in event analysis are based on two main approaches: theformer based on explicit event recognition, focused on finding high-level, semantic interpretations of video sequences, and the latterbased on anomaly detection. This paper deals with the second ap-proach, where the final goal is not the explicit labeling of recognizedevents, but the detection of anomalous events differing from typ-ical patterns. In particular, the proposed work addresses anomalydetection by means of trajectory analysis, an approach with sev-eral application fields, most notably video surveillance and trafficmonitoring. The proposed approach is based on single-class sup-port vector machine (SVM) clustering, where the novelty detectionSVM capabilities are used for the identification of anomalous tra-jectories. Particular attention is given to trajectory classification inabsence of a priori information on the distribution of outliers. Ex-perimental results prove the validity of the proposed approach.
Index Terms—Anomaly detection, event analysis, support vectormachines (SVMs), trajectory clustering.
I. INTRODUCTION
I N the last years, several works have been proposed on eventanalysis. Partial surveys on this topic can be found in the
reviews by Buxton [1] and Hu et al. [2] in the field of videosurveillance. Even though many different approaches have beendeveloped, they can generally be classified in two categories,often referred to with the terms explicit event recognition andanomaly detection.
In the explicit event recognition approach, the system has anexplicit knowledge of the events that must be identified. Oncean event is detected, it can be properly labeled with a semanticdescription. The fundamental part of an explicit recognitionsystem is thus an a priori knowledge base, where all theinformation about the recognizable events is stored, and thesystem behaves as a “parser” matching the incoming data withpredefined templates found in the knowledge base. Explicitevent recognition has its primary strength in its expressiveness,because it allows the modeling of heterogeneous events by la-beling them with high-level semantic descriptions, thus giving areal interpretation of the analyzed scene. The main drawback ofthis approach is the need of a prior modeling for each possible
Manuscript received February 25, 2008; revised June 20, 2008. First pub-lished September 26, 2008; current version published October 29, 2008. Thiswork was supported in part by the Italian Ministry of University and ScientificResearch within the framework of the project “Ambient Intelligence: EventAnalysis, Sensor Reconfiguration and Multimodal Interfaces” (2007–2008).This paper was recommended by Associate Editor D. Schonfeld.
The authors are with the Department of Mathematics and Computer Science,University of Udine, Udine 33100, Italy (e-mail: [email protected]).
Digital Object Identifier 10.1109/TCSVT.2008.2005599
instance of any event of interest. In real-world scenarios withuncontrolled and uncooperative environments, this could implyan exponential growth of the number of models as the scenecomplexity increases. Because of the nature of the explicitevent recognition task, it is not surprising that most works onthis topic are based on stochastic parsers for the identificationof known patterns of atomic events, as in the works by Ivanovand Bobick [3], Minnen et al. [4] or Moore and Essa [5].Similar to a parser-based approach is the work of Vu et al. [6],even though in their case the language used to express complexevents is not a full grammar, but rather a set of subevents subjectto temporal and logical constraints. Other works are based onthe integration of prior knowledge and low-level data acquiredby video processing (change detection, object tracking, etc.)as in the works by Ayers and Shah [7] or Medioni et al. [8].Wada and Matsuyama proposed a work in which raw imagedata are directly used to infer behavior recognition, without in-termediate processing as object detection or tracking [9]. Otherworks use a priori defined knowledge base partially modeledusing machine learning techniques rather than being manuallydefined as in a stochastic grammar. Most of these works relyon the use of hidden Markov models for event recognition, asin the works by Oliver et al. [10], Galata et al. [11], Brand andKettnaker [12], and Bashir et al. [13]. Finally, other works arebased on more general stochastic models, such as Bayesiannetworks, as in Hongeng et al. [14] or Moënne-Loccoz et al.[15].
The other popular approach to event analysis is based onanomaly detection. In this case, the system does not require aprior knowledge base about the events that should be recog-nized. On the contrary, the event models are automatically builtby the system itself in an unsupervised way, as the data are ac-quired. The models have a probabilistic nature, in the sense thatthe system is able to detect the most frequent patterns of ac-tivity occurred in the scene; the output of the event analysisprocess is no more an explicit description of the detected event(this would require a supervised learning), but only a measure ofprobability of that event, allowing to focus on the most rare ones(anomalies). A commonly used approach in this case is basedon the clustering of the trajectories of the detected moving ob-jects; the obtained clusters are then used as a normality modelfor anomaly detection. For a survey on trajectory (and more gen-erally time series) clustering, see [16]. The work by Johnson andHogg [17] was probably one of the first researches in this direc-tion, using vector quantization for the compact representation oftrajectories and multilayer neural networks for the identificationof common patterns. The same authors later published anotherwork on the same topic [18], where the probability density func-tion of common patterns was approximated with a mixture ofmultivariate Gaussian densities. Another notable work on trajec-tory analysis has been done by Stauffer and Grimson [19], where
1051-8215/$25.00 © 2008 IEEE
Authorized licensed use limited to: IEEE Xplore. Downloaded on December 12, 2008 at 08:04 from IEEE Xplore. Restrictions apply.
PICIARELLI et al.: TRAJECTORY-BASED ANOMALOUS EVENT DETECTION 1545
vector-quantized trajectories are analyzed in terms of cooccur-rence matrices of vector prototypes. Makris and Ellis [20], [21]proposed a method for labeling the scene with topological in-formation, which is then used within a Bayesian approach todetect anomalous trajectories. Piciarelli and Foresti [22] pro-posed a trajectory clustering algorithm especially suited for on-line anomaly detection, which is a main issue in surveillancesystems. Other relevant works on trajectory analysis for eventdetection include the ones by Porikli [23], which is based oneigenvalue decomposition of affinity matrices in order to find thecorrect number of clusters and compute conformity scores foranomaly detection; Hu et al. [24] use a hierarchic clustering oftrajectories depending on spatial and temporal information; Louet al. [25] use dynamic clustering techniques for traffic anal-ysis; Morris and Hogg [26] analyze trajectories in order to de-tect interactions with known objects in the environment; Wanget al. [27] define an ad hoc trajectory similarity measure and anassociated clustering technique; and Dee and Hogg [28] detectanomalies using inexplicability scores, a measure of how mucha trajectory can be explained in terms of simple goals.
In this paper, we address the problem of trajectory analysisfor anomaly detection using support vector machines (SVMs).Although SVMs have been a widely used tool for classificationand clustering problems and can explicitly address the problemof anomaly (or novelty) detection [29], only few trajectory clus-tering papers rely on SVM, such as [30]. In a preliminary work,we proposed an anomalous trajectory detection technique basedon single-class SVM [31] and we faced the problem of choosingthe best training parameters for optimal clustering. The pro-posed solution, however, had a high computational complexity;in this work, we propose an alternative, faster technique forSVM training in presence of outliers. Moreover, we present fur-ther experimental results proving the validity of our approach.
This paper is structured as follows. In Section II, a short re-view of the SVM theory is given to clarify some concepts thatwill be recalled later in this paper. Section III discusses the pos-sible applications of SVM techniques to trajectory analysis, andsome preliminary results are given. Section IV addresses theproblem of tuning SVM in presence of an unknown number ofoutliers, which is a common scenario in practical applications.Finally, Section V gives some experimental results proving thevalidity of the proposed approach.
II. SUPPORT VECTOR MACHINES THEORY
SVMs are a set of classification and regression techniquesbased on the concepts of statistical learning theory and riskminimization, initially proposed by Vapnik et al. [32] and laterextended to the nonlinear case with the introduction of kernelmethods [33]. Single-class SVMs [29] are a particular type ofSVM well suited for anomaly detection tasks, because they con-sider the training data as elements drawn from a single proba-bility distribution, whose support has to be found while possiblydiscarding outliers. This approach can naturally be applied toanomalous trajectory detection: the detected trajectories are ini-tially transformed in fixed-dimension feature vectors; then thetraining data are clustered using a single-class SVM, thus de-tecting the hypervolume in the feature space containing all thenormal trajectories. Identifying anomalous trajectories is just a
matter of checking if a new trajectory falls outside the computedhypervolume. To better understand the remaining sections ofthis work, a brief description of the SVM theory is here given.For further details on SVMs, see [34] and [35].
The main idea at the basis of SVM theory arises from theapplication of statistical learning theory results to linear classi-fiers. Let us consider the case of two-class hyperplane classifiersin some dot product space
(1)
corresponding to the decision function
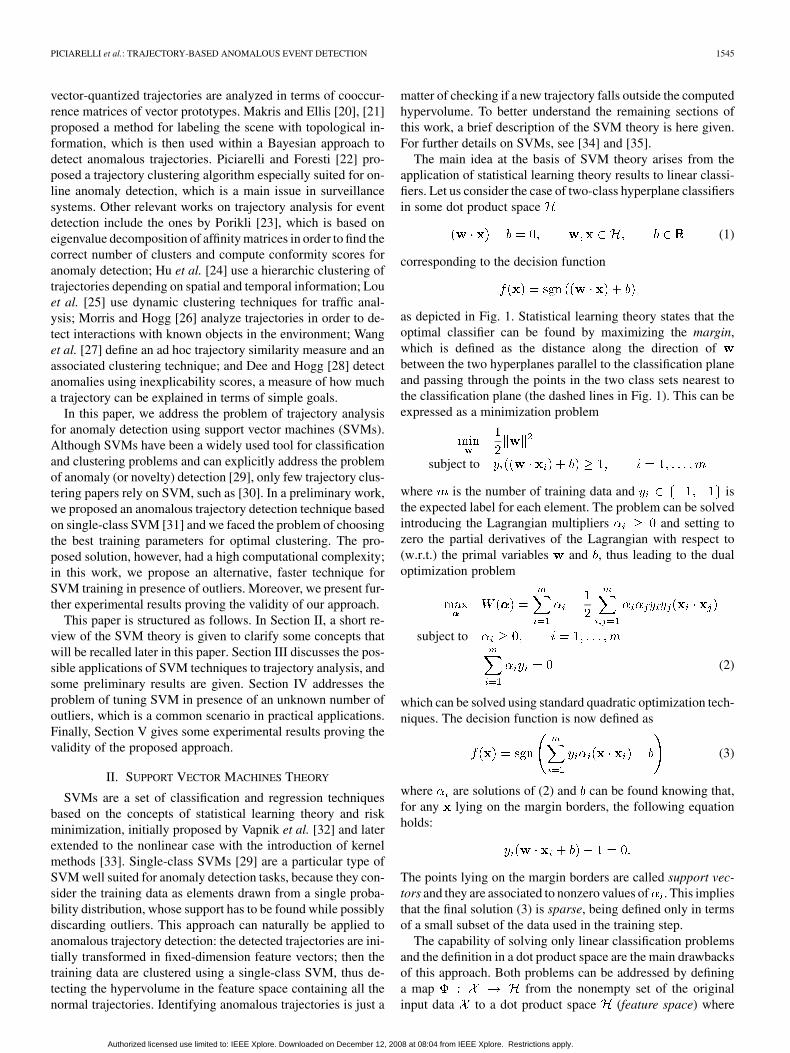
as depicted in Fig. 1. Statistical learning theory states that theoptimal classifier can be found by maximizing the margin,which is defined as the distance along the direction ofbetween the two hyperplanes parallel to the classification planeand passing through the points in the two class sets nearest tothe classification plane (the dashed lines in Fig. 1). This can beexpressed as a minimization problem
subject to
where is the number of training data and isthe expected label for each element. The problem can be solvedintroducing the Lagrangian multipliers and setting tozero the partial derivatives of the Lagrangian with respect to(w.r.t.) the primal variables and , thus leading to the dualoptimization problem
subject to
(2)
which can be solved using standard quadratic optimization tech-niques. The decision function is now defined as
(3)
where are solutions of (2) and can be found knowing that,for any lying on the margin borders, the following equationholds:
The points lying on the margin borders are called support vec-tors and they are associated to nonzero values of . This impliesthat the final solution (3) is sparse, being defined only in termsof a small subset of the data used in the training step.
The capability of solving only linear classification problemsand the definition in a dot product space are the main drawbacksof this approach. Both problems can be addressed by defininga map from the nonempty set of the originalinput data to a dot product space (feature space) where
Authorized licensed use limited to: IEEE Xplore. Downloaded on December 12, 2008 at 08:04 from IEEE Xplore. Restrictions apply.

1546 IEEE TRANSACTIONS ON CIRCUITS AND SYSTEMS FOR VIDEO TECHNOLOGY, VOL. 18, NO. 11, NOVEMBER 2008
Fig. 1. Optimal classification hyperplane separating two classes. The optimalclassification function is found by maximizing the distance between the twodashed hyperplanes in the direction of � (the margin).
the problem has a linear solution. The fundamental observa-tion is that, in the dual problem (2) and in the decision func-tion (3), the only operations performed in are dot products.The classifier can thus be trained without doing any explicitcomputation in if an explicit formula for dot products inis given. This formula is traditionally called kernel, defined as
. Using kernels, the decision function(3) becomes
(4)
where is a solution of the optimization problem
subject to
(5)
Similar techniques can also be applied to nonclassificationtasks such as anomaly detection. Given a set of unlabeled mea-sures generated according to an unknown probability distribu-tion , single-class SVMs are used to estimate the support of aparticular quantile of . The goal is to find an appropriate regionin the feature space containing most of the data drawn from
, possibly leaving outliers outside this region. In the SVMframework, this can be obtained by searching for a decision hy-perplane in the feature space , which maximizes its distancefrom the origin, while only a small fraction of data (the out-liers) falls between the hyperplane and the origin. This can beexpressed in terms of the constrained minimization problem
subject to (6)
where are training data in the data space, is the function mapping vectors in the fea-
ture space , and is the decision hyperplane
in . In the minimization process, outliers are linearly penal-ized by the slack variables , whose weight is controlled by theparameter . Introducing the Langrangian multipliers
, the minimization problem (6) can be reformulated in its dualform
subject to
(7)
Values can be found by solving the problem with standardquadratic programming methods; is given by
(8)
and, for any vector with , the following equationshold:
(9)
with for outliers and for support vectors lying onthe decision plane. The decision function in the data space isthus defined as
(10)
The solution is again sparse because for any lyingwithin the support region identified by the decision function:the majority of the training vectors do not contribute to the def-inition of the decision function. For the other vectors (supportvectors), if the vector lies on the decisionhyperplane, and if the vector is an outlier.
The parameter has an intuitive meaning because it tunesthe number of acceptable outliers. From (6), it can be seen that,when , the outliers’ penalization factors grow to infinity,thus leading to a hard margin solution, where no outliers areallowed at all. On the other hand, if , the constraints in(7) allow a single solution in which all the are saturated tothe maximum value , thus all the vectors are outliers. Morespecifically, it can be proven that is an upper bound for thefraction of outliers and a lower bound for the fraction of supportvectors (e.g., with , at least 10% of the training vectorswill be support vectors, and at most 10% will be outliers).
III. SVM TRAJECTORY CLUSTERING
In this section, we will explore the possibility of using SVMsfor event detection systems. The basic idea is to extract the tra-jectories of moving objects from video sequences, and clustertogether groups of trajectories sharing similar features whileleaving out the anomalous ones; testing a new trajectory foranomaly detection will thus be only a matter of comparing thenew trajectory with the cluster model. Because a single class
Authorized licensed use limited to: IEEE Xplore. Downloaded on December 12, 2008 at 08:04 from IEEE Xplore. Restrictions apply.

PICIARELLI et al.: TRAJECTORY-BASED ANOMALOUS EVENT DETECTION 1547
(the normal trajectories) is searched for and the aim is to findoutliers for that class, single-class SVMs seem to be well suitedfor this problem, due to their ability to detect a region in thedata space enclosing the training data while possibly excludingoutliers.
First, a proper input space must be defined. Trajectories aregenerally represented by variable-length sequences of 2-D co-ordinates, but the most commonly used kernels are defined onfixed-dimension spaces. A possible choice would be to definean ad hoc kernel working on sequences, and some efforts haverecently been done in this direction, e.g., with the definition ofstring kernels [36]; however, in this work, we have chosen towork with standard kernels. This implies that trajectories mustbe represented by fixed-dimension feature vectors, somethingwe obtained by trajectory subsampling (all the experiments inthis work have been performed by evenly subsampling trajec-tories into a list of 16 2-D coordinates). Trajectories are alsosmoothed with a running-average filter before subsampling inorder to remove the noise. Note that in this case we consideronly spatial features, but other features could also be included,as long as the resulting feature vector has a fixed size. As an ex-ample, one of the last experimental results in Section V includestemporal information.
Regarding the choice of an appropriate kernel, it has beenproven that all the traditionally used kernels (Gaussian, polyno-mial, and sigmoidal) have very similar performances given thatthe proper parameters are chosen [34]. Because we are workingwith spatial features, the Gaussian kernel seems a natural andintuitive choice, since it explicitly takes under consideration theEuclidean distance between feature vectors
The choice of heavily influences the final result because it rep-resents the “scale factor” at which the data should be clustered.However, the scale factor is more related to the type of data (e.g.,vehicle trajectories in a specific road, etc.) rather than on specificinstances of data sets: could be estimated only once for eachgiven scenario, without the need of reestimation when new datasets from the same scenario need to be processed. The choiceof the SVM parameter is more critical, because it depends onthe specific data set and thus cannot be estimated a priori. InSection IV, we propose a method to avoid an explicit choice of
by automatically identifying the outliers in the training data.
A. Preliminary Tests
We will now present some preliminary experimental resultson trajectory clustering with SVMs. The first test is based onlabeled data sets, where training trajectories are grouped inseveral known clusters. Multiclass SVMs are trained usingsome training sets, and their generalization capabilities areevaluated on the corresponding test sets. Being a supervisedlearning problem, this classification approach cannot be di-rectly applied to anomaly detection, and it has mainly beenperformed to confirm the validity of the choices described inthe this section about trajectory representation and choice ofkernel. If the test succeeds in separating different trajectories
TABLE IEXPERIMENTAL RESULTS WITH SUPERVISED SVM CLASSIFICATION
in different clusters, this implies that linear separability of thedata in the feature space is possible. This is not obvious,because depends both on the initial feature space and on thekernel used; a success in this test does not imply good resultsin the final proposed method, but a failure would be a strongindicator that the choices described in the previous sectioncould not lead to good results, whatever SVM technique isused. Tests have been done with increasing number of classes,ranging from a minimum of 2 to a maximum of 10. For eachcase, 50 different training and test sets have been randomlygenerated, each one with 100 trajectories in each class, for atotal of 900 data sets. Each training set has been used for thetraining phase of a multiclass SVM with a Gaussian kernel
, whose performances have been measured on thecorresponding test set. Results are shown in Table I, reportingthe total number of misclassifications in each run of 50 tests.The good results (with a worst case of 0.04% of classificationerrors) confirm that the combination of a Gaussian kernel withsubsampling-based spatial trajectory representation can be agood choice for trajectory analysis with SVMs.
We will now give some results on unsupervised clusteringwith single-class SVMs. Unlike in the previous experiment, thistime no clustering labels will be available. The SVM will beused to identify the region in the feature space containing allthe trajectories in the training sets, and then it will be usedto evaluate if anomalous trajectories in the test sets fall out-side this region. Because the tuning of the parameter , strictlycorrelated to the number of outliers, will be discussed only inSection IV, here it will be assumed that no outliers are presentin the training sets. Data sets have been again randomly gen-erated with increasing numbers of trajectory clusters, rangingfrom 1 to 10, each one containing 100 trajectories and repre-senting the normal data; each test set also contains ten anoma-lous trajectories. The results are given in Table II in terms oftrue positives (correctly detected anomalous trajectories) andfalse positives (normal trajectories misdetected as anomalies).The number of false positives is stable in all the tests, whilethe true positives slowly decrease with the increasing number ofclusters, because it becomes more and more difficult to detecta potentially anomalous trajectory among many different typesof normal ones. In any case, detections results seem promising,especially with few clusters in the scene.
IV. OUTLIER DETECTION
The major problem in trajectory clustering with single-classSVMs lies in the choice of the parameter . This parameter is
Authorized licensed use limited to: IEEE Xplore. Downloaded on December 12, 2008 at 08:04 from IEEE Xplore. Restrictions apply.

1548 IEEE TRANSACTIONS ON CIRCUITS AND SYSTEMS FOR VIDEO TECHNOLOGY, VOL. 18, NO. 11, NOVEMBER 2008
TABLE IIEXPERIMENTAL RESULTS WITH UNSUPERVISED SVM CLUSTERING
directly linked to the number of outliers in the training data, be-cause it is an upper bound for the fraction of outliers and a lowerbound for the fraction of support vectors. For example, if it isknown that 10% of the training data will be outliers, this wouldimply that must necessarily be greater than 0.1. However, inpractical trajectory clustering applications, there generally is noprior knowledge on the amount of outliers, and thus no boundscan be given.
Because an arbitrary choice of would lead to suboptimalresults, this parameter should be properly estimated. There issome literature on the estimation of SVM parameters [37], butthese works are generally based on cross validation or similartechniques that search the parameter space for a configurationthat minimizes the generalization error. This approach can beused in supervised learning problems, where labeled trainingdata are available for validation, but cannot be directly appliedto unsupervised, single-class clustering techniques. In this sec-tion, we describe an approach to single-class SVM tuning notrelying on labeled data; note that labeled data will actually beused for performance evaluation, but they are not involved inthe algorithm itself. The proposed method will entirely avoidthe problem of estimating a proper value for by automaticallydetecting outliers before applying SVM clustering techniques.
In a preliminary work, we already proposed a technique foroptimal estimation [31], but it is affected by strong compu-tational requirements because, for each classification problem,
SVMs must be trained, with proportionally increasing withthe required precision of the system. In this paper, we propose analternative and more efficient approach requiring only a singleSVM training by avoiding an explicit computation of . Themain idea is that the outliers are by definition few in number andwith an underlying distribution different from the normal data.We thus hypothesize that outliers can be detected by observingthe shrink of the hypervolume enclosing all the normal data aswe change the training conditions, for example, by varying thevalue of ranging from 0 to 1 (as we did in our previous work)or directly by removing from the training set the support vec-tors defining the boundaries of the classification function (theapproach used in this paper). More precisely, given a supportregion initially forced to include all the data, its hypervolume inthe feature space would shrink rapidly when removing real out-liers, while it would shrink slowly when removing normal data,as shown in the 2-D toy example of Fig. 2. The detection of the
Fig. 2. Support regions found by training a single-class SVM with differentvalues of � . The largest region is obtained with � � �� ; the regions shrinkas � approaches to 1.
Fig. 3. Training data lie on the surface of an hypersphere in � when usingnormalized kernels. The classification hyperplane intersect the hypersphere thusdefining an hyperspherical cap containing the majority of the data, while outliers(e.g., the element ��� �) lie outside the cap.
point of change in shrinking speed can thus lead to an optimalsupport region discarding only real outliers. The support regionvolume, however, cannot be easily computed in the data space
, and thus we are forced to perform the computations in thefeature space . Recall that could be extremely complex oreven unknown, but there is an easy way to compute dot productsin by means of kernels.
From now on, we will suppose to work with a normalizedkernel; this is a kernel such that . Notethat the Gaussian kernel chosen in the previous section is alwaysnormalized, because
Moreover, any other kernel has anormalized version defined as
Authorized licensed use limited to: IEEE Xplore. Downloaded on December 12, 2008 at 08:04 from IEEE Xplore. Restrictions apply.
PICIARELLI et al.: TRAJECTORY-BASED ANOMALOUS EVENT DETECTION 1549
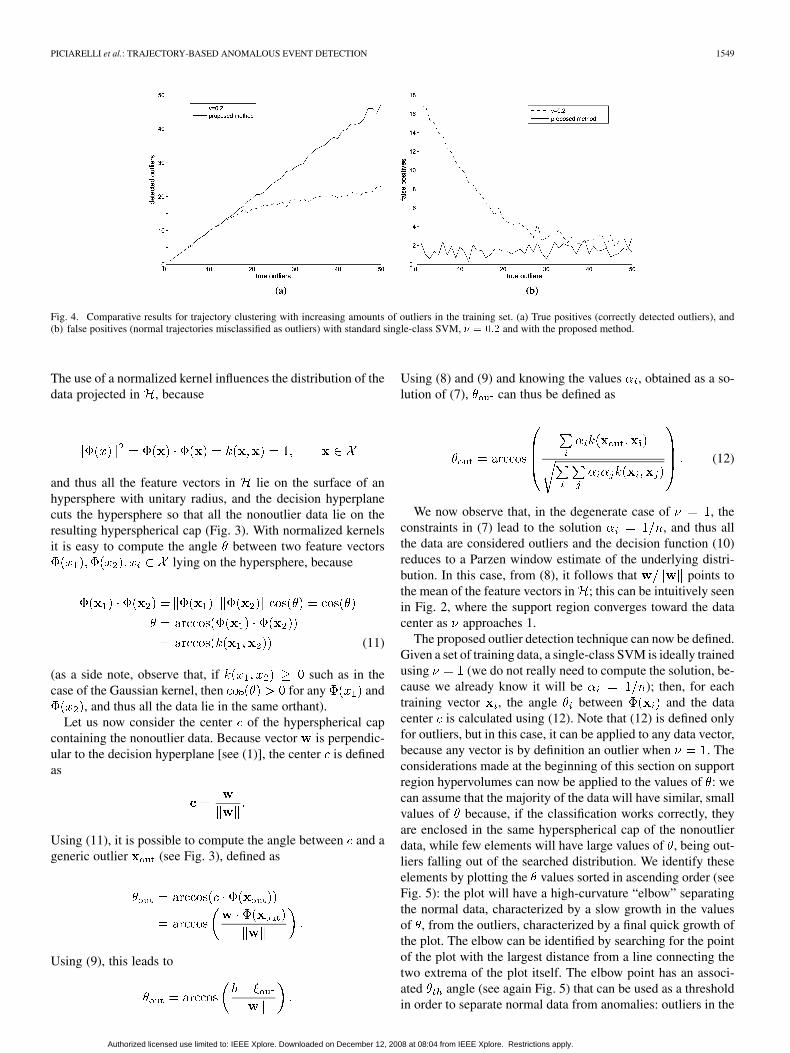
Fig. 4. Comparative results for trajectory clustering with increasing amounts of outliers in the training set. (a) True positives (correctly detected outliers), and(b) false positives (normal trajectories misclassified as outliers) with standard single-class SVM, � � ��� and with the proposed method.
The use of a normalized kernel influences the distribution of thedata projected in , because
and thus all the feature vectors in lie on the surface of anhypersphere with unitary radius, and the decision hyperplanecuts the hypersphere so that all the nonoutlier data lie on theresulting hyperspherical cap (Fig. 3). With normalized kernelsit is easy to compute the angle between two feature vectors
lying on the hypersphere, because
(11)
(as a side note, observe that, if such as in thecase of the Gaussian kernel, then for any and
, and thus all the data lie in the same orthant).Let us now consider the center of the hyperspherical cap
containing the nonoutlier data. Because vector is perpendic-ular to the decision hyperplane [see (1)], the center is definedas
Using (11), it is possible to compute the angle between and ageneric outlier (see Fig. 3), defined as
Using (9), this leads to
Using (8) and (9) and knowing the values , obtained as a so-lution of (7), can thus be defined as
(12)
We now observe that, in the degenerate case of , theconstraints in (7) lead to the solution , and thus allthe data are considered outliers and the decision function (10)reduces to a Parzen window estimate of the underlying distri-bution. In this case, from (8), it follows that points tothe mean of the feature vectors in ; this can be intuitively seenin Fig. 2, where the support region converges toward the datacenter as approaches 1.
The proposed outlier detection technique can now be defined.Given a set of training data, a single-class SVM is ideally trainedusing (we do not really need to compute the solution, be-cause we already know it will be ); then, for eachtraining vector , the angle between and the datacenter is calculated using (12). Note that (12) is defined onlyfor outliers, but in this case, it can be applied to any data vector,because any vector is by definition an outlier when . Theconsiderations made at the beginning of this section on supportregion hypervolumes can now be applied to the values of : wecan assume that the majority of the data will have similar, smallvalues of because, if the classification works correctly, theyare enclosed in the same hyperspherical cap of the nonoutlierdata, while few elements will have large values of , being out-liers falling out of the searched distribution. We identify theseelements by plotting the values sorted in ascending order (seeFig. 5): the plot will have a high-curvature “elbow” separatingthe normal data, characterized by a slow growth in the valuesof , from the outliers, characterized by a final quick growth ofthe plot. The elbow can be identified by searching for the pointof the plot with the largest distance from a line connecting thetwo extrema of the plot itself. The elbow point has an associ-ated angle (see again Fig. 5) that can be used as a thresholdin order to separate normal data from anomalies: outliers in the
Authorized licensed use limited to: IEEE Xplore. Downloaded on December 12, 2008 at 08:04 from IEEE Xplore. Restrictions apply.
1550 IEEE TRANSACTIONS ON CIRCUITS AND SYSTEMS FOR VIDEO TECHNOLOGY, VOL. 18, NO. 11, NOVEMBER 2008
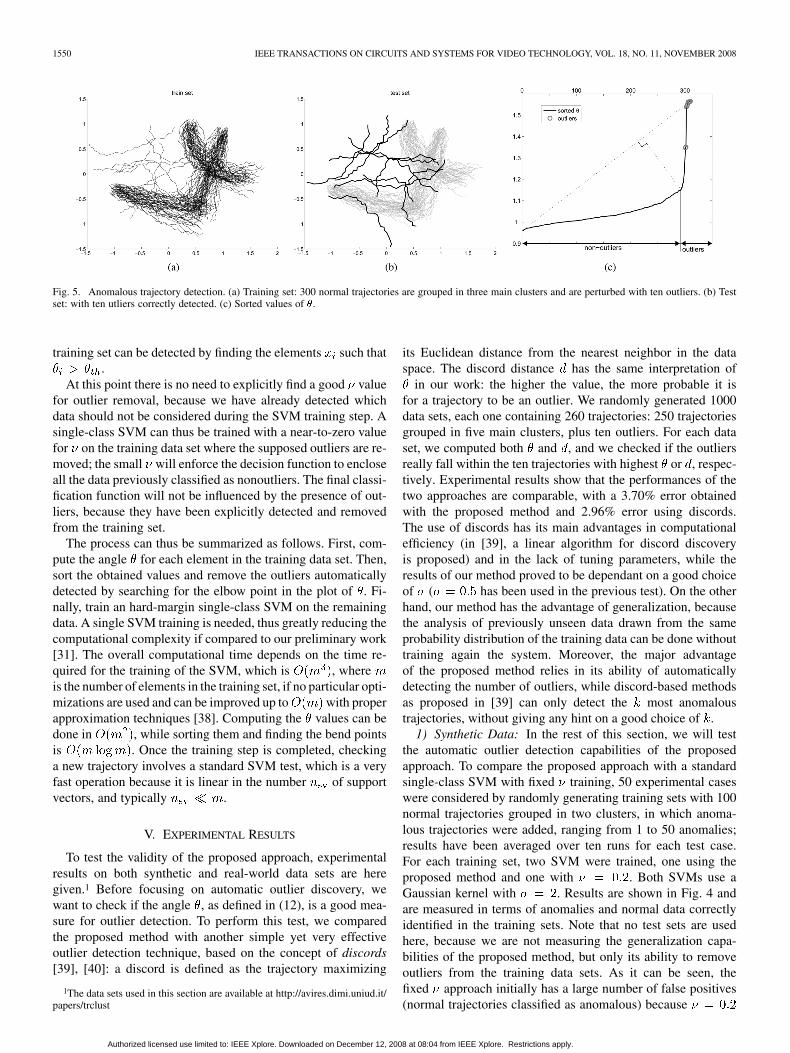
Fig. 5. Anomalous trajectory detection. (a) Training set: 300 normal trajectories are grouped in three main clusters and are perturbed with ten outliers. (b) Testset: with ten utliers correctly detected. (c) Sorted values of �.
training set can be detected by finding the elements such that.
At this point there is no need to explicitly find a good valuefor outlier removal, because we have already detected whichdata should not be considered during the SVM training step. Asingle-class SVM can thus be trained with a near-to-zero valuefor on the training data set where the supposed outliers are re-moved; the small will enforce the decision function to encloseall the data previously classified as nonoutliers. The final classi-fication function will not be influenced by the presence of out-liers, because they have been explicitly detected and removedfrom the training set.
The process can thus be summarized as follows. First, com-pute the angle for each element in the training data set. Then,sort the obtained values and remove the outliers automaticallydetected by searching for the elbow point in the plot of . Fi-nally, train an hard-margin single-class SVM on the remainingdata. A single SVM training is needed, thus greatly reducing thecomputational complexity if compared to our preliminary work[31]. The overall computational time depends on the time re-quired for the training of the SVM, which is , whereis the number of elements in the training set, if no particular opti-mizations are used and can be improved up to with properapproximation techniques [38]. Computing the values can bedone in , while sorting them and finding the bend pointsis . Once the training step is completed, checkinga new trajectory involves a standard SVM test, which is a veryfast operation because it is linear in the number of supportvectors, and typically .
V. EXPERIMENTAL RESULTS
To test the validity of the proposed approach, experimentalresults on both synthetic and real-world data sets are heregiven.1 Before focusing on automatic outlier discovery, wewant to check if the angle , as defined in (12), is a good mea-sure for outlier detection. To perform this test, we comparedthe proposed method with another simple yet very effectiveoutlier detection technique, based on the concept of discords[39], [40]: a discord is defined as the trajectory maximizing
1The data sets used in this section are available at http://avires.dimi.uniud.it/papers/trclust
its Euclidean distance from the nearest neighbor in the dataspace. The discord distance has the same interpretation of
in our work: the higher the value, the more probable it isfor a trajectory to be an outlier. We randomly generated 1000data sets, each one containing 260 trajectories: 250 trajectoriesgrouped in five main clusters, plus ten outliers. For each dataset, we computed both and , and we checked if the outliersreally fall within the ten trajectories with highest or , respec-tively. Experimental results show that the performances of thetwo approaches are comparable, with a 3.70% error obtainedwith the proposed method and 2.96% error using discords.The use of discords has its main advantages in computationalefficiency (in [39], a linear algorithm for discord discoveryis proposed) and in the lack of tuning parameters, while theresults of our method proved to be dependant on a good choiceof ( has been used in the previous test). On the otherhand, our method has the advantage of generalization, becausethe analysis of previously unseen data drawn from the sameprobability distribution of the training data can be done withouttraining again the system. Moreover, the major advantageof the proposed method relies in its ability of automaticallydetecting the number of outliers, while discord-based methodsas proposed in [39] can only detect the most anomaloustrajectories, without giving any hint on a good choice of .
1) Synthetic Data: In the rest of this section, we will testthe automatic outlier detection capabilities of the proposedapproach. To compare the proposed approach with a standardsingle-class SVM with fixed training, 50 experimental caseswere considered by randomly generating training sets with 100normal trajectories grouped in two clusters, in which anoma-lous trajectories were added, ranging from 1 to 50 anomalies;results have been averaged over ten runs for each test case.For each training set, two SVM were trained, one using theproposed method and one with . Both SVMs use aGaussian kernel with . Results are shown in Fig. 4 andare measured in terms of anomalies and normal data correctlyidentified in the training sets. Note that no test sets are usedhere, because we are not measuring the generalization capa-bilities of the proposed method, but only its ability to removeoutliers from the training data sets. As it can be seen, thefixed approach initially has a large number of false positives(normal trajectories classified as anomalous) because
Authorized licensed use limited to: IEEE Xplore. Downloaded on December 12, 2008 at 08:04 from IEEE Xplore. Restrictions apply.

PICIARELLI et al.: TRAJECTORY-BASED ANOMALOUS EVENT DETECTION 1551
TABLE IIIFALSE POSITIVES RESULTS FOR THE PROPOSED METHOD, EXPRESSED IN TERMS OF NORMAL TRAJECTORIES MISCLASSIFIED AS ANOMALIES
OVER THE TOTAL AMOUNT OF NORMAL TRAJECTORIES IN EACH DATA SET. RESULTS HAVE BEEN AVERAGED OVER TEN RUNS
TABLE IVTRUE POSITIVES RESULTS FOR THE PROPOSED METHOD, EXPRESSED IN TERMS OF ANOMALOUS TRAJECTORIES CORRECTLY CLASSIFIED AS OUTLIERS
OVER THE TOTAL AMOUNT OF ANOMALOUS TRAJECTORIES IN EACH DATA SET. RESULTS HAVE BEEN AVERAGED OVER TEN RUNS
is an overestimated choice for a small amount of outliers. Ifwe increase the number of real outliers, we face the oppositeproblem, with low true positives rates. On the other hand, theproposed approach always has a good true positives detectionrate (more than 90%) with a negligible false positive rate.
Previous results show how the proposed method can handleoutliers in the training data better than the naive approach, how-ever they do not prove that the system has good generalizationperformances when classifying previously unseen patterns. Wethus considered 100 different experimental cases, each one witha different number of groups of 100 normal trajectories (rangingfrom 1 to 10) and outliers (from 1 to 10). For each test, ten dif-ferent training/test sets were created, for a total of 2000 datasets. Single-class SVMs have been trained using the proposedmethod on the training sets and the results were measured onthe test sets (for an example, see Fig. 5). Note that outliers inthe test sets are drawn from the same distribution used for out-liers in the corresponding training sets, in order to ease the de-tection of anomalous training patterns being included in the nor-mality class. Tables III and IV, respectively, show the general-ization results of the proposed approach in terms of false posi-tives and true positives. As it can be seen, the true positives de-tection always gives good results, with an average of 92% of cor-rect detections. Both true positives and false positives results donot seem to be noticeably influenced by the increasing numberof outliers, while there is a slight performance degradation intrue positive detection when increasing the number of groups ofnormal trajectories.
Because the last experiment did not show any appreciablevariation in the results with low numbers of outliers (from 1 to
Fig. 6. True positives results with high amounts of outliers both in the trainingand in the test set and with 300 normal trajectories grouped in three clusters.
10 outliers in each training/test set), another test has been per-formed to measure the robustness of the proposed method inpresence of large amounts of outliers. We considered the caseof three clusters of normal data, each one containing 100 trajec-tories, where an increasing number of outliers has been added,ranging from 1 to 300 (in the last case, the data sets thus contain50% outliers). Fig. 6 shows the plot of the true positives detectedby the proposed approach; as can be seen, the system has a hightrue positives detection rate even in presence of large amountsof outliers. The maximum number of detected false positiveswas 2.
2) Real-World Data: The previously described experimentalresults were obtained on synthetic data to ease the evaluationof the algorithm performances. We now conclude this section
Authorized licensed use limited to: IEEE Xplore. Downloaded on December 12, 2008 at 08:04 from IEEE Xplore. Restrictions apply.

1552 IEEE TRANSACTIONS ON CIRCUITS AND SYSTEMS FOR VIDEO TECHNOLOGY, VOL. 18, NO. 11, NOVEMBER 2008
Fig. 7. Test results on publicly available data sets. The black thick trajectories are outliers. (a) Data set from [41]. (b) Data set from [42].
Fig. 8. Proposed method applied to real-world data. (a) Top view of an urban road. (b) Normal trajectories. (c) Anomalous trajectories detected in the test set(bold lines: the U-turn trajectories added to the test set).
with some examples of applications to real-world data, eventhough in this case there is no easy way to collect ground truthinformation and thus it is not possible to give objective perfor-mance measurements. We considered the case of an urban road,monitored by a static color camera [Fig. 8(a)]. The acquiredvideo data consist in a 51-min-long sequence at 320 240resolution, during which 1430 vehicles were detected by meansof multi-Gaussian background-subtraction techniques as in[19] and tracked using a combination of Kalman-based andCamShift trackers. We simulated the presence of two forbiddenU-turns obtained by merging the trajectories of vehicles movingin opposite directions. Moreover, the trackers are not error-free,and thus the acquired data are affected by noise, especially inthe form of broken trajectories due to lost objects. The acquiredtrajectories have been split in a train and a test set, each onecontaining 715 trajectories, and the proposed method has beenapplied using . Because the trajectory shapes are quitesimple, we have chosen to subsample each trajectory usingeight points, thus leading to feature vectors composed of 16elements (the and coordinates for each subsampled point).The results on the test set are shown in Fig. 8(b) and (c). Ascan be seen, the system has correctly recognized as anomaliesthe two U-turn trajectories (bold lines); moreover, the brokentrajectories generated by errors in the tracking system aremarked as anomalies as well, because they significantly differin shape from the normal data.
To test the system on other publicly available data sets, wealso applied the proposed outlier detection algorithm to the tra-jectory data sets used in [41] and [42]. The data set from [41]consists in 160 trajectories of moving persons acquired in an in-door environment. The 152 trajectories are grouped in four mainclusters, and the remaining eight are outliers. Fig. 7(a) showsthe results obtained by our system: all the eight anomalous tra-jectories have been correctly detected, although also two falsepositives are present. The data set used in [42] is made up of tra-jectories extracted from infrared surveillance videos. Fig. 7(b)shows how the 237 normal trajectories and the two outliers areall correctly classified. To compare results under the same con-ditions of [42], time has also been included in the feature vectordescribing each trajectory.
VI. CONCLUSION
In this paper, we proposed a technique for anomalous eventdetection by means of trajectory analysis. The trajectories aresubsampled to a fixed-dimension vector representation and clus-tered with a single-class SVM. The presence of outliers in thetraining data has led us to a novel technique for automatic de-tection of the outliers based on geometric considerations in theSVM feature space. The experimental results have proven thevalidity of the proposed approach.
Authorized licensed use limited to: IEEE Xplore. Downloaded on December 12, 2008 at 08:04 from IEEE Xplore. Restrictions apply.

PICIARELLI et al.: TRAJECTORY-BASED ANOMALOUS EVENT DETECTION 1553
REFERENCES
[1] H. Buxton, “Learning and understanding dynamic scene activity: Areview,” Image Vis. Comput., vol. 21, pp. 125–136, 2003.
[2] W. Hu, T. Tan, L. Wang, and S. Maybank, “A survey on visual surveil-lance of object motion and behaviors,” IEEE Trans. Syst. Man Cybern.C, Appl. Rev., vol. 34, no. 3, pp. 334–352, Aug. 2004.
[3] Y. Ivanov and A. Bobick, “Recognition of visual activities and interac-tions by stochastic parsing,” IEEE Trans. Pattern Anal. Mach. Intell.,vol. 22, no. 8, pp. 852–872, Aug. 2000.
[4] D. Minnen, I. Essa, and T. Starner, “Expectation grammars: Leveraginghigh-level expectations for activity recognition,” in Comput. Vis. Pat-tern Recognit., 2003, pp. II-626–II-632.
[5] D. Moore and I. Essa, “Recognizing multitasked activities from videousing stochastic context-free grammar,” in Proc. 18th Nat. Conf. Artif.Intell., 2002, pp. 770–776.
[6] V. Vu, F. Brémond, and M. Thonnat, “Automatic video interpretation:A novel algorithm for temporal scenario recognition,” in Proc. 8th Int.Joint Conf. Artif. Intell., Acapulco, Mexico, 2003, pp. 9–15.
[7] D. Ayers and M. Shah, “Monitoring human behavior from video takenin an office environment,” Image Vis. Comput., vol. 19, no. 2, pp.833–846, 2001.
[8] G. Medioni, I. Cohen, F. Brémond, S. Hongeng, and R. Nevatia, “Eventdetection and analysis from video streams,” IEEE Trans. Pattern Anal.Mach. Intell., vol. 23, no. 8, pp. 873–889, Aug. 2001.
[9] T. Wada and T. Matsuyama, “Multiobject behavior recognition byevent driven selective attention method,” IEEE Trans. Pattern Anal.Mach. Intell., vol. 22, no. 8, pp. 873–887, Aug. 2000.
[10] N. Oliver, B. Rosario, and A. Pentland, “A bayesian computer visionsystem for modeling human interactions,” IEEE Trans. Pattern Anal.Mach. Intell., vol. 22, no. 8, pp. 831–843, Aug. 2000.
[11] A. Galata, N. Johnson, and D. Hogg, “Learning variable length Markovmodels of behavior,” Comput. Vis. Image Understand., vol. 81, no. 3,pp. 398–413, 2001.
[12] M. Brand and V. Kettnaker, “Discovery and segmentation of activitiesin video,” IEEE Trans. Pattern Anal. Mach. Intell., vol. 22, no. 8, pp.844–851, Aug. 2000.
[13] F. Bashir, A. Khokhar, and D. Schonfeld, “Object trajectory-basedactivity classification and recognition using hidden Markov models,”IEEE Trans. Image Process., vol. 16, no. 7, pp. 1912–1919, Jul.2007.
[14] S. Hongeng, R. Nevatia, and F. Brémond, “Video based event recogni-tion: Activity representation and probabilistic methods,” Comput. Vis.Image Understand., vol. 96, pp. 129–162, 2004.
[15] N. Moenne-Loccoz, F. Brémond, and M. Thonnat, “RecurrentBayesian network for the recognition of human behaviors from video,”in Proc. Int. Conf. O Comput. Vis. Syst., Graz, Austria, 2003, pp.68–78.
[16] T. W. Liao, “Clustering of time series data—A survey,” PatternRecognit., vol. 38, no. 11, pp. 1857–1874, 2005.
[17] N. Johnson and D. Hogg, “Learning the distribution of object trajec-tories for event recognition,” Image Vis. Comput., vol. 14, no. 8, pp.609–615, 1996.
[18] N. Johnson and D. Hogg, “Representation and synthesis of behaviorusing Gaussian mixtures,” Image Vis. Comput., vol. 20, pp. 889–894,2002.
[19] C. Stauffer and W. Grimson, “Learning patterns of activity using real-time tracking,” IEEE Trans. Pattern Anal. Mach. Intell., vol. 22, no. 8,pp. 852–872, Aug. 2000.
[20] D. Makris and T. Ellis, “Path detection in video surveillance,” ImageVis. Comput., vol. 20, no. 12, pp. 895–903, 2002.
[21] D. Makris and T. Ellis, “Learning semantic scene models from ob-serving activity in visual surveillance,” IEEE Trans. Syst. Man Cybern.B, Cybern., vol. 35, no. 3, pp. 397–408, Jun. 2005.
[22] C. Piciarelli and G. Foresti, “On-line trajectory clustering for anoma-lous events detection,” Pattern Recognit. Lett., vol. 27, pp. 1835–1842,2006.
[23] F. Porikli, “Trajectory distance metric using hidden Markov modelbased representation,” in Proc. 8th Eur. Conf. Comput. Vis., PETSWorkshop, Prague, Czech Republic, 2004, pp. 9–16.
[24] W. Hu, X. Xiao, Z. Fu, D. Xie, T. Tan, and S. Maybank, “A system forlearning statistical motion patterns,” IEEE Trans. Pattern Anal. Mach.Intell., vol. 28, no. 9, pp. 1450–1464, Sep. 2006.
[25] J. Lou, Q. Liu, T. Tan, and W. Hu, “Semantic interpretation of ob-ject activities in a surveillance system,” in Proc. Int. Conf. PatternRecognit,, Quebec City, QC, Canada, 2002, pp. III:777–780.
[26] R. Morris and D. Hogg, “Statistical models of object interaction,” Int.J. Comput. Vis., vol. 37, no. 2, pp. 209–215, 2000.
[27] X. Wang, K. Tieu, and E. Grimson, “Learning semantic scene modelsby trajectory analysis,” in Proc. Eur. Conf. Comput. Vis., Graz, Austria,2006, pp. 110–123.
[28] H. M. Dee and D. C. Hogg, “On the feasibility of using a cognitivemodel to filter surveillance data,” in Proc. IEEE Int. Conf. Adv. VideoSignal Based Surveillance Syst., Como, Italy, 2005, pp. 34–39.
[29] B. Schölkopf, J. Platt, J. Shave-Taylor, A. Smola, and R. Williamson,“Estimating the support of a high-dimensional distribution,” MicrosoftResearch, Redmon, WA, Tech. Rep. TR 87, 1999.
[30] D. Lee and J. Lee, “Trajectory-based support vector multicategory clas-sifier,” in Proc. Int. Symp. Neural Netw., Chongquing, China, 2005, pp.857–862.
[31] C. Piciarelli and G. Foresti, “Anomalous trajectory detection using sup-port vector machines,” in Proc. IEEE Int. Conf. Adv. Video Signal-Based Surveillance, London, U.K., 2007, pp. 153–158.
[32] V. Vapnik and A. Lerner, “Pattern recognition using generalized por-trait method,” Autom. Remote Control, vol. 24, pp. 774–780, 1963.
[33] B. Boser, I. Guyon, and V. Vapnik, “A training algorithm for optimalmargin classifiers,” in Proc. 5th Annu. ACM Workshop Comput. Learn.Theory, 1992, pp. 144–152.
[34] B. Schölkopf and A. Smola, Learning With Kernels—Support VectorMachines, Regularization, Optimization, and Beyond. Cambridge,MA: MIT Press, 2002.
[35] K. Müller, S. Mika, G. Rätsch, K. Tsuda, and B. Schölkopf, “An in-troduction to kernel-based learning algorithms,” IEEE Trans. NeuralNetw., vol. 12, no. 2, pp. 181–201, Mar. 2001.
[36] J. Shave-Taylor and N. Cristianini, Kernel Methods for Pattern Anal-ysis. Cambridge, U.K.: Cambridge Univ. Press, 2004.
[37] O. B. O. Chapelle, V. Vapnik, and S. Maukherjee, “Choosing multipleparameters for support vector machines,” Mach. Learn., vol. 46, no.1–3, pp. 131–159, 2002.
[38] I. Tsang, J. Kwok, and P. Cheung, “Core vector machines: Fast SVMtraining on very large data sets,” J. Mach. Learn. Res., vol. 6, pp.363–392, 2005.
[39] D. Yankov, E. Keogh, and U. Rebbapragada, “Disk aware discord dis-covery: Finding unusual time series in terabyte sized datasets,” in Proc.IEEE Int. Conf. Data Mining, Omaha, NE, 2007, pp. 381–390.
[40] E. Keogh, J. Lin, and A. Fu, “Hot SAX: Efficiently finding the most un-usual time series subsequence,” in Proc. IEEE Int. Conf. Data Mining,Houston, TX, 2005, pp. 226–233.
[41] A. Naftel and S. Khalid, “Classifying spatiotemporal object trajecto-ries using unsupervised learning in the coefficient feature space,” Mul-timedia Syst., vol. 12, no. 3, pp. 227–238, 2006.
[42] D. Pokrajac, A. Lazarevic, and L. Latecki, “Incremental local outlierdetection for data streams,” in Proc. IEEE Symp. Comput. Intell. DataMining, Honolulu, HI, 2007, pp. 504–515.
Claudio Piciarelli (S’07–M’08) received the M.Sc.and Ph.D. degrees in computer science from Uni-versity of Udine, Udine, Italy, in 2003 and 2008,respectively.
Since 1999 he has been working on severalnational and European projects in collaboration withthe Artificial Vision and Real-time Lab, University ofUdine. He coauthored more than 20 works publishedin international journals and conferences and hasbeen a reviewer for several IEEE conferences andjournals. His main research interests include com-
puter vision, artificial intelligence, pattern recognition, and machine learning.He is currently mainly involved in the use of active vision in surveillancesystems and in behavior analysis for automatic detection of anomalous events.
Authorized licensed use limited to: IEEE Xplore. Downloaded on December 12, 2008 at 08:04 from IEEE Xplore. Restrictions apply.

1554 IEEE TRANSACTIONS ON CIRCUITS AND SYSTEMS FOR VIDEO TECHNOLOGY, VOL. 18, NO. 11, NOVEMBER 2008
Christian Micheloni (S’02–M’06) received theLaurea degree (cum laude) and the Ph.D. degreein computer science from the University of Udine,Udine, Italy, in 2002 and 2006, respectively.
Currently, he is an Assistant Professor at the Uni-versity of Udine. Since 2000, he has taken part inEuropean research being under contract for severalEuropean Projects. He has coauthored more than 40scientific works published in international journalsand refereed international conferences. He serves asa reviewer for several international journals and con-
ferences. His main interests involve active vision for understanding of the sceneby images acquired by moving cameras and neural networks for the classifica-tion and recognition of the objects moving within the scene. He is also interestedin pattern recognition techniques for both the automatic tuning of the camera pa-rameters for an improved image acquisition and for the detection of the faces.All these techniques are mainly developed and applied for video surveillancepurposes.
Dr. Micheloni is member of the International Association of Pattern Recog-nition (IAPR).
Gian Luca Foresti (S’93–M’95–SM’01) was bornin Savona, Italy, in 1965. He received the laurea de-gree (cum laude) in electronic engineering and thePh.D. in computer science from University of Genoa,Genoa, Italy, in 1990 and 1994, respectively.
In 1994, he was a visiting Professor at Universityof Trento, Italy. Since 2000, he has been Professorof Computer Science at the Department of Mathe-matics and Computer Science (DIMI), University ofUdine, Udine, Italy, where he is also Director of theArtificial Vision and Real-Time Systems (AVIRES)
Lab. His main interests involve computer vision and image processing, multi-sensor data and information fusion, and pattern recognition and neural networks.His proposed techniques found applications in the following fields: video-basedsurveillance systems, autonomous vehicle driving, road traffic control, humanbehavior understanding, and visual inspection. He is author or coauthor of morethan 200 papers published in international journals and refereed internationalconferences and he has contributed in several books in his area of interest.
Dr. Foresti was General Chairman and member of Program Committees atseveral conferences where he has been coorganizer of several special sessionson computer vision, data fusion, and pattern recognition. He has been FinanceChair of the 2005 IEEE Conference on Image Processing, Genoa, Italy. He hasbeen Guest Editor of a Special Issue of the IEEE PROCEEDINGS on “Video Com-munications, Processing and Understanding for Third Generation SurveillanceSystems” and of a Special Issue of the IEEE TRANSACTIONS ON SYSTEMS, MAN
AND CYBERNETICS on “Ambient Intelligence.” He serves as a reviewer for sev-eral international journals, and for the European Union in different researchprograms. He is the Italian delegate of the NATO-RTO Information SystemTechnology (IST) panel and member of the International Association of Pat-tern Recognition (IAPR).
Authorized licensed use limited to: IEEE Xplore. Downloaded on December 12, 2008 at 08:04 from IEEE Xplore. Restrictions apply.