A generic approach, employing information systems, for ...
403
University of Plymouth PEARL https://pearl.plymouth.ac.uk 04 University of Plymouth Research Theses 01 Research Theses Main Collection 2000 A generic approach, employing information systems, for introducing manufacturing information systems in SME 's Qurashi, Zahoor Ahmed http://hdl.handle.net/10026.1/2836 University of Plymouth All content in PEARL is protected by copyright law. Author manuscripts are made available in accordance with publisher policies. Please cite only the published version using the details provided on the item record or document. In the absence of an open licence (e.g. Creative Commons), permissions for further reuse of content should be sought from the publisher or author.
-
Upload
khangminh22 -
Category
Documents
-
view
3 -
download
0
Transcript of A generic approach, employing information systems, for ...
University of Plymouth
PEARL https://pearl.plymouth.ac.uk
04 University of Plymouth Research Theses 01 Research Theses Main Collection
2000
A generic approach, employing
information systems, for introducing
manufacturing information systems in
SME 's
Qurashi, Zahoor Ahmed
http://hdl.handle.net/10026.1/2836
University of Plymouth
All content in PEARL is protected by copyright law. Author manuscripts are made available in accordance with
publisher policies. Please cite only the published version using the details provided on the item record or
document. In the absence of an open licence (e.g. Creative Commons), permissions for further reuse of content
should be sought from the publisher or author.

I. r·
A generic approach, employing information systems, for introducing manufacturing information systems in SME 's
Zahoor Ahmed Qurashi BSc (Hons), MSc
A thesis submitted to the University of Plymouth in partial fulfillment of the degree of
DOCTOR OF PHILOSOPHY
Department of Mechanical and Marine Engineering
Faculty of Technology
University of Plymouth
February 2000
ii
Abstract
This thesis presents an approach which the small and medium size firms can use in
house to introduce manufacturing information systems. The approach developed is
generic and employs information system design and analysis techniques to guide
Small and Medium size Enterprises (SME's) from specification of their need, right
through to the implementation of an appropriate solution. Although there are
various tools and methodologies that are available for large organisations needs,
none are available for SME's. Therefore, the approach presented in this thesis
provides original and significant improvements on current practice.
The approach emphasises the importance of taking a company wide approach to
analyse systems throughout its various departments to establish bad practices and
system flaws which may impinge on the performance of the manufacturing
operations.
The research involved three independent stages. The first stage was the
identification of the problem which was realised from two sources: literature survey
and interviews with case study company managers. The second stage was the
development of a novel approach. The final stage included the validation of the
approach by implementing it in five different SMEs in the Devon and Cornwall
regiOn.
Through the use of this work, company's are encouraged to improve ownership and
commitment to the manufacturing information systems by fully involving the
relevant company personnel in identifying and resolving various problems. The
approach proposed also helps managers understand how the various processes work
in other areas of company, and can subsequently lead to improvements in other
departments.
iii
Chapter 1
1.1
1.2
1.3
1.4
1.5
1.6
Chapter 2
2.1
2.2
2.2.1
2.2.2
2.3
2.3.1
2.3.2
2.3.2.1
2.3.2.2
2.3.2.3
2.4
CONTENTS
Introduction .............................................................. Page 1
Overview ........................................................................... Page 1
Aims and scope of the thesis ............................................. Page 2
Contribution of the research .............................................. Page 4
Structure of the thesis ........................................................ Page 6
Publications ....................................................................... Page 10
Summary ............................................................................ Page 11
Research Methodology ............................................. Page 13
Introduction ....................................................................... Page 13
Research strategy ............................................................... Page 14
The case study approach .................................................... Page 14
Industrial partnership ......................................................... Page 15
The research plan ............................................................... Page 16
Literature survey ................................................................ Page 17
Case study companies ........................................................ Page 19
A brief descriptions of case study companies ................... Page 20
Information gathering ........................................................ Page 20
Data collection quality ....................................................... Page 21
Validation of the approach using five case study
companies .......................................................................... Page 22
2.5 Conclusions ....................................................................... Page 23
IV
Chapter 3
3.1
3.2
3.2.1
3.2.2
3.2.2.1
3.2.2.1.1
3.2.2.1.2
3.2.2.1.3
3.2.3
3.2.4
Characteristics of SMEs in Devon and Cornwall . Page 25
Overview ........................................................................... Page 25
Devon and Comwall .......................................................... Page 26
Statistical overview of Devon and Comwall ..................... Page 28
Spread of industrial sector ................................................. Page 28
Manufacturing ................................................................... Page 29
Long term prospects for manufacturing ............................ Page 31
Short term prospects for manufacturing ............................ Page 31
Investment prospects in manufacturing ............................. Page 32
Employment pattern .......................................................... Page 32
Problems faced by the businesses due to the region
being a periphery area ........................................................ Page 35
3.3 Characteristics of SME's in the Devon and Cornwall ...... Page 36
3.3.1 General characteristics ....................................................... Page 37
3.3.2 Technological characteristics ............................................ Page 39
3.3.3 Consultancy and small and medium sized enterprises ...... Page 40
3.4 Study of SME's in Devon and Cornwall,
the UK and the Europe ...................................................... Page 41
3.4.1 Problems faced by SME's in employing new
technology and the help given by the governments .......... Page 46
3.5 Assistance available to SME's in the Devon & Comwaii. ....... Page 48
3.5.1 Business Links ................................................................... Page 50
3.5.2 Single Regeneration Budget .............................................. Page 50
3.5.3 Training and Enterprise Council (TEC) ............................ Page 52
3.5.4 Teaching Company Schemes ............................................ Page 53
V
3.5.5
3.6
Chapter 4
4.1
4.2
4.2.1
4.2.2
4.2.3
4.2.4
4.3
4.4
4.5
4.6
4.7
4.8
4.9
4.10
Chapter 5
Technology Foresight Programme .................................... Page 54
Conclusions ....................................................................... Page 55
Manufacturing, systems, information, information
systems and manufacturing information systems ........ Page 57
Overview ........................................................................... Page 57
Introduction ....................................................................... Page 57
Efficiency in manufacturing .............................................. Page 58
Delivery dates and throughput... ........................................ Page 60
Inventory control ............................................................... Page 61
Future trends ...................................................................... Page 63
Manufacturing ................................................................... Page 64
Systems .............................................................................. Page 68
Manufacturing systems ...................................................... Page 70
Information ........................................................................ Page 76
Manufacturing information ................................................ Page 78
Information systems .......................................................... Page 80
Manufacturing information systems .................................. Page 82
Conclusions ....................................................................... Page 88
Review of existing information system and
CIM design methodologies ...................................... Page 90
5.1 Overview ........................................................................... Page 90
5.2 Introduction ....................................................................... Page 91
5.3 STRADIS ........................................................................... Page 91
VI
5.4
5.5
5.6
5.6.1
5.6.1.1
5.6.1.2
5.6.1.3
5.6.1.4
5.6.2
5.7
5.7.1
5.7.2
5.7.3
5.8
5.9
5.10
5.10.1
5.10.2
5.11
Chapter 6
SSADM ............................................................................. Page 93
Soft System Methodology (SSM) ..................................... Page 94
Data Flow Diagrams (DFD) .............................................. Page 97
Data flow elements ............................................................ Page 98
External entities ................................................................. Page 98
Processes ............................................................................ Page 98
Data stores ......................................................................... Page 98
Data flows .......................................................................... Page 99
DFD usage convention ...................................................... Page 99
IDEFO diagrams ................................................................. Page 101
Concepts of IDEF .............................................................. Page 101
Function block ................................................................... Page 103
Function decomposition .................................................... Page 104
SADT ................................................................................. Page 106
GRAI methodology ........................................................... Page 109
Modelling framework ........................................................ Page 112
CIM-OSA .......................................................................... Page 113
GIM ................................................................................... Page 115
Conclusions ....................................................................... Page 117
Requirement of an approach for introducing
manufacturing information systems in SMEs ....... Page 119
6.1 Overview ........................................................................... Page 119
6.2 Introduction ....................................................................... Page 120
6.3 Responses to questions ...................................................... Page 123
vii

6.4 Disadvantages of SME's in the Devon & Cornwall region ..... Page 143
6.4.1 Lack of know how of technology ...................................... Page 143
6.4.2 Lack of finances ................................................................. Page 143
6.4.3 Lack of understanding on how to implement
new technology .................................................................. Page 144
6.4.4 Lack of knowledge of available technology ...................... Page 145
6.4.5 Lack of skilled labour ........................................................ Page 145
6.4.6 Devon and Cornwall being a periphery region .................. Page 145
6.4.7 Lack of time and know how to investigate new
6.5
6.6
Chapter 7
7.1
7.2
7.3
7.3. I
7.3.1.1
7.3.1.2
7.3.1.3
7.3.1.4
7.3.2
7.3.2.1
technology .......................................................................... Page 146
Reasons for the implementation of new technology ......... Page 146
Conclusions ....................................................................... Page 148
A new generic approach to introducing
manufacturing information systems in SME 's .......... Page ISO
Overview ........................................................................... Page 150
Introduction ....................................................................... Page !51
Content of the new approach ............................................. Page !52
Phase l- Analysis ............................................................. Page 154
Project specification .......................................................... Page 155
Analysis of existing information systems .......................... Page 157
Problems assessment ......................................................... Page 169
Problems verification ......................................................... Page 171
Phase Two- Design of the new system ............................ Page 172
Specify and agree solutions ............................................... Page 173
viii
7.3.2.2
7.3.2.3
7.3.3
7.3.3.1
7.3.3.2
7.3.3.3
7.4
Chapter 8
8.1
8.2
8.3
8.3.1
8.3.2
8.3.3
8.3.4
8.3.5
8.4
Chapter 9
9.1
9.2
9.3
Researching into long-term solutions ................................ Page 180
Cost justification ................................................................ Page 188
Phase Three- System implementation .............................. Page 189
Devise and agree implementation plan .............................. Page 191
Phase implementation ........................................................ Page 193
System review .................................................................... Page 195
Conclusions ....................................................................... Page 197
Validation of the new approach .............................. Page 200
Overview ........................................................................... Page 200
Evaluation by seminar to practitioners .............................. Page 20 I
Validation by case study .................................................... Page 203
Company A ........................................................................ Page 203
Company B ........................................................................ Page 217
Company C ........................................................................ Page 221
Company D ........................................................................ Page 223
Company E ........................................................................ Page 226
Conclusions ....................................................................... Page 227
Conclusions ............................................................... Page 229
Introduction ....................................................................... Page 229
Devon and Cornwall scenario ........................................... Page 230
Information systems & manufacturing
information systems ........................................................... Page 231
9.4 Requirement for an approach ............................................ Page 232
ix
9.5 The new approach .............................................................. Page 233
9.6 Contribution of the work ................................................... Page 235
9.8 Future work ........................................................................ Page 236
References .................................................................................... Page 238
Appendix A Information systems and CIM design methodologies
Appendix B Overview of companies interviewed and diagrams for case
studies
Appendix C Publications
X

Table 3.1
Table 3.2
Table 4.1
Table 4.2
Table 6.1
Table 7.1
Table 7.2
Table 8.1
Table 8.2
Table 8.3
Table 8.4
Table 8.5
Table 8.6
Table 8.7
Table 8.8
Table 8.9
List of Tables
Business units in manufacturing ........................................ Page 30
Employment by industry: Devon and Cornwall,
1981-2001 ....................................................................... Page 34
Complicating factors affecting production management .. Page 65
The perspective of manufacturing information systems ... Page 84
Categorisation of SMEs ..................................................... Page 124
A sample entry in database of alternatives ........................ Page 183
A set of alternative systems ............................................... Page 187
Project specification for Company A ................................ Page 205
List of problems identified for Company A ...................... Page 212
List of problems and solutions to be resolved ................... Page 213
Matrix of alternatives ......................................................... Page 214
Cost justification using payback method ........................... Page 215
Evaluation of the approach by Company A ...................... Page 216
Evaluation of the approach by Company 8 ....................... Page 221
Evaluation of the approach by Company D ...................... Page 225
Evaluation of the approach by Company E ....................... Page 227
xi

List of Figures
Figure 4.1 The interrelationship of manufacturing control. ................ Page 67
Figure 4.2 Elements of control. ........................................................... Page 74
Figure 4.3 Production control ............................................................. Page 75
Figure 4.4 The control relationship between manufacturing
information systems and manufacturing systems .............. Page 83
Figure 5.1 DFD notation ..................................................................... Page 97
Figure 5.2 Basic building block of an IDEFO model... ....................... Page 103
Figure 5.3 IDEF function level ........................................................... Page I 05
Figure 5.4 SADT project Cycle .......................................................... Page 107
Figure 5.5 GRAI structured approach ................................................. Page 109
Figure 5.6 Structure of GRAI grid and GRAI net .............................. Page 110
Figure 5.7 GRAI conceptual model .................................................... Page 112
Figure 5.8 CIM-OSA modelling framework ...................................... Page 114
Figure 5.9 GIM modelling framework ................................................ Page 116
Figure 5.10 IMPACS modelling framework ........................................ Page 117
Figure 7.1 The model for new approach ............................................. Page 153
Figure 7.2 Phase I- Analysis ............................................................. Page !55
Figure 7.3 Example of Input I Output Diagram .................................. Page 164
Figure 7.4 Example of Information Flow Diagram-Version 1 ........... Page 167
Figure 7.5 Example of Information Flow Diagram-Version 2 ........... Page 168
Figure 7.6 Outline of stages in second phase ...................................... Page 172
Figure 7.7 Phase 3 - System implementation ..................................... Page 190
Figure 7.8 System implementation approaches .................................. Page 192 xii

Figure 8.1
Figure 8.2
Figure 8.3
Figure 8.4
Figure 8.5
Figure 8.6
Figure 8.7
Input/ Output diagram for Company A ............................. Page 206
Current planning system for Company A .......................... Page 207
Current production system for Company A ...................... Page 208
Current system for stores for Company A ......................... Page 209
Overview of order handling system for Company A ........ Page 210
Customer order processing system of Company B ........... Page 219
Revised customer order processing for Company B ......... Page 220
xiii

Acknowledgements
I dedicate this thesis to my parents, Maqsood-ur-Rahman and Bilqees Akhtar who
worked tirelessly to make sure that we had the best education. Even in adverse
financial circumstances they never put any demands on us to seek any work on the
expense of our education.
I also dedicate this work to my wife Shama Rahman and my children Abdus
Saboor, Ayman and Hana for their immense patience and support.
Thanks are also due to my brothers Mansoor, Ghayoor and my sisters Mahmooda
and Rukshanda for their silent support and encouragement.
I am very grateful to my supervisors Professor Roland Burns for his guidance and
supervision; and Martyn Polkinghome for his guidance, supervision and most
importantly his friendship throughout this research. I would also like to thank Kate
for checking grammar and spellings.
xiv

Author's declaration
At no time during the registration for the degree of Doctor of Philosophy has the
author been registered for any other university award.
XV

Chapter 1
Introduction
1.1 Overview
The changing global industrial scene is forcing companies to evolve at an
unprecedented rate (Vianen, 1993). The need to keep abreast of technological
developments to improve productivity, quality and range of products to maintain
performance is now of paramount importance (Williams, 1995). Despite the clear
evidence for a need to acquire technical skills, and investment in technology,
many companies are reluctant to move in this direction (Smith, 1995). This
reluctance can be attributed two main factors: (i) the extremely sizeable
investment required by a company, (ii) the total lack of experience with
technology. This is particularly true in the case of Small and Medium Enterprises
(SMEs), the DTI's classification for which is defined as those companies with
fewer than 250 employees. Research presented in this thesis demonstrates that
many SME's who wish to introduce new technology often do not know how to
begin because of the ignorance of technology and the lack of know how on
introducing new technology in their businesses. The use of outside consultancy
services is often unsuccessful (Staughton et al 1992) because of the high costs
involved in employing the consultants (Ibrahim and Goodwin, 1986). Therefore,
any inappropriate measures, and those that utilise resources without providing the
anticipated returns at the end, are an unnecessary waste of effort at a time when
such expenditure is potentially dangerous to the security of the company.
However, any measure that is capable of enhancing the competitive advantage of
SME's, without high costs, may therefore be considered to have huge potential
for a wide variety of SME based applications.
This introduction explains the scope of this thesis, outlining the aims and
objectives that the author has set out to achieve. It then goes on to explains the
typical make up and characteristics of SME's. A sketch of demographic,
geographical and industrial make up of Devon and Cornwall is drawn, this is
essential as all case study companies for research and validation of the new
approach are based in this region. Outline of the contribution to knowledge made
by this thesis is also discussed. Prior to the conclusion of this chapter a
description of the structure of this thesis is presented in the following section.
1.2 Aims and scope of the thesis
The aim of the research in this thesis is to help SME's introduce manufacturing
information systems in their businesses without, requiring input from outside
consultants. This is achieved by providing an approach which a company can use
in-house to identify their problems I bottlenecks, define solutions and then
implement the chosen solutions in their business. To meet these aims research
was carried out to:
• Define and understand the goals for manufacturing, systems, manufacturing
systems, information systems and manufacturing information systems.
• Compare Devon and Cornwall with the UK and the Europe and to identify
similarities and or differences which are particular to the manufacturing
companies in the Devon and Cornwall region.
2
• Review a few widely used Information Systems methodologies and to study
the basis of a systematic study of systems analysis and design approaches.
• Investigate existing Computer Integrated Manufacturing (CIM) design
methodologies and to establish their relevance to the SME's.
• Identify and establish the requirement for a methodology for introducing
manufacturing information systems in SME's.
• Specify and validate a novel generic approach for designing and
implementing manufacturing information systems SME's.
This research has demonstrated that, the management of most SME's do not fully
appreciate and understand the meanings of various terminology key to this study
including manufacturing, information systems and manufacturing systems etc.
Therefore, it was considered necessary to explain and define, from original
sources, the meanings of these terms.
The research also showed, that a typical SME frequently emerges from an
individual, working from his garage, soon growing to two people and then
rapidly growing to ten plus people. It was noted that although it was relatively
easy to divide, manage and co-ordinate work between three to four people.
However, as the numbers increased above five it became difficult to manage and
organise the work between the people. This was due to the fact that although a
company might be growing the systems do not grow with the company this often
results in very chaotic situations.

------------------ - - ---
As a result of the above findings a chapter is devoted to the study of systems and
methodologies for developing systems.
1.3 Contribution of the research
This thesis has made a significant contribution to the knowledge in this field by
developing a decision support tool which SME's can use in house to introduce
manufacturing information systems in their businesses. It presents an approach
which the SMEs can use in-house to introduce manufacturing systems and
computer based manufacturing systems instead of having to employ expensive
consultants. The author's extensive literature survey and case studies, in the
Devon and Cornwall region, have revealed that there is no such methodology that
is available for SME's anywhere. The use of case study implementations has
proven the success of the approach being presented.
The approach, by employing information systems, will enable companies to
introduce information systems and manufacturing information systems in to their
businesses if no systems already exist. It will guide companies on developing the
most appropriate solutions for those companies that can identify both the need
and resources required. The in-house approach which this approach encourages
will help to create more ownership and commitment from both the top
management and people at the implementation level, which is essential if
implementation is to create an operational environment capable of achieving
maximum benefits and effectiveness for the company concerned.
4
Many methodologies exist for designing a Computer Integrated Manufacturing
System (CIM) for large organisations. Further research has been published
concerning the need for SME's to adopt new technology (Gibson, 1995) for their
manufacturing systems to improve competitive edge. However, little research
and no methodology exist to address the delivery mechanism which may be used
to introduce manufacturing systems and computer based manufacturing systems.
The research has established a significant contribution knowledge in this field by:
• Providing a novel approach which SME's can use in-house to introduce
information systems and manufacturing information systems in their
businesses.
• Providing new, easy to use, information mapping diagrams.
• Undertaking a comparative study of Devon and Cornwall with the UK and
also with the rest of Europe to identify the special needs of SME's in the
Devon and Cornwall region.
• Providing a comprehensive review of information systems methodologies,
and design of CIM methodologies and by the identification of their
deficiencies for the SMEs application.
• Establishing the requirement for a need for an approach to assist SMEs in
introducing manufacturing information systems.
• Developing unique information mapping tools and qualitative decision making
technique that are easy to understand and use.
5

1.4 Structure of the thesis
The contents of the chapters in this thesis are described below. The order of these
chapters was mainly organised to facilitate the understanding of their contents.
Chapter 1: Introduction
This chapter provides an overview to manufacturing and the challenges faced by
SME's. It then presents the scope and aims of the thesis to develop a generic
approach to introduce manufacturing information systems in SME's. The main
characteristic of the approach is that it is simple and practical enough for
companies to use in-house. The chapter also outlines the significant contributions
to research which this thesis has proposed.
Chapter 2: Research methodology
This chapter describes the research methodology which has been used to
structure and manage the research. The methodology employed uses a literature
survey and case study approach to establish the requirements for the design and
validation of the new methodology.
Chapter 3: Characteristics of SME's in Devon and Cornwall
This chapter investigates the spread and frequency of SME's across various
industrial sectors in all the above regions. It also analysis the total employment
provided by the SME's in each of these regions to establish the importance of
SME manufacturing companies on the regions. The chapter then considers the
Information Technology (IT) infrastructure of the regions to establish the trends
6
on usage of IT within the regions and availability of information to and
capability of SMEs. The chapter also reviews various 'IT in manufacturing
policies' introduced by SME's together with help and encouragement provided
by the relevant local and national government bodies. The chapter concludes with
an assessment of the special needs of SME's in the Devon and Cornwall region.
Chapter 4: Manufacturing, systems, information, information systems
and manufacturing information systems
Chapter 4 addresses the definitions of systems, information, information systems,
manufacturing systems and manufacturing information systems. Consideration is
given to the aims and objectives of every manufacturing company, which are to
reduce wastage, Work In Progress (WIP), lead times and increase productivity,
quality and ultimately profitability of the company.
The chapter details routes to realising the above goals which can be achieved if a
systems approach is applied in a company. The chapter concludes by
emphasising the need for a structured approach to introduce company-wide
systems that can guide the companies in realising the above aims and objectives.
Chapter 5: Review of existing information systems and Computer
Integrated Manufacturing (CIM) design methodologies
Chapter 5 extends the descriptive phase of the research methodology, by
focusing on the existing information systems methodologies and CIM
methodologies which are available, and widely used. It was considered
7
necessary to summarise some of the common information system methodologies
as a close investigation of the current CIM methodologies reveals that most of
the CIM methodologies have stemmed, and evolved, from the information
systems approach and methodologies.
This chapter also describes the key common methodologies used for designing
computer integrated manufacturing systems. Although based on the original
information systems methodologies thinking the developers of these CIM
methodologies have adopted for applications within manufacturing
environments. However, almost all methodologies have been designed for
application to very large organisations and using highly complex models and
systems. Therefore, none of these methodologies can be applied to the SME
application. The chapter concludes by emphasising the need for a simpler
approach with specific needs for SME's in mind, as SME's often lack the
qualified personnel to apply complex methodologies. SME's also lack finances to
be able to hire outside consultants.
Chapter 6: Requirement of an approach for introducing
manufacturing systems for SME's.
Chapter 6 builds on the conclusions from chapters 3 and 5, integrating these
conclusions with the extensive research of SME's from the Devon and Cornwall
regions, recommendations are made of a set of requirements for an approach
capable of guiding and supporting the task of analysing, designing and
implementation of information systems and manufacturing information systems.
8
Chapter 7: A new generic approach to introducing manufacturing
information systems in SME's
A new generic approach is outlined in this chapter. The approach is divided into
three phases, analysis, solution development and implementation. This chapter
explains each of these phases in some detail and outlines the various steps
involved at each phase. The chapter also explains the original mapping tools that
have been developed with specific needs of the SMEs.
The particular structure of the approach has been developed for the ease of use to
the SMEs and without there being a need to employ outside consultants.
Chapter 8: Validation of the new approach
Chapter 8 establishes the validity of the approach by outlining the outcome and
results derived from the implementation of the approach in five case study
companies. All aspects of the approach were tested and proved valid in the case
studies. Whilst it would be extremely useful to test the full model within a
company environment to establish the credibility of the complete approach. This
is impracticable as the nature of SMEs is such that few will require full
implementation, choosing instead the section of the approach considered to be
relevant. This research has therefore inferred the validity of the entire model
based upon the validation of the components.
g.

Chapter 9: Conclusions
This chapter concludes the work by evaluating the progress made and suggesting
ways in which the work may be further developed in the future. This work has
provided a novel approach that SME manufacturing companies could use in
house to introduce information systems and manufacturing information systems
in their companies. This approach will provide companies with structured steps
to identifying the inherit problems of the company and then identifying solutions
to those problems, which may be either introduction of new technology or
redefining the existing structures and systems. And finally how to successfully
implement the solutions.
1.5 Publications
The papers based on the author's research have been presented and published in
the following conferences:
• Advanced Manufacturing Processes, Systems and Technologies (AMPST 96),
Bradford, UK, 1996.
• Advanced Manufacturing Technology, Twelfth National Conference on
Manufacturing Research, Bath, UK, 1996.
• Competitive Manufacturing, Twelfth Conference of the Irish Manufacturing
Committee, Cork, Republic of Ireland, 1995.
• Advances in Manufacturing Technology, Eleventh National Conference on
Manufacturing Research, Leicester, 1995.
• Applications of soft technologies for enhanced manufacture and management,
Technology Transfer series, Plymouth, 1996.
10
• Technology Transfer and Innovation, Teaching Company Directorate,
London, UK, 1997.
• New technology in SME's, Teaching Company Directorate, Belfast, Northern
Ireland, UK, 1995
Copies of each of the above mentioned papers are presented in Appendix C.
As well as the above publications altogether three courses of two days duration
were organised, with the University of Plymouth on the title" Introducing new
technology for small businesses", for companies in the Devon and Cornwall
regions. Also a seminars, of half a day duration, of the same title were organised,
jointly with the University of Plymouth, DTI and Business Links. The author
solely conducted all the courses and seminar, which were well attended, and
received a very warm and positive response, from the industrialist, towards his
methodology.
1.6 Summary
This chapter has sought to place the author's work in context and to define the
aims and scope of the research. The aim of the research is to develop a generic
approach which SME's can use in-house to introduce information systems and
manufacturing information systems. In doing so an overview of SME's and the
dynamic manufacturing environment has been briefly described. The
contribution of the research to knowledge has been stated and the structure of the
thesis has been described. To date no such approach exist which companies can
11

use in-house and which has addressed the particular needs of the Small and
Medium size companies.
In the following chapter, the author describes the research methodology which
was used to structure this thesis.
12
2.1 Introduction
Chapter 2
Research Methodology
This chapter outlines the research methodology adopted to develop a unique
approach to introduce information systems and manufacturing information
systems in SME's. SME's are defined by the European Commission to be any
company with less than 250 employee's and turnover of less than £20M. The
research methodology is multifaceted, and takes a comprehensive approach to
tackle this problem, while simultaneously remaining aware of the practical issues
involved.
The research took a triple-structured approach covering all aspects of the design
and practical functioning of the manufacturing information systems. The work
contained here, aims to have a practical dimension and orientation by the
analysing and resolving of relevant issues that concern business. This leads to
the development of methods that can be immediately integrated to fulfil their
requirements. A 'systems view' (Wilson, 1984) has been used to shape the
contours of these investigations. The development of the approach, which is
described in chapter 7, arose from interviews and observations of actual
companies. It was felt that this would lead to work that was more relevant to the
needs of practical life applications (Checkland, 1981 ). This can be seen as a
'Grounded Theory' approach (Giaser and Strauss, 1967) to research.
13
The primary research was conducted in the form of case studies of SME's in the
Devon and Cornwall region, in order to tailor the approach to fit any
requirements that the companies had. It was the adaptation of a rudimentary
prototype approach to genuine company applications, that provided the crucial
component when designing the final approach. This chapter then, describes the
primary research conducted, mainly in the form of case studies and then
describes the secondary research which took the form of a literature survey.
2.2 Research strategy
2.2.1 The case study approach.
It has been observed by many authorities, that the nature of operations research
has been divorced from reality to such an extent that it is an essentially artificial
exercise (Meredith et al 1989). Instead, much more emphasis has been exerted
upon the adoption of naturalistic paradigms (especially direct observation, case,
action and field studies) and existential (primary interpretative) paradigms.
Research carried out by Deising (1972), had determined the limitations of
quantitative analysis to defining relationships within an organisation.
Simultaneously, the study had found that quantitative analysis could not identify
the actual inner, or interpersonal transactions which bring them about.
Taking into consideration the findings mentioned above, the case studies formed
the backbone of the research into the design, testing and verification of the
methodology. The case study approach opened up opportunities to explore
specific factors in the implementation of new technology in the manufacturing
industry. In fact Rickwood et al (1987) noted that,
14

"the adoption of a case study approach provides opportunities for overcoming the restrictions of response imposed by the questionnaire in investigating the heterogeneity of procedures and their relationship with the context in which they are adopted."
The case study approach enhanced the research and the understanding of the
author, by giving insights into the various factors at work within the
manufacturing process. These would otherwise not have been identified. In
adopting the case study approach, Romano (1989) states that the researcher has
the opportunity to utilise a single- or multi-site case approach. He observes that a
multi-site study analysis provides further insight in to the research problem. In
addition, similar research conducted by Miles and Huberman (1985) found that,
"by comparing sites or cases one can establish the range of generality of findings or explanation and at the same time pin down the conditions under which that finding will occur. There is much potential for both greater explanatory power and greater generalizability than a single case study can deliver."
In response to this and similar research, this study refers to research conducted at
17 SME companies in the region of Devon and Cornwall and focuses on five
specifically, chosen to validate the salient points of the proposed novel technique.
2.2.2 Industrial partnership
A significant part of the research strategy, was to spend an appropriate length of
time within one company. This was undertaken in order to incorporate into the
approach, provisions for any organisational phenomena that was not observed in
the shorter periods in which the majority of case studies were spent.
One year was spent working on a joint research project between the case study
Company A and the University of Plymouth. Initially research was done to
IS

analyse the existing systems of the company and highlight the concerned areas.
In the second phase, appropriate research was completed, with the resources from
the University, and in collaboration with the staff of the company to identify
ways and means to eliminate bottlenecks and other relevant areas that were
hindering the production output. The final phase included the implementation of
new systems and technologies.
The experience gained at Company A laid the foundation for further research in
this area. The interaction between Company A, academia and close working
relationship with the staff of the company enabled the author to formulate an
awareness of a typical thinking process of a SME, typical production problems,
lack of awareness of new technology, and resistance to new ideas and
technology.
2.3 The research plan
The research for this thesis began with a survey of the literature available on the
regional trends in Devon and Cornwall and current approaches to manufacturing
systems methodology and information systems methodologies. This gave the
author an insight into the region and the key problems and issues facing it. In
addition, analysis of a survey conducted by the University of Plymouth Business
School (Eddy at el, 1996) into implementing new technology for competitive
advantage, led directly to the integration of this research with the trends and
problems of SME's in Devon and Cornwall. This was followed by visits to
seventeen companies in the region where information was gathered and the
16
rudiments of the methodology, formulated and tested. The authors findings were
presented and discussed in seminars for the DTI and Business Link and published
in several papers, see Appendix C. As a result courses were run for local SMEs
in Devon and Cornwall on behalf of the University of Plymouth. In addition,
over a year was spent in five companies where actual projects were undertaken to
ensure the mature development of the approach.
A new generic model was developed from the research undertaken, which sought
to guide SME manager's, from the stage of assessing the need to implement a
new system, to monitoring and auditing the performance of the new
manufacturing information systems. Validation of the model was undertaken as a
continuous process in case studies, and the industrial placement, as well as in
discussions with practitioners. The different parts of the research plan will be
briefly discussed below.
2.3.1 Literature survey
This was undertaken to gain an appreciation of the issues involved, in the
manufacturing industry and also in Devon and Cornwall. In addition to these
benefits, the literature survey also provided a theoretical background to the work
and reinforced the findings of the research.
The initial research undertaken, aimed to correlate the research that had already
been conducted in this field. To this end, books were consulted on areas as
diverse as 'Small Business Dynamics' (edited by C. Karlsson, B. Johannisson,
17

and D. Storey) and 'Information Systems for Managers' (by G. Reynolds). Then
different methodologies were researched in the fields of information systems and
manufacturing systems, to ascertain whether they contained anything that could
be applied to the small manufacturing business.
This research incorporated a large number of varying areas of expertise, of which
the primary titles are detailed below:
• Information System Methodologies • Flexibility
• Manufacturing System • Standards
Methodologies • Implementation Issues
• Tools and Techniques • Strategies within SME's
• Manufacturing Management • Organisations
• Information Technology • SME Culture
• Total Quality Management • Business Statistics
• Studies of SME's • Production Management
• South West Economical Research • Material Requirement Planning
• Human Factors (MRP)
• Computers Integrated Manufacturing • Manufacturing Resource Planning
• Stock Control Systems (MRP 11)
• Manufacturing Planning and • Information Systems
Scheduling Systems • Manufacturing Systems
The literature consulted showed that no work had been carried out on developing
systems manufacturing implementation methodologies aimed at helping SME's
18
in the region of Devon and Cornwall. In fact, no methodologies of this kind exist
and there was no evidence that one is currently being developed.
2.3.2 Case study companies
There appears to exist a consensus among the literature consulted, that SME's in
the region of Devon and Cornwalllag behind their competitors in both the
production output, and employment of technology and its use, both in the UK
and EU markets. During the course of the research the author visited seventeen
manufacturing SME's in the region and established the view that production
planning and scheduling were unorganised and employment of technology in
manufacturing in the region was relatively insubstantial. However, detailed study
had to be done to establish the reasoning behind this.
In order to fully understand the wider issues relating to the unorganised
production and lack of technology it was felt crucial to study all key departments
in a company rather than merely concentrating on the manufacturing department.
It was revealed, by analysis of the existing systems of case study companies, in
the initial research that in many cases it was not the lack of organisation, or
absence of technology within the production department, but some other factors
which resulted in delayed orders, poor quality and reduced output.
The study, therefore, included:
• Aims and objectives of the organisation
• History of the company
19

• Systems study of al\ departments
• Any formal methods and concept used in various departments i.e. Just in
Time (JIT), Total quality Management (TQM) etc.
• Qualifications of employees
• Quality control standards in production
• The use of technology in al\ departments
• Information storage and retrieval systems in all departments
• Desires to obtain professional standards e.g. ISO 9000 etc.
• Future plans and strategic thinking i.e. expansion, diversification etc.
2.3.2.1 A brief descriptions of case study companies.
During the first phase of the research, seventeen companies were visited from
the various manufacturing industrial sectors. The aim of this research was to
establish and identify general trends, and issues of concerns for SME's when
introducing new technology and systems into their respective organisation. A
brief description of seventeen case study companies is given in appendix B; a
detailed description of five of these companies is given in chapter 8, these
companies were used to validate the approach by carrying out a real project. Due
to confidentiality reasons the organisations cannot be identified and are simply
numbered from 1 to 17 .
2.3.2.2 Information gathering
The research information was gathered from the above companies, through a
series of semi-structured interviews. The interviews were conducted by the
20

author at the sites visited. In almost all companies the author questioned the
managing director, production manager as well as other senior managers. In
addition to this the author also spent a significant amount of time speaking to
supervisors and other workers on the shop floor.
A wide variety of questions were posed to the interviewees. The information
collected at these interviews and observations noted on the shop floor provided a
significant input to the development of the new approach.
A list of questions asked to managers and shop floor supervisors can be found in
the chapter 6. The responses to these questions and analyses are detailed in
chapter 6.
2.3.2.3 Data collection quality
Romano ( 1989) states, that the selection of data quality control methods for use
in a case study methodology should be based on practical usefulness and easy
implementation. In the case of the research detailed in this thesis, considerable
effort was made to ensure that the individuals interviewed in each company were
drawn from different backgrounds and different authority levels. Each case study
visit was undertaken using a standard set of issues and topics and the emerging
results of the work were regularly validated through discussions with the other
scholars in the field. These procedures gave the data collection a balanced
approach.
21
-----------------------------
2.4 Validation of the approach using five case study companies
Whilst the approach for introducing manufacturing systems in SME's was
developed from findings derived from this research. However, it was then
essential to validate this work through practical implementation.
To validate the approach the author undertook genuine projects in five of the
companies previously mentioned. The projects lasted from a maximum of one
year to minimum of six weeks. During these periods, the author was contributing
a minimum of 15 hours per week at the relevant company sites. Although parts of
the approach worked tremendously well in all companies, the author could not
verify full methodology life cycle in any one particular company. This was due to
the differing constraints in each of the case study companies, e.g. lack of time,
resources, internal politics etc.
Although it was not possible to verify the full life cycle of the approach, it proved
feasible to test, and then verify the validity of all the different phases in the
approach. The details of the projects, and practical results of the implementation
of the approach are listed, in detail, in chapter 8. It is considered unlikely that
100% of the approach for introducing information systems and manufacturing
information systems could be tested in its full cycle in any one SME environment
due to the size and nature of this classification of company. Any single company
is only ever likely to require a portion of the approach. However, in reality each
SME will require different portion to its neighbour.
22

Ultimately, the main method of evaluating the work will be the views of users
and others in the field. Since no approach had previously been developed to help
SME's introduce manufacturing information systems in their businesses, the
usefulness of a simple and yet thorough approach was self evident.
2.5 Conclusions
To produce a practical approach which would be useful to companies having to
deal with genuine situations, the research methodology took a very practical on
field-work approach, which sought to understand the problems of SME's from
the user's perspective, rather than being totally all academic based.
The approach adopted, opened up several issues e.g. i) that deficiency in
production, or poor quality is not always due to poor organisation in the
production department, but can often be attributed to other factors in the
company; ii) The absence of the implementation of new technology is not always
due to lack of investment, or resistance to the technology. It may however, be
due to the ignorance of the availability of this technology and lack of not
knowing how to introduce new technology. Therefore, the emphasis of this
research was placed on deriving an understanding of issue and then dealing with
them in turn, so that they could be integrated together to form a simple approach
with the potential to make an enormous impact on all SME's understanding these
sort of activities.
To this end, 17 case study companies were initially visited, followed by carrying
out actual projects in five companies. In the course of all the visits, discussions
23
were held with senior managers as well as supervisors and other workers on the
shop floor level.
In addition, findings of the research were regularly published, and courses and
seminars, in conjunction with the DTI and business links, were held for managers
from the Devon and Cornwall region.
The research has resulted in the development of a novel generic approach which
companies can use on-site to introduce new technology in their business, and
improve their systems to improve productivity, quality, reduce lead times and
minimise wastage. No such approach was discovered to exist during the period of
the research, and hence, this is believed to be an original approach, which has
wide applicability to SME's throughout the UK and Europe.
24

Chapter Three
Characteristics of SMEs in the Devon and Cornwall Region
3.1 Overview
This chapter sets the theme for the research presented in this theses. It identifies and
describes the characteristics of small businesses that must be considered when
developing an approach that SME's will be using to introduce Manufacturing
Information Systems in their environments. The research is primarily focused on
the characteristics of SME's in the Devon and Cornwall region. A certain additional
comparison is also made of SME's in the Devon and Cornwall region with those in
the UK and Europe.
The chapter reports the findings both from the literature search and the authors visits
to some 17 SME's in the region. The objective of these visits was to ascertain the
most obvious issues inhibiting change in SME' s. The detai I findings of the various
visits and conclusions made from it are detailed in chapter 6.
This chapter is divided into four main sections. The first section details the
circumstances of the Devon and Cornwall region. It specifies the spread of industrial
sectors, employment patterns and problems faced by businesses due to the region
being a periphery region of the UK .The second section describes the characteristics
of local SME's and is sub-divided into both general and technological
characteristics. The general characteristics address issues such as financial
25

resources, transportation problems and skills shortages. The technological
characteristics concentrate on the current use of technology, investigates various IT
in manufacturing policies, and the feasibility of adopting new technologies and
approaches to initiate and support business change. In the third section a general
comparison of SME manufacturing companies in the Devon and Cornwall region is
undertaken, with comparison to the SME's in the UK and Europe. This section
identifies the key differences between the region, the UK and Europe, and focuses
on the use of technology in each of the regions. The fourth section describes the help
available to SME' s in the region, describing both the help from the private sector,
and help available from the local and national government. Also considered is the
research assistance from the two universities and various colleges of further
education.
3.2 Devon and Cornwall
The counties of Devon and Cornwall represent a significant proportion of the South
West region of the UK. Tourism is one of the region's main industries, but the
outstanding beauty and variety of the area does not mask the fact that over the
centuries, the counties of Devon and Cornwall have also been a highly active
industrial area.
The people of Devon and Cornwall are resourceful, resilient, hard-working, flexible
and friendly. Throughout the history they have turned their hands to most things as
they sought to win a living from sea or soil- by fishing, ship building, or cargo
26

carrying; by farming quarrying, or mining and tradition remain extremely strong in
many areas.
They were and still are -explorers, traders, and inventors. They were and still are-
survivors. Whilst major industries have surged and disappeared through boom and
collapse, the two counties have seen them repeated to varying degrees throughout
the centuries as requirements have changed. Yet through it all, the counties have
adapted and survived (Hainden, 1991).
Today the industry of Devon and Cornwall is mainly in the form of small and '
medium sized firms (Gripaios, 1998). The counties have a variety of locally founded
businesses, along with a mixture of national and multi-national businesses that have
chosen to move or expand in Devon and Cornwall (Devon and Cornwall TEC,
1999).
There are approximately 35,800 businesses within Devon and Cornwall, of which,
90 % are small firms with fewer than 25 employees, 9% are medium sized
(employing 25-250) while large firms (employing 250+) account for less than 1% of
the total (Devon and Cornwall TEC, 1999).
27

3.2.1 Statistical overview of Devon and Cornwall
The combined population of Devon and Cornwall is just over 1.5 million. These
figures swell by 0.5 million over the summer months through tourism (Office of
National Statistics (ONS) mid year estimates 1997).
• Over half (51.6%) of the population is female (ONS mid year estimates 1997).
• Largest numbers of people working age are in the 25-34 and 35-49 age brackets
(ONS mid year estimates 1997).
• There are approximately 36000 business units, of which the vast majority are
small. This structure is very similar to that of the UK and has not changed
significantly over the period 1991-1995 (Devon and Cornwall TEC (DCTEC),
1998).
• Around 90% of 16-18 year olds are in full-time education or training providing
the basis for a world class workforce (Careers Service, DCTEC, 1998).
• The region had the second lowest crime rate in England and Wales in 1992, and
in the year to June 1994, recorded crimes in Devon and Cornwall fell by 8.4%
compared with the previous year (Regional Trends, 1994).
3.2.2 Spread of industrial sector
Devon and Cornwall continues to have a broad range of industries, including
traditional ones such as fishing, mining and quarrying as well as the newer
industries in high technology and electronic engineering. Agriculture and fishing
still employ proportionately more people in Devon and Cornwall than they do in the
28

country as a whole, despite their decline in recent decades (Devon and Cornwall
TEC, 1998). This sector still accounts for 4% of employees in Cornwall (5,500
people), although this number has fallen by 18% in recent years and self
employment in the sector is highly significant (Gripaios, 1998). In Devon, 3% of
employees are in agriculture and fishing (9,500 people), a figure which fell by 11%
between 1991 and 1995. Where as 1% of employees in Devon, the South West and
the UK are employed in the energy, water and mining sector, this figure rises to 3%
in Cornwall (Gripaios, 1998). However, employment in this sector fell by nearly
13% in Cornwall between 1991 and 1995, falling by 37% nationally over the same
period (Devon and Cornwall TEC, 1998).
3.2.2.1 Manufacturing
The manufacturing sector in Devon and Cornwall consisted of nearly 2,400 business
units in September 1995, employing 76,500 people (see Table 3.1 ). In order of the
number of businesses, the most important manufacturing sectors were, food products
and beverages, machinery and equipment, transport equipment (notably ship
building and repair), publishing and printing, radio, TV and communications
equipment. Each of these sectors had more than 5,000 employees (Annual
Employment Survey 1995, ONS). In addition, four of these sectors were among
seven manufacturing sectors in the two counties which had a higher concentration of
employment than nationally. These were manufacture of transport equipment and of
radio, TV and communications equipment, which had more than twice the national
share of employment, and food products and beverages, tanning and dressing of
29
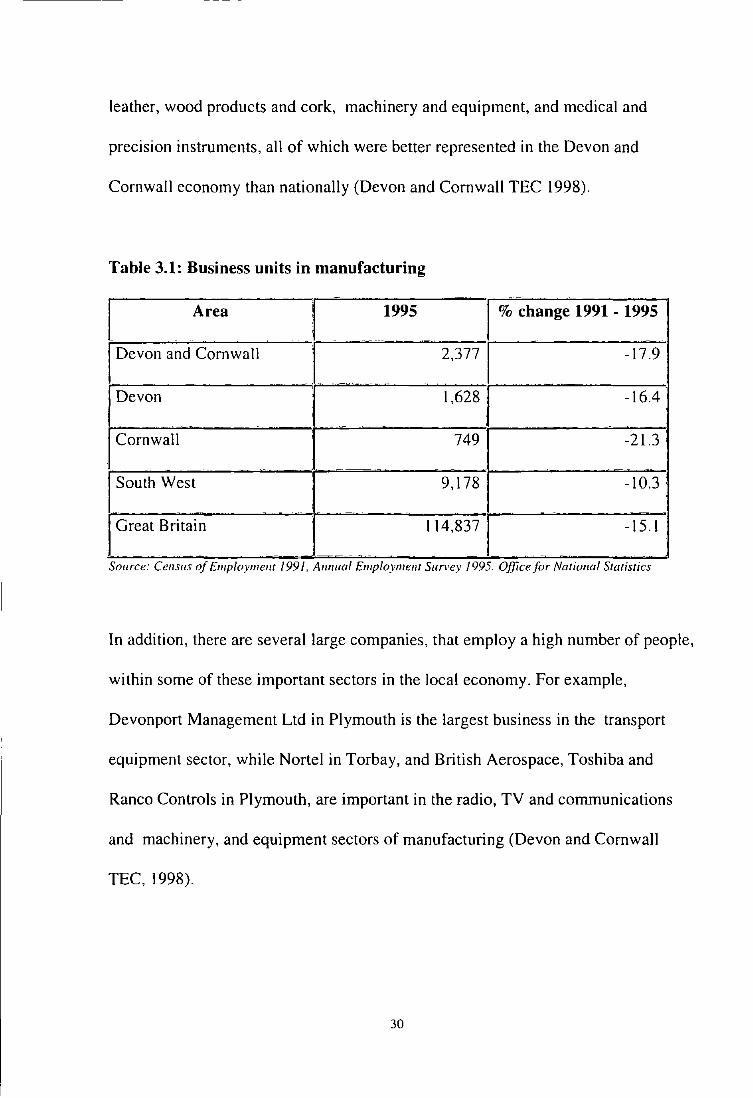
leather, wood products and cork, machinery and equipment, and medical and
precision instruments, all of which were better represented in the Devon and
Cornwall economy than nationally (Devon and Cornwall TEC 1998).
Table 3.1: Business units in manufacturing
I Area I 1995 o/o change 1991 - 1995
I Devon and Cornwall
1 2,3771 -17.9
- ·-· -I Devon I 1,628 J -16.4
I Cornwall 749 -21.3
- -
South West 9,178 -10.3
114,8371 Great Britain -15.1
- .
Source_· Census of Employmellt 1991. Annual Employment Survey 1995. Office for Narwnal Stallsllcs
In addition, there are several large companies, that employ a high number of people,
within some of these important sectors in the local economy. For example,
Devonport Management Ltd in Plymouth is the largest business in the transport
equipment sector, while Nortel in Torbay, and British Aerospace, Toshiba and
Ranco Controls in Plymouth, are important in the radio, TV and communications
and machinery, and equipment sectors of manufacturing (Devon and Cornwall
TEC, 1998).
30
3.2.2.1.1 Long term prospects for manufacturing in Devon and Cornwall
Long term prospects for manufacturing are relatively good. However, while output
is expected to grow, the forecasts for employment in this sector show either low
growth or decline (DCTEC, Annual Employers Survey, 1997). The latter is likely to
be the result of' technological change, increased productivity, and more outsourcing
of service tasks. However, outsourcing is likely to lead, to indirect employment
growth in other industrial sectors, as long as local firms are available to sub
contract, to those large manufacturing companies, which are concentrating on core
activities. Computing, professional, and other business services are likely to be the
main beneficiaries of this change in business process management. However, in
future, companies may show greater selectivity in their outsourcing, sometimes
combining internal and external provision.
3.2.2.1.2 Short term prospects for manufacturing in Devon and
Cornwall
Locally, short term prospects appear to be good, with manufacturing being only one
of two sectors in which the employers expected an increase in their workforce. In
fact, more than half of the manufacturing employers interviewed in July/ August
1997 were expecting their workforce to grow in the next 12 months. Amongst
manufacturing employers, 28% were expecting an increase in semi-skilled workers,
22% an increase in skilled/craft workers and 15% an increase in technicians/white
collar staff (DCTEC, Annual Employers Survey, 1997). Short term prospects were
31
----------------------
also good for other aspects of manufacturing. For example, 59% of manufacturing
companies thought that there would be an increase in their business turnover while
only 41% expected turnover to remain the static (Devon and Cornwall TEC, 1998).
While 63% of manufacturers expected an increase in profits, only 11% expected a
decrease.
3.2.2.1.3 Investment prospects in manufacturing
Investment prospects are also good with 64% of manufacturing companies
envisaging an increase in investment in plant and equipment, and 59% expecting
increased investment in training (OCTEC, Annual Employers Survey, 1997).
3.2.3 Employment pattern
This section highlights the employment trends for the manufacturing companies in
the Devon and Cornwall region.
A survey conducted by the Devon Cornwall TEC in 1997 reported that while the
majority of manufacturing employers (86%) had been able to recruit staff from their
immediate local area, ll% of manufacturing employers had to recruit staff from the
rest of Devon and Cornwall. A total of 6% had been recruited from the remainder of
the South West region, and 7% from the rest of the UK. Manufacturing companies
which had recruited outside Devon and Cornwall (13%) had commonly done so
because of their need for certain skills with the highest proportion (36%) recruiting
32
engineering skills from outside the two counties, followed by 11% for managerial
staff.
On average, manufacturing companies had 2.4 vacancies each at the time of the
survey. Half of those vacancies were for skilled/craft workers, followed by 20% for
semi-skilled workers and 13% for sales staff. Of the manufacturing companies
surveyed, 60% envisaged difficulties in filling these vacancies, especially those for
skilled/craft workers, and as many as 76% of manufacturing companies identified a
genuine skills shortage as the reason for problems in filling posts (DCTEC, Annual
Employers Survey, 1997).
Difficulties such as skills shortages are not surprising given the apparent large scale
absence of forward planning activities by manufacturers. For example, the author's
visits to SME' s revealed that 41% did not have a written business plan and 57% did
not have a written training plan.
The relative position of employment in manufacturing in the Devon and Cornwall
region is summarised in the Table 3.2 below.
33
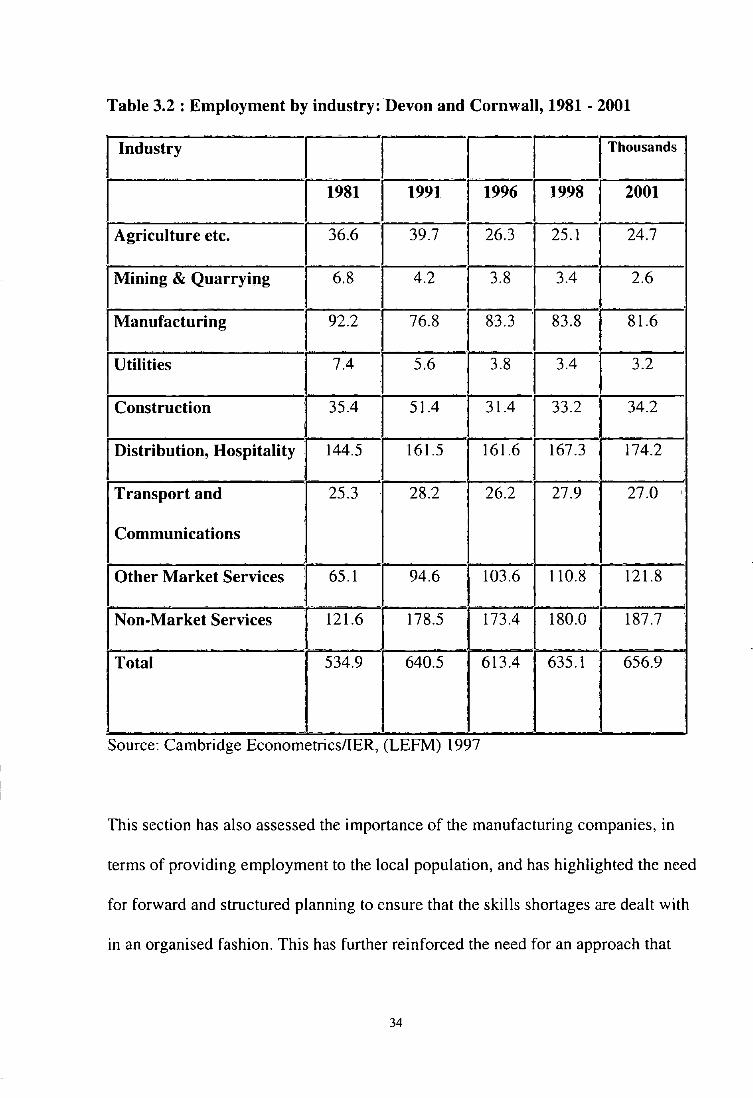
Table 3.2 : Employment by industry: Devon and Cornwall, 1981 - 2001
I Industry - rr--rl. Thousands
i------~----~F~I1996 1
1998 ~·
IAgricultureetc. ~· 39.7 FF~ rl M-in_i_n_g_&_Q_u_a_r-ry_i_n_g~-~. 4.2 ~F~.
I Manufacturing ~ 76.8 Fl 83.8 l 81.6
li-U_t_il-iti-es------~. 5.6 J3.8F~
I Construction 35.4 I 51.4 I 31.4 ·~ 34.2
Distribution, Hospitality 144.5 161.5 161.6 F 174.2
Transport and 25.3 28.2 26.2 27.9 27.0 I
Communications
Other Market Services ~_--65.1 -~ 103.6
l 121.6 178.5 173.4 I Non-Market Services
110.8 rru-F~
Total 534.9 640.5 613.4 635.1 656.9
Source: Cambridge Econometrics/IER, (LEFM) 1997
This section has also assessed the importance of the manufacturing companies, in
terms of providing employment to the local population, and has highlighted the need
for forward and structured planning to ensure that the skills shortages are dealt with
in an organised fashion. This has further reinforced the need for an approach that
34
----------------
can assist the manufacturing companies in the region, to introduce new technology
and systems without the extra costs of hiring the services of specialist consultants.
3.2.4 Problems faced by the businesses due to the region being a
periphery area
This section concentrates on the issues, and the constraints which are faced by the
manufacturing companies in the region due to the region being a periphery area of
the UK. These issues must be taken into consideration when justifying the need for
an approach to introducing new technology and systems into the manufacturing
compames:
• Devon and Cornwall is a region within what is termed the "Atlantic Arc" of
Europe, and is relatively peripheral to the main areas of economic activity within
the UK and the European Union. The region lacks high quality, physical and
electronic communications, which are essential to improving economic
competitiveness, and attracting new investment into the area (Havinden, 1991 ).
• The region is inhabited by higher than average proportion of older people, which
not only restricts the demand for the latest technology goods but also restricts the
quality of skilled labour (Havinden, 1991).
35

• The region has a poor infrastructure of roads, rail and air which are vital to
develop closer links with the customers in Europe and compete with
manufacturers both in the UK and Europe (Havinden, 1991 ).
• The region has a relatively few industrial estates and locations available for new
economic investment, and for relocations (Devon and Cornwall TEC, 1998).
• As discussed in the previous section, there is a severe shortage of skilled labour,
as higher proportions of individuals in the region are in semi or unskilled jobs.
3.3 Characteristics of SME's in the Devon and Cornwall
The research presented in this section has been accumulated from the literature
survey, discussions with practitioners and visits to SME's in the Devon and
Cornwall region. In most cases the principal findings in the literature have been
supported by the author's survey, with a few exceptions, that are of particular
relevance to the Devon and Cornwall region, the details of which have been given in
the chapter 6.
Small and medium size manufacturing companies are a significant part of the UK
economy (Teaching Company Directorate, 1995). In 1995 the DTI report on small
firms in Britain reported that 37% of all manufacturing employment was provided
by the SME's. While SME's are important to the economy there is also growing
recognition of their vulnerability in competitive markets (Staughton et al 1996).
36
Different criteria have been used to define SME's. The definition used for EC
initiatives such as the Community Action Programme for Education and training in
technology (COMETT) for example, identify an SME as having less than 500
employees. Brooksbank et al (1992) have suggested that the criteria of sales
turnover, number of employees and chosen growth strategy should be used
differentiate between large and small firms. Houldsworth (1992) classifies an SME
as having less than 250 employees and less than £250M turnover. This definition is
similar to that of the Teaching Company Directorate (1995) who suggest the criteria
of less than 250 employees, turnover less than £ l6M or balance sheet total of less
than £8M, and less than 25% owned by a company not meeting SME criteria. This
last criteria has been used to identify SME's for this research.
The characteristics of SME's can be divided in to two parts: the general
characteristics and technological characteristics.
3.3.1 General characteristics
ACARD (The advisory Council for Applied Research and Development, 1986)
study on SME's in late eighties identified the of lack of financial of resources as
being a key factor in the growth of SME's, particularly when trying to facilitate
training, innovation, organisational development and research and development.
This is a major factor preventing the advancement of SME's, given the high costs
associated with the alternative of acquiring outside consultancy.
37

Another factor that has been identified (Curran et al, 1993) is that small companies
often lack trained personnel to implement business change. This problem is also
faced by the larger organisations. However, SME's have to deal with these problems
without the specialised staff expertise and financial resources that are available to
the large companies. This implies that SME's need to focus on the training of staff,
to address the deficiencies in expertise. This can be achieved without the need for
huge financial resources.
A Price Waterhouse (1991) report, while acknowledging the flexibility and
dynamism of SME's, indicates the inability of SME's to undertake training on a
large scale due to the lack of staff resources and time. The use of educational
technologies which may facilitate a more flexible means for training could provide
the new opportunities which are required in this area (Balcon 1990).
In addition to the lack of financial resources and trained personnel, further
constraints are imposed by a short range management perspective (ACARD 1986,
Ibrahim and Goodwin, 1986). These characteristics of small firms play a significant
role in restricting the introduction of new technology and manufacturing systems.
For an SME to identify the use of technology within the business, there is a need to
first establish the strategic direction and plans of the company, which requires a
longer range perspective. It is unlikely that appropriate technology and systems
could be designed and implemented if there is no appreciation of corporate strategy.
38
3.3.2 Technological characteristics
This section identifies issues that sustain or restrict technological change in SME' s.
The implementation of Advanced Manufacturing Technology (AMT) and use of
outside consultancy is discussed in this section.
AMT can provide as many if not more benefits to the SME's, than it does for large
organisations (Merideth, 1987). These benefits include capitalising on flexibility,
quality, and lead time reductions offered by the new technology. In earlier work,
Meredith ( 1985) indicates that smaller companies are more selective in the
implementation of AMT, in that their investment is focused on achieving pre
defined goals, such as increased quality, reduced lead time or some other area of
potential competitive advantage.
The financial constraints identified (lbrahim and Goodwin, 1986) suggest that the
majority of SME's would be unable to attempt the introduction and implementation
of AMT because of the high costs associated with its adoption. Although the
financial resources are generally limited for SME's compared with the larger
organisations, the author's research in this field reveals that small companies have
indicated a large investment in production facilities for example, Computer
Numerically Controlled (CNC) machine tools.
A number of critical issues associated with the implementation of technology are
conducive to being a small company (Merideth 1981 ). The members of a project
39
--------

team are likely to possess a broader understanding of different areas of the business
which would facilitate problems identified and solution development which is not
constrained to individual and isolated areas of the business. This is in contrast to the
more narrow perspective which may be held by a larger company which relies on
individual departments, for example data processing, to lead the implementation of
new technologies. In addition, the senior management team of a small firm is likely
to be closer to the project than their counterparts in a larger company (Karlsson,
1993). This increases the possibility of obtaining a senior management, project
champion to support the project.
3.3.3 Consultancy and SME's
Where the solution of strategic problems is concerned, SME's are found to have
little expertise (Fuller 1994 ). These skills are typically acquired from external
interventions using consultants. However, such external intervention does not
guarantee success (Soh 1992). Lees and Lees (1987) suggest that SME's often
overestimate the impact of consultant support. Consultants often do not understand
the specific needs of the companies (Meredith 1981) and often try to apply methods
and tools to SME's which are normally used in large organisations. This results in
often over complex solutions or alternative solutions that are impractical and
therefore waste resources.
Another problem associated with the use of specialist consultants, is the dependency
of the companies on the consultants for future improvements to the systems, and
40

technology that subsequently results in more costs. Continuous improvement is the
key to successful system implementation, this can be difficult to achieve through the
use of consultants. The use of consultants also means that no new development of
company's own staff is initiated. This further poses confidentiality issues for the
possible replication of company's products.
In the majority of cases, for most SME's to use outside consultancy, is beyond the
limit of their financial budget. There needs to exist an approach that guides the
company staff through to implementing new technology and systems in their
companies. Such an approach is the focus of this research.
3.4 Study of SME's in Devon and Cornwall, the UK and the Europe
This section carries out a study of the SME's in Devon and Cornwall, the SME's in
Europe and the rest of the UK. It aims to identify similarities and or differences that
exist. The focus of which is to ensure that any new methodology that is developed
takes into account the particular needs of the SME's in the Devon and Cornwall
region. Also this study's objective is to highlight the advantages that companies in
Europe and the UK have over the SME's in the Devon and Cornwall region.
It was thought that the development of the European Union (EU) would,
increasingly concentrate business in large enterprises. However, in practice the
process of concentration of business in large enterprises has not only ceased but also
41

been reversed. All European countries including the UK, recognize the importance
of the small firm sector in wealth and job creation (The European Observatory for
SME' s - Fourth Annual Report 1996). The countries of the EU can be separated into
two groups. Firstly, the EU big four namely France, the United Kingdom, Italy and
Germany, while in the second group are contained Ireland and Denmark
(Eurostat!DG XXIII: Enterprises in Europe, Fourth Report, Brussels!Luxembourg,
1996).
There is a lack of consistency in international statistics about small firms, while
certain classification of information are simply not recorded in some countries- and
therefore not available. In addition, the sample base for various analyses also tends
to vary greatly from country to country making any attempt at comparative analysis
very difficult.
The problem reflects itself in the statistics on numbers and employment by the size
of firm. The picture that emerges is however, remarkably consistent. SME's
represent over 99.8% per cent of firms in all EU countries (European Observatory
for SME' s, Fourth Annual Report, 1996).
Employment patterns are more diverse, SME's employ between 60%, in France and
83%, in Italy and Republic of Ireland, of the work force. To some extent these
differences reflect the definitional problems outlined above. The one country out of
42
line is the UK where the small firm sector employs only 37 % of the work force
(European Observatory for SME' s, Fourth Annual Report, 1996) .
SME's in the EU tend to be more profitable than large firms (Ganguly, 1995).
Alongside this SME's are generally less productive than large firms (using output,
profit or value added per employee as a measure). The explanation for this is two
fold. Firstly small firms are actively substituting labour for capital because they face
capital constraints and/or rationing. The second reason is that the cost of capital and
labour are not the same for small and large firms. Capital costs are higher for small
firms, due to higher interest charges and the labour costs are lower. Hence capital
and labour will frequently be used in different firms according to their size, enabling
both to be technically and cost efficient.
SME's in the UK follow a different trend, with research data on profitability
showing that they are now marginally less profitable than large firms and that the
situation is deteriorating (European Observatory for SME's, Fourth Annual Report,
1996). They are also less productive than large firms. In other words, they are
inefficient using both capital and labour measures. The same is also true for the
companies in the Devon and Cornwall region. It is therefore possible to draw
conclusions about the efficiency and effectiveness of small firm management. This
points to a need for improvement in management style and technique (Fuller 1994),
and lack of employment of new technology (Meredith, 1986), which in the present
43

climate of intense competition is one aspect that cannot be overlooked. This causes
a real concern about this situation that cannot continue for long, especially in
relatively disadvantaged regions of the UK like Devon and Cornwall.
There are several factors that affect the UK's economic performance, among them
being capital costs, since the UK has the highest property rental costs for both office,
and manufacturing space than any other EU country (Opportunities for Growth; an
Economic Assessment of Devon and Cornwall, 1995). A further factor affecting the
UK's performance is high unit labour costs due to production being lower per head
than any other EU country while average wages are at the midpoint (Eurostat/DG
XXIII; Enterprises in Europe, Fourth Report, Brussels/Luxembourg, 1996).
The UK has a unique tax environment within the EU, being favourable for
businesses. The UK small businessman faces neither the burden of taxation nor the
complexity of administration that many of his European neighbours face, while the
Business Expansion Scheme offers unique and generous tax advantages to those
investing in small businesses (Small Firms Report 1995, DTI).
Arguably the major requirement of SME's is a need for equity capital. Here the
provision of tax incentives may have a part to play in that it can be used as an
inducement for non-participant individuals to invest in SME's. Britain stands out
here with its bold and generous Business Expansion Scheme. This allows the
deduction of up to £40,000 in any one year from an individual's tax liability for
44
investment in shares in unquoted trading companies incorporated and resident in the
UK (Small Firms Report 1995, DTI).
None of the countries in the survey have any scheme approaching the generosity of
the UK scheme (Small Firms Report 1995, DTI). Although Denmark has no special
incentives for investment by non-participants, it does have a scheme whereby wage
earners under 40 can make deductible deposits of up to 20% of their income in an
'establishment account' and use it for setting up their own business. In France private
individuals investing up to 7000 FF a year in quoted or unquoted companies may
claim a 25% tax credit. Germany, the Republic of Ireland, Italy and Switzerland
offer no specific tax incentive for non-participants (European Observatory for
SME's, Fourth Annual Report, 1996).
Management competency is a prerequisite to the success of any SME's trade. The
scope of this competency is a key to the economic success of an SME and can be
explained by its distinctive management practices which give it a competitive edge.
Motivation to growth by either the proprietor or/and managers is a key pre-condition
for business success. Clearly only entrepreneurs with a high motivation for stable
growth, innovation, employment of new technology and a positive attitude towards
effective delegation of tasks and responsibilities will be able to make their
enterprises grow (Small firms in Britain, DTI, 1995).
45
3.4.1 Problems faced by SME's in employing new technology and the help
given by the governments
SME's often lack the skills and capabilities required for the efficient production of
modem technologies (Qurashi, 1996), and this is one industry that Devon and
Cornwall will need to focus on if it is to make a long-term economic recovery.
Special programmes have also been introduced to improve the ability of SME's to
make use of various technologies.
In Ireland, the National Microelectronics Application Centre provides consultancy
and advice to SME's regarding their technological needs. The main activity is to
support small companies in their application of IT by providing technical solutions
(FitzGerald, 1993) Science Budget: Review of State Investment in Science and
Technology 1980-1993, Forfas Dublin, source: ESRI, Ireland). In Norway, the
Industrial and Regional Development Fund (SND) supports programmes through
which new products and innovations are developed in a close contact with, and
according to the requirements of, the user, which may be a public institution or
another company. The aim is to bind producers and users together and to enhance
the flow of information between them.
The problems faced by SME's using these new technologies are changing; as the
price of hardware and applications declines, so the problems which relate to the
skills and training required to use these technologies have come to the fore.
However, financial and infrastructure problems still exist and the need for
46
consultancy and training is growing (IT Diffusion Policies for SME's, OECD, Paris,
1995).
One common problem that SME's share is the lack of national IT structures, and the
poor suitability of these infrastructure and IT applications to SME's. In the Bretagne
region of France, an attempt has been made to improve the availability of the
infrastructure. A local network is open to everyone, and local authorities pay two
thirds of the operating costs. The network provides access to many research centres,
databanks, public authorities and the Internet. SME's have been major beneficiaries
of this service, which provides access to information highways in a region far from
the major axes of European development (Usine Nouvelle No. 2494 (March 1995),
Aprodi, France). In the Netherlands, a Dutch organisation for SME entrepreneurs
(MKB-Nederland) has started an interactive network for its members, through which
entrepreneurs can seek advice and consult experts. The main function of the network
is to help the entrepreneurs find the most relevant information sources (De
Financiele Telegraaf20.12.1995, ElM Small Business Research and Consultancy,
the Netherlands).
SME's are in need of relevant and up-to-date information about the development
and advantages of new technologies. However, the resources available to any
company are limited by its size and SME's in many cases would not be able to make
an extensive search for the information they require. One response to this problem is
the Technological Innovation Cell in Flanders, which searches for and evaluates
47
technical trends, as well as new products and processes, on behalf of local
enterprises. In Austria, the Economic Promotion Institute has established the
Interactive Information Centre in Graz where different IT services (e.g. simulation
applications and training) are offered to the entrepreneurs (IFG Vienna, Austria).
The introduction of new technologies often requires substantial investments in both
equipment and training and there are various national schemes throughout the EU
providing help to SME' s. In Italy there are regional laws that provide grants to
SME's for the purchase of technologically advanced software (Mediocredito
Centrale - Ouaderni di Politica Industriale- Osservatorio sulle Piccole e Medie
lmprese. Febbraio 1995, source: Bocconi University, Italy). In Germany,
subsidised loans are available to SMEs for either the production or purchase of these
new technologies (FM Bonn, Germany).
3.5 Assistance available to SME's in the Devon and Cornwall
Whilst the British Government believes that all business works best when given the
maximum freedom to operate, it also recognises that small firms often face
particular difficulties and tend to function at a disadvantage to larger firms (Small
Firms Report, DTI, 1995). These disadvantages include:
• greater difficulties in raising finance, particularly for small firms in high risk
areas such as new technology;
48

• difficulties in penetrating overseas markets; and
• limited possession of management and other business skills essential for
growth.
The Government is seeking to counteract the disadvantages which all SME's face.
Research has indicated however, that there is additional value in focusing assistance
selectively on those firms with the potential and management will to grow. The joint
DTIICBI, 1995 Winning report identifies the characteristics of a winning company,
as follows:
• they are led by visionary champions of change;
• they unlock the potential of all their people;
• they understand their customers' needs; and
• they strive continually to improve the range and quality of their products
and services.
The thread that runs through all these criteria is a recognition of the need for change,
and a willingness to seek help in implementing and responding to change. In the
small firm in particular, the role of the manager is crucial. While the government
does make available a wide range of support in such varied areas as business
planning, product development, marketing, training, exporting, accessing finance
etc., the impetus for change lies in the hands of the firm (Business Link, 1997).
49

The government believes that its policy in support of small firms must evolve in
partnership with small firms themselves (Chesterton Consulting Group, 1996), with
their representative organisations, and with providers of business support at the local
level (Small Firms Report 1995, DTI).
3.5.1 Business Links
In England, the Business Link is the normal single point of access for all DTI
business services. For the first time, all businesses have a single, local place to go
for a wide range of business support services. Business Links provide support for
all firms, from start-ups to well- established businesses, but the focus is on those
with potential for growth (Small Firms Report 1995, DTI).
The Personal Business Advisers (PBAs), who are at the heart of each Business Link,
develop long-term relationships with local business clients to help support their
development and growth. They are supported by specialist advisers in innovation
and technology, exporting and design. Business clients also have access to a finance
packaging service to help them to obtain the right mix of finance to meet their needs
(Small Firms Report 1995, DTI).
3.5.2 Single Regeneration Budget
The Single Regeneration Budget (SRB), came into operation in April 1994. It
combines 20 previously separate programmes into a single budget. From 1995/96
the Budget has been supporting new innovative projects, through the Challenge
50

Fund, with some £575 million funding available to the SMEs in the Devon and
Cornwall region (An economic assessment of Devon and Cornwall, 1998). These
new initiatives proposed and devised at local level, have been chosen through a
competitive bidding round administered by the Government Offices. Business
support is given prominence as a means of encouraging sustainable economic
growth. Improving the competitiveness of the local economy is an important aspect
of the Challenge fund objectives. SME's clearly stand to benefit from the Challenge
Fund in terms of economic help, since over 100 of the new Challenge Fund projects
have economic development as their key priority and aim to assist 60,000 new
businesses (An economic assessment of Devon and Cornwall, 1998)
In meeting their objectives, successful bids are expected to maximise the leverage of
private sector investment and intensify the impact of public sector resources by
achieving greater coherence of expenditure, including maximum co-ordination with
European Structural Funds. From this perspective, it is clear that SME's in Devon
and Cornwall stand to benefit from their EU assisted region status.
The 1995 bidding round built up to a total of £200 million in 1997/98. The SRB
bidding rounds have provided opportunities for developing imaginative and
innovative business support schemes that form part of the wider regeneration
strategies submitted for funding under the budget. Support for small businesses will
continue to be an objective of the SRB (An economic assessment of Devon and
Cornwall, 1998).
51
3.5.3 Training and Enterprise Council (TEC)
Small firms face particular problems in tackling their management skills and
training needs. Time and resources devoted to training and management
development when weighed against the pressures of keeping the business running,
can appear disproportionately costly.
It is clear, however, that small firms do need to improve management and skills
training (Caird, 1992). The government has paid particular attention to the needs of
small firms in all its training and development initiatives. Considerable help is
available in England through the Business Link and the Training and Enterprise
Council (TEC) networks.
TEC's were established by the Government to restructure Britain's approach to
training and enterprise development. In partnership with the local community, they
enhance the nation's efforts to improve business performance and develop
individuals. They have been given the task of determining the specific needs of
their areas (Foundations for the Future; an Economic Assessment of Devon and
Cornwall, 1994).
A new initiative, Skills for Small Businesses, is also available through TEC and
Business Links. It aims to help firms overcome the barriers they face in improving
the skills of their work force by developing in-house training expertise.
52
A new package of consultancy support for small and medium-sized enterprises is
being developed that will build on the success of the Enterprise Initiative
Consultancy Scheme which closed in 1994. The new services will be delivered by
Business Links (Small Firms Report 1995, DTI). The Diagnostic and Consultancy
Service provides subsidised management consultancy to help firms. This new
service is made up of two distinct elements:
• The provision of holistic diagnosis of business strengths and weaknesses
for individual businesses; and
• Full strategic consultancy.
During 1998 all Business Links offered an Innovation and Technology Counselling
service. Business Link clients received direct personal advice on any aspect of
innovation or the application of technology from Innovation and Technology
Counsellors (ITCs) (Devon and Cornwall TEC, 1998).
3.5.4 Teaching Company Schemes
The exchange of people between organisations has proved to be a very effective way
of facilitating the transfer of technology and skills. The Teaching Company Scheme
(TCS) aids technology transfer and provides industry-based training for high quality
graduates through partnerships between academia and business. TCS programme
costs are shared between the company and one or more government department or
53

Research Council sponsors (mainly the DTI and the Engineering and Physical
Sciences Research Council). A target for DTI-supported TCS programmes is that
80% should involve smaller firms. The DTI established a network of TCS Centres
for Small Firms, based in selected universities, to help small firms benefit from the
skills of graduates. TCS Centres offer easier access to technology in universities,
help to increase the number of TCS programmes with small firms and enable them
to benefit from shared TCS programme administration. In its new role as Lead
Department for TCS, the DTI is also looking to extend the scheme by encouraging
support from government departments and other public sector bodies which
currently do not sponsor TCS, or which only do so to a limited extent.
3.5.5 Technology Foresight Programme
Considering the future, the Technology Foresight programme, published in May
1995, has identified a number of emerging markets, and the technologies needed to
underpin them, which are most likely to provide major opportunities for UK
business over the next 10-20 years. The Government is disseminating the Foresight
findings through a national programme of workshops and conferences to spread
awareness, especially amongst small firms. Business Links and others, including
Chambers of Commerce, Trade Associations and Research and Technology
Organisations, will provide information about Foresight and promote follow-up
(European Observatory for SME's, Fourth Annual Report, 1996).
54
3.6 Conclusions
This chapter has presented the spread of various industrial sector within the Devon
and Cornwall region and has highlighted the above average concentration of SME's
in the region, when compared with the rest of the UK. The chapter has also
emphasised the importance of the manufacturing sector of the region and the need
for this sector to become competitive by innovating and introducing new
technology.
The chapter also presented the relative disadvantages faced by the SMEs by the
region being a periphery area. The disadvantages include lack of skilled labour, lack
of high quality physical and electronic communication, poor infrastructure of roads,
rail and air network, fewer industrial estates for economic investments and the lack
of technology suppliers in the region.
The chapter outlined the general and technological characteristics of the SME' s, to
include lack of finances available to the companies; lack of trained people; lack of
staff resources and time; short range management perspectives; short-term
perspective when investing in new technology; lack of technology appreciation and
know how; and the close involvement of senior managers in any project, the last
characteristic is a positive element.
55

A comparison is done of the SMEs in the Devon and Cornwall region with the
SMEs in the UK and Europe. The chapter also outlined the various help that is
available to SMEs in the region from the local and central government.
All the above characteristics and disadvantages of the companies require the SMEs
to become more competitive by introducing new technology in their manufacturing
operations. However, given the lack of know how of the available technology and
skilled labour to implement new systems gives rise to a requirement that an
approach be developed that could guide the companies from analysing the needs,
developing and researching for solutions and successfully implementing the new
technology.
56
Chapter 4
Manufacturing, Systems, Information, Information Systems and Manufacturing Information Systems
4.1 Overview
This chapter presents, in detail, the definitions of the fundamental concepts and
terminology's which are necessary to understand the needs of manufacturing
companies. The objective of the chapter is to understand the expectations of
manufacturing information systems in relation to the overall content of this
thesis.
This is achieved by looking at the original definitions of manufacturing, systems,
information systems and manufacturing information systems. For any new
approach to be considered to be effective it must be compared to its original
definitions to establish its validity.
4.2 Introduction
Manufacturing, at its most fundamental level is concerned with taking materials,
and then using resources, design and investment to create a commercial product.
Hence, for manufacturing to take place, it is necessary for an industrial enterprise
to have a supply of materials, with the required relevant technical properties.
Also required are machinery and equipment capable of being operated and
controlled to process the materials. A labour force adequately trained in the
57

appropriate skills to operate and control machinery, and equipment is necessary,
in order to achieve the required product to the predetermined desired quality.
The above aspects chieny relate to product and quality. In addition to these
aspects it is necessary to remember that each of the required technological
processes require a specific amount of time to achieve the required conversion
from one stage of manufacture to another. Since customers usually specify
delivery requirements in addition to those of quality, it must be ensured that
manufacture of the required items can be achieved by the stated delivery time or
due date.
Furthermore, the resources required for manufacture must be consumed in as
economic a manner as possible in order to ensure that the enterprise can cover its
costs and generate sufficient income for re-investment, together with adequate
rewards for shareholders etc. Therefore, it is necessary that the manufacturing
resources of the enterprise are utilised in the most effective way, in order to meet
the customers product quality and delivery requirements at an acceptable cost.
4.2.1 Efficiency in manufacturing
Over the past decade there has been much concern over the ability of U.K.
manufacturing companies to satisfactorily perform efficient manufacture
(Tepper, 1997). History is now replete with examples of industries successively
falling prey to competition from abroad (IT Catalyst for Change, PA Consulting
Group 1992). The reasons for these situations have been variously quoted as
58

"poor delivery performance", "poor quality", "bad labour relations", "lack of
liquidity", "declining market share" etc. More pointedly it has been said that
"the weakness in the U.K. economy lies squarely in the field of production and operations management. This is where the over-manning occurs, where jobs get delayed for delivery and the physical stocks are built up" (Nicholson, 1976).
Clearly, what is being referred to in Nicholson's statement is labour and resource
utilisation, due date and need date performance, lead times, throughput and
inventory turnover.
During the eighties and early nineties disturbing facts about these topics began to
emerge. Labour costs were thought of as being unacceptably high and
widespread cost cutting exercises were launched to drive this operational expense
down. It is now well known that companies cut their labour forces as much as
possible, at every opportunity. To achieve this for instance Jaguar, on introducing
new axles into their XJ40 model re-designed the axles to contain 30% less
labour content than the old axles (Weeks and Merrick, 1984). This re-design had
large implications for manufacture. With less labour content in a new axle, it was
quicker for the axle plant to build and arrange for just-in-time production. Of
course it is important to remain aware of large increases in demand. When an
increase in demand occurs the company will have to resist increasing their labour
force to meet the increase in demand, preferring instead to work overtime or once
again face the problems of over-manning in future months.
59
------------------- -
4.2.2 Delivery dates and throughput
The due date performance of U.K. manufacturing industry over the past decade
has also received much criticism. Whilst analysing a case-study company as part
of the research, a sample of due date performance revealed that 76.5% of the
orders were completed late, and on average they were three weeks late. This is of
course not the performance figure for the U.K. industry as a whole during this
time period. With good due date performance, there is a greater possibility of
"making money" by delivering goods on time. Perhaps more importantly, if a
company is in a supplier network, there is an increased prospect of remaining in
business with the customer. For factories with machine shops feeding assembly
areas, delivery of components by the date specified is of primary importance as
any delay could affect the production elsewhere.
Due dates, manufacturing lead times and throughput, are often inextricably
connected. During this research it was noted that in many companies orders were
completed late, due to the inability of the factory to produce within the planned
lead times. The actual throughput time in the sample was found to be on average,
1.7 times the planned lead time, i.e. it was actually taking 1.7 times as long as
intended to produce components. Throughput efficiency can be defined as:-
Set up time + machine process time x 100
Total throughput time
Using this equation it was revealed that the actual throughput efficiency attained
was 24%, that is on average the product was undergoing useful work only 24%
60
of the time spent in factory, compared to a planned throughput efficiency of 40%.
In 1976 the British Institute of Management (BIM) conducted a survey in U.K.
industry. The focus of this survey was to point out room for improvement in
throughput efficiencies and to identify the standard as a target for U.K. industry.
Included in the findings of this survey were statistics stating that 60% of all the
companies surveyed had throughput efficiencies of less than 30%.
4.2.3 Inventory control
Another key point raised by Nicholson's earlier statement concerns stocks or
inventory. Recently this area has received a tremendous amount of attention. This
is due to importance of being able to release working capital which otherwise
committed, thereby reducing the costs incurred in inventory handling and the
subsequent reduction in the annual cost of servicing inventory. The Japanese
focus attention on other reasons by using "the river of inventory" analogy. This is
where high inventory is analogous to a high water level covering obstacles like
rocks etc., analogous to capacity problems, bottlenecks and quality problems.
It is normal for companies to measure their relative inventory handling
capabilities by measuring the rate at which they turn that inventory over, this
relationship can be defined as:
cost of goods sold
inventory
An improvement in this ratio demonstrates reduced inventories, increased
throughput or a combination of both. This leads to shorter manufacturing lead
61

times, an uncovering of problems, and in general a more streamlined company,
with the possibility of enhanced profits. During the eighties, companies in the
USA and the U.K. turned their stocks over 3.2 times on average, whilst at the
same time Japanese industry turned its stock over 6.0 times. This figure increased
in the early nineties to 7.5 times, over 100% better than U.K. and American
companies in repetitive manufacturing (Wantuck, 1992).
Example application from specific companies, demonstrates that this interest in
inventory reduction is not necessarily one sided and that Western manufacturing
companies have also taken the idea on aboard. For instance Ford Motor
Company increased their inventory turns to 15.6 in 1993, and estimated a world
wide inventory saving of $2.8 billion. Ford's Engine Division reduced its total
inventory by 42% between 1990 and 1993. Jaguar in 1992 began to turn their
stock over 16 times a year and held less than a weeks stock of items with a high
monetary value (Weeks and Merrick, 1994). Obviously there is a limit to which
this increase in inventory turns can go as smaller stocks could imperil assembly
operations. An assessment of supplier quality and reliability records, along with
an evaluation of the risk involved for stock outs of important or critical parts
must be undertaken before dramatic increases in inventory turns are made.
4.2.4 Future trends
As the world-wide competition increases it is expected that this will result in:
• faster throughput time
• reduction in inventories
62

• reduction in set-up time
• reduction in work-in-progress (WIP)
• less storage space
• less internal transportation (fork lift trucks etc.)
• delivery and positioning of materials will became more important
• greater co-operation with suppliers
e better goods inwards procedures
• conveyor systems reduced in length
• ·. plants becoming more responsive to the customer
• increased manufacturing flexibility
• decentralisation of manufacturing facilities
• _ more manufacturing tasks taken over by automated machinery
• groups of machines able to produce various products
• small numbers of employees with operators able to work more than one
machine
• employees working closer together in clusters - having high expectations in
terms of heating, lighting, facilities etc.
• manufacturing in clusters or cells, virtually mini factories (automatic or
manual)
o layouts enabling operators to control more than one piece of equipment
63
• layouts permitting ease of transfer of parts and components
• operators and cell personnel requiring interaction with data, information and
the overall manufacturing control system via terminals
The manufacturing environment will, even if has not done so already, move
toward increasing computer control. Central to this control is the effective
application of information systems and the optimal use of relevant technology.
4.3 Manufacturing
Manufacturing has been defined by the Oxford English Dictionary as 'making
things on a large scale by machinery'. This remains an undiscriminating
definition, which tends to ignore the difficulties and complications of
manufacturing.
The complications of manufacturing will essentially depend on the nature of the
manufacturing system, for instance the type of manufacture may be mass
production or batch production, or some combination of both of these types.
Difficulties in planning for and controlling manufacture will then be apparent in
factors concerning the product, the company, the process, the market and supply.
A number of these complicating factors are shown in Table 4.1.
64
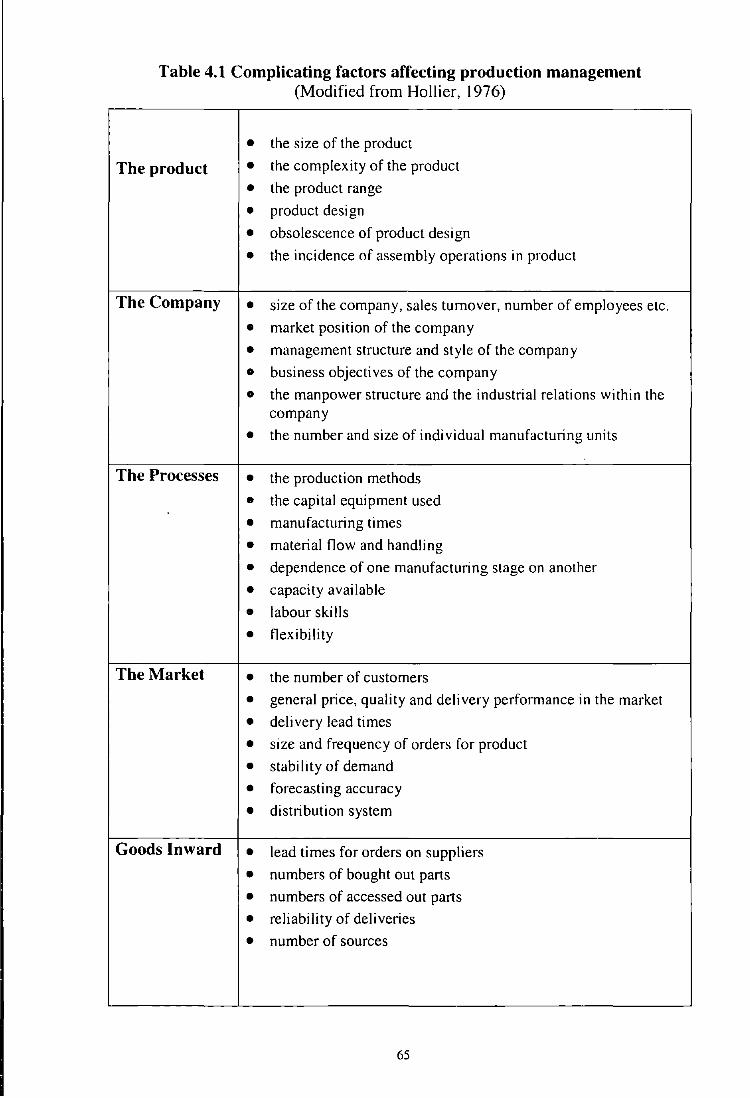
Table 4.1 Complicating factors affecting production management (Modified from Hollier, 1976)
• the size of the product
The product • the complexity of the product
• the product range
• product design
• obsolescence of product design
• the incidence of assembly operations in product
The Company • size of the company, sales turnover, number of employees etc .
• market position of the company
• management structure and style of the company
• business objectives of the company
• the manpower structure and the industrial relations within the company
• the number and size of individual manufacturing units
The Processes • the production methods
• the capital equipment used
• manufacturing times
• material flow and handling
• dependence of one manufacturing stage on another
• capacity available
• labour skills
• flexibility
The Market • the number of customers
• general price, quality and delivery performance in the market
• delivery lead times
• size and frequency of orders for product
• stability of demand
• forecasting accuracy
• distribution system
Goods Inward • lead times for orders on suppliers
• numbers of bought out parts
• numbers of accessed out parts
• reliability of deliveries
• number of sources
65

The above complicating factors contribute to making control of manufacture very
difficult to achieve and clearly many different departments and functions are
involved. Due to this it is vital that there is integration between these differing
functions with recognition of causes and effects. Figure. 4.1 attempts to put this
inter-relationship into perspective. It can be clearly seen that each element must,
therefore, consider the needs of other elements being developed.
66

LONG TERM CAPACITY PLANNING
-
':=sTOCK STATUS AND ... ... CAPACITY PLANS
~SHOP STATUS --,---------' AND BACKLOGS
en 0::: w 0 0::: 0 0 w z z :5 a..
,
CUSTOMER ORDER
PROCESSING
-- ·•
.---------- ·-
PREDICTED LEAD AND BOTILENECKS
1.----1 t MIC AND WORK FORCE CAPACITY ,, , ,, ,,
FORECASTING
---- --------~ STOCKOUTFREQUENCY
_y_ ,,
MASTER PRODUCTION SCHEDULING
REQUIREMENT
STOCK ~-STATUS
,, ,, ,, PURCH
.-----~ REO INVENTORY PLANNING CONTROL
PURCHASING ~
'--------'~
MATERIALS REQUIREMENTS
PLANNING
SHORT TERM SCHEDULING
REPLENISHMENT
I
+- ANDSTOCK ON HAND
~ WIP
PREDICTED LOADS -
QUEUES
I PLANNED
P/0
en Wen !;:eo:: ~~ :::::>0::: oO olzz <t:~ en I wen i=:z O::w o....J a::fu a..o:::
JOB STATUS ,, , ,, ,, ,, r 8C. ~~~~~~~~
SHORT TERM CAPACITY PLANNING
JOB STATUS, QUEUES AND LOADS ... RELEASING DISPATCHING AND
PRODUCTION CONTROL MACHINE AND WORK FORCE CAPACITY ...
Figure 4.1 The interrelationship of manufacturing control
67

4.4 Systems
When considering Figure. 4.1 and the functions which it proposes it is clear that
there is a system for manufacturing activity.
The word system has been variously defined as "a set of inter-connected parts that
form a whole or together" (Homby, Oxford English Dictionary, 1995), "any group of
interacting variables which has some power of regulating itself by its own experience",
(Yickers, 1955) or simply "any set independent variables" (McRae, 1971). McRae also
concluded that it incorporates anything from cuckoo clocks to the solar system. The
definitions become numerous and "resort to Webster's dictionary confuses rather than
clarifies, with a generous offering of some seventeen definitions from which to choose"
(Hoos, l.R., 1976). There is a tendency to see a system as it exists in objective terms.
However, there is also a large subjective element involved. lt may be that different
spectators of the same system have differing concepts of the system, each thinking that
their perception of the system is realistic. This will include a large subjective aspect to
perceptions of reality. This subjectivity was presented by the Open University Systems
Group (1981) who wrote "most writers who have attempted to define 'system' have
ignored this subjective element, or at least not explicitly recognised it." The Open
University Systems Group used, therefore, for their systems courses the following
definition:
"A system is an assembly of parts where:
I. The parts or components are connected together in an organised way.
2. The parts or components are affected by being in the system (and are changed by leaving it).
3. The assembly does something.
4. The assembly has been identified by a person as being of special interest..."
68
Certainly the assembly of elements in Figure. 4.1 comply with the Open
University Systems Group's definition of a system.
With the development of 'Systems Thinking' over the past years, the benefits of
visualising an organisation as a system has received increased appreciation
because management through systems concepts fosters a way of thinking which
helps the manager recognise the nature of the complex problems and thereby
operate within the perceived environment." (Johnson, 1964).
In the past, and to a large extent for many organisations at present, the most
prevalently used approach to operations and problem solving has been, the
"piecemeal" approach, which often leads to catastrophic results or sub-optimal
solutions. Systems theory is concerned with developing a systematic framework,
for describing the general relationships which prevail:-
"An ultimate, but distant goal will be a framework (or a system of systems) which will tie all disciplines together in a meaningful relationship." (Johnson, 1967).
Systems thinking can be seen as embracing a large spectrum of activity
concerned with the operation of all complex systems and machines. Porter (1969)
says
"As technology and society advance we must be concerned increasingly with the behaviour of the 'complete system' and not merely with the behaviour of individual parts of the whole."
Industrial organisation is then cited by Porter as an example:-
69
"The structure of industry consists of a hierarchy of increasingly complex units. For example a single operation in a manufacturing plant can be regarded as an elementary component with an easily defined goal. The plant itself, involving as it does a multiplicity of interacting component operations, may be regarded as a unit with more complex goals than the individual component. A complex of plants and administrative offices, making up a single industrial organisation, constitutes the next higher level of complexity and hence of goals, and the total number of organisations which together form an industrial complex may be regarded as the 'system'."·
The requirement was a basis for understanding and integrating the knowledge
from a wide variety of specialised fields " ... dynamic interaction is the basic
problem in all fields, and its general principles will have to be formulated in all
Systems Theory" (Bertalanffy von, 1952).
Through this has arisen systems theory- "the attempts to develop Scientific
principles to aid us in our struggles with dynamic systems with highly interactive
parts." (Ashby, 1964).
4.5 Manufacturing systems
Most researchers on this subject have worked within the framework of the two
Oxford English dictionary definitions of manufacturing and systems and
produced more definitive definitions of their own.
Dudley (1977) defines a manufacturing system as
"the way in which intimately related manufacturing processes and auxiliary equipment are organised and employed in the production of a specific product or component. " This he sees as different from a production system, which in Dudley's definition is "that which will normally embrace numerous manufacturing systems, that is the fly in which all production processes and
70
production services will interact in an entire manufacturing company or factory unit"
Spur (1971) appears to support this by saying that a manufacturing system is
"a machine tool, (note that he talks in the singular), for transforming blank workpieces into the shapes required by means of a manufacturing process and that a production system is "a plant of machines, devices, etc. for production of certain goods".
He further adds that both systems involve a tlow of material, energy and
information.
Parnaby ( 1979) introduces people into his definition of Manufacturing systems
when he says that it is
"one in which raw materials are processed from one form into another, known as a product, gaining a higher added value in the process. The Output products from one manufacturing system may be the inputs to another. There is therefore considerable interaction. Such systems incorporate particular product dependent applications of science and technology via their processes and associated machinery and are usually complex. They directly involve many people who carry the process know-how and they interact in many complex ways with our social system and physical environment".
Parnaby also refers to the considerable interaction prevalent, the like of which is
depicted in Fig. 4.1 and to the somewhat subjective content of "know-how" or
experience to which the Open University Systems Group (1981) referred.
Some broader aspects were introduced by Hitomi (1978). He defines a
manufacturing system as
71
"a unified assemblage of hardware (including workers, production facilities such as tools, jigs and fixtures, materials handling equipment and other supplementary devices) supported by software which is production information (production method and technology)".
Interestingly Hitomi by his use of the word 'software' begins to acknowledge the
presence of computers and computer aid. 'Information', a word that Parnaby
hinted at, is also specifically mentioned by Hitomi. Hitomi adds
"the system performs on production objects (raw materials) to generate useful products with particular functions and utilities to meet market demand"
thereby recognising the external influence on any manufacturing system. He also
points out a second aspect of manufacturing systems, a transformational aspect,
when he defines them as
"the conversion process of the factors of production of raw materials into finished products aiming at maximum efficiency."
Efficiency is now mentioned by Hitomi as a goal to work towards; implicit in the
word efficiency is measurement and some element of control.
Relevant to measurement and control Hitomi sees a third aspect
"the operating procedure of production, that is, the management system of production".
The management function in this context is the formulation of plans and the
implementation of manufacturing activities to meet objectives and to effect some
acceptable measurement of control over the process. Much the same sort of
procedure that Figure. 4.1 is seeking to illustrate.
72

------------------ - - ---
It would seem that "there is no clear concept of a manufacturing system
acceptable to everyone" and that "much depends on the viewpoint, the nature of
the industry and the type of product" (Parnaby, 1., loc. cit.). Some consistencies
do appear throughout the definitions though, notably that:- a manufacturing
system is a subset of a production system, there are many interactions between
the components of manufacturing systems and with the environment, and there
are many orders of manufacturing systems depending on the number of machines
etc. used. Perhaps most importantly "one essential requirement of all
manufacturing systems, regardless of the types of production processes,
machinery used and business environment, is that of long term stable operation in
the face of continually changing constraints and external disturbances." Parnaby
then goes on to lay that "this creates a need for a supply of information to
facilitate control decision making by management". He further cites that the three
basic functions of data acquisition and sorting, information flow, and systems
control, should be deliberately incorporated (Kochhar and Parnaby, 1977). This
they illustrate in Fig. 4.2 and Fig. 4.3.
73

Manufacturing process aims
Business process disturbances
'Set Points' I'
f
Raw materials resources
I ' • Current
Control logic
-------~decision making
manufacturing MANUFACTU· state variables
RING Customer specification changes
planning allocation procedures
PROCESSES
Sales plans
Recommendations for control strategy for dealing with changes
'------1
MODEL OF MANUFACTURING PROCESS· Allows alternatives to be evaluated (faster than real time)
Forecast targets, demands, performance,
forecast and actual states
MANUFACTURING SYSTEM CONTROL
Assess effectiveness of sales and marketing strategy
~ CONTROL
Market stimulus
Disturbances
Disturbances, e.g. competitors
Feedforward sales information
Figure 4.2 Elements of control
74
future state
Sales forecasting programme
Current state
Inventory levels
Manpower allocations
Production rates
Efficiencies
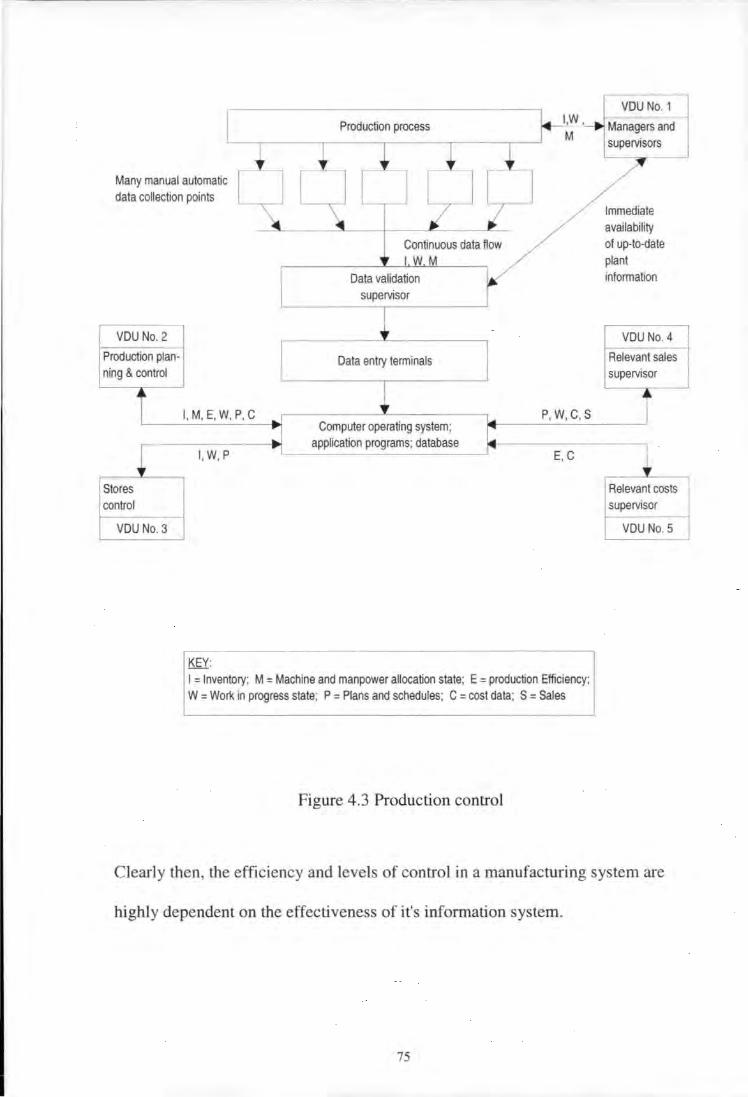
Many manual automatic data collection points
VDU No. 2
Production planning & control
Stores control
VDU No. 3
I, M, E. W, P, C
I, W, P
KEY:
Continuous data flow I W M
Data validation supervisor
Data entry terminals
Computer operating system; application programs; database
I,W , M
P, W, C,S
E, C
I = Inventory; M = Machine and manpower allocation state; E = production Efficiency; W = Work in progress state; P = Plans and schedules; C = cost data; S = Sales
Figure 4.3 Production control
Immediate availability of up-to-date plant information
VDU No. 4
Relevant sales supervisor
Relevant costs supervisor
VDU No. 5
Clearly then, the efficiency and levels of control in a manufacturing system are
highly dependent on the effectiveness of it's information system.
75
4.6 Information
The information handling in manufacturing may be either computer aided,
manual, or a mixture of both. In practice, and based on research undertaken by
the author, the reliability of a significant proportion of this manufacturing
information is questionable. Effectiveness of any piece of information depends
upon its source for the required degree of accuracy; on the information being of
the right type, being reported at the right time, in the right format, to the right
person, and so that the right action can be taken. There is also a need for factual
rather than intuitive information, removing many uncertainties which may occur
through lack of facts.
Basic to any information system is the information itself. When information is
referred to in every day usage one may speak of factual information, valuable
information, reliable information, precise information or true information. It is
beyond doubt that an effective information system, manual or computer aided,
should contain all these adjectives of information. Information is generally
regarded as information about something such as objects, people, times,
situations, events, places etc. Information also involves users, who act on the
information, and informers or advisors.
As previously stated the adjectives 'useful' and 'valuable' when applied to
information are related to a particular user whilst the adjectives 'factual' and
precise' are not. The adjective 'reliable' when applied to information depends on
the personal experience of the user of that particular source of information.
76
An example of this is the following piece of information, "we will make and
despatch some machine tools". This statement has very limited use, it is almost
valueless and contains little information content. However, if the statement is
expanded to : "we will manufacture and assemble and despatch three machine
tools in six months", there is much more information conveyed. The statement
can then be modified still further to: "we will manufacture all the components
required for the manufacture of mac hi ne tools I ,2 and 3 in machine shops A and
B and, based on a component manufacturing lead time of one week per machine
operation, have them ready for assembly in twenty three weeks. We will then
take two weeks to assemble them and one week to despatch them to customer X
in order to meet the delivery due date agreed upon". This latter statement is more
precise than the former two, but whether the information content is useful or
valuable depends on the user and the user's need. If the receiver of such
information is the production manager, or production controller in the
organisation, then it could be both useful and valuable information. If, however
the receiver is in a personal function the information could be useless and
valueless. The value of any information to the receiver of that information, can
therefore be seen to be highly subjective.
4.7 Manufacturing information
Information requirements will to a large extent depend on the manufacturing
methods used and the type of industry. For instance, some industries have
particular requirements depending upon making to customer order or making for
stock or more stringently, manufacturing for the pharmaceutical industry or for
77
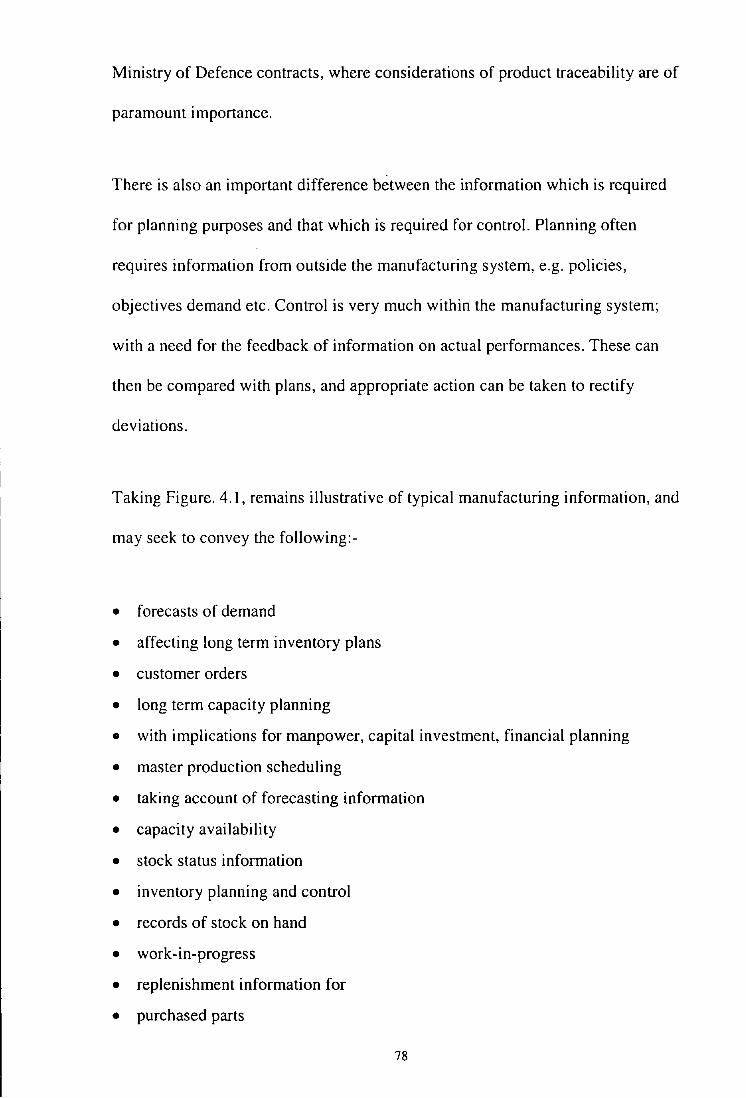
Ministry of Defence contracts, where considerations of product traceability are of
paramount importance.
There is also an important difference between the information which is required
for planning purposes and that which is required for control. Planning often
requires information from outside the manufacturing system, e.g. policies,
objectives demand etc. Control is very much within the manufacturing system;
with a need for the feedback of information on actual performances. These can
then be compared with plans, and appropriate action can be taken to rectify
deviations.
Taking Figure. 4.1, remains illustrative of typical manufacturing information, and
may seek to convey the following:-
• forecasts of demand
• affecting long term inventory plans
• customer orders
• long term capacity planning
• with implications for manpower, capital investment, financial planning
• master production scheduling
• taking account of forecasting information
• capacity availability
• stock status information
• inventory planning and control
• records of stock on hand
• work-in-progress
• replenishment information for
• purchased parts
78

• manufactured parts
• requirements planning
• using inventory information
• basic engineering information from bills of material
• manufacturing lead time information
• and issuing planned orders
• short term capacity planning and scheduling
• machine and workforce capacities and utilisation
• job status
• queue levels
• loads
• priorities and due date performance.
All the above form a general overview of manufacturing information and as wili
be shown later, there is much more detail required for specific manufacturing
systems.
Clearly the need for this manufacturing information is intended for planning and,
as Kochhar and Parnaby (1977) have stated, control. This control can be
production control exercised by personnel based on information flow perhaps
aided by computer software, process control of technological plant, or system
control of Flexible Manufacturing System (FMS) plant.
The nature of production control embraces the activities above and depicted in
Figure. 4.1. Efficiency in production control means taking account of the
circumstances that prevail and ensuring the company's best interests are served.
This has necessitated the need to be able to react to these changing circumstances
with speed of response and certainty of action.
79
There have been many unsuccessful attempts since the seventies at introducing
computer aid to increase the speed of response and certainty of action, which has
in the main been of a package nature. The problem has always been one of
obtaining the right system the particular company. In order to achieve this some
very detailed selection criteria need to be drawn up and adhered to. To
complicate matters further the advances and developments of computer
technology in the nineties have made some of the decisions made in the mid
eighties susceptible to change. Most of the successful attempts have therefore
been of an evolutionary nature.
4.8 Information systems
The term information system was defined by Langefors in 1966 as the
"collection, storage, processing and distribution of infonnation" (Sundgren,
1977). The purpose of such a system is to serve and support the activities of the
host organisation of which they are a part. Information systems have existed
within organisations for as long as people have set up organisations.
As the end to which these organisations were employed changed, along with the
technology of the organisations, so did the information systems requirements.
The title information system is now almost synonymous with computer based
technology.
It has also been shown that the introduction of information systems dependent on
computer technology has changed the organisational structure (Bjorn-Anderson,
1977; Nygaard, 1987; Bartezzaghia et al., 1992). Whilst accepting the
80
inevitability of organisational change, either in a planned or an evolutionary way,
the denigrating statements about this change in terms of rationalisation,
centralisation of decision making, and the resulting distribution of power away
from traditional areas, are somewhat hard to justify. In practice, the
implementation of the PC and the resulting shift back in decision making centres,
has negated many of these arguments.
The once thought of 'computer threat' to the management of organisation has in
fact dissolved like a mirage and information systems are very much an adjunct to
management and not a substitute for it. This presents quite a challenge, because
although it is possible to obtain information more easily and quickly than a
decade ago, it is harder to decide what the information should be. It has made
decision making more critical, the decision maker more professional, and the
consequence of bad decision making more drastic.
Of course, information systems exist to serve and support the activities of the
organisation of which they are a part. Any change in the information systems
must seek to improve the ability of the organisation to accomplish its goals. In
this sense both information and information systems have a value. They also
have costs and benefits to the users. It is the establishing of this value, and the
trading off of the costs with the benefits which have confounded practitioners in
the field since the first practical applications.
81
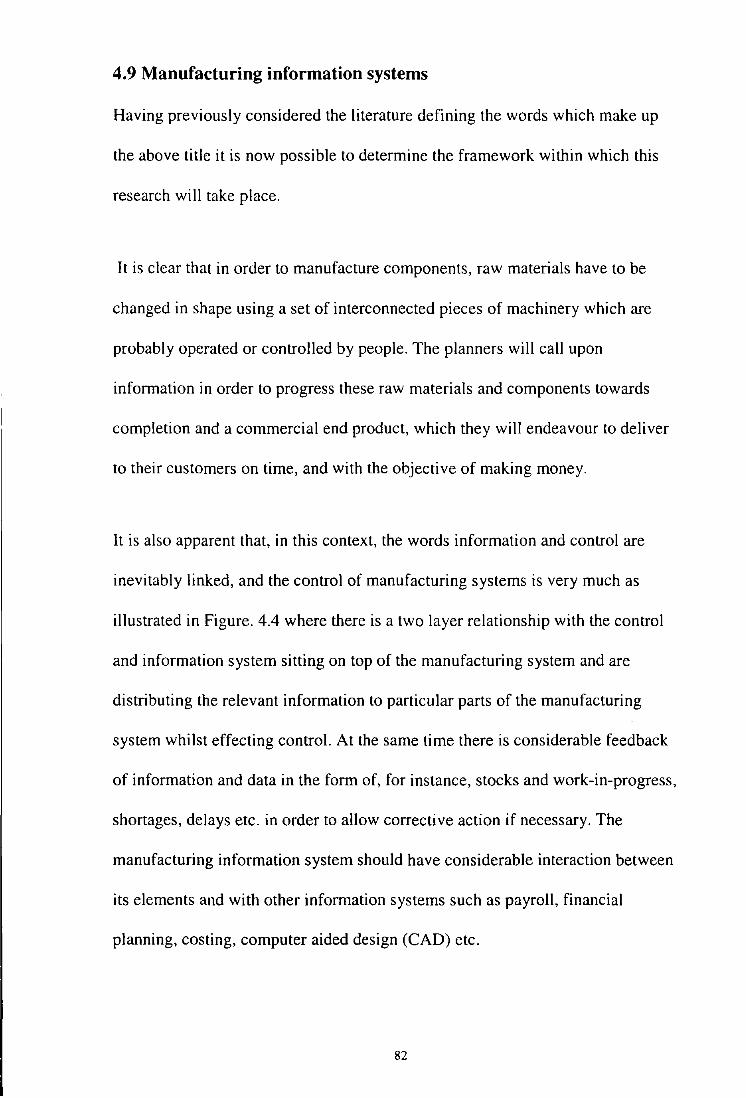
4.9 Manufacturing information systems
Having previously considered the literature defining the words which make up
the above title it is now possible to determine the framework within which this
research will take place.
It is clear that in order to manufacture components, raw materials have to be
changed in shape using a set of interconnected pieces of machinery which are
probably operated or controlled by people. The planners will call upon
information in order to progress these raw materials and components towards
completion and a commercial end product, which they will endeavour to deliver
to their customers on time, and with the objective of making money.
It is also apparent that, in this context, the words information and control are
inevitably linked, and the control of manufacturing systems is very much as
illustrated in Figure. 4.4 where there is a two layer relationship with the control
and information system sitting on top of the manufacturing system and are
distributing the relevant information to particular parts of the manufacturing
system whilst effecting control. At the same time there is considerable feedback
of information and data in the form of, for instance, stocks and work-in-progress,
shortages, delays etc. in order to allow corrective action if necessary. The
manufacturing information system should have considerable interaction between
its elements and with other information systems such as payroll, financial
planning, costing, computer aided design (CAD) etc.
82
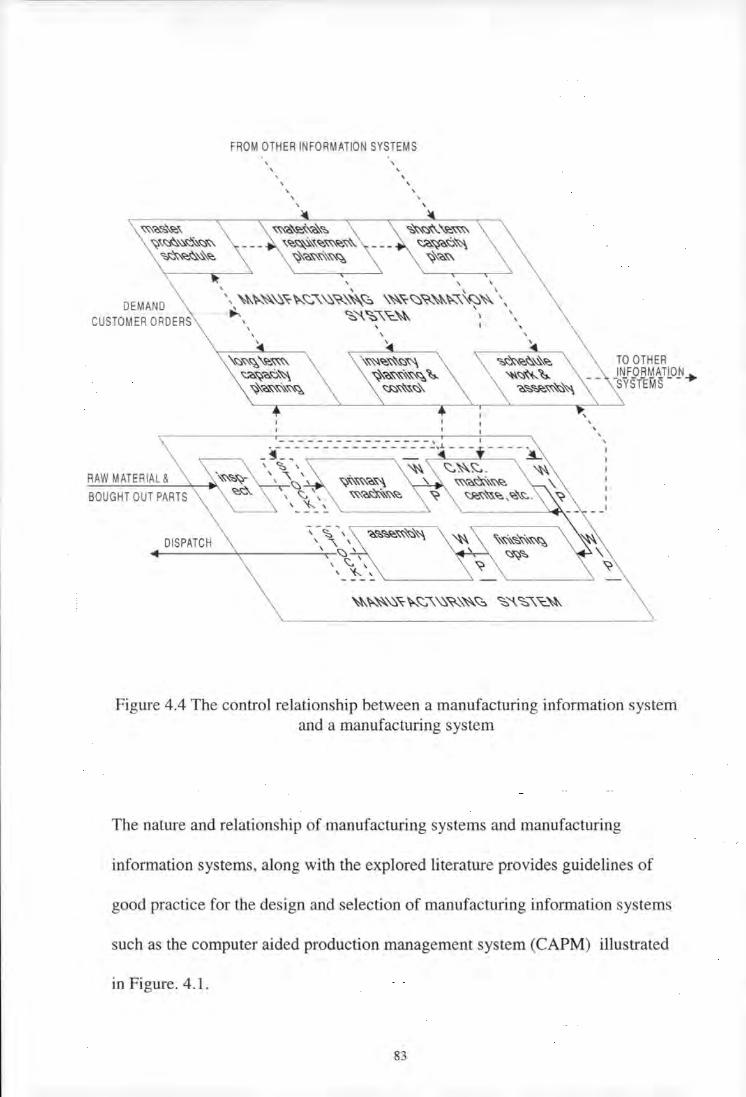
w-.-o.~\.~\ ~v:::t::..~~~~ ~~~~~~
DEMAND CUSTOMER ORDERS
RAW MATERIAL &
BOUGHT OUT PARTS
FROM OTHER INFORMATION SYSTEMS
' '
' ' ' '
' '
~'0.~~-&~ '~~~\\~w-.~~\. ~'0.~~~~
' '
' '
' '
\ -i. ~' '0-~~~w-.~\'\ DISPATCH ' ""\ '
.------>,...------''.-'J ' ' "\ ' "(-... '
TO OTHER JfiF.9BM~TlO_N_. SYSTEMS
Figure 4.4 The control relationship between a manufacturing information system and a manufacturing system
The nature and relationship of manufacturing systems and manufacturing
information systems, along with the explored literature provides guidelines of
good practice for the design and selection of manufacturing information systems
such as the computer aided production management system (CAPM) illustrated
in Figure. 4.1 .
83
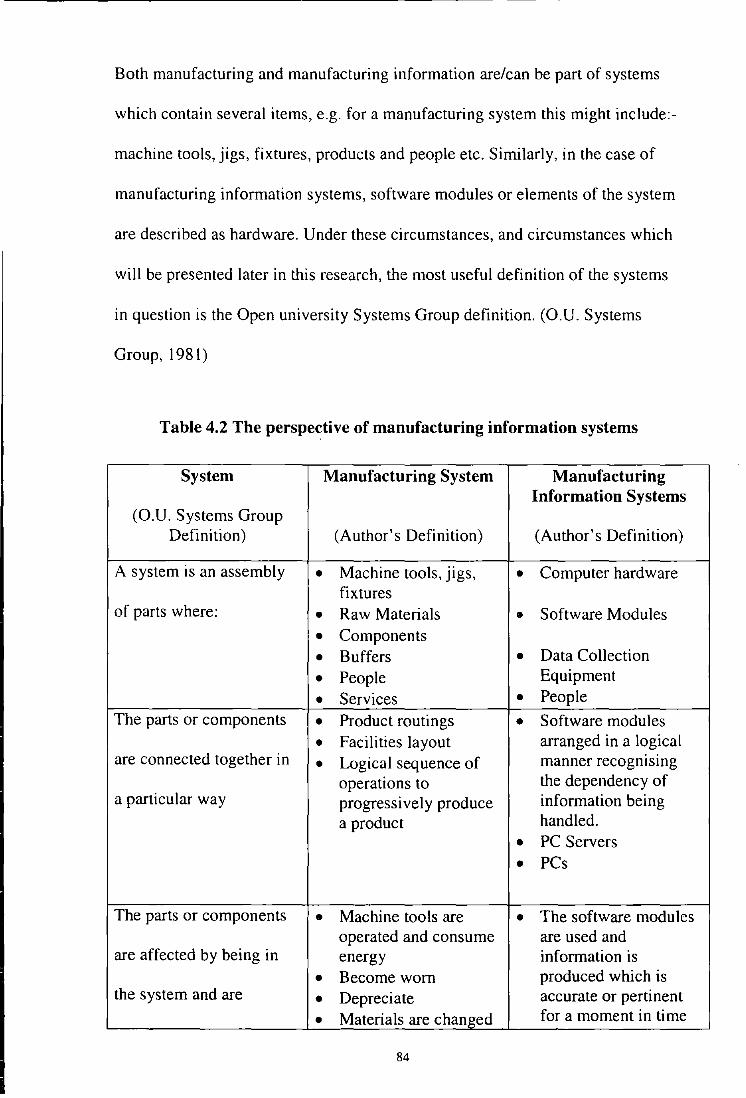
Both manufacturing and manufacturing information are/can be part of systems
which contain several items, e.g. for a manufacturing system this might include:-
machine tools, jigs, fixtures, products and people etc. Similarly, in the case of
manufacturing information systems, software modules or elements of the system
are described as hardware. Under these circumstances, and circumstances which
will be presented later in this research, the most useful definition of the systems
in question is the Open university Systems Group definition. (O.U. Systems
Group, 1981)
Table 4.2 The perspective of manufacturing information systems
System Manufacturing System Manufacturing Information Systems
(O.U. Systems Group Definition) (Author's Definition) (Author's Definition)
A system is an assembly • Machine tools, jigs, • Computer hardware fixtures
of parts where: • Raw Materials • Software Modules
• Components
• Buffers • Data Collection
• People Equipment
• Services • People The parts or components • Product routings • Software modules
• Facilities layout arranged in a logical are connected together in • Logical sequence of manner recogmsmg
operations to the dependency of a particular way progressively produce information being
a product handled.
• PC Servers
• PCs
The parts or components • Machine tools are • The software modules operated and consume are used and
are affected by being in energy information is
• Become worn produced which is the system and are • Depreciate accurate or pertinent
• Materials are changed for a moment in time
84

changed by leaving it in shape or particular
• People have tasks to circumstances perform and earn a • The information state wage, both the tasks changes and the wage change • There are new updates or disappear or exit • BOM runs from the system • Changes in methods of
manufacture
• Changes in hardware due to Obsolescence
• Advancement in technology
0 System capacity problems
The assembly does 0 Transforms work • Produces plans of what pieces into shapes is going to be
something • Material processed manufactured from one to another • Assesses the impact of
• Material changes these plans on shape as it passes from available resources machine tool to (machines & another or one manpower) manufacture system to • Might communicate another with other information
• The product gains systems added value in the • Establishes some system benefit
• Creates a saleable product
The assembly has been • Operations Planners 0 Should be user defined
• Process Planners • Participative approach identified by a person as • Methods towards system design
• Manufacturing I • Choice of system being of special interest Production engineers needs to be made of
• Finance for capital detailed user advice investment proposals • Needs to fit with
e Directors for overall company acceptance objectives
• Be accepted by high level management
85
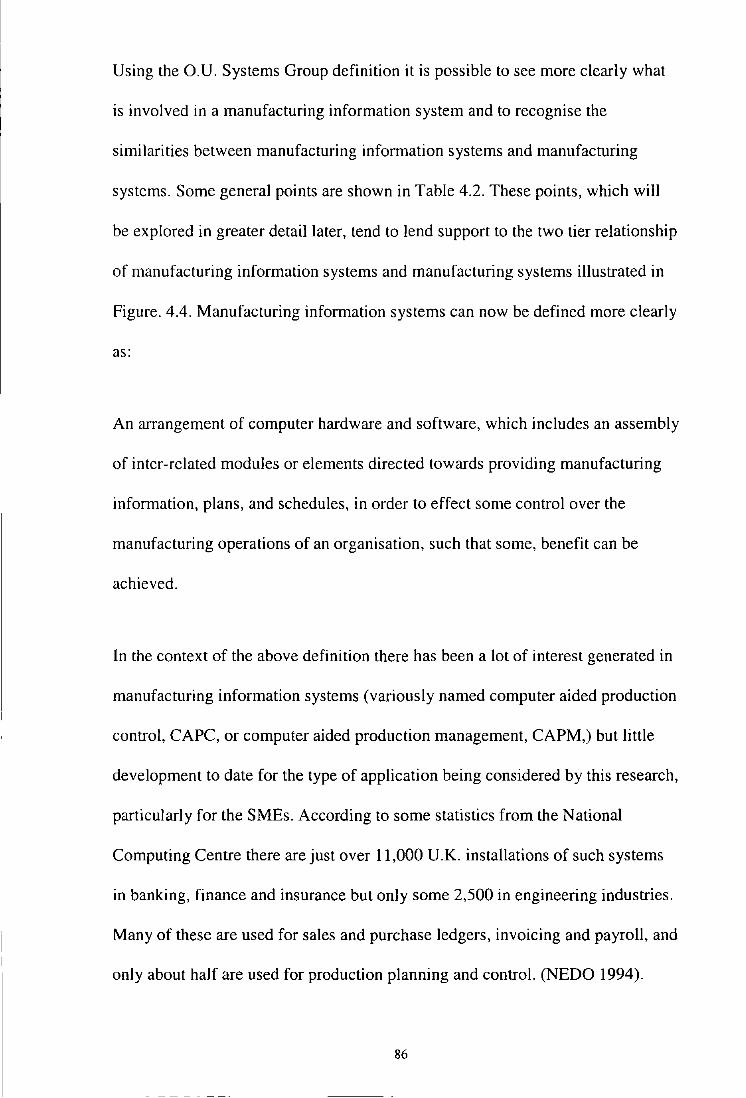
Using the O.U. Systems Group definition it is possible to see more clearly what
is involved in a manufacturing information system and to recognise the
similarities between manufacturing information systems and manufacturing
systems. Some general points are shown in Table 4.2. These points, which will
be explored in greater detail later, tend to lend support to the two tier relationship
of manufacturing information systems and manufacturing systems illustrated in
Figure. 4.4. Manufacturing information systems can now be defined more clearly
as:
An arrangement of computer hardware and software, which includes an assembly
of inter-related modules or elements directed towards providing manufacturing
information, plans, and schedules, in order to effect some control over the
manufacturing operations of an organisation, such that some, benefit can be
achieved.
In the context of the above definition there has been a lot of interest generated in
manufacturing information systems (variously named computer aided production
control, CAPC, or computer aided production management, CAPM,) but little
development to date for the type of application being considered by this research,
particularly for the SMEs. According to some statistics from the National
Computing Centre there are just over 11,000 U.K. installations of such systems
in banking, finance and insurance but only some 2,500 in engineering industries.
Many of these are used for sales and purchase ledgers, invoicing and payroll, and
only about half are used for production planning and control. (NEDO 1994).
86

Most early manufacturing information systems were reflections of the manual
planning and control systems with emphasis on separate systems for the various
aspects of stock control, production planning and scheduling etc.
However, in the last ten years there has been a significant shift towards an
integration of manufacturing information systems. This was clearly instigated by
the interest and introduction in material requirements planning packages which
purported to link with the capacity planning and scheduling. However, the
linking of these modules and the understanding of them within the manufacturing
function is a challenge which has not been too readily taken up (Mantz, 1993).
In order to take up this challenge an understanding at the user end of the market
is needed, built on comprehensive research concerning the system. However,
research lags well behind the state of the art in robotics, computer aided design
(CAD), computer aided manufacture (CAM), and even microprocessor
controlled machine tools. Beyond the Jag in knowledge about the "hardware" is
an equally serious Jag in academic knowledge about the management "software"
that also forms part of these technologies, e.g. MRP, Kanban ... "(Miller and
Graham, 1991).
Miller and Graham suggest that "several types of research dealing with new
technologies should be available, Including information gathering, description
and definition" and that "what is needed are comprehensive attempts to discuss
the technologies in laymen's terms, covering the kinds of issues that aid
management decision making". They further cite examples of technological
87

alternatives that exist and how they should be selected "how should CAD/CAM
and MRP systems be reconciled?" or choices have to be made between different
versions of the same technology, what criteria are suitable to govern the
decisions and how should they be weighted?" and "how are the economics to be
balanced off?" Such questions are of great concern to currently practising
manufacturing managers and directors, and precisely these questions and many
similar ones have been raised during this research
4.10 Conclusions
This chapter has sought to define the basic concepts of manufacturing, systems,
information systems and manufacturing information systems. The chapter has
highlighted that there is no clear concept of a manufacturing system which is
acceptable to everyone and that much depended on the nature of the industry and
the type of products. The chapter also defined manufacturing information
systems as an arrangement of computer hardware and software, which includes
an assembly of interrelated elements directed towards providing manufacturing
information, plans and schedules. This is undertaken in order to effect some
control over the manufacturing operations of an organisation, so that some
benefit can be achieved. This definition is synonymous with the definition of
Computers integrated Manufacturing (CIM), which are considered further in
chapter 5. In the next chapter CIM methodologies and their relevance to the
SME's have been reviewed in more detail.
However, this chapter has also highlighted the complexities of various concepts
and has identified the urgent need for an approach which is compact and yet
88

----------------------
flexible to meet the requirements of individual companies. By using such an
approach small and medium size companies can hope to define and assess the
need for their particular company, develop manufacturing information systems
solutions and implement those solutions.
89
Chapter 5
Review of Existing Information System and CIM Design Methodologies
5.1 Overview
The previous chapter discussed and demonstrated that there is a system to
manufacturing activity. The chapter also mapped the definition of system, as
given by the Open University Systems Group to the various activities in the
manufacturing system and manufacturing information system. It was established
that the efficiency and levels of control in a manufacturing system are highly
dependent on the effectiveness of its information system.
The purpose of information systems in manufacturing is to serve and support the
various activities of a manufacturing organisation of which they are part (see fig
4.3). Therefore, for the effectiveness of any manufacturing information system it
is vital that the various information systems are accurate and relay the
information which is relevant.
Several analysis, design techniques, tools and approaches exist that assist in
designing information system and Computer Integrated Manufacturing (CIM)
systems (see Appendix A). These approaches and methodologies provide tools
and techniques to analyse, map, design and implement systems. This chapter
outlines several of these approaches and tools that are widely used by
practitioners. The chapter also assesses the deficiencies of these, while evaluating
their relevance and effectiveness for small and medium size enterprises.
90
5.2 Introduction
Initially this chapter considers the various information systems analysis
methodologies which are widely used. These include, Structure Analysis Design
and Implementation of information systems (STRADIS), Structured System
Analysis and Design Methodology (SSADM), and Soft System Methodology
(SSM). The chapter will then outline and assess the various mapping tools which
are widely used to map the analysis of existing system, these include, IDEFO
Diagrams and Data Flow Diagrams. The chapter then outlines Computers
Integrated Manufacturing (CIM) design methodologies, to include, Structured
Analysis and Design Techniques (SADT), Graph a Resultats et Activites lnterlies
(GRAI) and Integrated Computer Aided Manufacturing (!CAM). The associated
tools for the CIM approaches are also considered these include, CIM-OSA
modelling framework, GRAl formalism and GRAI Integrated Method (GIM)
formalism.
5.3 STRADIS
STRADIS approach was developed by Gane and Sarson in 1977, who built on
the earlier work done by Myers and Constantine (1974) and later refined by
Yourdon and Cons tan tine ( 1978).
Gane and Sarson's book (Structure System Analysis, 1979) gives a description of
an information systems development methodology, but not in any great detail.
Their approach is restricted mainly to a series of techniques used in a structured
91
fashion, which are applied to the development of an information system.
STRADIS is broken down into four stages:
• Initial Study
• Detailed study
• Defining and designing alternative solutions
• Physical design
The main tool used is a Data Flow Diagrams (DFD). At the initial stage the
existing physical system is analysed and mapped using DFD's. The next stage is
to abstract out the implementation detail from such diagrams to produce a set of
logical system DFD's. The next step is to identify significant areas on the DFD's
that may be considered to change with the introduction of information
technology. These domains of change are reflected on a new set of logical DFD's
and the implementation details are reflected on a new set of physical DFD's.
Gane and Sarson's methodology mainly concentrates on the analysis of systems,
although the methodology is being refined into the area of implementation. The
methodology is conceived as being a methodology applicable to the development
of any information system, irrespective of size and whether or not it is going to
be automated. In practice, however, it has mainly been used and refined in areas
where at least part of the information system is automated. The methodology is
considered relevant in situations where there is a backlog of systems waiting to
be developed and insufficient resources to devote to all the potential new
systems.
92
5.4 SSADM
SSADM (Structured Systems Analysis And Design Method ) is an important
methodology which is in widespread use in the UK Civil Service and
government departments. It was developed by Learmonth and Burchett
Management Systems (LBMS) and the Central Computing and
Telecommunications Agency (CCT A) during the 1970s. Version 4+ was released
in 1996. The framework of the methodology is depicted in five modules. These
modules are further subdivided into stages, steps and tasks:
Feasibility study. The feasibility module consists of a single stage. This stage
constitutes a high-level analysis and design exercise. It is under taken in order to
determine whether or not the system can in fact meet business requirements.
Requirement analysis. This module consists of two stages. Stage l, investigation
of current environment is used to identify the current business environment and
system in terms of major processes and data structures. Stage 2, business system
options, is used to generate up to six possible logical models of systems.
Requirements specification. This module consists of a single stage - stage 3,
definitions of requirements. During this stage more detailed documentation of
requirements takes place.
Logical system specification. This module consists of two stages. Stage 4,
technical system options, produces specifications pertaining to the technical and
development environments for up to six options. One of the option is selected.
Stage 5, logical design, represents the logical design of up to date processes,
enquiry processes and dialogues.
93

Physical design. This module consists of a single stage: stage 6, physical design
which takes the logical specification produced from module 4 and creates a
physical database design and a set of program specification.
SSADM is good structured approach, however, it is mainly used for writing
computer programs and does not deal with the implementation and maintenance
of any given system.
5.5 Soft System Methodology (SSM)
SSM (Soft System Methodology) has been developed by Checkland at Lancaster
University, with the most up to date version, mode 2, being outlined in
Checkland and Scholes (1990). It is based on the belief that when analysing a
system, it has to be viewed as a whole for any kind of meaningful conclusions to
be drawn, as, when decomposed into its parts, it loses something of the whole
which is unreproducible by each of the parts on their own. For this reason
information systems cannot be viewed in an incomplete fashion as purely 'hard'
systems- collections of data and processes- but as more complex 'soft' systems,
within which there is a inseparable human element. Thus soft system models are
better able to represent the complex workings of large, complex organisations.
Soft systems thinking assumes that the purpose of a system is to arrive at more
complex purposes or missions, and not simple goals, as a hard system might set
out to achieve. The understanding of purposes and missions is achieved through
debate with the actors who operate within the soft system.
94

SSM is broken down into seven stages, which are divided into two categories;
these being a) the activities within the organisation which involve people in the
problems, and b) the activities that analyse and resolve the problematic
situations. The stages are as follows :
for a) l. The problem situation : unstructured.
2. The problem situation : expressed.
for b) 3. Root definitions of relevant systems.
4. Conceptual models.
4a. Formal system concept.
4b. Other systems thinking.
for a) 5. Comparison of 'Conceptual models' with 'The problem
situation : expressed'.
6. Feasible, desirable changes.
7. Action to improve the problem situation.
Stages I and 2 are an 'expression' phase during which an attempt is made by the
analyst to build up the richest possible picture, not of 'the problem', but the
situation perceived to be the problem or the urge for change. Stage 3 involves
naming systems relevant to the perceived problem, and preparing concise
definitions known as 'root definitions' of what these systems are, as opposed to
what they do. To assist in forming the 'root definitions', the CA TWOE
mnemonic is applied to determine what it should contain.
95
C: Beneficiaries of the system.
A: Actors of the system.
T: Transformation of the system.
W: Weltanschauung, world view, or viewpoint.
0: Ownership of the system.
E: Environmental constraints in which the system must operate.
Stage 4 consists of building a model conceptualising the systems named in the
root definitions at stage3, and their interactions with one another. Stage 4 model
building is fed by stages 4a and 4b. 4a is a general model of a human activity
system including group behavioural science, etc. 4b consists of modifying or
transforming the model into any other form considered suitable.
The conceptual models are then compared in stage 5 and set against the
perceptions there. The purpose of this comparison is to generate debate in a bid
to progress from a state of understanding to that of further understanding, and
ultimately a solution in real terms. Stage 6 defines possible changes that are
feasible, desirable, and aligned to the ethos and culture of the company.
Stage 7 involves taking action based on stage 6 to improve the problem situation.
This in fact defines 'a new problem' and it too may now be tackled with the help
of the methodology.
SSM involves all 'actors' (all the participants) in the processes to discover the
problems at the heart of the system(s). It is an iterative process, with everyone
involved, particularly the analysts, expected to learn as they go along. With no
96
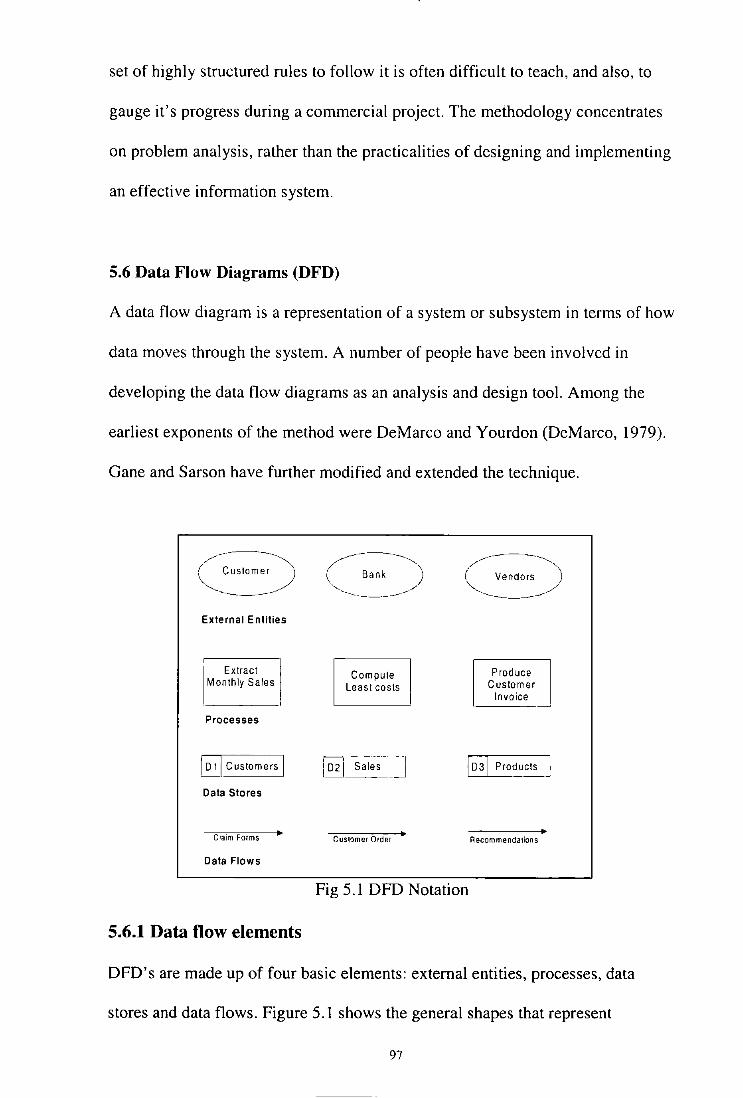
set of highly structured rules to follow it is often difficult to teach, and also, to
gauge it's progress during a commercial project. The methodology concentrates
on problem analysis, rather than the practicalities of designing and implementing
an effective information system.
5.6 Data Flow Diagrams (DFD)
A data flow diagram is a representation of a system or subsystem in terms of how
data moves through the system. A number of people have been involved in
developing the data flow diagrams as an analysis and design tool. Among the
earliest exponents of the method were DeMarco and Yourdon (DeMarco, 1979).
Gane and Sarson have further modified and extended the technique.
/-----..............., --------·~ /~------/ ·,,
(, Customer ) ~ Bank ) ( Vendors "J '-.. / ~' -~--------------- ~-----------
External Entities
Extract Compute Produce Monthly Sales Least costs Customer
Invoice --'
Processes
El Customers I ~ Sales J [ 031 Products I
Data Stores
Claim Forms Customer Order A ecommendations
Data Flows
Fig 5.1 DFD Notation
5.6.1 Data flow elements
DFD's are made up of four basic elements: external entities, processes, data
stores and data flows. Figure 5. I shows the general shapes that represent
97
different elements. Please note that notations used here are those by the British
methodology SSADM.
5.6.1.1 External entities
These are logical classes of things ancVor people which represent a source or a
destination of transactions, e.g. customers, employees, supplier etc. Where a
system with a defined boundary accepts data from another system or provides
data to it, that system is an external entity. It is represented on a DFD by some
form of rounded shape- circle or oval -with an appropriate name as in Figure
5.1. By designating something or some system as an external entity, it is implied
that the entity is not under the control of the system, although it is possible to
influence its behaviour.
5.6.1.2 Processes
A process is a transformation of incoming data flow(s) into outgoing data
flow(s). A process is represented on a DFD by a labelled square or rectangle, as
in Figure 5.1.
5.6.1.3 Data stores
Without making a physical commitment during analysis, it is noted there are
places where there is a need to define data as being stored between processes.
Data stores may be symbolised by a pair of horizontal parallel lines, closed at one
end, preferably just wide enough to hold the name. Each store is identified by a D
98
and an arbitrary number in a box at the left hand end for easy reference. When a
process stores data , the data flow arrow is shown going into the data store.
5.6.1.4 Data flows
Data flow is symbolised by an arrow, preferably horizontal and/or vertical with
an arrowhead showing the flow direction. Each data flow is seen as a pipe, down
which parcels of data or 'things' are sent.
Each data flow is given a description. An identifier can, in addition to the
description, be used to make the data flow as meaningful as possible to the user
who will be reviewing the data flow diagrams.
5.6.2 DFD usage convention
The DFD technique uses a hierarchic structure. The top level data flow diagram
for a system can be exploded or decomposed to become a lower level DFD in its
own right. Each process at a lower level is related back to the higher level
process and this is done by using an identification number. For example, a high
level box numbered 10 can be decomposed into 10.1, 10.2, 10.3, etc. for the next
level and subsequently further decomposed into an even lower level and
identified by a further decimal suffix, e.g. l 0.1.1, l 0.3.2 and so on. This shows
the relationship of process or activity, say 10.3.2 to lO through 10.3.
Detailed rules regarding exception handling, error handling, construction
methods and convention to be used, including arrow checking, etc. can be found
99
in many texts written on this subject, and it is not considered necessary to
describe them in detail here. However, there are certain basic rules that must be
satisfied in DFD construction and these can be summarised as follows:
• a source cannot leak data directly to a data store
• a data store cannot pass data directly to a destination
(in both cases the data has to go through a process to give system control
over itself)
• a data flow into a data store assumes that the process can also take data out
• data flow out of a data store is presumed to be read only
• data cannot flow from one store to another with a process
• no output without an input. Any process that is producing output by itself
should be a source
• one cannot have only input into a process
• each sub-system must be a rectangle on the next higher level
• number of data flows in and out of each sub-system must match the data
flows at the lower level
Although DFD is a good tool which is widely used in industry, particularly by
computer programmers. However, the actual model can be difficult to read unless
substantial care is taken to break down elements and sub-systems into a
manageable size. Computer aid can help in this respect, but so far, almost all
software packages have been developed for structured programming work.
100
5.7 IDEFO diagrams
IDEF (Integrated computer-aided DEFinition) was developed by the US Air
Force to describe the information and organisation structure of a complex
manufacturing system. To date, the technique consists of five basic levels:
IDEFO, ID EFI, IDEF2, IDEF3 and IDEF4. IDEFO has evolved from the original
technique of SADT (Structured Analysis and Design Technique) developed by
Douglas T. Ross, of SofTech.
5.7.1 Concepts of IDEF
The basic concepts of IDEF are a combination of structured design analysis and
human judgement that work best for a manufacturing system. These concepts can
be summarised as:
1. Understand a system by creating a model that graphically shows things
(objects or information) and activities (performed by men and machines).
The model must properly relate both aspects.
2. Distinguish what functions a system must perform and how the system is
to be built to accomplish those functions. The distinction must be clearly
evident in a model.
3. Structure a model as a hierarchy with major functions at the top and
successive levels revealing well-founded details. Each model must be
internally consistent.
4. Establish an informal review cycle to 'proof-read' the developing model
and record all decisions in writing. This ensures that a model reflects the
best efforts of a committed team.
101
An important aspect of model building is establishing the orientation of the
model to be produced. This is achieved by establishing the three aspects of the
orientation:
I. The CONTEXT, which identifies the subject matter of the model
by describing its boundaries.
2. The VIEWPOINT, from which the subject matter will be described
and which governs the emphasis given to the various features.
3. The PURPOSE, or reason for which the model is being created and
which will determine its scope, depth and structure.
Therefore, it starts by representing the whole system as a single modular unit- a
box with arrow interfaces, Figure 5.2. Since a single box represents the system as
a whole, the descriptive name written in the box must be general rather than
abstract. This takes account of the above points and is known as context diagram,
and helps to eliminate any confusion about the viewpoint, purpose etc. of the
subsequent models.
IDEFO is a technique that can be used to specify completely the functional
relationship of any manufacturing environment. ID EFI is used to describe the
relationship between data items in the environment, such that a relational
database model may be specified. IDEF2 is a simulation technique that can be
used to investigate a systems dynamic behaviour. IDEF3 is for process design,
and the latest addition, IDEF4, is an object-oriented approach to manufacturing
102
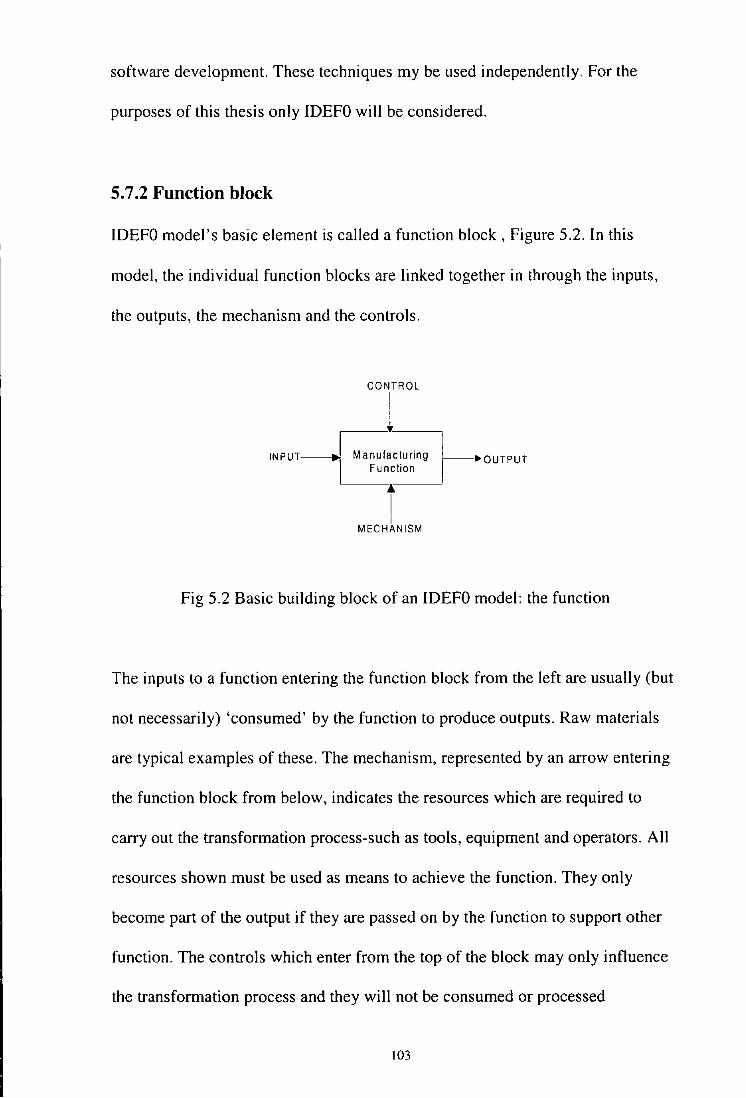
software development. These techniques my be used independently. For the
purposes of this thesis only IDEFO will be considered.
5.7.2 Function block
IDEFO model's basic element is called a function block, Figure 5.2. In this
model, the individual function blocks are linked together in through the inputs,
the outputs, the mechanism and the controls.
CONTROL
I I
•OUTPUT
I MECHANISM
Fig 5.2 Basic building block of an IDEFO model: the function
The inputs to a function entering the function block from the left are usually (but
not necessarily) 'consumed' by the function to produce outputs. Raw materials
are typical examples of these. The mechanism, represented by an arrow entering
the function block from below, indicates the resources which are required to
carry out the transformation process-such as tools, equipment and operators. All
resources shown must be used as means to achieve the function. They only
become part of the output if they are passed on by the function to support other
function. The controls which enter from the top of the block may only influence
the transformation process and they will not be consumed or processed
103
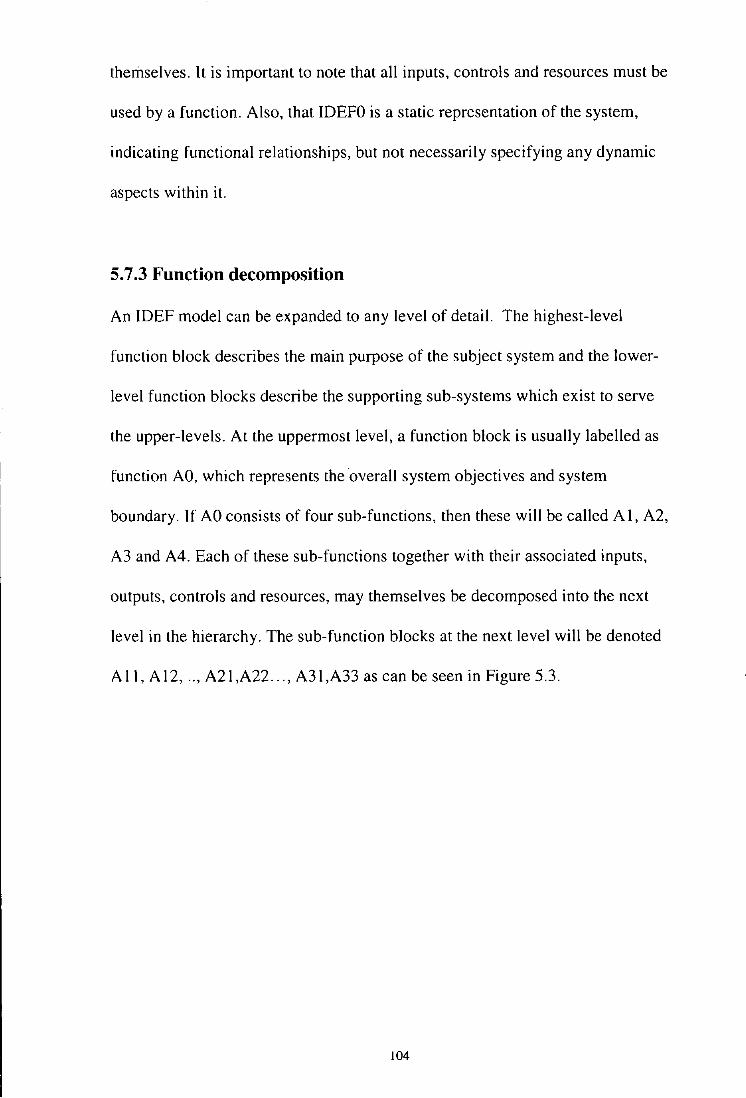
themselves. lt is important to note that all inputs, controls and resources must be
used by a function. Also, that IDEFO is a static representation of the system,
indicating functional relationships, but not necessarily specifying any dynamic
aspects within it.
5.7.3 Function decomposition
An IDEF model can be expanded to any level of detail. The highest-level
function block describes the main purpose of the subject system and the lower
level function blocks describe the supporting sub-systems which exist to serve
the upper-levels. At the uppermost level, a function block is usually labelled as
function AO, which represents the overall system objectives and system
boundary. If AO consists of four sub-functions, then these will be called Al, A2,
A3 and A4. Each of these sub-functions together with their associated inputs,
outputs, controls and resources, may themselves be decomposed into the next
level in the hierarchy. The sub-function blocks at the next level will be denoted
A 11, A 12, .. , A21 ,A22 ... , A31 ,A33 as can be seen in Figure 5.3.
104
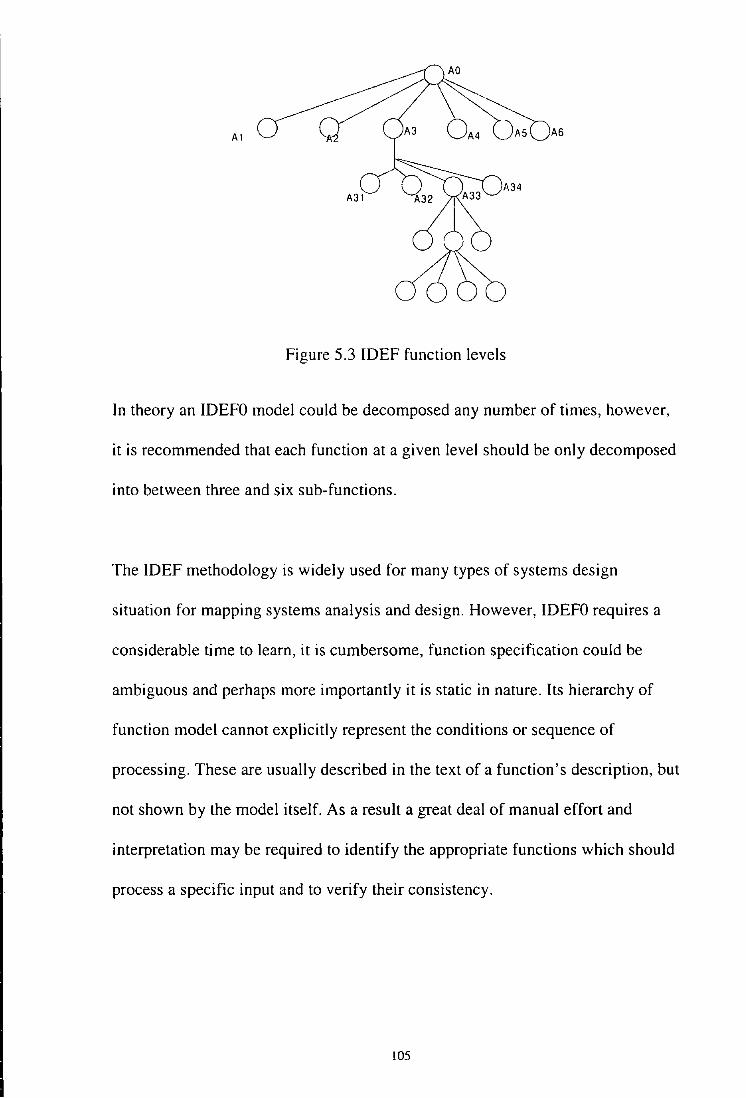
Al
Figure 5.3 IDEF function levels
In theory an IDEFO model could be decomposed any number of times, however,
it is recommended that each function at a given level should be only decomposed
into between three and six sub-functions.
The IDEF methodology is widely used for many types of systems design
situation for mapping systems analysis and design. However, IDEFO requires a
considerable time to learn, it is cumbersome, function specification could be
ambiguous and perhaps more importantly it is static in nature. Its hierarchy of
function model cannot explicitly represent the conditions or sequence of
processing. These are usually described in the text of a function's description, but
not shown by the model itself. As a result a great deal of manual effort and
interpretation may be required to identify the appropriate functions which should
process a specific input and to verify their consistency.
105
5.8 SADT
Structured Analysis and Design Technique (SADT) was developed by Douglas T
Ross, Board Chairman and founder of SofTech Inc. SADT has been further
developed and refined at SofTech as a result of extensive use dating from 1973.
It has so far been successfully applied to a variety of complex systems problems
ranging from real time telephonic communication design, computer-aided
manufacturing and military policy planning. SADT is a diagramming technique
and primarily a methodology for producing descriptions of systems using this
graphical language. It is a top-down methodology (in terms of the design
process) and relies heavily on the use of functional decomposition to identify the
key activities of a system and their inter-relationships. Concepts which from the
basis of SADT can be summarised as follows.
• Complex problems can be best understood or expressed by building models to
define what the problems are. The problems identification is sufficiently
precise to serve as a basis for problem solution.
• The analysis and model building procedure are top-down, modular, hierarchic
and structured to reflect the systematic thinking
• The model is represented by simple diagramming techniques which represent
both 'things' (objects, documents or data) and activities (performed by
people, machines, computers and software)
• The model consists of diagrams, texts and glossary cross-referenced to each
other
106

• Functional model of functions to be performed is differentiated as much as
practicable from a sub equent design model of how those functions will be
performed.
• Analysis method supports a disciplined and co-ordinated team work
• All analysis and design decisions are in written form for open review by team
members.
SADT uses IDEF diagramming techniques, in fact, IDEFO is another name for
SADT diagramming technique.
To make appear the needs ..
\ To Analyze
~ctional
To Pilot Project Planning
/ T: integrate into t\ system
Prototype
t • To implement
and to test
/ Specifications
'------.To o:sign
I m pie menta lion sp ecifica lion
~
Figure 5.4 SADT project cycle
There are five steps in a SADT project (Figure 5.4)
I. Interview: Collect information on the system requirements and experience
of experts
107
2. Authoring: Analyse the system, design the system and document the
results
3. Reading: Review the analysis and design, observe errors and offer
improvements.
4. Revising: Correct and improve the documents
5. Approving: Verify and accept technical content
A SADT project group is composed of :
• Actor (analyst): Person who studies the constraints and needs, and analyses
system functions
• Commentator: Actor who criticises and comments other actors' work
• Reader: Person who reads the diagrams
• Expert: Person who gives information about the system
• Technical committee: Group of persons who criticise the analysis in each
decomposition steps
• Librarian: responsible for all the documents of the project and dissemination
of them
o Monitor: Specialist of SADT guiding actors to practice SADT
• Instructor: Specialist of SADT whose role is to teach actors and
commentators to use SADT.
SADT is an exhaustive methodology which identifies recovers easy-to-miss
details in a complex organisation. However, once the models have been
developed, they are inflexible and require considerable effort to update them.
108

Models developed by an analyst or analysts, may be subjective and therefore
reflect their viewpoint. Time delays, organisational responsibility, i.e. process
control within a box, the flow pattern or path of things, e.g. stores, are not
documented in these models .
GAAI Gr~d
~acro lnconstSiencle
New GAAI Grid
( Initial isation )
Detection of Inconsistencies
DESIGN
lmllalisatron global desrgn
delarled design synthesis
Figure 5.5 GRAI structured approach
5.9 GRAI methodology
GAAI Nets
~~ Mtero
)- lnconsrslencr
New GRAI Nets
GRAI (Graphe a Resultats et Activites lnterlies) was developed by Doumeingts
et al. , 1987. It was specially developed for the design of managerial systems. The
development of GRAI methodology is based on the argument that using
formalised rules in the early phases will reduce errors in design and therefore
109
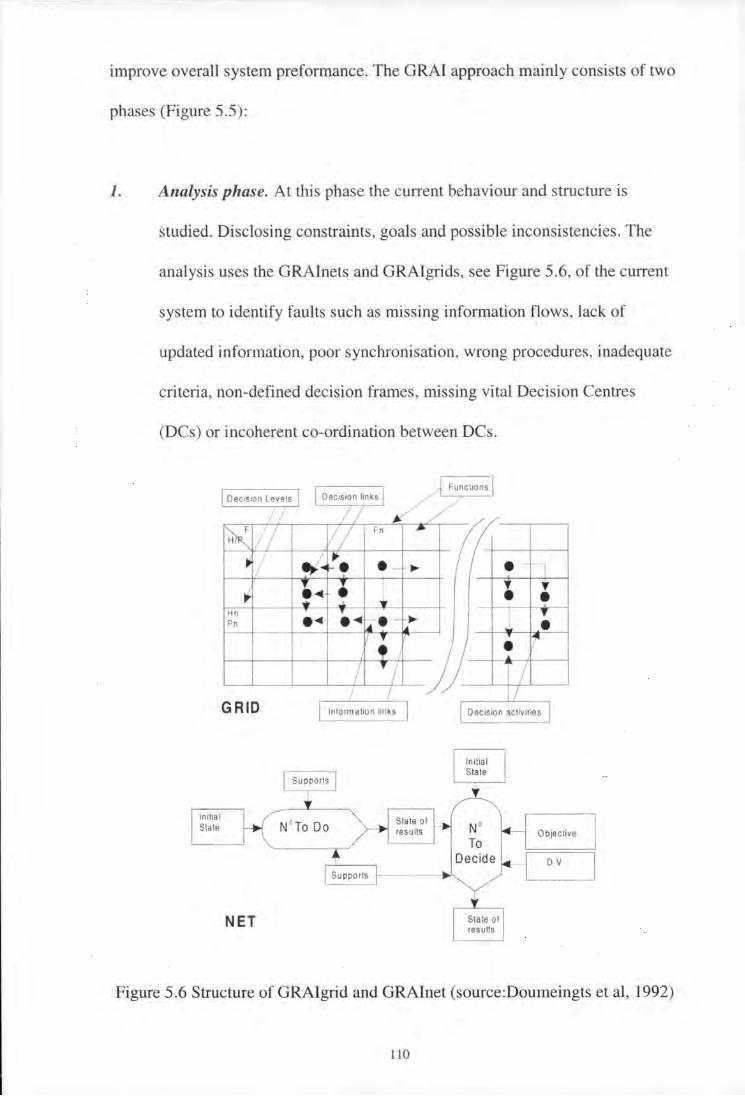
improve overall system preformance. The GRAI approach mainly consists of two
phases (Figure 5.5):
1. Analysis phase. At this phase the current behaviour and structure is
studied. Disclosing constraints, goals and possible inconsistencies. The
analysis uses the GRAinets and GRAigrids, see Figure 5.6, of the current
system to identify faults such as missing information flows, lack of
updated information, poor synchronisation, wrong procedures, inadequate
criteria, non-defined decision frames , missing vital Decision Centres
(DCs) or incoherent co-ordination between DCs.
Hn Pn
GRID
NET
Inform a lion links
I Supports I
Figure 5.6 Structure of GRAlgrid and GRAinet (source:Doumeingts et al, 1992)
110
2. Design specification phase. This phase determines the functional
specification, the basic framework and general behaviour of the desired
system. This stage of GRAI can be further decomposed into three stages.
• Conceptual modelling. A conceptual model of the manufacturing
system under study will provide direction for the design team's work.
A GRAI conceptual model of a manufacturing system consists of three
sub-systems, Figure 5.7. The physical system transforms material into
products, and is co-ordinated by a hierarchy of control or decisional
systems. The information system carries out all data transfers between
and within these systems.
• Structural modelling and functional ~pecifications. The designer
attempts to create a system to fulfil certain criteria, using the
conceptual model as an outline structure. The methodology uses the
same GRAI tools to validate structural models, as using these will
ensure that all control aspects are considered and that the processing of
information required to support the decision making is well
understood.
• Operational-level specifications. This stage is concerned with the
detailed specification of system components.
I I I
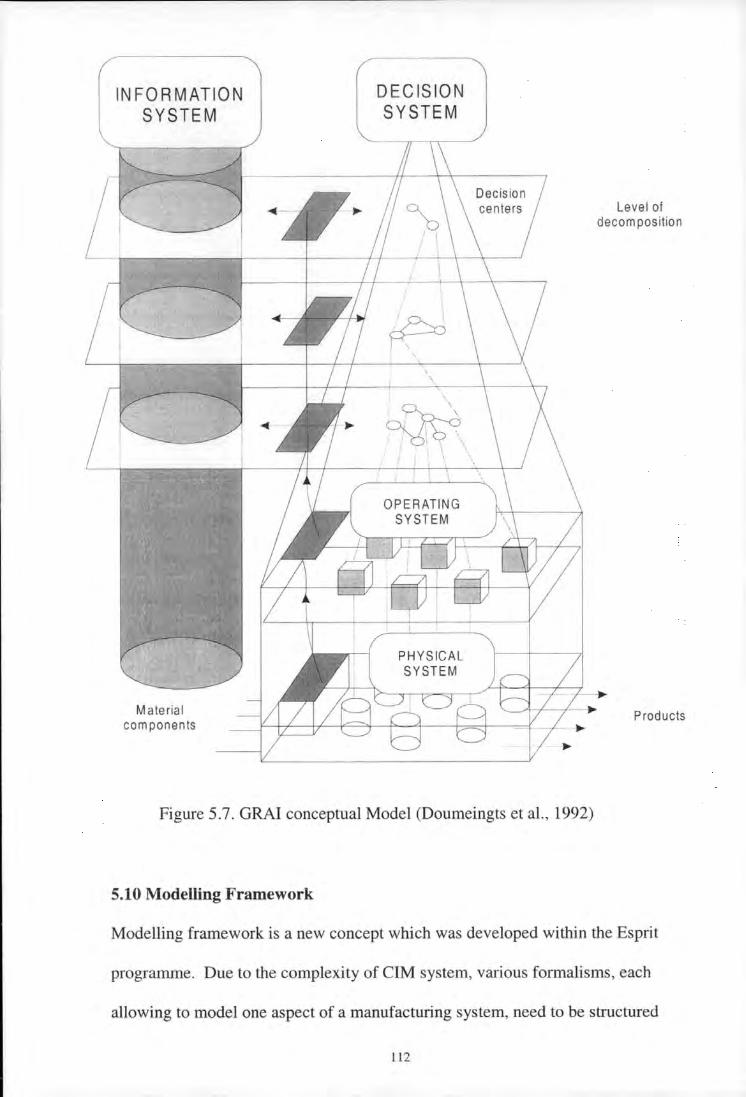
INFORMATION SYSTEM
Material corn ponents
DECISION SYSTEM
' \ \
~-.
Figure 5.7. GRAI conceptual Model (Doumeingts et al., 1992)
5.10 Modelling Framework
Level of decomposition
Products
Modelling framework is a new concept which was developed within the Esprit
programme. Due to the complexity of CIM system, various formalisms, each
allowing to model one aspect of a manufacturing system, need to be structured
112
into a framework in which a complete CIM system model can be built. In a
modelling framework all models needed for the analysis design and development
of CIM systems find their place.
This section briefly lists the three such models to give the reader a flavour of the
available tools and the complexity involved in understanding them and using
them for a useful purpose.
5.10.1 CIM-OSA
The CIM-OSA (Computer Integrated Manufacturing- Open System
Architecture) provides a reference architecture to help particular enterprises to
build their own particular architecture as a set of models describing the various
aspects of the enterprise (function, information, resource, and organisation) at
different modelling levels (requirements definition, design specification, and
implementation description). The reference architecture is separated into two
layers: a generic layer providing generic building blocks (i.e., basic constructs of
the modelling language, their types, and instantiation and aggregation rules) and
a partial model layer providing a library of reusable partial models for some
industry sectors (i.e., partially instantiated models that can be customised to
specific enterprise needs). The enterprise modelling framework provides
semantic unification of concepts shared in CIM system.
The structure of the framework for enterprise modelling follows the principles of
CIM-OSA cube Figure 5.8.
113

Dimension of views
Figure 5.8 CIM-OSA modelling framework
It is structured according to three dimensions:
I) The dimension of genericity. There are three levels of generecity:
• The generic level, which defines the basic modelling constructs for
components, constraints, rules, terms, services, functions and protocols
• The partial level, which contains partial models
• The particular level, which describes enterprise specific knowledge using
constructs of the generic level
2) The dimension of models. There are three types of models:
• Requirement models define enterprise operations to be done and how they
can be done.
114
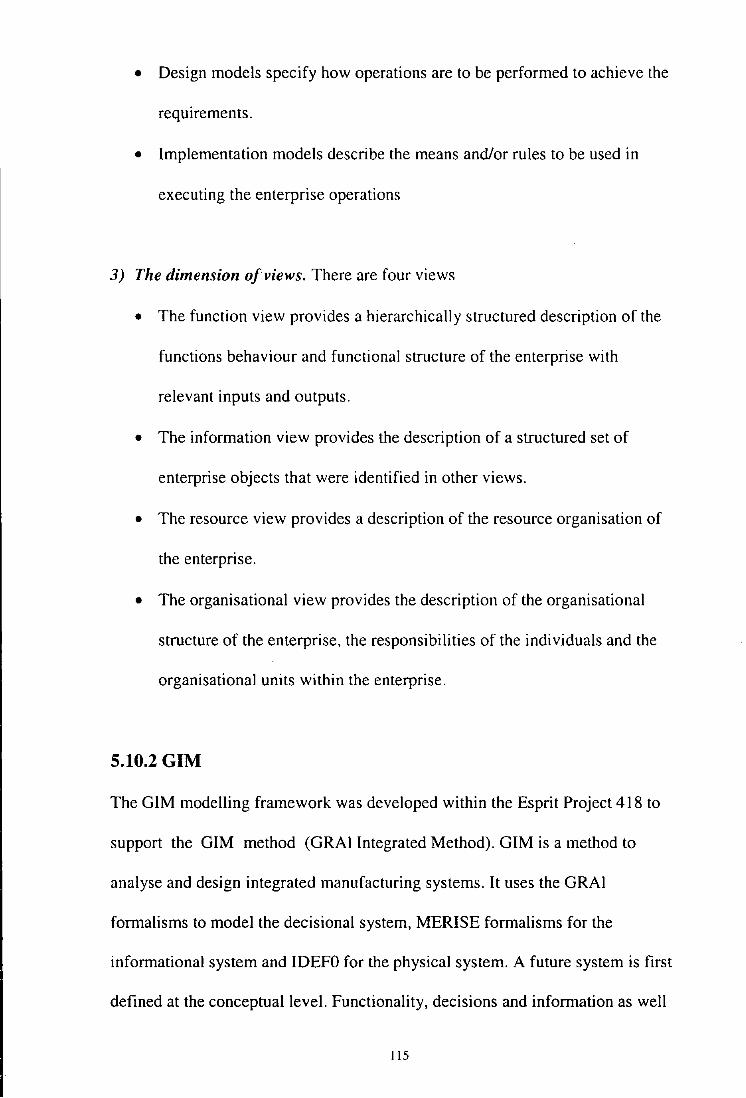
• Design models specify how operations are to be performed to achieve the
requirements.
• Implementation models describe the means and/or rules to be used in
executing the enterprise operations
3) The dimension of views. There are four views
• The function view provides a hierarchically structured description of the
functions behaviour and functional structure of the enterprise with
relevant inputs and outputs.
• The information view provides the description of a structured set of
enterprise objects that were identified in other views.
• The resource view provides a description of the resource organisation of
the enterprise.
• The organisational view provides the description of the organisational
structure of the enterprise, the responsibilities of the individuals and the
organisational units within the enterprise.
5.10.2 GIM
The GIM modelling framework was developed within the Esprit Project 418 to
support the GIM method (GRAI Integrated Method). GIM is a method to
analyse and design integrated manufacturing systems. It uses the GRAI
formalisms to model the decisional system, MERISE formalisms for the
informational system and IDEFO for the physical system. A future system is first
defined at the conceptual level. Functionality, decisions and information as well
115
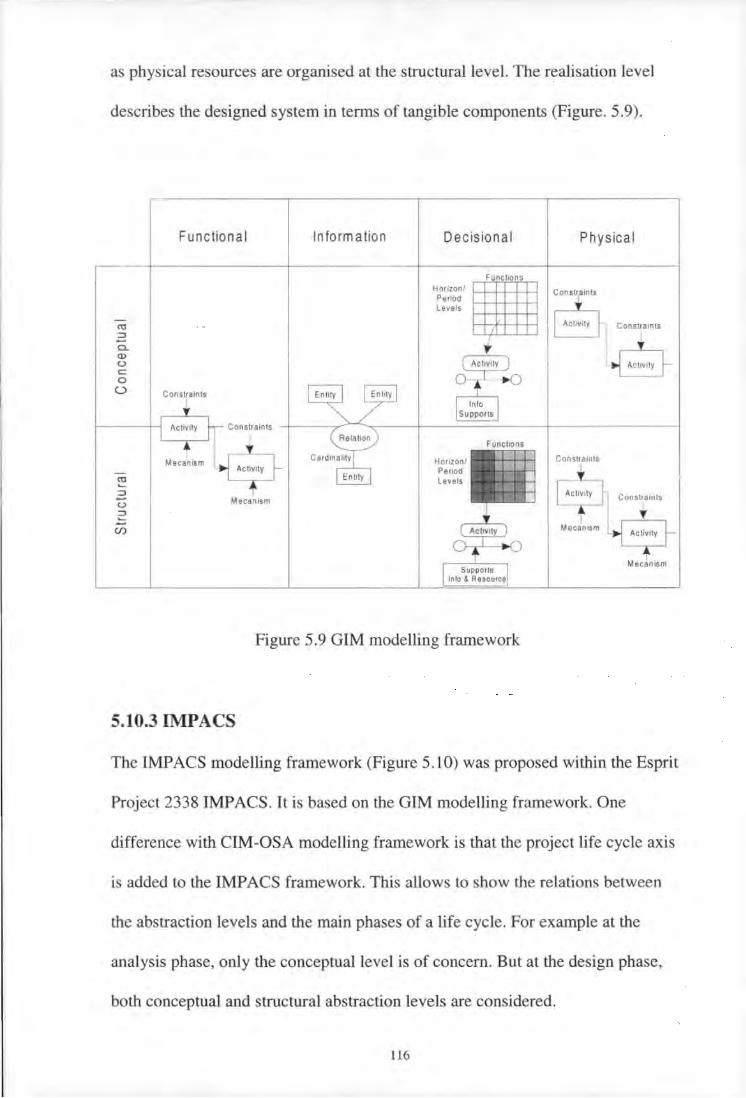
as physical resources are organised at the structural level. The realisation level
describes the designed system in terms of tangible components (Figure. 5.9).
CO ::::J
Cl.. (]) (.)
c: 0
0
CO ..... ::::J
(.)
2
Functional Information
Mecanosm
Decision a I
Horizon/ ~~Functoons Perood Levels
I
.,.
Figure 5.9 GIM modelling framework
5.10.3 IMPACS
Physical
Consuaints
Constraonts
Constraints
Constraonts
Mecanosm
Mecanosm
The IMPACS modelling framework (Figure 5.10) was proposed within the Esprit
Project 2338 IMP ACS. It is based on the GIM modelling framework. One
difference with CIM-OSA modelling framework is that the project life cycle axis
is added to the IMPACS framework. This allows to show the relations between
the abstraction levels and the main phases of a life cycle. For example at the
analysis phase, only the conceptual level is of concern. But at the design phase,
both conceptual and structural abstraction levels are considered.
116
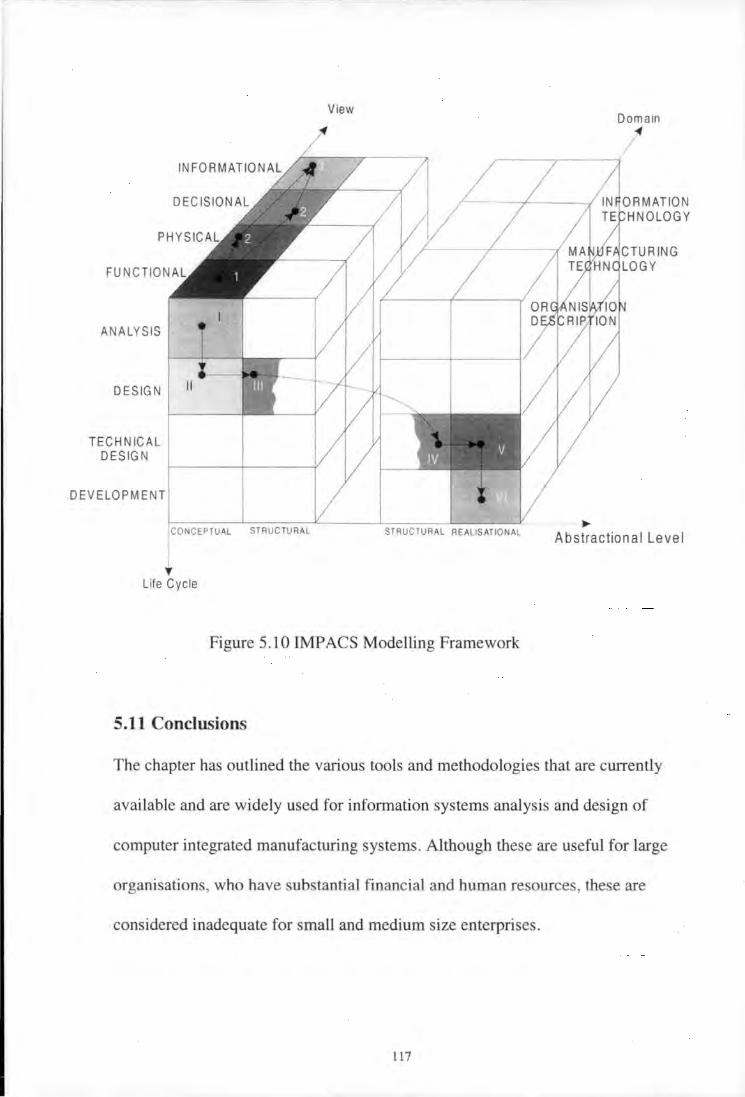
ANALYSIS
DESIGN
TECHNICAL DESIGN
11
DEVELOP M ENT
CONCEPTUAL STRUCTURAL
~ Life Cycle
View
STRUCTURAL REALISATIONAL
Figure 5.10 IMPACS Modelling Framework
5.11 Conclusions
...
Domain ~
TU RING LOGY
Abstractional Level
The chapter has outlined the various tools and methodologies that are currently
available and are widely used for information systems analysis and design of
computer integrated manufacturing systems. Although these are useful for large
organisations, who have substantial financial and human resources, these are
considered inadequate for small and medium size enterprises.
ll7

The tools and approaches are far too complicated to be understood and used by
SME personnel who often have more than one job to do and are racing against
time. No one, above mentioned, methodologies or tools take the practitioners
through the full project life cycle.
To use many of the above tools requires a substantial investment in software
purchases and training of staff, which is normally out of the reach of SME's. To
use the tools effectively requires experience of similar projects, which are not
normally available to SME. And to acquire them from outside consultant
organisation is too expensive for SME's. In any case, the employment of these
methods in SME's will only unnecessarily complicate an already chaotic
environment.
The above arguments further reemphasis the need for an approach which
considers the particular needs of the SME's and is simple enough to be used in
house by the companies.
118
Chapter 6
Requirement of an Approach for Introducing
Manufacturing Information Systems in SMEs
6.1 Overview
This chapter identifies the requirements for a structured approach, that will
enable SME's to introduce manufacturing information systems within their firms.
The chapter reveals that such an approach must be simple to both understand and
use, so that the company's personnel can implement the approach in-house,
without having to hire external consultants. The specification further requires that
the approach must investigate the systems of the whole company, and identify
and highlight any problem areas. These problems may then be tackled, either
with the employment of new technology, or simply by re-organising the
company's administrative and management systems.
The findings presented in here have been concluded from visits to some twenty
five SME's in the Devon and Cornwall region. Structured, and face to face,
interviews with managing directors and senior managers of some seventeen
companies were also undertaken. During this research the author developed and
presented several courses/seminars on various aspect of manufacturing for
SME's in the region. The delegates were mainly managing directors and
production managers. Discussion with these people further enhanced the author's
understanding of the realisation of the problems faced by local SME companies.
119

This resulted in a further extension to the findings presented in this chapter. The
information obtained has not been published before.
6.2 Introduction
While large firms have the financial leverage to utilise leading business
consultants to implement change and/or introducing systems, most SME's cannot
afford this quality of support. It is for this category of company that any
approach to introducing manufacturing information systems, is likely to have
most impact.
The proportion of self-employed people in the considered region is higher than
the national average and it is, therefore, no coincidence that SME's are set to
become the most significant driving force for the local economy (Opportunities
for Growth, TECH Report, 1999). In fact SME's comprise of 99% of businesses
in the region and employ 80% of the workforce (Qurashi, 1996). Defence and
agriculture, the traditional industries that dominated the economy, are 111
decline and will have to enter a phase of restructuring and diversification
(Grapious, 1998). Simultaneously, new industries, e.g. high technology firms,
are in the ascendancy and will provide a key focus for future inward investment
into the region, especially those which operate in the areas identified by the
government foresight programme (Devon and Cornwall TEC, 1998). The
foresight topics are those considered to be the areas with most potential for
growth and impact on society over the next decade. The region's potential for
120
export has not been fully exploited and so one of the keys to the region's future is
export to the rest of the UK and the European Union on a much larger scale.
It is clear then, that although Devon and Cornwall occupy a peripheral
geographical and economic location in the EU, there is a good opportunity to
start to address this. Through vocational training of the workforce, and the
effective and efficient use of technology the effect of these limiting factors can
be reduced. It is only with an aggressive export expansion plan that the long
term future of the region can be safeguarded, and this is only possible with
significant changes including technological advancement.
An overview of the manufacturing environment, infrastructure and relative
position of the region vis-a-vis the European Union, is sufficient to highlight the
various components needed for medium to long term growth and development.
Devon and Cornwall have poor communications and transport facilities, which
combined with geographical remoteness relative to their competitors, translate
into a significant disadvantage for businesses located there. It is therefore, not
surprising, that the export potential of the region is not being fulfilled and
businesses continue to operate within the confines of the region. This means that
market potential is stifled. Any attempt to offset these disadvantages, and change
the situation into one, more favourable for the region would also require business
to produce goods with reduced prices and increased quality. Lefebvre et al
(1990) note that SME's are vulnerable to these disadvantages in a variety of
121
ways. For example, they lack qualified personnel, they have problems finding
adequate capital financing and they lack technological sophistication.
Therefore, in order to survive, SME's need to improve the manner in which they
carry out their business activities. This applies particularly in SME's investment
in new technology, necessary to compete in both domestic and global markets.
Furthermore, the increase in labour costs are requiring SME's to focus on
methods which will help them improve their competitiveness, reduce
manufacturing costs, improve productivity and increase product/service quality
simultaneously.
The introduction of technology in firms should not be viewed as a one
dimensional exercise, since the advantages accruing from it are considerable.
According to a TEC report (Devon and Cornwall TEC, 1999) of the region's
economic future, high technology will provide a key focus for new inward
investment. However, correct implementation is crucial to success. Any
company invariably consists of its employees, and their flexibility and skills are
crucial to current workforce requirements. However, the TEC report
demonstrated that employers in the region are not prepared to 'lose money' by
releasing employees for training programmes. Most training in the region is
conducted 'on the job' with a shift towards computer based and open/distance
learning and it is in this work environment, that any approach for change could
be used to substantial benefit by firms.
122

However, the requirement for an approach does not merely rest upon the need of
business. Other important aspects need to be considered, including need for an
awareness amongst managers for that need itself. The management is also
required to have a sufficient level of competency and experience, to understand
and implement any approach, and overcome initial problems that may arise.
These problems could form one set of possible criteria in evaluating the
feasibility of an approach for introducing manufacturing information systems.
So the question should be extended from not just looking at a need for the
availability of an approach, but also the feasibility of using that approach for the
conditions that exist in Devon and Cornwall.
6.3 Responses to questions
This section reports the results of the visits to various companies, and the
structured interviews with managing directors and other senior company staff.
Interviews were conducted on a one-to-one basis with the author directing the
questions and the interviewees responding to the best of their ability.
The questionnaire utilised for this study consisted of 19 questions of which the
first four were related to the size and nature of the business operation. The first
four questions were, used to contextualise the answers to the remainder of the
questions thus giving a general view of trends at three different levels.
Therefore, one is a view of trends at the general regional level ignoring the size
and type of business, while the second is a look at businesses according to their
size and the third showing trends amongst the different types of business.
123

As stated questions one to four consider the size of the business by the number of
employees, the company turnover, and also the type of business. The rest of the
questionnaire has been analysed question by question and each question has been
stated for ease of understanding.
It was found that there existed a pattern in reply to the question and the size of
the company, in terms of number of employees. Therefore, for the purposes of
the presentation of this study the following categorisation was made as shown in
Table 6.1:
Number of employees in the company Category
Less than 15 Micro SME's
16 to 50 Developing SME's
51 to 100 Established SME's
100 to 250 Mature SME's
Table 6.1 Categorisation of SMEs
Q5. Have you served as an apprenticeship in a trade relevant to your
current business?
This question can only indicate the general level of experience that managing
directors have in their respective industries. The results of the question may be
linked with the type of businesses making it relevant to the more general problem
124
'
that may prevail in a particular industry. The extent to which this question has
been answered with an affirmative would indicate whether individuals who are
running businesses have experience of their manufacturing operations. This is
very useful in the context of the implementation of manufacturing information
systems, since it is often the small details gained by experience which make a
successful change possible. However, this does not necessarily mean that
managing directors who have spent time as an apprentice are also necessarily
good business people. In fact, the research presented in this chapter has shown
that generally the senior managers from the manufacturing operation experience
background are poor at developing and executing business and marketing
strategies.
The answer to this question varied from the type of industry and size of the
business. Almost 90% of the managing directors from the mechanical
engineering, with less then 15 employees replied that they had spent time on an
apprenticeship. Whereas, 38% of the managing directors from the electrical
engineering background, irrespective of the size company, replied that they had
not spent time as an apprentice. It was generally found that a high proportion of
managing directors from small SME's i.e. less than 15 employees had spent time
as an apprentice. The higher the number of employees the less time senior
managers had spent on apprenticeships. This indicates a clear pattern between the
size of a company, in terms of number of employees and the background of
apprenticeships of the managing director.
125
Overall, the study found that 56% of current managing directors had served
relevant apprenticeships. This shows that almost half of the managing directors
interviewed had not served apprenticeships and were not fully aware of the
manufacturing operations and processes of their businesses. Therefore, a
structured approach which identifies and maps the manufacturing processes of
the business would be of benefit to this group. An information systems
implementation approach, for analysis of existing systems, described in chapter
5, would be most suitable for identifying the manufacturing processes. As
managing directors without apprenticeships would tend to have less knowledge
of the businesses and therefore could offset this disadvantage with a structured
approach.
The answers to the question also shows that the experience gained from an
apprenticeship is typically passed from practical experience rather than the
theoretical understanding of the processes. This can hinder the introduction of
new technology because it was discovered that this group of people are often
reluctant to change and find it difficult to adapt to the new approaches.
Therefore, any new approach should appreciate this problem and should involve
the people who would be using the systems from the beginning.
The main beneficiaries of a structured approach would be the senior managers,
who would armed with the experience of all aspects of their business through an
apprenticeship. This group forms a large number of the heads of businesses.
126
Q6. Do you have a degree, HND or similar higher qualifications?
The replies to this question would indicate a level of literacy and ability to
understand theoretical concepts and procedures. This is a crucial measure to
assess the level of complexity that any approach should adopt.
The replies varied according to the size of the company and background of the
managing directors. Generally, 64% of managing directors replied that they had
some kind of higher qualifications. However, it was notable that 95% of the
managing directors from the apprenticeship background and had basic
qualifications of O'Levels and CSE's. Also, 25% of the managing directors from
the micro-companies had some kind of higher qualifications. The 38% of senior
managers from the growing SME's replied that they either had higher
qualifications or they were in the process of gaining higher qualifications on a
part-time basis. Eighty% from the established SME's and 96% from the mature
SME's replied that they had higher qualifications.
It was also noted that, generally, managing directors from micro SME's and
developing SME' s had qualifications relevant to the their industrial sector.
Although, senior managers from developing SME's did show that they were
interested in gaining qualifications in other areas of the business i.e. Marketing,
IT etc. Senior managers from the established SME's and mature SME's had
people qualified in other areas of the business as well as the those relevant to
their industrial sector. It was rare to find senior managers with more than one
higher qualification in different areas of the business.
127
The analysis of the replies has shown that there is a clear pattern between the size
of the company and achievement of higher qualifications by the senior managers.
As the 89% of companies in the Devon and Cornwall region fall in the category
of micro-companies (Qurashi, 1996) the approach being developed should give
due regard to the ability of the senior managers. And the approach should as
simple as possible to understand and use.
Q7. Do you have any professional qualifications i.e. membership of
Chartered bodies or Royal bodies?
This is a very important question since many of the qualities needed in gaining
the above are also required for the comprehension, implementation and follow up
of a systems change through using a systems implementation approach. Thus the
suitability and level of sophistication of this approach can be partially assessed
for the region. Professional qualifications demonstrate amongst the holders, a
general willingness to excel in their particular industries, and to gain from the
experience of other member individuals to remain at the forefront of any new
ideas and or technology.
Only 20% of the managing directors had any professional qualifications or
memberships of professional bodies. It was surprising to note that there was
general ignorance of these bodies and what they could offer to their members.
There was also a fear amongst senior managers of being rejected.
128
It can be concluded from the above that there is a lack of awareness of help
available to SME's through professional bodies and hence lack of awareness of
advancement in the various industries of the region. The new approach should
highlight the sources of knowledge and help that could be available to SME's.
QS What is your main objective for your company growth and profit
maximisation?
The question helps to expose the general psychological framework and attitudes
of businesses in the region. The answers to this question could provide the
author with an indication of how an approach will be utilised in different ways,
depending on the nature and priority of the managing director. Firms with short
term profit maximisation or similar priorities will inevitably tend to shy away
from investment in areas, which may not provide immediate short-term gains, but
may prove lucrative in the long term. However, those businesses whose horizons
are not limited to maximise profits in the short/medium-term, are more likely to
invest in the new technology which would help them improve their market
position in the medium/long-term.
The results also reflect the economic conditions that the businesses were
operating in and this varies amongst different industries. It was concluded that
most managing directors took an optimistic, though cautious route, opting to try
for steady growth in the current economic climate. 62% of managing directors
opted for steady growth strategies in the medium term, while only 12% were
concerned with immediate profit maxirnisation. The 10% of the companies did
129

not think that there was any potential for them to grow or that investment in new
technology would necessarily bring them any benefit. Only 16% of the
companies were planning for the long-term.
The replies indicate there seems to be a general fear of the growth of the
economy and that majority of the companies in the region are not aggressive in
selling their products. There was also pessimism about the long-term survival of
companies and hence reluctance in investment to employ new technology.
The new approach should contain some measure of the cost-justification and
return on the investment for managing directors. The approach should also
contain elements which improve the productivity and competitiveness of the
company without huge investment in new technology.
Q9. What are the problems in your manufacturing department and how do
you intend to overcome these problems?
This question is related to the introduction of manufacturing information systems
in overcoming the manufacturing problems. As such, the results provide
important information about whether or not businesses see the restructuring of
manufacturing processes and information systems as well as introducing new
technology as relevant to their needs.
The managing directors indicated the following problems with their
manufacturing:
130
• High lead times
• High Work in Progress (WIP)
• Poor Quality
• Stock control problems
• Lack of quality labour
• Poor Planning and scheduling
• Lack of co-ordination between various departments
• Absence of new production machinery due to financial constraints
On discussion with the managing directors, 59% said that they thought that by
employing new technology they may be able to overcome some of the problems.
However, only 18% said that they thought that there manufacturing information
systems required restructuring or that their manufacturing processes needed to be
improved. The remaining 23% said that they lacked time and personnel to
identify the causes of the problems and how to overcome them, these were
mainly managing directors from the micro companies.
It can be concluded from the answers that there was general awareness amongst
the managing directors about the problems. However, only 18% thought that an
information system approach was required to identify the problem areas. This
indicates that 59% of the managing directors did not know how investigate the
causes of problems and identify possible solutions.
131
The new approach must take a systematic step by step approach to identify the
causes of the problems and highlight them in simple and yet meaningful way to
the senior managers.
Q 10. Do you carry out training of staff at a regular interval (at least
annually) within your Company and do you use any management or other
tools?
The aim of this question was to measure the commitment of various businesses to
training and general use of management tools. The question also give another
measure of the awareness or ignorance cif management techniques of managing
directors in the region and how well they could understand and apply any new
approach. It was found that only 38% of companies gave formal training to their
staff and only 20% of the companies gave regular training. However, 70% of the
managing directors stated that they used some kinds of tools and techniques to
manage their businesses. The other 30% thought that the use of these tools was
either waste of time or they considered that there were no relevance for their
needs requirements.
24% of the companies did not think that they needed to give any kind of training
to their staff and the remaining 38% said that they would like to give training but
it was either too expensive or they could not afford the time to send people on
courses.
132
The above facts show that 76% of the companies in the region are potential
beneficiaries of the new approach. It can be concluded from the above facts that
for the applications where management systems are in place, an approach for
implementing manufacturing information systems will only enhance the
performance of that business. It may also be concluded that those managing
directors who are ignorant of these various management tools would almost
certainly benefit from the introduction of this approach.
However, for an approach to be utilised by the most companies in the region, the
approach must require little or no training to be effectively used as 38% of the
companies indicated that they could not afford to send people away on training
courses.
Q 11. Do you have long term plans to introduce new technology to your
business?
Answers to this question yield two important pieces of information concerning
both the need and the relevancy of introducing new approach. Integrated
together, the results from this question demonstrate the trends of business style at
the various firms investigated. By highlighting any shortcomings in terms of
planning techniques and more specifically, whether or not they have any plan or
the right attitude for the introduction of new technology, relevant conclusions can
then be made.
133
Although the majority of firms had a specific long term plan for marketing, it
seemed that approximately 55% of the firms had no proper structured plan for
dealing with the manufacturing problems aspects of their business. Only 35% of
the companies had, mainly from the developing and established SME's, some
plan to introduce new technology at the shop-floor level. 58% of the mature
companies replied that they were looking at Enterprise Resource Planning (ERP)
systems. Even those companies that had planned to introduce new technology
had not identified the requirement in a structured manner. Instead, a laissez-faire
approach was adopted by 47% of firms towards both aspects of their business.
This highlights an enormous gap in the manufacturing operations of these
businesses, introduction of new technology and a structured planned approach for
identifying the need and finding appropriate solutions. It is widely known that the
companies that do not employ a structured approach often lead to unsuccessful
implementation of technology and systems (Qurashi, 1996, Merideth 1984,
Mohanty, 1993). Therefore, there is justification for a structured approach to be
adopted.
Q12. In general, how would you describe the style of manufacturing
planning activities within your company?
The aim of this question was to establish the general use of established
techniques being utilised in the manufacturing planning. This will guide the
development of any new approach to the level of detail of the approach should
adopt.
134

The number of companies with some form of established techniques for
manufacturing planning were shown to be in a minority of 46%, and out of this
percentage of companies using computer as a tool for planning were found to be
20%. This percentage does not, however, represent the use of purpose written
software for planning and scheduling, as some companies used spreadsheets for
their and scheduling activities. While regular discussions seemed to form the
majority of planning activities in the remaining 54% of the companies.
Again, there exists a clear divide between the various SME types. Micro SME's
did little formal planning, with most of production decisions being made by the
production manager on ad-hoc basis and as and when the need arose. Although,
this was found to be relatively effective it was dangerous culture to have
especially if the company had plans to grow in future. The new approach should
address this need of micro companies. Developing SME's were found to be the
most chaotic when planning and scheduling for manufacturing and had the worst
records for delayed orders, poor quality products and high work in progress
(WIP). On analysis it was discovered that the reasons for this were rapid growths
of the company with little attention paid to the improvement to manufacturing
systems. In other words manufacturing planning systems did not improve with
the growth of the companies.
Established and mature SME's were found to be better at the manufacturing
planing and employed some specialist software and personnel. However, it was
135
discovered that many of these companies and poor implementation of the new
technology and systems.
It can be concluded from all the answers to this question, that all SME type
companies can benefit from a structured approach. Although, the use of the
approach for the companies would be different depending upon the specific
needs of the companies.
Q13. What kind of new technologies do you employ in your business ?
Although almost all of the companies stated that they had some form of computer
systems for administrative work, e.g. word-processing, accounts, etc. Only about
52% of the companies said that they employed some kind of technology for
manufacturing, these technologies ranged from CNC machines to CAD and
networking. The remaining 48% of the companies employed no technology for
manufacturing either for planning or at shop-floor level.
On further investigation the companies with no current use of technology in
manufacturing, the following different reasons were noted:
• Lack of know how about technology
• Lack of finances
o Lack of understanding on how to implement new technology
• Lack of knowledge of available technology
• Lack of time and know how to investigate new technology
136
The above and further points are discussed in detail, later in the chapter.
However, it can be concluded from the above facts that there is an urgent need
for an approach that can guide SME's in the region to identify the need for
technology and guide the companies in implementing the technology. Given the
shortage of skilled labour, and the increased competition from the rest of the UK,
identified in chapter 3, there clearly is a need for companies to invest in both core
and in peripheral technologies that are crucial in areas of intense competition,
and vital for further growth.
Q14. Generally was this new technology (as identified in Q13) introduced to
exploit future possibilities or deal with current problems?
This question was addressed to the companies who had invested in some form of
technology for their manufacturing, either at the shop floor level or at the
planning and scheduling level. Sixty % of the managing directors replied that
they introduced technology to improve production and quality in the short to
medium term. While 30% said that either they thought they needed technology or
they were pressurised by their customers to employ technology. However, only
10% said that they employed technology to improve their planning and
scheduling.
Majority of the micro SME managing directors said that they were pressurised
into introducing new technology by their bigger customers. Whilst majority of
the established companies introduced technology to improve their quality.
137
Mature companies were planning for long-term as well as dealing with short term
issues when introducing new technology.
The answers to this question throw light onto the attitudes of managing directors
towards the use of technology and its role in the workplace which need to be
considered when designing any new approach. It was found that firms tended to
employ new technology to overcome short-term problems while at the same time
hoping that IT will give them some future benefits.
QlS Overall, how successful was the new technology in meeting the
objectives you defined in the last question?
The aim of this question was establish whether there was careful planning done
to identify the need for new technology and whether systematic approach was
adopted to implement the changes. As it is not the technology by itself that can
bring added benefit or give competitive advantage but the right technology and
the right use and implementation of the technology that can give advantages
(Julien, 1995).
Out of all the companies questioned only 26% said that new technologies met all
the objectives for which they were purchased. 40% said that the introduction of
new technology gave some benefit to their business, while 20% said that the new
technology gave them no real added benefit. The remaining 14% said that
introducing new technology had the opposite effect i.e. it made situation worse
for them.
138
It can be concluded from the above that 74% of the companies were not entirely
happy with the investment in new technology. And confirms the fact that the
successful introduction of technology can only be realised if the need had been
clearly identified prior to any investment. Hence the need for an approach that
guides the companies from identifying the need to implementing the technology.
Q16 How was the implementation done, step by step or sudden and was there any
pre and post implementation testing?
Even a correctly identified need for the technology, and the subsequent
investment in that technology can not guarantee successful return on investment.
Implementation must be carefully planned to achieve this (Geisler, 1992). The
aim of this question was to identify how much of the lack of benefit from
introducing new technology, identified in the previous question, can be related to
the poor implementation plan.
All the firms using a gradual and carefully planned implementation process
succeeded in introducing the technology effectively and efficiently. The
unplanned and Iaissez-faire approach was shown to be ineffective in the
implementation of new technology, yet a substantial minority of companies
(33%) used this approach. Moreover, it is found that nearly half of the companies
surveyed had no system of pre-implementation testing and 38% either failed in,
or did not conduct post-implementation monitoring and control. The lack of
return from the investment was reported by companies of all sizes.
139

-----------------
A new approach that defines and guides companies for the most effective way of
implementing new technology would be of benefit in this situation where
confusion exists as to the most effective way of implementing new technologies.
The approach must also contain steps to ensure that pre and post implementation
testing is carried out to a satisfactory standard.
Q17 Did you have any past experience of introducing new technologies ?
It was determined that 70% of companies in the mechanical and electrical
industry had little or no experience in introducing new technologies, this also
proved to be the industry where the introduction of new technology either had
adverse affect, or gave no real value. Eighty five % of rest of the companies said
that they had no experience. However, all companies considered that they had
received some help from the suppliers of their technology. 95% of all companies
stated that they did no company wide study of the company's processes and
systems before investing in new technology.
The extent of supplier support or back-up was severely lacking, with only 47% of
businesses receiving satisfactory levels of support. Other external support, i.e.
from government bodies e.g. chambers of commerce, business links etc, for the
companies was negligible with only 16% receiving support from other sources.
Furthermore, only 47% of managing directors regarded themselves a skilful in
change management.
140

It can be concluded from the above that the companies did attempt to introduce
define the need, purchase the technology and implemented it without any
experience and little help from supplier or any other sources. This had resulted in
making either poor choices for the kind of technology or failing to enquire for the
crucial things like after sales support and future compatibility of the systems.
The new approach should present a set of criteria which the managers can use to
enquire for the suitability of the system for future use as well as the short term.
Poor return from the investment was also due to the absence of company wide
analysis of the information systems.
Q18 Did you do cost justification for investing in new technology?
Taking into consideration the economic climate that the industries are operating
in and also the fierce competition within the industries, as highlighted in chapter
3, every aspect of the manufacture of products has to be performing at an
optimum level. The aim of this question was to investigate if the companies who
invested in technology had made an assessment of what would be the return on
the investment.
Almost all companies replied that they were presented with some calculation
from the supplier of the technology on possible increases in productivity and
hence the turnover. However, about 50% of the companies replied that they did
not use of the formal methods for calculating the time it would take them to gain
return on their investment. The other 50% said that their accountants did
calculation for them using a payback method or net present value method.
141
Although, the managing directors also said that they thought that the estimate for
the return on the investment was either exaggerated or underestimated.
It can be concluded from the above replies that companies need to be aware of
the formal methods of cost justification on investment. Therefore, the new
approach must present these methods, their use and the advantages and
disadvantages that they present.
Q19 Would your company benefit from guidance for future investment in
new technology ?
The aim of this question was to establish if the managing directors and senior
directors of the companies thought that there was need for a formal approach that
they could use to introduce information systems and new technology in their
business.
All companies who had not invested in any new technology said that they would
like some guidance on how to approach the introduction of technology. Seventy
% of the companies who had invested in IT previously said that they would like
some formal guidance and the other 30% said that they felt that there were in
better position to implement any IT project.
142
6.4 Disadvantages of SME's in the Devon and Cornwall region
Both chapter 3 and the results of the interviews with managing directors of
SME's have identified several disadvantages that firms in the region face. These
can be summarised as:
a) Lack of know how of technology
b) Lack of finances
c) Lack of understanding on how to implement new technology
d) Lack of knowledge of available technology
e) Lack of skilled labour
f) Devon and Cornwall being a periphery region
g) Lack of time and know how to investigate new technology
6.4.1 Lack of know how of technology
The author's extensive field work in the Devon and Cornwall region indicated
that there exists a general ignorance about technology, and the advantages that
technology presented for the businesses. Even though many companies indicated
that their competitors were gaining competitive advantage over them by
employing new technology. They had no specific views concerning the areas of
the business and the key technologies that they require. These companies also do
not understand how their business can benefit as a result.
6.4.2 Lack of finances
Even where the companies know the technology that needs to be introduced in
their companies, they are prevented from doing so due to a lack of funds
143
available to the companies. However, the author observed that companies were
generally looking to invest in manufacturing systems e.g. CNC machines,
Computer integrated manufacturing (CAM) etc. but failed to realise the potential
that IT could bring in other areas such as planning and scheduling. This type of
application cost significantly less than manufacturing systems. The companies
were also, generally, unaware of financial help available from the local and
national government bodies to assist with introducing new systems. This type of
help can make the implementation more affordable and beneficial.
6.4.3 Lack of understanding on how to implement new technology
The results of the questionnaire highlighted that for many companies the
investment in technology did not yield the expected results. This is mainly due to
the fact that even those companies. that have the time, staff and financial
resources to implement technology often failed because they did not adopt a
structured implementation policy. The author observed that most companies
adopted a 'big bang' approached where overnight firms shifted from old systems
to new systems. This results in chaotic situations and consequently staff refusing
to work with new systems and reverting back to old systems. Often significant
quantities of time, information and product are lost through the inevitable
problems that occur with big bang implementation. Conversely, incremental
implementation can reduce the risks considerably.
144

6.4.4 Lack of knowledge of available technology
The companies that were enthusiastic about introducing technology and were
willing to invest funds, often found it difficult to know what to purchase. Most
senior managers were found to be unaware of what was available in the market
place to assist them in improving their business. This occurs both at the
administrative and management level as well as manufacturing systems level.
6.4.5 Lack of skilled labour
The author also found that the companies that had rightly invested in the relevant
technology were not utilising this technology to its full capabilities. This was
mainly due to the fact that many members of staff found it difficult to grasp
prime concepts that were pre-requisites to using the certain features. The staff
also concluded that it proved difficult to use manuals that came with systems, and
usually the training that was given was insufficient. The companies found vendor
support expensive and therefore prohibitive.
6.4.6 Devon and Cornwall being a periphery region
Most IT suppliers for systems relevant to SME's in the region, are based outside
the Devon and Cornwall counties. For a supplier to investigate the requirement
for a company often means a day's journey, and it was concluded that suppliers
were not willing to make the journey unless there was an opportunity for a
substantial order. There are also supplier held workshops and seminars to
demonstrate the latest technology, most of which are not available on a local
bases.
145

Being a periphery region also means that companies must produce and perform at
more optimised level than many of their competitors. This compensation for
extra costs of transportation that had to be accounted for. For some companies in
London, for example, it was cheaper for them to import goods from Europe then
to have them transported from Devon and Cornwall.
6.4.7 Lack of time and know how to investigate new technology
Typically, SME's work to their full manpower capacity, often fire-fighting. Lack
of time available to them often leads to companies unable to do research in
evaluating and improving their systems and operations. The author noted that
senior managers lacked the know how of how to do the research i.e. where to
look, who to contact etc.
6.5 Reasons for the implementation of new technology.
This section present some of the other reason that senior managers of SME's in
the region gave for investing in new technology.
I) Safety- many jobs in manufacturing such as welding, involve some degree
of danger to the employee and using technology for these tasks would
improve the general level of safety of employees.
146

2) High cost of raw materials- the application of technology to many tasks
would increase the efficient use of materials, thus enabling the firm to make
savmgs.
3) Improved product quality- this aspect of product manufacture is one of the
key concerns of manufacturing companies and upon it rests the future of the
firm. Any method that would enable companies to produce products of a
higher quality, is of substantial benefit to the firm in terms of customer
satisfaction, image and higher productivity.
4) Reducing manufacturing lead time -the time it takes to deliver a finished
product from the time it was ordered by a customer, is of major importance in
any firm. Technology has a role to play in many firms when there is a need to
reduce the lead-time.
5) Reduction of WIP- work in progress (WIP), results from a lack of planning
and insufficient scheduling of work on the shop-floor. The introduction of
new technology would help to alleviate this perennial problem.
6) The high cost of not employing new technology - most businesses operate in
an environment of fierce competition and the strength of a business is related
to its position amongst competitors. As an increasing number of businesses
transfer an increasing percentage of their work into automation, any business
that wants to retain its position will also inevitably have to automate.
147

6.6 Conclusions
In today's global and dynamjc manufacturing environment where the suppliers
and customers no longer have to be to confined to the local region or even the
country the cost of not investing in new technology can be substantial. This is
particularly the case for companies in the Devon and Cornwall, who have extra
disadvantages, as highlighted previously in this chapter and also in chapter 3.
Therefore, there is a requirement for an affordable, and accessible approach,
which companies can use in-house to introduce information systems and
manufacturing information systems in their companies. As SME's have limited
financial resources with which to hire the expertise of an outside consultant. An
approach that would guide companies, that lack in-house expertise, in identifying
needs, specifying the systems and implementing the systems would be
invaluable.
An approach must be simple to use and must take into account the disadvantages
of SME's in the region it must also guide the companies throughout full life
cycle of the proposed project. Such an approach must provide the company with
ownership of the project. Because it will develop in-house, This approach will
further enhance expertise as well as creating greater ownership and commitment
from the companies own staff.
There is currently no such approach available to guide SME's, therefore, any
approach developed must adopt a structured approach in identifying the need and
148
proposing suitable solution. The approach should also encompass the required
technological, organisational and infrastructural dimension.
The chapter has identified the current use of technology within the SME's in the
Devon and Cornwall region, it has also identified the disadvantages faced by the
SME's in the region. The chapter established that for companies to make use of
an approach it must be structured and easy enough for companies to use in-house.
However, for any approach to be effective there must be a commitment from the
senior management in adopting the approach, freeing staff to work on the project
and making financial commitments. The following chapter presents an outline
description of the novel approach that will fulfil the requirements stated. The
approach is then validated in chapter 8, using case study applications, to ensure
its effectiveness during implementation.
149

Chapter Seven
A New Generic Approach to Introducing Manufacturing Information Systems in SME's
7.1 Overview
The implementation of new technology in manufacturing gives rise to several
advantages including improved productivity, higher quality, efficient use of
resources etc (Meredith, 1987). However, what is less appreciated are the
complexity and manifold risks associated with the process of introducing new
technology (Julien, 1995, Geisler, 1992) .
This chapter presents a description of a new generic approach which small and
medium sized companies can use in-house to introduce a manufacturing
information systems. The approach deals directly with the issues that were raised
by the managing directors of various companies in the region, as presented in the
previous chapter. The approach is designed to be simple and yet highly effective,
and has given due consideration to the issues and problems faced by the SME
companies in the Devon and Cornwall region. The approach has also introduced
an original method for making qualitative decisions to choose appropriate IT
systems for specific applications and has developed additional novel mapping
tools which are essential if successful implementation of this new approach is to
be achieved.
The approach has evolved during five years of extensive research in the region.
The research has been integrated with the results from visits to many SME
ISO
companies, together with discussions and evaluation of the proposed approach
with the practitioners I academics in the field. The validity of the approach was
established through practical implementation of the approach in five SME's in
the region, (see chapter 8 for details). The case studies proved that the approach
was effective, and could be followed by any such company wishing to achieve
similar success.
7.2 Introduction
The approach outlined in this chapter has been developed independently of any
software or hardware vendor. This ensures that the outcome of the approach is
appropriate to the company, and is not dependant upon vendor or consultants, as
this would create a reliance on certain hardware and software that would not be
beneficial to the desired outcome.
Typically, when an outside consultancy services are employed there is little or no
involvement of company personnel. This lack of involvement results not only in
lack of ownership by the company personnel, but also the company being tied to
the providers of the consultancy. Consultancy service organisations generally do
not attempt to develop the skills of client staff. Therefore, in the future, any
amendments to the system would require rehiring of the consultancy services.
The author's approach achieves results by involving company personnel from the
outset. The company has the ownership and complete control of the project
throughout its life cycle. Hence any actions identified are fully supported, and
151

more likely to be implemented successfully. The company also retains the
expertise gained and is able to cope with any future alterations.
For the company, using the approach, it is important that a project manager is
identified who will be completely responsible for the project through its life
cycle. It is vital that the person chosen has a good understanding of the overall
requirements and strategic direction of the company. This manager should ideally
be either a senior member of company staff, or somebody who has full support of
the senior management. This is important because the achievement of lasting
change in any organisation requires commitment right from the top level if it is to
be successful (Tranfield and Smith, 1988).
It is important to note that the approach proposed does not deal with the strategic
analysis or direction of the company. It is assumed that strategic aspects are
considered by the senior management. The approach is concerned with the
improvement of company's information systems and the introduction of
manufacturing information systems with the implementation of new technology.
However, it is crucial that any company utilising this approach has undertaken a
strategic analysis of its market, competitors, future trends, the economy and its
future direction etc.
7.3 Content of the new approach
Figure 7.1 represents an overview of the approach, showing the structured phases
and steps involved. The approach has been divided into three phases, Analysis,
152

PJ C/) '"0 0 '"0 .......
Figure '"'1 c
7.1 The Model For New Approach 0 c . PJ 0 ("') ::l ::r IJJ -· 0 IJJ
0 0
A provisional ::l < ("') 0
IS lisl of V~rified Lisl of 0 0 WorkP ian prob lems
c '"0 Analysed Problems Probl~ms problems '"'1
Specificalion PJ 3 Asscsmenl ve rficallon ('JQ 0
0 ::l Phase I : 0.. ......
Analyn~ ...... PJ 0 ::l PJ 0..
lnfo rmal1on '"0 -"2. 3 Mapping '-< '"0 ...... ~ ::r 3 0
Dalabasc of i? 0
Ve rified Lisl of Ag reed Long- ::l ....... ,....,.
pro blems Term Solu lion Allernativc Chosen Solu li on
PJ V'l Research in lo Soluti ons PJ c. VJ Specify & Agree Se! Cost Justifica tion '"0 0
Solulions Long Term
of Allernali ves '"0 ::l Soluions '"'1
0 ?:: Phase 2: PJ ("') ,....,.
Soluuuns ::r ::r De velopment 0
9- c ('JQ
0 ::r &. PJ < ::l c;;· '-< -· ("') 0 0
Agreed ::l s lmplcmenlali lmplcmenla li Analysi s of New
0 '"0 >-+, Chosen Solu lion Dev ise & Agree Plan Complele
PJ
Phase Syslcm 9- ::l l mp lemenlalion Review 0 '-<
l,hase 3: Pla n l mpl eme nl all ion PJ c
'"0 IJJ -· Implemen tat ion '"0 ::l '"'1 ('JQ 0 PJ ,....,. ("') ::r ::r (/)
into phases makes it simpler for the companies that may feel that they certain
phases are not applicable in their case due to the completion of earlier work. For
example, a company may wish to use the approach to develop their solutions, if
they previously undertaken the analysis of their existing systems.
The Figure 7.1 shows the three phases and the various steps involved at each of
the phases. The output from the phase 1 is the input to phase two, and the output
from phase two is the input into phase three. The rest of the chapter will discuss
and explain each of the phases and their respective steps. Although a detail
explanation of each step is presented, however, it is not perceived that a company
utilising the approach would necessarily use all the phases and the steps.
7.3.1 Phase 1 - Analysis
This is the first of the three phases of the new approach, this phase has four
different steps as indicated in the Figure 7.2 below. This is an important first
phase, as prior to designing any manufacturing information system and
implementing any new technology that will give a company its competitive
advantage, it is important that the characteristics of the business's current
operations are clearly understood. The primary output from this phase is a list of
problems and bottlenecks that have been identified. This list can then be used as
an input to the next phase which attempts to provide solutions to the problems
identified.
154
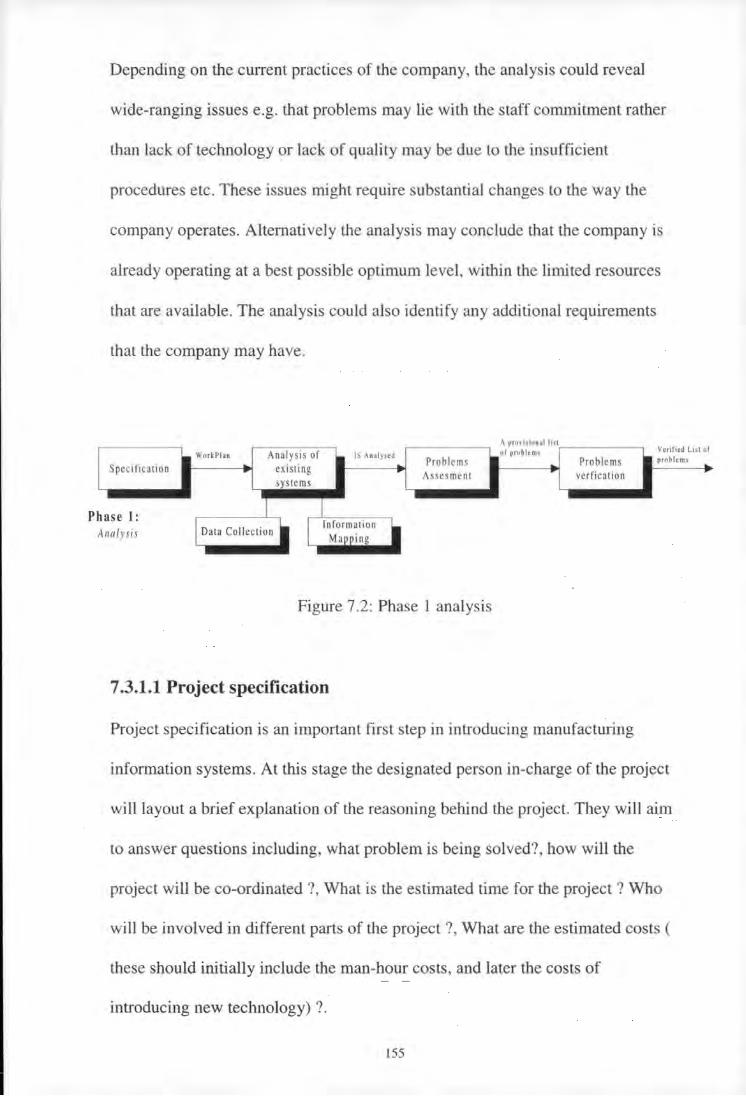
Depending on the current practices of the company, the analysis could reveal
wide-ranging issues e.g. that problems may lie with the staff commitment rather
than lack of technology or lack of quality may be due to the insufficient
procedures etc. These issues might require substantial changes to the way the
company operates. Alternatively the analysis may conclude that the company is
already operating at a best possible optimum level, within the limited resources
that are available. The analysis could also identify any additional requirements
that the company may have.
A pro\ isioul lis I
Analysis of IS Anoly><d or probl<ms Verified Lisl of WortPian problt:ms
Specificati on Jo. ex isti ng Problems Prob lems
Assesme nt verfication sys tems
p ha se 1: I I I Data Collection I I
Inform ation I Analysis Mapping
Figure 7.2: Phase 1 analysis
7 .3.1.1 Project specification
Project specification is an important first step in introducing manufacturing
information systems. At this stage the designated person in-charge of the project
will layout a brief explanation of the reasoning behind the project. They will aim
to answer questions including, what problem is being solved?, how will the
project will be co-ordinated ? , What is the estimated time for the project ? Who
will be involved in different parts of the project ? , What are the estimated costs (
these should initially include the man-hour costs, and later the costs of
introducing new technology) ?.
155

The costs and time estimates should not be considered as being too rigid at this
stage as the author's experience of SMEs has demonstrated that companies often
have to fire-fight situations within the company, and the project co-ordinator may
be called in to do other tasks. Similarly, it is difficult to estimate costs from the
beginning as the analysis of the current system will identify the problems. Once
discovered they may not necessarily require financial investment.
However, it is important, at this stage, that a Gantt chart is produced listing, in
logical order and estimated time, the various steps and tasks involved to complete
the different stages of the project. The tasks required to be undertaken at this
stage can be summarised as:
I. Brief description of the project
2. Estimated time required
3. Estimated costs
4. Identification of people who may possibly be involved
5. Gantt chart listing the steps and tasks involved
It is not expected at this stage that all the estimates should be highly accurate,
instead they act only as guide. No money for new technology should be budgeted
at this stage.
156

The project specification not only clarifies the objectives and tasks for the project
co-ordinator, but also the documentation produced at this stage will help other
understand the nature and direction of the project. Therefore, the project
description and other relevant documents produced at this stage should be widely
circulated within the company, from shop-floor supervisors, to the administrators
and senior management. This will have two benefits (i) that everybody will feel
part of the project and (ii) the recipients may give useful ideas and feedback.
7 .3.1.2 Analysis of existing information systems
As defined in chapter 4, an information system is a set of procedures that collect,
(or retrieve), process, store and disseminate information to support decision
making and control. Every organisation has a set of information systems that
generate some form of information, and interact with other information systems
within the organisation to facilitate decision making and productivity.
Information systems can be informal, for example office gossip, or they could be
formal with set and pre-defined criteria and procedures. If a system conforms
with this i.e. collection, processing, storing and dissemination of information,
then it may be classed as an information system. The information can be
collected for example, verbally, fax, purchase order, e-mail etc. The mechanism
for storing could be, a persons memory back of a scrap paper, a filing system or a
sophisticated computer databases. Processing may be achieved with manual
calculation, guess work, calculation or by using a sophisticated computer systems
I packages. Dissemination may also be performed, verbally, via carefully thought
157
out forms or via badly thought out forms, e-mail, or computer systems etc. Any
system, or way of working, that has the above characteristics, is known as an
information system. In SME's it is the mechanism of exchange of the
information, and the quality of information between the information systems of
various departments, that determines whether the company is productive,
produces high quality products etc. It should be noted that an information system
may employ mechanical or electrical equipment as well as computer based
systems.
This section outlines the approaches that can be used to analyse a company's
existing information systems.
Data collection
The process of data collection to analyse any existing information systems should
be completed on a departmental basis, i.e. manufacturing or sales departments
etc. This may be done in four different ways:
(i) Interviewing people- interviewing people in SME's should be
undertaken as informally as possible. It was established from the case
study companies that company personnel often feel intimidated and
stressed when they are subjected for a formal interview. The interviewer
should ideally be a person from another department and preferably not a
senior manager as the intention of the exercise is to establish the facts as
far as possible. An employee might be reluctant to speak frankly to a
!58
senior manager or a person from the same department. This situation may
have the affect of limiting and distorting, the data collected. Interviewing
undertaken by a neutral party is therefore much more beneficial to the
quality of the end results.
The interviewer should start by explaining the purpose of the interview
and assuring confidentiality. The first few minutes may be used for social
chat before asking the relevant questions. The interviewer should restrict
the questions limited to those which find out the interviewees
understanding of how information systems in the department work. It is
vital to obtain the interviewees understanding of the system, and not what
the interviewee thinks the systems is, or even what it should be. It was
discovered in the case study companies that often the perception of the
manager, or a person in the department of how the information systems
works, and how it actually works, were remarkably different. It is essential
that this difference views is recorded as it is one of the key foundations for
the information environment.
The information should be recorded using diagrams and descriptive text.
Details of the proposed mechanism for recording this information is
included in the next section. A flip chart may also be used or even a
simple notepad could also suffice. It is important that before the interview
is finished, the interviewer should provide a summary of the information
!59
they have gathered and should seek the interviewees agreement on the
correct understanding of what the interviewee has both said and meant.
Interviews should be conducted with different people from the same
department and preferably with those who represent a range of positions
i.e. from the administrative secretary, manager of the department and also
supervisors within that department. All of staff should be asked the same
questions, although the wording of the questions may be altered to
understanding for the interviewee. This may identify the different
understanding of the same system by different people and could also
highlight many related problems within the department.
(ii) Observation -Observation is an important part of the analysis of the
existing systems, which should be repeated throughout the analysis
process. Observations often provide clues about why the current system is
not functioning properly. Experience of the case study companies revealed
that many managers and supervisors provided false answers to make their
particular system appear to be superior than it was in reality. This could be
due to the fact that either the person deliberately gives the false
information to hide any weaknesses within that individual or did not
understand the workings of the system.
In any case the observations of the departments, and even very small and
unexpected incidents, can all be significant in later analysis. It is therefore
160
vital that they are recorded at that time. Many observations will be
unplanned, however, there must also be a planned observation. This
should involve watching an operation for a period to see exactly what
happens. It is recommended that formal observations should be
undertaken with the agreement of the users/operators, as covert
observation can undermine any trust and goodwill that the analyst
manages to build up. The observation is particularly good for tracing
bottlenecks, and should be used for checking facts that have already been
noted.
(iii) Record searching- Time constraints can prevent a systems analyst from
making as thorough an investigation as he might wish. Record searching
can enable conclusions to be drawn from a sample of past and present
results of the current systems. This involves looking through written
records to obtain quantitative information, and to confirm or quantify
information already supplied by user staff or management.
During record searching, information can be collected about, unused
forms, the accuracy of data held in the system, the frequency with which
the files are updated, the volume of file data and transactions, frequencies
and trends. Using the information, an assessment of the relevance of the
information can be made and the usefulness of existing information can be
questioned if it appears that some file data is merely updated, often
inaccurate or little used.
161
Furthermore, all of the information collected by record searching can be
used to cross-check information given by users of the system. Whilst this
does not imply that user opinion will be inaccurate, discrepancies can be
evaluated and the reasons for them discussed.
(iv) Document analysis- When investigating the information flow through
documents, it is useful to collect the documents which demonstrate how
this information is organised. These documents may include formal lists,
organisation charts, reports and forms. In order to fully understand the
purpose of a document and its relevance and importance to the business,
the questions should be asked about how, where, why and when it is used.
This technique is particularly useful when employed with one or more of
the previously mentioned techniques. The author found this technique
very applicable for case study companies. In the case of company A it was
able to recommended that 40% of the documents should be discarded as
they served little or no use to the company. As such they proved to be an
unnecessary burden to maintain and file.
Four techniques have been highlighted that should be used to collect information
about the company and its flow of information. These techniques can be used in
isolation, or in combination, to gather the information about the current system
and to understand any requirement for any new system. This information needs
162
to be recorded graphically using a mapping technique to assist in the ease of
reading.
Information mapping
Typically at the data collection stage a considerable amount of information is
collected, which may include notes made from the interviews, observation
records, sample documents and lists of problems and requirements, as perceived
by the staff of the company. Before any conclusions can be drawn from the data
that has been collected, it is important to record this information in an
unambiguous and concise manner. In this way the data may be used to verify the
information gathered, and develop the new system. As recording information
entirely in sentences and paragraphs is often more confusing to both the recorder
and the reader, a pictorial way of recording the information is preferred as it aids
understanding.
There are various very useful techniques such as Data Flow Diagrams (DFD) and
ICAM Definition Diagrams (IDEFO), that are discussed in chapter 5 and
appendix A. However, these techniques are often too complicated for the SME
companies to use. SME companies also lack time and resources to send
personnel away on training to master these techniques. The author has therefore
developed two new techniques that can be used by the SME's. These require
little or no training and the case studies have shown that they are highly effective.
These new techniques are easily understood and can be used by anybody who has
not come across graphical techniques before. These two techniques are known as:
163
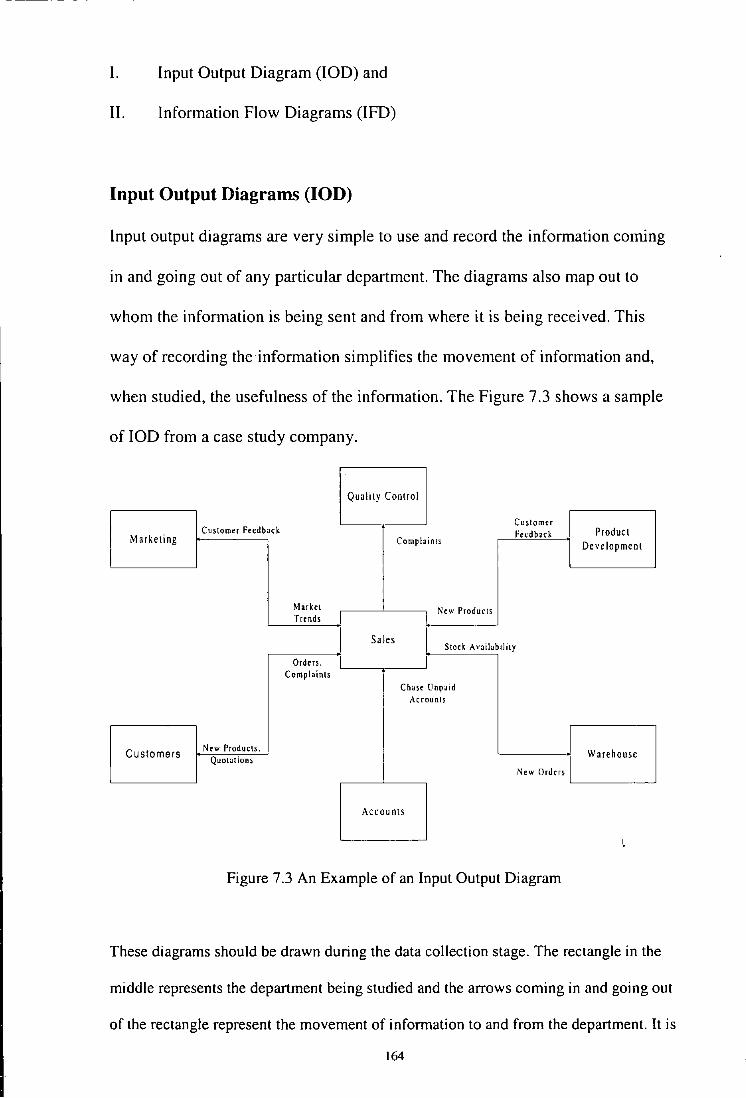
I. Input Output Diagram (IOD) and
II. Information Flow Diagrams (IFD)
Input Output Diagrams (IOD)
Input output diagrams are very simple to use and record the information coming
in and going out of any particular department. The diagrams also map out to
whom the information is being sent and from where it is being received. This
way of recording the information simplifies the movement of information and,
when studied, the usefulness of the information. The Figure 7.3 shows a sample
of IOD from a case study company.
Quality Control
Customer Customer Feedback • Product
Marketing Feedback Complaints Development
Market New Products Trends
I Sales
Stock A\·:~ilability
Orders. Complaints
Chase Unpaid Accounts
Customers New Products.
Warehouse Quotations
New Orders
Accounts
I
Figure 7.3 An Example of an Input Output Diagram
These diagrams should be drawn during the data collection stage. The rectangle in the
middle represents the department being studied and the arrows coming in and going out
of the rectangle represent the movement of information to and from the department. It is
164

vital to record both the direction of the flow, and the type of infmmation that is being
delivered I received. It is also useful to note how the information is being transferred i.e.
verbally, via computer etc. However, sometimes how the information is transferred is
dictated by the culture of the company i.e. all information is transferred verbally or
using forms, in which case it is not necessary to record the detail.
When applying this technique, during the case studies, the author was able to
establish that some departments who were constantly meeting and exchanging
verbal abuse at each other, in reality, had no useful information to communicate.
More importantly their problem really lay with another department. These
diagrams can also be used on their own without the need for overall study of the
information systems of a business.
The use of these simple diagrams was highly appreciated by the case study
companies and also by other practitioners in the field. As a direct result of this
research, one of the case study companies decided to use this diagram technique
to record the information requirement from all their major suppliers and
customers.
Information Flow Diagrams (IFD)
Information Flow Diagrams, Figure 7 .4, are used to record the flow of
information from when the information enters into a department or a company to
when it leaves the department or company. These diagrams show the path that
information follows and the processes that it goes through. The IFD's can be
165
used to pictorially to record the flow of an order from when it arrives at the
company, the processes it goes through and the time it is despatched.
The IFD's use simple rectangles to record which departments the information is
going into and coming out from. The use of arrows is applied to provide the
reader with an understanding of the direction of the flow of the information. For
established and mature SME companies, version 2 of the IFD's, Figure 7.5, can
be employed. In this version 2 the triangular boxes are split into three
compartments. The first compartment lists the kind of information being
processed, the second compartment notes the time it takes to process this
information and the third compartment lists the how the information is conveyed.
This version 2 of the IFD can be used by micro SME's, when they are mapping
the overall functioning of the system, if they feel. Experience of the case study
companies discovered that some SME companies found it difficult to use version
2 of IFD. This was because version of the IFD required a lot more detailed
information to be mapped on a single diagram, this was found to be difficult to
achieve, and was confusing to some members of the staff.
166
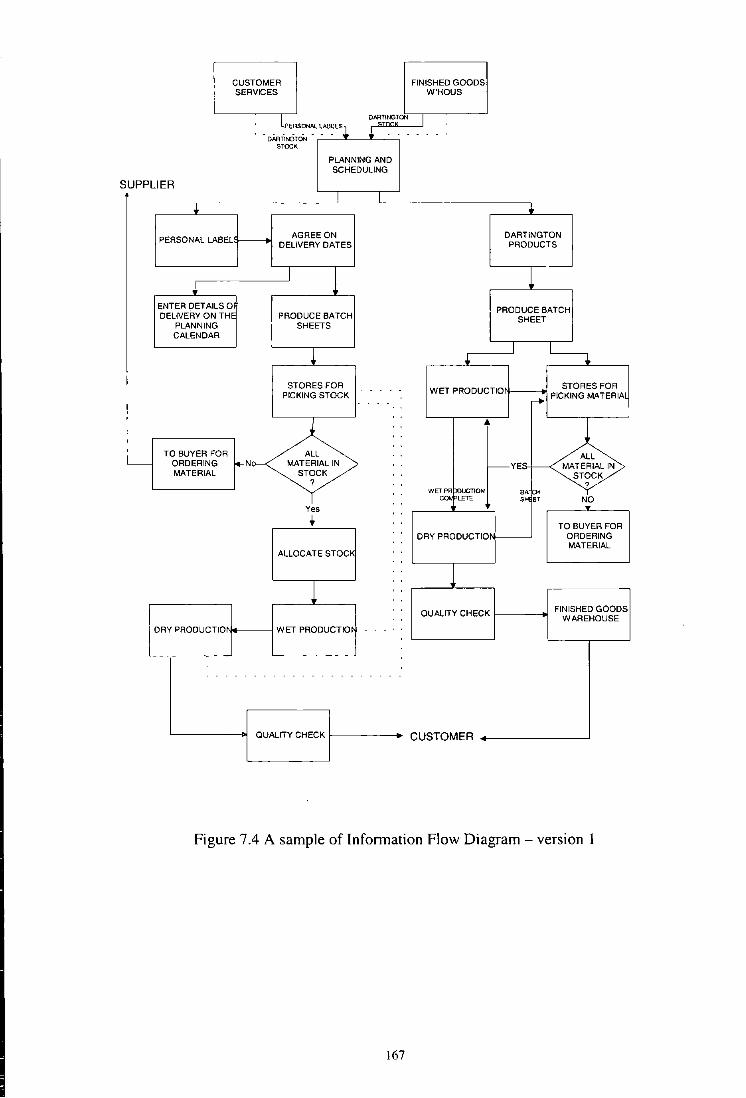
TO BUYER FOR
CUSTOMER SERVICES
ORDERING .-N MATERIAL
ALL MATERIAL IN
STOCK ?
Yes
t
ALLOCATE STOC~
DRY PRODUCTION4-----1 WET PRODUCTIO
FINISHED GOODS W'HOUS
DARTINGTON PRODUCTS
PRODUCE BATCH SHEET
I I
STORES FOR WET PRODUCTIOI'I---_.--.1 PICKING MATERIA
~'~ ~ WET0~0~10N BA~ C-. L.ETE SH ET ~Q
DRY PRODUCTIO~----' TO BUYER FOR
ORDERING MATERIAL
QUALITY CHECK f-------.1 FINISHED GOODS WAREHOUSE
QUALITY CHECK f-----•• CUSTOMER
Figure 7.4 A sample of Information Flow Diagram- version l
167
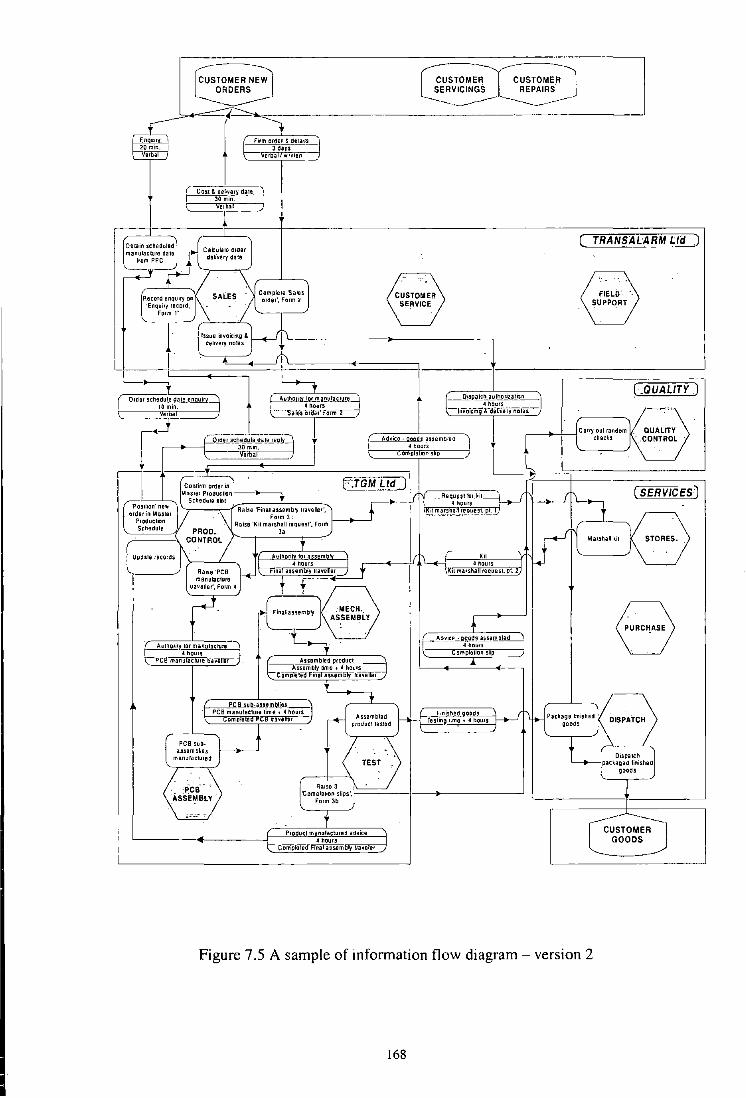
[
[~TOME A NEW ORDERS
~~~~---------------
~ R";;;;:] r F>m "'" ' """ ' r--20 mm. 1 1 ---Tdays- -----
" . I ... .,,,..,
Cost & dtlhYarv date "j
__ Q...Il!P~!~II au.t,t.~~J~-" _ 4 ~ours
-liiVoiCiiii & -deti;&ryno res-
( TRANSALARM Wl )
8
Figure 7.5 A sample of information flow diagram- version 2
168

The IFD's employ diamond shape box's, as used in flowcharting technique to
represent a question or decision to be made. The information flow diagrams can
be employed to represent the overall working and interaction of enterprise wide
information systems. IFD's can also be used to show a flow of information for a
department, however, there must always exist an IFD for the whole company.
Once drawn the diagrams can then be used to assess the bottlenecks and problem
areas. New diagrams can be drawn to show the resolution of the bottlenecks
previously identified.
IFD's are an original approach to mapping information and were developed to
make the graphical representation of information for SME's easier to understand
and apply. However, with the case studies undertaken, some people still found
them little difficult to create. It was noted that, most of the people who used the
diagrams found them much easier to use, and follow, then conventional methods
like data flow diagrams and ICAM definition Diagrams (IDEFO).
7 .3.1.3 Problems assessment
The previous section outlined the approach and techniques to analyse and map
the existing information systems of a company by asking questions, gathering
documents and recording details about the current systems by using two
diagrams, IOD and IFD. In this section, consideration will be given to assessing
the inherent problems that a company might be having, and identifying
techniques that can be used to specify these problems for clear identification.
169

A study was undertaken to identify if there were any available tools that could be
utilised to assess these problems, and that would also be relevant to SME
environment. However, no such tool could be identified for application to
SME's. The tools that do exist are highly complex in nature and are aimed at
large multinational organisations. As such they were found to be irrelevant in the
case of SME's. For the approach presented in this chapter the author has
recommended the following two techniques:
(i) A list from company staff- This list of problems is made primarily from the
interviews of the company staff. All problems that are perceived by the company
staff are written down and if more than two people report the same problem then
it is highlighted. It is important to realise that this is a list of the perception of the
problems by the company staff, and does not necessarily mean that the problem
exists. However, they must be noted and their causes identified.
These concerns should be written according to the departments that report them
and if it relates to another department then it should also be written down i.e.
production department reports that there is a problem with sales department.
These difficulties should then be listed under the production department. The
reason for this is that the production department see the sales department as being
a problem but the sales department may not see it as being a problem, connected
with sales.
170
(ii) Assessment of information flow diagrams- The IFD's should be carefully
considered by the relevant company staff and brainstorming should be achieved
to identify why bottlenecks appear at certain stages of the diagram. Although,
this is a very subjective way of assessment the case studies have demonstrated
that this method is highly effective as it encourages people to talk about the flow
of information, and they can then relate to the issues involved rather then just
applying another tool or technique.
For the case study companies, the IFD's were presented and the discussion was
carried out with all the people who were either interviewed or approached at the
data collection stage. Brainstorming was then undertaken to identify why certain
areas represented on the IFD were bottleneck areas in the company. A list of all
the possible causes was made, and then discussed to identify the range of
potential solutions.
7 .3.1.4 Problems verification
Once a record of the problems reported and identified has been made, then the
list must be verified. It is important to note that the list should not be circulated at
this stage, as the experience from the case study indicated that people started
looking at other peoples perception of the problems, and started criticising them,
rather then verifying the accuracy of the problem that they reported. Therefore,
either the project manager should personally go round and verify the problems or
alternatively only the problems reported by the individual should be sent to them.
171

Any false conclusions that may have given rise to imaginary and/or virtual
problems can be rectified at this early stage.
The end result from the verification stage is a list of the problems that need to be
addressed and resolved. This forms the input to the phase two of the new
approach.
Phut 1: Ana/n1.>"
Pbau Z· SciJIID.s
(Jn tlop .. ,fl
Phu t 3: lmplrmtnlolinn
A1r••• S.on· Ter11 Solalioa Scl
Chosen Sulati An lysis ur Nt v.·
Systtm
Figure 7.6 Outline of the stages in the second phase
7 .3.2 Phase two - Design of the new system
The objective of the previous phase was to understand the existing information
systems of a company and to make a list of the problems that have been
identified. The aim of this phase is to help resolve the problems identified either
by introducing new technology or simply by reorganising the existing
172

----------------------------------------------------------
information systems and eliminating the troubling factors. Figure 7.6 outlines the
stages involved in this phase.
It is important in this phase to involve as many of the managers and supervisors,
who will be using the system, as possible. As analysis of the questionnaire
presented in the previous chapter, experience of case studies and research has
shown that that one of the main reasons for the failure of new technology to
successfully meet all its objectives, is due to the scepticism of employees. With
the employment trends of the past two decades, there is an assumption, that new
technology is linked with significant job losses. It is therefore no surprise, that
employees feel threatened and not in control of the situation, this especially true
if they are kept in the dark about the new system being developed I introduced to
the company. If people are made to feel that they own and are involved in the
project, then the chance of it succeeding is increased enormously.
7 .3.2.1 Specify and agree solutions
The critical step to resolving the problems identified in the previous phase, is to
split the problems into two categories. (i) Those that require no new investment
and can be overcome by using available in-house resources, (ii) and those
problems that require implementing new technology. These need to be carefully
identified, and a set approach presented in the rest of this section should be
followed.
173
Problems requiring no investment- Case studies revealed that typically 80% of
a company's problems can be resolved using in-house resources and reorganising
of various systems. This includes problems such as reorganising administration,
redefining management structure, rearranging shop-floor layout, redesigning
existing forms and documents, agreeing the format of information presentation
between different departments, agreeing the means of communicating
information.
Reorganising administration- The examples of this include reorganising or
organising the filing structures, and reorganising the layout of the administrative
office so that people can easily access the information that they need. Clearly
marking in-trays or filing cabinets with information that they contain. Organising
a system so that mail or information destined for somebody reaches them
immediately. Although many of the examples seem very simple and obvious, the
case studies revealed that by the lack of organisation of the above, caused
unnecessary stress and time wastage.
Redefining management structures - ill defined chains of command or
management structures can considerably confuse the operations of an
organisation and its employees. This confusion can lead to work being
duplicated, people having different perception of what is required and could
further create rift between the employees of the business. In the case study
example of Company B, 40% of the problems were eliminated by revisiting and
redefining the management structure. Here the efforts should be made to
174

eliminate any duplication of the chain of command and/or repetition of tasks by
different people within the same organisation.
Rearranging of shop-floor Layout- In case study company A, the quality of the
company's product was being affected due to the poor layout of the production
machines on the shop-floor level. The batches of products were required to travel
up and down the shop-floor for the various stages of work to be undertaken.
There are sophisticated computer packages such as, 'Factory Layout' etc. that
can be used to work out the optimum lay out of machines on the shop-floor.
However, for most SME's, a simple diagram of the shop floor can be either hand
drawn or sketched out on a simple design package stating the existing set-up.
This diagram can then be redrawn to present the optimal layout.
Redesigning of existing forms and documents - forms and documents can be
redesigned so that they contain all the information that is required by the people
who have to implement them. For this case study the author was able to eliminate
40% of the forms and documents by redesigning them so that they contained the
relevant information necessary for final production and delivery.
Agreeing the format of information presentation between different departments
This requires a simple meeting between two or more departments that share
information. This information may be presented electronically, or manually.
However, all parties must agree to a standard format of the information i.e.
should it be presented on a spreadsheet in a certain layout. This means that
175

infonnation can be categorised and will help departments to cut time spent
rearranging infonnation for their use. In one of the case study companies one
piece of information was being represented in completely different layouts by the
sales department, warehouse and production department.
Agreeing the means of communicating information- This activity compliments
the previous one, but now the departments must agree a suitable method of
communication e.g. electronic, manual forms or verbal.
There are no specific techniques that are being suggested for this section as the
resolutions to the problems are simple in nature and just require somebody to co
ordinate them to make sure that they are resolved and relevant people sit together
to discuss them and agree on solutions. Any solution will be bespoke to the
individual company.
Problems requiring investment
This should be a list of all those problems that cannot be resolved in-house and
may therefore, require some financial investment and new technology to be
introduced. However, before a decision can be made on where to invest money,
the Information Flow Diagram must be drawn to indicate where the IT systems
will be introduced to overcome bottlenecks. Introduction of new technology may
also mean that the changes would have to be made to the information systems
flow of the company. This should also be reflected on the IFD for the new
system.
176

Before considering undertaking the research for the availability of a suitable new
technology and then choosing from the alternatives the additional benefits of
following the framework described below should be considered carefully. Due
consideration at this stage will make it simpler for any future upgrades to the
system.
• Easy to use -Any new system, however good it may be, will not be effective
if the user finds it difficult to grasp the concepts and principles involved.
Therefore, the suitable system must be user friendly, easy to understand, not
difficult to learn how to use and straightforward to operate and apply.
• Flexible- It was determined that in the case study companies, during the
new system design stage, the system expectation were not clear e.g. the
expected production output etc. However, during the pre-implementation
stage, new system requirements often emerge, a flexible design should be
able to accommodate these new requirements. Any system that is formalised
and rigid will not prove adequate for implementation in situations where a
high number of variable are involved.
• Cost effective - the benefit of any new system to an organisation must be
weighed against its financial costs. There are many examples of firms that
over-invest in technology or purchase systems far in advance of their
requirements. This can results in the company struggling financially as the
rate of return on investment is low and systems are under-utilised. Cost
justification techniques are considered later in the chapter.
177
• Maintainable- the reliability of the new system is central to its usefulness in
the medium and long term. Any system that is unreliable will be a constant
drain on the resources of the organisation and disruptive to its work.
Therefore, a good system should be easy to maintain.
• Portable -any software I hardware that are purchased to support the new
system design should be portable. The hardware must be able to function
under different operating systems, and software must be able to run on these
new operating systems. The rapid changes in software and hardware
development can make a system idle relatively quickly, if it does not meet
this portability criteria. Also any new system should not be limited by space
or time, otherwise it will have to be replaced due to physical expansion or
geographical relocation of the company.
• Reliable- Too often the companies that are heavily dependent upon
computers find that they stop functioning as a company when their computer
systems stop functioning. Any new system must be tested for its reliability,
and ideally should be supported in the open market so that a company is not
dependent on the supplier of the product for support. Some supplier
companies charge extortionate costs when they know that nobody else can
provide the necessary required support.
178

The point must be re-emphasised that when the new systems are being discussed
and planned, the people who will be using the final systems must be consulted
and their points of view taken on board. Also at this stage of designing the
manufacturing information systems, the designers must not define what
technology they should be using instead they should be concerned with the
various options available to help them overcome their problems. The design
should contain statements such as, "we need to have a better stock control
system"; "the planning and scheduling system should be introduced to overcome
bottlenecks at planning stage"; "We need some kind of Material Requirement
Planning System (MRP)" etc. By this means this stage can identified the problem
areas in the manufacturing information systems that require new technology to
make the company more efficient.
Research and discussion presented previously in this thesis has revealed that a
high percentage of the companies who introduced technology to overcome their
problems, did not consider that the introduction of new technology had helped
significantly to provide the company with the necessary competitive advantage.
The reason for this lack of performance was due to a poor definition of the
requirements and expectation to be derived from the new system. The approach
presented in this section greatly assisted the case study companies to overcome
this particular problem and can help any other company.
Having defined and agreed the requirements for the long-term solutions the next
stage is to research into the available technology.
179

7 .3.2.2 Researching into long-term solutions
Chapter 6 identified that managing directors who wished to introduce some kind
of technology into their businesses, did not know what technology was available,
or where to begin looking. This stage provides a brief guide to where research
should be concentrated to identify the technology, for a company's particular
need.
Guides and magazines- While the Yellow Pages may be adequate for some
general needs, a list of specialist magazines and guides would need to be
consulted for more specific needs. Its possible to locate specialist magazines on
manufacturing management and control, as well as computers in manufacturing
etc. Help in this search can be obtained from the professional engineering
institutions.
These journals and magazines are not only useful to identify the potential
suppliers of the technology who may advertise in them, but are also useful since
periodically these magazines and journals review the technologies and report on
the case studies of companies who implemented the technology. This can provide
crucial guidance to the suitability of the technology for a company's specific
requirements.
Government organisations - various governmental organisations like DTI,
Business Links etc. have been set-up to help SME's identify new technology.
These organisation, typically, have an IT aware/dedicated person responsible for
180

keeping track of the technology available. Contact with these organisation can
prove to be a crucial source of information.
However, government organisations are often considered by businesses to be
inefficient, and consequently this source of reference is currently underused by
most companies. Essentially, the DTI can also assist by acting as a source of help
to businesses through subsidies and grants. Chapter 4, identified the government
bodies dedicated to providing help for SME's in the Devon and Cornwall region.
A good example of this is of case study Company C, whose problem were jointly
resolved by Devon and Cornwall Business Link and the research proposed in this
thesis, thereby enabling them to save the company three hundred thousands
pounds.
Academic Institutions- the contemporary links between academia and industry
are very weak and this is primarily due to ignorance on the part of small
businesses and the level of help and co-operation that is available to them. Local
universities and colleges of further education have the resources who can help
identify the suitable technology for a company and are always looking out for
possible case study companies to help and to learn from them in a two way
interactive partnership.
Most small businesses are simply not aware of the opportunities that are available
through acadernia. However, based on the experience of universities working
with large businesses, the potential for helping smaller companies is enormous.
181
There is a current climate for universities to support technology and science
parks. This is potentially the case with the University of Plymouth (through the
Tamar Science Park) and also from the University of Exeter.
Internet- Internet is one of the best ways to identify possible suppliers of
technology. An increasing number of companies are setting-up web sites, and are
conducting business over the internet. A search can be conducted by typing in the
exact requirements, this allows search engines to operate and identify suitable
information.
Having completed the research, the company's outcome should be a list of
possible suppliers, who must then be contacted to obtain promotional literature.
Possibly a representative should be engaged to visit the company to present their
technology and gain an understanding of the company's needs. A database of
different technology solutions can then be made to help make the final decision.
This database of alternatives should contain a summary of the various solutions,
and hardware/software requirements for the solutions. Table 7.1 below shows a
sample of an example item in such a database.
182

Table 7.1 A sample entry in database of alternatives
Name:
Company:
Hardware Requirements:
Software Requirements:
Price:
Key Words:
Memory Requirement:
Source Code Language:
No. Installed:
Compatibility's:
Reports and/or Related References:
Cabinet File Address:
Product Entry
CS/3 Manufacturing Systems
Tetra.
2 x Pentium HI servers, with four CPU's and 6 x 17 GB Hard Drives
NT Server or UNIX operating systems
£60000 + 10% Maint PA.
Bill Of Materials, Inventory, MRP, Shop Floor Control, Master Schedule, Purchasing, Costing, Order Entry.
1 GB RAM per server
C++
350
Database in SQL language
Computers in industry review Nov 99
05-50
Abstract: The Mullinet Manufacturing System is an advanced software product that enables management to control planning and operations in the manufacturing process. It consists of eight applications that functions independently or as part of a fully integrated, closed-loop, net-change, MRP II system.
At the end of this exercise there should be a list of about ten to twelve alternative
solution entries to choose from. However, before a decision is taken on the
choice of the system the criteria suggested in the next section should be
considered against every alternative on the list.
183
Selection criteria
With the immense advances in technology over the past two decades, it is very
difficult for everyone to keep abreast of all the changes taking place. Selection
criteria is therefore an indispensable guide for managers, to ensure that they
make the correct choice when opting for a new technology. Consequently, the
approach presents a selection criteria that is comprehensive in nature, as it deals
with several facets of the technological change.
Compatibility of the system- the question of the compatibility of the system is an
essential one. Any system purchased must be compatible for both present and
future use I requirements. It is pointless to change from using IBM compatible
machines to Macintosh, when all employees had training and experience in the
former, and the information stored was in disks compatible with only the original
systems. Some of these changes may be predictable, however most will not be.
Furthermore, the system should be able to cope with most future changes that
may need to be made. There is no purpose in purchasing a system that will
become redundant before it has paid for its investment. For example, when
installing a computer network, a pessimistic estimation of the computer capacity
needs to be made based upon estimated future workload. The estimation would
naturally change from business to business depending on the different situations
in various industries and any company specific forecasts.
Reliability of the system- the costs of maintaining technology are relatively high
and can become prohibitive, especially to the small business, if that technology is
184
unreliable. For example, if a computer network formed the backbone of a
company's information system, the cost of any malfunction would have to
measured in terms of both the financial cost of rectifying the problem and also by
the work disrupted and orders lost I delayed.
Expense of the equipment- many companies 'have gone out of business'
attempting to upgrade their technology, and it is of the utmost importance that the
technology being purchased is adequate for their use, and within their financial
range. Along with aspects of the company's internal financial situation, the
external financial trends in the company's industry, must also be taken into
consideration.
Warranty and support- an assessment needs to be made on whether any
warranty and support is sufficient for the needs of the organisation, and the
quality of the equipment.
User-friendliness- from experience gained in case study companies, it was
analysed that a major obstacle to the successful implementation of new
technology in companies, was due to the mental barrier presented by employees.
One reason for this psychological barrier stems from the lower level IT skills that
the work force possess. Providing them with a user friendly system should
minimise the problem.
185
Training programmes- A further method of tackling the psychological barrier is
through formal training programmes. Therefore, any suppliers offering training
programmes in the use of the new technology should be given priority status.
A novel technique for decision analysis
The previous section listed the selection criteria which must be used to short list a
selection of suitable suppliers and systems. This section outlines a novel decision
analysis approach, developed in this research, which can be used to make the
final decision. The approach consists of asking a series questions about the
alternatives. Once this is done, it should then be possible to rank paired
comparison alternatives based on the information obtained. The approach obtains
the most satisfactory alternative to satisfy the needs of the company. It also
provides ranking of all alternatives.
After criteria for selecting alternative solutions are defined, the decision making
process can begin. Solutions that are inefficient can be eliminated immediately.
An inefficient system is one that is equivalent or lower in all criteria and lower in
at least one criterion compared to an existing alternative. To demonstrate how
this works consider that a Company X needs to buy a planning and scheduling
System. The company undertakes some research and finds out from various
sources that systems 1 to 20 all solve their planning and scheduling problems.
The company can then rate each alternative on three criteria: cost, compatibility
and system support (see table 7.2). To make a decision weighting should be
given to each category for each alternative and then the system with the highest
186

score should be selected. In the above example the weighting is given between (-
15 and 25), however, a company utilising this technique can agree on some other
weighting.
System Criterion 1: Criterion 2: Criterion 3: Cost Compatibility System Support Total
1 -10 13 4 7 2 -8 4 10 6 3 -12 5 15 8 4 -6 10 7 11 5 -5 19 11 25 6 -8 4 3 -I 7 -6 20 23 37 8 -10 1 -8 9 -7 12 1 6 10 -8 4 2 -2 11 -4 6 1 3 12 -10 l 22 13 13 -5 20 9 24 14 -7 3 3 -1 15 -9 8 5 4 16 -12 9 10 7 17 -6 5 10 9 18 -15 6 3 -7 19 -2 16 10 24 20 -7 3 11 7
Table 7.2 A Set of Alternatives
A careful review of the alternatives may reveal some inefficient choices, i.e.,
there might be systems that beat other systems in all three categories. For
example alternative 7 is better than alternative 6 with respect to each of the three
criteria. Therefore, alternative 6 is inefficient and can be ignored. The top three
(this is an arbitrary number, some companies may choose less while others more)
options from the list should be considered further and the rest be discarded. A
187
cost justification exercise must then be undertaken on these alternatives and a
final decision can then be made. The following section describes the techniques
for cost justification of any investment.
7 .3.2.3 Cost justification
The purpose of any investment is to realise a return on that investment. Investing
in new technologies is no different and there are several techniques in assessing
the value of different technologies. Below, a brief description of the two well
known techniques is given. (for further details please see Drury, 1997)
(i) Pay back method- this is a number of years it will take before estimated
annual savings resulting from the use of new technologies, will equal the
net investment made. The typical pay back period for any new
manufacturing system is typically five years.
(ii) Net present value- this is the present value of the total estimated savings
over the life of the proposed investment, i.e., after allowing for an
assumed minimum attractive rate of return, less the initial net investment.
Disadvantages of the cost justification methods
As with many systems in which several variables are in operation, the error
margins of any measure and subsequent calculations are considerable.
Consequently, the tracing measurement and allocation of many cost elements are
inaccurate. In addition, due to the hard-headed practise of management
188

accountancy, the value of intangible benefits, such as the time saved by staff, or
the improved image of the company are assumed to be of no financial value.
Another consequence of using cost justification methods is that the value of the
long-term benefits is disregarded.
The nature of modern analytical disciplines requires that any system under
observation and analysis is compartmentalised. This same philosophy is applied
in management accountancy, and so no allowance is made for the beneficial
effects of a proposed project on other parts of a company. This and other
deficiencies of cost justification methods should be appreciated and taken into
consideration during the application of it to any investment.
The cost justification exercise should suggest the best alternative from the
financial perspective. The solution should be collectively agreed on and selected.
A careful implementation planning approach is required for the smooth and
effective implementation of the new system. The next phase of the approach
present the a structured approach for implementation of the solution.
7 .3.3 Phase three - system implementation
The previous two phases of the approach have outlined, in some detail, the
process of identifying the requirements for a company and then investigating a
suitable system. Even having identified the requirements and investigated the
right system the new system could still fail to give the expected results if the
system is not implemented correctly. This is an important phase of introducing
189
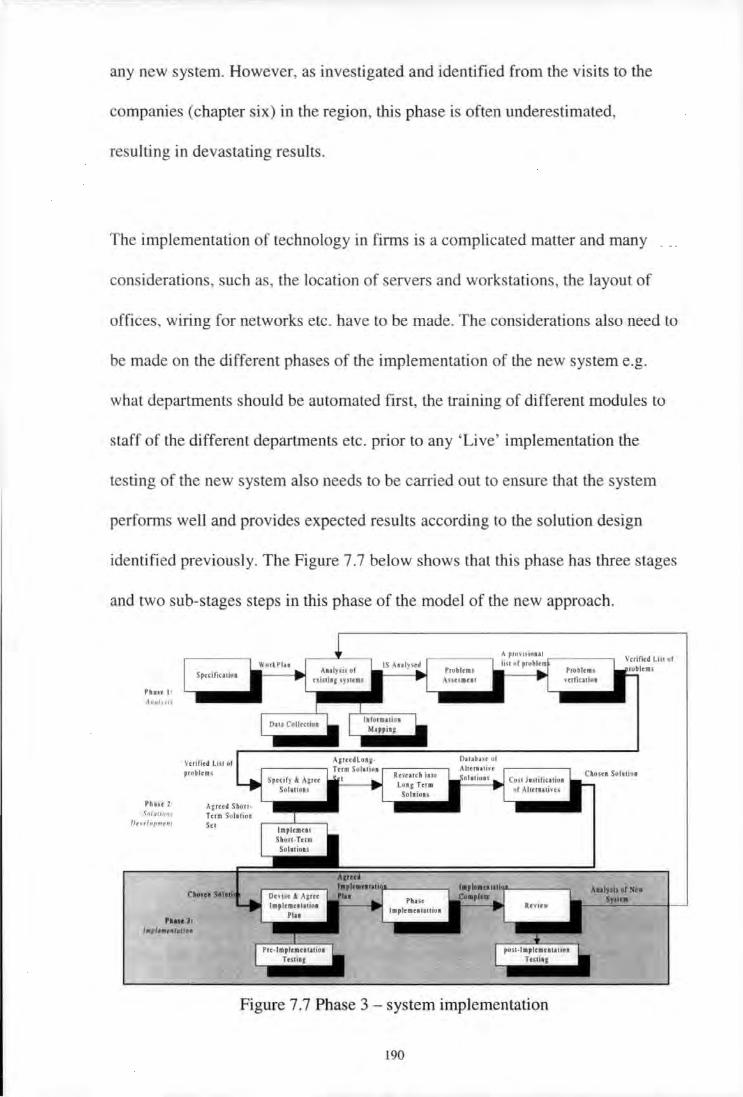
any new system. However, as investigated and identified from the visits to the
companies (chapter six) in the region, tills phase is often underestimated,
resulting in devastating results.
The implementation of technology in firms is a complicated matter and many
considerations, such as, the location of servers and workstations, the layout of
offices, wiring for networks etc. have to be made. The considerations also need to
be made on the different phases of the implementation of the new system e.g.
what departments should be automated first, the training of different modules to
staff of the different departments etc. prior to any 'Live' implementation the
testing of the new system also needs to be carried out to ensure that the system
performs well and provides expected results according to the solution design
identified previously. The Figure 7.7 below shows that this phase has three stages
and two sub-stages steps in this phase of the model of the new approach.
Phast 1: lhOJUIJ
prnbl cm 'i
Phoso l Snlulums
IJu ,.t,,,,,.,,
"•u J: , .. ,,,,. .. ,.,11,;0,.
Agreed Sboll· Ttrm Sol11io• Set
Figure 7.7 Phase 3 -system implementation
190
AIIIJSh or New s, ••••

7.3.3.1 Devise and agree implementation plan
As reported in the last chapter, for a few companies the investment in technology
failed to yield the expected benefits due to the ineffective implementation. The
companies typically adopted a 'Big Bang' approach. Whereby new system,
overnight, replaced the old system. Resulting in confusion, loss of confidence
and rejection of the system by the staff of the company. Even though the training
was given in the use of the new system. However, to suddenly leave the old
system and adapt to the new one was found to be very difficult, because people
forgot what they learnt at the training and also training could not cater for all
eventualities.
There is therefore, a need to adopt a different approach to implementation. The
Figure 7.8 shows three possible approaches to implementation. (i) Big Bang
Approach, (ii) Parallel Approach and (iii) Step Approach.
The Big Bang approach has already been discussed and disadvantages
highlighted. This approach is not suitable for SME manufacturing systems
implementation. The literature review confirmed that this approach is not
adopted for even large organisations. The only case for a big bang approach
would be at a situation where any other approach is impossible, for example the
market data for stock exchange which is live and alters every few seconds.
The Parallel approach is suitable for micro and developing SME's as the system
is not expected to be very big in these companies and therefore having two
systems running side by side is a practical option.
191
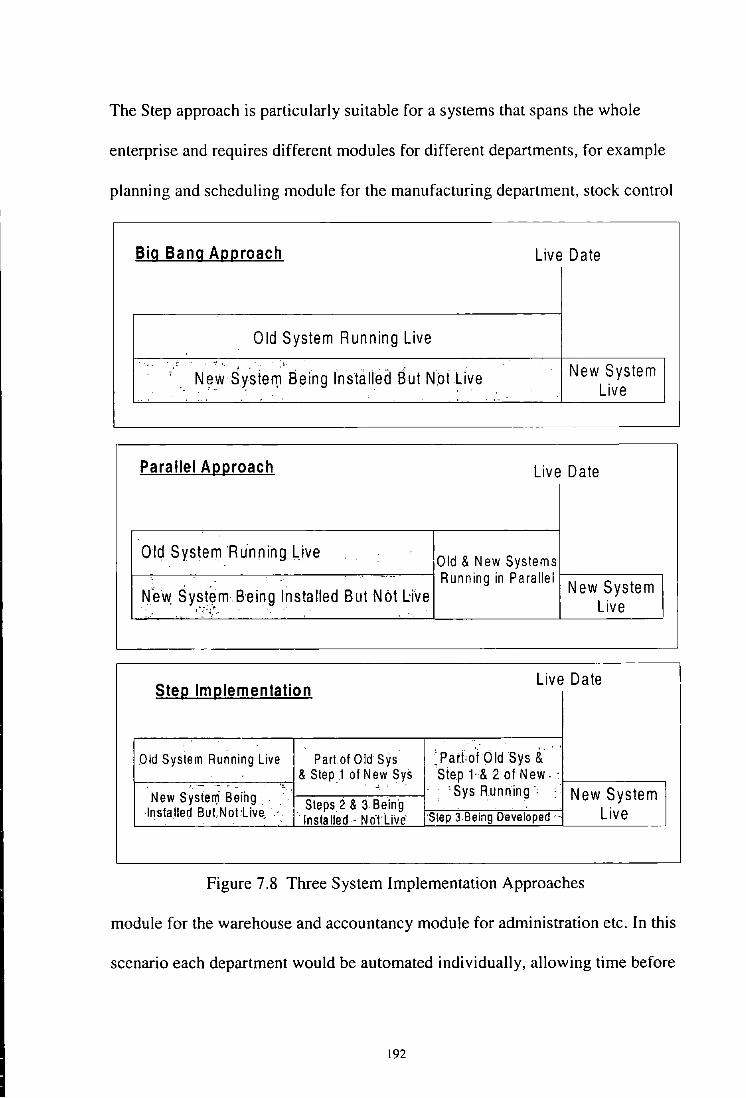
The Step approach is particularly suitable for a systems that spans the whole
enterprise and requires different modules for different departments, for example
planning and scheduling module for the manufacturing department, stock control
Big Bang Approach Live Date
Old System Running Live ,, .
New System ' N ~w Sysie111 Being fnstalied But N.ot Live Live
'' '··-
Parallel Approach Live Date
Old System Running L.ive Old & New Systems ·, Running in Parallel
N"ew: Syst~mBeing Installed But Not Live New System
,.' '· ··;_'(· . . ' '. '·, ' Live
Steo lmolementation Live Date
.. :ParJ;o.idld Sys &_·
''
Old System Running Live Part. of Old Sys & Step 1 of New Sys Step l· & 2 of New. ;
. ~ 'Sys Running·. New System - New Syster(l Being. ' Installed B. ut. Not :Live, Steps2 & 3 Being
Live "Installed · Nollive ·step 3 Being Developed.,
Figure 7.8 Three System Implementation Approaches
module for the warehouse and accountancy module for administration etc. In this
scenario each department would be automated individually, allowing time before
192
next department is automated so that the staff of the first department can master
their module.
This stage of the implementation phase should conclude by collective agreement
of all parties concerned on what approach of implementation would be followed.
The next stage outlines the practical steps involved in implementing.
7 .3.3.2 Phase implementation
The Planning of system implementation can be divided into six different steps:
a) Identify stages
b) Priorities stages
c) Identify activities
d) Allocate resources
e) Implement plan
f) Implement next stage
The first step in the system implementation is to identify the various stages that
may be required to complete the implementation. This may include identifying
the departments that need to be automated, and when and what are the
requirements that need to be met such as wiring of the network, purchase of the
appropriate furniture etc. This stage should include a complete list of stages,
which may be over one month or six months and more.
The next step is to prioritise the stages identified in the previous section. The
strategy of any company is central to the configuration of its priorities and it is
193

these priorities that may determine the order in which new technology is
implemented, in some companies. An example of the link between priority of a
company and order of the steps of implementation was Case Study Company A.
This company had to introduce itself into the High Street store market, in order to
cope with the high demands on its systems, the information systems had to be
upgraded to electronic data interchange (EDI) first which was required to deal
with major companies and then the manufacturing systems needed to be changed
to produce a higher volume of products.
The priority of the steps may also be dictated by the ease of implementation, for
example it may be easier to introduce the new system in accounting department
because the staff in the department may be relatively more computer literate then
other department.
Having prioritise the steps the next stage is to identify all the tasks that have to be
undertaken to complete the priority step. This will include a list of all the
activities that are required to complete this step. Which may include tasks like,
purchase the hardware kit, install operating systems, delivery date for furniture
delivery, booking of training room for training etc.
The fourth stage is to allocate resources for the tasks identified in the previous
section. This should include, booking time of key individuals, commitment from
the financial director for spending money, agreeing on the dates when systems
will be installed etc.
194

If one is satisfied with all the above steps, then the plan should be implemented.
And finally, only after successfully implementing the previous phase should one
move to the next. This ensures that the various phases of implementation link
into each other and form a coherent whole.
There may be cases where two or more phases have to be implemented
simultaneously, therefore the management needs to ensure that in such cases the
confusion is minimised and the staff are sufficiently trained and confident to
work with the new system.
7 .3.3.3 System review
Any new system must be reviewed regularly to ensure that it is giving the desired
results and that there are no deviations. This could be achieved by the following
method:
• Set review criteria
• Audit new system
• Compare to initial audit
• Report findings
• Agree action plan
• Set next audit interval
195

To leave the new system running without any initial monitoring or review would
defeat the purpose of implementing a new system. Review criteria have to be
defined and adhered to. The review criteria reflects the priorities of the company
and so each part of the new technology and its implementation are subject to a
review, the importance of which is determined by the relative importance of that
particular part. In brief, the review criteria ensure that the new technology and its
implementation is achieving the objectives of the company.
An audit in the accounting profession seeks to determine the financial state and
health of a business. By analogy, any audit of the new manufacturing system
would reveal its strengths and weaknesses, thereby indicating the extent to which
it has been successfully implemented.
There are many ways in which the system could be audited and different parts of
the system would need to be analysed in different ways. Methods of
measurement could include the inspection of productivity levels, or even a
questionnaire.
Essentially, the implementation of manufacturing systems seeks to achieve an
improvement in some part of the company organisation, financial strength or
quality of product. Whatever aims the implementation of new technology has,
the results have to be compared with any previous record of performance and this
is done through a systematic and comprehensive comparison between the initial
audit and the latest audit of the new system. This exercise should identify the
196
improvement in the reduction of lead times, improvement in quality, and savings
made due to less pilferage etc.
Any findings that are made from comparisons between the old and new
manufacturing systems, need to be presented to senior management in the
company and an action plan agreed upon for the corrective actions.
The action plan of senior management within the company needs to consider the
following; firstly any problems needed to be listed in order of priority, then the
steps specific to the resolutions of each problem should be laid down and
responsibility allocated to various personnel.
The timing of the next audit has to be set by considering some aspects of the
Manufacturing systems. The first aspect involves the lead-time of the products
since any meaningful audit would have to allow the system to run over many
cycles. In addition, other variables should be allowed to run their cycles in order
to obtain sound results and subsequent knowledge of the system.
7.4 Conclusions
This chapter has presented a novel approach that SME's can use in house to
introduce manufacturing information systems in their business. The approach
drew extensively from the research done in Devon and Cornwall, in particular
with structured visits and interviews with seventeen SME's in the region. The
197

approach also drew lessons from the mistakes made by SME's when introducing
new technology.
The new approach presented is a substantial improvement over the existing in
company or vendor led approaches, the latter of which tend to tie companies in to
very costly and open-ended relationships. Where users are not involved in
identifying problems devising solutions to their own problems, nor do
contracting consultants devote much effort to developing the skills and
knowledge of company staff. This results in the lack of commitment from the
company staff and poor use of the new system.
By using this original approach, in-house, the company will not only have a
documented record of all the various stages, but will also have in-house trained
and experienced who may be able to deal with in future expansion to the system
glitches in the system.
The content of the approach consists of three phases - Analysis, Solution
Development and Implementation. Each of three phases have a number of stages,
which are further divided into various steps.
From user-friendly perspective the approach has been simplified as far as
possible with the avoidance of any complicated techniques. The approach has
introduced novel information mapping and other decision making techniques,
that are easy to use and apply. The approach is original and comprehensive in
198

nature that leads a user from identifying the need for new technology to the
implementation. Chapter 8 considers the implementation of this new approach
within case study companies to validate its performance.
199
Chapter 8
Validation of the New Approach
8.1 Overview
For any new approach to be considered valuable and deserving of recognition, it
must be demonstrated, in 'real-time' experiments to prove that it is relevant and
practical to the industry concerned. The case study technique was chosen to be
the most suitable method of validating the proposed approach. However, the
inherent disadvantage of this technique is that it only considers a specific
application. To overcome this several case studies are required to obtain a
reliable conclusion. Also, the case studies have been chosen as they employ
various combinations of phases I activities, thereby making the test process more
robust.
To establish the suitability of the new approach, for introducing manufacturing
information systems in SME's in the Devon and Cornwall region, the approach
was validated in two different stages. First of all the evaluation of the approach
was undertaken at a seminar, delivered by the author and organised jointly by
Plymouth Teaching Company Centre, DTI and Devon and Cornwall Business
Links for the managing directors from SME manufacturing companies in the
region. Secondly the approach was demonstrated, and applied to five companies
in the region. The above validation and evaluation methods allowed the author to
facilitate enhancement to the approach, as well as establish its validity at the
practical level. This chapter, therefore presents the results of these validations.
200
8.2 Evaluation by seminar to practitioners
To facilitate the enhancement and revision of the approach, it was initially
presented and discussed at a seminar delivered by the author. The seminar was
attended by 16 practitioners. Ten of these delegates included managers and senior
directors from the local manufacturing SME's, who were planning or considering
improving their businesses, by employing new technology. Two delegates were
academics from the manufacturing and business school at the University of
Plymouth. The remaining four delegates were from the local offices of Business
Link and the DTI.
Initially, a presentation of the conclusions discussed in chapter 6 concerning the
manufacturing businesses in the Devon and Cornwall region, along with
problems faced by such companies, was made to the participants. Subsequently
the new approach was presented, explaining how the problems experienced by
these companies could be overcome, by employing the new approach.
Explanation of information systems and their use in manufacturing was also
undertaken.
Following the presentation, each company represented considered the
applicability, and usefulness of the approach to their own company.
The discussion after the presentation consisted of question I answer and feedback
sessions. The responses gained were extremely positive, with almost all
participants appreciating the long overdue, need for such an approach. The
201
company representatives, particularly, welcomed the simplicity and the ease of
use of the approach, as well as the use of information systems analyses technique
to understand the existing systems. The use of Input /Output diagrams and
information flow diagrams for mapping the existing information systems was
also greatly appreciated due to its simplicity of development compared to the
enormous quantity of information generated as a result.
The participants were asked to consider if they felt that they could use the
approach in-house, without any help from outside, and whether anybody would
employ the approach in the near future. The general consensus indicated that the
approach was simple and yet effective for companies to use. The participants
from the Business Link and DTI suggested that the approach be put in the form
of a workbook for companies to use. The other companies agreed, and the DTI
representative further offered to publish such a book.
At the end of the seminar, a managing director from of one of the companies
indicated that he would like to use the approach in his company, and offered his
company as a case study example. A representative from the Business Link also
suggested a local company, that could benefit from the use of this approach. The
second and more detailed stage of validation, reports on the case study results for
both of the companies together with the applications to three other companies.
202

8.3 Validation by case study
This stage of validation involved the actual implementation of the new approach
at five local SME manufacturing companies in the Devon and Cornwall region.
The approach was used at these companies with the company providing a project
co-ordinator who was responsible for the overall implementation of the project,
and the author involved as an observer/ guide to the use of the approach. The
observations provided insight into the feasibility of the proposed approach in the
real environment. The results obtained from the case study are 'Commercial in
Confidence' and are described while maintaining the anonymity of companies.
8.3.1 Company A
Company A is a food manufacturing company, it produces high quality food
products including mandarin in liqueur, high quality salad dressings, Christmas
puddings, chocolate fudge etc; in total the company has 103 different products.
Its current share is 30% of the market in Britain, and it also exports to the USA
and Australia. Some of the major customers of this company include, Harrods,
Boots, Marks and Spencer, and other speciality food companies. The company's
products are seasonal based with 80% of sales being achieved from June to
December. Although the company has been established for over one hundred
years, there have been several changes in management, the most recent of these
was in 1993. The company employs fifteen permanent staff and employs a
further forty, during the peak period. The company's turnover in 1995 was £1.2
million.
203

The company has some two thousand stock items, which are supplied by about
forty companies, the majority of which are located in the Devon and Cornwall
region. Some stock items, mainly glass bottles and specialist food items, are also
imported from the continent.
The company contacted the University of Plymouth for help and consultancy in
overcoming various problems in the manufacturing department: Ninety % of all
orders were being delivered late at that time. There had also been several
problems in the quality assurance area, particularly in the level of alcohol in jars
being either too much or too little; occasional discovery of fruit flies in the jars,
and poor hand finishing on packaging. The company had about £250,000
committed to work in progress. There were severe stock control problems, with
production often being halted because of the insufficient levels of stock.
The project at Company A lasted for over six months, it started with a meeting
between the author, project co-ordinator and the Managing Director to define the
project specification. The Table 8.1 shows the results of this discussion. Please
note that the project specification, at this stage, is only a guide and not to be
adhered to strictly.
204
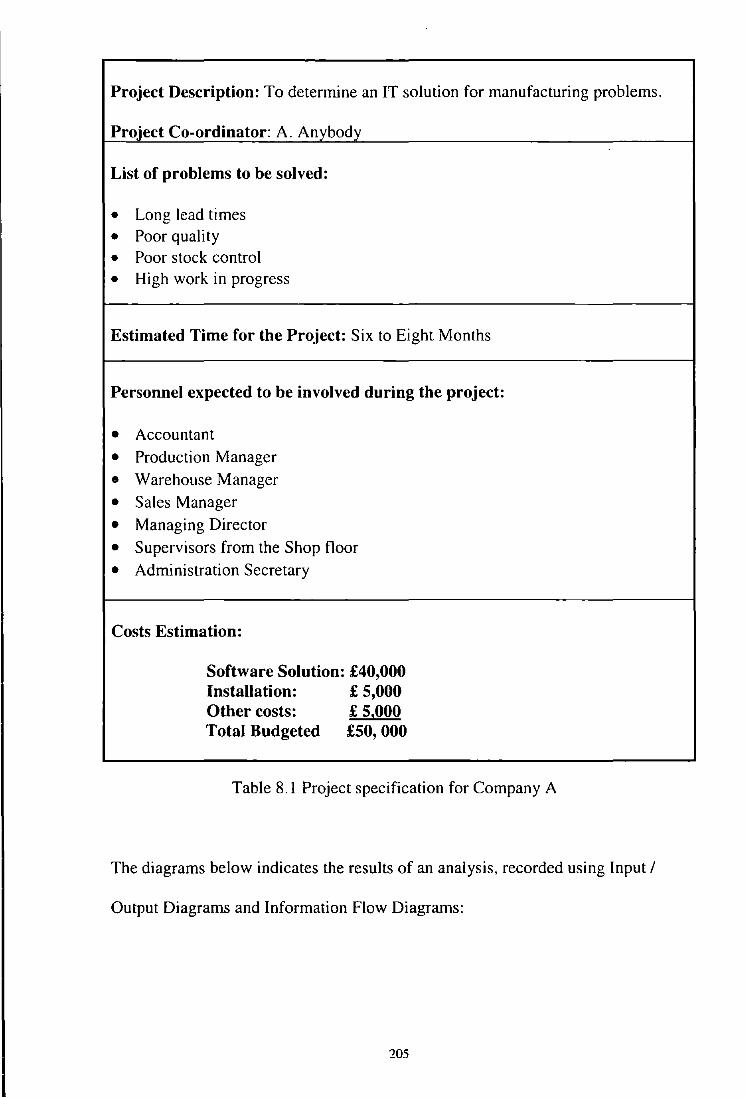
Project Description: To determine an IT solution for manufacturing problems.
Project Co-ordinator: A. Anybody
List of problems to be solved:
• Long lead times • Poor quality • Poor stock control • High work in progress
Estimated Time for the Project: Six to Eight Months
Personnel expected to be involved during the project:
• Accountant
• Production Manager
• Ware house Manager
• Sales Manager
• Managing Director
• Supervisors from the Shop floor
• Administration Secretary
Costs Estimation:
Software Solution: £40,000 Installation: £ 5,000 Other costs: £ 5,000 Total Budgeted £50, 000
Table 8.1 Project specification for Company A
The diagrams below indicates the results of an analysis, recorded using Input I
Output Diagrams and Information Flow Diagrams:
205
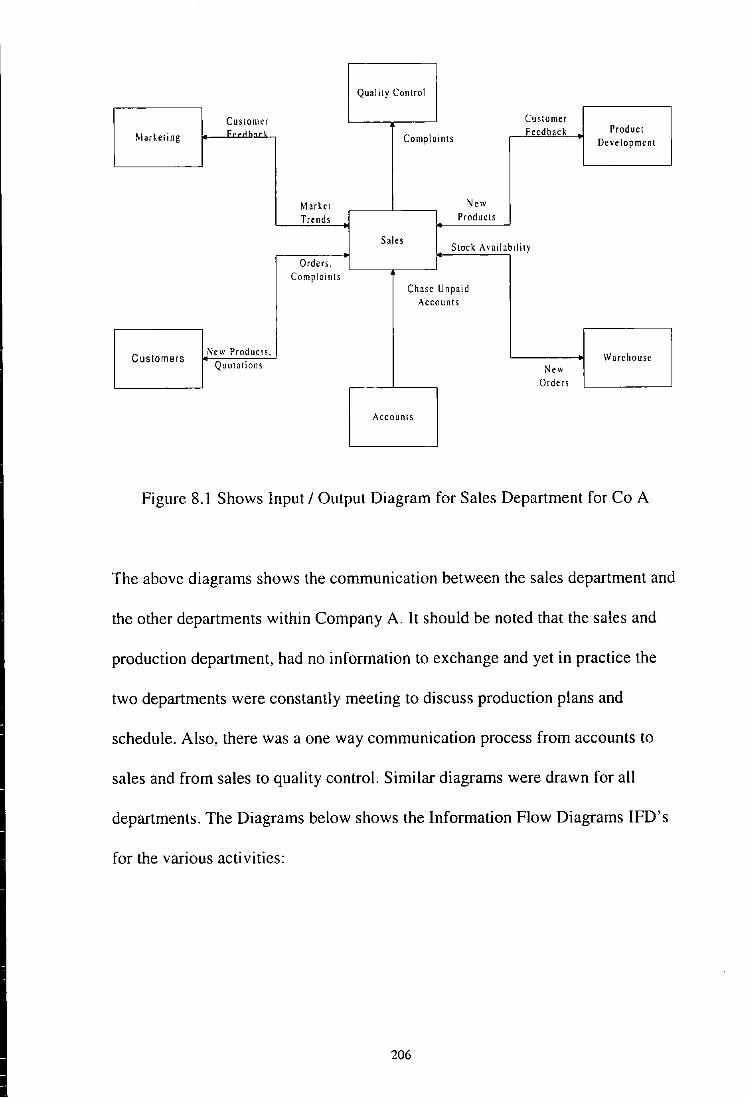
Quality Control
Customer Customer
Marketing < ·"h ,, Feedback Product Complaints Development
Market New
Trends Products
Sales Stock Availability
Orders, Complaints
Chase Unpaid Accounts
Customers New Products,
Warehouse Quotations New
Orders
Accounts
Figure 8.1 Shows Input I Output Diagram for Sales Department for Co A
The above diagrams shows the communication between the sales department and
the other departments within Company A. It should be noted that the sales and
production department, had no information to exchange and yet in practice the
two departments were constantly meeting to discuss production plans and
schedule. Also, there was a one way communication process from accounts to
sales and from sales to quality control. Similar diagrams were drawn for all
departments. The Diagrams below shows the Information Flow Diagrams IFD's
for the various activities:
206
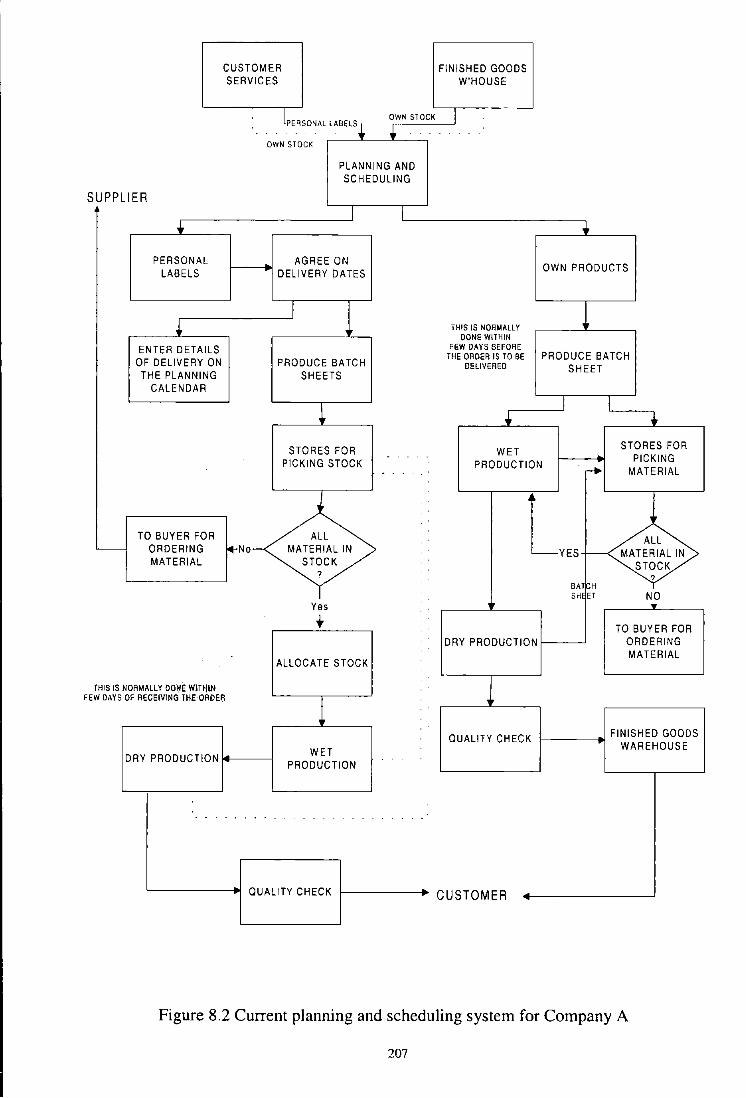
CUSTOMER
SUPPL IER
THIS IS FEW OAYS
.r PERSONAL
LABELS
~ ENTER DETAILS
OF DELIVERY ON THE PLANNING
CALENDAR
TO BUYER FOR ORDERING MATERIAL
NORMALLY OO~E WIT~III OF RECEIVING THE ORDEll
DRY PRODUCTION
SERVICES
_ _ lPERSONAL LABELS~ OWN STOCK . -OWN STOCK
PLANNING AND SCHEDULING
I I
AGREE ON DELIVERY DATES
I
" PRODUCE BATCH
SHEETS
1 STORES FOR
PICKING STOCK - -
ALL ~No MATERIAL IN
STOCK ?
Yes
...
ALLOCATE STOCK
WET PRODUCTION
- - - - -
QUALITY CHECK
FINISHED GOODS W'HOUSE
I
.. OWN PRODUCTS
THIS IS NOA~ALLY OONE WITHIN
FEW OAYS BEFORE THE ORDER IS TO BE PRODUCE BATCH
OELIVEREO SHEET
I I • • WET
STORES FOR PICKING
PRODUCTION 'r+ MATERIAL
L"' ALL MATERIAL IN
STOCK ?
BAT H SH ET NO ..
TO BUYER FOR DRY PRODUCTION ORDERING
MATERIAL
QUALITY CHECK FINISHED GOODS WAREHOUSE
CUSTOMER
Figure 8.2 Current planning and scheduling system for Company A
207
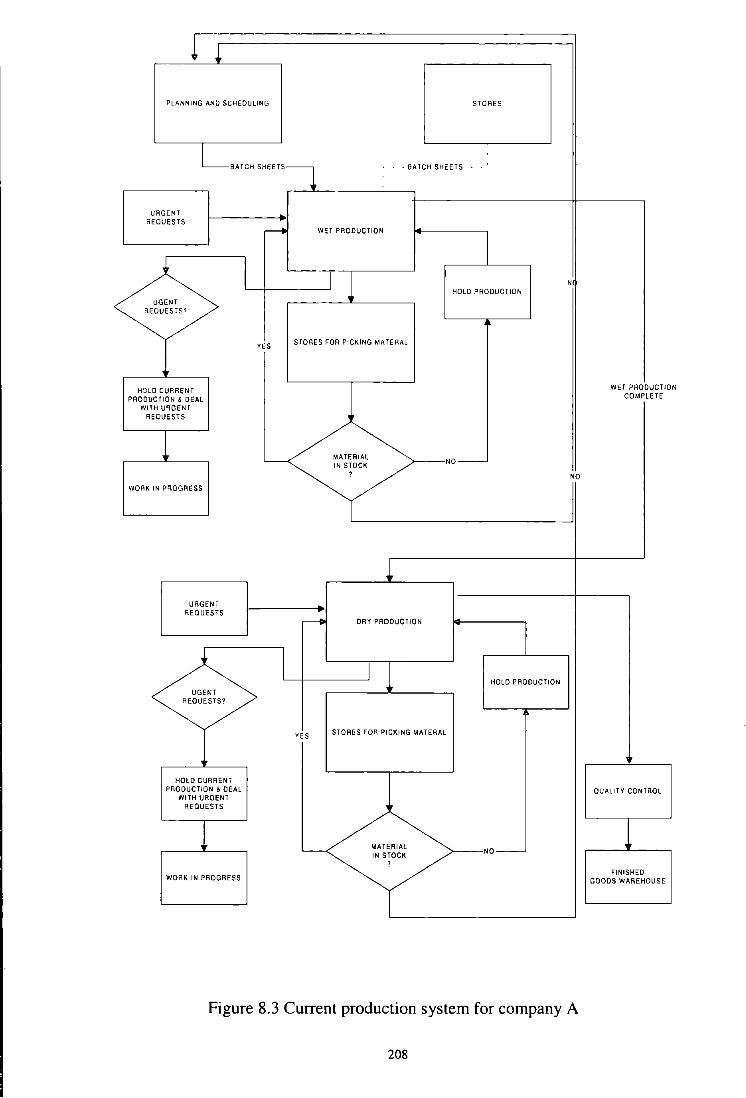
r r PLANNING AND SCHEDULING STORES
LBATCH SHEETS~ -BATCH SHEETS
URGENT REQUESTS ,... WET PRODUCTION
0 I N HOLD PRODUCTION
'
YES STORES FOR PICKING MATEAAL
HOLD CURRENT WET PRODUCTION
PRODUCTION & DEAL COMPLETE
WITH URGENT REQUESTS
MATERIAL NO-IN STOCK
? NO
WORK IN PROGRESS
l URGENT
REQUESTS ,... DRY PRODUCTION
0 I HOLD PRODUCTION
.
YES STORES FOR PICKING MATEAAL
HOLD CURRENT PRODUCTION & DEAL QUALITY CONTROL
WITH URGENT REQUESTS
MATERIAL NO-IN STOCK
' FINISHED
WORK IN PROGRESS GOODS WAREHOUSE
Figure 8.3 Current production system for company A
208
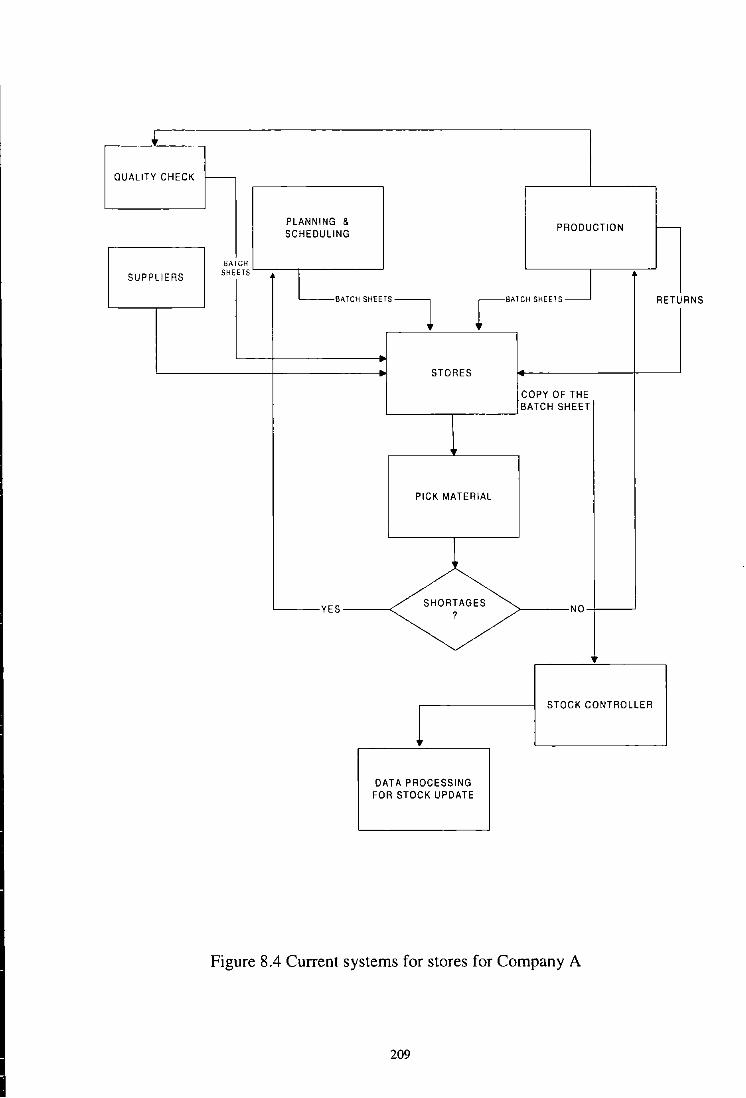
QUALITY CHECK r--
SUPPLIERS
PLANNING & SCHEDULING
STORES
L-------.-----~
PICK MATERIAL
PRODUCTION
COPY OF THE BATCH SHEET
L-----YES------<~>-------NO-r----~ ?
OATA PROCESSING FOR STOCK UPDATE
STOCK CONTROLLER
Figure 8.4 Current systems for stores for Company A
209
-
RETURNS
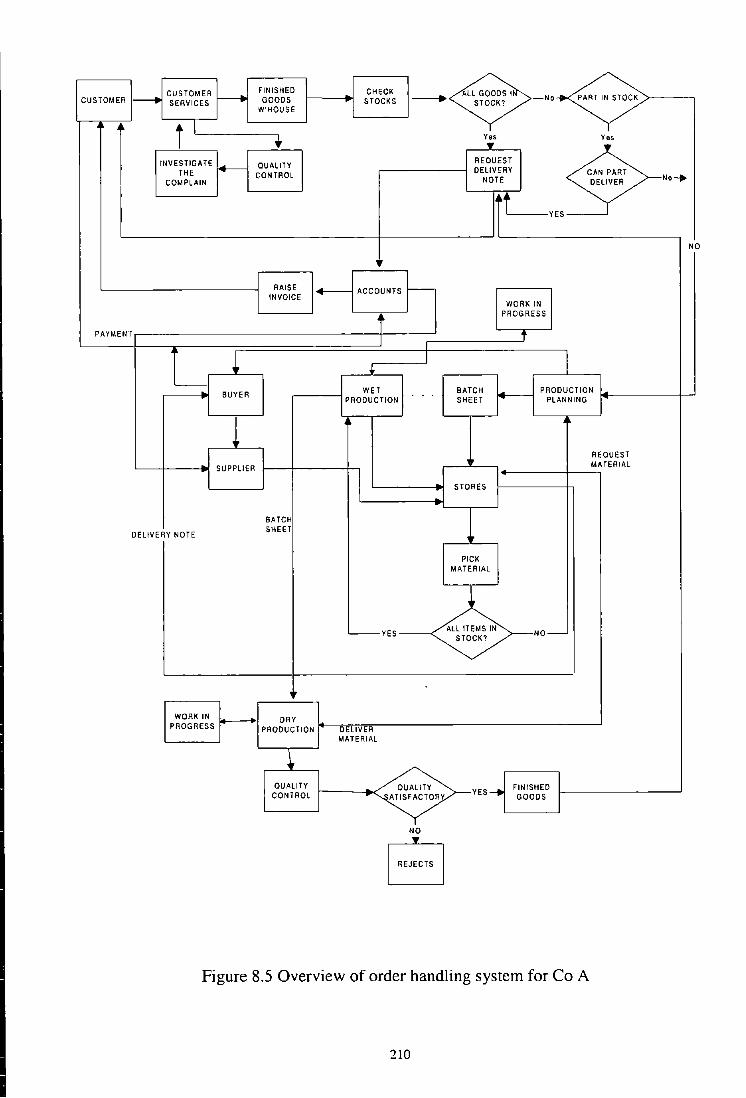
CUSTOMER ~
FINISHED CHECK All GOODS I CUSTOMER 1-- SERVICES GOODS STOCKS - STOCK?
-No PART IN STOCK
W'HOUSE
i I • Y:,s Yes
INVESTIGATE 1-- QUALITY REQUEST
THE CONTROL DELIVERY CAN PART
COMPLAIN NOTE DELIVER No_.
L_YES
NO
RAISE 1- f---INVOICE
ACCOUNTS
WORK IN
t PROGRESS
PAYMENT I t
~ I I ..
'---WET BATCH I-- PRODUCTION BUYER
PRODUCTION - -
SHEET PLANNING
l REQUEST
SUPPLIER MATERIAL
I STORES
BATCH
DELIVERY NOTE SHEET
PICK MATERIAL
-YES ~ .. -?
WORK IN DRY PROGRESS PRODUCTION DELIVER
MATERIAL
~ QUALITY QUALITY
YES_. FINISHED
CONTROL ~ ATISFACTOA GOODS
NO
8
Figure 8.5 Overview of order handling system for Co A
210

Figures 8.2 to 8.5 demonstrate the analysis of the existing systems of the various
departments. These diagrams can then used to compile a list of all the problems
identified. It must be realised that the diagrams were compiled following the
application of various techniques to assist the analysis process, i.e. Interviews,
observation, document searching etc. The Table 8.2 is the list of problems
created from the various problems as perceived by the company staff and the
assessment of the diagrams.
211

Identified problems for Company A
I. Incomplete information passed between different departments.
2. The orders from customers not clear
3. Poor planning and scheduling
(a) Duplicate booking of shifts
(b) Too many or too few production staff arranged
(c) Poor estimate of time required to complete a batch, often too little
4. Poor production control
(a) Too many people on shop floor
(b) Too many orders being made at the same time
(c) Production forms difficult to understand
(d) Untrained staff
(e) Poor layout of the production machines
5. Poor stock control
(a) No mechanism for recording out of stock items
(b) Long lead time on many stock items
(c) No recording of the movement of stock in and out of warehouse
(d) Poor understanding of finished goods requirements
(e) Poor or no estimation of stock requirements
(f) Poor quality stock
(g) Poor storage of stock- items passing sell-by dates
(h) Difficult to locate stock items in the warehouse
6. Lack of team work and too much backbiting I slandering
7. Significant amount of unaccounted stock items and finished goods
8. The existing IT technology underused due to fear of IT
Table 8.2 List of problems identified for Co. A
212
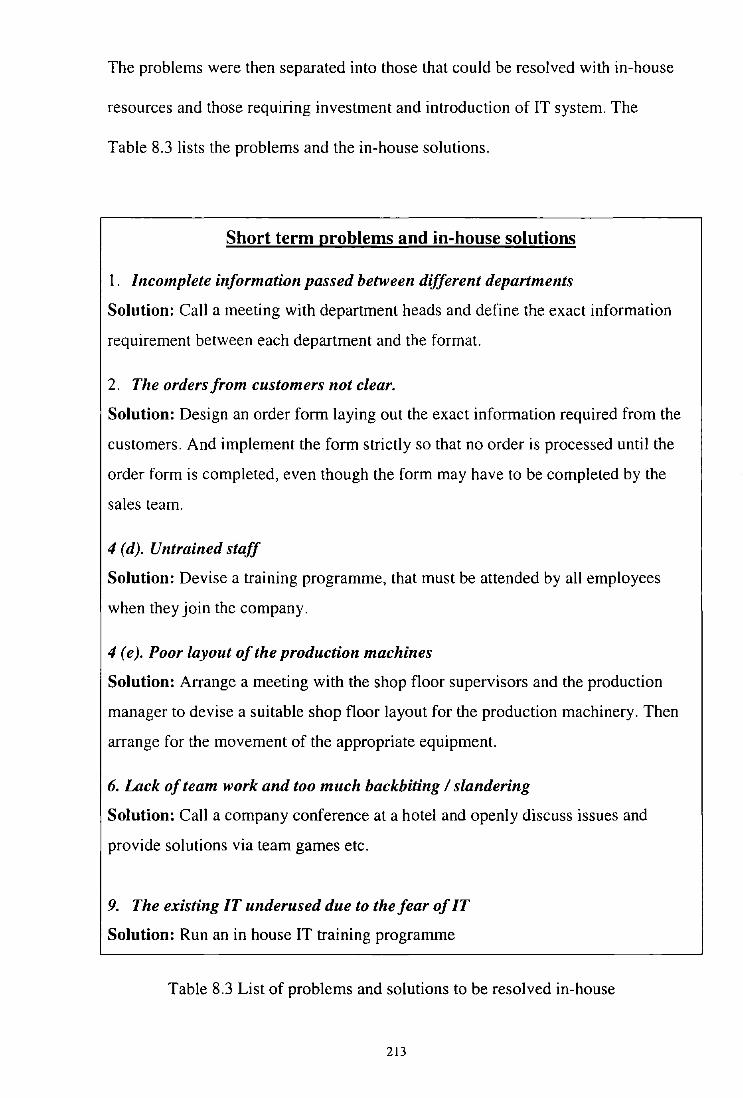
The problems were then separated into those that could be resolved with in-house
resources and those requiring investment and introduction of IT system. The
Table 8.3 lists the problems and the in-house solutions.
Short term problems and in-house solutions
1. Incomplete information passed between different departments
Solution: Call a meeting with department heads and define the exact information
requirement between each department and the format.
2. The orders from customers not clear.
Solution: Design an order form laying out the exact information required from the
customers. And implement the form strictly so that no order is processed until the
order form is completed, even though the form may have to be completed by the
sales team.
4 (d). Untrained staff
Solution: Devise a training programme, that must be attended by all employees
when they join the company.
4 (e). Poor layout of the production machines
Solution: Arrange a meeting with the shop floor supervisors and the production
manager to devise a suitable shop floor layout for the production machinery. Then
arrange for the movement of the appropriate equipment.
6. Lack of team work and too much backbiting I slandering
Solution: Call a company conference at a hotel and openly discuss issues and
provide solutions via team games etc.
9. The existing IT underused due to the fear of IT
Solution: Run an in house IT training programme
Table 8.3 List of problems and solutions to be resolved in-house
213
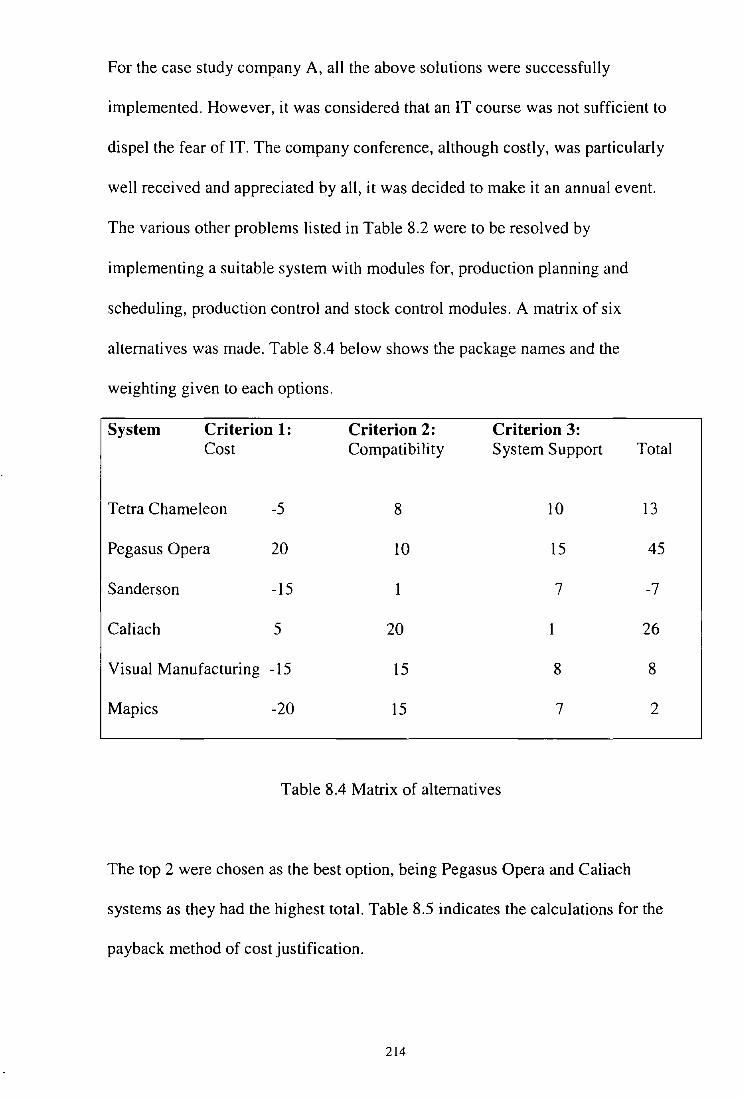
For the case study company A, all the above solutions were successfully
implemented. However, it was considered that an IT course was not sufficient to
dispel the fear of IT. The company conference, although costly, was particularly
well received and appreciated by all, it was decided to make it an annual event.
The various other problems listed in Table 8.2 were to be resolved by
implementing a suitable system with modules for, production planning and
scheduling, production control and stock control modules. A matrix of six
alternatives was made. Table 8.4 below shows the package names and the
weighting given to each options.
System Criterion 1: Criterion 2: Criterion 3: Cost Compatibility System Support Total
Tetra Chameleon -5 8 10 13
Pegasus Opera 20 10 15 45
Sanderson -15 1 7 -7
Caliach 5 20 26
Visual Manufacturing -15 15 8 8
Mapics -20 15 7 2
Table 8.4 Matrix of alternatives
The top 2 were chosen as the best option, being Pegasus Opera and Caliach
systems as they had the highest total. Table 8.5 indicates the calculations for the
payback method of cost justification.
214

Payback calculations for Pegasus Opera andVisual Manufacturing
Year Pegasus Opera Caliach
Return Payback Return Payback
0 -20,000 0 -35,000 0
1 5,000 5000 5,000 5000
2 7,000 12000 8,000 13000
3 7,000 19000 8,000 21000
4 7,000 26000 8,000 29000
5 7,000 33000 8,000 37000
Table 8.5 Cost justification using payback method
From Table 8.5 the best system, using payback method of cost justification the
best option is Pegasus Opera. This option pays the return on investment in just
over three years. Caliach system takes nearly five years to payback the return on
investment. Therefore the option of Pegasus Opera systems was selected.
It was decided to purchase and implement the various modules of the system
over eight months, and to run the system on the existing network and servers.
The Table 8.6 summarises the evaluation results of the approach for Company A.
These results were summarised by the project co-ordinator and the MD of the
company A.
215
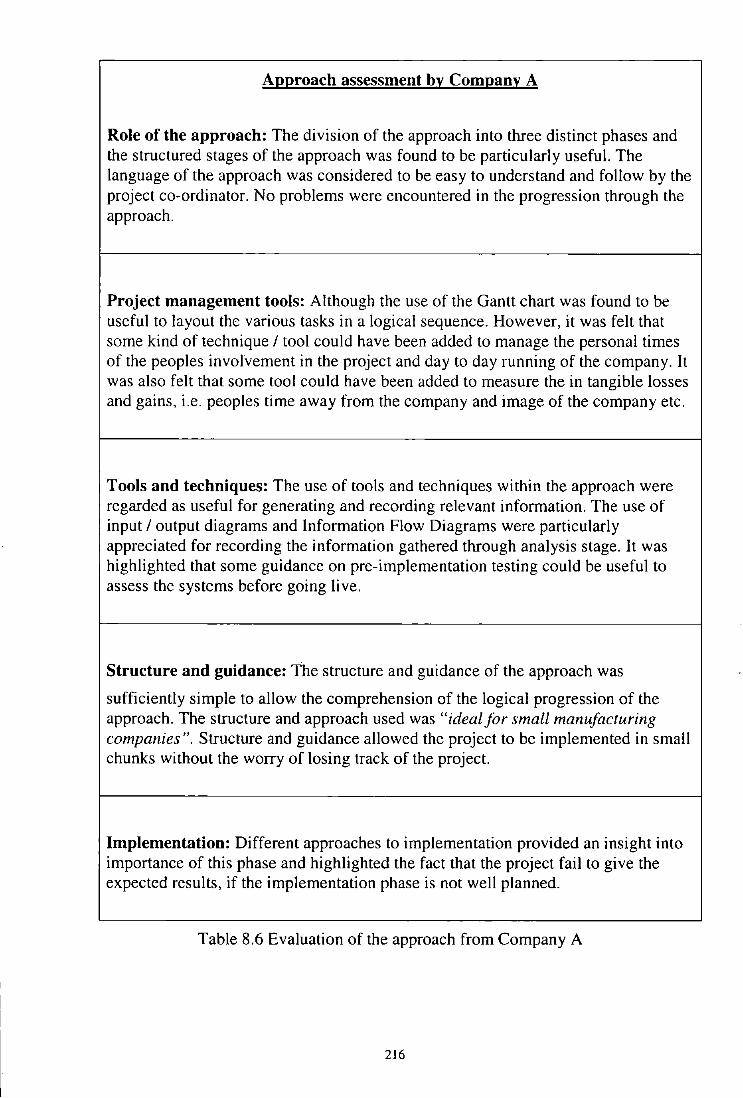
Approach assessment by Company A
Role of the approach: The division of the approach into three distinct phases and the structured stages of the approach was found to be particularly useful. The language of the approach was considered to be easy to understand and follow by the project co-ordinator. No problems were encountered in the progression through the approach.
Project management tools: Although the use of the Gantt chart was found to be useful to layout the various tasks in a logical sequence. However, it was felt that some kind of technique I tool could have been added to manage the personal times of the peoples involvement in the project and day to day running of the company. It was also felt that some tool could have been added to measure the in tangible losses and gains, i.e. peoples time away from the company and image of the company etc.
Tools and techniques: The use of tools and techniques within the approach were regarded as useful for generating and recording relevant information. The use of input I output diagrams and Information Flow Diagrams were particularly appreciated for recording the information gathered through analysis stage. It was highlighted that some guidance on pre-implementation testing could be useful to assess the systems before going live.
Structure and guidance: The structure and guidance of the approach was
sufficiently simple to allow the comprehension of the logical progression of the approach. The structure and approach used was "ideal for small manufacturing companies". Structure and guidance allowed the project to be implemented in small chunks without the worry of losing track of the project.
Implementation: Different approaches to implementation provided an insight into importance of this phase and highlighted the fact that the project fail to give the expected results, if the implementation phase is not well planned.
Table 8.6 Evaluation of the approach from Company A
216
In addition to the above evaluation, the MD of Company A regarded the
approach as a highly useful tool to understand the actual working of the company
and highlightthe causes of many problems. He was particularly appreciative of
the analysis phase and the various techniques that it suggests. The use of
diagrams to map the flow of information and processes was also greatly valued.
However, it was suggested that it would be an advantage if general templates of
various forms e.g. order forms, works forms etc. were provided as examples. Any
company can then modify these example forms to their specific needs.
8.3.2 Company B
Company B is a company specialising in manufacturing and mounting far
reaching lifts on all kinds of vehicles, with world-wide customer base. Major
customers include Dubai Airport, British Telecom, and South West Electricity
Board. Company B are the second largest manufacturers in its sector in the UK.
The annual turnover of the company for 1997 was£ 1.4M and it employs 20
permanent skilled staff.
The MD of the company approached the University of Plymouth's Mechanical
Engineering Department, for assistance in overcoming problems with quality
control, and quality assurance. All orders were being delivered late, even when
the lead times were twice as long as some of their competitors. The MD of the
company was provided with an overview of the approach, and he agreed to use
the proposed approach to resolve the problems identified.
217
The various diagrams and list of problems etc. are given in Appendix B. It was
decided to use version two of the information flow diagram for this company to
record the analysis of existing systems and designing a new system. The case
study of this company only utilised the first phase of the approach, analysis, as it
was discovered that all the problems within the company related to poor
management, and ineffective systems, rather then absence of any technology. A
significant number of problems were overcome by redefining the organisation
structure, and redefining job roles and job descriptions.
The company managing director evaluated the approach, (Table 8.7), and highly
commended it. He further added that without the approach he would have
invested more money into new technology rather then identifying the core issues.
The MD suggested that the analysis phase should include a list of possible
questions to ask interviewees that the user of the approach can utilise in his/her
investigation.
The Figures 8.6 and 8.7 demonstrate the use of second version of information
flow diagrams used for this case study.
218

( W 1\ order &
Focm
Build order 1nto b schedule !
)
f'::H\ Decide il order is \...:~ u19ent
liver
DIRECT " I ---------CUSTOMER j '-~~-
'f
little or no consullatfon on de_tivery datn
'r-
SALES
--------r CUSTOMERj ORDERS FROM ~ AGENTS
------------'f
• -1t8+ Works order
""'
Do nothin" urgent 10""' il "'" ,, Re uestlor r-delalteddmwtngs
I Issue detailed
drawings
t
t .
l ~;NERAL '" ,,-::;\._1 H~Ji. t -.-::==·'-'--Do nothing ANAGER drawrngs , '-..___...,. c-
- ! . '. """'"' I1 ~---
19sued delailed drawings
2-) Issue schematic - ,
work Myway I .... \. Blueprints diagrams
~-::;
t Produce
sch&ma!lc diagrams
t Decide to start HCheso orawings L· No
t 'f . INo BOM produced by the
}+
Issued schematiC draw1ngs -\ design englnlieis
l a·iueprints t - lr-~o~·~'·~·~·'~'~'~"~"~"~'-~1 I
" . rl'l
I
1920\
'"
l j_ \_ arts
~ ''""" BDM b .J r:::-- I __),-·-- '------+------'' -1\L_f-~__J'r-r-.. .. -c available? I Order parts J - I \.___...~
ASSEMBLY
o'""""' ~ .... ~.:~~.~Jrl .... m,,~l ~·( Is there tim~ lor
: 'O<g?[' _No
_ Send the vehicle anyway
No
" SUPPLIER Return perl! I RM
Figure 8.6: Existing customer order processing system mapped using version 2 of Information Flow Diagram (IFD)
219
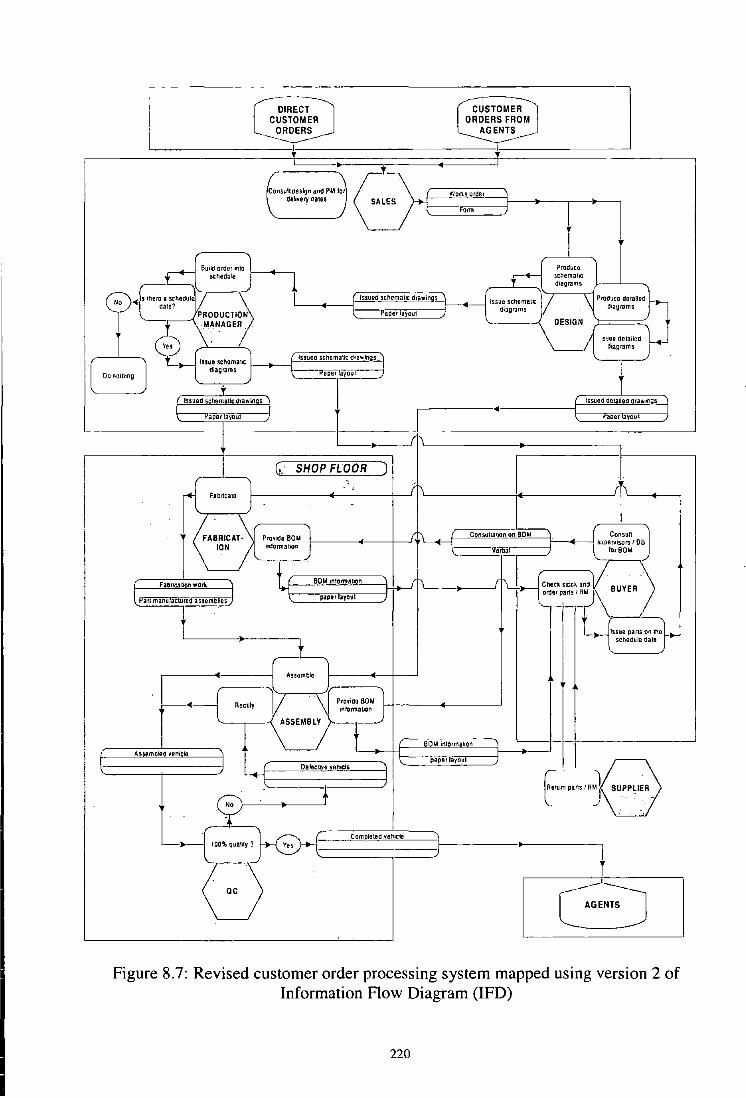
I ' I
I
I
I
I I
I
~ DIRECT J OMER CUSTOMER S FROM J
ORDERS ENTS---
~--------------- ---~ I I
"~····~""' 0 Wof\s order · deher_i aa1as SALES
l '- '""
-C '"'" "'"""I Produce
~ schedule )
t r- scnemalrc
Issued schema he dra•ings -1 (Issue sehema!IC dalo'
l diagrams I!LagtBms PRODUCTION aper ayou1
DESIGN
/"-y·-.. -a ? ........ ,I 9 0~\~"'"" Issue d&taLied
5 d.agrams J B ·~~-· ~suea scr.ematJC d~Li d1agrams ~-Papiil.iyoul
' t j
I
Issued schematic draw In s Issued dO!aUea drawltl s
l-------papenayou I
aper you
I (I\
(,,· SHOP FLOOR )
I r{ I !I\ (\ Fabrltalo j . .
mlormallon )
_(,H C nsuna!JOnonBOM Coos•n •J (upervisorslDB lorBOM (::X·--·"·' ~ c vom.1~
t BOM inlomahOn ,~, (\_r-e··~·· """) Faon~bon won.
~an manufiCWred assembhes_)
~ ortler parts I RM paper ayou
l lJ, ... , ''"'" '"'}~ t schedule !lata
Assombie
( Rec11ly I \ Provide BOM I j_ l inrormaiJQn
ASSEMBLY r----~~ BOM inlormallon
As em led ~enl le -j ~
( ) paper ayou
Del!tCIIVO YOilielo
'--+-
t""m ''"" RM
7 t SUPPLIER
.
[ "" '""'''' Completlld Yllllk:lll
'"
A () I
Figure 8.7: Revised customer order processing system mapped using version 2 of Information Flow Diagram (IFD)
220
I

Approach assessment by Company B
Role of the approach: The role of the approach was crucial as without the analysis techniques and guide from the approach the company may have invested substantial sum in new technology. The approach was sufficiently simple to allow for the easy understanding of the concepts and techniques.
Project management tools: The company had already been using Gantt charts on Microsoft Project 98 and find the software appropriate for the needs of managing small scale projects.
Tools and techniques: The use of simple diagrams to map the current information was found to be exceptionally useful. The use of three storey rectangular boxes for recording various information was also much appreciated. The MD was interested in learning other mapping tools and suggested that a brief introduction of other techniques like Data Flow Diagrams and IDEFO diagrams would be useful.
Structure and guidance: The structure and guidance of the approach was Excellent, it was simple and yet highly comprehensive and effective. The approach made the company consider in areas where it would have otherwise ignored. The language of the approach was to be non-technical which made the readability and understanding to be very user-friendly.
Implementation: The ideas in the implementation phase make the company aware of possible pitfalls and makes the process of implementation much smoother and controlled.
Table 8.7- Evaluation of the approach by Company B
8.3.3 Company C
Company C is a small surf board manufacturing company in Newquay. It
employs about twelve people. The turnover of the company in 1997 was
221

approximately £0.75M pounds. Surf manufacturing is a very specialist market,
with the majority of the sales occurring in the summer. Normally each surf board
is hand carved from polyurethane board with finishing touches applied according
to the demand from the customer.
The company was refeiTed by the local Business Link and the DTI office for
help, and guidance in developing some kind of an automated machine that could
shape the first process of the board, according to a defined shape. The company
had a limited budget of about £40,000 to develop this machine. The company's
own research indicated that there was only one machine of this kind available in
Brazil costing more than £0.5 million.
Although this case study did not require the full use of the approach, it did
however, make use of the research by utilising part of the phase 2 of the
approach, regarding researching for the solution. This case study is also an
excellent example of the collaboration between manufacturing company,
academia and the DTI.
After extensive discussion between the author, MD of the company the
University of Plymouth Mechanical Engineering Department and research from
the intemet, and journals it was identified that a similar machine was developed
by the Ministry of Defence (MoD) for building ship-models. After visiting the
MoD to look at their prototype, the manufacturers of the prototype were
approached and an outline of the requirement for the Company C was presented.
222
The AutoCam company based in East-Anglia, subsequently visited the Company
C in Newquay and gave a quotation of about £30,000 for the development of the
required machine.
The MD of Company C was grateful for the assistance provided by the approach
and the author. He further added that although the ideas for the research for
suitable technology, presented in the approach, were simple but he would not
have thought of them if the guidance was not there and would have wasted
considerable time and resources. The full approach was not applicable to this
company.
8.3.4 Company D
Company D manufactures and markets security boxes that are used by security
companies to take the money in and out of banks. These boxes have a built-in
device so that if the boxes are stolen, the device will trigger the release of red
dye that would stain the money. The company has a major share of the UK
market, and exports to a few European countries. The company employs 140
people.
Even though the company has grown two fold in the last six years, due to
increase in export, unfortunately the systems within the company never grew
with the company. At the time of the case study the company had severe
problems in almost all departments, including sales and administration. The
quality assurance was a major problem with 20% of the goods being returned due
223
to the bad quality. It was the feeling of the MD that he no longer understood the
manufacturing processes of the company. Although, a new production manager
had been appointed recently he also struggled to understand all the processes.
Following a visit to the university by a company representative, the author visited
the company in return and decided to employ the new approach. The co-ordinator
from the company was the production manager. Version 2 of the information
flow diagrams were employed to map the existing systems and to design a new
system. This case study lasted for over four months, and when completed various
new systems were designed and implemented for the company. It was also the
intention of the of the manufacturing manager to invest in an ERP system, but
unfortunately due to the internal politics of the company this did not materialise.
However, the work carried out, using the approach was considered to be
extremely successful.
The evaluation results presented in Table 8.8 represents comments made by the
manufacturing manager of the company.
224

Approach assessment by Company D
Role of the approach: The company found the approach to be practical for understanding the various information systems of the company. The company has decided to use the various techniques for recording any new information systems. The approach provided the company with logical steps in identifying bottleneck I weaknesses in the existing information systems. The approach also provided the company with ideas, e.g. effective layout of shop-floor machines etc. to increase productivity and minimise pilferage's.
Project management tools: The company did not think the use of Gantt charts alone were sufficient for management of complex project Suggestions were made to include various principle embedded in computer packages like Microsoft project, and Visio to be included as part of the approach.
Tools and techniques: The company was appreciative of the various techniques for analysing the existing information systems. The use of record searching and document analysis was more effective for the case of this company. The version 2 of Information Flow diagrams were praised for their simplicity in recording complex information. However, the company felt that the cost justification techniques presented in the approach were too simple and overlooked many issues like the intangible benefits etc.
Structure and guidance: The structure of the approach was ideally suited for the company. It allowed the company to work with the approach at their own pace. The guidance was simple to follow and gave a lot of ideas at various stages of the analysis and new system design. The analysis techniques were applied to all departments of the company including accounts and sales & administration.
Implementation: No specific comments were made as the company did not use this phase of the approach ..
Table 8.8 - Evaluation of the approach by Company D
225
8.3.5 Company E
Company E manufactures furniture for handicapped and special needs children.
The company supplies furniture to special needs schools throughout the UK, and
is the only supplier of its kind in the Devon and Cornwall region. The company
has been in existence for over ten years. In 1997 the turnover for the company
was just over £900,000.
The company had developed from a one man band to 20 employees, over the ten
years. The various procedures and systems of the company developed without
any planning or systems thinking. The company approached the University of
Plymouth for assistance in overcoming problems in stock control, quality control,
long lead times and manufacturing planning. The company decided to become a
case study company for the new approach as they could see the potential benefits.
A manager from the company was appointed as the project manager.
Detailed system analysis were conducted using the techniques and tools
presented in the approach. It was discovered that majority of the problems lay in
the company having poor information systems and procedures in place. The
management structure was also re-organised. At the solution development phase
it was concluded there was not a need for any investment in new technology
because the almost all problems could be resolved by re-organising the
information systems and management structure. The evaluation of the approach
was done by the project co-ordinator, please see Table 8.9.
226
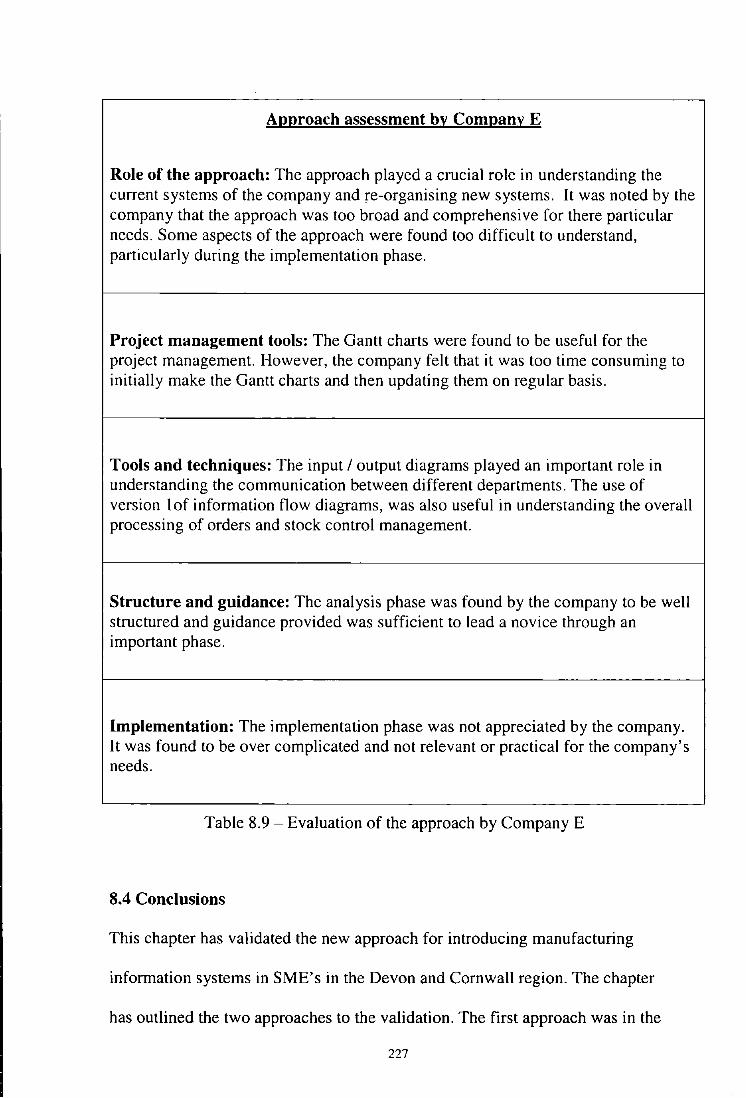
Approach assessment by Company E
Role of the approach: The approach played a crucial role in understanding the current systems of the company and re-organising new systems. It was noted by the company that the approach was too broad and comprehensive for there particular needs. Some aspects of the approach were found too difficult to understand, particularly during the implementation phase.
Project management tools: The Gantt charts were found to be useful for the project management. However, the company felt that it was too time consuming to initially make the Gantt charts and then updating them on regular basis.
Tools and techniques: The input I output diagrams played an important role in understanding the communication between different departments. The use of version lof information flow diagrams, was also useful in understanding the overall processing of orders and stock control management.
Structure and guidance: The analysis phase was found by the company to be well structured and guidance provided was sufficient to lead a novice through an important phase.
Implementation: The implementation phase was not appreciated by the company. It was found to be over complicated and not relevant or practical for the company's needs.
Table 8.9- Evaluation of the approach by Company E
8.4 Conclusions
This chapter has validated the new approach for introducing manufacturing
information systems in SME's in the Devon and Cornwall region. The chapter
has outlined the two approaches to the validation. The first approach was in the
227

form of seminar conducted in collaboration with local DTI offices, and the
University of Plymouth, for the practitioners and academics in the manufacturing
industry. The seminar was considered to be a success with much appreciation of
the approach and suggestion for the improvements. The feedback obtained from
practitioners has indicated that the approach has an essential role to play in
developing and introducing information systems in SME's. Any specific
comments were incorporated in the approach.
The second stage of the validation was conducted by implementing the approach
in five case study companies. In all case studies 'real' problems were resolved
using the tools and techniques outlined in the approach. The approach was only
fully tested in one of the companies, however, from the results obtained it can be
concluded that the approach had all the elements to support all the case study
companies, should the approach be fully utilised. In comparison to the alternative
approaches, the new approach has proven to be both cost effective and user
friendly, both factors being crucial for successful application in the SME sector.
The validations presented in this chapter have concluded that the approach is a
unique and original approach to identifying and resolving many of the problems
faced by the SME's in the Devon and Cornwall region. This novel work received
considerable praise from the practitioners and case study companies and when
widely available is expected to have enormous impact on small companies in the
region.
228

9.1 Introduction
Chapter 9
Conclusions
This work has developed a novel approach, that SME manufacturing companies
can use in-house, to introduce information systems and manufacturing
information systems in their companies. This approach will provide companies
with structured steps to assist them in identifying the inherent problems of the
company, and then identifying solutions to those problems, which may be either
the introduction of new technology or redefining of the existing structures and
systems. Finally it demonstrates how to successfully implement the solutions
identified.
The research has presented definitions of manufacturing, systems, information,
information systems and manufacturing information systems. It has also
suggested that an information system approach will provide a more appropriate
way to identify problems, and develop solutions. The approach has developed
novel information mapping tools that are easy to understand and implement for
small and medium size companies.
The intensive literature survey, and meetings with practitioners has revealed that
currently there is no such approach available in a form which is both accessible
and affordable for SMEs. There is no such methodology or approach that can
take the user from identifying the need through to implementing the solution. Yet
229

it is simple enough to be comprehended and successfully be implemented by
people with little or no understanding of carrying out such projects previously.
Although, the work has concentrated on the needs of SMEs in the Devon and
Cornwall region, the research has indicated that no such approach is available for
SMEs anywhere.
This work has also provided the foundations for future work, to further develop
and refine the approach and creates the basis for the creation of a workbook to
aid implementation. Tools and techniques that have been suggested can be
further developed to provide templates for various forms etc. However to do this,
it is recommended that additional case studies must be conducted, particularly
with companies that can fully utilise the entire approach.
9.2 Devon and Cornwall scenario
Manufacturing in today's dynamic and somewhat turbulent market, is not
straightforward. Companies no longer face competition from just their local
rivals, but with tremendous development, and adoption of the internet technology
by the buyers, the competition is now global. In such environment it has become
vital for manufacturing companies to produce high quality products, with less
lead time, and at an affordable cost to the consumer. This can only be achieved if
the companies are highly efficient in the use of their resources.
The manufacturing sector in Devon and Cornwall is relatively small compared
with many other UK regions. In 1998 it accounted for 16% of total employment
230

in Devon and Cornwall, compared with 21% in the UK as a whole. The
manufacturing companies in the region suffer from the extra disadvantages of
being in the periphery region of the country. The region suffers from the lack of
skilled labour, poor transportation network, lack of local suppliers, lack of local
customers, lack of technology support and awareness etc.
Given the inherent disadvantages suffered by the manufacturing companies in the
region it is therefore more important that companies have the necessary tools and
mechanisms available to them, to continuously improve their businesses, and
offset many of the stated disadvantages, e.g. lack of skilled labour etc. by
employing efficient systems and new technology they can attempt to remain
competitive.
9.3 Information systems and manufacturing information system
For small manufacturing companies to survive in today's buyer market, it must
have significant competitive advantage. Knowing the limitations of a company in
terms of production capacity, manpower capacity, resources available, can
provide the company with the extra advantages of having information available
to make reliable decision on taking new orders, knowing exact lead times on
products, and maintaining consistent quality.
The research has suggested that a company should follow the information
systems approach when analysing and understanding the existing workings of the
company, and developing new systems. Information systems are any systems,
231

whether manual or automated, that collect, store, process and disseminate
information. Manufacturing systems are an arrangement of computer hardware
and software, which includes an assembly of inter-related modules, or elements
directed towards providing manufacturing information, plans, and schedules, in
order to effect some control over the manufacturing operations of an
organisation, so that some key benefit can be achieved.
This research has suggested that taking the information systems and
manufacturing information systems approaches when defining a company's
operations I use of resources can provide the necessary extra benefits of being
able to make reliable decisions and hence lead to the desired competitive
advantage over rivals.
9.4 Requirement for an approach
Those companies that want to improve their information systems within their
companies, and introduce manufacturing information systems, often do not know
how to implement their ideas. What they lack is a 'road map', that will guide the
company towards making the correct decisions.
The figures presented in the research show that a large proportion of firms suffer
greatly, due to a lack of awareness of the different possibilities available to them.
Up to 30% of the costs in the implementation of new technology, are associated
with design and consultancy and a shocking 40% of automation attempts fail. In
fact, many companies have gone into receivership in an attempt to automate.
232
Taking into consideration the ignorance surrounding new technology, the
research has established that many of these bankruptcies could have been
prevented, if adequate guidance was available to companies when making the
important decisions. The research also found that 25% of companies did not
optimise the benefit from their technological change, while 20% of companies
over automated under the misguided notion that more technology equals better
results. These figures demonstrate the misuse and misapplication of technology
in most firms and the need for a structured approach that can guide the
companies when they are defining and implementing their new technology and
systems.
The guide must adopt a structured approach in order to enable firms to identify
the problems, develop solutions and implement effectively. The approach must
also be easy to understand and apply without the need for an outside consultants.
The approach must also be comprehensive enough to guide the user from
identifying the need to implementation.
9.5 The new approach
The novel approach presented in this research concentrated on developing a well
structured process for introducing manufacturing information systems. The
approach utilises the information systems analysis and solution development
techniques to specify requirements and needs. It avoids mistakes, made by
methodologies that are used for large organisation which are overcomplicated
233

and not dealing with all aspects of projects, by making the approach
comprehensive and yet easy to understand and follow.
The information system approach ensures that the right questions are asked and
provides some tools /techniques to help at various stages of analysis. It also
ensures that the true causes of problems and bottlenecks are identified and the
infonnation needed to develop solutions is articulated in a clearly understandable
form. The approach ensures that the relevant personnel are involved in the
process of identifying, defining and implementing any new systems. This
ensures the likelihood of any systems being readily accepted by all concerned.
The division of the approach in to three phases also ensures that the approach can
be used in separate parts. For example a company may want to only use the
analysis phase to identify and map their existing systems, and may not
necessarily wish to invest in any IT solutions. Other phases can also be used in
isolation.
This in-house approach is the only approach of its kind available to SME
companies in the Devon and Cornwall region, and an extensive literature survey
has revealed that that it appears to be unique even from a world-wide perspective.
The use of such approach gives the companies a complete control over their
projects and will also develop in-house skills, which may not be gained when
outside consultants are employed.
234
The approach has proved to be effective when applied to the case study
companies in the Devon and Cornwall region. The ease of use of the approach
has received many commendations and much appreciation from the companies.
The academics from the University of Plymouth and the regional offices of DTI
and Business Links also commended the work.
9.6 Contribution of the work
This work has provided a unique approach that SME companies can use in-house
to introduce information systems and manufacturing information systems to their
businesses.
The approach presented has been built on original work undertaken in the Devon
and Cornwall region, and also by making some comparison and reviewing the
region with the rest of the UK and Europe. The requirements for the approach
have been established through the use of structured interviews and free flowing
discussions with not only the MD's of the company, but also with the supervisors
and other managers. This method is considered more superior then that of using
just questionnaires which only answer the questions presented, and not
necessarily represent the true picture.
The work has defined information systems and manufacturing information
systems in the context of SMEs, and has developed original information mapping
tools and qualitative decision making technique that are easier to use than
existing tools and techniques available, and hence more appropriate for SMEs.
235
Furthermore, this approach will make it considerably easier for the company and
its staff to take ownership of the systems as well as developing new in-house
skills that will enable the company to make any future changes, or additions to
the existing systems without the need for outside consultants. For companies to
be able to modify and manipulate any implemented solutions for their company
is crucial, if they are to maximise the benefits they are to derive.
9.8 Future work
The work has provided a first step in providing an approach for SMEs to
introduce manufacturing information systems, using in-house resources.
Further work is required to refine and develop the approach by applying it to
more case study examples, where the full approach could be implemented to
derive the full spectrum of results .
This approach can be further enhanced by making the approach into a workbook
format, that could simplify the various steps by providing templates for various
forms and techniques and examples of case studies. There is also a need to
develop cost justification techniques that are specific for the use of SMEs, and
have some way of measuring the intangible benefits that may be gained from the
investment in technology.
There is also a scope to develop the approach into a computer package that will
provide support in both managing the project as well as assisting in various
236

aspects the approach for example design tools to draw diagrams, sample
interviewing questions, samples for manufacturing forms, order forms, etc.
237
References
A CARD, Rothwell Ray
Barriers to growth: The importance of Technology
Transfer Science Policy Research Unit, University of Sussex, London, 1986
Ashby, N.R.
( 1964) In: Open University Systems Group. Systems behaviour. 3'ct Ed.
Harper and Row, London, 1981.
Balcon R,
Educational Technologies for SMEs
DL T News, Issue 2, March, 1990
Barrow C.
The Essence of Small Business,
Prentice Hall Europe, 1998.
Barber 1., Metcalfe J.S. and Porteous M.
Barriers to Growth in Small Firms,
London, Routledge 1989.
Bartezzaghia,E., Ciborra,C., De Maio,A. and Magiolini,P.
Interaction between computer based information systems and organisation: an
empirical study.
Proceedings XXIII International Meeting of the Institute of Management Sciences,
Athens, 25-27 July, 1977.
Beeckman D.
CIM-OSA: Computer Integrated Manufacturing.
lot. J. Computer Integrated Manufacturing, Vol. 2 No. 2, 1989
238
Bertalanffy von,L.
Problems of life.
John Wiley and Sons, Inc., New York 1952, p.201.
Birch D.L.
The Job Generation Process.
Working Paper, MIT Program on Neighbourhood and Regional Change,
Cambridge, 1979.
Bjorn-Anderson,N.
Information Systems and Organisational Structure.
Proceedings of Management Information Systems Conference, North Staffs.
Polytechnic, Stafford, England. 11-22 July, 1977.
Blokdijk A. and Blokdijk P
Planning and Design of Information Systems,
Academic Press, 1987
Boelzing D. and Schulz H.
Calculating Investments for Integrated Manufacturing: Looking at the Overall Costs
and Benefits. The International Journal of Computer Integrated Manufacturing,
Vol. 2, No. 6, 1989.
Boelzing D.
Use of Computer-based Factory Automation
Int. J. Computer Integrated Manufacturing, Vol. 3, No. 2, 1990
Brandimarte P. and Cantamessa M.
Methodologies for Designing CIM Systems:A critique
Computers in Industry Vol. 25, 1995.
239
Brooksbank R. Kirby D. Wright G.
Marketing and Company Performance: An examination of Medium sized
Manufacturing Firms in Britain.
Small Business Economics, Vol4, pp 231-236, 1992.
Browne J.. and Duggan G.,
ESPIRIT Project 477: Production activity control design and implementation
Proc. 5th annual ESPIRIT conf.
Browne 1 .. Sackett P.J.. Wortmann J. C.
Future of Manufacturing Systems- Towards the Extended Enterprise.
Computers in Industry, Vol. 25, 1995.
Busby J. S ..
The Value of Advanced Manufacturing Technology,
Butterworth Heinemann, 1992.
Business Link.
Getting the Best from Your Supply Partners, Managing in the 90's.
The DTI, November 1995.
Business Link.
Design for Effective Manufacture. Managing in the 90's,
The DTI, September 1995.
Business Link.
Innovation, Technology and Design.
Devon and Cornwall TEC, 1997
240
Burns P., and Dewhurst J.
Small Business in Europe,
Macmillan, 1986
Caird S.
What Support is Needed by Innovative Small Business?
Journal of General Management Vol. 18, No. 2,1992.
CAM-!
Functional Specifications for an Advanced Factory Management System,
CAM -line., R-79-JSIG-01, March 1979.
Camillus J.C. and Lederer A.L.
Corporate Strategy and the Design of Computerised Information Systems,
Sloan Management Review, Spring 1985.
Checkland P,
Systems Thinking, Systems Practice
J. Wiley and Son, 1981
Chen, D., Vallespir B. and Doumeingts G.
GRAllntegrated ClM architecture- A Proposal
CIMCON 90: lnt. Conf. on CIM Architectures, Gaithersburg, MD,22-24, May 1990.
Chen,P.P.
The entity - relationship model : Toward a unified view of data,
ACM Trans. Data Base Syst., VOL.l, No.l, 1976.
241
Cherry,C
On human Communication.
2"ct Edition, The MIT Press, Massachusetts, USA, 1970, p8-9.
Chittenden F., Robertson M., Watkins D.
Small Firms: Recession and Recovery,
The Institute of Small Business Affairs, 1993
Chittenden F. and Robertson M.
Small Firms: Public Policy Issues in Recession and Recovery.
The Institute of Small Business Affairs, 1993.
Chesterton Consulting Group
An Economic Development Strategy for Devon and Cornwall.
Exeter Enterprises Limited. 1996
Clarke B.R.
Knowledge-based Configuration of Industrial Automation
lnt. J. Computer Integrated Manufacturing, Vol. 2 No. 6, 1989
CIM Reference Model Committee, Purdue University.
A Reference Model for Computer Integrated Manufacturing.
Int. J. Computer Integrated Manufacturing, Vol. 2 No. 2, 1989
Curran J, R A Blackbum
Local Economies and Small Firms: A view from the ground
ISBA, London, 1993.
Davidsson P., Lindmark L. and Olofsson.
Regional Characteristics, Business Dynamics and Economic Development.
Routledge, 1993.
242
Devon and Cornwall TEC
Opportunities for Growth: An economic Assessment of Devon and Cornwall, 1995
Devon and Cornwall TEC
Opportunities for Growth: An economic Assessment of Devon and Cornwall, 1998
Devon and Cornwall TEC
Opportunities for Growth: An economic Assessment of Devon and Cornwall, 1999
Diesing P
Patterns of Discovery in the Social Sciences
Routledge & Kegan Paul, London, 1972
Dooner M.
Conceptual Modelling of Manufacturing Flexibility
lnt. J. Computer Integrated Manufacturing, 1991, Vol. 4 No. 3
Doumeingts,G.
Methode de conception des systemes de productique, These d'etat en Automatique.
Universite de Bourdieux I, 1984.
Doumeingts, G.
Modelling techniques for CIM,
CEC Workshop on Computer Integrated Manufacturing System Architecture,
Brussels, 7-8 March 1990.
Doumeingts G., Vallespir B., Zanettin M. and Chen D.,
GIM GRAI Integrated Methodology- A methodology for Designing CIM systems,
GRAI I LAP, Universite Bourdieux I, version 1.0, May 1992.
243

Drury C.
Management Accounting for Business Decisions.
International Thomson Business Press, 1997
Dudley, N.A.
Engineers' Concepts of Production Efficiency. In: Industrial Efficiency and the Role
of Government .
Ed: Bowe,C., Department of Industry, HMSO., London, 1977.
Fairhead J.
Competitive Manufacturing.
12'h Conference of the Irish Manufacturing Committee, IMC-12, University College
Cork, September 1995
Fuller P B.
Assessing Marketing in SMEs
European Journal of Marketing, Vol 28, No 12, pp 34-48, 1994
Gane,C.H. and Sarson, T.
Structured Systems Analysis: Tools and Techniques,
1ST data- flow diagram, New York 1977.
Gallagher C., Robson G., and Kerr J.
Regional Variations in the Small and Medium-Sized Enterprises m Britain. The
Institute of Small Business Affairs, 1993
Ganguly P.
UK Small Business Statistics and International Comparisons.
Harper & Row, London, 1995.
244
Geisler E.
Managing Information Technologies in Small Business.
Journal of General Management Vol. 18 No.! Autumn 1992
Gibson P.
Manufacturing Management: Principles and Concepts
Chapman and Hall, 1995.
Glaser B. G. and Strauss A.L.
The Discovery of Grounded Theory: Strategies for Qualitative Research
Aldine, New York. 1967
Graefe V. and Thomson V.
A Reference Model for Production Control
Int. J. Computer Integrated Manufacturing, Vol. 2 No. 2
Grant A.D., Ngwenyanama O.K., Klein H.K.
Modelling for CIM Information Systems.
Computers in Industry, Yol18, 1992
Gripaios P A
The South West Economy Trends and Prospects, 101h Edition.
South West Economy Centre, University of Plymouth, 1998.
Gupta Y.P., Gupta CM., and Bector CR.
Review of Scheduling Rules in Flexible Manufacturing ..
Int. J. Computer Integrated Manufacturing, Vol. 2 No. 6
Harhalakis G., Lin C. P., and Medrano P. R. M.
INformation Systems for Integrated Manufacturing (INSIM) ..
lnt. J. Computer Integrated Manufacturing, 1991, Vol. 4 No. 6
245
Havinden M A, Queniary 1, Stanyer 1
Centre and Periphery: Brittany and Cornwall and Devon Compared
University of Exeter Press, 1991
Hegland D.E.
CIM -The Foundation for Factory Automation,
Production Engineering, May 1985.
Hitomi,K.
Manufacturing Systems Engineering.
Taylor and Francis, London, 1978.
Holmes 1.
Manufacturing and the Environment. Managing in the 90's.
The DTI, January 1992.
Hoos, I.R.
Engineers as Analysts of Social Systems- a Critical Enquiry.
Journal of Systems Engineering, 1976, vol.4, p.l.
Houldsworth E.
Technology Based Training as a Potential Aid to Competitive Advantage: A survey
of Small and Medium Enterprises and Training Enterprises Councils.
Working Paper, Henley Management College, 1992
Huang P. Y. and Sakurai M.
Factory Automation: The Japanese Experience,
IEEE Transactions on Engineering Management, Vol. 37, No. 2, May 1990.
lbrahim A, Goodwin 1.
Perceived Causes of Success in Small Business
American Journal of Small Business, Fall, pp 41-50, 1986.
246
IMP A CS,
A prototype IMPACS architecture,
Deliverable 1.2.1. IMPACS project restricted, April 1991.
lnamoto A.
Study of Object Orientated System Design of Factory Automation
Automatic Control- 12th Triennial World Congress 1993
Johnson R.A. , Kast F.E and Rozenweig, f. E.
Designing Systems Thinking.
The Business Quarterly, Summer, 1964.
Johnson, R.A. , Kast F.E. and Rozenweig l.E
The Theory of Management Systems.
2"u Ed., Mcgraw Hill Inc., New York, 1967.
Karlsson C., Johannisson B. and Storey D.
Small Business Dynamics; International, National and Regional Perspectives.
Routledge, 1993.
lain P. K. and Mosier C. T.
Artificial intelligence in Flexible Manufacturing Systems
Int. J. Computer Integrated Manufacturing, 1992, Vol. 5 No. 6
Jewitt R.
Just In Time. Managing in the 90's,
The DTI, March 1996.
]ones A., Barkmeyer E. and Davis W.
Issues in the Design and Implementation of a System.
Int. J. Computer Integrated Manufacturing, Vol. 2 No. 2 1989
247
Julien P.A.
New Technologies and Technological Information In Small Businesses
Journal of Business Venturing ,1995.
Karcanias N.
Integrated Process Design: A Generic Control Theory/ Design Based Framework.
Computers in Industry, 26, 1995.
King V. C. and Fisher E.L.
BARBS: Integrated Simulation ..
lnt. J. Computer Integrated Manufacturing, Vol. 2 No. 6 1989.
Keeble D.E. and Kelly T.
New Technology Based in Firms in Britain and Germany.
Anglo-German Foundation 1988.
Kochhar,A. and Parnaby,J.
The Choice of Computer Systems for Real Time Production Control.
J .lnst.Prod.Engs., 1977, 56,29.
Kochan D.
Intelligent Production Technology Future-oriented Vision or Industrial Reality.
Computers in Industry Vol. 28, 1995.
Lecuire V., Lepage F., Bran J. Y.
Factory Automation and Manufacturing
Proceedings of the 19th Annual Conference
Lees J, Lees D.
Realities of Small Business Information System Implementation,
Journal of Systems Management, Vol25 (1), pp 6-13, 1987.
248

Lefebvre LA. Harvey J and Lefebvre E
Technological Experience and the Technology Adoption Decisions in Small
Manufacturing Companies.
R & D Management. Vol 21(3), pp 241-249, 1991
Littover M .. Randvee 1 .. Tavast R .. Vain J.
A Modelling Framework for Integrated Factory Automation
CIM in Process and Manufacturing Industries
Lint L. J. 0.
Real Options Analysis in Advanced Manufacturing Technologies
lnt. J. Computer Integrated Manufacturing, 1992, Vol. 5, No. 3
McRae, T.W.
Management Information Systems,
Penguin Books, London, 1971.
Meredith J.
Management Survey on Justifying New Manufacturing Technologies.
International Journal of Computer Integrated Manufacturing, Vol. 2, No. 3, 1989.
Meredith J. R.
Implementation of Computer Based Systems
Journal of Operations Management, Vol. 2, No. 10, 1981.
Merdith J.R.
The Implementation of Computer Based Systems,
Journal of Operations Based Management (American Production and Inventory
Control Society), Vol. 2, No. 10, 1981.
249
Meredith J.
Automation Strategies.
University of Cincinnati, May 1986.
Miles M Band Huberman A M,
Qualitative Data Analysis: A Sourcebook of New Methods
Sage, 1984
Miller.l.G. and Graham, M.B. W. with Freeland. J.R., Hottenstein,M., Maister,
D. H., Meredith,J. and Schmenner,R. W. ( 1981).
State of the Art- Production/Operations Management Agenda for the '80's.
Decision Sciences, 1981, 12, 547-571.
Moss S. P.
A Management and Control Architecture for Manufacturing System
Int. J. Computer Integrated Manufacturing, Vol. 2 No. 2, 1989
Mulvenna M. D., Scott T.M., Leahy D. G., Hughes J.G.
The Caged Tiger of Technology: KBS and Technology Transfer in SME's.
NI Knowledge Engineering Laboratory, University of Ulster,UK.
N.E.D.O.
Computers in Production Control.
National Economic Development Office, London, March, 1984.
Nicholson 0.1.
The Production Cinderella - Causes.
Management Today, June, 1976.
250

Nygaard,K.
The Role of Information Systems.
Proceedings of Management Information Systems Conference, North Staffs.
Polytechnic, Stafford, England, II-22 July, 1977.
Oakey R.P.
High Technology Small Firms.
Prentice Hall, London 1984.
Open University Systems Group.
Systems Behaviour,
Harper and Row, 1981, P.14.
Page-lanes M.
The Practical Guide To Structured Systems Design, 2"d Ed., 1988.
Palmer R.S.
Factory Automation -Not Just for Large Companies
Energy Technology 11: Applications and Economics 1984
Parnaby,J
Concept of a Manufacturing System.
International Journal of Production Research, 1979, 17, 123-135.
Porter,A.
Cybernetics simplified.
English Universities Press, London 1969, p.28.
Rickwood C,
Managed Costs and the Capture of Information
Accounting and Business Research, Vol17, pp319-326
251
Romano CA.
Research Strategies for Small Business: A case study approach
International Small Business journal, Vol 7 ( 4), 1989, pp35 -43
Robertson M., Chell E., Mason C.
Towards the twenty-first Century: The Challenge for Small Business.
United Kingdom Enterprise Management and Research Association's 131h National
Small Firms Policy and Research Conference, 1990.
Rothwell R.
SMEs and their Role in New Technologies
Final Hearing, 5 May 1987, E.C. Brussels
Ray V., Banerjee P. and Liu CR.
Design of Automated Assembly Environment
Computer-Aided Design Volume 21 No. 9 (Nov. 1989)
Savolainen T. and Cantamessa M.
The Creative Agent in CIM Modelling
Computers in Industry 25 ( 1995)
Skivington J.J.
Computerising Production Management Systems; A Practical Guide for Managers,
John Wiley and Sons, 1990.
Smith G.S.
Managing to Succeed; Strategies and Systems for Manufacturing Businesses,
Prentice Hall, 1995.
Smith S. and Tranfield D.
A Catalytic Implementation Methodology for CIM.
Int. J. Computer Integrated Manufacturing, Vol. 2, No. 3, 1989.
252
So.ftech
Integrated Computer-Aided Manufacturing (!CAM) Architecture Part 11: Composite
Function Model of 'Manufacture Product' (MFGO),
Softech Inc., June 1981.
Soh C. Yap C, Raman K.
Impact of Consultants on Computerisation Success in Small Businesses
Information and Management, pp 309-319, 1992
Spur, G.
Manufacturing Systems Approach in the Designing of Machine Tools.
Advances in Manufacturing Systems Research.
Pergamon Press, London, 1971.
Stamper,R.K.
A Philosophy for the IFIP Systems Curriculum Appropriate to a University.
Proceedings, 2"d World conference on Computers and Education, Moreeilles, 1975.
Stamper,R.K.
Information Analysis Of Administrative Systems Based On Legislation
Implications For Data Base Design.
Working paper, LIO. (Legol. Project), LSE System Research Group, 1977, p.2.
Staughton R, Williams C, Hill T, Westbrook R,
Why Consultants Fail UK SMEs: Data and Opinion
Proceedings of the 3'd International Conference of the European Operations
Management Association, London 2-4 June 1996
Steven R., Lee/air and Abrams F.L.
Qualitative Process Automation
lnt. J. Computer Integrated Manufacturing, Vol. 2 No. 4, 1989
253
Sundgren,B.
User Controlled Design of Information Systems.
Proceedings of Management Information Systems Conference, North Staffs.
Polytechnic, Stafford, England. 11-22 July, 1977.
Talavage J. J. and Shodhan R.
Automated Development of Design and Control Strategy ..
lnt. J. Computer Integrated Manufacturing, 1992, Vol. 5, No. 6
Teaching Company Scheme.
Strategic Impact of TCS on Small and Medium Companies.
Seminar Proceedings Vol. 5, No. 7, November 1995.
Tepper R.
Fail Safe Small Businesses,
John Wiley & Sons, Inc, 1997.
Tranfield D and Smith S
Managing Rapid Change
Management Decision, Vol 20( 1 ), Spring 1988
Vallespir, B., Doumeingts G. and Zanettin M.
Proposal for an integrated approach to model and design manufacturing systems:
The GRAI Integrated Method,
Third Int. Conf. On Computer Applications in Production and Engineering, Tokyo
and Japan, 2-5 October 1989.
Vianen J.
Small Business Developments In The Long Run And Through The Business Cycle:
Lessons From The Past In The Netherlands.
Routledge, 1993.
254

Vickers,G.( 1955)
Communications in Economic Systems, In: Evans, B.I. , Studies in Communication,
Seeker and Warburg, 1955, 69-90.
Vliegen H. 1. W. and Mal H. H. V.
Innovation and Development Strategy
Int. J. Computer Integrated Manufacturing 1991, Vol. 4 No. 3
Wang K.S., Hsia H. W., and Zhuang Z.D.
An Intelligent Decision System for a Modem Manufacturing System.
Int. J. of Computer Integrated Manufacturing, Vol. 6, No. 5, 1993.
Wantuck, K.A.
The Japanese Approach to Productivity.
Bendix Corporation, July, 1982, p2.
Weeks, 1. K and Merrick, G
A Study Of Japanese Manufacturing Methods And A Report On A Trial Application
At Jaguar. Unpublished B.Sc. Thesis, Department Of Engineering Production,
University of Birmingham, September 1994.
Weston R.H., Hodgson A., Gascoigne 1.D., Sumpter C.M., Rui A.
and Coutts 1.
Configuration Methods and Tools for Manufacturing ..
Int. J. Computer Integrated Manufacturing, Vol. 2 No. 2, 1989
Williams B. R.
Manufacturing for Survival.
Addison-Wesley Publishing Company, 1995.
255
Williams D. J. and Upton D. M.
Syntactic Models of Manufacturing Processing and Control
lnt. J. Computer Integrated Manufacturing, Vol. 2 No. 6, 1989
Willmott P.
Optimising Plant Availability. Managing in the 90's.
TheDTI,June 1991.
Wilson B.
Systems: Concepts, Methodologies and Applications
John Wiley, 1984
Wilson P,
Computer Supported Co-operative Work: An introduction
Intellect, Oxford, 1991
256

Appendix A
Information Systems and CIM Design Methodologies
Information System Methodologies
Overview
This Appendix outlines, in detail, some of the most widely used Information
system methodologies in commercial environments. The methodologies are
presented here so that their principle and concept could be followed are
supplementary to chapter 5.
Methodology 1: STRADIS
Introduction
STRADIS ( Structured Analysis Design & Implementation of Information
Systems ) was conceived by Chris Gane and Trish Sarson as a methodology to
formalise the use of structured design in the development of any information
system. It was envisaged as being applicable to any size of information system
development project and to cope with any degree of intended automation. The
methodology is based upon earlier work on structured design by Stevens, Myers
and Constantine (1974) and later refined by Yourdon and Constantine (1978) and
Myers (1975 and 1978).
Gane and Sarson's book 'Structured Systems Analysis' (Gane and Sarson, 1979)
gives a description of an information systems development methodology, but not
in any great detail. Their approach is restricted mainly to a series of techniques -
used in a structured fashion - which are applied to the development of an
information system. Both it's strengths and weaknesses result from this fairly
narrow perspective, in that structured design is a useful way of tackling
information system design, (especially through it's use of Data Flow Diagrams
(DFD) and functional decomposition) but it does not address either any preceding
information system problems and their resolution, or the implementation of the
newly designed information system. The methodology does, however, epitomise
the use of it's chosen techniques amongst the many other methodologies which
use them.
The stages of the methodology
STRADIS methodology is broken down into four stages :
• Initial study
• Detailed study
• Defining and designing alternative solutions
• Physical design
Expanding each of these :
Initial study
To ensure that the systems being studied are the ones most worthy of
development, an initial study is carried out. A costs and benefits analysis
establishes the viability of continuing to develop each of the systems under
consideration. Systems Analysts gather information from managers and users,
existing strategic information systems plans and in-use documentation are
2
considered. DFD's (Data Flow Diagrams) of existing systems are produced and
time and cost estimates for the construction of more detailed analyses are
produced during this phase.
On completion of this stage, a report is produced outlining a proposal, which is
presented to the management, who then decide whether to accept and proceed to
the detailed Study phase. The following must be noted for this stage:
• This is not a feasibility study, and doesn't produce the same depth of
information.
• No review of alternative approaches is included.
• There is no commitment to implementation required from the owners at this
stage (although the cost of the Detailed Study has to be born).
Detailed study
Throughout the detailed study, the existing system is researched in detail, to
allow managers to review in more depth and decide whether to proceed or not.
Potential user groups are identified as senior managers, middle managers and end
users and their interests and needs are determined through interviews. From this,
a draft logical DFD is prepared, extending beyond existing system boundaries to
also include interfacing systems. The DFD is decomposed and each process
described using process logic representation techniques such as decision trees and
tables, structured English. The overall correctness is checked by reviewing and
'walking through'. The mechanics of DFD construction and functional
decomposition are illustrated and discussed in the next chapter.
3
The review of costs and benefits of the new system, carried out in the Initial
Study, is further refined. The impact of it's implementation, on the organisation,
is analysed and alternative proposals are laid out. Management then decide
whether to proceed, basing their decision on this study presented by the analysts.
Defining and designing alternative solutions
At this stage of the methodology the objectives of the organisation, which may be
stated as, for example, to increase revenue, are translated into system objectives
to enable a range of alternative solutions to be presented. System objectives are
specific and from these a DFD of the proposed system is produced. This should
display a level of detail which shows that the important objectives are being met.
During the next stage, the design phase, analysts produce a range of alternative
solutions to varying combinations of cost, implementation timescale and
objective satisfaction. Based upon this stage's report, an alternative is chosen
with which to proceed. The report should contain:
• The current system's flowcharts/DFD.
• A statement of the current system's limitations.
• The new system's flowcharts/DFD.
and for each alternative proposal
• Associated costs and benefits.
• A programme for implementation.
• Associated risks.
4
Physical design :
At this stage designers convert the chosen alternatives into a physical design
through:
I) Refining and finalising both the process detail of the DFD (including error
and exception handling), the data dictionary content and the interface
design, with the users.
2) Designing and establishing the database; data stores are introduced.
3) Rationalising the database; and the data store via normalisation.
4) Distinguishing between 'transforming' and 'transacting' processes on the
DFD and deriving a modular hierarchy.
5) Defining clerical tasks.
Finally, the costs associated with the system's development and implementation
are estimated, being based principally upon :
• The time required to develop the system modules.
• The computer system required.
• The costs of peripherals and data communication.
• The time to develop training and documentation.
• User I system interaction time
• System maintenance time.
5
Methodology 2: Information Engineering (lE)
Introduction
The exact origins of lE are unclear, but it has it's roots in both the data modelling
development work done by Clive Finkelstein, in Australia in the 1970s, and later,
a collaborative venture between him and James Martin, and also systems
development work by Ian Palmer and colleagues at CACI Inc. International, also
in the 1970s. lE has also become diverse in it's approaches, through independent
development around the world and commercial popularisation - most importantly
by James Martin. Martin himself regards lE 'as a generic class of methodologies',
not as a single dogma.
lE is claimed to be a methodology that covers all aspects of the information
system development life-cycle. It is viewed as a framework which covers the
fundamental things that have to be done to design and implement a high quality
system, within which a range of techniques are utilised to achieve system
development and support the framework. The techniques in current use may
change (as they are not part of the framework), to be replaced by alternatives that
are more appropriate as required. The framework itself is seen as still evolving -
in particular with the use of automated tools and 4GL systems development - but
it is a practical, applicable and proven management tool. It's results reflect the
needs of clients. lE is based on the precepts that:
6
• Information is more stable than the processes that operate on it, so placing an
organisation's data types (and it's data structure) at the information system's
centre provides a more stable basis for the system's operation.
• Communication within the methodology is best achieved through the use of
diagrams. Each technique is oriented towards producing diagrams and these
are produced at each major stage. Organisational complexity would normally
necessitate the use of an automated support tool in diagram production.
• The methodology is defined as 'top-down' i.e. an organisation and system
overview is taken and broken down into areas of interest, which are solved on
their own, but as part of the whole. Therefore, the overall objective remains
the same, whilst detail objectives change as system design progresses.
The levels of the methodology
Four levels are identified, and these are broken down further into phases. The
levels are:
• Information strategy planning
• Business area analysis
• System planning and design
o Construction
Information Strategy Planning (ISP) :
This is an analysis of the overview of the business and its corporate objectives
and is seen as the fundamental starting point of the methodology. Although it
7

may not necessarily be carried out by the IE analysts but by the corporate
managers, this positions the information system in support of the business's
objectives. ISP has four elements :
Current situation analysis
Analyses the organisation's current position in terms of the strengths and
weaknesses of it's current systems, and the preliminary information architecture
is defined.
Executive requirements analysis
Managers input their preferences, needs and perceptions. Critical Success Factors
(CSF's) are identified at a high level, as well as for the decomposed elements.
Architecture definition
An overview is taken of the information layout in terms of function and
distribution. And an ideal business system, plus supporting technology and
support function, is defined.
Information strategy plan
Information architectures are separated into logical business areas and
development and implementation plans are drawn up. The ISP is completed,
stating the chosen strategy, including priority projects.
8
Business area analysis
At this stage a detailed data and function analysis is performed on the previously
identified business areas. Tasks in this stage are :
Entity and function analysis
This task involves analysis of entity types, relationships, processes and
dependencies, also at this task function hierarchy and dependency diagrams are
constructed. Attributes and information views are defined.
Interaction analysis
The relationships between data and functions are examined to determine the
nature of those relationships. Entity life-cycles and process logic are also
analysed and process action diagrams prepared.
Current systems analysis
The 'old' and 'new' systems are modelled in the same way for the purposes of
comparison and to ensure the transition is smooth. Canonical synthesis is used to
bring together different functional views of data in an entity model, duplications
are removed through normalisation, producing a syntheses of views.
Confirmation
Here the previous results are cross-checked for completeness, correctness and
stability. Possible changes to the business are examined for their impact.
9
Planning for design
The parts of the model to be developed are defined and implementation
procedures and design objects are planned.
System planning and design :
Here a logical system is designed for each previously identified design area using
the following steps :
Preliminary data structure design
A first attempt is made to convert the entity model to the structure of the DBMS.
System structure design -
Business processes are mapped to procedures using DFDs.
Procedure design
Data navigation diagrams, dialogue flows and action diagrams are drawn up.
Confirmation
The work to date is checked for completeness, it's adherence to IE rules and
usability by the users.
Planning for technical design
·Implementation areas are defined and technical plans are prepared. This results in
the production of a business systems specification detailing the information flows
and user procedures, the results of business area analysis and the proposed user
10

interfaces. Those parts of the above to be computerised are designed using the
following routine :
• Data design
• Software design
• Operations design
• Verification of design
• System test design
• Implementation planning
Summary
This stage's output is a technical specification for the system and a plan for
construction and implementation.
Construction and cut-over
At this stage the computing environment, development procedures, database and
modules are constructed. Systems are constructed and integrated. Documentation
is generated. Testing and user acceptance is carried out. Cutover is the controlled
changeover from the old to new system and is sequenced as follows :
• Preparation : schedule preparation and training.
• Installation of new software
• Final acceptance
• Fan-out : installation at each location.
11
• System variant development : system modification to suit local conditions.
After full implementation, the system'sperformance is periodically evaluated,
tuned and maintenance carried out.
The highly structured and ordered framework of lE has made progressive
automation possible. The framework is a modifiable 'encyclopaedia' of data
objects and their inter-relationships. The scope of lE across the systems
development life-cycle is probably the widest of the methodologies.
Methodology 3: SSADM
Introduction
SSADM (Structured Systems Analysis And Design Method ) is an important
methodology which is in widespread use in the UK Civil Service and government
departments. It was developed by Learmonth and Burchett Management Systems
(LBMS) and the Central Computing and Telecommunications Agency (CCT A)
during the 1970s. Version 4 was released in 1990.
The phases of SSADM, and it's rules and guidelines, are precisely defined, this
makes it highly amenable to controlled project management and also user
training. Comprehensive standards provision and controlling documentation are
also a feature.
12

The structure of the methodology
The framework of the methodology is depicted in five modules, which
themselves range across seven stages, which are as follows :
Feasibility
• Feasibility study
Requirements analysis
• Investigation of current environment
• Business systems options
Requirements specification
• Definition of requirements
Logical system specification
• Technical system options
• Logical design
Physical design
• Physical design
The stages are now outlined
Feasibility
The technical viability of the project is established, and the potential benefits
weighed against costs. Techniques such as interviewing, questionnaires and
DFD's are used to investigate the scope, requirements and feasibility of the new
13
system. Current system weaknesses are used to help define the potential
alternative solutions, which are outlined in a report.
Investigation of current environment
The work in the feasibility stage is repeated, but in greater detail. DFD's are
decomposed to further levels of detail and conflicts and inaccuracies worked out.
Existing data flows, processing methods and data are examined and mapped and
used to assess new system requirements. Processes and entities and their
relationships are studied, and activity catalogues created. A report on the current
environment is output.
Business systems options
Those user requirements, from the previous stages that can be justified using
cost-benefit analysis are incorporated into an range of business system options.
From these, an option is chosen by management and a system specification
produced, which forms the basis for next stage development.
Definition of requirements
The full specification of requirements is produced from the selected business
option at this stage. The requirements catalogue is updated and the logical entity
and data flow models are refined. Functions are documented in detail and
relationships between users and functions are also recorded. Jackson Structure
Diagrams (JSD's) are use to show input and output structures. Entity life histories
14

are constructed, which record events that affect an entity during it's life cycle.
Lastly, a check of the authority of the requirements specification is carried out,
that the functions are properly defined and that objectives are still being met.
Demonstration prototypes of critical dialogues and menu structures may be
developed and users asked for feedback. This involves users during development
whilst helping to validate work to date.
Technical systems options
In this stage, specific hardware and software configuration options are identified
and reviewed by management. Technical choices are made in consideration of
any existing system constraints, organisational impact, time and cost factors and
development strategy.
Logical design
The dialogue and menu structures and designs are defined for users. Update
processes and operations and enquiry processing are defined. Rules for validating
data are specified and final detail for the control of operations following events
is completed. The design, in general, is brought to a state ready for physical
design.
15

Physical design
The skills of Analysts, Technologists and Programmers are brought together to
produce a physical systems solution from the logical design. The logical design is
mapped using a Function Component Implementation Map (FCIM), which maps
each logical function component onto the physical components of the operating
system. The logical data model is converted into an appropriate DBMS design.
Storage, timing and performance are optimised.
Conclusion
SSADM is clearly a structured approach, and it's basic techniques of entity
modelling, entity histories and DFDs, have made it a methodology that is easily
taught; and it is a part of many UK university Information Systems degree
programs. It's techniques and tools are widely known and good implementation is
possible using skilled key personnel. It is supported by a range of computer tools
which help with analysis and design, which, together with the importance it
places on documentation standards and also the detailed guidelines it provides,
eases the system development process.
Methodology 4: JSD
Introduction
JSD (Jackson Systems Development) has been developed from Jackson
Structured Programming (JSP) by Michael Jackson. Jackson views the systems
development process as being almost identical to that required to develop
16
programs. He says 'We may think of a system as a large program', consequently
JSD's goal is to produce software systems, not, primarily, information systems.
Important stages in the information systems development life-cycle are not
covered by JSD, including :
• Project selection
• Cost Justification
• Requirements analysis
• Project management
• User interface
• Procedure design
• User participation
• Database design
• File design
Although more recent commercial versions, by different authors, have included
some of these aspects in their versions i.e. Davies and Layzell ( 1993).
The central problem for JSD is finding the hidden path between the presentation
of a system specification and that system's final production as a completed,
executable and supportable program. For Jackson, the answer is to use process
scheduling and real-world modelling. Also, systems are dynamically, not
statically, modelled giving a more accurate rendition of real world systems.
17
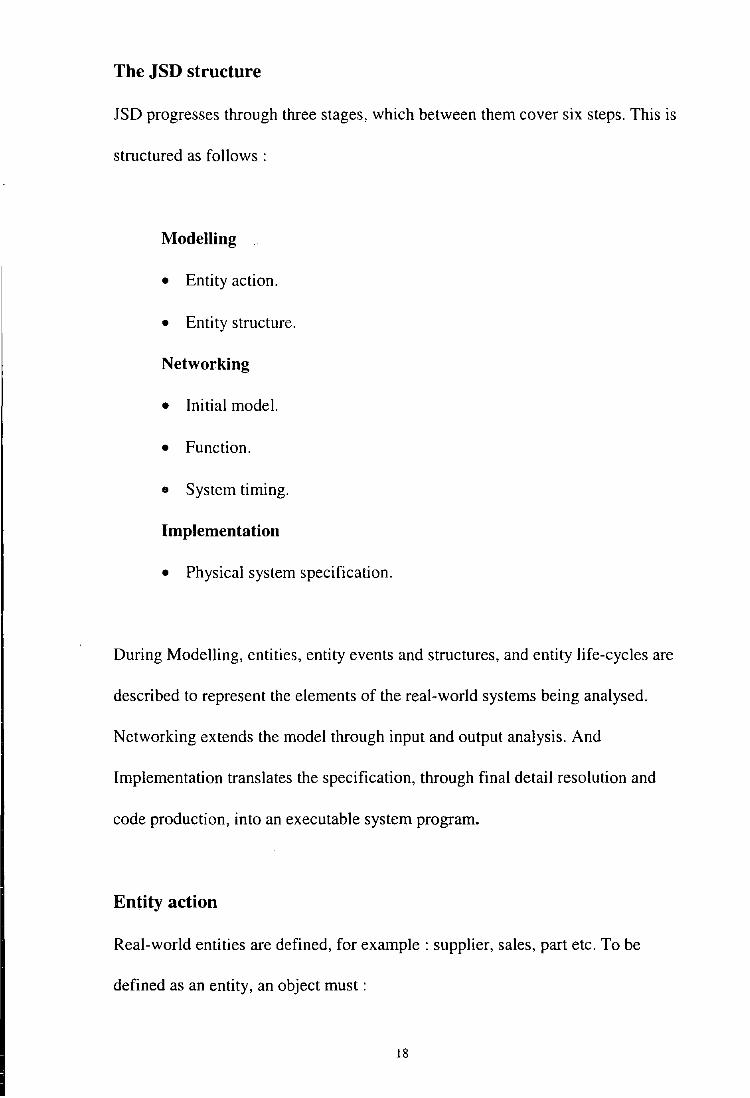
The JSD structure
JSD progresses through three stages, which between them cover six steps. This is
structured as follows :
Modelling
• Entity action.
• Entity structure.
Networking
• Initial model.
• Function.
• System timing.
Implementation
• Physical system specification.
During Modelling, entities, entity events and structures, and entity life-cycles are
described to represent the elements of the real-world systems being analysed.
Networking extends the model through input and output analysis. And
Implementation translates the specification, through final detail resolution and
code production, into an executable system program.
Entity action
Real-world entities are defined, for example : supplier, sales, part etc. To be
defined as an entity, an object must:
18

• Perform or suffer actions in a significant time ordering.
• Must exist in the real world outside the system that models the real world.
• Must be capable of individual instantiation with a unique name.
Entity actions describe how entities behave within the system. In JSD, entities
perform or suffer actions. Actions must :
• Be regarded as taking place at a point in time, rather than extending over a
period of time.
• Take place in the real world outside the system and not be an action of the
system itself.
• Be regarded as atomic and cannot be decomposed into sub-actions.
Entity and action attributes are stated. Entity attributes add information about the
entity and are updated by it's entity actions, and action attributes originate beyond
the system boundaries and trigger the action.
The output from this step is a list of entities, their actions, and attributes for each
of these actions.
Entity structure
Here, the actions performed or suffered by entities are ordered in time. JSD
structure diagrams are produced which express the life-span of an entity
19
hierarchically. These show a hierarchical decomposition of an entity's life-time.
Entity role separation is essential, for example if there is no link between
'promotion' and 'training' along a career path, then two separate JSDs are
needed. In essence, the entity diagrams show entity activities processing in time,
without concurrency, and from the entity's birth to it's death. Diagram drawing is
supported by the Program Development Facility tool. A set of Jackson Structure
Diagrams is generated by this step.
Initial model
In this step a process model is created, which emulates real world system
activity. A sequential process is created for each entity type, and these are
designed to operate at real-time speeds. Structure text (similar to Structured
English) is used to define process models and diagrams are drawn up to show the
interconnection between processes. Structure text definitions can later be
expanded (since it resembles a high-level Algol- like programming language, see
figure *). Data stream connection or state vector connection is used to model
process connection. JSD System Specification Diagrams are used to map the
network of inter-process communications.
This step's output is a systems specification diagram and set of structure texts,
both modelling a set of communication processes.
20

Function
The previously created model is extended, by the addition of functions, to also
model outputs resulting from combinations of events. Structure text is evolved to
reflect this change.
A refined system specification and structure text set is completed at the end of
this stage.
System timing
In this step, system process timing, in relation to real-world timing (in terms of
acceptable delays, time lags etc), is established within the model. Specifically,
time delays between input receipt and the production of outputs is studied. Inter
process timing, as well as in-process timing, is considered. Time Grain Markers
(TGM's) are used to co-ordinate processes. Technical and user constraints are
used as guides to timing of processes. This step results in processes merged with
TGM's, producing a time aware process model.
Implementation
JSD's interpretation of implementation considers one subject; how to share
processors amongst processes. The physical implementation of a complete
information system is not a concern, and JSD doesn't address this issue.
Guidance is given on how to translate the model into a set of sub-routines and
programs which cater for multiple processing on multiple processors, or if
21

desired, single process processing on one or many processors. JSD Systems
Implementation Diagrams are used in the translation to code.
Conclusion
The strength of JSD is it's ability to model real world systems, not just in terms of
entities and their actions, but dynamically, catering accurately for concurrency,
timing and process scheduling, producing a real-time picture of events. It's
weakness lies in it's self-acknowledged incompleteness, in so much as it
concentrates on producing a working information system regardless of any
existing system and IT strategies, problems or with regard as to physical
implementation and subsequent maintenance. Jackson sees, however, his system
development approach as the most valid, in comparison with static, entity model
based systems designs.
Methodology 5: (SSM)
Introduction
SSM (Soft Systems Methodology) has been developed by Checkland at Lancaster
University, with the most up to date version, mode 2, being outlined in Checkland
and Scholes ( 1990). It is based on the belief that when analysing a system, it has
to be viewed as a whole for any kind of meaningful conclusions to be drawn, as,
when decomposed into its parts, it loses something of the whole which is
unreproduciable by each of the parts on their own. For this reason information
systems cannot be viewed in an incomplete fashion as purely 'hard' systems-
22

collections of data and processes - but as more complex 'soft' systems, within
which there is a inseparable human element. Thus soft system models are better
able to represent the complex workings of large, complex organisations. Soft
systems thinking assumes that the purpose of a system is to arrive at more
complex purposes or missions, and not simple goals, as a hard system might set
out to achieve. The understanding of purposes and missions is achieved through
debate with the actors who operate within the soft system.
Checkland has developed SSM through 'action research', where his methods
have been actively tested within client organisations. Modification to SSM has
come from feedback and learning, and it is therefore field proven. Central to the
methodology, is first to find the overall or world view; the resulting information
system flows from this.
The stages of the methodology
SSM is broken down into seven stages, which are divided into two categories;
these being a) the activities within the organisation which involve people in the
problems, and b) the activities that analyse and resolve the problematic situations.
The stages are as follows :
for a) I. The problem situation : unstructured.
2. The problem situation : expressed.
23

for b) 3. Root definitions of relevant systems.
4. Conceptual models.
4a. Formal system concept.
4b. Other systems thinking.
for a) 5. Comparison of 'Conceptual models' with 'The problem
situation : expressed'.
6. Feasible, desirable changes.
7. Action to improve the problem situation.
The problem situation : unstructured
Problem owners - managers, the business owner - and others involved in the
problem situation are consulted to discover the nature of the information system
problem. Varying views of the problem are taken and, also, an impression of the
existing physical information structure, including informal communication means
and practices, is formed.
The problem situation : expressed
The problem situation is analysed during this stage. The impressions already
formed are laid out diagrammatically, to aid communication between problem
solvers and owners. No method is stated as the best way to map the impressions,
but Checkland uses Rich Picture Diagrams. These can show process structures
and the inter-relationships between processes. The people involved, the tasks
being performed, the system's environment, the owner and clients, can all be
24
included on the diagram Departmental conflicts, communication difficulties, and
other 'bottlenecks', can also be depicted.
Root definitions of the relevant systems
Problem themes are discussed with problem owners and relevant systems that
provide a viewpoint on the problem, are identified. Problem solvers and owners
then decide which view to use to assist with problem resolution and a rich
picture, followed by a root definition of the chosen system are constructed.
Checkland describes a root definition as 'a concise, tightly constructed
description of a human activity system which states what the system is'
(Checkland, 1981 ). For example, a root definition for a hotel administration
system might be 'to provide the highest standards of care and service to all
paying guests, and provide an effective and discrete hotel administration service.'
The root definition is constructed using CATWOE, which stands for :
Client - the beneficiary or victim of the activities.
Actor - the person who carries out the change.
Transformation - the change.
Weltanschauung - the world view that gives the root definition meaning.
Owner- the sponsor of the change.
Environment - the wider system, of which the problem system is a part.
25

Building conceptual models
Conceptual models are developed from the root definitions, and laid out in
diagrams. They conceptual model is a model of the system which shows how it
performs, and should be closely related to the human activity system it describes.
The models are discussed and refined until agreement is reached between solvers
and users on the correctness of the root definitions and conceptual models. This
iterative process is intended to tease out conflicts of interest, ideology etc. to
illuminate the true overall, or underlying, nature of the problem.
Comparing conceptual models with reality
Conceptual models are compared to previously stage 2's rich pictures, and the
nature of the problems discussed leading to recommendations on what changes
need to be made to resolve them.
Assessing feasible and desirable changes
The recommended changes are analysed and those considered worthwhile are
drawn up as proposals.
Action to improve the problem situation
This stage considers the actions recommended in the proposals. SSD is mainly
concerned with identifying system problems, and goes no further in discussing
how to implement any chosen information system solution.
26
Conclusion
SSM involves all 'actors' (all the participants) in the processes to discover the
problems at the heart of the system(s). It is an iterative process, with everyone
involved, particularly the analysts, expected to learn as they go along. With no set
of highly structured rules to follow it is often difficult to teach, and also, to gauge
it's progress during a commercial project.
The methodology concentrates on problem analysis, rather than the practicalities
of designing and implementing an effective information system.
Methodology 6: Multiview
Introduction
Multiview's approach is attributed to Wood-Harper, Antill and Avison. It
combine 'hard' and 'soft' views of information systems development to offer a
more balanced and realistic methodology, which reflects the balance of human
and technical components found within a real-world problem situation. It's broad
approach is mirrored in the scope of it's influences i.e. STRADIS, lE, ETHICS,
SSM.
Action research has been used to test and prove ideas, and the methodology has
developed information systems in a range of organisations of various sizes, down
to those much smaller than other methodologies have been applied to.
A central tenet of MULTIVIEW's approach, is contingency; that is because of
factors such as the range of organisational environments, the unpredictability of
27
problem situations and the varying levels of analyst's skills, not all approaches,
techniques or tools will work in a proscribed manner, but certain of these should
be used as befits needs. To this end, much of MUL TIVIEW is derived from other
methodologies, these stages, techniques etc. being seen as the most useful at that
point.
Multiview stages
There are five defined stages :
I) Analysis of human activity
2) Analysis of information (information modelling)
3) Analysis and design of socio-technical aspects
4) Design of the human-computer interface
5) Design of technical aspects
To ensure that both human and technical sides of the development process are
covered, the methodology proposes that it should assist in providing the answers
to five questions, which are :
I) 'How is the computer system supposed to further the aims of the organisation
installing it?'
2) 'How can it be fitted into the working lives of the people in the organisation
that are going to use it?'
3) 'How can the individuals concerned best relate to the machine in terms of
operating it and using the output from it?'
28
4) 'What information system processing function is the system to perform?'
5) 'What is the technical specification of a system that will come close enough to
doing the things that have been written down in the answers to the other four
questions?'
By involving all those participating in system development- users, managers,
analysts etc. - in answering these questions, MUL TIVIEW hopes to balance the
technical with the human aspects, the task-related questions with the issue-related
questions en-route to providing a more multi-faceted , and hence effective,
information system.
Analysis of human activity
Based on the ideas of SSM, a world-view of the organisation (of any size or type)
is arrived at, through debate with the problem situation participants. Rich pictures
are used to stimulate communication and debate and produce an understanding of
the problem situations. Problem themes (for instance; inter-departmental
communication breakdown, or supplies shortage) are pulled out and relevant
systems which may help to solve the difficulties are identified. A root definition,
based on one view, is agreed and refined (using CATWOE) and this forms the
basis for the construction of a conceptual model. The conceptual model is
compared with the rich picture for it's correct representation of 'real' events and
any necessary enhancements made. At the end of this stage, a clear root definition
and conceptual model describes the area of concern.
29
Analysis Of Information
Entities and functions are analysed in a two phase process. These are :
1) Development of a functional model:
The main function is identified and decomposed as far as possible, and
this is then portrayed in a hierarchical model. DFD's showing sequences
of events are produced from the functional decomposition.
2) Development of an entity model:
Entities and their inter-relationships are extracted, and an entity model
constructed.
Analysis And Design Of The Socio-Technical Aspects
MUL TIVIEW bases the work of this phase on ideas borrowed from Mumford' s
ETHICS, which insist that the resulting information system will be enhanced if
those whom it affects are given the chance to help design it, modifying it in
consideration of job satisfaction, the type and nature of tasks to be performed,
morale etc. During this stage, a range of alternative solutions covering both
human and social, and also technical, priorities are drawn up. These are graded
according to how well they fulfil social, technical, cost, resource and constraint
objectives. The technique of Future Analysis (Land, 1982) is used to assist in
setting the objective criteria, based upon statements of potential future scenarios.
This stage's output is the role set, and the computer and people task requirements.
30
Design of the human-computer interface
Initially the technical design of the human-technical interface is designed.
Decisions are made on how users will interact with the computer, whether, for
instance, batch or on-line processing is to used. Detail about the nature of inputs
and outputs, how information is to be reported etc is worked out. These
requirements are then translated into a description of the technical requirements
needed for computer system design.
Design of the technical aspects
By this stage the technical requirements of the system, incorporating the
necessary human and social influences, have been analysed and the development
process concentrates on the technical design of an information system
specification. MULTIVIEW gives an outline technical specification, which is the
output from this stage, and is as follows :
• Application subsystem : performs functions computerised from the function
chart.
• Information retrieval subsystem : responds to enquiries regarding stored data.
• Database maintenance subsystem : updates and error checks data.
• Control subsystem : checks and alerts for user, operator, machine and
program errors.
• Recovery subsystem : assists with system repair after error detection.
• Monitoring subsystem : monitors system activities.
31
• Database: where data is stored in an organised fashion.
After design, the system is tested and subsystems enhanced or corrected where
required. MUL TIVIEW sees an information system not as a static, leave-alone
design, but stresses that the development process should be regarded as
continuous, where the users change the system to suit their needs as they require,
in order for it to continue meeting organisational, human and technical objectives.
Conclusion
MULTIVIEW aims to develop information systems whose performance is
optimised through ensuring that both human and technical aspects are given fair
consideration in the development process, and also, by taking the parts of other
methodologies that it sees as useful within it's own context, and using these help
to integrate the human and technical influences into the system design. The
methodology is designed to be flexible enough to be applied across a wide range
of organisational problem situations and sizes.
32
Current Methodologies For Introducing CIM Systems (adopted from Doumeingts G., review of Information systems methodologies, I 995)
Overview
This appendix is supplement to chapter 5 and outlines some of the most popular
CIM design methodologies that currently exist. These are also presented to give the
reader appreciation of complexities of these methodologies and to further emphasis
the need for an approach that is appropriate for SME cases.
Introduction
Developing detailed specifications during the design of modem CIM systems has
become a very complex task. The design must take into account a number of
constraints (cost, quality, flexibility, time, evolution), and grant the resulting system
better efficiency. The choice of hardware and software is a direct consequence of
this design process, which means that taking the wrong choice may have dramatic
consequences on investments. Among the various elements (previous experiences,
objectives, etc.) which may influence the final design, the choice of a modelling
technique is of paramount importance.
CIM (Computer Integrated Manufacturing) is used to describe the process of
integration of all the elements involved in manufacturing, by means of computer
techniques. Over the last ten years. CIM has been confined to a purely technical
interpretation. Today, the many difficulties encountered in the course of various
implementations have shown that such a narrow outlook is not satisfactory:
33
economic, social and human aspects must be taken into account. Therefore, a broad
definition of CIM, below, suggested by Vallespirsss would be more appropriate.
"CIM refers to a global approach-in an industrial environment which aims at
improving industrial performances. This approach is applied in an integrated way
to all activities, from designing to delivery and after-sale, and uses various methods,
means and techniques (computer and automatic techniques) in order to
simultaneously improve productivity, decrease costs, meet due dates, increase
product quality, secure flexibility at local or global level in a manufacturing system
and involve every actor. In such an approach, economic. social and human aspects
are at least as important as technical aspects." This broad definition shows that a
CIM solution cannot be bought: each firm must devise its own, which explains why
methodologies must be made available so that CIM systems can be built.
Designing a CIM system meets with a number of difficulties:
• The system is extremely complex; it involves not only technical aspects but also
economic, social and human aspects which must be integrated. Moreover, it may
be highly automated and, computerised.
• All the knowledge that is needed to design the system is not to be found in one
single person. Instead, this is a group work.
• The designing process is impossible to model: only experience can teach it, and
references are scant.
34

Definition of concepts
The word "methodology,"' means a set of methods which involve the use of:
• reference models and architectures,
• modelling formalisms and their associated graphical tools,
• a structured approach.
Reference model or architecture is a very important concept in CIM. However there
is no world-wide accepted definition of architecture. An architecture of CIM
systems can be defined as a structured set of "models" which represent the invariant
building blocks, of the whole CIM system. The architecture can be considered as a
basis for the design and the implementation of CIM systems. These models, which
contain the invariant elements and the relations between these elements, describe
respectively the "WHAT" (what a CIM system is conceptually composed of), and
the "HOW" (how a system technically works), and show how to transform the
models into realities, i.e. the working system. A modelling formalism is a mean to
represent pieces of knowledge that have to be transmitted unambiguously. It allows
to build models according to associated concepts. A model is an abstract, simplified
representation of reality. A manufacturing model can only represent a set of selected
elements concerning the domain studied, and in agreement with defined objectives.
A system can be represented by various kinds of models based upon various points
of view. A good model should amplify the important characteristics and conceal the
details which are considered to be of low or of no importance. In the domain of
CIM, models are supported by mathematical formalisms, languages and/or
graphical tools.
35

In modelling, we distinguish between structure models and simulation models.
Structure models define the basic concepts, the elements and the relations between
these elements from a static point of view. Simulation models, on the other hand,
take the concepts defined in the structure models and introduce the "time" factor:
they take the dynamic evaluation of the model into account. Generally speaking, a
structured approach defines a sequence of steps to be followed when applying a
methodology to solve a problem. In a CIM design methodology, the structured
approach should cover the whole life cycle of the CIM project which is split up into
several steps (analysis, design, development, implementation, operating). All these
steps should be perfectly defined and based on the project type structure, consisting
of particular actors whose roles are clearly defined. Indeed, I will show later that it
is fundamental to define precisely the various steps that lead from specification to
implementation. This point has been insufficiently debated up to now. For each of
these steps, models should be designed and validated. At the present stage of
development, only the analysis phase and the design phase are linked. A lot of work
remains to be done before reaching the stage of development. One may however
find instances of links within the exploitation phase.
Reference models and architectures
Here I will present some well known reference models for designing CIM systems
such as the ICAM, CAM-I and NBS models developed in the USA, the GRAI
model developed in France, MMCS, IMPACS and the Knowledge-based factory
model developed within the frame of the Esprit Programme.
36

ICAM
ICAM (Integrated Computer Aided Manufacturing) was one of the biggest CIM
projects in the US and lasted from 1978 to 1983. The objective of the project was to
improve the use of information technology in the field of manufacturing and
particularly within the aerospace industry. A "model of Manufacturing" (Softech,
1981) was elaborated in this frame. The objective of this model was to display the
main functions of manufacturing and the relationships between them (Fig. I). The
model has a hierarchical decomposition based on a top-down approach.
CAM-I
A2 Obtammg and Ul lltZ1ng of Auto products
A·24 Mamtenance
A6
Fig 1 ICAM Model
CAM-I proposed a factory model(CAM-1, 1979). Two levels of this model (shop
level and cell level) were described in the "Factory Management" project. The
CAM-I model proposed four levels of decomposition (Firm, Factory, Workshop
37
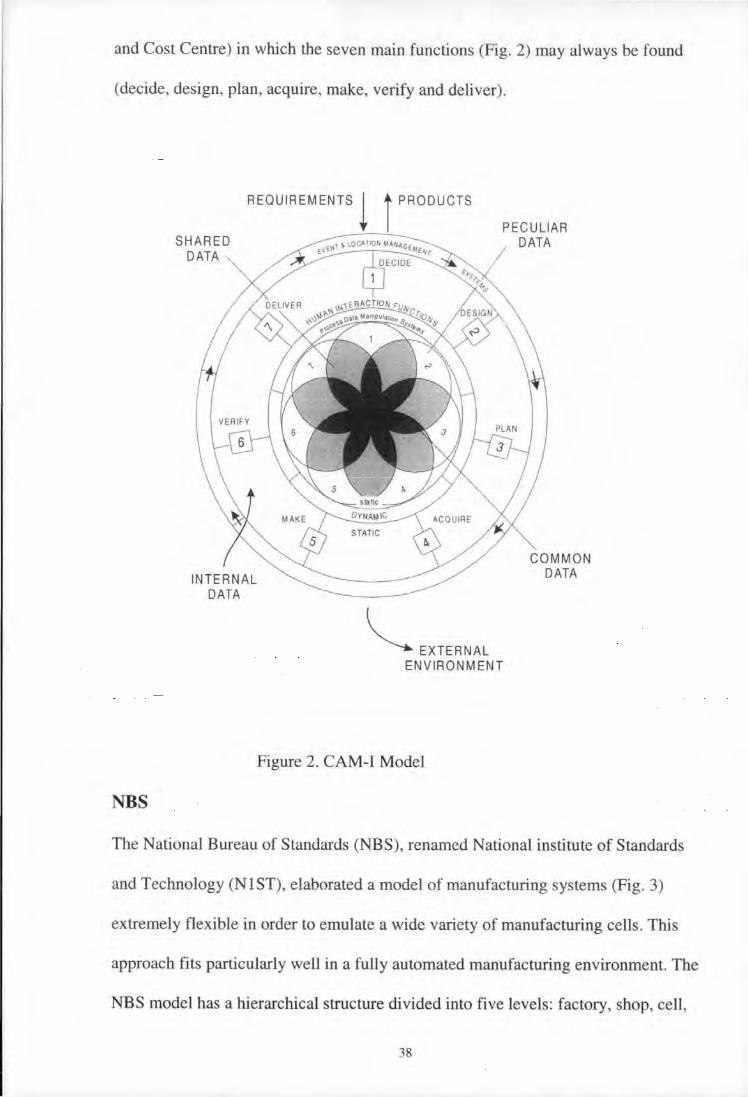
and Cost Centre) in which the seven main functions (Fig. 2) may always be found
(decide, design, plan, acquire, make, verify and deliver).
NBS
SHARED DATA
PECULIAR DATA
~EXTERNAL ENVIRONMENT
Figure 2. CAM-I Model
COMMON DATA
The National Bureau of Standards (NBS), renamed National institute of Standards
and Technology (NlST), elaborated a model of manufacturing systems (Fig. 3)
extremely flexible in order to emulate a wide variety of manufacturing cells. This
approach fits particularly well in a fully automated manufacturing environment. The
NBS model has a hierarchical structure divided into five levels: factory, shop, cell,
38

workstation and machine. Today this model has been widely accepted as a basic
reference. The NBS model lays the emphasis on communication links for
information exchanges, based on the hypothesis that all elements in the firm can
have access to information, and can communicate with all the other ones.
Level Broadcast Network
Shop Communication nodes 1
Cell
Workstation
Equipment
Figure 3. NBS Model
GRAI
GRAI models (G. Doumeingts, 1984) were developed within the GRAl method
context to meet the needs of the modelling of decision systems. The GRAl models
consist of a macro reference model for manufacturing systems (Fig 4) and a micro
reference model for decision centres. The macro model is used to express our
perception and ideas on a manufacturing system which is decomposed into a
decision sub-system, an information sub-system and a physical sub-system. The
macro model has a hierarchical structure within which decision centres are
identified. The micro model is used to represent the internal elements of a decision
centre.
39

INFORMATION SYSTEM
Material components
DECISION SYSTEM
Figure 4 GRAI Macro Reference Model
MMCS
Dec ision Level of
decomposition
Products
The MMCS architecture (Manufacturing Management Control System) as shown
in Fig. 5 was developed within ESPRIT Project 418 (Open CAM System), in which
GRAl was involved. The MMCS architecture (Procos, 1988) deals with shop and
cell planning and control with carefully defined interfaces. These interfaces
40
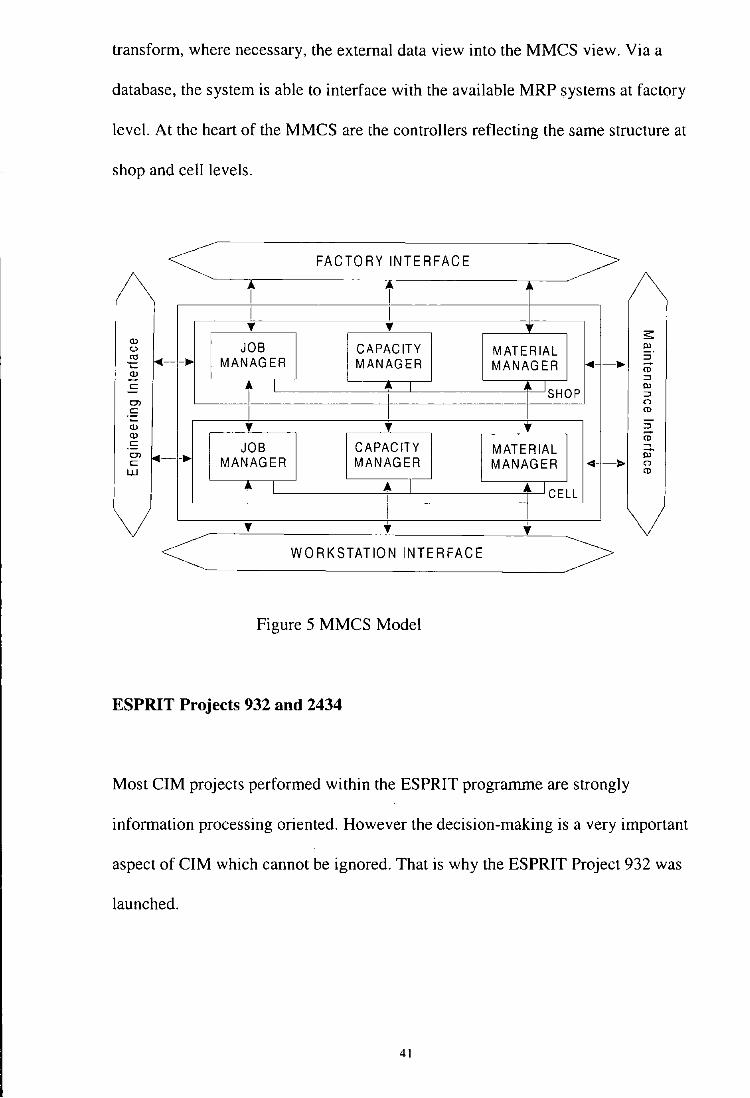
transform, where necessary, the external data view into the MMCS view. Via a
database, the system is able to interface with the available MRP systems at factory
level. At the heart of the MMCS are the controllers reflecting the same structure at
shop and cell levels.
<D (_)
~ <1(
~ c::
0> c::
<D <D c::
-·
-~
.. I ..,
JOB MANAGER
.. I I
.., JOB
MANAGER
I
FACTORY INTERFACE
i I ..,
CAPACITY MANAGER
I
.., CAPACITY MANAGER
.. I I
I
MATERIAL MANAGER
1SHOP
MATERIAL MANAGER
A I CELL
'
..,._
<1-
- ~ CD
-
::J Ill :::J n CD
::J
eo iil
,._ n CD
.., I
~-------__ w_o_R_K_S_TA_T_IO __ N_IN_T_E_R_F_A_C_E ______ ~~
Figure 5 MMCS Model
ESPRIT Projects 932 and 2434
Most CIM projects performed within the ESPRIT programme are strongly
information processing oriented. However the decision-making is a very important
aspect of CIM which cannot be ignored. That is why the ESPRIT Project 932 was
launched.
41

--------------------------------------------------------
ESPRIT Project 932 has defined a knowledge-based real-time reference model (Fig.
6) to support decision-making at shop-floor level. This reference model ( Philips
Gmbh, 1988) is based on the NBS model and the GRAI model, with the intelligent
work cell controller concept. A controller performs three basic tasks (Planning,
Quality Control, Preventive Maintenance). Project 932 finds its sequel in project
2434. ESPRIT Project 2434 is concerned with real-time CIM controllers for
distributed factory supervision. The results achieved in Esprit Project 932 are used
directly in ESPRIT 2434. The objective of this project is to make the modem
production philosophies (OPT. JIT, LOP, etc.) available on the factory floor, by
delivering decision support to each relevant function of the factory using
knowledge-based software techniques.
Time Horizon Time Period Planning
FACTORY Year
SHOP
CELL
WORKSTATION
AUTOMATION MODULE
Month
Month Day
Day Minute
Minute Second
Millisecond
Q ·Quality M · M~intenance
Figure 6 Knowledge-based factory control model
42
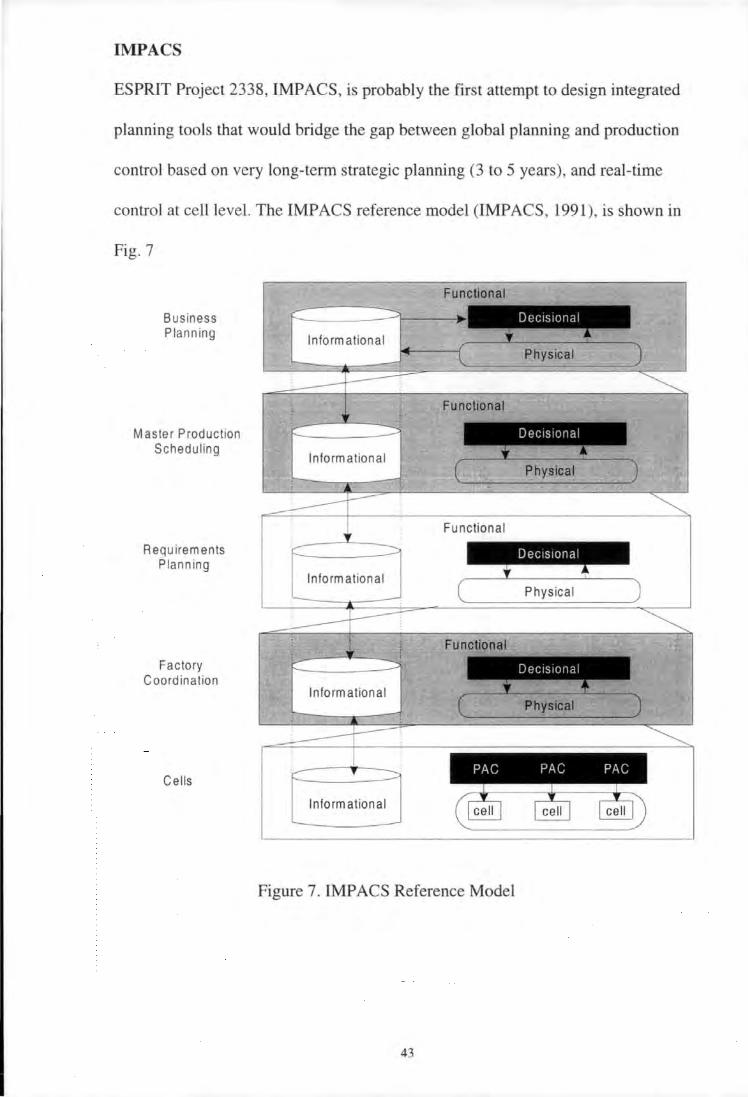
IMP ACS
ESPRIT Project 2338, IMPACS, is probably the first attempt to design integrated
planning tools that would bridge the gap between global planning and production
control based on very long-term strategic planning (3 to 5 years), and real-time
control at cell level. The IMPACS reference model (IMPACS, 1991), is shown in
Fig. 7
Business Planning
Master Production Scheduling
Requirements Planning
Factory Coordination
Cells
Functional
Dec1S1onal
Physical
Functional
Dec1S1onal
Physical
Functional
Dec1S1onal
Physical
Functional
Inform at ion al
Figure 7 . IMPACS Reference Model
43
Remarks about models and architectures
The !CAM and CAM-I models developed earlier in the US are the basis for the
other developments. The ICAM model is supported by the IDEF formalism, which
is widely used. No modelling formalism was developed within the CAM-I
approach. In the "Factory Management Project" of CAM-I, the DFD (Data Flow
Diagram) developed within the frame of the SSAD method is used.
The NBS model is today widely accepted as a reference model for an enterprise to
decompose the factory into its basic resources (machines, equipment, etc.). No
modelling formalism has been developed for the NBS approach. The GRAI model
is supported by the GRAI grid/GRAl nets formalisms and a structured approach
Although prototyped and tested in several companies, the MMCS model is being
challenged by a more generic model developed within the ESPRIT Project 477:
COSIMA (Brown and Duggan, ESPRIT Project 477). This model is called PAC
(Production Activity Control). The basic principle of PAC is the recognition of five
basic building blocks representing the functions required for production control at
the shop and cell levels: Scheduler, Dispatcher, Mover, Producer and Monitor. The
knowledge-based reference model insists on the decision-making aspect and uses
some important concepts of the GRAl model, such as decision horizon/period and
decision frame. GRAl grid and GRAI nets formalisms were used to support the
knowledge-based 932 model. The IMPACS model insists on integrated solution and
decision making for production planning and control. A set of decision support tools
are developed to support the elaboration of a manufacturing strategy which is to be
understood, interpreted and used correctly at the various planning and control
hierarchies. The lowest level ofiMPACS model is consistent with the PAC model.
44
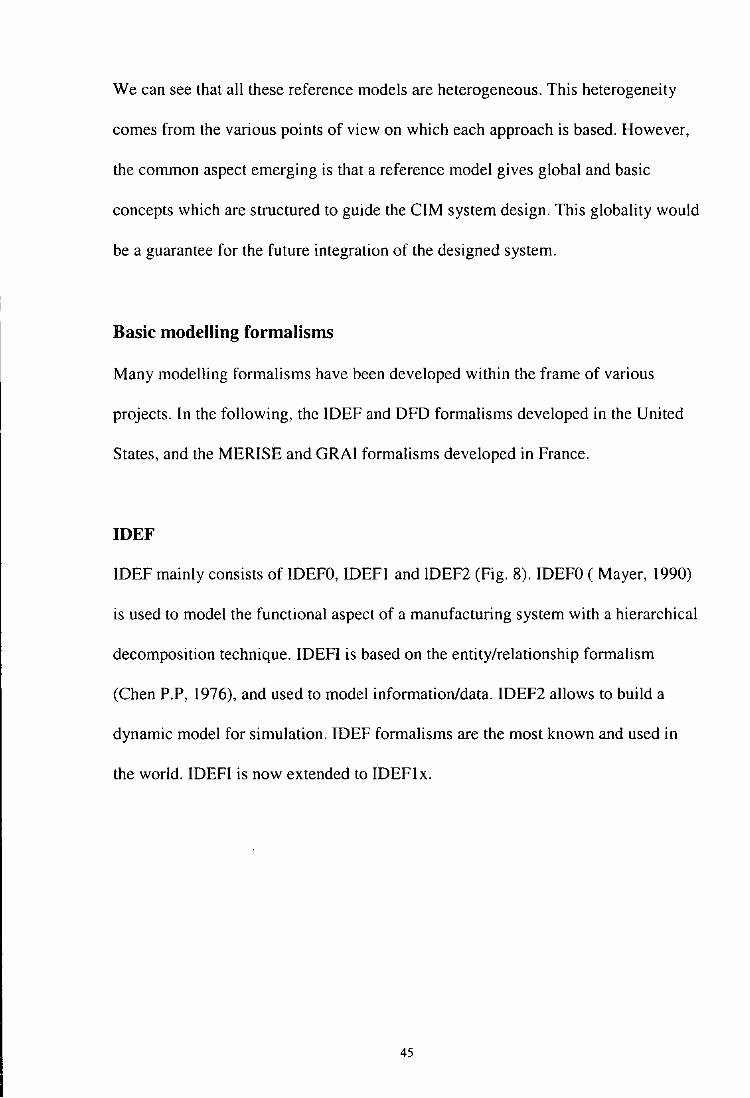
We can see that all these reference models are heterogeneous. This heterogeneity
comes from the various points of view on which each approach is based. However,
the common aspect emerging is that a reference model gives global and basic
concepts which are structured to guide the CIM system design. This globality would
be a guarantee for the future integration of the designed system.
Basic modelling formalisms
Many modelling formalisms have been developed within the frame of various
projects. In the following, the IDEF and DFD formalisms developed in the United
States, and the MERISE and GRAI formalisms developed in France.
IDEF
IDEF mainly consists of IDEFO, ID EFI and IDEF2 (Fig. 8). IDEFO ( Mayer, 1990)
is used to model the functional aspect of a manufacturing system with a hierarchical
decomposition technique. IDEFI is based on the entity/relationship formalism
(Chen P.P, 1976), and used to model information/data. IDEF2 allows to build a
dynamic model for simulation. IDEF formalisms are the most known and used in
the world. ID EFI is now extended to ID EFI x.
45
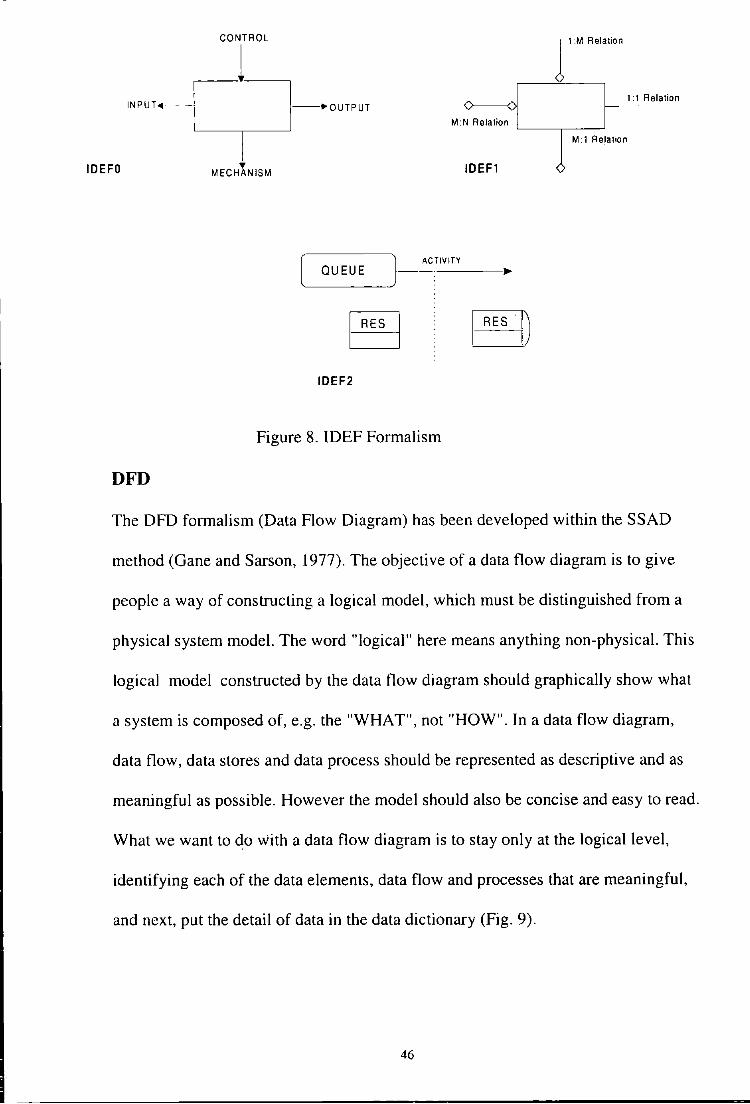
CONTROL
1 INPUT<!- -- --•OUTPUT
ll :M Relalion
1:1 Relation 1---------
M:N Relalion L___~ _ _j
I M:l Relalion
IDEFO .,
MECHANISM IDEF1 (
~Q_U_E_U_E_~}-~T-IV_IT_Y __
IDEF2
Figure 8. IDEF Formalism
DFD
The DFD formalism (Data Flow Diagram) has been developed within the SSAD
method (Gane and Sarson, 1977). The objective of a data flow diagram is to give
people a way of constructing a logical model, which must be distinguished from a
physical system model. The word "logical" here means anything non-physical. This
logical model constructed by the data flow diagram should graphically show what
a system is composed of, e.g. the "WHAT", not "HOW". In a data flow diagram,
data flow, data stores and data process should be represented as descriptive and as
meaningful as possible. However the model should also be concise and easy to read.
What we want to do with a data flow diagram is to stay only at the logical level,
identifying each of the data elements, data flow and processes that are meaningful,
and next, put the detail of data in the data dictionary (Fig. 9).
46
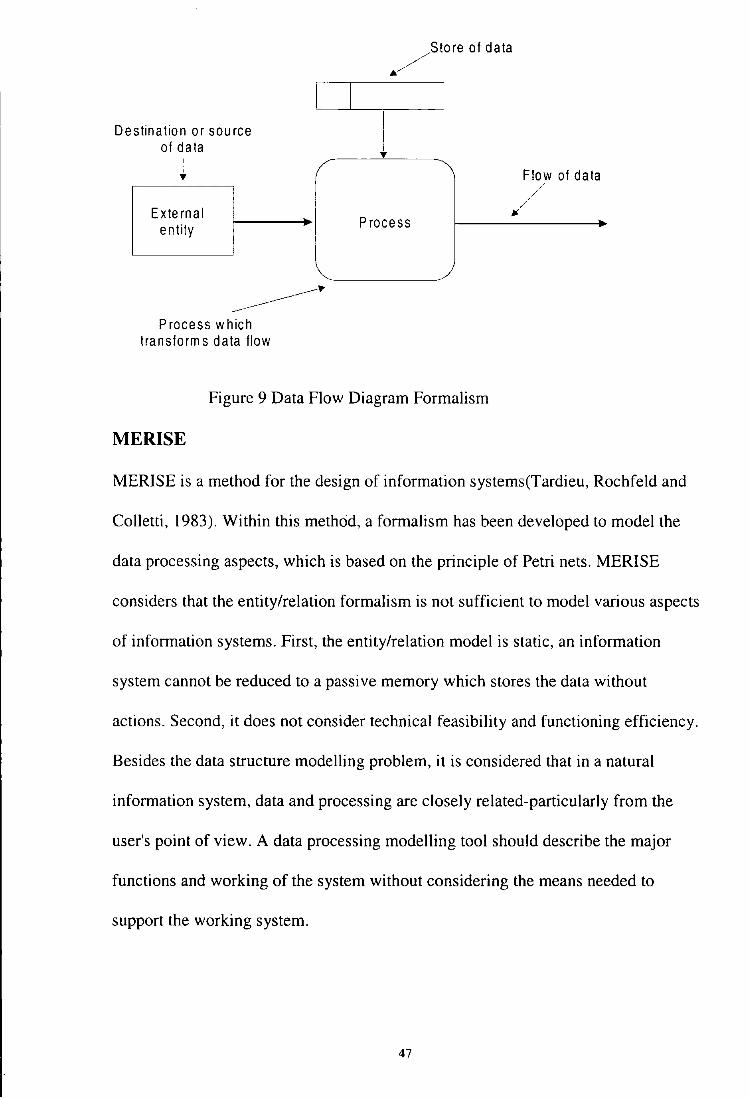
Destination or source of data
I "'
External entity
I
-----Process which
/
~~
transforms data flow
I "'
Process
Figure 9 Data Flow Diagram Formalism
ME RISE
MERISE is a method for the design of information systems(Tardieu, Rochfeld and
Colletti, 1983). Within this method, a formalism has been developed to model the
data processing aspects, which is based on the principle of Petri nets. MERISE
considers that the entity/relation formalism is not sufficient to model various aspects
of information systems. First, the entity/relation model is static, an information
system cannot be reduced to a passive memory which stores the data without
actions. Second, it does not consider technical feasibility and functioning efficiency.
Besides the data structure modelling problem, it is considered that in a natural
information system, data and processing are closely related-particularly from the
user's point of view. A data processing modelling tool should describe the major
functions and working of the system without considering the means needed to
support the working system.
47
The process uses the information brought by the event and generates the results.
The notion of result is the same as that of event. The result is an event created by a
process and used by a next process. The synchronisation represents a condition
which is a logical function of events and which must be true to launch the activity
(Fig. I 0).
GRAI
EVENT
SYNCHRONISATION
Operation 1----------1 ACTIVITY
Sending Rules
EVENT
Figure 10. MERISE data processing formalism
The GRAI formalism consists of GRAI grid and nets (Doumeingts, 1984). The
GRAI grid allows to model a decision system and nets allow to model the decision
activities of each decision centre identified in the grid. In the GRAI grid, a double
arrow represents a decision link and a simple arrow represents an information link.
A decision link cannot cross levels in creating a level short-circuit, but an
information link can. A decision link leads always from a higher level to a lower
level or is used to connect two decision centres of the same level, but never from a
lower level to a higher level. However, an information link can connect any two
decision centres liberally. A decision link is made of decision variables, decision
48

objectives and decision constraints. A decision link provides a decision frame to
another decision centre. An information link transmits the decisions made in one
decision centre to another decision centre as information (Fig. 11 ).
I Decision Levels I I Decision links I /j Func
/ // /I 11 ¥' //
~ I I 1/ Fn 1>-
I I I 1
~; .,: .. ,.. ·-F. _._
~ •~ ~ I .. T Hn i·•± Pn ...... .....
,......, ,--
• • I y I I
GRID Information links
Objective:
D.V.
Figure 11 GRAI Formalism
GRAI nets could be considered as an adaptation of existing graphical tools, such as
Petri nets, GRAFCET nets and PERT nets to meet better the needs of decisional
activity representation. By using GRAl nets, the result of one discrete activity can
be connected with the support of another discrete activity. With GRAI nets, four
fundamental elements arc to be identified:
49
• to do or to decide (activity name),
• initial state (main input of an activity),
• supports (information, decision frame, methods and materials),
• results (results of an activity).
Remarks about modelling formalism
IDEFO is quite general. It is the most used formalism in the world, not only for the
analysis of an existing system, but also for the design of information systems.
IDEFI is extended to IDEFlx, developed and tested by DACOM through various
Air Force and private projects with both major aerospace corporations, such as
General Dynamics, McDonnell Douglas, Rockwell International and General
Electric, and with non-aerospace corporations, such as ARCO, security Pacific
National Bank and Schering Plough. IDEFI is used to build an information model,
while IDEFlx is more suitable to build a semantic data model. IDEFlx is also more
rich in semantic. Graphical representation is also improved.
Both IDEFI and DFD deal with modelling of information systems. IDEFl is more
oriented to the modelling of data structures. DFD is more computer-implementation
oriented for software development. In fact most information modelling tools are
entity/relation based, they are used to describe the structure of data. The MERISE
data processing tool is the first one which allows to study the behaviour of
information systems. IDEFl is static, whereas the MERISE data processing model
is dynamic. The combination of these two formalisms allows to build a complete
model of information systems.
50
The GRAI formalism is the only one which is used to model decision making
systems while most of existing formalisms are too oriented towards the modelling
of information processing or functions rather than decision aspects of the overall
problem.
Modelling framework
Due to the very complexity of CIM systems, various formal isms, each allowing to
model one aspect of a manufacturing system, need to be structured into a
framework in which a complete CIM system model can be built.
CIMOSA
The CIMOSA (Computer Integrated Manufacturing Open System Architecture)
modelling framework has been developed within the ESPRIT Project 688 (AMICE
Consortium, 1989) . The CIMOSA modelling framework is well known and is
adapted by the European standardisation organisation body CEN/CENELEC as
ENV 40 003 for enterprise modelling (Fig. 12).
51

implementation description
building / blocks
Stepwise Instantiation
Figure 12 CIMOSA Modelling Framework
GIM
The GIM modelling framework was developed within the Esprit Project 418 to
support the GIM method (GRAl Integrated Method). GIM is a method to analyse
and design integrated manufacturing systems. It uses the GRAl formalisms to model
the decisional system, MERISE formalisms for the informational system and IDEFO
for the physical system. A future system is first defined at the conceptual level.
Functionality, decisions and information as well as physical resources are organised
at the structural level. The realisation level describes the designed system in terms
of tangible components (Fig. 13).
52

Functional Inform at ion Decisional Physical
Functions Horizon/
11 Constr1aints
Period
' Levels R-1 "'"["'" -ro ::J
J 0..
£-Q)
~ u c 0
.~ OJ ...0 0 Constraints
I 1, lnfo , I I 3-- Constrain Is
Supports
A l I Relation
Functions
Meca1nism $ Cardinality ""';'""11 Constraints
- Activity Period - • --
I
I ro En lily
Levels . I -'
~- '""i';'" ~
::J I u Mecanism
::J I ~
~ I 'f
en Mecanism e 0.: ...0
I I
I Supports el Mecanism
lnfo & Resource
Figure 13 GIM Modelling Framework
IMP ACS
The IMPACS modelling framework (Fig 14) was proposed within the Esprit Project
2338 IMPACS. It is based on the GIM modelling framework.
Remarks on modelling framework
Modelling framework is a new concept developed within the Esprit Programme.
When designing a CIM system, various concepts and models need to be defined and
built in order to ensure the completeness, consistency and integration between the
concepts and models, ln a modelling framework all models needed for the analysis,
design and development of Cl M systems find their place.
53
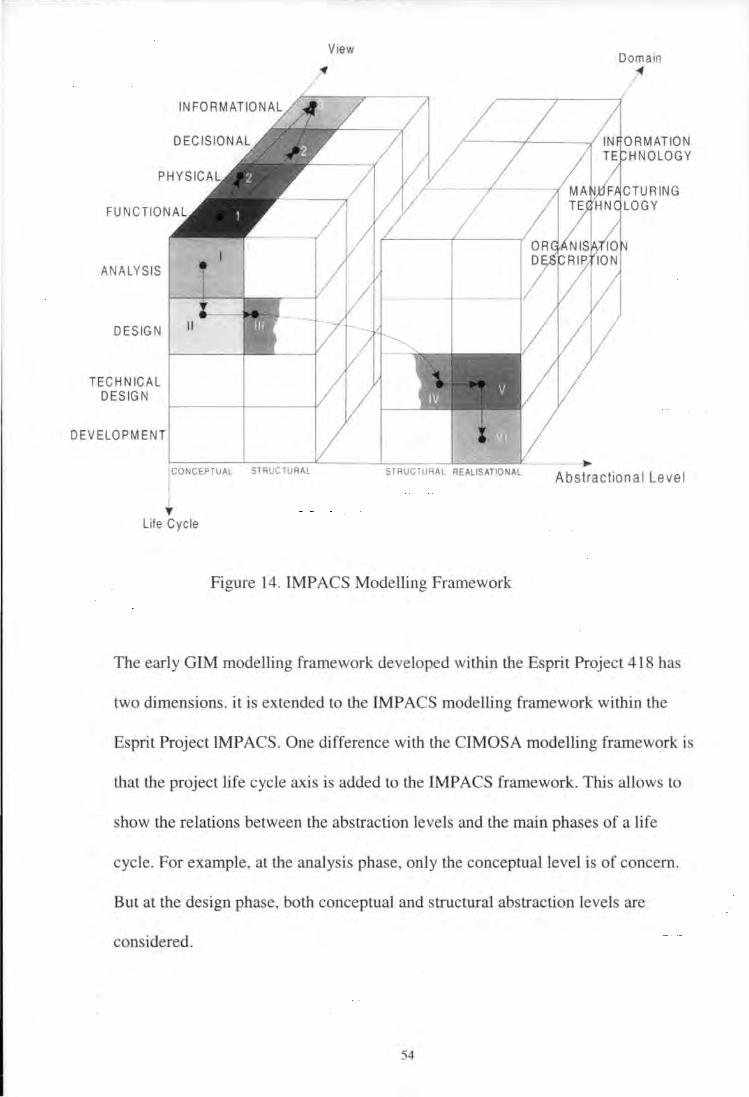
ANALYSIS
DESIGN
TECHNICAL DESIGN
DEVELOPMENT
View
CONCEPTUAL STRUCTURAL STRUCTURAL REALISATIONAL
'f Life Cycle
Figure 14. IMPACS Modelling Framework
..
Doma in ~
/
RMATION HNOLOGY
Abstractional Level
The early GIM modelling framework developed within the Esprit Project 418 has
two dimensions. it is extended to the IMPACS modelling framework within the
Esprit Project lMPACS. One difference with the CIMOSA modelling framework is
that the project life cycle axis is added to the IMPACS framework. This allows to
show the relations between the abstraction levels and the main phases of a life
cycle. For example, at the analysis phase, only the conceptual level is of concern.
But at the design phase, both conceptual and structural abstraction levels are
considered.
54

Structured approaches
Structured approaches aims at giving a "project dynamics" to concepts described
above. Before looking at the existing approaches, some theoretical developments
are presented which could be a theoretical basis to operational approaches.
Theoretical basis
Basic structured approach
The structured approach puts the design process in a prominent position and
generally associates to this step-by-step process a functional view of the system
studied. This approach leads to study the system more by activities the system must
execute than by data it must manage. The two main principles of the structured
approach
(1) the module decomposition;
(2) the flows study.
The decomposition of a module into sub-modules builds up a hierarchy to be
designed within a top-down approach. The functional modules enable a step-by-step
specification down to a very detailed level of modelling. The flows study leads to
understanding each module as a black box and to highlighting flows moving
between modules. IDEFO and SADT are based on this approach.
Systems theory approach
This approach aims at describing the entity and at designing it as a whole,
progressing in its environment. The systemic approach uses three techniques to
understand a system:
(1) analogy, which leads to comparing different domains;
55

(2) modelling, which aims at showing a real complex system under a simpler
form;
(3) simulation, the purpose of which is to test the model by looking slits
behaviour when external elements acting upon it are made to vary and by
extending conclusions to the real system.
The GRAI model is based on this approach.
Object approach
The object approach is the most recent. It comes from considerations about
programming languages. The main principle of this approach is that a system must
own external' quality factors in order to completely satisfy users. These factors can
be defined as: -
• validity: ability to exactly realise the tasks defined by specifications;
• robustness: ability to run even under abnormal circumstances;
• extensibility: facility of adaptation when specifications are changing;
• reusability: ability to be usable as a whole or by p5rts for a new application;
• compatibility: ability to be combined with other systems.
One of the main goals of the object approach is to meet two of these external quality
factors: extensibility and reusability (modularity).
Rodenacker's approach
Rodenacker's basic idea is that a system or a machine to be designed can be
modelled and defined from a functional point of view. For instance, three types of
inputs and outputs of a machine could be: energy, material and information. The
56
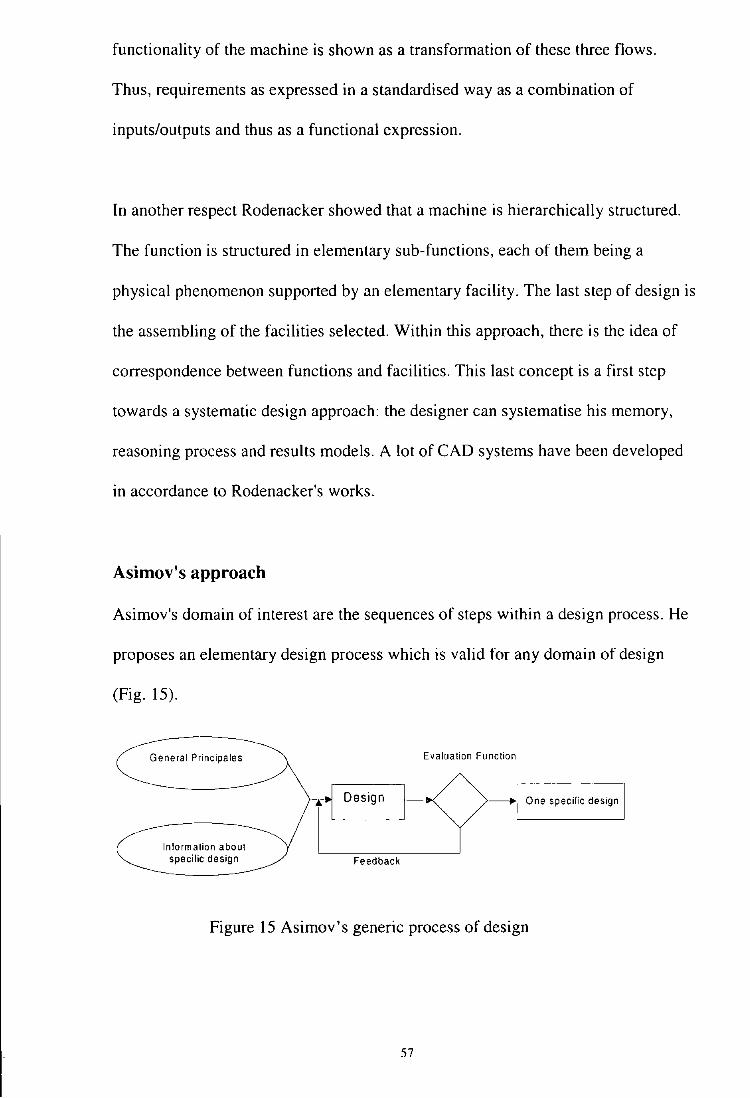
functionality of the machine is shown as a transformation of these three flows.
Thus, requirements as expressed in a standardised way as a combination of
inputs/outputs and thus as a functional expression.
In another respect Rodenacker showed that a machine is hierarchically structured.
The function is structured in elementary sub-functions, each of them being a
physical phenomenon supported by an elementary facility. The last step of design is
the assembling of the facilities selected. Within this approach, there is the idea of
correspondence between functions and facilities. This last concept is a first step
towards a systematic design approach: the designer can systematise his memory,
reasoning process and results models. A lot of CAD systems have been developed
in accordance to Rodenacker's works.
Asimov's approach
Asimov's domain of interest are the sequences of steps within a design process. He
proposes an elementary design process which is valid for any domain of design
(Fig. 15).
Information about specific design Feedback
Evaluation Function
One specific design
Figure 15 Asimov's generic process of design
57
Connection with the IMC model
lt is interesting to establish a connection between the two previous approaches and
the IMC model (Intelligence-Modelling-Choice) for decision processes. According
to this model a decision process is composed of three main steps:
(1) the "intelligence" or "identification" step (identification of current status);
(2) the "modelling" or "design" step (elaboration of solutions);
(3) the "choice" (choice of the best solution).
Y oshika wa 's general theory of design
The General Theory of Design has evolved from the framework of Yoshikawa's
work about automation of thinking within design activities [ 19]. This theory
includes works shown before. Yoshikawa has proposed it for a partial automation of
design within the framework of the definition of a method to build up CAD
systems.
It is an axiomatic approach. From a topologic model of human intelligence, he
proposes the following theorems about design process:
• Design requirements are functionally expressed.
• The solution to a design problem is expressed in terms of attributes the set of
which is infinite.
• An entity or an object is characterised by a set of attributes or properties.
• The set of attributes being infinite knowledge has no limit too. Thus the
definition of a solution to a design problem is possible and immediate.
SR
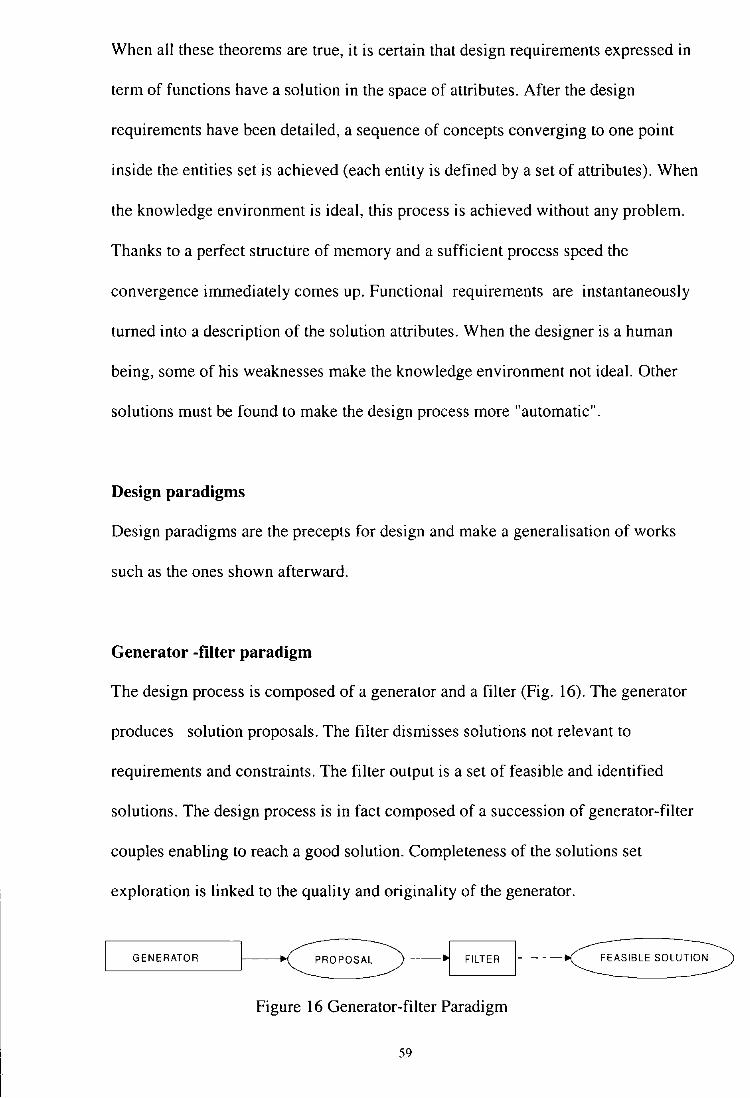
When all these theorems are true, it is certain that design requirements expressed in
term of functions have a solution in the space of attributes. After the design
requirements have been detailed, a sequence of concepts converging to one point
inside the entities set is achieved (each entity is defined by a set of attributes). When
the knowledge environment is ideal, this process is achieved without any problem.
Thanks to a perfect structure of memory and a sufficient process speed the
convergence immediately comes up. Functional requirements are instantaneously
turned into a description of the solution attributes. When the designer is a human
being, some of his weaknesses make the knowledge environment not ideal. Other
solutions must be found to make the design process more "automatic".
Design paradigms
Design paradigms are the precepts for design and make a generalisation of works
such as the ones shown afterward.
Generator -filter paradigm
The design process is composed of a generator and a filter (Fig. 16). The generator
produces solution proposals. The filter dismisses solutions not relevant to
requirements and constraints. The filter output is a set of feasible and identified
solutions. The design process is in fact composed of a succession of generator-filter
couples enabling to reach a good solution. Completeness of the solutions set
exploration is linked to the quality and originality of the generator.
GENERATOR PROPOSAL
Figure 16 Generator-filter Paradigm
59

Analysis-synthesis-evaluation paradigm
The design process is composed of three main steps (Fig. 17):
(1) requirements analysis;
(2) solution synthesis;
(3) solution evaluation.
Feed-back loops between these steps are possible.
Requirements are recorded and analysed before beginning the definition of a design
solution: every significant requirement must be expressed before the synthesis step.
The synthesis is only deduced from requirements. Performances of future objects
are evaluated in order to choose the most interesting solution. Evaluation is different
from filtering (previous paradigm): filtering dismisses solutions not relevant to
requirements, evaluation is processed afterwards. 1 t chooses the best solution when
several ones are possible. Evaluation also tests whether the solution is feasible.
---~'----...,..-A-NA_L_v_sE __ __,I--.,.1 SYNTHES10---~-------.-__JI----~-----------~ ~' ----------~
Figure 17 Analysis-synthesis-evaluation paradigm
Algorithmic paradigm
The set of design problems is rarely well structured or, more precisely speaking,
difficult to be structured in a good way. However some of them can get a good
structure. If the design sub-problem has clear boundaries and if requirements
evaluation criteria are known and numbered, then a design algorithm can be built
60
and it guarantees a correct solution. Thus the design algorithmic paradigm is also
the automatic design paradigm. Several formalisms can be used, for instance:
• Mathematical equations and inequalities. The design problem is brought back to
the resolution of a system of n equations and m parameters.
• Catalogue in which solutions can be reached through several input criteria.
Artificial intelligence paradigm
Because of the structuring problems, design requirements do not own accurate
evaluation facilities. Because of the number of design parameters to be taken in
account, definition of an understandable and complete set of design requirements is
not possible. Thus artificial intelligence gives a design framework composed of two
spaces:
(I) design status space;
(2) knowledge space linked to the designer.
The design status space is composed of:
• initial problem status;
• design goal;
• intrinsic constraints of the object studied;
• every other status reached during previous attempts to reach the target status.
The knowledge base is a combination of all pieces of knowledge which can be
reached while the design process.
The design process is a sequence of changes of the current design status. For each
change the current design status triggers a relevant action from the knowledge base.
61
This action leads to a new current design status. The kernel of this paradigm is the
utilisation of heuristics, because the number of design statuses is potentially infinite.
Heuristics are decision-making, enabling to reduce the inquiry domain inside the
design status space.
Design process
The major design problem is the research of possible actions. Simon thinks that
measuring the design criteria satisfaction is generally possible: it is an optimisation
problem. Doubts may be expressed about this opinion: in some cases a designer
cannot pass an objective judgement on the solution he gets. According to
Yoshikawa it is a knowledge structuring problem. He demonstrates that the design
solution is immediate within the case of an ideal knowledge base (everything is
known). Some design process models. however, enable to take in account the choice
of solutions according to functional design requirements. They enable to define a
rough correspondence between functional concepts topology (requirements) and
attribute concepts (possible solutions).
o Straight correspondence model (catalogue model). The two sets have the same
cardinality and are finite: to one specific requirement is always corresponding
the same solution (from the attributes point of view'). Thus no artefact is created.
the model acts only at a memory and the knowledge base does not evolve. It is a
borderline case because there is no real design process in this model.
• Production model. The principle of this model is to define a rules set to produce
solution (attributes) according to requirements. Constraints must be taken in
account according to the system to be designed.
62
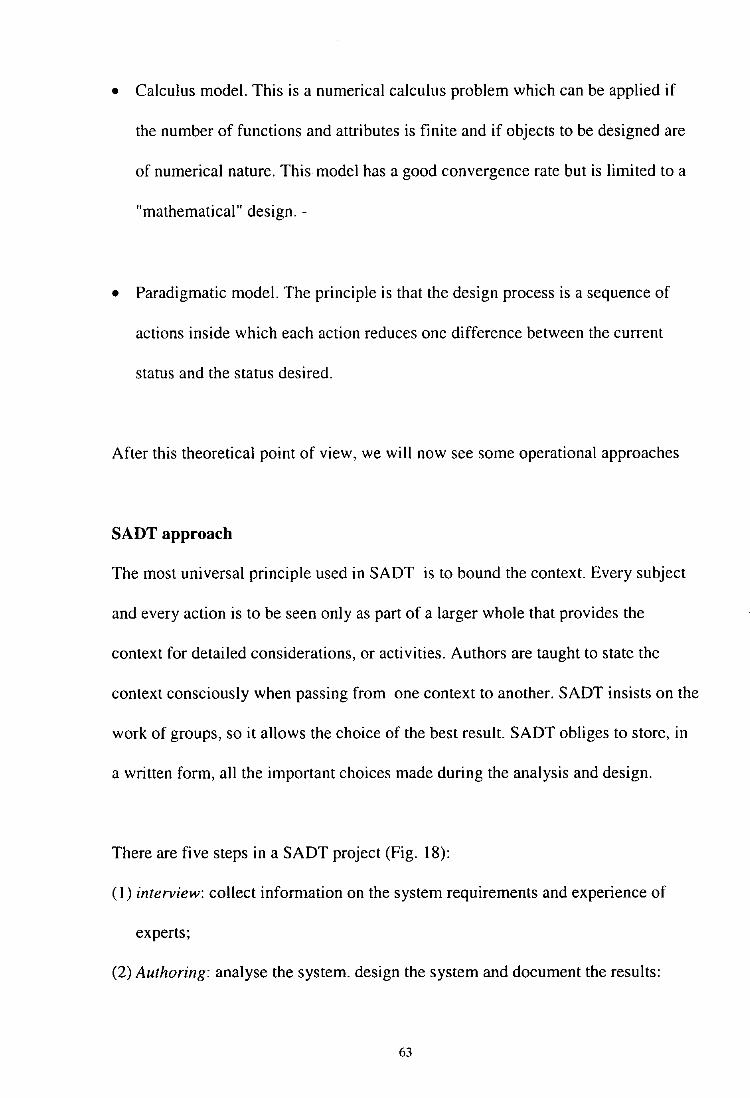
• Calculus model. This is a numerical calculus problem which can be applied if
the number of functions and attributes is finite and if objects to be designed are
of numerical nature. This model has a good convergence rate but is limited to a
"mathematical" design. -
• Paradigmatic model. The principle is that the design process is a sequence of
actions inside which each action reduces one difference between the current
status and the status desired.
After this theoretical point of view, we will now see some operational approaches
SADT approach
The most universal principle used in SADT is to bound the context. Every subject
and every action is to be seen only as part of a larger whole that provides the
context for detailed considerations, or activities. Authors are taught to state the
context consciously when passing from one context to another. SADT insists on the
work of groups, so it allows the choice of the best result. SADT obliges to store, in
a written form, all the important choices made during the analysis and design.
There are five steps in a SADT project (Fig. 18):
(I) interview: collect information on the system requirements and experience of
experts;
(2) Authoring: analyse the system. design the system and document the results:
63
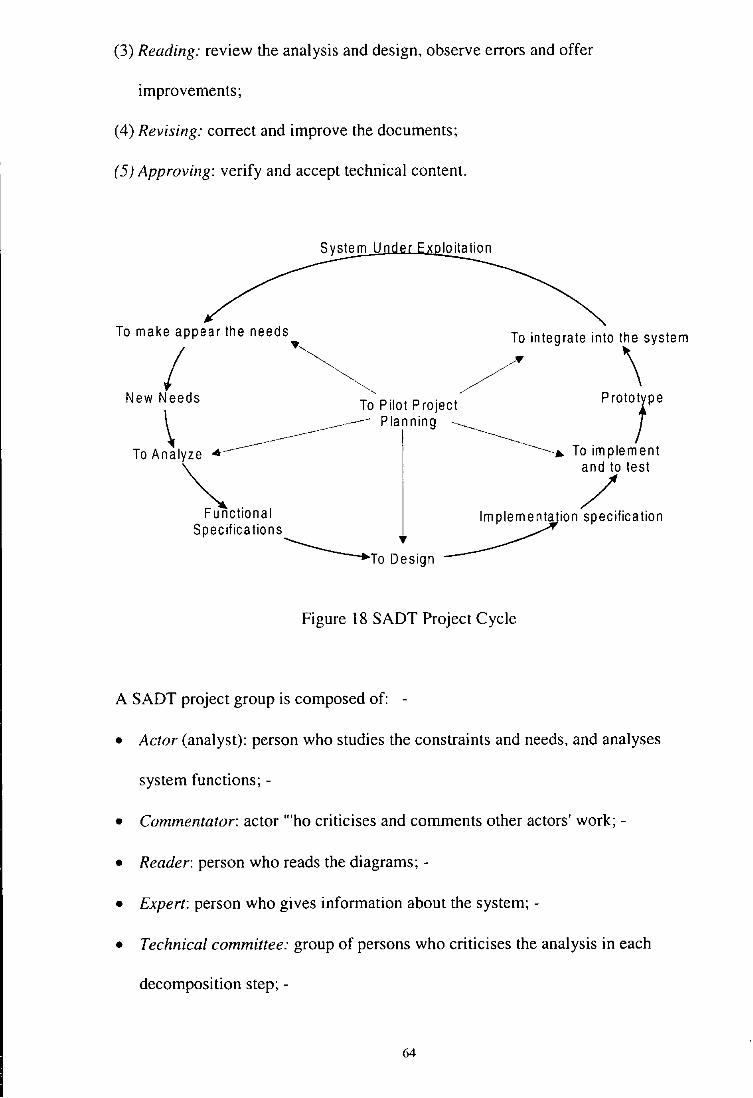
(3) Reading: review the analysis and design, observe errors and offer
improvements;
(4) Revising: correct and improve the documents;
( 5) Approving: verify and accept technical content.
To make appear the needs
1 ~ /;:'""'""toto'\ syst'm
New Needs To Pilot Project Proto,pe
\ ___ _________.------ P I a n n in g -----...--------.
\ ----- ~ To Analyze • --------~,., To implement
~. /test
FunctiOnal lmpleme~ion specification Specifications ~
~ToD:sign
Figure 18 SADT Project Cycle
A SADT project group is composed of: -
• Actor (analyst): person who studies the constraints and needs, and analyses
system functions; -
• Commentator: actor '"ho criticises and comments other actors' work; -
• Reader: person who reads the diagrams;-
• Expert: person who gives information about the system; -
• Technical committee: group of persons who criticises the analysis in each
decomposition step;-
64
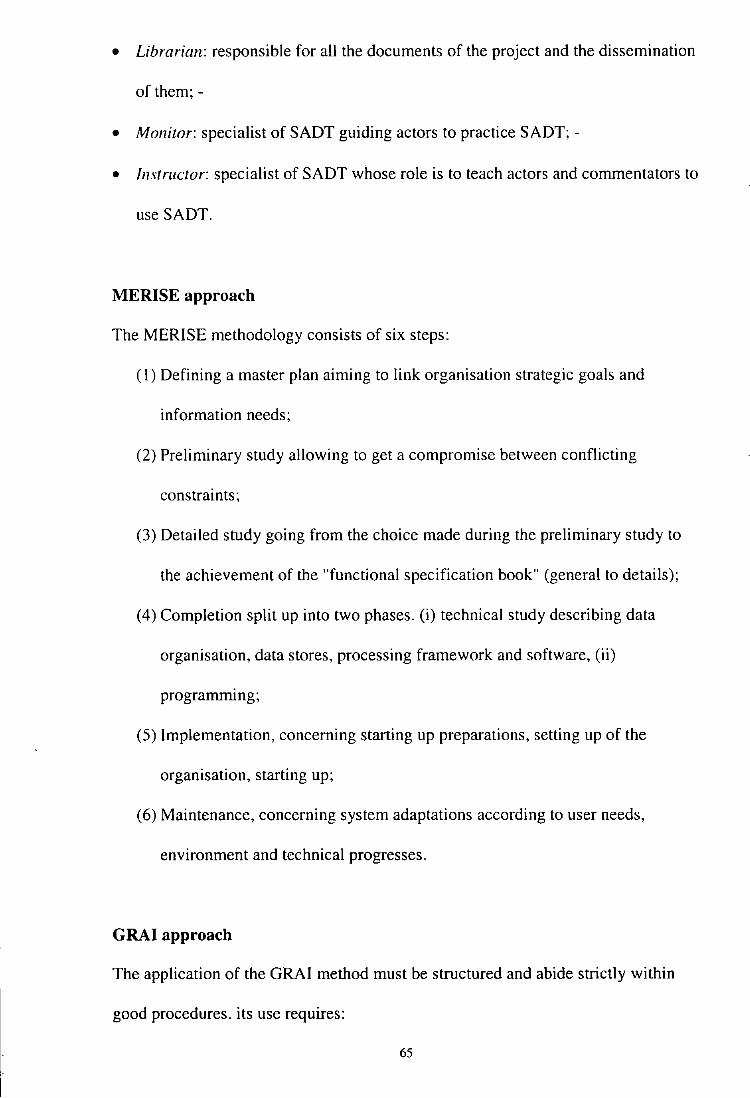
• Librarian: responsible for all the documents of the project and the dissemination
of them;-
• Monitor: specialist of SADT guiding actors to practice SADT; -
• Instructor: specialist of SADT whose role is to teach actors and commentators to
use SADT.
MERISE approach
The MERISE methodology consists of six steps:
( l) Defining a master plan aiming to link organisation strategic goals and
information needs;
(2) Preliminary study allowing to get a compromise between conflicting
constraints;
(3) Detailed study going from the choice made during the preliminary study to
the achievement of the "functional specification book" (general to details);
(4) Completion split up into two phases. (i) technical study describing data
organisation, data stores, processing framework and software, (ii)
programming;
(5) Implementation, concerning starting up preparations, setting up of the
organisation, starting up;
(6) Maintenance, concerning system adaptations according to user needs,
environment and technical progresses.
GRAI approach
The application of the GRAI method must be structured and abide strictly within
good procedures. its use requires:
65
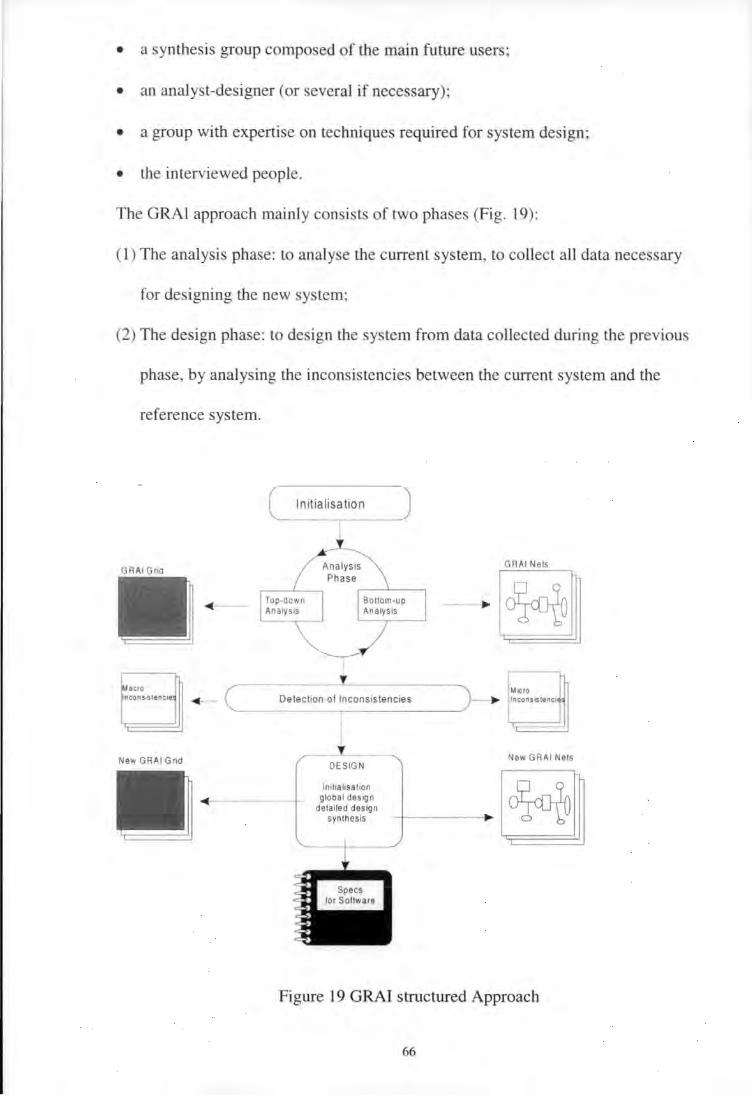
• a synthesis group composed of the main future users;
• an analyst-designer (or several if necessary);
• a group with expertise on techniques required for system design;
• the interviewed people.
The ORAl approach mainly consists of two phases (Fig. 19):
(I) The analysis phase: to analyse the current system, to collect all data necessary
for designing the new system;
(2) The design phase: to design the system from data collected during the previous
phase, by analysing the inconsistencies between the current system and the
reference system.
GRAI Gnd
Macro nconstStencte
New GRAI Grid
Detection of lnconststenctes
DESIGN
lnat,alisat,on global des1gn
detailed design syn thesis
GR AI Nets
~ MIC ro lnconsastenct
New GR AI Nets
Figure 19 GRAI structured Approach
66
The analysis phase consists of a top-down analysis and a bottom-up analysis. Top
down analysis consists of drawing up a frame showing the structure of the decision
centres of the current system by using GRAl grid. Bottom-up analysis consists, for
each decision centre, of analysing in detail: decisions made in the decision centre,
variables used in making decisions and frame of decision (constraints on variables,
criteria, etc.). This analysis is supported by GRAl nets which represent both
activities (decision or process) and iii formation required by the activities The aim
of the analysis is to find defaults in production management systems. There are
three possible types of inconsistencies:
(l) transmission of information;
(2) specific to a decision; and
(3) co-ordination between decision centres. These inconsistencies may be solved
in the design phase in which a new structure of production control system is
defined.
The design phase includes two steps:
( 1) Drawing a frame representing the new structure of the Production
Management System;
(2) Drawing the GRAl nets which show', for each decision centre, the main
specifications of information and decision.
The result of this structured approach is the specifications of the Production
Management System.
67
GIM approach
GIM starts by an initialisation phase which defines the problem to be solved, the
domain and the objective of the project. During the second phase, a global model of
the studied enterprise is built with the IDEFO tool. The objective is to analyse the
different flows in the enterprise and to locate the manufacturing system. The third
phase is to model and to analyse each sub-system within the manufacturing system
(decisional, informational and physical). At this step, we make a separation between
the PMS described by tools coming from GRAI and MERISE, and the physical
system described by IDEFO. The analysis phase consists of a top-down analysis and
a bottom-up analysis. The aim of top-down analysis is to build macro models
(functional and physical models by IDEFO, decisional model by GRAI grid and data
model by MERISE). The bottom-up analysis allows to build the rrucro models
(decisional model by GRAI net, physical model by IDEFO). The fourth phase is the
detection of inconsistencies on the three sub-systems. For that purpose we use some
formal rules defined by the GRAI method, some' coherence tool and reference
models. Afterwards, the objective and the goal of the design phases are detailed and
the system constraints are analysed. The other steps concern design with several
levels of detail which correspond to the different abstraction levels: conceptual,
structural and physical (Fig. 20).
68

Existing system
Definition of the domain of the study
(first levels of the functional model)
New System
Figure 20 GIM Structured Approach
Conclusions
Techn ical Oriented n
Nowadays, CIM can no longer be reduced to a purely technical approach. The only
guarantee to design an adequate CIM system is to use a methodology which
involves and mobilises all the people concerned, and which takes into account
function, information, decision, organisation resource/physical, as well as
69

economic, social and human aspects. A global methodological approach should be
able to incorporate simultaneously the coherent use of methods, formalisms and
reference models/architectures. Most existing approaches (ICAM, CAM-I,
MERISE, SADT, GRAI, etc.) are noticed to have been developed separately in
order to tackle only one particular aspect of CIM. The need to integrate these
various approaches generate coherence problems with regard to the concepts that
are developed. The research work carried out within the ESPRIT programme,
especially GIM. CIMOSA and IMPACS, tries to integrate the various techniques
needed to design an efficient CIM system into a global approach.
In this way, concepts we have presented as constructs of a methodology (reference
model, modelling formalisms, structured approach) are found in most of current
design approaches. Thus, this frame is a good basis to understand the role of each of
these concepts in design. However, the approaches presented are very different from
one to another and many concepts and terms are used in different ways.
Recently, the IFAC/IFIP Task Force on Architectures for integrating Manufacturing
Activities and Enterprises has carried out a comparative study on three selected
architectural approaches: CIMOSA, GIM and PERA (Purdue Enterprise Reference
Architecture). Based on this study, the Task Force started to define a complete
architecture associated with a methodology: GERAM (Generic Enterprise
Reference Architecture and Methodology) for the analysis and design of Integrated
Manufacturing Systems.
70

Appendix B
A brief descriptions of companies interviewed and
Diagrams for case study companies
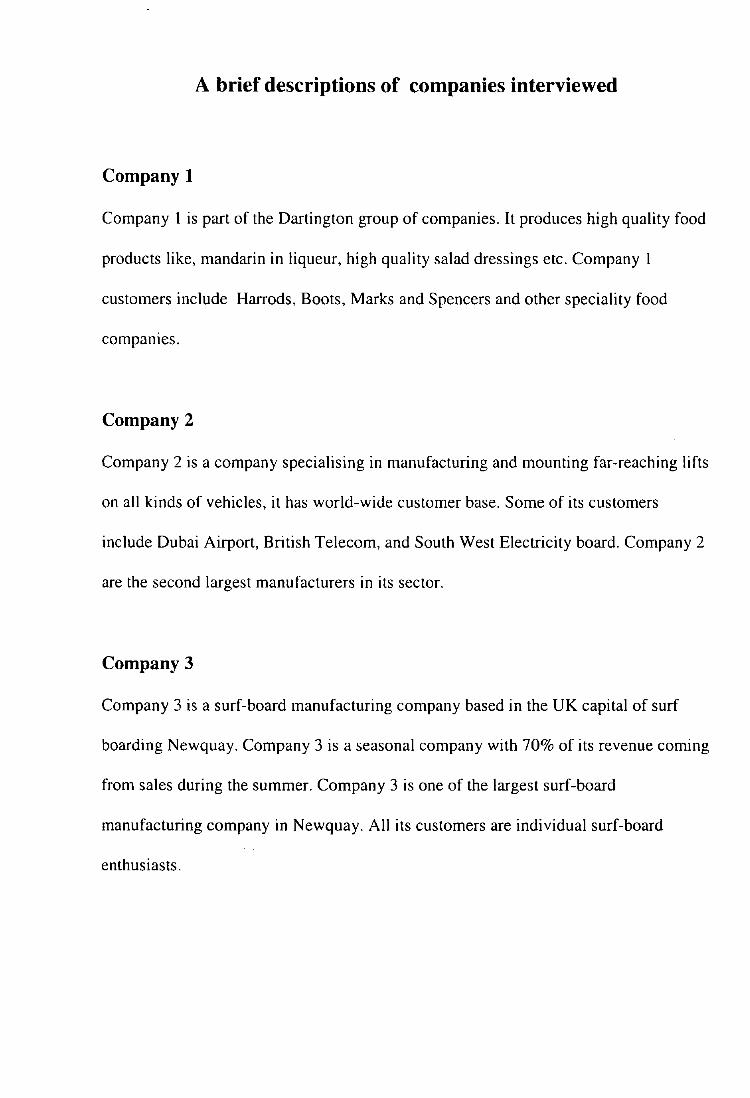
A brief descriptions of companies interviewed
Company 1
Company l is part of the Dartington group of companies. It produces high quality food
products like, mandarin in liqueur, high quality salad dressings etc. Company l
customers include Harrods, Boots, Marks and Spencers and other speciality food
compames.
Company 2
Company 2 is a company specialising in manufacturing and mounting far-reaching lifts
on all kinds of vehicles, it has world-wide customer base. Some of its customers
include Dubai Airport, British Telecom, and South West Electricity board. Company 2
are the second largest manufacturers in its sector.
Company 3
Company 3 is a surf-board manufacturing company based in the UK capital of surf
boarding Newquay. Company 3 is a seasonal company with 70% of its revenue coming
from sales during the summer. Company 3 is one of the largest surf-board
manufacturing company in Newquay. All its customers are individual surf-board
enthusiasts.
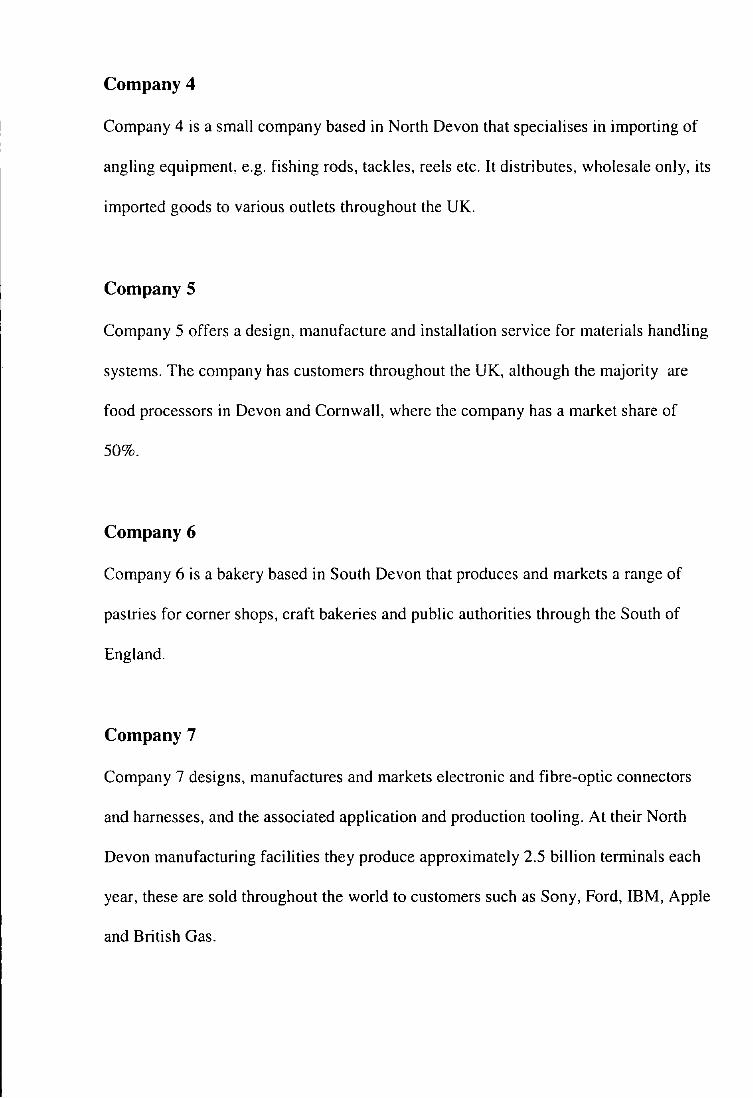
Company 4
Company 4 is a small company based in North Devon that specialises in importing of
angling equipment, e.g. fishing rods, tackles, reels etc. It distributes, wholesale only, its
imported goods to various outlets throughout the UK.
Company 5
Company 5 offers a design, manufacture and installation service for materials handling
systems. The company has customers throughout the UK, although the majority are
food processors in Devon and Cornwall, where the company has a market share of
50%.
Company 6
Company 6 is a bakery based in South Devon that produces and markets a range of
pastries for corner shops, craft bakeries and public authorities through the South of
England.
Company 7
Company 7 designs, manufactures and markets electronic and fibre-optic connectors
and harnesses, and the associated application and production tooling. At their North
Devon manufacturing facilities they produce approximately 2.5 billion terminals each
year, these are sold throughout the world to customers such as Sony, Ford, IBM, Apple
and British Gas.

Company 8
Company 8 manufactures and markets security boxes that are used by security
companies to take the money in and out of banks. These boxes have a built-in device so
that if the boxes are wrongfully snatched, the device would set off red dye that would
stain the money. The company has a major share of the UK market and exports to a
few European countries.
Company 9
Company 9 manufactures furniture for handicapped and special needs children. The
company supplies furniture to special needs schools throughout the UK, and is the only
supplier of its kind in the Devon and Cornwall region.
Company 10
Company 10 is the UK leader in the manufacture of modular power supplies and is part
of a multinational company that is the world's largest power supply group. This
company has been trading for over 35 years and employs about 250 people. This was
the largest company visited.
Company 11
Company 11 is a manufacturer in the market of wholesale plants. The company sells 2-
3 million plants each year and holds an estimated 2% of the UK market. The
company's annual turnover includes 10% export revenue. The company has been
growing at the rate of 20% per annum.

Company 12
Company 12 is an independent private company. The principal product of the company
is a range of high quality assembled kitchen units, mainly sold direct to house builders
within its geographical region. It is estimated that the company holds 5% of the market
in the Devon and Cornwall region.
Company 13
Company 13 designs, manufactures and markets a range of microwave guides. These
are used by the defence and telecommunications equipment manufacturers. The
customers include British Aerospace, GEC and Ericsson. The company commands a
65% market share of the UK market, 30-40% of the mainland Europe market and
significant part of the North American market; approximately 65% of the company's
turnover is export.
Company 14
Company 14 is a privately owned company founded in 1970. It designs, manufactures
and markets a range of oceanographic and hydrometric instrumentation. The majority
of the company's turnover comes from the sale of self-recording, and direct reading
multi-parameter current meters. The company's customers include the NRA, Ministry
of Agriculture Fisheries and Food (MAAF), the Defence Research Agency (ORA), and
Seatronics.
Company 15
Company 15 is an independent private company. The principal product is a range of
garage forecourt equipment (e.g. jetwash, air pressure equipment, little bins, screen
wash fillers etc.) mainly sold direct to the large oil companies. It is estimated that this
company holds 15% of the UK market, 5% of its revenue is from export.
Company 16
Company 16 is a major manufacture of microprocessors for a specialist sector. The
company's customers include NASA in the USA. The company commands 20% of the
UK and 35% of company's turnover is generated from export and overseas business.
Company 17
Company 17 is a specialist thin film company which supplies advanced thin film
coatings for a wide variety of commercial military applications.

Diagrams For Case Study Company B
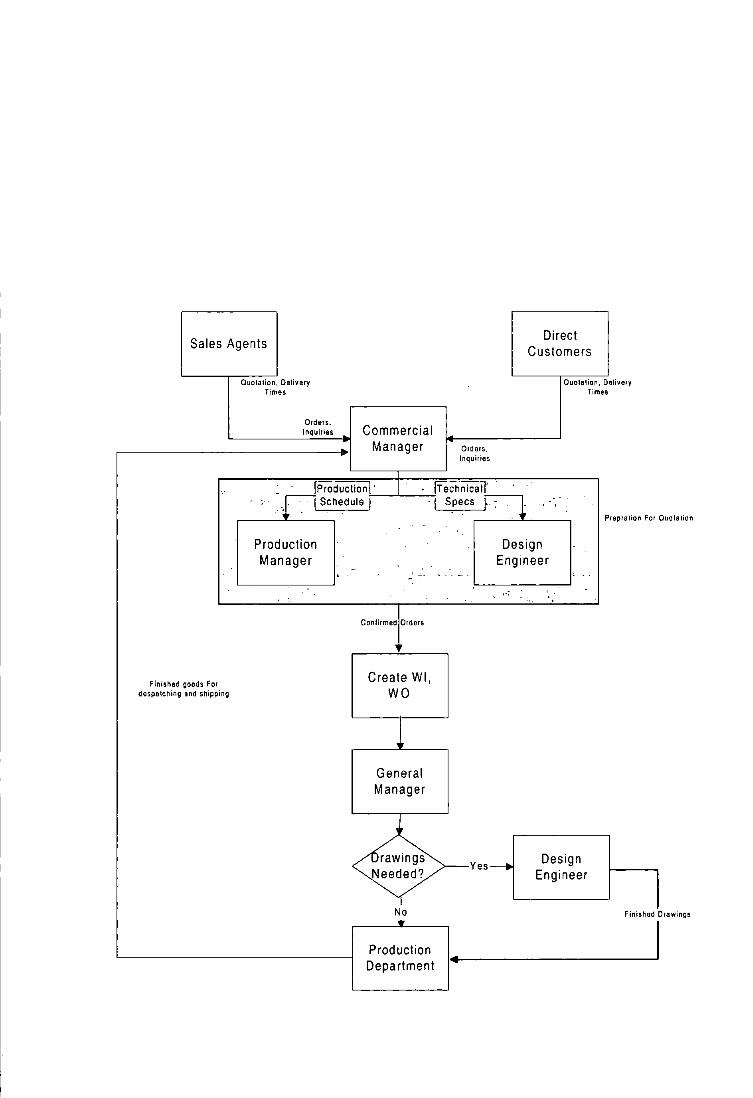
Sales Agents Direct
Customers
Finished goods For despatching and shipping
Quotation. Delivery Times
Orders. Inquiries Commercial
Manager Orders, Inquiries
Quotation, Delivery Times
: rlPr.oductiOnl' fTechnical,_l' ------, · · - . -~ . L Schedule ;-1 --'---;_1 Specs f - . ~
Production Manager
Conlirmed Orders
Create Wl, WO
General Manager
rawings Needed?
No .. Production Department
.--~,.__----,
Design Engineer
Yes-Design
Engineer
Prepralion For Quotation
Finished Drawings

Design Engineer
_Schematic Drawings
Assembly supervisor
General Manager
Schedule-
Make BOM No _____..
and order RM
Yes ,..__ ___ _
done ?
Yes
No wait for
Fabrication
______. Buyer 1---
RM
Start assembly 1+--------------- -----_j
Testing
Despatch
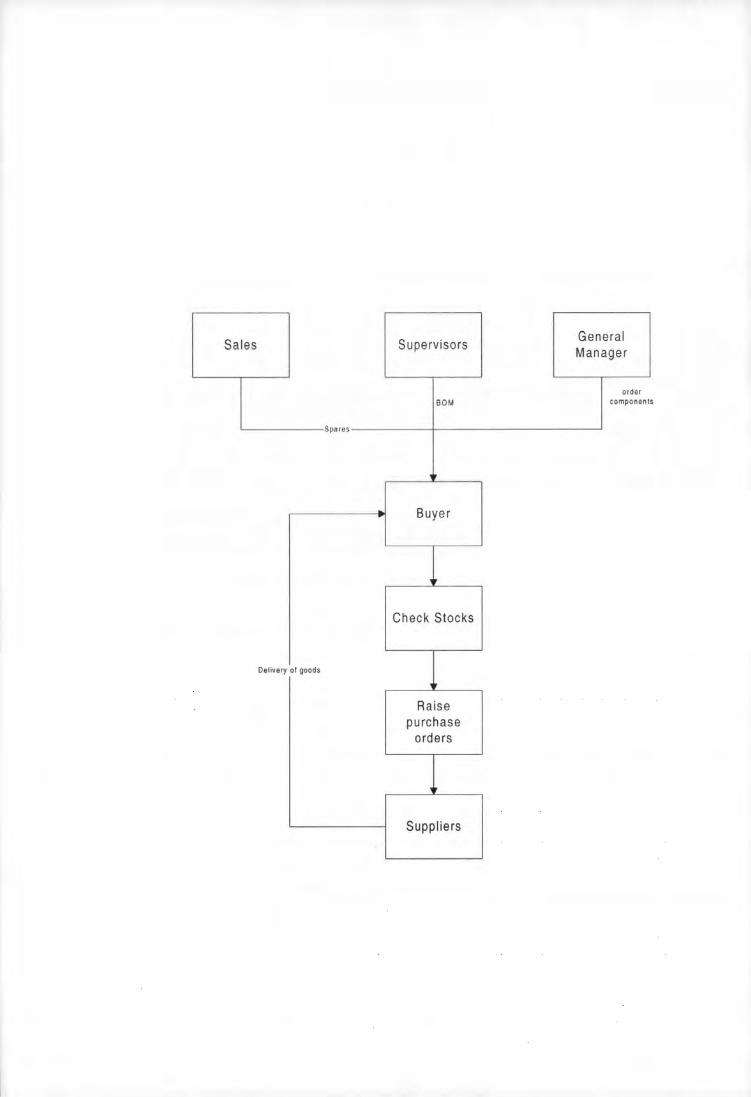
Sales General
Supervisors Manage r
order BOM components
Spares
.... Buyer
Check Stocks
Deliver y of goods
t
Raise purchase
orders
t_
Suppliers
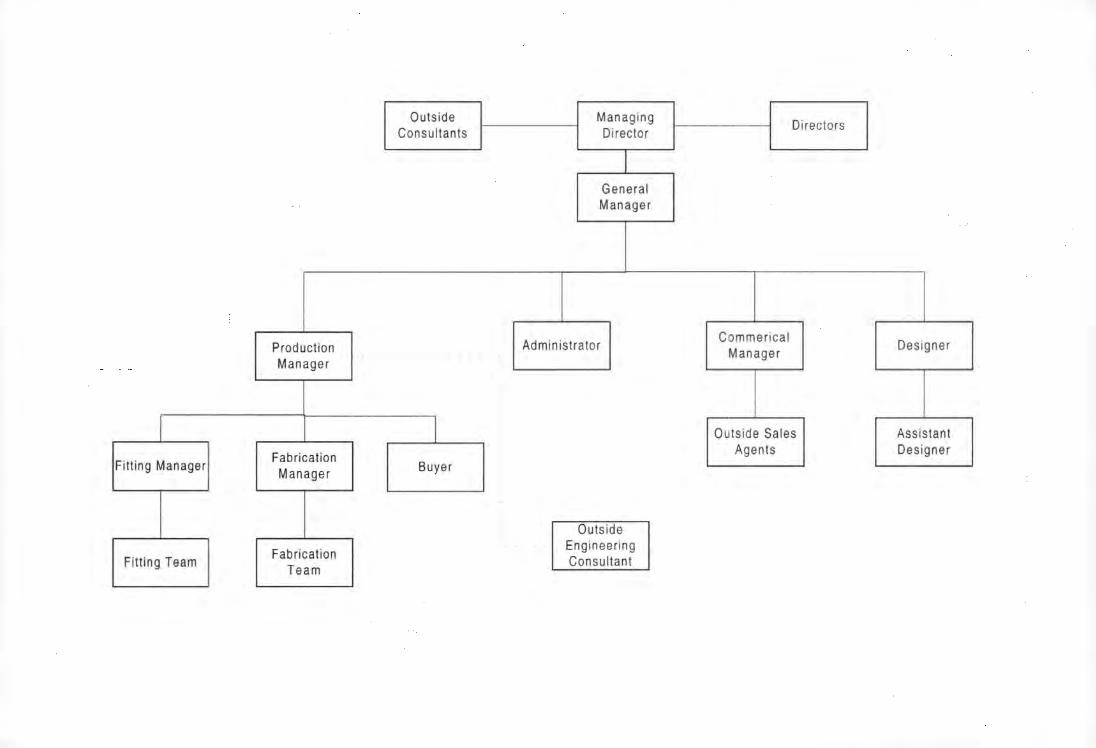
Fitting Manager
Fitting Team
Production Manager
Fabrication Manager
Fabrication Team
Outside Consultants
l Buyer
Managing Director
General Manager
Administrator
Outside Engineering Consultant
Commerical Manager
Directors
Outside Sales Agents
Designer
Assistant Designer
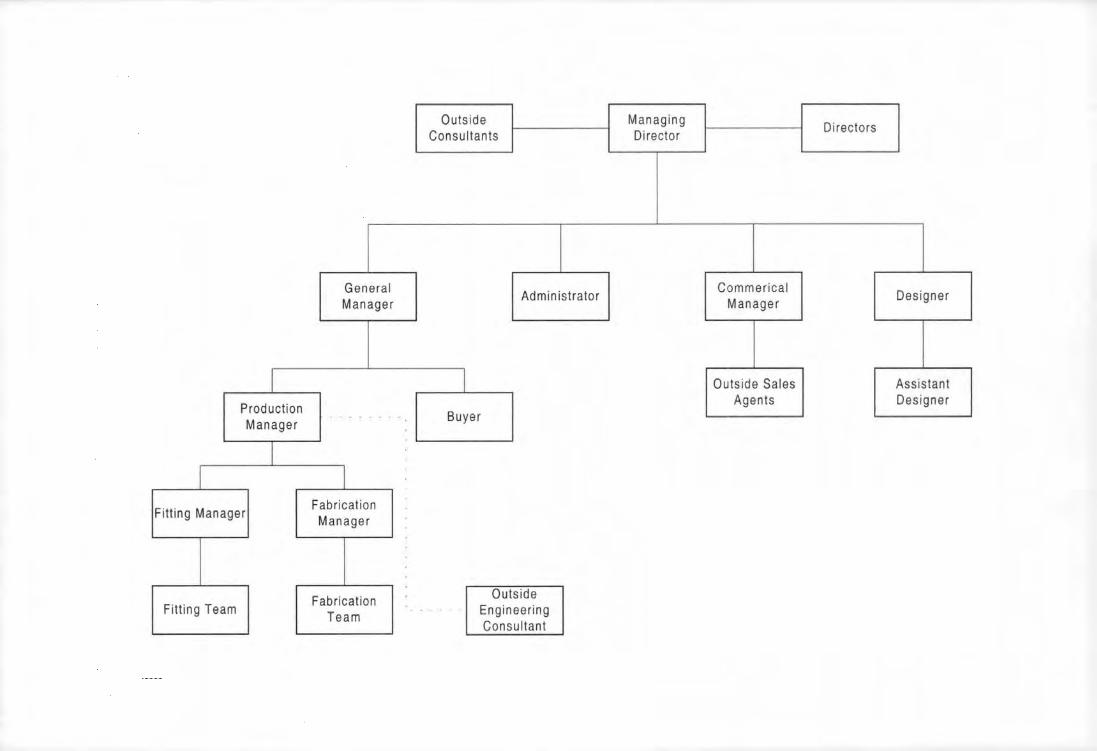
I
I Production Manager
I
Fitting Manager
Fitting Team
General Manager
I Fabrication Manager
Fabrication Team
Outside Consultants
Administrator
l Buyer
Outside Engineering Consultant
Managing Director
Commerical Manager
Outside Sales Agents
Directors
Designer
Ass istant Designer

Design Eng ineer
..._____Schematic Drawmos
Fabricat ion supervisor
Yes
• Start
Fabrication
1 Assembly
General Manager
Schedule-
No Make BOM
and order AM Buyer
RM

Sales -Works Orders -
BOM and AM Aequuemenl Ca lculaled
Fabrication
· . .-------'~ ~·
Assembly
'-----AM Needs ----+1
General Manager
Design Engineer
AM Needs
Buyer
Fabrication Starts
Assembly
Testing
Pfoduct1on Schedule
Production Manager
Despalchrng

Production Manager Noel Bray
I Fabrication Team
Outside Consultantsl--------1
Payroll April Osborne
Commercial Manager Jarrard
I
Managing Director ~,....---------,
I 1 > Personal Assistant
General Manager ~
I I
Customer support John Pett it
I
Des ign Engineer John Beecroft
Development Engineer
Glen Barnet -
I I Sales Agents Assistant Des igner
Tom AN Other
Assembly Team Buyer
Les Vanstone
-
Outside Eng ineering Consu ltants
Personal Ass istant 1----------------------------' Linda

Agents
Direct customers
Supplier
Sates
Unle or NO consultation on delivery dates
Works order
WO and Oehvery
Do nothing No
Buyer
Design
General Manager
Built into Schedule
Yes
Yes
Issue drawings
Order AM/part
No
'-----Deliver AM/ Part~---.< Order Parts
Deliver Parts
Make BOM Assembly
No Do nothing
Yes
I ... ~ . .,·1---'
Yes
No
•
Produce Schematic Diagrams
No BOM produced by lhe
des,gn engineers
Do nothing
Chase detailed drawings
Fabrication
Make BOM
Yes
Fabricate
Start work anyway
Issue schematic
Drg 's
No- Do nothing
Yes
test and reclfy
No Send the vehicle anyway

.. Agents + I
Works order
Sales I
Direct t customers
consul! design and PM for delivery dates
Do nothing ~No
Design
Production Manager
Build into Schedule
chedule date
Yes
+ Issue
Produce Schematic Diagrams
Sch DRG . Buye r Consult
supervisors I DB for BOM
Check stock & order AM
schematic 14' ~~~: ~~~~Drg's
- Deltver palls - Supplier
Fabrication
Assemble 1+-
QC
Detailed Drawings
i
1>----No--. Rectify ~ c_____________j
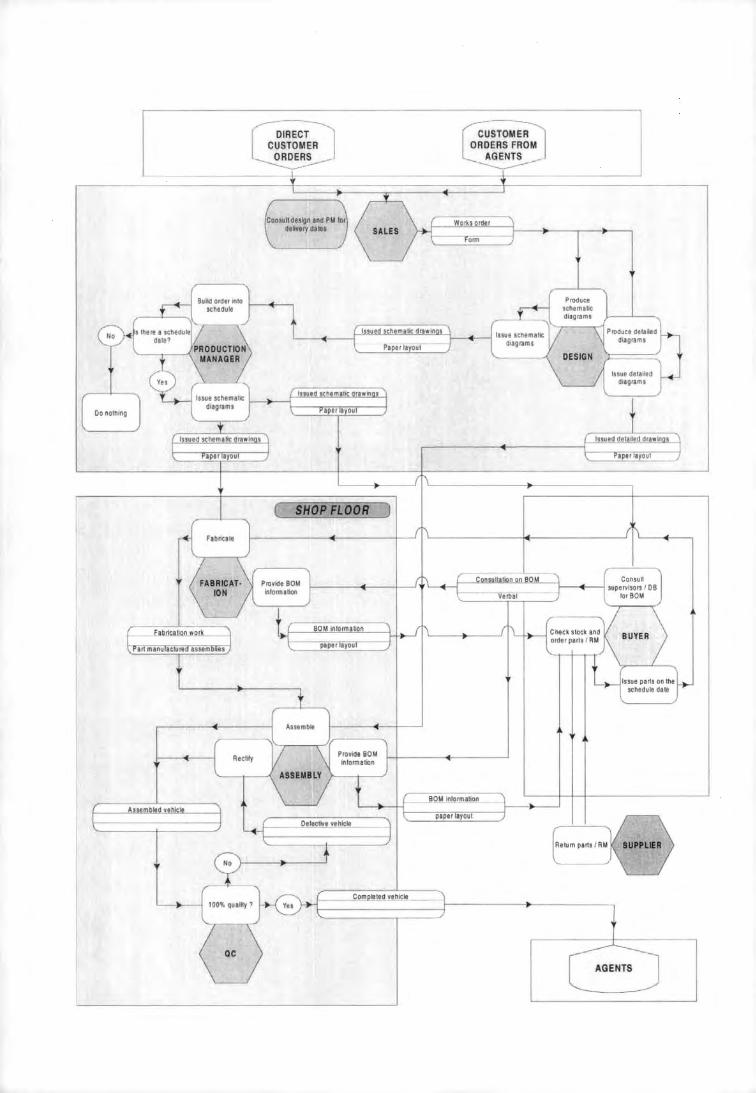
Consull dnlgn and Pll lor dalvery dales
( SHOP FLOOR J
BOil lnlormalion
paper ayout
Re tu m pans/ RM
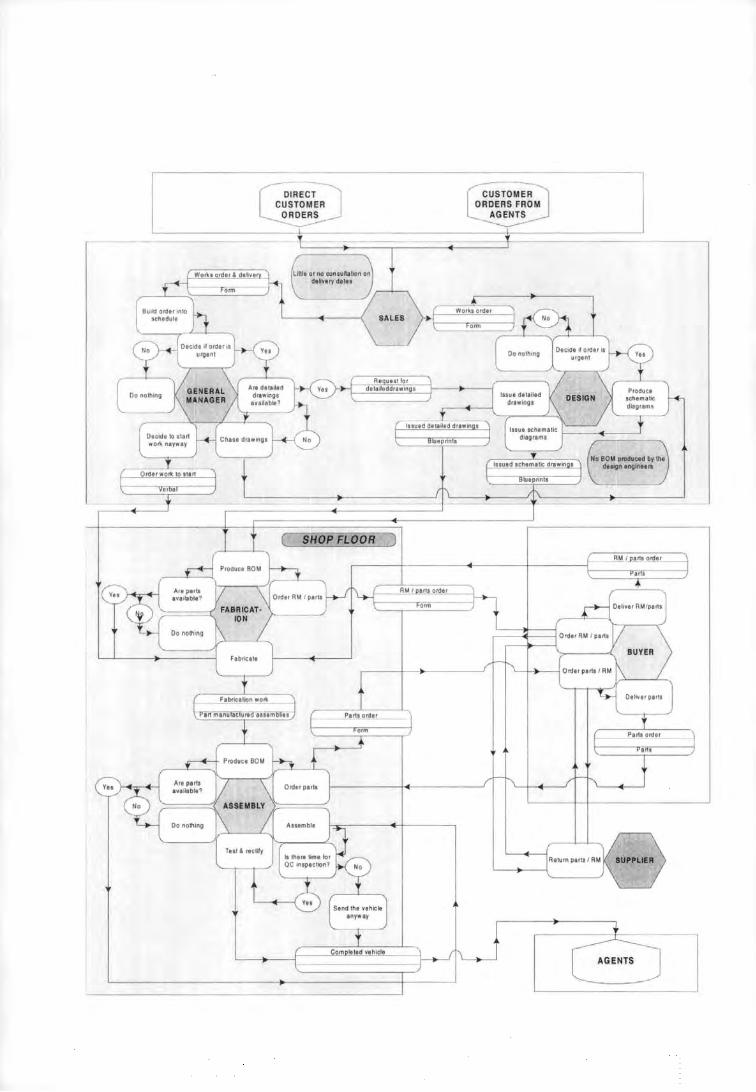
G- ~ RECT STD MER RDERS -
------
No 8011 produced by the d11ign englnters
Return parts/ AU

Diagrams For Case Study Company D

Producl manufactured advice 4 hours
1na assem rave er
-~-CUSTOMER CUSTOMER SERVICING$ REPAIRS
-------
J
TRANSALARM Ltd
( QUALITY )
[$ERVICES]
8

C~ME~ ORD~
3
8 ( TRANSALARM,Ltd )
8
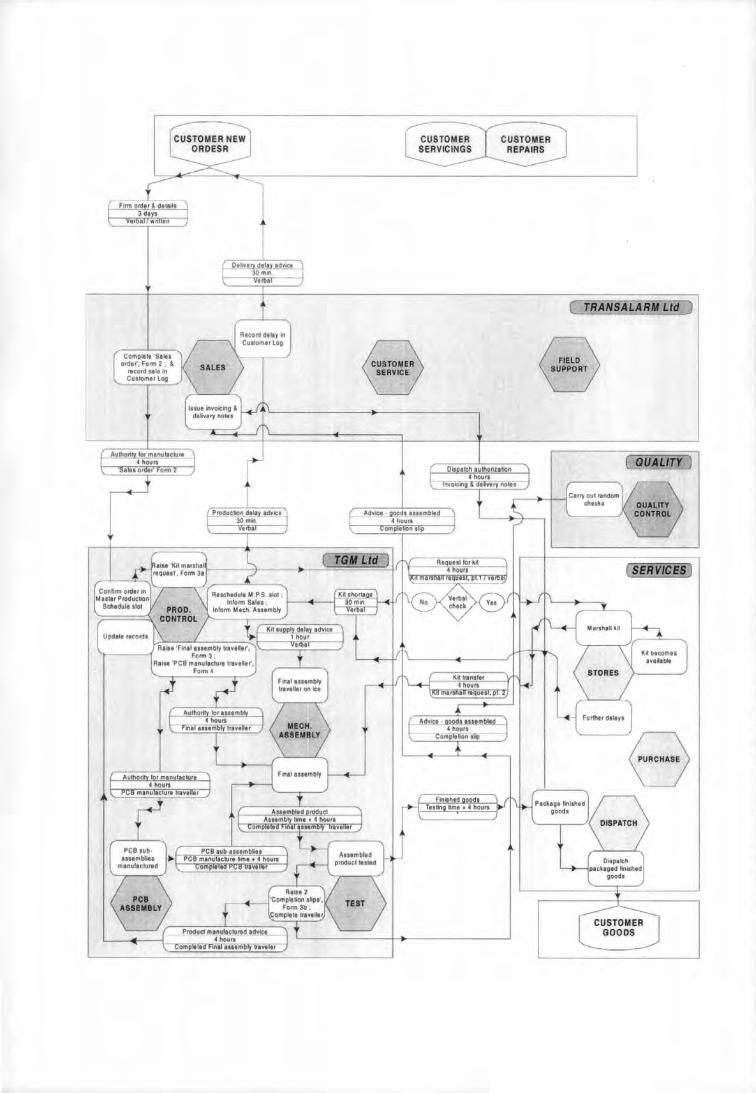
TRANSALARftf Ltd

Appendix C
Publications
The papers attached to this appendix were presented and published in the following
conferences:
• Advanced Manufacturing Processes, Systems and Technologies (AMPST 96),
Bradford, UK, 1996.
• Advanced Manufacturing Technology, Twelfth National Conference on
Manufacturing Research, Bath, UK, 1996.
• Competitive Manufacturing, Twelfth Conference of the Irish Manufacturing
Committee, Cork, Republic of Ireland, 1995.
• Advances in Manufacturing Technology, Eleventh National Conference on
Manufacturing Research, Leicester, 1995.
• Applications of soft technologies for enhanced manufacture and management,
Technology Transfer series, Plymouth, 1996.
• Technology Transfer and Innovation, Teaching Company Directorate, London, UK,
1997.
• New technology in SME's, Teaching Company Directorate, Belfast, Northern
Ireland, UK, 1995
PLYMOUTH TEACHING COMPANY CENTRE
UNIVERSITY OF PLYMOUTH
The Design Process For A Management Information System Applied To A Manufacturing Company
Mr. Z.Qurashi u, Dr. M.N.Polkinghome3, Dr R. Burns3 and Mr.
J .F.Pearce2·3
1 Dartington Foods (UK) Ltd, lvybridge.
2 Plymouth Business School, University of Plymouth, Plymouth.
3Plymouth Teaching Company Centre, University of Plymouth, Plymouth.

ABSTRACT
It is the aim of this paper to describe the design process for a manufacturing based management information system. Prior to the design and specification of required computational resources, it is shown that significant advantages may be achieved in terms of the effectiveness of the final solution and in its acceptance by the relevant employees, by initially concentrating on the development of the manual. information systems present.
INTRODUCTION
When considering the current dynamic manufacturing environment it has clearly become imperative that companies manufacture to ever increasingly tighter schedules and higher quality specifications in order to maintain profit margins. Key goals in any manufacturing company are to reduce lead time and work in progress (WIP) with wastage minimised, while at the same time to remain competitive in their markets, which may extend world-wide.
The success or failure of an organisation was traditionally attributed to many factors, e.g. employment of capital, plant equipment, quality of ski lied labour, etc. In recent years handling of information within a company has become just as relevant and vital. Therefore, for a company to achieve its objectives it is imperative that the information must be controlled in an orderly and organised manner. Due to the recent computational development the nature and handling of information have become much more complex. If not well organised and understood, there is a significant possibility that detrimental effects on the company's position may result.
The application of Information Systems (IS) has been established in industry for several years. These systems consist of a set of fundamental procedures that collate, process, store and disseminate relevant information[ 1], thus supporting the decision making and control within the organisation. This has been extended by the principles of Management information Systems (MIS). The MIS methodology is designed to serve the monitoring, controlling, decision making and administrative activities of an organisation[ l]. Implementation of these MIS principles can be computer based (CBMIS). The system may therefore be designed to focus on daily, weekly, monthly and annual summaries of various accounting and manufacturing transactions. This Teaching Company Scheme case study is based on a low volume/high margin food manufacturing company where the primary objective was to increase the output without necessitating an increase in production resources. This paper aims to explain how this process will be achieved by first developing manual information systems for individual departments, and then subsequently using the basis of these systems, to develop an integrated CBMIS.
SPECIFICATION OF THE PROJECT
The first, and most significant, stage of the system design is the project specification which should include precise definition of the project's boundaries,
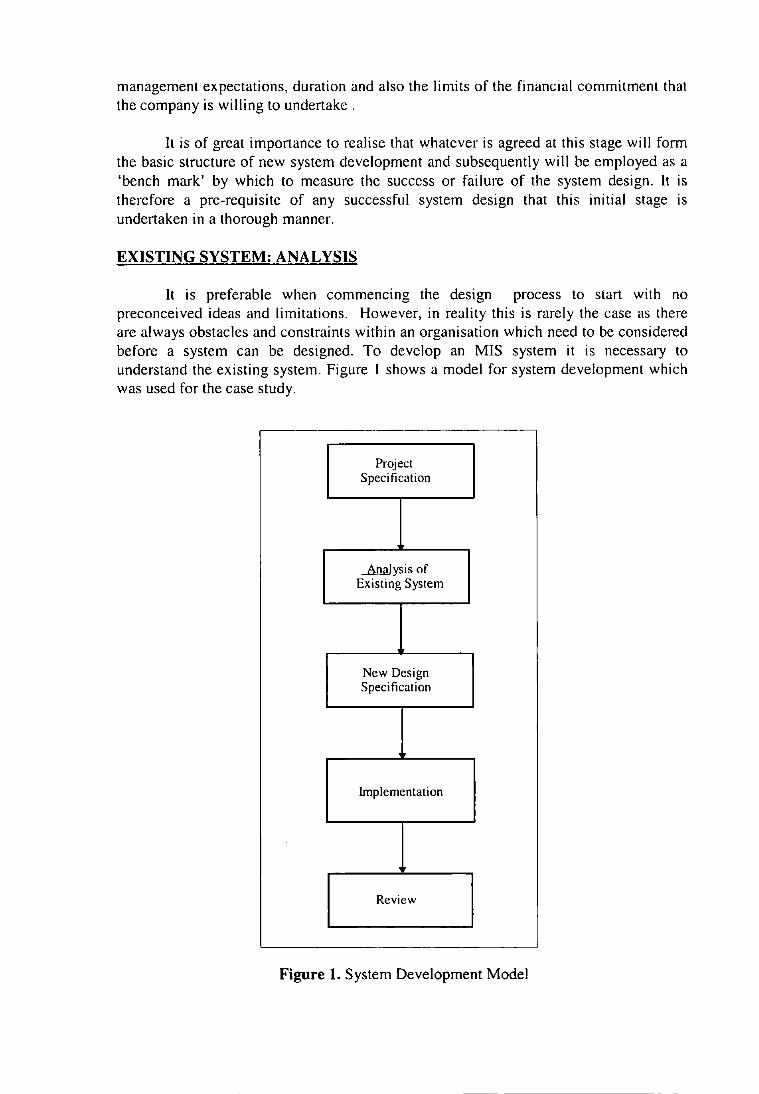
management expectations, duration and also the limits of the financial commitment that the company is willing to undertake .
It is of great importance to realise that whatever is agreed at this stage will form the basic structure of new system development and subsequently will be employed as a 'bench mark' by which to measure the success or failure of the system design. It is therefore a pre-requisite of any successful system design that this initial stage is undertaken in a thorough manner.
EXISTING SYSTEM: ANALYSIS
It is preferable when commencing the design process to start with no preconceived ideas and limitations. However, in reality this is rarely the case as there are always obstacles and constraints within an organisation which need to be considered before a system can be designed. To develop an MIS system it is necessary to understand the existing system. Figure 1 shows a model for system development which was used for the case study.
Project Specification
...Alli!) ys is of Existing System
New Design Specification
Implementation
Review
Figure 1. System Development Model
EXISTING SYSTEM: UNDERSTANDING THE ORGANISATION
The initial consideration when attempting to understand a company is to identify the actual structure, e.g. the operation may be very centralised with nearly all decisions being focused at head office. If this is the case then clearly the IS must reflect this. Conversely, if the organisation allows considerable autonomy to managers in subsidiary parts of the business then the system must be designed to provide these managers with their necessary requirements to run the business effectively. The system must therefore be tailored to closely reflect the structure of decision making[2]. In addition, the existing IS's in the various departments must be understood and evaluated. This can be achieved by utilising a sequence of methods.
The most significant tool for finding out how the existing system works is the personnel interview. It is best to interview all of those concerned with the system, even though this appears to provide more sources of information than is absolutely necessary. Some of these sources will make mistakes, so the extra sources help to identify where this has occurred.
The use of a systematic approach to gathering the information should help to minimise the risk of leaving gaps in the information gathered. The use of a standard data collection form by the analyst is often helpful at this point, assisting the interviewer to ensure that nothing is missed through open ended questions.
Inviting the interviewee's observations and opinions can prove helpful and may help to form relationships ready for the stage when change must be implemented. The questions should be worded carefully. They should not offend and must enable the analyst to identify all information used, what it is used for, why the process is carried out, where the information is derived from and where its subsequent destination is[2].
Observation is another key element in building up a picture of how the existing system operates. Useful insight into the problems and inefficiencies of the system are often easier to spot by actually watching the job being performed. A further useful technique is to search through written records to verify information obtained from other sources, and to check information on data accuracy, data volumes etc. and to look for anomalous events.
While using these methods, it can be extremely useful to collect copies of all documents which flow around, and to trace their movements and use from the originator to the point where the document is destroyed. It is normal for elements of the information gathered to be incorrect. Therefore, to obtain a clear and accurate picture of the existing system is a meticulous process of checking, re-checking and cross checking.
RECORDING GATHERED INFORMATION
The information gathered must be recorded in an unambiguous and concise manner as it will be used to critically analyse the system and explain the relevant internal mechanisms to others. The choice of techniques utilised is dependant upon the
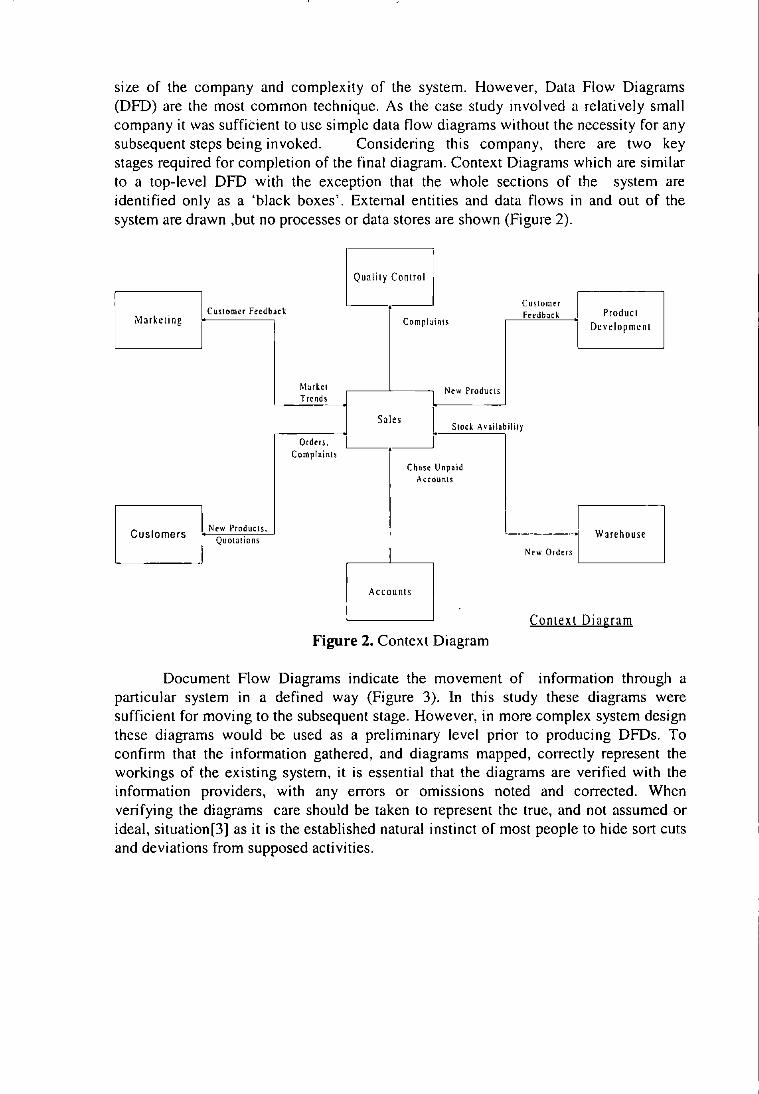
size of the company and complexity of the system. However, Data Flow Diagrams (DFD) are the most common technique. As the case study involved a relatively small company it was sufficient to use simple data flow diagrams without the necessity for any subsequent steps being invoked. Considering this company, there are two key stages required for completion of the final diagram. Context Diagrams which are similar to a top-level DFD with the exception that the whole sections of the system are identified only as a 'black boxes'. Extemal entities and data flows in and out of the system are drawn ,but no processes or data stores are shown (Figure 2).
I Q"'"'' c"""' Customer
Customer Feedback • Producl Markering Feedback
Compl:.!ints
I Dcvelopmcnl
Mart.ct New Products Trends
Sales S10ck Availilbilil)'
Orders. Complaints •
Chase Unp:~id Accounts
Cuslomers New Products, Warehouse
Quotations New Orders
Accounts
Context Diagram
Figure 2. Context Diagram
Document Flow Diagrams indicate the movement of information through a particular system in a defined way (Figure 3). In this study these diagrams were sufficient for moving to the subsequent stage. However, in more complex system design these diagrams would be used as a preliminary level prior to producing DFDs. To confirm that the information gathered, and diagrams mapped, correctly represent the workings of the existing system, it is essential that the diagrams are verified with the information providers, with any errors or omissions noted and corrected. When verifying the diagrams care should be taken to represent the true, and not assumed or ideal, situation[3] as it is the established natural instinct of most people to hide sort cuts and deviations from supposed activities.
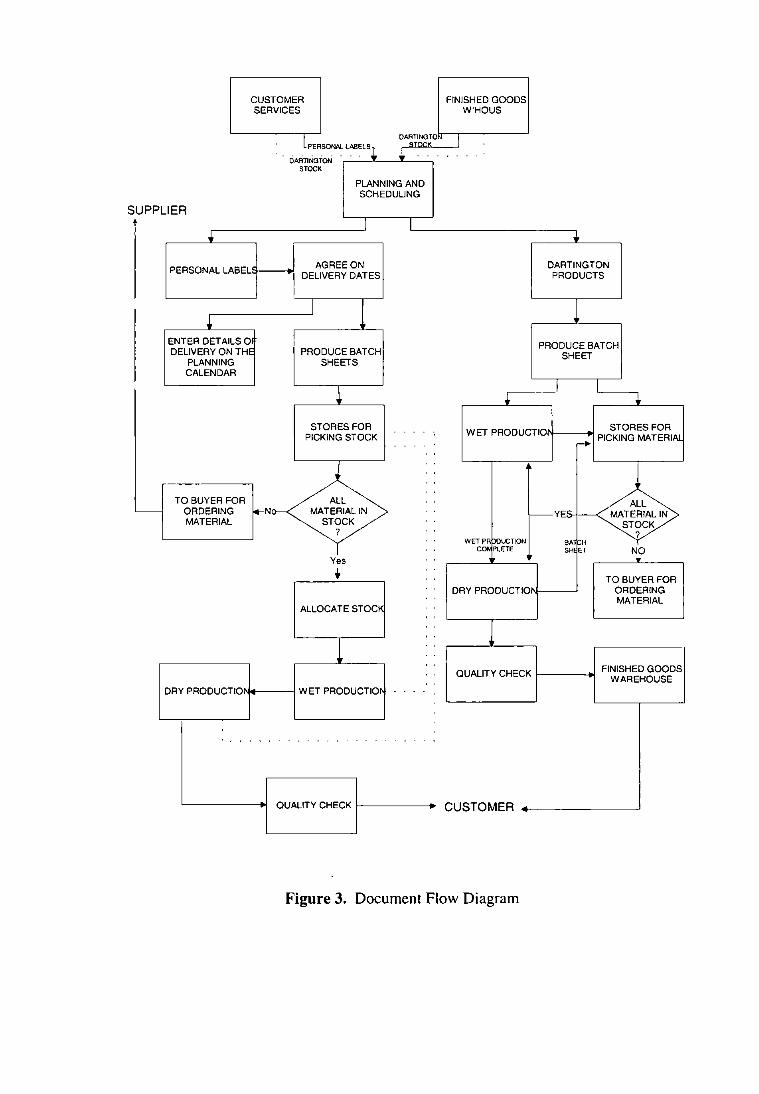
CUSTOMER FINISHED GOODS SERVICES W'HOUS
__ _ lP_ER_S~ l~~lSl D~~~JO I .r ...
DARTING TON STOCK
PLANNING AND SCHEDULING
SUPP LIER T I
J. i.
PERSONAL LABEL AGREE ON DARTING TON DELIVERY DATES PRODUCTS
1 1 ~ ENTER DETAILS~ PRODUCE BATCH DELIVERY ON TH PRODUCE BATCH SHEET
PLANNING SHEETS CALENDAR
I I ~ • •
STORES FOR WET PRODUCTIO STORES FOR
PICKING STOCK r- PICKING MATERIAL
TO BUYER FOR ALL ALL ORDERING ~N MATERIAL IN t--YES. MATERIAL IN MATERIAL STOCK STOCK
7 ~tx:TION
? WE66~ BA foH
PLETE SH ET NO Yes • t TO BUYER FOR
DRY PRODUCTIO ORDERING MATERIAL
ALLOCATE STOC~
QUALITY CHECK FINISHED GOODS WAREHOUSE
DRY PRODUCTIO WET PRODUCTIO
. . . . .. . .
QUALITY CHECK CUSTOMER
Figure 3. Document Flow Diagram
EXISTING SYSTEM: CRITICAL ANALYSIS
At this point, the information has been collected on the ex1stmg system and recorded using text and diagrams. It is now important to critically analyse the underlying logic of the system in order that the problem areas may be highlighted. A list of problems and their causes should be produced and verified by the managers from the relevant departments. Confirmed problems may now be investigated with due regard to the p1iority needs of the business.
NEW SYSTEM: DESIGN
After identifying the problems with the existing information systems in the various departments, it is important to make sure that they are functioning correctly on an individual basis before an integrated MIS is designed. When designing the MIS the primary objective is always to design a system that is capable of delivering the functions required by the client to suppo11 the business objectives of their organisation[4]. The system must, therefore, conform to the customer's requirements, each function being delivered in a manner which meets expectations in terms of service performance.
Whilst there are alternative ways in which these requirements may be met by a physical design solution, there are a number of other objectives that require consideration if a suitable design is to be produced. Flexibility of the design should enable future requirements of the business to be incorporated without undue difficulty. Reliability of the design must be secure against human errors, deliberate misuse and/or machine failure, to ensure that data will be stored without corruption.
The final design is required to be easily maintainable, since this significantly reduces the maintenance costs which usually represents a high proportion of the total lifetime cost of the system[4]. The design must work within the financial constraints of the company and justify the money invested. In addition, security of the design is essential to protect the confidentiality of the data, particularly when commercially sensitive. It may therefore be important to build in methods to restrict access to authorised users only.
CONCLUSIONS
This paper has mainly concentrated on the development of manual information systems, as it is vitally important that a logical flow of information through various departments needs to be identified before IT resources can be employed[2]. This approach is significantly different from the traditional method of designing MIS, whereby the existing manual systems are simply transferred to a computer system.
The approach taken in this paper ensures that each department is running efficiently, and aims to eliminate bad practices within a company. No matter how sophisticated a computer system may be, if the people using the system do not conform their working styles and habits to accommodate the computer based system, then for the successful implementation of that system will always be in doubt. Therefore, any system analysis and design must take into account the organisation culture. New systems must
be developed collectively with the people directly involved in running the system. Once a system has been designed in this manner, so that people can appreciate and understand the design, then the subsequent computerisation will be simplified.
ACKNOWLEDGEMENTS
The authors wish to thank the Teaching Company Directorate (EPSRC/DTI), University of Plymouth and Dmtington Foods (UK) Ltd for their support to undertake project Grant Reference Number GR/162487.
REFERENCES
l. Laudon, K.C. and Laudon, J.P. "Management Information System: A Contemporary Perspective", Macmi llan, 1988.
2. Shields M., Yeates D. and Helmy D. "System Analysis And Design", Pitman Publishing, 1994.
3. Riggs J. L. "Planning Analysis And Control", John Wiley and Sons, 1987. 4. East S. "Systems Integration: A Management Guide", McGraw-Hill, 1994.

Development of a factory automation model for SME's MR Z. Qurashi, Professor R. Bums and OR M N Polkinghome
!.Introduction
The technology of factory automation involves the application of mechanical, electrical/electronic and computer based systems to enable the increased efficiency and economy of process operation. The 1990's is established as a pe1iod of intensive competition on both a national and international basis. For companies in Western Europe facing the relative labour cost disadvantage in comparison to the developing nations, there is increasing evidence that the only route to survival is to exploit the competitive advantages possible in the areas of quality, productivity and flexibility that are valuable by factory automation. There are five major categories of automation , these can be defined as engineering design, manufacturing Planning, manufacturing control, factory automation and intelligent systems/ computers. Automation may also be realised by the interaction of these main categories.
Many small and medium size companies are concerned about the automation of their manufacturing operations, but do not know where to begin. This paper aims to assess the automation needs of SME's in the Devon and Cornwall counties, which have larger proportion of SME's than elsewhere in the UK. And suffer from relative disadvantages of a periphery area i.e. transport, sh01tages of skilled labour etc. The paper identifies the current utilisation of FA by the firms in the Devon and Cornwall assess the factors hindering Factory Automation (FA). Based on the analysis of the above factors a model for automation in the SME's is presented.
2. The Economic Scenario Facing Devon and Cornwall Companies
Devon and Cornwall provide an attractive environment and a high quality of life for the local workforce. The area has over 36,000 businesses of which 89% have fewer than 25 people but between them employ 112 million people. A further 146,000 individuals are self employed.
The manufacturing sector in Devon and Cornwall is relatively small compared with many other UK regions. In 1991 it accounted for 16% of total employment in Devon and Cornwall compared with 21% in the UK as a whole.
However, in terms of overall employment, manufacturing in Devon and Cornwall has significantly outperformed the rest of the country in recent years. The dramatic reduction in manufacturing employment recorded elsewhere in the country has been largely avoided in Devon and Cornwall, although in common with other sectors, there has been a significant drop in manufacturing employment levels since 1989. The 1993 Devon and Cornwall TEC Employer Survey shows expectations of marginal job increase in
manufacturing and engineering. Managerial, skilled and cletical occupations will be the most buoyant, whilst professional occupations are set to decline.
Although there are clear signs of optimism in the sector, there is no room for complacency. In fact, the biggest perceived constraint on business growth in the next year is a static or declining market (particularly in manufacturing, though less is in engineering) and the availability of finance. The manufacturing firms which are faring best are those with markets extending across the UK or internationally.
2.1 Emerging Trends
• Large companies and those operating in niche or Hi-Tech areas have the best survival rates and growth prospects.
• Exports will be crucial for the future of the manufacturing and engineering sector.
• A cautious optimism has emerged amongst employers, resulting in recent recruitment and investment in plant and machinery.
2.2 Key opportunities
• Sales to the rest of the UK and exports to America in the short term and Europe in the medium term should be encouraged.
• The manufacturing base of Devon and Cornwall needs to be augmented to match the UK base.
• There is a need to encourage diversification of activity across the sector.
Given the limited resources and technical know how many of the above opportunities may never be realised by SME's.
3. Areas of Automation
Automation can be implemented into several areas of manufacturing. We have grouped them into five major categories: Engineering Design, Manufacturing Planning, Manufacturing Control, Factory Floor Automation and Intelligent Systems and Computers. Automation can also be realised in the interaction of these categories. In this section we discuss the five areas of automation mentioned earlier.
3.1 Engineering Design
Engineering design is the transformation of ideas into specifications. Computers can aid in the designing process by maintaining an engineering database, analysing and optimising engineering designs and preparing visual drawings for presentation.
3.2 Manufacturing Planning
Manufacturing planning is the translation of engineering design into the optimal processes that will be used in production. This includes process planning, quality control and facilities planning.
3.2.1 Process Planning
Process planning addresses the question of how a part is to be manufactured in the most practical , economical way. Process planning is a decision-making process. The process planner has to specify which machine to use, which operations to perform on each machine and their sequence, and which tooling and cutting conditions to use. It is a series of decisions, where each of the decisions impose constraints on the following ones.
Group Technology (GT) is a term to describe the grouping of similar parts into families for the manufacturing efficiency. These similarities can be manipulated in a systematic way to improve operations. Common similarities that can be used to classify parts include shape, dimensions, specific machining required, tolerances, etc. GT is closely involved with facilities layout since the machines are grouped to reduce distances. GT can also improve the design and process planning areas of manufacturing by requiring a database to be built.
Computer-Aided Process Planning (CAPP) requires the generation of an operation sequence (or routing sheet) to manufacture, based on the input data. The routing is developed by identifying the specific characteristics of the part in question and relating these characteristics to their corresponding appropriate manufacturing processes. Appropriate parts classification and coding, usually based on GT, precedes the use of automated process planing system. CAPP achieves reduction in time and cost of manufacturing a part beyond that achieved by mere standardisation of parts. A variety of similar parts can be processed through the same sequence of machines, but the operations required at each machine may vary between parts.
3.2.2 Quality control
Quality control is concerned with the problems of detecting poor quality in manufactured product and taking corrective action to eliminate it. Traditional manual methods of inspections are both time consuming and expensive.
New approaches to the quality control function are emerging that are drastically alerting the way inspection and testing are performed. These new approaches are based on advanced sensor technologies often combined with computer-based systems to interpret the sensor signals. In addition, new software tools are being developed to automate the operation of complex sensor systems and to statistically analyse the sensor measurements.

3.2.3 Facility Planning
Facilities planning can include facility location and layout. Plant layout can be divided into layout generation and layout evaluation. In the facility layout we wish to minimise the materials handling costs, maximise flexibility and maximise production rate.
3.3 Manufacturing Comrol
Manufacturing Control begins when demand forecasts are translated into a Master Production Schedule (MPS) that lists products, delivery dates and quantities. Manufacturing control includes activities that assure optimal use of machines, manpower and materials. Manufacturing control includes Material Requirement Planning (MRP), production scheduling, shop floor control and capacity planning.
3.4 Factory Floor Automation
The fourth main area of manufacturing automation is factory floor automation. This includes materials handling, inspection and assembly. Many of the other areas are concerned with automating infonnation processing, whereas this area includes physical equipment.
3.5 Intelligent Systems and Computers
This area includes: numerical control, computer numerical control, direct numerical control, programmable controllers, robotics, Computer Aided Design and Manufacture (CAD/ CAM), microprocessors, flexible manufacturing systems, man-machine interfacing, artificial intelligence and expert systems. The ultimate goal is to have a computer integrated manufacturing system (CIMS). CIM is a system that recognises and supplies computer services to each phase of the manufacturing cycle independently while at the same time maintaining a database that serves as a single source of data for all company activities and applications.
A flexible manufacturing System (FMS) is a conglomeration of automation technologies. It incorporates automated materials handling, direct numerical control and group technology principles to produce a product. The resulting system can include machining centres, numerically controlled machines and related processes. Parts can be transported via automated guided vehicles or automated retrieval and storage systems.
Artificial Intelligence (AI) is the next generation of computerised manufacturing systems. The purpose of artificial intelligence is to allow machines to possess human-like qualities. AI systems are currently emphasising expert systems, robotics natural language understanding and machine vision I voice recognition. Machines possessing human characteristics can then be used to solve problems by making their own decisions. These

machines are smart and can learn from their past experiences and also analyse current situations.
AI has many potential applications in the manufacturing area. For example AI can oversee the development of high level plans, schedules, budgets and directives to meet demands. These systems can be adapted to work with modem factory equipment. It is just a matter of time before AI ill emerge into all levels of the factory to become an integral part of every organisation.
4. A Methodology for selection of automation system
It must be kept in mind that the aim of automation is not to replace workers with machines but to employ current technology to meet multiple objectives of manufacturing companies to reduce cycle times, reduced costs and increased quality. The following model can be used to implement automation in small businesses (fig I)
Figure 1. Model For Automation Small Businesses
Project
l Specitication
L~.-
Analys;J] existing systems
L.!: •. '
Id en lily P<Oblems. I] and bolllenecks ·
~1- c J... --s.!. .
Separate quick -, fixes lrom Long·
I term
I .,
Implement quick· -, Resae<Ch inlo I] llx solutions
I tong·term solutions '
l' !,_,._~'- I • .
Devise a solution implementation
plan
~I
• Cost juslilicalion
tor capital investment
L~.J· . • I. lmplemed
L._;+'" ' Review n

It is important to use a system approach to identify problems and solution in a company. Without this approach, wrong decisions can be made. Optimising or improving a specific subsystem will not necessarily improve the entire system. Establishing better coordination among subsystems is more important.
Information Systems (IS) consist of a set of fundamental procedures that collect, process, store and disseminate information to support decision making and control. Analysis of IS in a company will identify how information flow and activities are performed within a company and the affect of flaws in the system on the final output of the company. The information collected should be mapped diagramatically to assist in easy understanding of the system (fig2). After the analysis of the IS it may be realised that, in some cases, poor quality or late deliveries may not necessarily be due to the lack of advanced equipment but poor practices and bad communication within the company.
Having done the analysis of the IS the next stage is to critically analyse the system and identify the bottlenecks. A list of problems and their causes should be produced and verified by the managers from the relevant departments. Confirmed problems and bottlenecks can now be investigated and measures can be taken to illiminate them.
To choose a Advanced Manufacturing Technology (AMT) to illiminate the problem or bottleneck identified during analysis, research on various technology available is a necessary step. A list of major books, guides and magazine that provide information can nOJmally be obtained easily from many sources including, DTI and local universities. Some organisations will even perform a search based on preferences for a particular technology.
The manuals and guides listed are extremely helpful for finding out what manufacturing technologies are available in the market, their prices, specifications, compatibility, reliability (e.g. how many have been installed successfully). The trade magazines usually contain practical articles in the development or application of different approaches for industrial, production, and manufacturing engineering problems. They also contain a lot of advertisements and reference cards for further enquiries.
An important step before selecting among automation alternatives is to record information in a logical form. A database for different alternatives should be made and the following questions should be asked when selecting the appropriate:
* * *
* * *
How compatible is the system for present use? How compatible is the system for the future use? How reliable is the system? How expensive are the equipment? How much Warranty and support comes with the system? How user-friendly is the system?

* Does the vendor provide a training program?
After careful assessment of the answers to the above questions the most suitable system should be selected and simulation should be run.
Simulation is used to monitor the behaviour if a given system under different constraints. This may or may not involve the use of actual machines and relevant systems. A computer based graphical simulation package can give a good visual understanding of how a system would behave in the real life.
Simulation is a very cheap method to ensure that a system will produce the desired results before huge sums of money is invested in the purchase of equipment, software etc.
In identification of the most suitable system the costs justification must be done before the equipment etc. are bought . There are various methods that can be used to assess the cost justification some of them, most commonly used in manufacturing, include:
* * * *
Payback method Net Present Value method Uniform Annual Value method Rate of return method
The final stage in automation is implementation of the system and training of the people who will be using the system. This should be done gradually and on incremental basis i.e. process at a time, while the older system is still running.
5. Conclusions
In this paper we have presented some of the areas, terminology and methods of automation with particular reference to the issues of Devon and Cornwall. We cannot stress enough the importance of overall system approach to the problems and solutions. Certainly any company that follows this thorough process will benefit in choosing methods for automation. They can also benefit by automating the non-manufacturing sectors, e.g. the administrative tasks. This should help to reduce the total cycle time significantly. As a first step we also recommend developing islands of automation, particularly in the areas of shop floor control and process planning. It should also be noted that having gone through the method, outlined in the paper, the conclusion may well be that no automation is required in your particular company except for reorganisation of information system and better communication.
References
Groover MP, Automation, Production Systems and Computer Integrated Manufacturing. Prentice-Hall, Inc (1987)
Ross Alastair, Dynamic Factory Automation- Creating flexible systems for competitive manufacturing. McGraw-Hill Book Company (1992).
Vanderspek Peter G, Planning for Factory Automation- A management Guide To WorldClass Manufacturing. McGraw-Hill, Inc (1993)
Szymankiewicz J, Solving Business Problems By Simulation. McGraw-Hill Book Company, England. ( 1988)
Graham Glenn A, Encyclopedia of Industrial Automation. Longman Scientific & Technical ( 1988)
Qurashi Z A, Polkinghome M N, Biss T, Design of a manufacturing based Management ln.fonnation System, Advances In Manufacturing Technology, Taylor and Francis (1995)
Devon & Cornwall TEC, Opportunities for Growth- an economic assessment of Devon and Comwall 1995.
Mr Z.Qurasbi, Or M.N.Polkinghome and Mr T.Biss
APPLICATION CONSIDERATIONS FOR A MANUFACTURING BASED MANAGEMENT INFORMATION SYSTEM
Mr Z.Qurashi1.J, Or M.N.Polkinghome3 and Mf T.Biss2
1Dartington Foods (UK) Ltd, lvybridge. 2Piymouth Business School, University of Plymouth, Plymouth.
lplymouth Teaching Company Centre, University of Plymouth, Plymouth.
ABSTRACT
It is the aim of this paper to descn"be the design process for a manufacturing based management information system Prior to the design and specification of required computational resources, it is shown that significant advantages may be achieved in terms of the effectiveness of the final solution and. in its acceptance by the relevant employees, by initially concentrating on the development of the manual information systems present.
I. INTRODUCTION
When considering the current dynamic manufacturing environment it has clearly become imperative that companies manufacture to ever increasingly tighter schedules and higher quality specifications in order to maintain profit margins given the E::>risting economic climate. Key goals in any manufacturing company are to reduce in lead time and work in progress (WJP) with wastage minimised, while at the same time to remain competitive in their market, which may extend worldwide.
The success or failure of an organisation was traditionally attn"buted to many factors, e.g. employment ofcapital, plant equipment, quality of skilled h.bour, etc. In recent years handling of information within a company has become just as relevant and vital Therefore, for a company to achieve its objectives it is imperative that the information must be controlled in an orderly and organised manner. Due to the recent computational dev·~lopment the nature and handling of information have become much more complex. If not wel: organised and understood, there is a significant poSSJ"bility that detrimental effects on the company's position may result.
The application of Information Systems (IS) has been established in industry for several years. These systems consist of a set of fundamental procedures that collate, process, store and disseminate relevant information Laudon and Laudon [1], thus supponing the decision making and control within the organisation. There has also been further extension by the principles of Management Information Systems (MIS) which have been developed to further this process. The MIS methodology is designed to serve the monitoring, controllina, decision making and administrative activities of an organisation. Implementation of these MIS principles can be computer based (CBMIS). The system may therefore be designed to focus on daily, weekly and monthly summaries of various accounting and manufacturing transactions. Tbis Dartington Foods (UK) Ltd case study is based on a low volume/high margin food manufacturing company where the primary objective
887

Mr Z.Qurasbi, Dr M.N.Pol.kinghome and Mr T.Biss
was to increase the output without necessitating an increase in production resources. This paper aims to explain how this process be achieved by first developing manual information systems for individual departments, and then subsequently using the basis of these systems, to develop an integrated CBMIS.
2. SPECIFICATION OF THE PROJECf
The first, and most significant, stage of the system desi.gn is the project specification which should include precise definition of the project' s boundaries, expectation, duration and also the limits of the financial commitment that the company is willing to undertake. It is of great importance to realise that whatever is agreed at this stage will form the basic stmcturc of new system development and subsequently will be employed as a 'bench mark' by which to measure the success or failure of the system design. It is therefore a pre-requisite of any successful system design that this initial stage is undertaken in a realistic manner.
3. EXJ.STING SYSTEM: ANALYSIS
It is preferable when commencing the design process to start with no preconceived ideas and limitations. However, in reality this is rarely the case as there are always obstacles md constraints within an organisation which need to be considered before a ~stem can be designed. To develop a!\
MIS system it is necessary to understa11d the existing sys;;em. fig. l shows a model for system development which was used for the case study.
lmplemcnwion
Figure 1. System Development Model
888
Mr Z.Qurashi, Dr M.N.Polkingbome and Mr T.Biss
4. EXISTING SYSTEM: UNDERSTANDING THE ORGANISATION
The initial consideration when attempting to understand a company is to identifY the actual structure, e.g. operation may be very centralised with nearly all decisions being focused at head office. lf this is the case then clearly the IS must reflect this. Conversely, if the organisation allows considerable autonomy to managers in subsidiary parts of the business then the system must be designed to provide these managers with their necessary requirements to run the business effectively. The system must therefore be tailored to closely reflect the structure of decision making Shields et a/ [2). In addition, the existing ISs in the various departments must be understood and evaluated. This can be achieved by utilising a sequence of methods.
The most significant tool for finding out how the existing system works is the personnel interview. It is best to interview all of those concerned with the system, even though this appears to provide more sources ofinformation than is absolutely necessary. Some of these sources will make mistakes, so the extra sources help to identifY where this has occurred.
The use of a systematic approach to gathering the information should help to minimise the risk ofleaving gaps in the information gathered. The use of a form by the analyst is often helpful at this point, assisting the interviewer to ensure that nothing is missed through open ended questions.
Inviting the interviewee's observations and opinions can prove helpful and may help to form relationships ready for the stage when change must be implemented. The questions should be worded carefully. They should not offend and must enable the analyst to identifY all information used, what it is used for, why the process is carried out, where the information is derived from and where its subsequent destination is, Shields et a/ [2).
Observation is another key element in building up a picture of how the eXIStmg system operates. Useful insight into the problems and inefficiencies of the system are often easier to spot by actually watching the job being performed. A further useful technique is to search through written records to verifY information obtained from other sources, and to check information on data accuracy, data volumes etc. and to look for anomalous events.
While using these methods of studying the flow of information, it can be extremely useful to collect copies of all documents which flow around, and to trace their movements and use from the originator to the point where the document is destroyed. It is normal for elements of the information gathered to be incorrect. Therefore, to obtain a clear and accurate picture of the existing system is a meticulous process of checking, re-checking and cross checking.
S. RECORDING GATHERED INFORMATION
The information gathered must be recorded in an unambiguous and concise manner as this information will be used to critically analyse the system and explain the relevant internal mechanisms to others. The choice of techniques utilised is dependant upon the size of the company and complexity of the system. However, Data Flow Diagrams (DFD) are the most common technique. As the case study involved a relatively small company it was sufficient to use simple data flow diagrams without the necessity for any subsequent steps being invoked. Considering this company,
889
; I

Mr Z.Qurashi, Dr M.N.Pol.kinghome and Mr T.Biss
there are two key stages required for completion of the final diagram. Context Diagrams which are similar to a top-level DFD with the exception that the whole system is identified only as a ' black box'. External entities and data flows in and out of the system are drawn ,but no processes or data stores are shown (Fig. 2).
QIM/Ity Control roduct Ot~nt
Figure 2. Context Diagram
Document Flow Diagrams indicate the movement of information through a particular system in a defined way (Fig. 3). These diagrams were sufficient for moving to the subsequent stage. However, in more complex system design these diagrams would be used as a preliminary level prior to producing DFDs. To confirm that the information gathered, and diagrams mapped, correctly represent the workings of the existing system, it is essential that the diagrams are verified with the information providers, with any errors or omissions noted and corrected. When verifying the diagrams care should be taken to represent the true, and not assumed or ideal, situation Riggs [3] as it is the established natural instinct of most people to hide sort cuts and deviations from supposed activities.
890
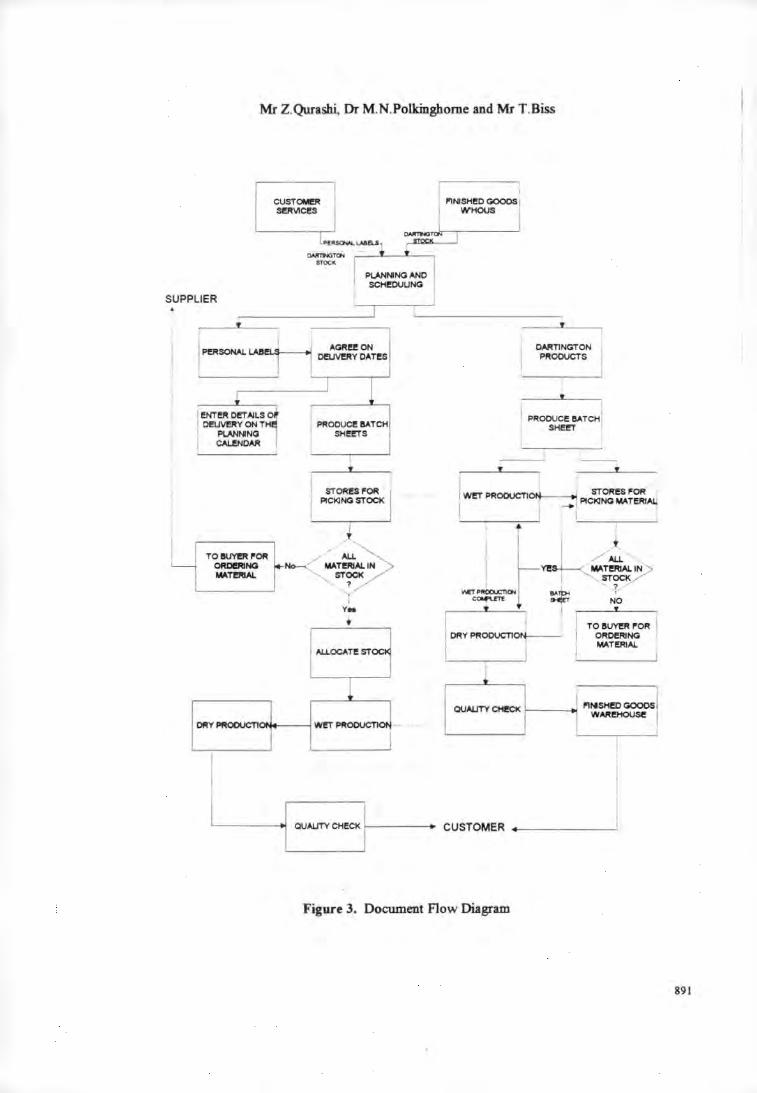
Mr Z.Qurashi, Or M.N.Polkinghome and Mr T.Biss
CUSTOMeR Sl!ft\11CI!!S
SUPPLIER
I PI!!RSONAL L.A81"1
~ II!!NTI!!I't OI!!TAILS 0
OI!!UveRY ON TH!
I PLANNING CALeNDAR
TO~I"Oft
~NO W.Tl!JaAL.
ORYPROOUCTI"'
CWITNGTON STOCK
AGI'!I!!I!! ON oeLJV!I'Y OATI!!S
I 1 PROOUCI!! ISATCH
SHI!!I!!TS
~
STORI!!SI"OR PICI<JNO STOCK
' , ..._
AL.LOCATI!! STOCI<
1 WI!!T PftOOUCTIOI'
j"·~~=j CMTN)T
OARTINGTON PRODUCTS
I PROOUCI!! 15ATCHj
1
, SHI!!I!!T
= I NO
QUAUTY CHf!CK ;-----~ l'lNISHI!!O GOODS WAAI!!HOUse
'-----~1 oom '"'"i I-----+~ CUSTOMER _ ______ __.J
Figure 3. Document Flow Diagram
891

Mr Z.Qurasbi, Or M.N.Polkinghome and Mr T.Biss
6. EXISTING SYSTEM: CRITICAL ANALYSIS
At this point, the information has been collected about the existing system and recorded using text and diagrams. It is now important to critically analyse the underlying logic of the system in order that the problem areas may be highlighted. A list of problems and their causes should be produced and verified by the managers from the relevant departments. Confirmed problems may now be investigated with due regard to the priority needs of the business.
7. NEW SYSTEM: DESIGN
After identifying the problems with the existing Information systems in the various departments, it is important to make sure that they are functioning correctly on an individual basis before an integrated MIS is designed. When designing the MIS the primary objective is always to design a system that is capable of delivering the functions required by the client to support the business objectives of their organisation East [4). The system must, therefore, conform to the customer's requirements, each function being delivered in a manner which meets expectations in terms of service performance.
Whilst there are alternative manners in which these requirements may be met by a physical design solution, there are a number of other objectives that require consideration if a suitable design is to be produced. Flexibility of the design should enable future requirements of the business to be incorporated without undue difficulty. Reliability of the design must be secure against human errors, deh'berate misuse and/or machine failure, to ensure that data will be stored without corruption.
The final design is required to be easily maintainable, since this significantly reduces the maintenance costs which usually represents a high proportion of the total lifetime cost of the system. The design must work within the financial constraints of the company and justify the money invested. In addition, si:curity of the design is essential to protect the confidentiality of the data, particularly when commercially sensitive. It may therefore be important to build in methods to
· restrict access to authorised users only.
8. CONCLUSIONS
This paper has mainly concentrated on the development of manual information systems, as it is vitally important that a logical flow of information through various departments needs to be identified before IT resources can be employed Shields et a/ [2). This approach is significantly different from the traditional method of designing MIS, whereby the existing manual systems are simply transferred to a computer system.
The approach taken in this paper ensures that each department is running efficiently, and aims to eliminate bad practices within a company. No matter how sophisticated a computer system may be, if the people using the system do not conform their working styles and habits to accommodate the computer based system, then for the successful implementation of that system will always be in
892
Mr Z.Qurashi, Or M.N.Polkingbome and Mr T.Biss
doubt. Therefore, any system analysis and design must take into account the organisation cuhure. New systems must be developed collectively with the people directly involved in running the system. Once a system has been designed in this manner, so that people can appreciate and understand the design, then the subsequent computerisation will be simplified.
Acknowledgements: The authors wish to thank the Teaching Company Directorate (EPSRC/DTI), University of Plymouth and Darrington Foods (UK) Ltd for their support to undertake project Grant Reference Number GR/162487.
9. REFERENCES
l. East S. "Systems Integration: A Management Guide", McGraw-Hill, 1994. 2. Laudon, K.C. and Laudon, J.P. "Management Information System: A Contemporary
Perspective", Macmillan, 1988. 3. Shields M., Yeates D. and Helmy D. "System Analysis And Design", PitmanPublishing, 1994. 4. Riggs 1. L. "Planning Analysis And Control", John Wiley and Sons, 1987.
893
"I;:;
DIESIGN OF A MANUFACfURING BASED MANAGEMENT INFORMATION SYSTEM
Mr. Z.Qurashiu, Mr. T.Biss' and Dr. M.N.Polkinghome'
'Dartington Foods (UK) Ltd, lvybridge, U.K. 'Plymouth Teaching Company Centre, University of Plymouth, Plymouth, U.K.
'Plymouth Business School, University of Plymouth, Plymouth, U.K.
"This paper describes the design process for an information systems applied to a manufacturing company. By concmtrating on the development of the manual information systems present prior to the design and specification of required computational resources, it is demonstrated that significant advantages may be achieved both in terms of the effectiveness of the final solution and in its acceptance by the relevant employees.
Introduction
In today's dynamic manufucturing environment it has become essential that companies manufucture to tighter schedules and high quality specifications in order to make profit, or indeed survive the current harsh economic climate. Key goals in any manufucturing company are to reduce in lead time and work in progress (WIP) with wastage minimised, while at the same time to remain competitive in their marka, which may extend world-wide.
Traditionally, the success or failure of an organisation was mainly attributed to factors such as the employment of capital, plant equipment, quality of skilled labour, etc. However, in recent years handling of information within a company has become just as relevant and vital. Therefore, for a company to achieve its objectives it must control its information flow in an orderly and organised manner. Due to the recmt computational development the nature and handling of information have become much more complex. If it's not well organised, and understood then it can cause detrimental effects on the company.
Infomtation Systems (IS) have been utilised by companies for many years. Such systems consist of a set offi.mdamental procedures that collect, process, store and disseminate information to support decision making and control. "This has been extended by the principles of Management Information Systems (MIS) which have been developed to further this process. The MIS methodology is designed to serve the monitoring, controlling, decision making and administrative activities of an organisation. Implementation ofthese MIS principles can be computer based (CBMIS). The system may therefore be designed to focus on daily, weekly and monthly summaries of various accounting and manufacturing
·:-:.''
~I
·' - .!i-·"li

442 Mr Z Quradli. Mr T BiJ.'I and Or M N Polkinghorflf.'
transactions. The case study is af a low volwnelhigh margin manufacturing company where the aim was to increase the output without necessitating an increase in production resources. This paper aims to explain how this can be achieved by first developing individual department's manual information systems, and subsequmtly the basis of these systems, to develop an integrated CBMIS.
Project Specification
The initial and most important stage afthe system design is the project specification which should include precise definition of the project's boundaries, expectation, duration and also the limits afthe financial commitment that the company is willing to undertake . lt is important to realise that whatever is agreed at this stage will form the basis afnew system development and subsequmtly is employed as a yard stick to
measure the success or fuilure of the system design. It is therefore a pre-requisite of a successful system design that this initial stage is undertaken in a realistic manner.
Analysis of Existing System
Ideally when designing it is preferable to start with no preconceived ideas and limitations. However, in reality this is rarely the case as there are always obstacles and constraints within an organisation which need to be considered before a system can be designed. To develop an MIS system it is necess~ry to understand the existing system. Figure I shows a model fur system development which was used fur the case study.
Projoct Analysis Of ~ New DesiJPl ~ Implementation f----< 1----< Review Spocification Existins System I Spocificatioo
Figure I. System Development Model
Understanding tbe Organisation of tbe Existing System
I I
The first consideration when attempting to understand a company is to identify its actual structure, e.g. it may operate in a very centralised fashion with nearly aU decisions being made at head office. If this is the case then clearly the IS must reflect this. Conversely, if the organisation allows considerable autonomy to managers in subsidiary parts afthe business then the system must be designed to provide these managers with their necessary requirements to run the business effectively. The system must therefore be tailored to closely reflect the structure af decision making. In addition, the existing I Ss in the various departments must be understood and evaluated. This can be achieved by utilising a sequence of methods. The main tool fur finding out how the existing system works is the personnel interview. It is best to interview all of those concerned with the system, even though this appears to provide more sources of information than is absolutely necessary. Some of these sources will make mistakes, so the extra sources help to identify where this has occurred
A systematic approach to gathering the information should help to minimise the risk of leaving gaps in the information gathered. The use of a form by the analyst is often helpful at this point, assisting the interviewer to ensure that nothing is missed through open ended questions. Inviting the interviewee's observations and opinions can prove helpful and may help to form relationships ready fur the stage when change must be implemented. The
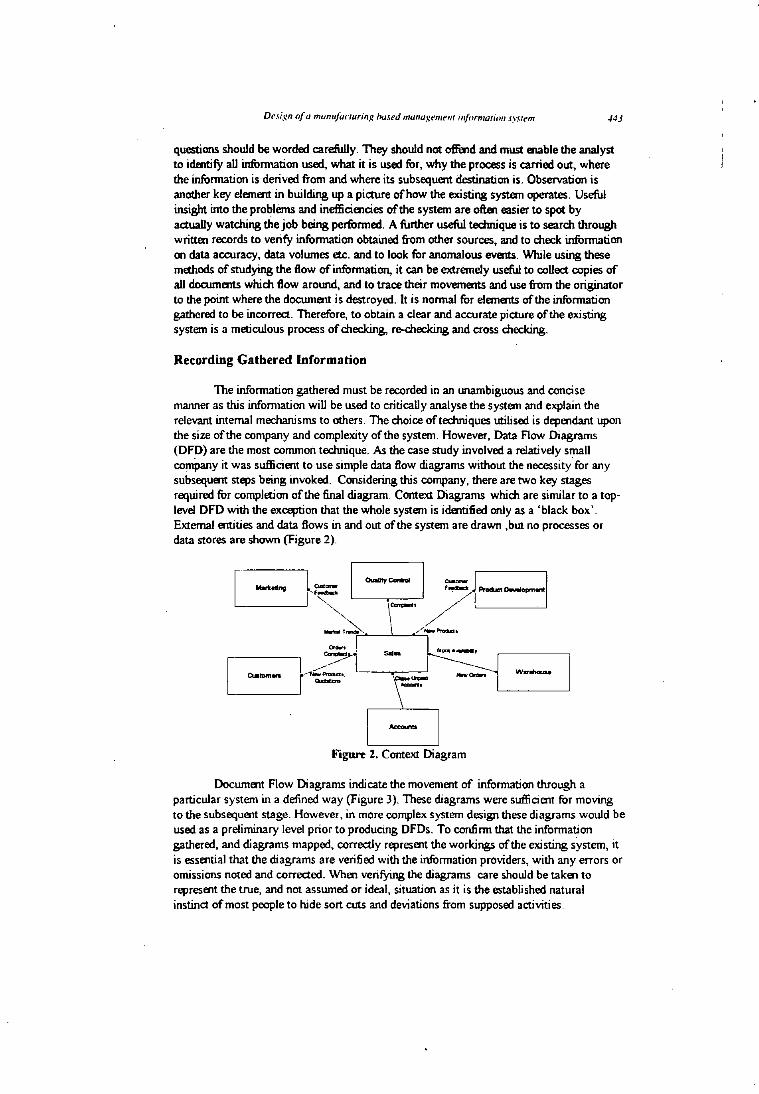
Design of lJ nu..mufanuring hused mmuJ.~f!mel/1 information Jystem ~43
questions should be worded carefully. They should not offi:nd and must Ell3ble the analyst to identity all information used, what it is used for, why the process is carried out, where the information is derived from and where its subsequent destination is. Observation is another key element in building up a picture of how the existing system operates. Useful insight into the problems and inefficiencies of the system are often easier to spot by actually watching the job being performed. A further useful technique is to search through written records to verity information obtained from other sources, and to check information on data accuracy, data volumes etc. and to look for anomalous events. While using these methods of studying the flow of information, it can be extremely useful to coUect copies of all docwnents which flow around, and to trace their movements and use from the originator to the point where the docwnent is destroyed. lt is normal for elements of the information gathered to be incorrect. Therefore, to obtain a clear and accurate picture of the existing system is a meticulous process of checking, re-checking and cross checking.
Recording Gathered Information
The information gathered must be recorded in an unambiguous and concise manner as this information wiU be used to criticaUy analyse the system and explain the relevant internal mechanisms to others. The choice of techniques utilised is dependant upon the size of the company and complexity of the system. However, Data Flow Diagrams (DFD) are the most conunon technique. As the case study involved a relatively smaU comj,any it was sufficient to use simple data flow diagrams without the necessity for any subsequent steps being invoked. Considering this company, there are two key stages required for completion of the final diagram. Context Diagrams which are similar to a toplevel DFD with the exception that the whole system is identified only as a 'black box'. External entities and data flows in and out of the system are drawn ,but no processes or data stores are shown (Figure 2).
[-:_:::]~ ?--~1 ~~c..:..--'-~"-"'-::;--·
F'tgnre 2. Context Diagram
Document Flow Diagrams indicate the movement of information through a particular system in a defined way (Figure 3). These diagrams were sufficient for moving to the subsequent stage. However. in more complex system design these diagrams would be used as a preliminary level prior to producing DFDs. To confirm that the information gathered, and diagrams mapped, correctly represent the workings of the existing system, it is essential that the diagrams are verified with the information providers, with any errors or omissions noted and corrected. When veri tying the diagrams care should be taken to represent the true, and not assumed or ideal, situation as it is the established natural instinct of most people to hide sort cuts and deviations from supposed activities.
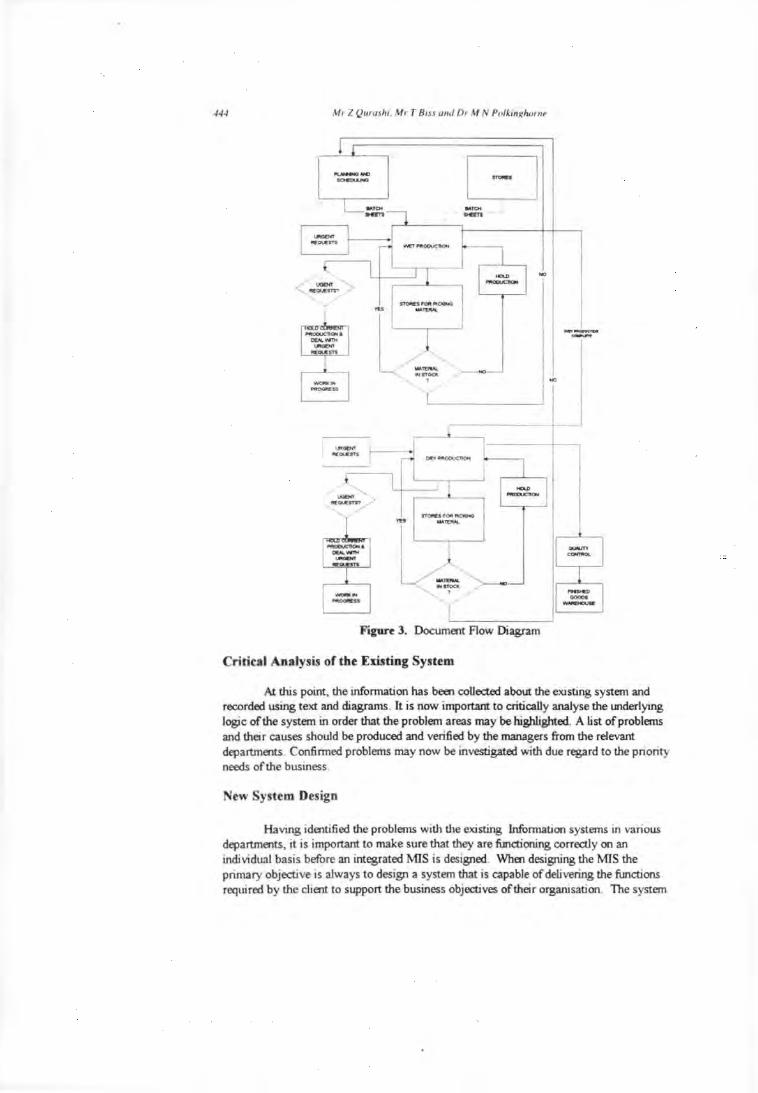
-14-1 M1 L Qurashi. Mr T Biss und 01 M N Po/kinghoml'
/ ... ,.,.... "'""""' ' ,
NO
_ ..,
---I "" r-----u
Figure 3. Document Flow Diagram
Critical Analysis of tbe Existing System
At this point, the information has been collected about the existing system and recorded using text and diagrams. It is now important to critically analyse the underlying logic of the system in order that the problem areas may be highlighted. A list of problems and their causes should be produced and verified by the managers from the relevant departments. Confirmed problems may now be investigated with due regard to the priority needs of the business .
New System Design
Having identified the problems with the existing Information systems in various departments, it is important to make sure that they are functioning correctly on an individual basis before an integrated WS is designed. When designing theWS the primary objective is always to design a system that is capable of delivering the functions required by the client to support the business objectives of their organisation. The system
Dt"sign of a manufauuring hw;t>J munu.s:t'metrt informal ion sy.uem
must, therefore, confonn to the customer's requirements, each function being delivered in a manner whiCh meets expectations in terms of service perfurmance.
Whilst there are alternative manners in which these requirements may be met by a physical design solution, there are a number of other objectives that require consideration if a suitable design is to be produced. Flexibility of the design should enable future requirements of the business to be incorporated without undue difficulty. Reliability ofthe design must be secure against human errors, deliberate misuse and/or machine fililure, to ensure that data wiU be stored without corruption. The design is required to be easily maintainable, since this significantly reduces the maintenance costs which usuaUy represents a high proportion of the total lifetime cost of the system. The design must work within the financial constraints of the company and justify the money invested. Security of the design is essential to protect the confidentiality of the data, particularly when commerciaUy sensitive. lt may be important to build in methods to restrict access to authorised users only.
Conclusions
This paper has mainly concentrated on the development of manual information systems, as it is vitaUy important that a logical flow of information through various departments needs to be identified before IT resources can be employed. This approach is significantly differmt from the traditional method of designing MIS, whereby the existing manual systems are simply transferred to a computer system.
The approach taken in this paper ensures that each departmmt is running efficiently, and aims to eliminate bad practices within a company. No matter how sophistica~ a computer system may be, if the people using the system do not confonn their working styles and habits to accommodate the computer based system, then for the successful implementation of that system wiU always be in doubt. Therefore, any system analysis and design must take into account the organisation culture. New systems must be developed Ct>Jiectively with the people directly involved in running the system. Once a system has been designed in this manner, so that people can appreciate and understand the design, then the subsequent ·computerisation wiU be simplified.
Acknowledgements: The authors wish to thank the Teaching Company Directorate (EPSRCIDTI), University of Plymouth and Dartington Foods (UK) Ltd for their support to undertake project Grant Reference Number GR/162487.
References
East, S. 1994, Systems Integration: A Manngement Guitk (Me Graw-HiU Book Co). Laudon, K.C and Laudrin, J.P. 1988, Management Information System: A Contemporaf)' Perspective (MacmiUan Publishing Co). Shields, M , Yeates, D. and Helmy, D. 1994, System Analysis And Design (Pitman Publishing) Riggs, J. L. 1987, Planning Analysis And Control, (John Wiley and Sons).

•
The economic impact of the Teaching Company Scheme on the local manufacturing base
Z A QURASHI, M N POLKINGHORNE, and J P BENNETT Plymouth Teaching Company Centre, University of Plymouth, UK J FPEARCE Plymouth Business School, University of Plymouth, UK
SYNOPSIS
The Teaching Company Scheme is a government put-funded initiative to facilitate the transfer of technology from Academia to Industry. Each programme is run on a two year basis, employing one or more graduates who are located at a compmy for the duration of the project and act as the catalysts to enable a process of technology transfer to occur. This paper considers five such completed Teaching Company programmes md demousttates the impact that co-operation betweeD academic and industrial establishme:Dts can have on the local manufacturing base.
1. INTRODUCfiON
The cbanging global industrial scene is forcing companies to C\lolve at an unprecedented rate. The requirement to keep abreast of technological dC\Ielopmcnts to improve productivity, quality, range of products md other performance IIIC8SUleS is now paramount. Despite the clear evidence for a. need to acquire technical skills md invcstmcDt in technology, -1111111y companies are reluctant to move in the direction of automation. This reluctance can be attn'buted two main factors: the extremely sizeable investment required by the company, and the total lack of previous experience with such technology. This is particularly true in the case of Small and Medium Enterprises (SMEs), the DTI's classification for which is defined as those companies with fewer than 250 employees.
Any measure that is capable of enhancing the competitive advmtage of this size of firm may therefore be considered as being very timely. HowC\Ier, inappropriate measures, and those that utiliSe resources without providing the anticipated returns at the end, are an unnecessary
43t

waste of effon at a time when such generosity is potentially dangerous to the heahh of the company. To he able to indicate the success _of past assistance offered to SMEs can therefore become a highly useful tool in assessing where to place maxinnim effons in the future. This paper therefore investigates the impact of the Teaching Company Scheme on five manufacturing case study companies based in the South West region of the UK.
2. TEACHING COMPANY SCHEME'S OPERATIONAL CONSIDERATIONS
The Teaching Company Scheme (TCS) has been in existence since 1974 when it was introduced with the foUowing aims and objectives [I)
I. To raise the level of industrial perfo111Wlce by effective use of academic resources.
2. To improve industrial methods by the effective implementation of advanced technology and new ideas.
3. To develop able graduates for careers in industry.
4. To give staff broad and direct involvement with industry to benefit research and to enhance the relevance of teaching.
The TCS is operated through a national body named the Teaching Company Directorate (TCD) who act as the interfilce between the Universities and the funding bodies such as MAFF, DTI, EPSRC etc. Joint funding for each programme of work is also obtained from the associated company. The ratio of this funding is dependant upon the size of the company with SmaU and Medium Enterprises (SMEs) receiving the largest government contn"bution. At the time of writing the cost to an SME. is about £9k per annum per graduate employed.
The TCS may be regarded as being a two-year technology transfer partnership between the University, the Company and the Graduate, each gaining considerably from the experience. Recently the emphasis is moving more towards meeting the requirements of SME's where the need for technological assistance, and the subsequent impact on their competitive advantage, has proven to be far more significant.
Figures released for the South West region demonstrate that almost 99% of local businesses are within the classification of SME, ie. less than 2SO employees in total (including any membership of a larger group). Approximately 5% of these local SMEs operate in
. technological discipline fields, e.g. manufilcturing engineering, and it is this type of company which has the most potential to gain from the suppon and technological interaction offered by involvement in the TCS.
432
Current policy has been to co-ordinate several TC programmes from regionally based centres across the UK. The South West regional Centre is located at the University of Plymouth and runs an average of 25 TC programmes. Obviously there is enormous potential

•
for enhancing the local manufacturing base, clear indication of which can be demonstrated by detailing five specific TC programmes as SME case studies.
3. LOCAL MANUFACTURING BASE
Devon and Cornwall provides an attractive environment and a high quality of life for the local workforce. The area has over 36,000 businesses of which 89% have fewer than 25 people but between them employ 1/2 million people. A further 146,000 individuals are self employed.
The local economy is slowly emerging out of recession. There is a feeling of cautious optimism, ahhough the region as a whole continues to under performed compared with the UK and Europe. Generally, the upturn in the local economy is slow and it is feh that established smaU and medium sized companies have the best prospects for growth and will provide a strong base for the area's future. In particular, provision of support and management development will be important to help these businesses which, coupled with networking and more exporting, could yield further economic growth.
The manufacturing sector in Devon and CornwaU is still relatively smaU compared with many other UK regions. In 1991 it accounted for 16% of total employment in Devon and Corn waD compared with 21% in the UK as a whole [2].
However, in terms of overaU employment, manufacturing in Devon and CornwaU has significantly outperformed the rest of the countty in recent years. The dramatic reduction in manufacturing employment recorded elsewhere in the countty has been largely avoided in Devon and Cornwall, ahhough in common with other sectors, there has been a significant drop in manufacturing employment levels since 1989. The 1993 Devon and Cornwall TEC Employer Survey shows expectations of marginal job increase in manufacturing and engineering. Manageria~ skilled and clerical occupations will be the most buoyant, whilst profesSional occupations are set to decline.
Ahhough there are clear signs of optimism in the sector, there is no room for complacency. In fact, the bi~est perceived constraint on business growth in the next year is a static or declining market (particularly in manufacturing, though less is in engineering) and the availability of finance. The manufacturing firms which are fairing best are those with markets extending across the UK or internationally [2).
The main in.Ouence on economic prospects in Devon and CornwaU will undoubtedly be the performance of the national economy. This is only just beginning to come out of sucb a deep and prolonged recession that high growth rates would be required for many years to restore output levels to those of the previous boom An added problem in the UK is the deficit of government's finances which is not being helped by slow growth in the economy. This has required tax increases and public expenditure restrictions which have also had an impact on restraining demand. Emerging trends and key opportunities for SMEs may be defined as [2]:
433

434
..
Emerging Trends
• Large companies and those operating in niche or Hi-Tecb areas have the best survival rates and growth prospects.
• Exports will be crucial for the future of the manufacturing and engineering sector.
• A cautious optimism has emerged amongst employers, resulting in recent recruitment and investment in plant and machinery.
Key opportunities
• Sales to the rest of the UK and exports to America in the short term and Europe in the medium term should be encouraged.
• The manufacturing base of Devon and Cornwall needs to be augmented to match the UK base.
• There is a need to encourage diversification of activity across the sector.
Given limited resources and technical know how, many of the above opportunities may never be realised by SME's. However, the introduction of Teaching company Scheme has in many cases, allowed a considerable quantity of specific relevant knowledge and skills to be transferred from academia to industry resuhing in low cost and high benefits. In addition, there is frequently an increase in their competitive advantage within the global manufacturing environment.
Case studies of five companies on Teaching Company Schemes are presented and the enhancement in profits and competitive advantage are highlighted.
4. TCS CASE STIJDY FOR COMPANY A
The SME Company A is a major manufacture of process [3] for a specialist sector of this particular market (estimated as 20% of UK market alone). Previous annual turnover exceeded 0.5 million pa of which approx. 35% waa generated by export and overseas business. Although company growth was increasing at a rate of 30% pa, it had become apparent that due to intense competition, a new initiative was required to enhance their competitive advantage.
The objective of the TC programme was to develop a fully automated version of the existing process equipment and for this purpose the Company required extensive transfer of technology from the University. In parallel to the main programme of work, a novel product was to be designed which could be used to demonstrate the functionality of the newly automated process. Clearly this novel product was anticipated to have considerable commercial potential in its own right.
..
5. TCS CASE STUDY FOR COMPANY B
The SME company B is a major manufacturer of garage equipmeat [4]. It is estimated that the company commands some 15% of the UK market. Previous annual turnover was 1.5 million of which 5% was export. In order to meet customer requirements, and to increase turnover, the company required the implementation of a quality management system and to gain quality approval to BS5750.
The objectives of the TC programme were therefore to devise and implement the required quality management system for the company and thereby gain BS5750. In addition, development was required of.an analysis programme to cover both existing products and those under development. The two objectives were seen as being complimentary and without certain areas of redesign, the quality requirements of the existing products could not be achieved.
6. TCS CASE STUDY FOR COMPANY C
Company C offers a design, manufacture and installation service for materials handling systems [ 5]. The company has customers throughout the UK, ahhough the majority are foods processors in Devon and Cornwall where the company has a market share of SO%. Previous annual turnover was £600k. Over'the last few years the company has grown substantially and the order book (over £150k) suggested that the growth would continue. The forecast was that the turnover would increase by 50% over the next two years. This service and product development strategy was placing a considerable extra burden on the management, staff and systems of the company.
The objective of the TC was to provide the company with a set of Cfrective systems and procedures. In doing so the programme was expected to make a significant con01bution to the introduction of Information Technology and quality management in the company. The new systems and procedures were expected to yield increased sales through reduced lead times, improved product quality/costing information and also reduced costs due to improved materialslresource management.
7. TCS CASE STIJDY FOR COMPANY D
Company D is a manufacturer in the market of wholesale plants [6]. The Company's turnover was in the excess of£1.2m of which 10% was export. The company sells some £2-3m plants each year and holds an estimated 2% of the UK market. The company employs some 35 people and over the last few years the company has grown at a rate exceeding 20%. A medium term objective of the company was to maintain the level of growth by a strategy of new market and product development. However, the Company did not have the resources to carry out the marketing and development operation support systems which will be critical in the implementation of their strategy.
The objectives of the TC programme were to develop and implement a strategy of growth by exploiting export opportunities and increasing turnover by 40%. This was to be canied out through the identification of new products and markets and the development of an
435
436
..
infrastructure of operations support system. The programme was expected to increase the turnover from £ 1.2m to £ 1.7m, leading to an increase in profit of £ 70k pa. Improved operations support systems leading to improved resource utilisation were also anticipated.
8. TCS CASE STUDY FOR COMPANY E
Company E is an independent private company. The principal product of the company is a range of high quality assembled kitchen units mainly sold direct to house builders within its geographical region [7]. The turnover of the company was over £I. I m It is estimated that the company held 5% of the market within its region. In order to increase turnover and the customer base the company were planning to move into retail kitchen market.
The objectives of the TC programme were to develop and implement a marketing strategy which would enable the Company to trade in the retail built-in kitchen market. The programme was expected to increase turnover from £I. I m to £2. 5m, increase levels of customer numbers, improve profitability and improved ability to withstand competition from continental suppliers.
9. RESULTS AND CONCLUSIONS
Table I summarises the objectives and results achieved in the each of 5 case studies. The acrual benefits gained from the TC programmes far exceeded the expected objectives.
There have also been considerable indirect benefits such as the close interaction forged between local industry and the University. This link has also resulted in further courses and research being devised which are more closely tailored to the needs of industry.
Clearly, wben considering example manufacturing case study companies described in the paper, the Teaching Company programmes have achieved a considerable conut"bution to enhancing each company's competitive advantage. In aD cases benefits have been gained by each of the partners involved, ie. the Company, the University and the Graduate. The schemes have been sufficiently flexible to· allow for modification to the objectives during the two year period which has ensured that not only are the objectives achieved, but more importantly that those objectives are still valid. Particularly in the case of SMEs, changing operational considerations may alter priorities. This can be reflected, to a certain degree, within the scope of the TCS which is a further benefit wben compared to more rigid alternative methods of support. Practice has demonstrated $at the interaction between the University and the Companies involved and allowed the expected uansfer of technology, but more importantly it has generated further collaboration, and interchange of ideas, in many complementary fields of application, e.g. consultancy, undergraduate project placements, provision of case-study material for teaching purposes etc. Each graduate received the opportunity to register for a higher degree (MSc or MPhil) and in addition received a comprehensive package of both educational and practical uaining.

•
Table 1 Results from case study TC programmes
COMPANY Targets Achieved Other Benefits
A Increase in turnover by £ l50k Turnover increased by £300k Future growth expected at 15-20%
Increase in orofits of £40k Profits increased by £145k New product
B Obtain BS5750 BS5750 Obtained Computerised clerical system
Reduction in costs of 10% (£150k) Costs reduced 13% (£200k) Purchased new plant
Develoo analvsis uroa:ramme Introduced value analysis proa:ramme
c Increase in turnover £300k Turnover increased by £300k Change in Company's culture
Increase in profits £80k Profits increased by £I OOk Introduced computer system (50% saving) Improved company image (resulting in new orders of £250k)
D Increase in exports 40% Sales increased by £ ll4k Improved production efficiency
Increase in turnover from £500k Profits increased by £40k New systems for:
Increase profits £70k Fully integrated operational management Inventory olanninll and control
E Increase in turnover £1.4m Orders increased by 50% Customer database
Increase in customer base Customer base increased by 200% Improved quality of information
Profits increased by 12% Increase in retail business

•
The TCS objectives as defined in section 2 appear very ambitious when under initial assessment. However, it is obvious from the resuhs presented that it may be one of the few genuine methods of support for SMEs which actually does benefit all three partners involved.
10. REFERENCES
I. Teaching Company Scheme Information Sheet. Publisbed by the Teaching Company Directorate, London.
2. Foundation for the Future: An Economic Assessment of Devon and Cornwall. Devon and Cornwall TEC Annual Report, 1994.
3. Teaching Company Programme Final Report, Grant Reference Number GRIH96872.
4. Teaching Company Programme Final Report, Grant Reference Number GRIH48743.
5. Teaching Company Programme Final Report, Grant Reference Number GR/141314.
6. Teaching Company Programme Final Report, Grant Reference Number GRIH89036.
7. Teaching Company Programme Final Report, Grant Reference Number GRIH48866.
. -t' .
437

Copyright Statement
This copy of the thesis has been supplied on condition that anyone who consults it is
understood to recognise that its copyright rests with the author and that no quotation
from the thesis and no information derived from it may be published without the
author's prior written consent.