Regulatory T cell development in the absence of functional Foxp3
10
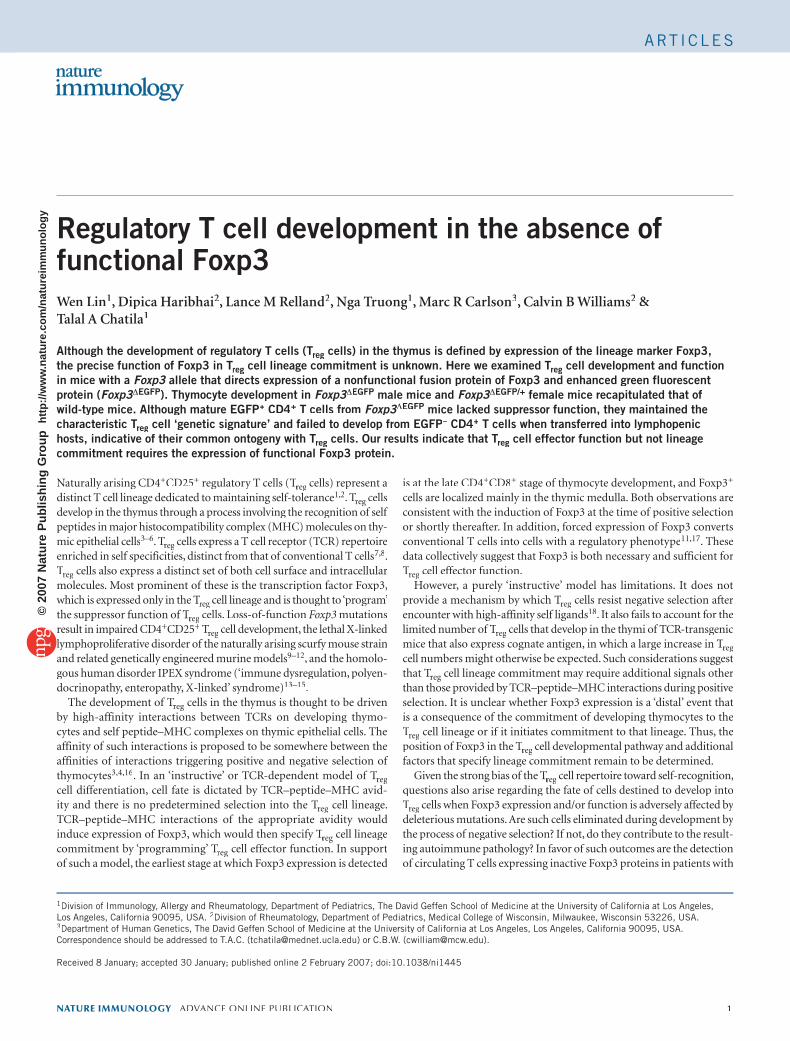
Regulatory T cell development in the absence of functional Foxp3 Wen Lin 1 , Dipica Haribhai 2 , Lance M Relland 2 , Nga Truong 1 , Marc R Carlson 3 , Calvin B Williams 2 & Talal A Chatila 1 Although the development of regulatory T cells (T reg T T cells) in the thymus is defined by expression of the lineage marker Foxp3, the precise function of Foxp3 in T reg T T cell lineage commitment is unknown. Here we examined T reg T T cell development and function in mice with a Foxp3 allele that directs expression of a nonfunctional fusion protein of Foxp3 and enhanced green fluorescent protein (Foxp3 Δ EGFP ). Thymocyte development in Foxp3 Δ EGFP male mice and Foxp3 Δ EGFP/+ female mice recapitulated that of wild-type mice. Although mature EGFP + CD4 + T cells from Foxp3 Δ EGFP mice lacked suppressor function, they maintained the characteristic T reg T T cell ‘genetic signature’ and failed to develop from EGFP – CD4 + T cells when transferred into lymphopenic hosts, indicative of their common ontogeny with T reg T T cells. Our results indicate that T reg T T cell effector function but not lineage commitment requires the expression of functional Foxp3 protein. Naturally arising CD4 + CD25 + regulatory T cells (T reg T T cells) represent a g g distinct T cell lineage dedicated to maintaining self-tolerance 1,2 . T reg T T cells g g develop in the thymus through a process involving the recognition of self peptides in major histocompatibility complex (MHC) molecules on thy- mic epithelial cells 3–6 . T reg T T cells express a T cell receptor (TCR) repertoire g g enriched in self specificities, distinct from that of conventional T cells 7,8 . T reg T T cells also express a distinct set of both cell surface and intracellular g g molecules. Most prominent of these is the transcription factor Foxp3, which is expressed only in the T reg T T cell lineage and is thought to ‘program’ g g the suppressor function of T reg T T cells. Loss-of-function g g Foxp3 mutations result in impaired CD4 + CD25 + T reg T T cell development, the lethal X-linked g g lymphoproliferative disorder of the naturally arising scurfy mouse strain and related genetically engineered murine models 9–12 , and the homolo- gous human disorder IPEX syndrome (‘immune dysregulation, polyen- docrinopathy, enteropathy, X-linked’ syndrome) 13–15 . The development of T reg T T cells in the thymus is thought to be driven by high-affinity interactions between TCRs on developing thymo- cytes and self peptide–MHC complexes on thymic epithelial cells. The affinity of such interactions is proposed to be somewhere between the affinities of interactions triggering positive and negative selection of thymocytes 3,4,16 . In an ‘instructive’ or TCR-dependent model of T reg T T cell differentiation, cell fate is dictated by TCR–peptide–MHC avid- ity and there is no predetermined selection into the T reg T T cell lineage. TCR–peptide–MHC interactions of the appropriate avidity would induce expression of Foxp3, which would then specify T reg T T cell lineage g g commitment by ‘programming’ T reg T T cell effector function. In support of such a model, the earliest stage at which Foxp3 expression is detected is at the late CD4 + CD8 + stage of thymocyte development, and Foxp3 + cells are localized mainly in the thymic medulla. Both observations are consistent with the induction of Foxp3 at the time of positive selection or shortly thereafter. In addition, forced expression of Foxp3 converts conventional T cells into cells with a regulatory phenotype 11,17 . These data collectively suggest that Foxp3 is both necessary and sufficient for T reg T T cell effector function. g g However, a purely ‘instructive’ model has limitations. It does not provide a mechanism by which T reg T T cells resist negative selection after encounter with high-affinity self ligands 18 . It also fails to account for the limited number of T reg T T cells that develop in the thymi of TCR-transgenic g g mice that also express cognate antigen, in which a large increase in T reg T T cell numbers might otherwise be expected. Such considerations suggest that T reg T T cell lineage commitment may require additional signals other g g than those provided by TCR–peptide–MHC interactions during positive selection. It is unclear whether Foxp3 expression is a ‘distal’ event that is a consequence of the commitment of developing thymocytes to the T reg T T cell lineage or if it initiates commitment to that lineage. Thus, the g g position of Foxp3 in the T reg T T cell developmental pathway and additional g g factors that specify lineage commitment remain to be determined. Given the strong bias of the T reg T T cell repertoire toward self-recognition, g g questions also arise regarding the fate of cells destined to develop into T reg T T cells when Foxp3 expression and/or function is adversely affected by g g deleterious mutations. Are such cells eliminated during development by the process of negative selection? If not, do they contribute to the result- ing autoimmune pathology? In favor of such outcomes are the detection of circulating T cells expressing inactive Foxp3 proteins in patients with 1 Division of Immunology, Allergy and Rheumatology, Department of Pediatrics, The David Geffen School of Medicine at the University of California at Los Angeles, Los Angeles, California 90095, USA. 2 Division of Rheumatology, Department of Pediatrics, Medical College of Wisconsin, Milwaukee, Wisconsin 53226, USA. 3 Department of Human Genetics, The David Geffen School of Medicine at the University of California at Los Angeles, Los Angeles, California 90095, USA. Correspondence should be addressed to T.A.C. ([email protected]) or C.B.W. ([email protected]). Received 8 January; accepted 30 January; published online 2 February 2007; doi:10.1038/ni1445 NATURE IMMUNOLOGY ADVANCE ONLINE PUBLICATION 1 ARTICLES © 2007 Nature Publishing Group http://www.nature.com/natureimmunology
-
Upload
independent -
Category
Documents
-
view
7 -
download
0
Transcript of Regulatory T cell development in the absence of functional Foxp3
Regulatory T cell development in the absence of functional Foxp3Wen Lin1, Dipica Haribhai2, Lance M Relland2, Nga Truong1, Marc R Carlson3, Calvin B Williams2 & Talal A Chatila1
Although the development of regulatory T cells (TregAlthough the development of regulatory T cells (TregAlthough the development of regulatory T cells (T cells) in the thymus is defined by expression of the lineage marker Foxp3, the precise function of Foxp3 in Tregthe precise function of Foxp3 in Tregthe precise function of Foxp3 in T cell lineage commitment is unknown. Here we examined Treg cell lineage commitment is unknown. Here we examined Treg cell lineage commitment is unknown. Here we examined T cell development and function in mice with a Foxp3 allele that directs expression of a nonfunctional fusion protein of Foxp3 and enhanced green fluorescent Foxp3 allele that directs expression of a nonfunctional fusion protein of Foxp3 and enhanced green fluorescent Foxp3protein (Foxp3ΔFoxp3ΔFoxp3 EGFP). Thymocyte development in Foxp3ΔFoxp3ΔFoxp3 EGFP male mice and Foxp3ΔFoxp3ΔFoxp3 EGFP/+ female mice recapitulated that of wild-type mice. Although mature EGFP+ CD4+ T cells from Foxp3ΔFoxp3ΔFoxp3 EGFP mice lacked suppressor function, they maintained the characteristic Tregcharacteristic Tregcharacteristic T cell ‘genetic signature’ and failed to develop from EGFP– CD4+ T cells when transferred into lymphopenic hosts, indicative of their common ontogeny with Treghosts, indicative of their common ontogeny with Treghosts, indicative of their common ontogeny with T cells. Our results indicate that Treg cells. Our results indicate that Treg cells. Our results indicate that T cell effector function but not lineage commitment requires the expression of functional Foxp3 protein.
Naturally arising CD4+CD25+ regulatory T cells (Treg regulatory T cells (Treg regulatory T cells (T cells) represent a reg cells) represent a regdistinct T cell lineage dedicated to maintaining self-tolerance1,2. Treg. Treg. T cells reg cells regdevelop in the thymus through a process involving the recognition of self peptides in major histocompatibility complex (MHC) molecules on thy-mic epithelial cells3–6. Treg. Treg. T cells express a T cell receptor (TCR) repertoire reg cells express a T cell receptor (TCR) repertoire regenriched in self specificities, distinct from that of conventional T cells7,8. TregTregT cells also express a distinct set of both cell surface and intracellular reg cells also express a distinct set of both cell surface and intracellular regmolecules. Most prominent of these is the transcription factor Foxp3, which is expressed only in the Tregwhich is expressed only in the Tregwhich is expressed only in the T cell lineage and is thought to ‘program’ reg cell lineage and is thought to ‘program’ regthe suppressor function of Tregthe suppressor function of Tregthe suppressor function of T cells. Loss-of-function reg cells. Loss-of-function reg Foxp3 mutations result in impaired CD4+CD25+ Treg Treg T cell development, the lethal X-linked reg cell development, the lethal X-linked reglymphoproliferative disorder of the naturally arising scurfy mouse strain and related genetically engineered murine models9–12, and the homolo-gous human disorder IPEX syndrome (‘immune dysregulation, polyen-docrinopathy, enteropathy, X-linked’ syndrome)13–15.
The development of TregThe development of TregThe development of T cells in the thymus is thought to be driven by high-affinity interactions between TCRs on developing thymo-cytes and self peptide–MHC complexes on thymic epithelial cells. The affinity of such interactions is proposed to be somewhere between the affinities of interactions triggering positive and negative selection of thymocytes3,4,16. In an ‘instructive’ or TCR-dependent model of Treg. In an ‘instructive’ or TCR-dependent model of Treg. In an ‘instructive’ or TCR-dependent model of Tcell differentiation, cell fate is dictated by TCR–peptide–MHC avid-ity and there is no predetermined selection into the Tregity and there is no predetermined selection into the Tregity and there is no predetermined selection into the T cell lineage. TCR–peptide–MHC interactions of the appropriate avidity would induce expression of Foxp3, which would then specify Treginduce expression of Foxp3, which would then specify Treginduce expression of Foxp3, which would then specify T cell lineage reg cell lineage regcommitment by ‘programming’ Tregcommitment by ‘programming’ Tregcommitment by ‘programming’ T cell effector function. In support of such a model, the earliest stage at which Foxp3 expression is detected
is at the late CD4+CD8+ stage of thymocyte development, and Foxp3+
cells are localized mainly in the thymic medulla. Both observations are consistent with the induction of Foxp3 at the time of positive selection or shortly thereafter. In addition, forced expression of Foxp3 converts conventional T cells into cells with a regulatory phenotype11,17. These data collectively suggest that Foxp3 is both necessary and sufficient for TregTregT cell effector function.reg cell effector function.reg
However, a purely ‘instructive’ model has limitations. It does not provide a mechanism by which Tregprovide a mechanism by which Tregprovide a mechanism by which T cells resist negative selection after encounter with high-affinity self ligands18. It also fails to account for the limited number of Treglimited number of Treglimited number of T cells that develop in the thymi of TCR-transgenic reg cells that develop in the thymi of TCR-transgenic regmice that also express cognate antigen, in which a large increase in Tregmice that also express cognate antigen, in which a large increase in Tregmice that also express cognate antigen, in which a large increase in Tcell numbers might otherwise be expected. Such considerations suggest that Tregthat Tregthat T cell lineage commitment may require additional signals other reg cell lineage commitment may require additional signals other regthan those provided by TCR–peptide–MHC interactions during positive selection. It is unclear whether Foxp3 expression is a ‘distal’ event that is a consequence of the commitment of developing thymocytes to the TregTregT cell lineage or if it initiates commitment to that lineage. Thus, the reg cell lineage or if it initiates commitment to that lineage. Thus, the regposition of Foxp3 in the Tregposition of Foxp3 in the Tregposition of Foxp3 in the T cell developmental pathway and additional reg cell developmental pathway and additional regfactors that specify lineage commitment remain to be determined.
Given the strong bias of the TregGiven the strong bias of the TregGiven the strong bias of the T cell repertoire toward self-recognition, reg cell repertoire toward self-recognition, regquestions also arise regarding the fate of cells destined to develop into TregTregT cells when Foxp3 expression and/or function is adversely affected by reg cells when Foxp3 expression and/or function is adversely affected by regdeleterious mutations. Are such cells eliminated during development by the process of negative selection? If not, do they contribute to the result-ing autoimmune pathology? In favor of such outcomes are the detection of circulating T cells expressing inactive Foxp3 proteins in patients with
1Division of Immunology, Allergy and Rheumatology, Department of Pediatrics, The David Geffen School of Medicine at the University of California at Los Angeles, Los Angeles, California 90095, USA. 2Division of Rheumatology, Department of Pediatrics, Medical College of Wisconsin, Milwaukee, Wisconsin 53226, USA. 3Department of Human Genetics, The David Geffen School of Medicine at the University of California at Los Angeles, Los Angeles, California 90095, USA. Correspondence should be addressed to T.A.C. ([email protected]) or C.B.W. ([email protected]).
Received 8 January; accepted 30 January; published online 2 February 2007; doi:10.1038/ni1445
NATURE IMMUNOLOGY ADVANCE ONLINE PUBLICATION 1
ART ICLES©
2007
Nat
ure
Pub
lishi
ng G
roup
ht
tp://
ww
w.n
atur
e.co
m/n
atur
eim
mun
olog
y
IPEX syndrome who have missense FOXP3 mutations and the observa-tion that the autoimmune lymphoproliferative disease associated with Foxp3 deficiency is more aggressive than that in experimental models of acquired Tregof acquired Tregof acquired T cell deficiency induced by neonatal thymectomy or by reg cell deficiency induced by neonatal thymectomy or by regdepletion with antibody to CD25 (anti-CD25)1,19–21.
To determine the function of Foxp3 in TregTo determine the function of Foxp3 in TregTo determine the function of Foxp3 in T cell lineage commitment reg cell lineage commitment regand to identify Foxp3-deficient Tregand to identify Foxp3-deficient Tregand to identify Foxp3-deficient T cell precursors exported to the periphery, we generated mice containing a cassette encoding a mutant fusion protein of Foxp3 and enhanced green fluorescent protein (EGFP) in the Foxp3 locus (Foxp3ΔEGFP). EGFP+ CD4+ T cells lacked regulatory function, and Foxp3ΔEGFP male mice developed a fatal autoimmune lym-phoproliferative disease indistinguishable from that of other Foxp3-defi-cient mice. Thymic expression of the mutant Foxp3-EGFP fusion protein occurred at the same developmental stages and in a similar proportion of cells as did that of Foxp3 protein in wild-type mice. EGFP+ CD4+ T cells in Foxp3ΔEGFP mice had a cell surface phenotype and a gene-expression profile that shared many features with those of wild-type Tregprofile that shared many features with those of wild-type Tregprofile that shared many features with those of wild-type T cells and reg cells and regwere distinct from activated conventional T cells. Overall, our results dis-sociate the essential purpose of Foxp3 in Tregsociate the essential purpose of Foxp3 in Tregsociate the essential purpose of Foxp3 in T cell regulatory function from reg cell regulatory function from regits suggested requirement in initiating Tregits suggested requirement in initiating Tregits suggested requirement in initiating T cell lineage commitment.reg cell lineage commitment.reg
RESULTST cell–suppressive function of Foxp3ΔEGFP
We inserted DNA encoding EGFP followed by a stop codon in-frame into the terminal exon 11 of Foxp3 at codon 397. The resultant allele (Foxp3ΔEGFP) encoded a fusion protein expressed under control of the endogenous Foxp3 promoter and enhancer elements (SupplementaryFigure 1 online). The Foxp3 33–amino acid C-terminal peptide that was replaced with EGFP included residues involved in the binding of Foxp3 to DNA and to the transcription factor NFAT as well as the nucleus-local-ization sequence, and the nucleotide sequence encoding it is the target of loss-of-function mutations and deletions in patients with IPEX syn-drome22–24. The Foxp3-EGFP fusion protein was localized to the cytosol, consistent with the loss of the C-terminal nucleus-localization signal (Supplemental Video 1 online). Male offspring carrying the Foxp3ΔEGFP
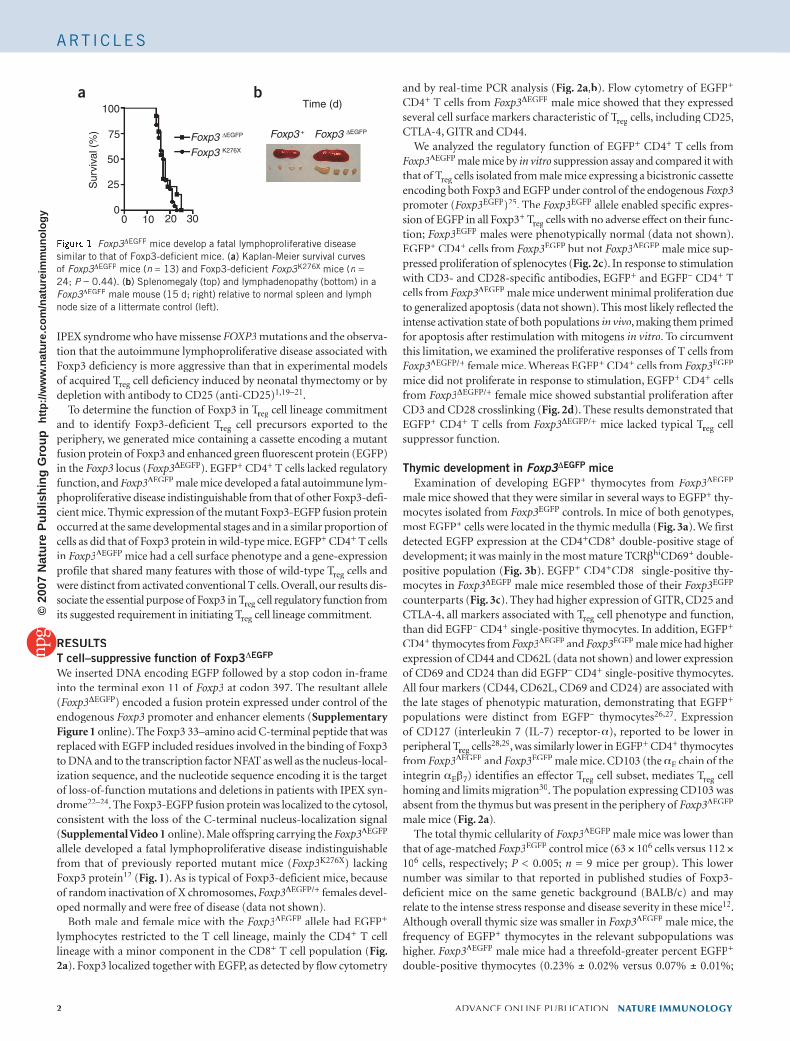
allele developed a fatal lymphoproliferative disease indistinguishable from that of previously reported mutant mice (Foxp3K276X) lacking Foxp3 protein12 (Fig. 1). As is typical of Foxp3-deficient mice, because of random inactivation of X chromosomes, Foxp3ΔEGFP/+ females devel-oped normally and were free of disease (data not shown).
Both male and female mice with the Foxp3ΔEGFP allele had EGFP+
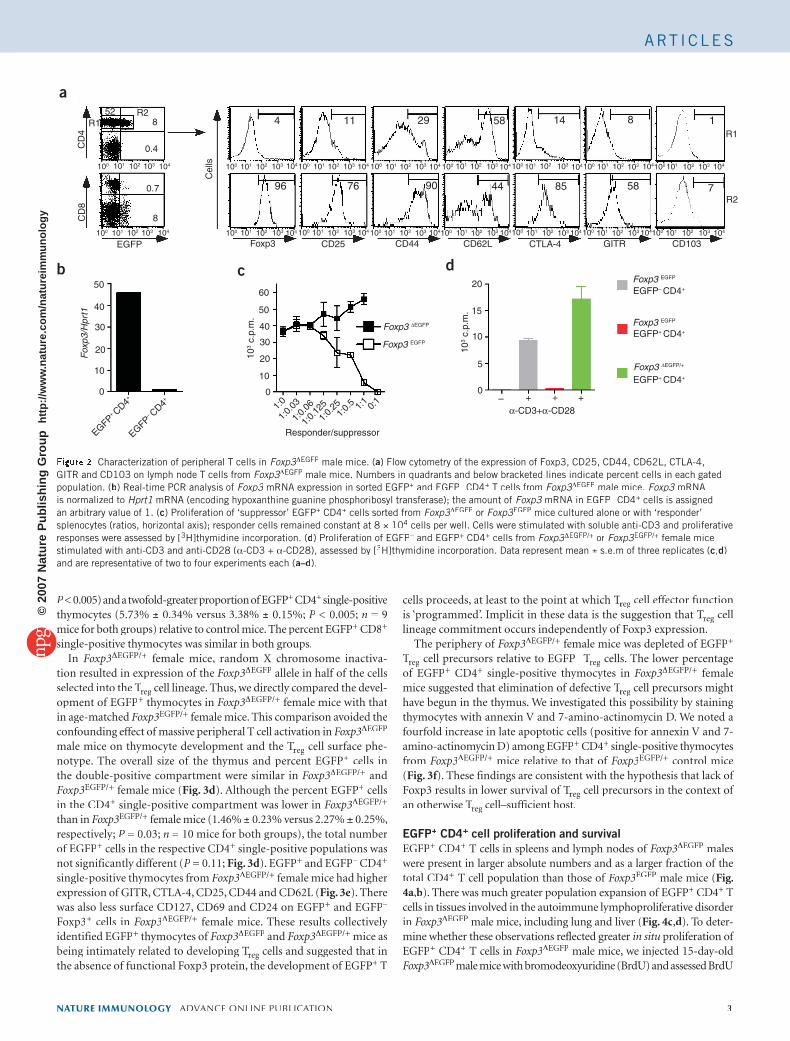
lymphocytes restricted to the T cell lineage, mainly the CD4+ T cell lineage with a minor component in the CD8+ T cell population (Fig. 2a). Foxp3 localized together with EGFP, as detected by flow cytometry
and by real-time PCR analysis (Fig. 2a,b). Flow cytometry of EGFP+
CD4+ T cells from Foxp3ΔEGFP male mice showed that they expressed several cell surface markers characteristic of Tregseveral cell surface markers characteristic of Tregseveral cell surface markers characteristic of T cells, including CD25, reg cells, including CD25, regCTLA-4, GITR and CD44.
We analyzed the regulatory function of EGFP+ CD4+ T cells from Foxp3ΔEGFP male mice by in vitro suppression assay and compared it with that of Tregthat of Tregthat of T cells isolated from male mice expressing a bicistronic cassette reg cells isolated from male mice expressing a bicistronic cassette regencoding both Foxp3 and EGFP under control of the endogenous Foxp3promoter (Foxp3EGFP)25. The Foxp3EGFP allele enabled specific expres-sion of EGFP in all Foxp3+ Treg Treg T cells with no adverse effect on their func-reg cells with no adverse effect on their func-regtion; Foxp3EGFP males were phenotypically normal (data not shown). EGFP+ CD4+ cells from Foxp3EGFP but not Foxp3ΔEGFP male mice sup-pressed proliferation of splenocytes (Fig. 2c). In response to stimulation with CD3- and CD28-specific antibodies, EGFP+ and EGFP– CD4+ T cells from Foxp3ΔEGFP male mice underwent minimal proliferation due to generalized apoptosis (data not shown). This most likely reflected the intense activation state of both populations in vivo, making them primed for apoptosis after restimulation with mitogens in vitro. To circumvent this limitation, we examined the proliferative responses of T cells from Foxp3ΔEGFP/+ female mice. Whereas EGFP+ CD4+ cells from Foxp3EGFP
mice did not proliferate in response to stimulation, EGFP+ CD4+ cells from Foxp3ΔEGFP/+ female mice showed substantial proliferation after CD3 and CD28 crosslinking (Fig. 2d). These results demonstrated that EGFP+ CD4+ T cells from Foxp3ΔEGFP/+ mice lacked typical Treg mice lacked typical Treg mice lacked typical T cell suppressor function.
Thymic development in Foxp3ΔFoxp3ΔFoxp3 EGFP miceExamination of developing EGFP+ thymocytes from Foxp3ΔEGFP
male mice showed that they were similar in several ways to EGFP+ thy-mocytes isolated from Foxp3EGFP controls. In mice of both genotypes, most EGFP+ cells were located in the thymic medulla (Fig. 3a). We first detected EGFP expression at the CD4+CD8+ double-positive stage of development; it was mainly in the most mature TCRβhiCD69+ double-positive population (Fig. 3b). EGFP+ CD4+CD8– single-positive thy-mocytes in Foxp3ΔEGFP male mice resembled those of their Foxp3EGFP
counterparts (Fig. 3c). They had higher expression of GITR, CD25 and CTLA-4, all markers associated with TregCTLA-4, all markers associated with TregCTLA-4, all markers associated with T cell phenotype and function, than did EGFP– CD4– CD4– + single-positive thymocytes. In addition, EGFP+
CD4+ thymocytes from Foxp3ΔEGFP and Foxp3EGFP male mice had higher expression of CD44 and CD62L (data not shown) and lower expression of CD69 and CD24 than did EGFP– CD4– CD4– + single-positive thymocytes. All four markers (CD44, CD62L, CD69 and CD24) are associated with the late stages of phenotypic maturation, demonstrating that EGFP+
populations were distinct from EGFP– thymocytes26,27. Expression of CD127 (interleukin 7 (IL-7) receptor-α), reported to be lower in peripheral Tregperipheral Tregperipheral T cellsreg cellsreg
28,29, was similarly lower in EGFP+ CD4+ thymocytes from Foxp3Δ
regΔregEGFP
regEGFP
reg and Foxp3EGFP male mice. CD103 (the αE chain of the
integrin αEβ7) identifies an effector Treg) identifies an effector Treg) identifies an effector T cell subset, mediates Treg cell subset, mediates Treg cell subset, mediates T cell homing and limits migration30. The population expressing CD103 was absent from the thymus but was present in the periphery of Foxp3ΔEGFP
male mice (Fig. 2a).The total thymic cellularity of Foxp3ΔEGFP male mice was lower than
that of age-matched Foxp3EGFP control mice (63 × 106 cells versus 112 ×106 cells, respectively; P < 0.005; n = 9 mice per group). This lower number was similar to that reported in published studies of Foxp3-deficient mice on the same genetic background (BALB/c) and may relate to the intense stress response and disease severity in these mice12. Although overall thymic size was smaller in Foxp3ΔEGFP male mice, the frequency of EGFP+ thymocytes in the relevant subpopulations was higher. Foxp3ΔEGFP male mice had a threefold-greater percent EGFP+
double-positive thymocytes (0.23% ± 0.02% versus 0.07% ± 0.01%;
2 ADVANCE ONLINE PUBLICATION NATURE IMMUNOLOGY
Foxp3 ∆EGFP
Foxp3 K276X
100
75
50
25
00 10 20 30
Time (d)S
urvi
val (
%) Foxp3 + Foxp3 ∆EGFP
a b
Figure 1 Foxp3ΔFoxp3ΔFoxp3 EGFP mice develop a fatal lymphoproliferative disease similar to that of Foxp3-deficient mice. (a) Kaplan-Meier survival curves of Foxp3ΔFoxp3ΔFoxp3 EGFP mice (n = 13) and Foxp3-deficient Foxp3K276X mice (n =24; P = 0.44). (b) Splenomegaly (top) and lymphadenopathy (bottom) in a Foxp3ΔFoxp3ΔFoxp3 EGFP male mouse (15 d; right) relative to normal spleen and lymph node size of a littermate control (left).
ART ICLES©
2007
Nat
ure
Pub
lishi
ng G
roup
ht
tp://
ww
w.n
atur
e.co
m/n
atur
eim
mun
olog
y
P <0.005) and a twofold-greater proportion of EGFP+ CD4+ single-positive thymocytes (5.73% ± 0.34% versus 3.38% ± 0.15%; P < 0.005; n = 9 mice for both groups) relative to control mice. The percent EGFP+ CD8+
single-positive thymocytes was similar in both groups.In Foxp3ΔEGFP/+ female mice, random X chromosome inactiva-
tion resulted in expression of the Foxp3ΔEGFP allele in half of the cells selected into the Tregselected into the Tregselected into the T cell lineage. Thus, we directly compared the devel-reg cell lineage. Thus, we directly compared the devel-regopment of EGFP+ thymocytes in Foxp3ΔEGFP/+ female mice with that in age-matched Foxp3EGFP/+ female mice. This comparison avoided the confounding effect of massive peripheral T cell activation in Foxp3ΔEGFP
male mice on thymocyte development and the Tregmale mice on thymocyte development and the Tregmale mice on thymocyte development and the T cell surface phe-notype. The overall size of the thymus and percent EGFP+ cells in the double-positive compartment were similar in Foxp3ΔEGFP/+ and Foxp3EGFP/+ female mice (Fig. 3d). Although the percent EGFP+ cells in the CD4+ single-positive compartment was lower in Foxp3ΔEGFP/+
than in Foxp3EGFP/+ female mice (1.46% ± 0.23% versus 2.27% ± 0.25%, respectively; P = 0.03; n = 10 mice for both groups), the total number of EGFP+ cells in the respective CD4+ single-positive populations was not significantly different (P = 0.11; Fig. 3d). EGFP+ and EGFP– CD4+
single-positive thymocytes from Foxp3ΔEGFP/+ female mice had higher expression of GITR, CTLA-4, CD25, CD44 and CD62L (Fig. 3e). There was also less surface CD127, CD69 and CD24 on EGFP+ and EGFP–
Foxp3+ cells in Foxp3ΔEGFP/+ female mice. These results collectively identified EGFP+ thymocytes of Foxp3ΔEGFP and Foxp3ΔEGFP/+ mice as being intimately related to developing Tregbeing intimately related to developing Tregbeing intimately related to developing T cells and suggested that in the absence of functional Foxp3 protein, the development of EGFP+ T
cells proceeds, at least to the point at which Tregcells proceeds, at least to the point at which Tregcells proceeds, at least to the point at which T cell effector function is ‘programmed’. Implicit in these data is the suggestion that Tregis ‘programmed’. Implicit in these data is the suggestion that Tregis ‘programmed’. Implicit in these data is the suggestion that T cell lineage commitment occurs independently of Foxp3 expression.
The periphery of Foxp3ΔEGFP/+ female mice was depleted of EGFP+
TregTregT cell precursors relative to EGFP– Treg Treg T cells. The lower percentage of EGFP+ CD4+ single-positive thymocytes in Foxp3ΔEGFP/+ female mice suggested that elimination of defective Tregmice suggested that elimination of defective Tregmice suggested that elimination of defective T cell precursors might reg cell precursors might reghave begun in the thymus. We investigated this possibility by staining thymocytes with annexin V and 7-amino-actinomycin D. We noted a fourfold increase in late apoptotic cells (positive for annexin V and 7-amino-actinomycin D) among EGFP+ CD4+ single-positive thymocytes from Foxp3ΔEGFP/+ mice relative to that of Foxp3EGFP/+ control mice (Fig. 3f). These findings are consistent with the hypothesis that lack of Fig. 3f). These findings are consistent with the hypothesis that lack of Fig. 3fFoxp3 results in lower survival of TregFoxp3 results in lower survival of TregFoxp3 results in lower survival of T cell precursors in the context of an otherwise Tregan otherwise Tregan otherwise T cell–sufficient host.reg cell–sufficient host.reg
EGFP+ CD4+ cell proliferation and survivalEGFP+ CD4+ T cells in spleens and lymph nodes of Foxp3ΔEGFP males were present in larger absolute numbers and as a larger fraction of the total CD4+ T cell population than those of Foxp3EGFP male mice (Fig. 4a,b). There was much greater population expansion of EGFP+ CD4+ T cells in tissues involved in the autoimmune lymphoproliferative disorder in Foxp3ΔEGFP male mice, including lung and liver (Fig. 4c,d). To deter-mine whether these observations reflected greater in situ proliferation of EGFP+ CD4+ T cells in Foxp3ΔEGFP male mice, we injected 15-day-old Foxp3ΔEGFP male mice with bromodeoxyuridine (BrdU) and assessed BrdU
NATURE IMMUNOLOGY ADVANCE ONLINE PUBLICATION 3
CD
4C
D8
EGFP
52 R28R1
0.4
0.7
8
100 101 102 103 104
100 101 102 103 104
100 101 102 103 104100 101 102 103 104 100 101 102 103 104 100 101 102 103 104100 101 102 103 104100 101 102 103 104100 101 102 103 104
100 101 102 103 104 100 101 102 103 104 100 101 102 103 104100 101 102 103 104100 101 102 103 104 100 101 102 103 104100 101 102 103 104
Cel
ls
Foxp3 CD25 CD44 CD62L CTLA-4 GITR CD103
R1
R2
4
96
11
76
29
90
58
44
14
85
8
58
1
7
Fox
p3/H
prt1
0
10
20
30
40
50
EGFP+ C
D4+
EGFP– C
D4+
103
c.p.
m.
60
0
10
20
30
40
50
Foxp3 ∆EGFP
Foxp3 EGFP
1:0
1:0.
03
1:0.
06
1:0.
125
1:0.
251:
0.5 1:
1 0:1
103
c.p.
m.
– + + +α-CD3+α-CD28
0
5
10
15
20 Foxp3 EGFP
Foxp3 EGFP
Foxp3 ∆EGFP/+
EGFP– CD4+
EGFP+ CD4+
EGFP+ CD4+
a
b c d
Responder/suppressor
Figure 2 Characterization of peripheral T cells in Foxp3ΔFoxp3ΔFoxp3 EGFP male mice. (a) Flow cytometry of the expression of Foxp3, CD25, CD44, CD62L, CTLA-4, GITR and CD103 on lymph node T cells from Foxp3ΔFoxp3ΔFoxp3 EGFP male mice. Numbers in quadrants and below bracketed lines indicate percent cells in each gated population. (b) Real-time PCR analysis of Foxp3 mRNA expression in sorted EGFPFoxp3 mRNA expression in sorted EGFPFoxp3 + and EGFP– CD4– CD4– + T cells from Foxp3ΔFoxp3ΔFoxp3 EGFP male mice. Foxp3 mRNA Foxp3 mRNA Foxp3is normalized to Hprt1 mRNA (encoding hypoxanthine guanine phosphoribosyl transferase); the amount of Foxp3 mRNA in EGFPFoxp3 mRNA in EGFPFoxp3 – CD4– CD4– + cells is assigned an arbitrary value of 1. (c) Proliferation of ‘suppressor’ EGFP+ CD4+ cells sorted from Foxp3ΔFoxp3ΔFoxp3 EGFP or Foxp3EGFP mice cultured alone or with ‘responder’ splenocytes (ratios, horizontal axis); responder cells remained constant at 8 × 10⁴ cells per well. Cells were stimulated with soluble anti-CD3 and proliferative responses were assessed by [3H]thymidine incorporation. (d) Proliferation of EGFP– and EGFP– and EGFP– + CD4+ cells from Foxp3ΔFoxp3ΔFoxp3 EGFP/+ or Foxp3EGFP/+ female mice stimulated with anti-CD3 and anti-CD28 (α-CD3 + α-CD28), assessed by [3H]thymidine incorporation. Data represent mean ± s.e.m of three replicates (c,d) and are representative of two to four experiments each (a–d).
ART ICLES©
2007
Nat
ure
Pub
lishi
ng G
roup
ht
tp://
ww
w.n
atur
e.co
m/n
atur
eim
mun
olog
y
incorporation in their lymphocytes. We found a higher percentage of BrdU+ EGFP+ than BrdU+ EGFP– T cells in both peripheral lymphoid – T cells in both peripheral lymphoid –
tissues and infiltrated organs, indicating that EGFP+ CD4+ T cells prolifer-ated more in situ (Fig. 4e). In contrast, both the EGFP+ and EGFP– CD4– CD4– +
T cell populations in Foxp3ΔEGFP male mice had similar frequency of pro-grammed cell death, as detected by staining of freshly isolated lymphocytes for activated caspase 3 (Fig. 4f). The staining for activated caspase 3 of both Fig. 4f). The staining for activated caspase 3 of both Fig. 4fpopulations was much higher than that of conventional and Tregpopulations was much higher than that of conventional and Tregpopulations was much higher than that of conventional and T cells in reg cells in regFoxp3EGFP male mice, however, probably reflecting the heightened acti-vation state of T cells in Foxp3ΔEGFP male mice. These findings suggested that the accumulation of EGFP+ T cells in Foxp3ΔEGFP male mice is due to a net proliferative advantage over EGFP– T cells.– T cells.–
In addition to their heightened proliferation, EGFP+ T cells from the spleen and lymph nodes of Foxp3ΔEGFP male mice had higher produc-tion of T helper type 1 (TH1) and TH2 cytokines than did their EGFP–
counterparts (Fig. 4g,h). Dual staining with monoclonal antibodies specific for IL-4 and interferon-γ (IFN-γ) showed that most EGFP+
T cells produced one or the other cytokine, suggesting that they had already differentiated into TH1 or TH2 effector cells (data not shown). In contrast, EGFP+ T cells produced less IL-2 than did EGFP– T cells (Fig.4g,h). These results indicated that EGFP+ T cells might account for a substantial proportion of the exaggerated TH1 or TH2 cytokine production characteristic of Foxp3 deficiency12.
Flow cytometry of EGFP+ CD4+ peripheral T cells from Foxp3ΔEGFP/+
females showed that like their counterparts from male mice, they expressed several cell surface markers characteristic of Tregexpressed several cell surface markers characteristic of Tregexpressed several cell surface markers characteristic of T cells, includ-reg cells, includ-reging CD25, CTLA-4, GITR and CD44 (Fig. 5a) and produced little IL-2 and more IL-4 and IFN-γ than did EGFP– CD4– CD4– + T cells (Fig. 5b). These results confirmed that the phenotypic and functional characteristics of CD4+ T cells expressing the nonfunctional Foxp3-EGFP fusion protein were cell autonomous and were not simply a function of the dysregu-lated immune environment associated with Foxp3 deficiency. However, the peripheral lymphoid tissues of Foxp3ΔEGFP/+ females had many fewer EGFP+ T cells than those of Foxp3EGFP/+ heterozygous female control mice (Fig. 5c). This was more accentuated in nonlymphoid organs (data not shown) and was associated with heightened apoptosis, as demon-strated by more detection of activated caspase 3 in freshly isolated EGFP+
CD4+ T cells from Foxp3ΔEGFP/+ females (Fig. 5c). Notably, the EGFP+
T cells from Foxp3ΔEGFP/+ females underwent more programmed cell death than did EGFP– T cells from the same mice or EGFP– T cells from the same mice or EGFP– + and EGFP– T – T –
cells from control Foxp3EGFP/+ female mice. These results suggested that T cells expressing the nonfunctional Foxp3-EGFP fusion protein were at a survival disadvantage relative to their normal Trega survival disadvantage relative to their normal Trega survival disadvantage relative to their normal T cell counterparts.reg cell counterparts.reg
Next we examined the capacity of EGFP– T cells to convert to EGFP– T cells to convert to EGFP– +
T cells after transfer of the former into a lymphopenic environment. We transferred equal numbers of EGFP+ and EGFP– CD4– CD4– + T cells from
4 ADVANCE ONLINE PUBLICATION NATURE IMMUNOLOGY
EGFP, I-Ad, CD4Foxp3 ∆EGFP
Foxp3 EGFP
Live cell gate CD4+CD8+ CD45+EGFP+ CD45+EGFP– CD4+CD8–
CD8 EGFP TCRβ CD4
Foxp3 EGFP
Foxp3 ∆EGFP
CD
4
CD
45
CD
69
EG
FP
102103104105
102 103104105
102103104105
102 103104 105
102103 104105
102 103104105
102103104105
102103104105
102103104105
102103 104 105
102
103
104
105
102
103
104
105
102
103
104105
102
103
104
105
102
103
104
105
102
103
104
105
102
103
104
105
102
103
104
105
102
103
104
105
102
103
104
105
83
78
99 0.2
99 0.1
72
78
14
7
94
6
3
96
Max
. (%
)
GITR CTLA-4 CD25 CD103
CD127 CD44 CD69 CD24
Foxp3 ∆EGFP
Foxp3 EGFP
Foxp3 EGFP EGFP– CD4+
EGFP+ CD45+
EGFP+ CD45+
Fox
p3
CD4+CD8+ CD4+CD8–
102103104105 102103104105
102103104105 102103104105
102
103
104
105
102
103
104
105
102
103
104
105
102
103
104
1050.2 0.1
99
2.21.5
95
0.2 0.1
99
2.2 2.3
95 Cel
ls (
×10
5 )C
ells
(×
105 )
02468
10
02468
10EGFP+
Foxp3+
Foxp3 ∆EGFP/+Foxp3 EGFP/+
CD4+ CD8
–
CD4+ CD8
+
Tota
lEGFP
Max
. (%
)GITR CTLA-4 CD25 CD103
CD127 CD44 CD69 CD24Foxp3 ∆EGFP/+
Foxp3+ EGFP+ CD4+
Foxp3+ EGFP– CD4+
Foxp3– EGFP– CD4+
Foxp3 ∆EGFP/+ Foxp3 EGFP/+
7-A
AD
Annexin V
92 98
4
3
0.4
2102103104105102103104105
102
103
104
105
102
103
104
105
Apo
ptos
is (
%) EGFP+ CD45+
Foxp3 ∆EGFP/+ Foxp3 EGFP/+
Foxp3 ∆EGFP/+
Foxp3 EGFP/+
02468
10
a b c
d e f
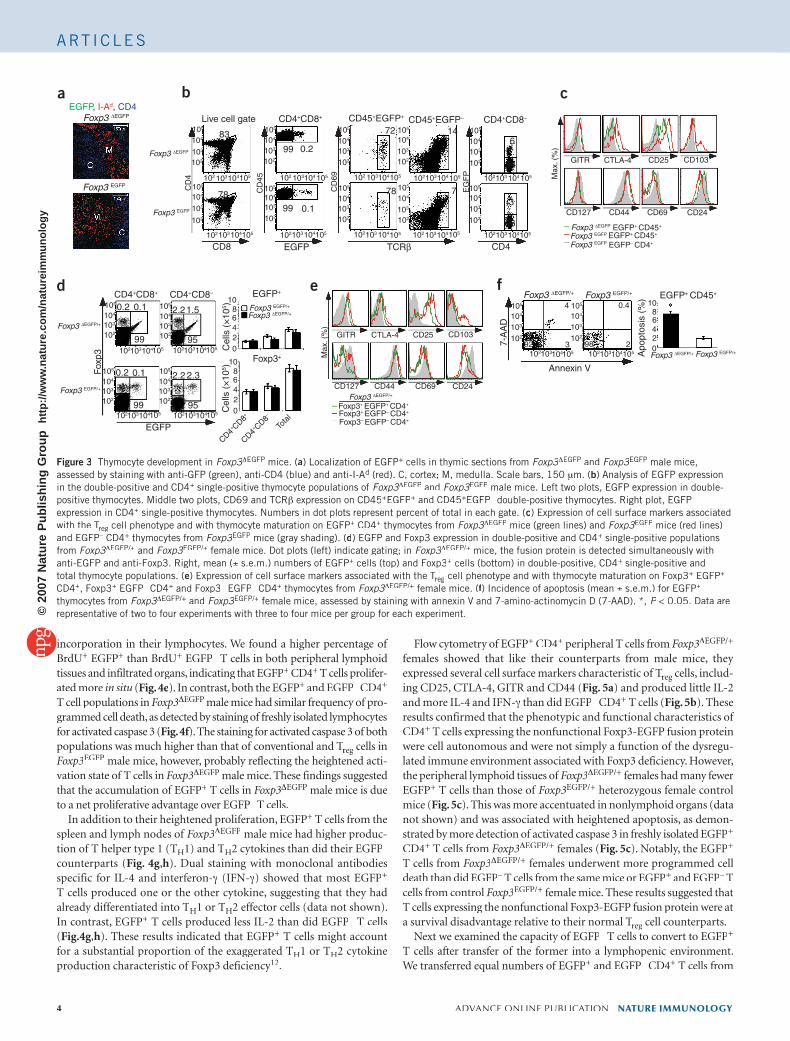
Figure 3 Thymocyte development in Foxp3ΔFoxp3ΔFoxp3 EGFP mice. (a) Localization of EGFP+ cells in thymic sections from Foxp3ΔFoxp3ΔFoxp3 EGFP and Foxp3EGFP male mice, assessed by staining with anti-GFP (green), anti-CD4 (blue) and anti-I-Ad (red). C, cortex; M, medulla. Scale bars, 150 μm. (b) Analysis of EGFP expression in the double-positive and CD4+ single-positive thymocyte populations of Foxp3ΔFoxp3ΔFoxp3 EGFP and Foxp3EGFP male mice. Left two plots, EGFP expression in double-positive thymocytes. Middle two plots, CD69 and TCRβ expression on CD45+EGFP+ and CD45+EGFP– double-positive thymocytes. Right plot, EGFP – double-positive thymocytes. Right plot, EGFP –
expression in CD4+ single-positive thymocytes. Numbers in dot plots represent percent of total in each gate. (c) Expression of cell surface markers associated with the Tregwith the Tregwith the T cell phenotype and with thymocyte maturation on EGFP+ CD4+ thymocytes from Foxp3ΔFoxp3ΔFoxp3 EGFP mice (green lines) and Foxp3EGFP mice (red lines) and EGFP– CD4– CD4– + thymocytes from Foxp3EGFP mice (gray shading). (d) EGFP and Foxp3 expression in double-positive and CD4+ single-positive populations from Foxp3ΔFoxp3ΔFoxp3 EGFP/+ and Foxp3EGFP/+ female mice. Dot plots (left) indicate gating; in Foxp3ΔFoxp3ΔFoxp3 EGFP/+ mice, the fusion protein is detected simultaneously with anti-EGFP and anti-Foxp3. Right, mean (± s.e.m.) numbers of EGFP+ cells (top) and Foxp3+ cells (bottom) in double-positive, CD4+ single-positive and total thymocyte populations. (e) Expression of cell surface markers associated with the Treg) Expression of cell surface markers associated with the Treg) Expression of cell surface markers associated with the T cell phenotype and with thymocyte maturation on Foxp3+ EGFP+
CD4+, Foxp3+ EGFP– CD4– CD4– + and Foxp3– EGFP– EGFP– – CD4– CD4– + thymocytes from Foxp3ΔFoxp3ΔFoxp3 EGFP/+ female mice. (f) Incidence of apoptosis (mean ± s.e.m.) for EGFP+
thymocytes from Foxp3ΔFoxp3ΔFoxp3 EGFP/+ and Foxp3EGFP/+ female mice, assessed by staining with annexin V and 7-amino-actinomycin D (7-AAD). *, P < 0.05. Data are representative of two to four experiments with three to four mice per group for each experiment.
ART ICLES©
2007
Nat
ure
Pub
lishi
ng G
roup
ht
tp://
ww
w.n
atur
e.co
m/n
atur
eim
mun
olog
y
Foxp3ΔEGFP male mice into SCID (severe combined immunodeficient) mice and assessed proliferation of the adoptively transferred lympho-cytes and development of colitis (precipitated by the lack of Tregcytes and development of colitis (precipitated by the lack of Tregcytes and development of colitis (precipitated by the lack of T cells)reg cells)reg
31. Adoptively transferred EGFP– T cells expanded their populations in SCID – T cells expanded their populations in SCID –
hosts, and SCID recipients of EGFP– T cells developed colitis, as demon-– T cells developed colitis, as demon-–
strated by diarrhea, weight loss and pathological findings within 6–8 weeks (Fig. 6a and data not shown). SCID recipients of EGFPFig. 6a and data not shown). SCID recipients of EGFPFig. 6a – T cells contained, – T cells contained, –
on average, less than 0.5% EGFP+ T cells in the spleen or mesenteric lymph nodes (Fig. 6b and data not shown). In contrast, adoptively transferred EGFP+ CD4+ T cells failed to proliferate in SCID hosts, were undetectable in peripheral lymphoid organs and did not cause colitis. Further analysis showed the presence of very few EGFP+ CD4+ T cells in the lungs of SCID recipients (Fig. 6b). A few EGFP– CD4– CD4– + T cells were also present in the lung and spleen, probably representing the population expansion of the few contaminating EGFP– T cells in the transfer population.– T cells in the transfer population.–
To determine if the failure of EGFP+ CD4+ T cells to expand their populations in a lymphopenic environment reflected a requirement for EGFP– CD4+ T cells in this process, we gave SCID mice EGFP– CD4+
T cells alone or together with EGFP+ CD4+ T cells at a ratio of 1:0.2. Only mice receiving EGFP– CD4– CD4– + T cells alone or in combination with EGFP+ CD4+ T cells developed colitis (Fig. 6c). The latter group had EGFP+ CD4+ T cells in their spleens at ratios that approached the ratio of EGFP+ CD4+ T cells in the transferred population. However, we did not detect EGFP+ CD4+ in mesenteric lymph nodes draining the colitic lesions. We detected a few EGFP+ CD4+ T cells in the lung (Fig. 6d). These data collectively indicated that in a lymphopenic environment, EGFP– CD4+ T cells acted as distinct population that did not freely convert into EGFP+ CD4+ T cells. They also demonstrate a dependence of EGFP+ CD4+ T cells on EGFP– CD4– CD4– + T cells for survival in a lym-phopenic environment.
‘Genetic signature’ of Foxp3ΔFoxp3ΔFoxp3 EGFP T cellsTo determine whether EGFP+ CD4+ T cells in Foxp3ΔEGFP mice shared a common molecular ‘signature’ with Trega common molecular ‘signature’ with Trega common molecular ‘signature’ with T cells, we did a comparative
microarray analysis of four different cell populations derived from spleens and lymph nodes of Foxp3EGFP and Foxp3ΔEGFP male mice. We prepared total RNA from purified cells, amplified it and used it to gen-erate probes for Affymetrix 430 2.0 chips. We identified the subset of probe sets whose expression increased or decreased by twofold or more in any comparison. We also compared our results with published gene expression profiles of Tregexpression profiles of Tregexpression profiles of T cells and conventional T cellsreg cells and conventional T cellsreg
32.We first compared the expression profiles of EGFP+ CD4+ cells from
Foxp3ΔEGFP and Foxp3EGFP mice with those of conventional EGFP– CD4– CD4– +
T cells from Foxp3EGFP mice. We identified a total of 514 probe sets cor-responding to 413 unique genes as being common to EGFP+ CD4+ cells from Foxp3ΔEGFP and Foxp3EGFP mice. Of these, 242 genes were overex-pressed and 171 were underexpressed relative to their expression in con-ventional T cells. ‘Interrogation’ of the probes using published gene array data32 with the latter set at 1.5- and 2-fold cutoffs showed concordance rates of 72% and 56%, respectively (Supplementary Table 1 online).
We then compared EGFP+ and EGFP– CD4– CD4– + cells in each mouse and derived a gene set common to both comparison groups. By incorporat-ing into the analysis comparison of EGFP+ and EGFP– CD4– CD4– + cells from Foxp3ΔEGFP mice, the contribution of the generalized T cell activation state in these mice (which involved both cell populations) to the results was minimized, as many of the genes associated with the Tregwas minimized, as many of the genes associated with the Tregwas minimized, as many of the genes associated with the T cell ‘genetic reg cell ‘genetic regsignature’ were also expressed in activated T cells. With this approach, we identified a total of 163 probe sets corresponding to 133 unique genes as being common to EGFP+ CD4+ T cells in Foxp3ΔEGFP and Foxp3EGFP
mice (Supplementary Table 2 online). Of these, 83 genes were overex-pressed and 50 were underexpressed relative to their expression in the respective EGFP– CD4– CD4– + cells. ‘Interrogation’ of the identified probe sets using the published array data32 with the latter set at 1.5- and 2-fold cutoffs showed concordance rates of 71% and 49%, respectively. These results indicated that a plurality of the genes identified were constituents of a Tregof a Tregof a T cell ‘genetic signature’ shared across different data sets.reg cell ‘genetic signature’ shared across different data sets.reg
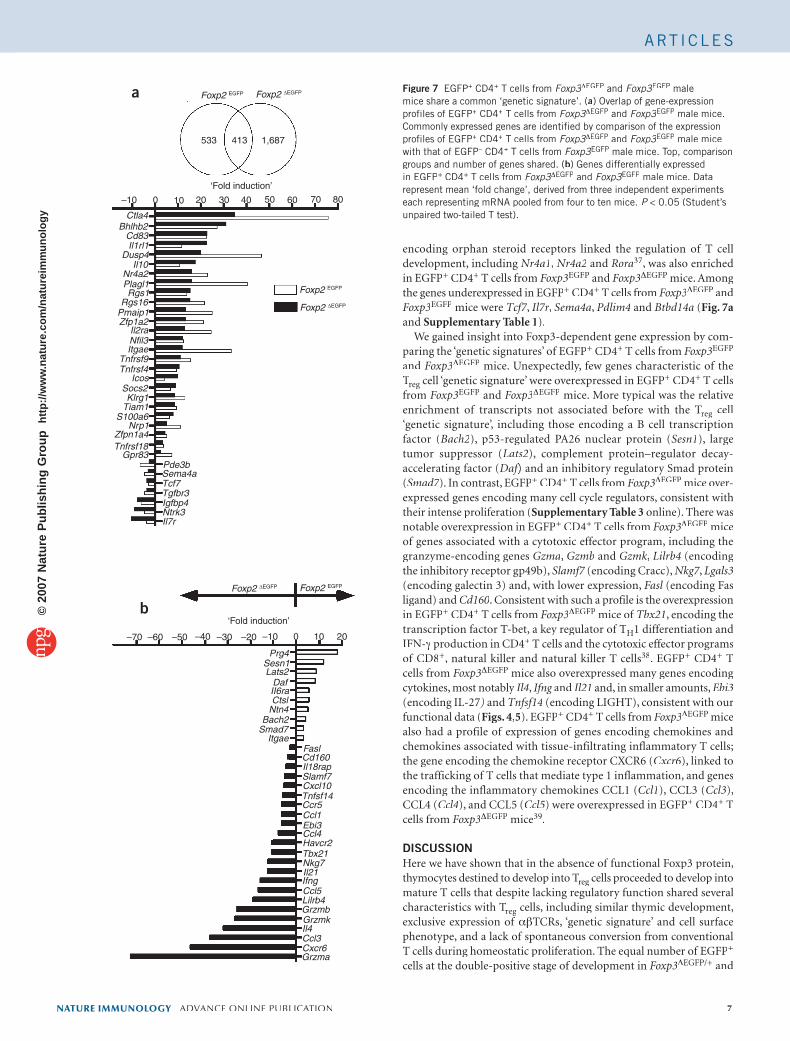
Examination of the identified common genes resulted in several findings (Fig. 7). First, the shared ‘genetic signature’ of EGFP+ CD4+
NATURE IMMUNOLOGY ADVANCE ONLINE PUBLICATION 5
0
5
10
15
20
0
0.3
0.6
0.9
1.2
0
5
10
15
20
0
0.3
0.6
0.9
1.2
EG
FP
+ C
D4+
(×
106 )
EG
FP
+ C
D4+
(%
)
EG
FP
+ C
D4+
(×
106 )
EG
FP
+ C
D4+
(%
)
Spleen Lymph nodes
Foxp3 ∆EGFP
Foxp3 EGFP
0
10
20
30
00.51.01.5
2.02.5
0
10
20
30
40
0
0.2
0.4
0.6
EG
FP
+ C
D4+
(%
)
EG
FP
+ C
D4+
(×
105 )
EG
FP
+ C
D4+
(×
106 )
EG
FP
+ C
D4+
(%
)
Lung Liver
0123456
Foxp3 ∆EGFP
Foxp3 EGFPA
ctiv
e ca
spas
aae
3 (%
)
EGFP– C
D4+
EGFP+ C
D4+
EGFP– C
D4+
EGFP+ C
D4+0
123456
EGFP– C
D4+
EGFP+ C
D4+
EGFP– C
D4+
EGFP+ C
D4+
Lung MLN
Brd
U+ (
%)
Isot
ype
IL-2
EGFP
IL-4
IFN
-γ
100 101 102 103 104 100 101 102 103 104
100 101 102 103 104 100 101 102 103 104
0.1 0.2
0.2
2 3
8.5 10
22
64
2
12
6
78
3
13
0
10
20
30
40
E–
E+
E–
E+
E–
E+
a b c d
e f g h
IL-2 IL-4 IFN-γ
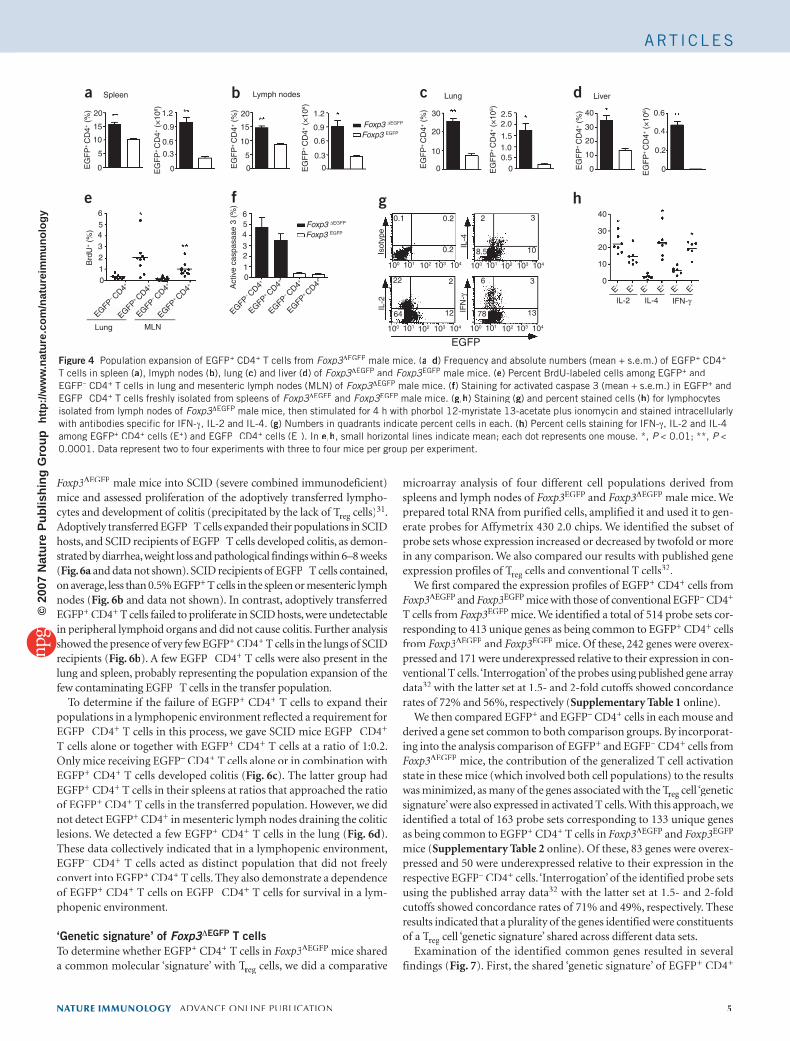
Figure 4 Population expansion of EGFP+ CD4+ T cells from Foxp3ΔFoxp3ΔFoxp3 EGFP male mice. (a–d) Frequency and absolute numbers (mean + s.e.m.) of EGFP+ CD4+
T cells in spleen (a), lmyph nodes (b), lung (c) and liver (d) of Foxp3ΔFoxp3ΔFoxp3 EGFP and Foxp3EGFP male mice. (e) Percent BrdU-labeled cells among EGFP+ and EGFP– CD4– CD4– + T cells in lung and mesenteric lymph nodes (MLN) of Foxp3ΔFoxp3ΔFoxp3 EGFP male mice. (f) Staining for activated caspase 3 (mean + s.e.m.) in EGFP+ and EGFP– CD4– CD4– + T cells freshly isolated from spleens of Foxp3ΔFoxp3ΔFoxp3 EGFP and Foxp3EGFP male mice. (g,h) Staining (g) and percent stained cells (h) for lymphocytes isolated from lymph nodes of Foxp3ΔFoxp3ΔFoxp3 EGFP male mice, then stimulated for 4 h with phorbol 12-myristate 13-acetate plus ionomycin and stained intracellularly with antibodies specific for IFN-γ, IL-2 and IL-4. (g) Numbers in quadrants indicate percent cells in each. (h) Percent cells staining for IFN-γ, IL-2 and IL-4 among EGFP+ CD4+ cells (E+) and EGFP– CD4– CD4– + cells (E–). In e,h, small horizontal lines indicate mean; each dot represents one mouse. *, P < 0.01; **, P <0.0001. Data represent two to four experiments with three to four mice per group per experiment.
ART ICLES©
2007
Nat
ure
Pub
lishi
ng G
roup
ht
tp://
ww
w.n
atur
e.co
m/n
atur
eim
mun
olog
y
T cells in Foxp3ΔEGFP and Foxp3EGFP mice included most of the genes identified as being characteristic of the Tregidentified as being characteristic of the Tregidentified as being characteristic of the T cell lineage, including (among others) Il2ra, Ctla4, Itgae, Cd83, Gpr83, Gzmb, Ikzf2, Icos, Il1r2, Il1rl1, Klrg1, S100a4, S100a6, Tiam1, Tnfrsf4, Tnfrsf9 and Tnfrsf9 and Tnfrsf9 Tnfrsf18 (refs. 32–35; Fig. 7a and Supplementary Table 1). Examination of the rela-tive expression of each gene in EGFP+ CD4+ T cells from Foxp3EGFP
and Foxp3ΔEGFP mice suggested that the phenotype of cells from the latter mice was closer to that of CD25lo activated Treg activated Treg activated T cells (lower expression of Cd25, Gpr83 and Itgae and higher expression of Il1rl1
and Icos). The subset of genes that remained overexpressed in EGFP+
CD4+ T cells from Foxp3EGFP and Foxp3ΔEGFP mice after the contri-bution of EGFP– CD4+ T cells from Foxp3EGFP and Foxp3ΔEGFP mice was ‘filtered out’ (Supplementary Table 2) included several canoni-cal markers of the Tregcal markers of the Tregcal markers of the T cell ‘genetic signature’, such as Ctla4, Il2ra, Itgae, Il10, Socs2, Traf1, Nfil3 and Nrp1. Another gene of interest that emerged from the second analysis was Bhlhb2; deficiency in this gene is associated with autoimmunity and lymphoproliferation36. Expression of genes encoding cell signaling regulators, such as Dusp4, and those
6 ADVANCE ONLINE PUBLICATION NATURE IMMUNOLOGY
PBSEGFP+
EGFP–
0 1 2 3 4 5 6 7 8–20
–10
0
10
20 150
100
50
0
PBS
EGFP+
EGFP–
Cel
ls (
×10
4 )
Spleen Lung
Cel
ls (
×10
4 )
0
5
10
15
PBS
EGFP+
EGFP–
CD4+EGFP+ T cellsTotal CD4+ T cells
PBS
EGFP+
EGFP–
Mixe
d PBS
EGFP+
EGFP–
Mixe
d
Cel
ls (
×10
4 )
Cel
ls (
×10
4 )
0
0.5
1.0
0
5
10
15
20
25Spleen Lung
Transferred populations
0 1 2 3 4 5 6–20
–10
0
10
20
PBS
EGFP+
EGFP–
Mixed
Wei
ght c
hang
e (%
)W
eigh
t cha
nge
(%)
Transferred populationsTime (weeks)
a b
c d
Time (weeks)
Figure 6 EGFP– CD4– CD4– + T cells from Foxp3ΔFoxp3ΔFoxp3 EGFP
mice do not convert to EGFP+ CD4+ T cells after adoptive transfer into lymphopenic hosts. (a,b) Weight change (a) and cell counts (b) after injection of vehicle alone (PBS) or 5 × 10⁵
purified EGFP– or EGFP– or EGFP– + CD4+ T cells from Foxp3ΔFoxp3ΔFoxp3 EGFP mice into SCID recipient mice. (a) Weight change, tracked over 8 weeks after injection. †, P = 0.03, versus PBS group (Mann-Whitney U-test). (b) Total (+ s.e.m.) CD4+ T cells or EGFP+ CD4+ T cells in spleens and lungs of recipient mice. Results are pooled from four independent experiments with three to five mice per group per experiment. (c,d) Weight change (c) and cell counts (d) after injection of 2 × 10⁵
EGFP+ CD4+ T cells, 1.2 × 10⁶ EGFP– CD4– CD4– + T cells or a combination of 1 × 10⁶ EGFP– CD4– CD4– +
plus 2 × 10⁵ EGFP+ CD4+ T cells (Mixed) into SCID host mice; control mice received PBS alone. (c) Weight change, tracked over 6 weeks after injection. (d) EGFP+ CD4+ T cells (+ s.e.m.) in spleens and lungs of recipient mice. *, P < 0.01.Results are representative of two independent experiments with three to five mice per group per experiment.
100 101 102 103 104100 101 102 103 104100 101 102 103 104100 101 102 103 104 100 101 102 103 104 100 101 102 103 104
100 101 102 103 104100 101 102 103 104100 101 102 103 104 100 101 102 103 104100 101 102 103 104100 101 102 103 104
100 101 102 103 104
49R1 R2
0.82
0.05
5
44
9
26
56
89
94
65
5
51
13
65
GITRCTL-4CD62LCD44CD69CD25
EGFP
CD
4
E–
E+
E–
E+
E–
E+
0
1
3
45
2
6
Cyt
okin
e-pr
oduc
ing
cells
(%
)
Cyt
okin
e-pr
oduc
ing
cells
(%
)
0
15
30
45
60
IL-2 IL-2 IFN-γ
0
1.5
3.0
4.5
6.0
0
0.25
0.50
0.75
0
2.5
5.0
7.5
10.0
EG
FP
+ C
D4+
(%
)
EG
FP
+ C
D4+
(×
106 )
Act
ive
casp
ase
3 (%
)
EGFP+ C
D4+
EGFP– C
D4+
EGFP+ C
D4+
EGFP– C
D4+
Foxp3 EGFP/+
Foxp3 ∆EGFP/+
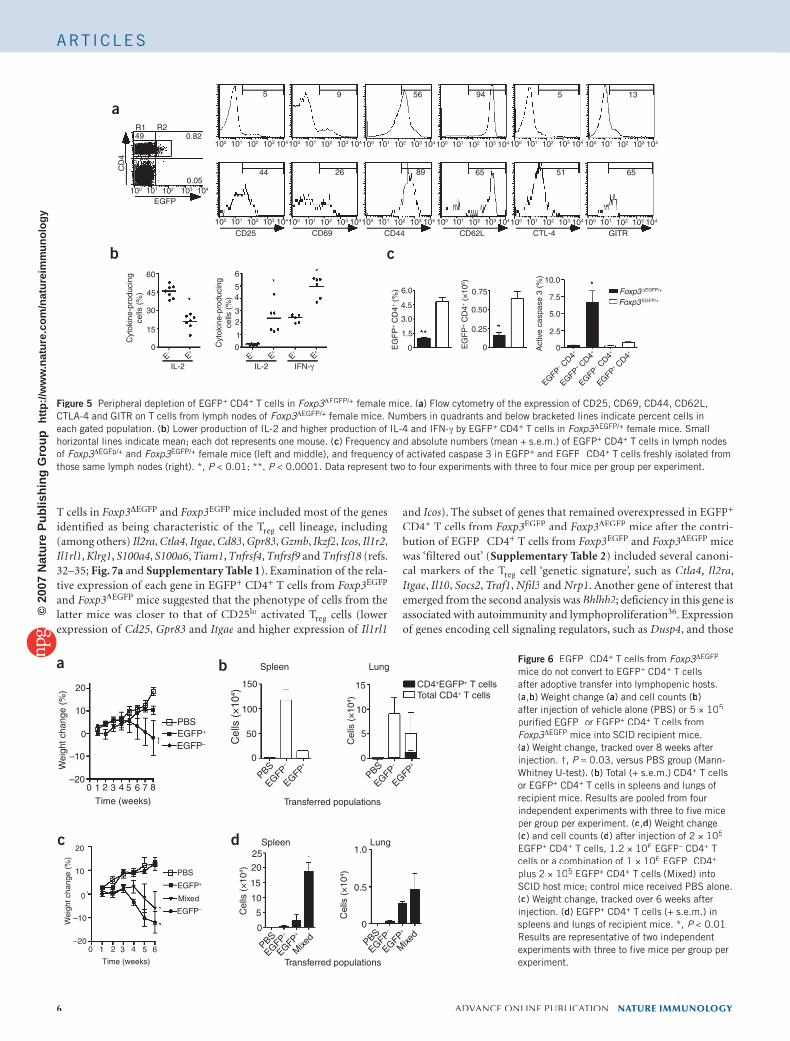
a
b c
Figure 5 Peripheral depletion of EGFP+ CD4+ T cells in Foxp3ΔFoxp3ΔFoxp3 EGFP/+ female mice. (a) Flow cytometry of the expression of CD25, CD69, CD44, CD62L, CTLA-4 and GITR on T cells from lymph nodes of Foxp3ΔFoxp3ΔFoxp3 EGFP/+ female mice. Numbers in quadrants and below bracketed lines indicate percent cells in each gated population. (b) Lower production of IL-2 and higher production of IL-4 and IFN-γ by EGFP+ CD4+ T cells in Foxp3ΔFoxp3ΔFoxp3 EGFP/+ female mice. Small horizontal lines indicate mean; each dot represents one mouse. (c) Frequency and absolute numbers (mean + s.e.m.) of EGFP+ CD4+ T cells in lymph nodes of Foxp3ΔFoxp3ΔFoxp3 EGFp/+ and Foxp3EGFP/+ female mice (left and middle), and frequency of activated caspase 3 in EGFP+ and EGFP– CD4– CD4– + T cells freshly isolated from those same lymph nodes (right). *, P < 0.01; **, P < 0.0001. Data represent two to four experiments with three to four mice per group per experiment.
ART ICLES©
2007
Nat
ure
Pub
lishi
ng G
roup
ht
tp://
ww
w.n
atur
e.co
m/n
atur
eim
mun
olog
y
encoding orphan steroid receptors linked the regulation of T cell development, including Nr4a1, Nr4a2 and Rora37, was also enriched in EGFP+ CD4+ T cells from Foxp3EGFP and Foxp3ΔEGFP mice. Among the genes underexpressed in EGFP+ CD4+ T cells from Foxp3ΔEGFP and Foxp3EGFP mice were Tcf7, Il7r, Sema4a, Pdlim4 and Btbd14a (Fig. 7aand Supplementary Table 1).
We gained insight into Foxp3-dependent gene expression by com-paring the ‘genetic signatures’ of EGFP+ CD4+ T cells from Foxp3EGFP
and Foxp3ΔEGFP mice. Unexpectedly, few genes characteristic of the TregTregT cell ‘genetic signature’ were overexpressed in EGFP+ CD4+ T cells from Foxp3EGFP and Foxp3ΔEGFP mice. More typical was the relative enrichment of transcripts not associated before with the Tregenrichment of transcripts not associated before with the Tregenrichment of transcripts not associated before with the T cell ‘genetic signature’, including those encoding a B cell transcription factor (Bach2), p53-regulated PA26 nuclear protein (Sesn1), large tumor suppressor (Lats2), complement protein–regulator decay-accelerating factor (Daf) and an inhibitory regulatory Smad protein Daf) and an inhibitory regulatory Smad protein Daf(Smad7). In contrast, EGFP+ CD4+ T cells from Foxp3ΔEGFP mice over-expressed genes encoding many cell cycle regulators, consistent with their intense proliferation (Supplementary Table 3 online). There was notable overexpression in EGFP+ CD4+ T cells from Foxp3ΔEGFP mice of genes associated with a cytotoxic effector program, including the granzyme-encoding genes Gzma, Gzmb and Gzmk, Lilrb4 (encoding the inhibitory receptor gp49b), Slamf7 (encoding Cracc), Slamf7 (encoding Cracc), Slamf7 Nkg7, Lgals3(encoding galectin 3) and, with lower expression, Fasl (encoding Fas Fasl (encoding Fas Faslligand) and Cd160. Consistent with such a profile is the overexpression in EGFP+ CD4+ T cells from Foxp3ΔEGFP mice of Tbx21, encoding the transcription factor T-bet, a key regulator of TH1 differentiation and IFN-γ production in CD4+ T cells and the cytotoxic effector programs of CD8+, natural killer and natural killer T cells38. EGFP+ CD4+ T cells from Foxp3ΔEGFP mice also overexpressed many genes encoding cytokines, most notably Il4, Ifng and Ifng and Ifng Il21 and, in smaller amounts, Ebi3(encoding IL-27) and Tnfsf14 (encoding LIGHT), consistent with our functional data (Figs. 4,5). EGFP+ CD4+ T cells from Foxp3ΔEGFP mice also had a profile of expression of genes encoding chemokines and chemokines associated with tissue-infiltrating inflammatory T cells; the gene encoding the chemokine receptor CXCR6 (Cxcr6), linked to the trafficking of T cells that mediate type 1 inflammation, and genes encoding the inflammatory chemokines CCL1 (Ccl1), CCL3 (Ccl3), CCL4 (Ccl4), and CCL5 (Ccl5) were overexpressed in EGFP+ CD4+ T cells from Foxp3ΔEGFP mice39.
DISCUSSIONHere we have shown that in the absence of functional Foxp3 protein, thymocytes destined to develop into Tregthymocytes destined to develop into Tregthymocytes destined to develop into T cells proceeded to develop into reg cells proceeded to develop into regmature T cells that despite lacking regulatory function shared several characteristics with Tregcharacteristics with Tregcharacteristics with T cells, including similar thymic development, exclusive expression of αβTCRs, ‘genetic signature’ and cell surface phenotype, and a lack of spontaneous conversion from conventional T cells during homeostatic proliferation. The equal number of EGFP+
cells at the double-positive stage of development in Foxp3ΔEGFP/+ and
NATURE IMMUNOLOGY ADVANCE ONLINE PUBLICATION 7
Prg4Sesn1Lats2
DafII6raCtsl
Ntn4Bach2
Smad7Itgae
FaslCd160Il18rapSlamf7Cxcl10Tnfsf14Ccr5Ccl1Ebi3Ccl4Havcr2Tbx21Nkg7Il21IfngCcl5Lilrb4GrzmbGrzmkIl4Ccl3Cxcr6Grzma
Ctla4Bhlhb2
Cd83Il1rl1
Dusp4Il10
Nr4a2Plagl1Rgs1
Rgs16Pmaip1Zfp1a2
Il2raNfil3Itgae
Tnfrsf9Tnfrsf4
IcosSocs2Klrg1
Tiam1S100a6
Nrp1Zfpn1a4Tnfrsf18
Gpr83Pde3bSema4aTcf7Tgfbr3Igfbp4Ntrk3Il7r
‘Fold induction’
–10 0 10 20 30 40 50 60 70 80
–70 –60 –50 –40 –30 –20 –10 0 10 20
‘Fold induction’
413533 1,687
Foxp2 EGFP Foxp2 ∆EGFP
Foxp2 ∆EGFP Foxp2 EGFP
Foxp2 EGFP
Foxp2 ∆EGFP
a
b
Figure 7 EGFP+ CD4+ T cells from Foxp3ΔFoxp3ΔFoxp3 EGFP and Foxp3EGFP male mice share a common ‘genetic signature’. (a) Overlap of gene-expression profiles of EGFP+ CD4+ T cells from Foxp3ΔFoxp3ΔFoxp3 EGFP and Foxp3EGFP male mice. Commonly expressed genes are identified by comparison of the expression profiles of EGFP+ CD4+ T cells from Foxp3ΔFoxp3ΔFoxp3 EGFP and Foxp3EGFP male mice with that of EGFP– CD4– CD4– + T cells from Foxp3EGFP male mice. Top, comparison groups and number of genes shared. (b) Genes differentially expressed in EGFP+ CD4+ T cells from Foxp3ΔFoxp3ΔFoxp3 EGFP and Foxp3EGFP male mice. Data represent mean ‘fold change’, derived from three independent experiments each representing mRNA pooled from four to ten mice. P < 0.05 (Student’s P < 0.05 (Student’s Punpaired two-tailed T test).
ART ICLES©
2007
Nat
ure
Pub
lishi
ng G
roup
ht
tp://
ww
w.n
atur
e.co
m/n
atur
eim
mun
olog
y
Foxp3EGFP/+ female mice indicated that Treg female mice indicated that Treg female mice indicated that T cell lineage commitment occurred before Foxp3 expression. EGFP+ T cells in both Foxp3ΔEGFP
male and Foxp3ΔEGFP/+ female mice continued down this developmen-tal pathway and displayed a mature cell surface phenotype characteristic of functional Tregof functional Tregof functional T cells. Although Foxp3 may have some function in determining the amount of expression of surface molecules, as sug-gested by other data, the Treggested by other data, the Treggested by other data, the T cell–like phenotype was independent of Foxp3. Thymi of Foxp3ΔEGFP/+
regEGFP/+
reg and Foxp3EGFP/+ female mice contained
equal numbers of Foxp3+ T cells, indicating that Foxp3 did not directly influence either the positive or negative selection of Treginfluence either the positive or negative selection of Treginfluence either the positive or negative selection of T cells. A few mature Tregmature Tregmature T cell precursors in the thymi of Foxp3ΔEGFP/+
regEGFP/+
reg female mice
showed signs of apoptosis, and there were many fewer of such cells in the periphery. This suggested that the function of Foxp3 in Tregthe periphery. This suggested that the function of Foxp3 in Tregthe periphery. This suggested that the function of Foxp3 in T cell sur-reg cell sur-regvival is linked to the development of Tregvival is linked to the development of Tregvival is linked to the development of T cell effector function. Whether reg cell effector function. Whether regthis putative survival function is intrinsic to Tregthis putative survival function is intrinsic to Tregthis putative survival function is intrinsic to T cells or is the result of Foxp3-induced resistance to other mechanisms of tolerance cannot be determined from our studies.
Some of the attributes that distinguished EGFP+ CD4+ T cells in Foxp3ΔEGFP mice from wild-type Treg mice from wild-type Treg mice from wild-type T cells can be directly linked to loss reg cells can be directly linked to loss regof Foxp3 function. Prominent among these were a lack of suppressive activity and enhanced TH1 and TH2 cytokine production; Foxp3 conveys regulatory activity and suppresses cytokine production after its ectopic expression in conventional T cells40–42. However, although Treg. However, although Treg. However, although T cells do reg cells do regnot produce IL-2 after activation and Foxp3 suppresses Il2 transcrip-tion after its ectopic expression in T cells, activated EGFP+ CD4+ T cells from Foxp3ΔEGFP male mice had much less IL-2 expression than did EGFP– CD4– CD4– + T cells from the same mice. The idea that this was not due to intense activation and cytokine polarization in the context of a dysregulated immune system was indicated by the finding that EGFP+
CD4+ T cells from Foxp3ΔEGFP/+ female mice had a similar propensity for less production of IL-2. These results suggested that lower production of IL-2 may be an attribute of cells committed to the TregIL-2 may be an attribute of cells committed to the TregIL-2 may be an attribute of cells committed to the T cell lineage that reg cell lineage that regmay be further accentuated by Foxp3.
Consistent with the ‘bias’ of the TCR repertoire of TregConsistent with the ‘bias’ of the TCR repertoire of TregConsistent with the ‘bias’ of the TCR repertoire of T cells toward self-reactivity, proliferating EGFP+ CD4+ T cells in Foxp3ΔEGFP male mice were present in tissues targeted by the autoimmune response, including lung and liver. Although antibody-mediated depletion of Tregincluding lung and liver. Although antibody-mediated depletion of Tregincluding lung and liver. Although antibody-mediated depletion of Tcells is associated with the precipitation of autoimmunity, the resultant phenotype is less severe than the lethal autoimmune lymphoprolifera-tive process unleashed by Foxp3 deficiency in mice and humans or by toxin-mediated depletion of Tregtoxin-mediated depletion of Tregtoxin-mediated depletion of T cells in micereg cells in micereg
1,19–21,43. Our results would suggest that Foxp3 deficiency results in the emergence of a particularly autoaggressive subset of lymphocytes comprising cells originally des-tined to develop into Tregtined to develop into Tregtined to develop into T cells. However, adoptively transferred EGFPreg cells. However, adoptively transferred EGFPreg
+
CD4+ T cells from Foxp3ΔEGFP mice failed to precipitate disease in the target organs of lymphopenic hosts on their own, indicative of a require-ment for additional lymphocytic elements to foment autoimmunity and tissue infiltration.
After transfer into lymphopenic hosts, EGFP– CD4+ T cells from Foxp3ΔEGFP mice did not appreciably convert to EGFP+ CD4+ T cells during homeostatic proliferation. In addition, homeostatic prolifera-tion of transferred EGFP+ CD4+ T cells occurred only in the presence of cotransferred EGFP– CD4– CD4– + T cells. Notably, the population expan-sion of Tregsion of Tregsion of T cells in a lymphopenic environment is also dependent on conventional T cells, reflecting a potential requirement for conventional T cell–derived IL-2 (ref. 44). In contrast to their greater production of IL-4 and IFN-γ, EGFP+ CD4+ T cells from Foxp3ΔEGFP mice were less effective in their production of IL-2, a phenotype also shared by Tregeffective in their production of IL-2, a phenotype also shared by Tregeffective in their production of IL-2, a phenotype also shared by Tcells. IL-7, a cytokine critical for effective homeostatic proliferation of CD4+ T cells, is dispensable for Treg T cells, is dispensable for Treg T cells, is dispensable for T cell homeostatic population expan-reg cell homeostatic population expan-regsion, as the latter expand their populations normally in IL-7-deficient
hosts45. Consistent with this observation was the finding that EGFP+
CD4+ T cells from Foxp3ΔEGFP mice had very low expression of IL-7 receptor-α.
Gene-expression-profile analysis showed that most transcripts associ-ated with the Tregated with the Tregated with the T cell ‘genetic signature’ were present in EGFPreg cell ‘genetic signature’ were present in EGFPreg
+ CD4+ T cells expressing the nonfunctional Foxp3-EGFP fusion protein; these data indicated that expression of such transcripts and, by extension, the Tregindicated that expression of such transcripts and, by extension, the Tregindicated that expression of such transcripts and, by extension, the Tgenetic program are mostly independent of functional Foxp3 protein. Some TregSome TregSome T cell–associated transcripts, including reg cell–associated transcripts, including reg Itgae, had higher expres-sion in Tregsion in Tregsion in T cells than in EGFPreg cells than in EGFPreg
+ CD4+ T cells from Foxp3ΔEGFP male mice, suggesting that Foxp3 may upregulate the expression of these transcripts. In contrast, many genes involved in cell cycle regulation and in proinflam-matory and cytotoxic T cell activity were overexpressed in EGFP+ CD4+ T cells from Foxp3ΔEGFP male mice. This profile can be interpreted as being a further differentiated form of an already existent cytotoxic function of TregTregT cells that is necessary for their suppressor activityreg cells that is necessary for their suppressor activityreg
46–48 cells that is necessary for their suppressor activity46–48 cells that is necessary for their suppressor activity .Finally, the development and disposition in normal hosts of TregFinally, the development and disposition in normal hosts of TregFinally, the development and disposition in normal hosts of T
cell precursors that fail for some reason to upregulate Foxp3 expres-sion in the thymus is an issue of inherent relevance to the pathogenesis of autoimmunity. The lack of disease in Foxp3ΔEGFP/+ female mice or mothers of patients with IPEX syndrome has been interpreted to reflect the capacity of functional Tregthe capacity of functional Tregthe capacity of functional T cells in such hosts to mediate dominant reg cells in such hosts to mediate dominant regtolerance11,13–15. Our findings extend the understanding of tolerance in carrier females by showing that the periphery is depleted of autoreactive TregTregT cell precursors with mutated reg cell precursors with mutated reg Foxp3 alleles. Whether such cells could develop and persist in certain conditions and contribute to autoimmune disease requires further investigation.
METHODS
Mice. Foxp3EGFP and Foxp3K276X mice were generated as describedK276X mice were generated as describedK276X 12,25. For the generation of Foxp3ΔEGFP mice, Foxp3 genomic DNA was isolated from a bacterial artificial chromosome clone (Genome Systems) and was subcloned into the plasmid vector pKO (Lexicon). An HpaI restriction site was created by site-directed mutagenesis of codons 396 and 397 in exon 11 of Foxp3 (from GTGCGA to GTTAAC). EGFP cDNA followed by a stop codon was inserted in-frame after codon 396 (which continued to encode valine) by blunt-ended ligation at the newly created HpaI site. A phosphoglycerate kinase–neomycin-resistance (PGK-neor) cassette was also inserted at the EcoRI site in intron 9 of Foxp3 in the same orientation as Foxp3 and was flanked by two loxP sites to allow excision by Cre-mediated recombination. The targeting construct also included a diphtheria toxin gene for negative selection against randomly inserted targeting constructs. Targeting plasmids were introduced by electroporation into SCC10 embryonic stem cells, which were subjected to G418 selection. Resistant clones were screened by Southern blot analysis and successfully targeted clones were injected into C57BL/6 blastocysts. Chimeric males were mated with ‘Cre-deleter’ female mice on the BALB/c background that had an allele with constitutive, ubiquitous expression of Cre recombinase49. N1 female mice heterozygous for the Foxp3ΔEGFP allele (minus the PGK-neor cassette) were identified by genotyping. All Foxp3 mutant mouse strains were backcrossed for eight to twelve genera-tions onto the BALB/c background. Mice were housed in specific pathogen–free conditions and were used according to the guidelines of the institutional Animal Research Committees of the University of California in Los Angeles and the Medical College of Wisconsin.
PCR analysis. Screening of the Foxp3ΔEGFP and Foxp3EGFP alleles was achieved by PCR amplification with the following EGFP-specific sense primers: forward, 5ʹ-CGGCAAGCTGACCCTGAAGT-3ʹ; reverse, 5ʹ-GGATGTTGCCGTCCTCCTTG-3ʹ. PCR-based discrimination of wild-type and mutated alleles was accomplished by analysis of the presence of residual loxP sequence retained in the respec-tive allele after Cre-mediated excision of the PGK-neor cassette. Primers used were 5ʹ-GCGTAAGCAGGGCAATAGAGG-3ʹ (sense) and 5ʹ-GCATGAGGT-CAAGGGTGATG-3ʹ (antisense). Real-time PCR for Foxp3 expression was done as described12. Foxp3 expression was normalized to that of the gene encoding hypoxanthine guanine phosphoribosyl transferase.
8 ADVANCE ONLINE PUBLICATION NATURE IMMUNOLOGY
ART ICLES©
2007
Nat
ure
Pub
lishi
ng G
roup
ht
tp://
ww
w.n
atur
e.co
m/n
atur
eim
mun
olog
y
NATURE IMMUNOLOGY VOLUME 8 NUMBER 3 MARCH 2007 9
Flow cytometry. Single-cell suspensions were stained with fluorochrome-conjugated antibodies in PBS containing 5% (wt/vol) BSA (Sigma-Aldrich) and Fc-block (BD Pharmingen), were fixed in 1% (wt/vol) paraformaldehyde and were ana-lyzed on a FACSCalibur or LSRII cytometer (Becton Dickinson). Monoclonal antibodies to the following were obtained from BD Pharmingen: TCRβ (H57), CD3 (2C11), CD4 (L3T4), CD8 (53-6.7), CD11c (HL3), CD25 (PC61), CD28 (37.51), CD62L (MEL14), I-Ad (AMS-32.1), CTLA4 (UC10-4F10-11), CD69 (7E.17G9), GITR (DTA-1), CD103 (M290) and CD45 (2D1), as well as annexin V and anti-BrdU. Intracellular Foxp3 staining was done as described with phy-coerythrin-conjugated anti-mouse Foxp3 (ref. 12; clone FJK-16s; eBioscience). Apoptosis was analyzed by intracellular staining with annexin V plus 7-amino-actinomycin D (BD Biosciences) or with activated caspase 3 (BD Biosciences). For intracellular cytokine staining, lymphocytes were activated for 4 h with phorbol 12-myristate 13-acetate (20 ng/ml) and ionomycin (1 μg/ml) in the presence of brefeldin A (BD Pharmingen). Cells were collected and were processed for intracellular cytokine staining with the Cytofix/Cytoperm kit (BD Pharmingen) according to the manufacturer’s instructions. For isolation of EGFP+ CD4+ T cells, suspensions of splenic and lymph node lymphocytes were first enriched for CD4+ T cells by magnetic-activated cell sorting (Miltenyi Biotec) or on mouse CD4 columns (R&D Systems). The enriched populations were labeled with phy-coerythrin-conjugated monoclonal anti-CD4 and cells were sorted into EGFP+
and EGFP– CD4– CD4– + populations with a FACSAria or FACSVantage SE cell sorter (Becton Dickinson). For assessment of T cell proliferation by incorporation of BrdU, 15-day-old Foxp3ΔEGFP male mice were injected intraperitoneally with 1 mg BrdU. Tissues were collected 2 h after injection and lymphocytes were stained intracellularly with anti-EGFP, anti-CD4 and anti-BrdU.
Suppression assays. Purified splenocytes were cultured in 96-well round-bot-tomed plates in the presence of 1 μg/ml of anti-CD3. The number of responder splenocytes was kept constant at 8 × 10⁴ cells per well, whereas the number of suppressor cells was ‘titrated’ to achieve various ratios. Cultures were maintained for 48 h, then were pulsed with 0.4 μCi/well of [3H]thymidine for an additional 18 h, were collected onto fiber filtermats with a Micro96 collecter (Skatron) and were counted.
Immunocytochemistry. Thymic sections were stained as described25. Sections were visualized by laser-scanning confocal microscopy with a Leica TCS single-positive II microscope equipped with 488-, 568- and 633-nm lasers. Images were collected with Leica acquisition software. Antibodies and emissions collected were as follows: Alexa Fluor 488–conjugated rabbit anti-GFP IgG fraction (Molecular Probes), collected at 500–545 nm; biotinylated monoclonal anti-I-Ad with strep-tavidin–Alexa Fluor 568 (Molecular Probes), collected at 615–700 nm; and allo-phycocyanin-conjugated monoclonal anti-CD4, collected at 650–740 nm.
Gene-expression profiling. CD4+ T cell populations from age-matched Foxp3ΔEGFP and Foxp3EGFP male mice (four to ten mice per experiment) were purified by magnetic bead sorting (Miltenyi), and the respective EGFP+ and EGFP– CD4– CD4– + populations were further purified by flow cytometry. Total RNA was isolated with the RNeasy Mini Kit (Qiagen). Aliquots of 2 μg were subjected to single-round probe amplification with the Affymetrix Small Sample Labeling Protocol II. Amplified probes were fragmented and were applied to Affymetrix GeneChip Mouse Genome 430 2.0 arrays. For analysis of gene-expression mea-sures, all Affymetrix data were normalized with the justRMA algorithm from the Bioconductor group50. Pairwise comparisons were made for all experimental conditions such that probe sets with a change in expression of at least a twofold were ‘selected out’ for further analysis. For comparative analysis of gene-expres-sion profiles (Fig. 7b), results represent mean ‘fold change’ values derived from three independent arrays for the cell type, each representing mRNA pooled from four to ten mice, with statistical analysis by Student’s unpaired two-tailed t-test (P < 0.05). Target expression was confirmed by flow cytometry and/or real time PCR. Because the gene-array probes for Foxp3 are ‘distal’ to the poly(A) start site of the EGFP cassette in the Foxp3EGFP allele, a false-negative result is generated for Foxp3 in Foxp3EGFP T cells.
Accession code. GEO: microarray data, GSE6875.
Note: Supplementary information is available on the Nature Immunology website.
ACKNOWLEDGMENTSWe thank J. Booth, J. Ziegelbauer and B. Edwards for animal care; I. Williams-McClain for cell sorting; and W. Grossman, J. Verbsky and J.M. Routes for critical reading of the manuscript. Supported by the National Institutes of Health (2R01 AI065617 to T.A.C. and R01 AI47154 to C.B.W.), the Nickolett and the D.B. and Marjorie Reinhart Family Foundations (C.B.W.) and the American Heart Association (0525142Y to W.L.).
COMPETING INTERESTS STATEMENTThe authors declare no that they have competing financial interests.
Published online at http://www.nature.com/natureimmunology/Reprints and permissions information is available online at http://npg.nature.com/reprintsandpermissions
1. Sakaguchi, S. Naturally arising CD4+ regulatory T cells for immunologic self-toler-ance and negative control of immune responses. Annu. Rev. Immunol. 22, 531–562 (2004).
2. Fontenot, J.D. & Rudensky, A.Y. A well adapted regulatory contrivance: regulatory T cell development and the forkhead family transcription factor Foxp3. Nat. Immunol.6, 331–337 (2005).
3. Apostolou, I., Sarukhan, A., Klein, L. & von Boehmer, H. Origin of regulatory T cells with known specificity for antigen. Nat. Immunol. 3, 756–763 (2002).
4. Jordan, M.S. et al. Thymic selection of CD4+CD25+ regulatory T cells induced by an agonist self-peptide. Nat. Immunol. 2, 301–306 (2001).
5. Bensinger, S.J., Bandeira, A., Jordan, M.S., Caton, A.J. & Laufer, T.M. Major histo-compatibility complex class II-positive cortical epithelium mediates the selection of CD4+25+ immunoregulatory T cells. J. Exp. Med. 194, 427–438 (2001).
6. Cabarrocas, J. et al. Foxp3+ CD25+ regulatory T cells specific for a neo-self-antigen develop at the double-positive thymic stage. Proc. Natl. Acad. Sci. USA 103, 8453–8458 (2006).
7. Hsieh, C.S., Zheng, Y., Liang, Y., Fontenot, J.D. & Rudensky, A.Y. An intersection between the self-reactive regulatory and nonregulatory T cell receptor repertoires. Nat. Immunol. 7, 401–410 (2006).
8. Pacholczyk, R., Ignatowicz, H., Kraj, P. & Ignatowicz, L. Origin and T cell receptor diversity of Foxp3+CD4+CD25+ T cells. Immunity 25, 249–259 (2006).
9. Lyon, M.F., Peters, J., Glenister, P.H., Ball, S. & Wright, E. The scurfy mouse mutant has previously unrecognized hematological abnormalities and resembles Wiskott-Aldrich syndrome. Proc. Natl. Acad. Sci. USA 87, 2433–2437 (1990).
10. Godfrey, V.L., Wilkinson, J.E. & Russell, L.B. X-linked lymphoreticular disease in the scurfy (sf) mutant mouse. Am. J. Pathol. 138, 1379–1387 (1991).
11. Fontenot, J.D., Gavin, M.A. & Rudensky, A.Y. Foxp3 programs the development and function of CD4+CD25+ regulatory T cells. Nat. Immunol. 4, 330–336 (2003).
12. Lin, W. et al. Allergic dysregulation and hyperimmunoglobulinemia E in Foxp3 mutant mice. J. Allergy Clin. Immunol. 116, 1106–1115 (2005).
13. Chatila, T.A. et al. JM2, encoding a fork head-related protein, is mutated in X-linked autoimmunity-allergic disregulation syndrome. J. Clin. Invest. 106, R75–R81 (2000).
14. Wildin, R.S. et al. X-linked neonatal diabetes mellitus, enteropathy and endocrinopathy syndrome is the human equivalent of mouse scurfy. Nat. Genet. 27, 18–20 (2001).
15. Bennett, C.L. et al. The immune dysregulation, polyendocrinopathy, enteropathy, X-linked syndrome (IPEX) is caused by mutations of FOXP3. Nat. Genet. 27, 20–21 (2001).
16. Kawahata, K. et al. Generation of CD4+CD25+ regulatory T cells from autoreactive T cells simultaneously with their negative selection in the thymus and from nonautoreac-tive T cells by endogenous TCR expression. J. Immunol. 168, 4399–4405 (2002).
17. Hori, S., Nomura, T. & Sakaguchi, S. Control of regulatory T cell development by the transcription factor Foxp3. Science 299, 1057–1061 (2003).
18. van Santen, H.M., Benoist, C. & Mathis, D. Number of T reg cells that differentiate does not increase upon encounter of agonist ligand on thymic epithelial cells. J. Exp. Med. 200, 1221–1230 (2004).
19. Gavin, M.A. et al. Single-cell analysis of normal and FOXP3-mutant human T cells: FOXP3 expression without regulatory T cell development. Proc. Natl. Acad. Sci. USA103, 6659–6664 (2006).
20. Taguchi, O. & Takahashi, T. Administration of anti-interleukin-2 receptor α antibody in vivo induces localized autoimmune disease. Eur. J. Immunol. 26, 1608–1612 (1996).
21. McHugh, R.S. & Shevach, E.M. Cutting edge: depletion of CD4+CD25+ regulatory T cells is necessary, but not sufficient, for induction of organ-specific autoimmune disease. J. Immunol. 168, 5979–5983 (2002).
22. Wu, Y. et al. FOXP3 controls regulatory T cell function through cooperation with NFAT. Cell 126, 375–387 (2006).
23. Stroud, J.C. et al. Structure of the forkhead domain of FOXP2 bound to DNA. Structure14, 159–166 (2006).
24. Lopes, J.E. et al. Analysis of FOXP3 reveals multiple domains required for its function as a transcriptional repressor. J. Immunol. 177, 3133–3142 (2006).
25. Haribhai, D. et al. Regulatory T cells dynamically control the primary immune response to foreign antigen. J. Immunol. (in the press).
26. Bendelac, A., Matzinger, P., Seder, R.A., Paul, W.E. & Schwartz, R.H. Activation events during thymic selection. J. Exp. Med. 175, 731–742 (1992).
27. Feng, C. et al. A potential role for CD69 in thymocyte emigration. Int. Immunol. 14, 535–544 (2002).
ART ICLES©
2007
Nat
ure
Pub
lishi
ng G
roup
ht
tp://
ww
w.n
atur
e.co
m/n
atur
eim
mun
olog
y
10 VOLUME 8 NUMBER 3 MARCH 2007 NATURE IMMUNOLOGY
28. Liu, W. et al. CD127 expression inversely correlates with FoxP3 and suppressive func-tion of human CD4+ T reg cells. J. Exp. Med. 203, 1701–1711 (2006).
29. Seddiki, N. et al. Expression of interleukin (IL)-2 and IL-7 receptors discriminates between human regulatory and activated T cells. J. Exp. Med. 203, 1693–1700 (2006).
30. Huehn, J. et al. Developmental stage, phenotype, and migration distinguish naive- and effector/memory-like CD4+ regulatory T cells. J. Exp. Med. 199, 303–313 (2004).
31. Izcue, A., Coombes, J.L. & Powrie, F. Regulatory T cells suppress systemic and mucosal immune activation to control intestinal inflammation. Immunol. Rev. 212, 256–271 (2006).
32. Fontenot, J.D. et al. Regulatory T cell lineage specification by the forkhead transcription factor Foxp3. Immunity 22, 329–341 (2005).
33. Gavin, M.A., Clarke, S.R., Negrou, E., Gallegos, A. & Rudensky, A. Homeostasis and anergy of CD4+CD25+ suppressor T cells in vivo. Nat. Immunol. 3, 33–41 (2002).
34. Chen, Z., Herman, A.E., Matos, M., Mathis, D. & Benoist, C. Where CD4+CD25+ T reg cells impinge on autoimmune diabetes. J. Exp. Med. 202, 1387–1397 (2005).
35. Sugimoto, N. et al. Foxp3-dependent and -independent molecules specific for CD25+CD4+ natural regulatory T cells revealed by DNA microarray analysis. Int. Immunol. 18, 1197–1209 (2006).
36. Sun, H., Lu, B., Li, R.Q., Flavell, R.A. & Taneja, R. Defective T cell activation and auto-immune disorder in Stra13-deficient mice. Nat. Immunol. 2, 1040–1047 (2001).
37. He, Y.W. Orphan nuclear receptors in T lymphocyte development. J. Leukoc. Biol. 72, 440–446 (2002).
38. Glimcher, L.H., Townsend, M.J., Sullivan, B.M. & Lord, G.M. Recent developments in the transcriptional regulation of cytolytic effector cells. Nat. Rev. Immunol. 4, 900–911 (2004).
39. Kim, C.H. et al. Bonzo/CXCR6 expression defines type 1-polarized T-cell subsets with extralymphoid tissue homing potential. J. Clin. Invest. 107, 595–601 (2001).
40. Khattri, R., Cox, T., Yasayko, S.A. & Ramsdell, F. An essential role for Scurfin in CD4+CD25+ T regulatory cells. Nat. Immunol. 4, 337–342 (2003).
41. Schubert, L.A., Jeffery, E., Zhang, Y., Ramsdell, F. & Ziegler, S.F. Scurfin (FOXP3) acts as a repressor of transcription and regulates T cell activation. J. Biol. Chem. 276, 37672–37679 (2001).
42. Bettelli, E., Dastrange, M. & Oukka, M. Foxp3 interacts with nuclear factor of activated T cells and NF-kappa B to repress cytokine gene expression and effector functions of T helper cells. Proc. Natl. Acad. Sci. USA 102, 5138–5143 (2005).
43. Kim, J.M., Rasmussen, J.P. & Rudensky, A.Y. Regulatory T cells prevent catastrophic autoimmunity throughout the lifespan of mice. Nat. Immunol. 8, 191–197 (2007).
44. Almeida, A.R., Zaragoza, B. & Freitas, A.A. Indexation as a novel mechanism of lym-phocyte homeostasis: the number of CD4+CD25+ regulatory T cells is indexed to the number of IL-2-producing cells. J. Immunol. 177, 192–200 (2006).
45. Peffault de Latour, R. et al. Ontogeny, function, and peripheral homeostasis of regula-tory T cells in the absence of interleukin-7. Blood 108, 2300–2306 (2006).
46. Grossman, W.J. et al. Human T regulatory cells can use the perforin pathway to cause autologous target cell death. Immunity 21, 589–601 (2004).
47. Gondek, D.C., Lu, L.F., Quezada, S.A., Sakaguchi, S. & Noelle, R.J. Cutting edge: contact-mediated suppression by CD4+CD25+ regulatory cells involves a granzyme B-dependent, perforin-independent mechanism. J. Immunol. 174, 1783–1786 (2005).
48. Zhao, D.M., Thornton, A.M., DiPaolo, R.J. & Shevach, E.M. Activated CD4+CD25+ T cells selectively kill B lymphocytes. Blood 107, 3925–3932 (2006).
49. Lakso, M. et al. Efficient in vivo manipulation of mouse genomic sequences at the zygote stage. Proc. Natl. Acad. Sci. USA 93, 5860–5865 (1996).
50. Gentleman, R.C. et al. Bioconductor: open software development for computational biology and bioinformatics. Genome Biol. 5, R80 (2004).
ART ICLES©
2007
Nat
ure
Pub
lishi
ng G
roup
ht
tp://
ww
w.n
atur
e.co
m/n
atur
eim
mun
olog
y