Recommendations for the Use of Antiretroviral Drugs During ...
C
Researc
h LettersAIDS 2006, 20:1669–1677
Foxp3R regulatory T cells in antiretroviral-naiveHIV patients
Martin Montesa,d, Dorothy E. Lewisb, Cesar Sanchezd,Diego Lopez de Castillad, Edward A. Gravissc, CarlosSeasd, Eduardo Gotuzzod and A. Clinton White Jra,b
We characterized regulatory T cells from antire-
troviral-naive HIV patients by flow cytometry. The
proportion of CD4 cells positive for CD25 and
Foxp3 was increased, mainly in those with CD4
cell counts less than 200 cells/ml. The total number
of Foxp3-positive cells correlated with the CD4 cell
count. Further studies are needed on whether
Foxp3-positive cell numbers or function explain
the susceptibility to autoimmune and inflammatory
diseases seen in some patients with advanced HIV.
Patients with advanced HIV infection have an increasedsusceptibility to a number of immune-mediated andinflammatory conditions, including high rates of adversereactions to medications as well as immune reconstitutioninflammatory syndromes [1]. Regulatory T cells (Tregs)are a subgroup of CD4 T cells characterized by theupregulation of the IL-2 receptor (CD25) and theexpression of the transcription factor protein Foxp3[2]. In contrast to activated T cells, which are alsoCD4þCD25þ, the biological role of regulatory cells is todampen immune responses [3–5]. Tregs can be infectedwith HIV [6]. Some reports suggest that their numbersare depleted by HIV infection [7–9], whereas otherssuggest that the proportion of regulatory cells may beincreased [10,11]. Previous studies, however, may havebeen confounded by methodological problems, includinga failure to separate regulatory cells that highly expressCD25 from other CD4þCD25þ cells, the inclusion ofpatients without regard to antiretroviral therapy (withunknown effects on regulatory cell numbers), and afailure to distinguish regulatory numbers and percentages.In addition, the availability of monoclonal antibodiesto Foxp3 now makes it possible to study expression ofFoxp3 protein at the single cell level. In the presentstudy, we enumerated Tregs in antiretroviral-naiveHIV-infected patients using flow cytometry to identifyFoxp3-expressing CD4þCD25þ T cells.
To determine the effects of HIV on Treg numbers, werecruited antiretroviral-naive patients with a wide rangeof CD4 cell numbers at the Instituto de MedicinaTropical Alexander von Humboldt of the HospitalNacional Cayetano Heredia, Lima, Peru. Ethics com-mittees from the Universidad Peruana Cayetano Heredia
opyright © Lippincott Williams & Wilkins. Unauth
ISSN 0269-9370 Q 2006 Lippinc
and Baylor College of Medicine approved the protocoland consent forms before initiation of the study.
We identified Tregs by flow cytometry after intracellularstaining for Foxp3. Briefly, 10 ml blood samples werecollected from consenting participants. Peripheral bloodmononuclear cells were surface stained using Cy-chrome-conjugated anti-CD4 and phycoerythrine-conjugatedanti-CD25 monoclonal antibodies (BD Biosciences,San Jose, California, USA). After fixing the cells andpermeabilizing them, we stained for intracellular Foxp3using a fluorescein-isothiocyanate-conjugated anti-Foxp3monoclonal antibody according to the manufacturer’sinstructions (eBiosciences, San Diego, California, USA).Cells were analysed using a FACScalibur flow cytometerinstrument (Becton Dickinson, Franklin Lakes, NewJersey, USA). Tregs were identified as CD25-positiveand Foxp3-positive cells among CD4 cells within thelymphocyte gate. Flow cytometry analysis used FlowJosoftware (V. 6.4 Tree Star, Ashland, Oregon, USA). TheCD4 cell count was determined by four-color surfacestaining using fluorescein-isothiocyanate-conjugated anti-CD3, phycoerythrine-conjugated anti-CD4, peridinchlorophyll protein-conjugated anti-CD45 and activatedprotein C-conjugated anti-CD8 monoclonal antibodies(BD Biosciences) using a single-platform protocol. Theabsolute Treg number was determined by multiplying theproportionofCD25þFoxp3þby the totalCD4cell count.
Twenty-three antiretroviral-naive HIV patients and 16HIV-negative healthy individuals consented to participatebetween December 2005 and March 2006. In the HIV-positive group, 15 were male and eight female. Agesranged from 19 to 67 years (median 32). Six hadpreviously completed treatment for tuberculosis. In theHIV-negative group, 10 were male and six female, agesranged from 21 to 49 years (median 28).
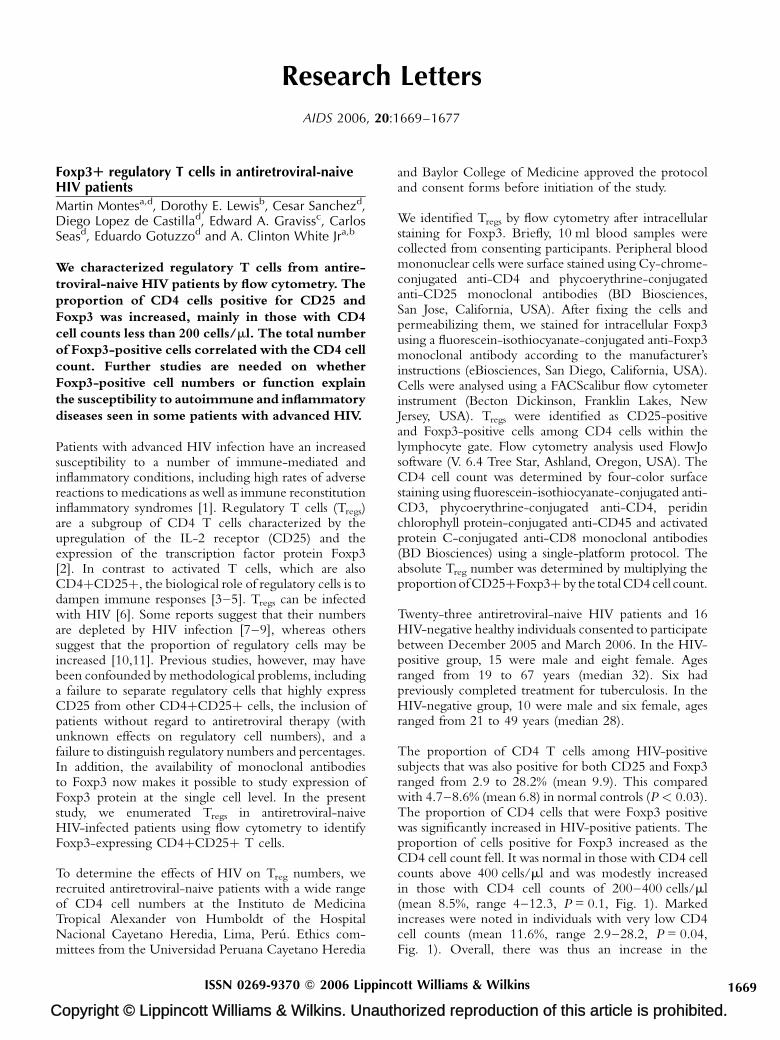
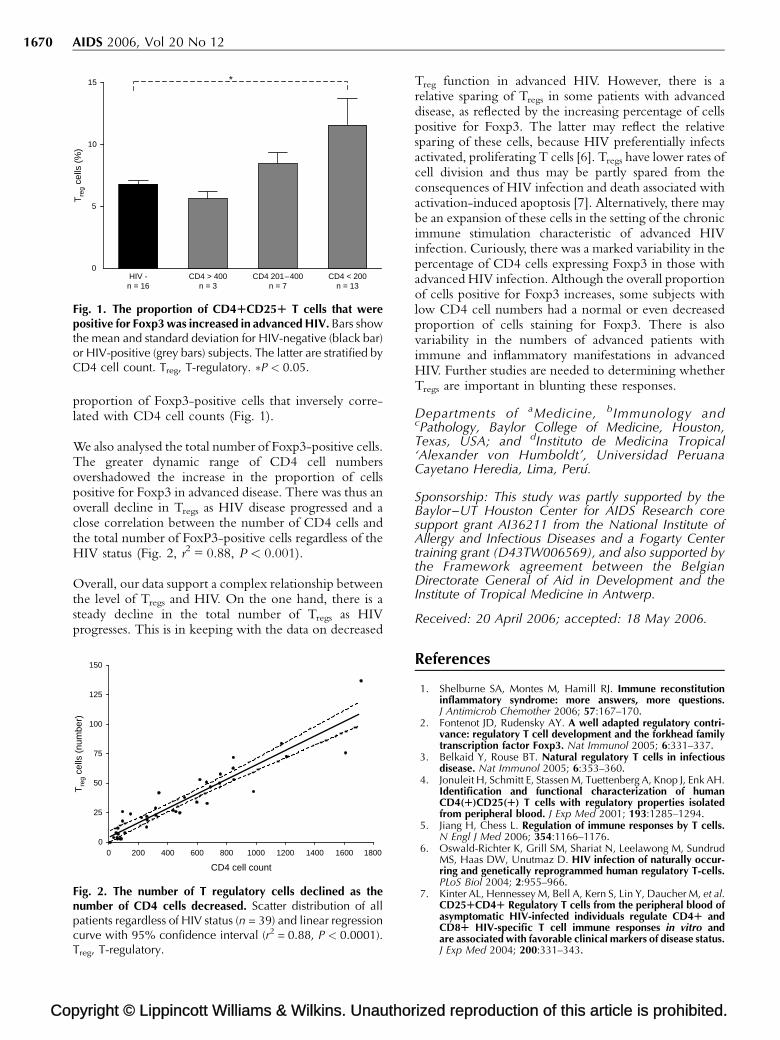
The proportion of CD4 T cells among HIV-positivesubjects that was also positive for both CD25 and Foxp3ranged from 2.9 to 28.2% (mean 9.9). This comparedwith 4.7–8.6% (mean 6.8) in normal controls (P < 0.03).The proportion of CD4 cells that were Foxp3 positivewas significantly increased in HIV-positive patients. Theproportion of cells positive for Foxp3 increased as theCD4 cell count fell. It was normal in those with CD4 cellcounts above 400 cells/ml and was modestly increasedin those with CD4 cell counts of 200–400 cells/ml(mean 8.5%, range 4–12.3, P = 0.1, Fig. 1). Markedincreases were noted in individuals with very low CD4cell counts (mean 11.6%, range 2.9–28.2, P = 0.04,Fig. 1). Overall, there was thus an increase in the
orized reproduction of this article is prohibited.
ott Williams & Wilkins 1669
Co
1670 AIDS 2006, Vol 20 No 12
CD4 < 200n = 13
CD4 201–400n = 7
CD4 > 400n = 3
HIV -n = 16
0
5
10
15 *T
reg
cells
(%
)
Fig. 1. The proportion of CD4RCD25R T cells that werepositive for Foxp3 was increased in advanced HIV. Bars showthe mean and standard deviation for HIV-negative (black bar)or HIV-positive (grey bars) subjects. The latter are stratified byCD4 cell count. Treg, T-regulatory. �P < 0.05.
proportion of Foxp3-positive cells that inversely corre-lated with CD4 cell counts (Fig. 1).
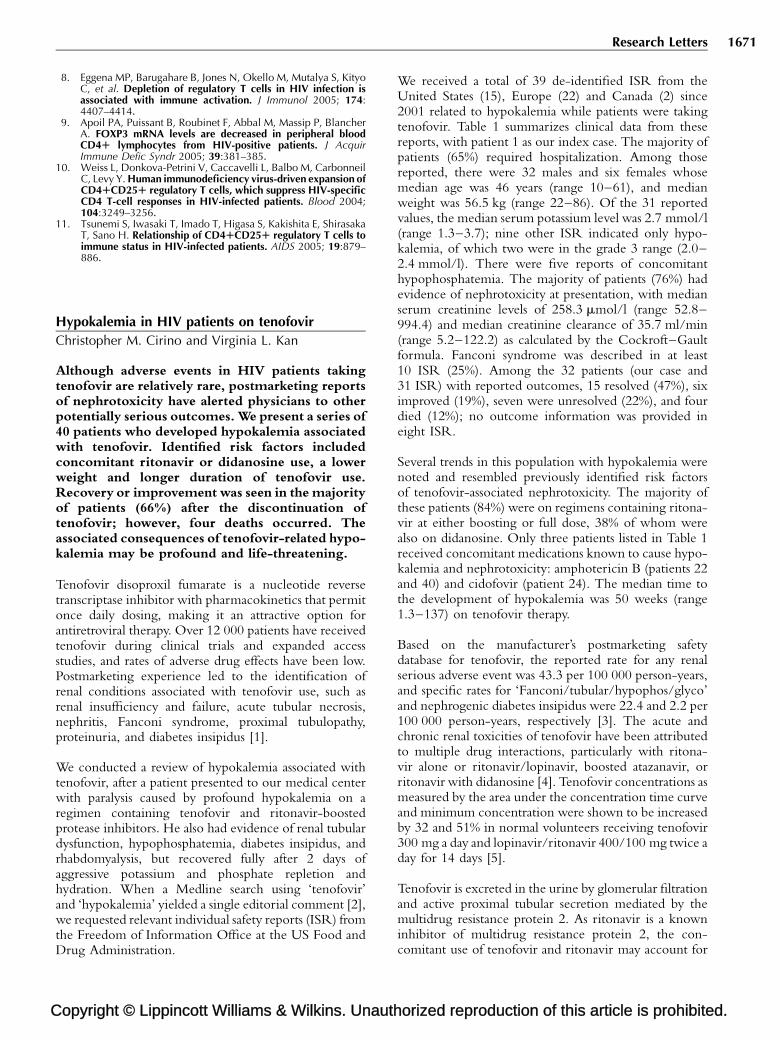
We also analysed the total number of Foxp3-positive cells.The greater dynamic range of CD4 cell numbersovershadowed the increase in the proportion of cellspositive for Foxp3 in advanced disease. There was thus anoverall decline in Tregs as HIV disease progressed and aclose correlation between the number of CD4 cells andthe total number of FoxP3-positive cells regardless of theHIV status (Fig. 2, r2 = 0.88, P < 0.001).
Overall, our data support a complex relationship betweenthe level of Tregs and HIV. On the one hand, there is asteady decline in the total number of Tregs as HIVprogresses. This is in keeping with the data on decreased
pyright © Lippincott Williams & Wilkins. Unauthor
0 200 400 600 800 1000 1200 1400 1600 18000
25
50
75
100
125
150
CD4 cell count
Tre
g ce
lls (
num
ber)
Fig. 2. The number of T regulatory cells declined as thenumber of CD4 cells decreased. Scatter distribution of allpatients regardless of HIV status (n = 39) and linear regressioncurve with 95% confidence interval (r2 = 0.88, P < 0.0001).Treg, T-regulatory.
Treg function in advanced HIV. However, there is arelative sparing of Tregs in some patients with advanceddisease, as reflected by the increasing percentage of cellspositive for Foxp3. The latter may reflect the relativesparing of these cells, because HIV preferentially infectsactivated, proliferating T cells [6]. Tregs have lower rates ofcell division and thus may be partly spared from theconsequences of HIV infection and death associated withactivation-induced apoptosis [7]. Alternatively, there maybe an expansion of these cells in the setting of the chronicimmune stimulation characteristic of advanced HIVinfection. Curiously, there was a marked variability in thepercentage of CD4 cells expressing Foxp3 in those withadvanced HIV infection. Although the overall proportionof cells positive for Foxp3 increases, some subjects withlow CD4 cell numbers had a normal or even decreasedproportion of cells staining for Foxp3. There is alsovariability in the numbers of advanced patients withimmune and inflammatory manifestations in advancedHIV. Further studies are needed to determining whetherTregs are important in blunting these responses.
Departments of aMedicine, bImmunology andcPathology, Baylor College of Medicine, Houston,Texas, USA; and dInstituto de Medicina Tropical‘Alexander von Humboldt’, Universidad PeruanaCayetano Heredia, Lima, Peru.
Sponsorship: This study was partly supported by theBaylor–UT Houston Center for AIDS Research coresupport grant AI36211 from the National Institute ofAllergy and Infectious Diseases and a Fogarty Centertraining grant (D43TW006569), and also supported bythe Framework agreement between the BelgianDirectorate General of Aid in Development and theInstitute of Tropical Medicine in Antwerp.
Received: 20 April 2006; accepted: 18 May 2006.
References
1. Shelburne SA, Montes M, Hamill RJ. Immune reconstitutioninflammatory syndrome: more answers, more questions.J Antimicrob Chemother 2006; 57:167–170.
2. Fontenot JD, Rudensky AY. A well adapted regulatory contri-vance: regulatory T cell development and the forkhead familytranscription factor Foxp3. Nat Immunol 2005; 6:331–337.
3. Belkaid Y, Rouse BT. Natural regulatory T cells in infectiousdisease. Nat Immunol 2005; 6:353–360.
4. Jonuleit H, Schmitt E, Stassen M, Tuettenberg A, Knop J, Enk AH.Identification and functional characterization of humanCD4(R)CD25(R) T cells with regulatory properties isolatedfrom peripheral blood. J Exp Med 2001; 193:1285–1294.
5. Jiang H, Chess L. Regulation of immune responses by T cells.N Engl J Med 2006; 354:1166–1176.
6. Oswald-Richter K, Grill SM, Shariat N, Leelawong M, SundrudMS, Haas DW, Unutmaz D. HIV infection of naturally occur-ring and genetically reprogrammed human regulatory T-cells.PLoS Biol 2004; 2:955–966.
7. Kinter AL, Hennessey M, Bell A, Kern S, Lin Y, Daucher M, et al.CD25RCD4R Regulatory T cells from the peripheral blood ofasymptomatic HIV-infected individuals regulate CD4R andCD8R HIV-specific T cell immune responses in vitro andare associated with favorable clinical markers of disease status.J Exp Med 2004; 200:331–343.
ized reproduction of this article is prohibited.
C
Research Letters 1671
8. Eggena MP, Barugahare B, Jones N, Okello M, Mutalya S, KityoC, et al. Depletion of regulatory T cells in HIV infection isassociated with immune activation. J Immunol 2005; 174:4407–4414.
9. Apoil PA, Puissant B, Roubinet F, Abbal M, Massip P, BlancherA. FOXP3 mRNA levels are decreased in peripheral bloodCD4R lymphocytes from HIV-positive patients. J AcquirImmune Defic Syndr 2005; 39:381–385.
10. Weiss L, Donkova-Petrini V, Caccavelli L, Balbo M, CarbonneilC, Levy Y. Human immunodeficiency virus-driven expansion ofCD4RCD25R regulatory T cells, which suppress HIV-specificCD4 T-cell responses in HIV-infected patients. Blood 2004;104:3249–3256.
11. Tsunemi S, Iwasaki T, Imado T, Higasa S, Kakishita E, ShirasakaT, Sano H. Relationship of CD4RCD25R regulatory T cells toimmune status in HIV-infected patients. AIDS 2005; 19:879–886.
Hypokalemia in HIV patients on tenofovir
Christopher M. Cirino and Virginia L. Kan
Although adverse events in HIV patients takingtenofovir are relatively rare, postmarketing reportsof nephrotoxicity have alerted physicians to otherpotentially serious outcomes. We present a series of40 patients who developed hypokalemia associatedwith tenofovir. Identified risk factors includedconcomitant ritonavir or didanosine use, a lowerweight and longer duration of tenofovir use.Recovery or improvement was seen in the majorityof patients (66%) after the discontinuation oftenofovir; however, four deaths occurred. Theassociated consequences of tenofovir-related hypo-kalemia may be profound and life-threatening.
Tenofovir disoproxil fumarate is a nucleotide reversetranscriptase inhibitor with pharmacokinetics that permitonce daily dosing, making it an attractive option forantiretroviral therapy. Over 12 000 patients have receivedtenofovir during clinical trials and expanded accessstudies, and rates of adverse drug effects have been low.Postmarketing experience led to the identification ofrenal conditions associated with tenofovir use, such asrenal insufficiency and failure, acute tubular necrosis,nephritis, Fanconi syndrome, proximal tubulopathy,proteinuria, and diabetes insipidus [1].
We conducted a review of hypokalemia associated withtenofovir, after a patient presented to our medical centerwith paralysis caused by profound hypokalemia on aregimen containing tenofovir and ritonavir-boostedprotease inhibitors. He also had evidence of renal tubulardysfunction, hypophosphatemia, diabetes insipidus, andrhabdomyalysis, but recovered fully after 2 days ofaggressive potassium and phosphate repletion andhydration. When a Medline search using ‘tenofovir’and ‘hypokalemia’ yielded a single editorial comment [2],we requested relevant individual safety reports (ISR) fromthe Freedom of Information Office at the US Food andDrug Administration.
opyright © Lippincott Williams & Wilkins. Unauth
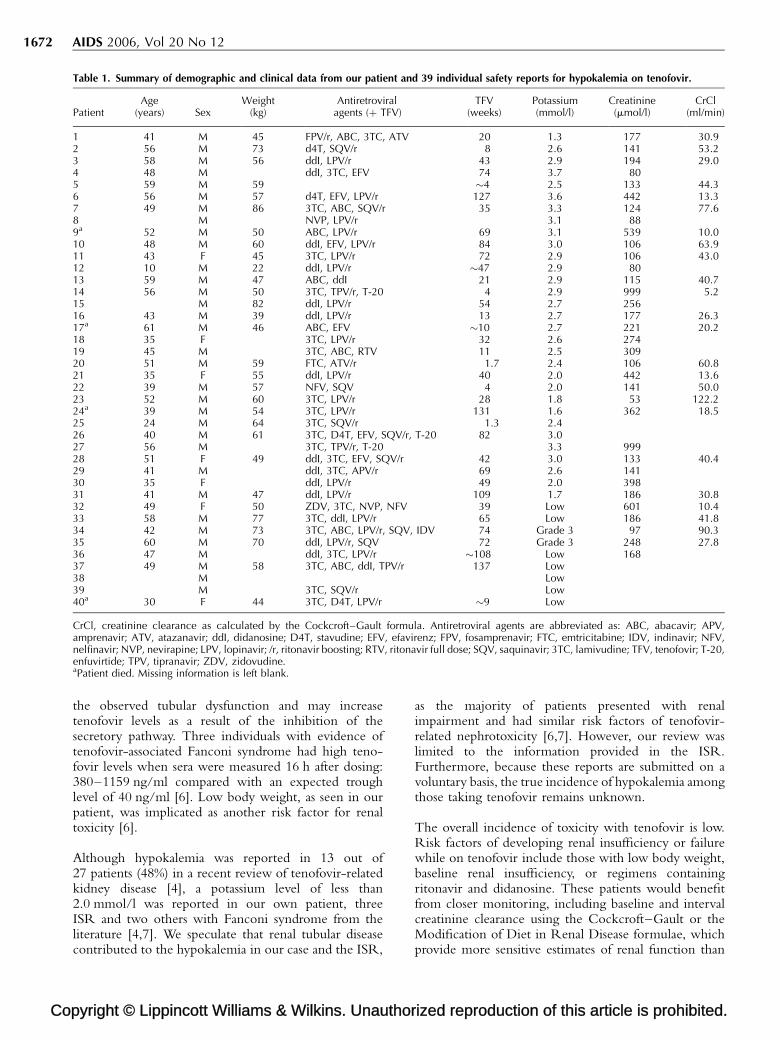
We received a total of 39 de-identified ISR from theUnited States (15), Europe (22) and Canada (2) since2001 related to hypokalemia while patients were takingtenofovir. Table 1 summarizes clinical data from thesereports, with patient 1 as our index case. The majority ofpatients (65%) required hospitalization. Among thosereported, there were 32 males and six females whosemedian age was 46 years (range 10–61), and medianweight was 56.5 kg (range 22–86). Of the 31 reportedvalues, the median serum potassium level was 2.7 mmol/l(range 1.3–3.7); nine other ISR indicated only hypo-kalemia, of which two were in the grade 3 range (2.0–2.4 mmol/l). There were five reports of concomitanthypophosphatemia. The majority of patients (76%) hadevidence of nephrotoxicity at presentation, with medianserum creatinine levels of 258.3 mmol/l (range 52.8–994.4) and median creatinine clearance of 35.7 ml/min(range 5.2–122.2) as calculated by the Cockroft–Gaultformula. Fanconi syndrome was described in at least10 ISR (25%). Among the 32 patients (our case and31 ISR) with reported outcomes, 15 resolved (47%), siximproved (19%), seven were unresolved (22%), and fourdied (12%); no outcome information was provided ineight ISR.
Several trends in this population with hypokalemia werenoted and resembled previously identified risk factorsof tenofovir-associated nephrotoxicity. The majority ofthese patients (84%) were on regimens containing ritona-vir at either boosting or full dose, 38% of whom werealso on didanosine. Only three patients listed in Table 1received concomitant medications known to cause hypo-kalemia and nephrotoxicity: amphotericin B (patients 22and 40) and cidofovir (patient 24). The median time tothe development of hypokalemia was 50 weeks (range1.3–137) on tenofovir therapy.
Based on the manufacturer’s postmarketing safetydatabase for tenofovir, the reported rate for any renalserious adverse event was 43.3 per 100 000 person-years,and specific rates for ‘Fanconi/tubular/hypophos/glyco’and nephrogenic diabetes insipidus were 22.4 and 2.2 per100 000 person-years, respectively [3]. The acute andchronic renal toxicities of tenofovir have been attributedto multiple drug interactions, particularly with ritona-vir alone or ritonavir/lopinavir, boosted atazanavir, orritonavir with didanosine [4]. Tenofovir concentrations asmeasured by the area under the concentration time curveand minimum concentration were shown to be increasedby 32 and 51% in normal volunteers receiving tenofovir300 mg a day and lopinavir/ritonavir 400/100 mg twice aday for 14 days [5].
Tenofovir is excreted in the urine by glomerular filtrationand active proximal tubular secretion mediated by themultidrug resistance protein 2. As ritonavir is a knowninhibitor of multidrug resistance protein 2, the con-comitant use of tenofovir and ritonavir may account for
orized reproduction of this article is prohibited.
Co
1672 AIDS 2006, Vol 20 No 12
Table 1. Summary of demographic and clinical data from our patient and 39 individual safety reports for hypokalemia on tenofovir.
PatientAge
(years) SexWeight
(kg)Antiretroviral
agents (þ TFV)TFV
(weeks)Potassium(mmol/l)
Creatinine(mmol/l)
CrCl(ml/min)
1 41 M 45 FPV/r, ABC, 3TC, ATV 20 1.3 177 30.92 56 M 73 d4T, SQV/r 8 2.6 141 53.23 58 M 56 ddI, LPV/r 43 2.9 194 29.04 48 M ddI, 3TC, EFV 74 3.7 805 59 M 59 �4 2.5 133 44.36 56 M 57 d4T, EFV, LPV/r 127 3.6 442 13.37 49 M 86 3TC, ABC, SQV/r 35 3.3 124 77.68 M NVP, LPV/r 3.1 889a 52 M 50 ABC, LPV/r 69 3.1 539 10.010 48 M 60 ddI, EFV, LPV/r 84 3.0 106 63.911 43 F 45 3TC, LPV/r 72 2.9 106 43.012 10 M 22 ddI, LPV/r �47 2.9 8013 59 M 47 ABC, ddI 21 2.9 115 40.714 56 M 50 3TC, TPV/r, T-20 4 2.9 999 5.215 M 82 ddI, LPV/r 54 2.7 25616 43 M 39 ddI, LPV/r 13 2.7 177 26.317a 61 M 46 ABC, EFV �10 2.7 221 20.218 35 F 3TC, LPV/r 32 2.6 27419 45 M 3TC, ABC, RTV 11 2.5 30920 51 M 59 FTC, ATV/r 1.7 2.4 106 60.821 35 F 55 ddI, LPV/r 40 2.0 442 13.622 39 M 57 NFV, SQV 4 2.0 141 50.023 52 M 60 3TC, LPV/r 28 1.8 53 122.224a 39 M 54 3TC, LPV/r 131 1.6 362 18.525 24 M 64 3TC, SQV/r 1.3 2.426 40 M 61 3TC, D4T, EFV, SQV/r, T-20 82 3.027 56 M 3TC, TPV/r, T-20 3.3 99928 51 F 49 ddI, 3TC, EFV, SQV/r 42 3.0 133 40.429 41 M ddI, 3TC, APV/r 69 2.6 14130 35 F ddI, LPV/r 49 2.0 39831 41 M 47 ddI, LPV/r 109 1.7 186 30.832 49 F 50 ZDV, 3TC, NVP, NFV 39 Low 601 10.433 58 M 77 3TC, ddI, LPV/r 65 Low 186 41.834 42 M 73 3TC, ABC, LPV/r, SQV, IDV 74 Grade 3 97 90.335 60 M 70 ddI, LPV/r, SQV 72 Grade 3 248 27.836 47 M ddI, 3TC, LPV/r �108 Low 16837 49 M 58 3TC, ABC, ddI, TPV/r 137 Low38 M Low39 M 3TC, SQV/r Low40a 30 F 44 3TC, D4T, LPV/r �9 Low
CrCl, creatinine clearance as calculated by the Cockcroft–Gault formula. Antiretroviral agents are abbreviated as: ABC, abacavir; APV,amprenavir; ATV, atazanavir; ddI, didanosine; D4T, stavudine; EFV, efavirenz; FPV, fosamprenavir; FTC, emtricitabine; IDV, indinavir; NFV,nelfinavir; NVP, nevirapine; LPV, lopinavir; /r, ritonavir boosting; RTV, ritonavir full dose; SQV, saquinavir; 3TC, lamivudine; TFV, tenofovir; T-20,enfuvirtide; TPV, tipranavir; ZDV, zidovudine.aPatient died. Missing information is left blank.
the observed tubular dysfunction and may increasetenofovir levels as a result of the inhibition of thesecretory pathway. Three individuals with evidence oftenofovir-associated Fanconi syndrome had high teno-fovir levels when sera were measured 16 h after dosing:380–1159 ng/ml compared with an expected troughlevel of 40 ng/ml [6]. Low body weight, as seen in ourpatient, was implicated as another risk factor for renaltoxicity [6].
Although hypokalemia was reported in 13 out of27 patients (48%) in a recent review of tenofovir-relatedkidney disease [4], a potassium level of less than2.0 mmol/l was reported in our own patient, threeISR and two others with Fanconi syndrome from theliterature [4,7]. We speculate that renal tubular diseasecontributed to the hypokalemia in our case and the ISR,
pyright © Lippincott Williams & Wilkins. Unauthor
as the majority of patients presented with renalimpairment and had similar risk factors of tenofovir-related nephrotoxicity [6,7]. However, our review waslimited to the information provided in the ISR.Furthermore, because these reports are submitted on avoluntary basis, the true incidence of hypokalemia amongthose taking tenofovir remains unknown.
The overall incidence of toxicity with tenofovir is low.Risk factors of developing renal insufficiency or failurewhile on tenofovir include those with low body weight,baseline renal insufficiency, or regimens containingritonavir and didanosine. These patients would benefitfrom closer monitoring, including baseline and intervalcreatinine clearance using the Cockcroft–Gault or theModification of Diet in Renal Disease formulae, whichprovide more sensitive estimates of renal function than
ized reproduction of this article is prohibited.
C
Research Letters 1673
serum creatinine alone [8], serum potassium and phos-phate levels, and a urinalysis to detect proteinuria andglucosuria [6,7]. Assessment for increased urinaryfrequency may be helpful in detecting treated patientswho may be at risk. The associated consequences oftenofovir-related nephrotoxicity and hypokalemia maybe profound and life threatening.
Acknowledgements
The authors would like to thank Kendall Marcus, MD,from the Center for Drug Evaluation and Research, Foodand Drug Administration, for her assistance in providingthe individual safety report numbers for hypokalemiaamong individuals taking tenofovir.
The views expressed in this article are those of the authorsand do not necessarily represent the views of theDepartment of Veterans Affairs.
Infectious Diseases Section, Veterans Affairs MedicalCenter, Washington, DC, USA.
Received: 20 April 2006; accepted: 19 May 2006.
References
1. Viread (tenofovir disoproxil fumarate) package insert. Foster City,CA: Gilead Sciences; March 2006.
2. Fine DM. Editorial comment: tenofovir nephrotoxicity –vigilance required. AIDS Reader 2005; 15:362–363.
3. Nelson M, Cooper D, Schooley R, Katlama C, Montaner J, CurtisS, et al. The safety of tenofovir DF for the treatment of HIVinfection: the first 4 years. In: Abstracts of the 13th Conference onRetroviruses and Opportunistic Infections. Denver, CO, 5–9February 2006 [A781].
4. Zimmerman AE, Pizzoferrato T, Bedford J, Morris A, Hoffman R,Braden G. Tenofovir-associated acute and chronic kidney dis-ease: a case of multiple drug interactions. Clin Infect Dis 2006;42:283–290.
5. Food and Drug Administration. Viread: NDA 21-346/S-006.Rockville, MD: Food and Drug Administration; 2003.
6. Peyriere H, Reynes J, Rouanet I, Daniel N, deBoever CM,Mauboussin JM, et al. Renal tubular dysfunction associated withtenofovir therapy: report of 7 cases. J Acquir Immune DeficSyndr 2004; 35:269–273.
7. Gaspar G, Monereo A, Garcia-Reyne A, de Guzman M. Fanconisyndrome and acute renal failure in a patient treated withtenofovir: a call for caution. AIDS 2004; 18:351–352.
8. Galland JE, Parish MA, Keruly JC, Moore RD. Changes in renalfunction associated with tenofovir disoproxil fumarate treat-ment, compared with nucleoside reverse-transcriptase inhibitortreatment. Clin Infect Dis 2005; 40:1194–1198.
DEFB1 gene polymorphisms and increased risk ofHIV-1 infection in Brazilian children
Michele Milanesea, Ludovica Segata, AlessandraPontilloa, Luiz Claudio Arraesb,c, Jose Luiz de LimaFilhoc and Sergio Crovellaa,c
In our study we analysed three single nucleotidepolymorphisms (SNPs) in the 50 untranslated region
opyright © Lippincott Williams & Wilkins. Unauth
(UTR) of the DEFB1 gene, namely S52(G/A)
S44(C/G) and S20(G/A), in three groups of north-
eastern Brazilian children in order to assess their
role in HIV-1 infection. Our results allowed us to
hypothesize that the SNPs located in the 50 UTR of
the DEFB1 gene can be employed as a marker of risk
for HIV-1 infection.
Beta defensins are small secreted antimicrobial peptidesthat are components of innate immunity [1]. A role forbeta defensins in contrasting infection from HIV-1 hasbeen reported by Quinones-Mateu et al. [2], whosuggested that human beta defensin (hBD) 2 and hBD-3are able to protect GHOST X4/R5 cells from beinginfected, by directly binding to the viral envelope. Asimilar effect, in which beta defensins interact withsurface carbohydrates, has been shown by Leikina et al.[3]. Moreover Sun et al. [4] hypothesized an involvementof beta-defensins in HIV-1 oral transmission, emphasizingtheir protective role in the oral mucosa.
Despite the fact that Quinones-Mateu et al. [2] were notable to prove a role for hBD-1 in protecting cells frominfection by HIV-1, Braida et al. [5] recently reportedan association between the �44(C/G) single nucleotidepolymorphism (SNP) in the 50 untranslated region (UTR)of the DEFB1 gene, encoding for the hBD-1 peptide, andHIV-1 infection in Italian children.
In our study we analysed the same SNPs in the 50 UTR ofthe DEFB1 gene, �52(G/A), �44(C/G) and �20(G/A)(rs1799946, rs1800972, and rs11362, respectively), asreported by Braida et al. [5] in three groups of north-eastern Brazilian children in order to assess the role ofthese polymorphisms in HIV-1 infection when looking atethnic groups other that the Caucasians studied by Braidaet al. [5].
We enrolled 128 HIV-1 perinatally infected children(average age 4 years, range 0–13) and 60 exposeduninfected children (average age 7 years, range 0–15)born to HIV-1-positive mothers who did not receiveantiretroviral therapy during gestation, and did notundergo caesarean section to prevent vertical transmission.We also recruited 115 uninfected and unexposed children(average age 8 years, range 0–19) from the same populationas the healthy controls. All children came from the InstitutoMaterno Infantil do Pernambuco (Recife, Brazil), andinformed consent was obtained from their parents.
DNA extraction and DEFB1 SNP genotyping wereperformed according to Braida et al. [5].
The significance of differences in allelic and genotypefrequencies was calculated by chi-square test. Yates’ con-tinuity correction and Fisher’s exact test were employedwhen appropriate. The correction of P values for multiple
orized reproduction of this article is prohibited.
Co
1674 AIDS 2006, Vol 20 No 12
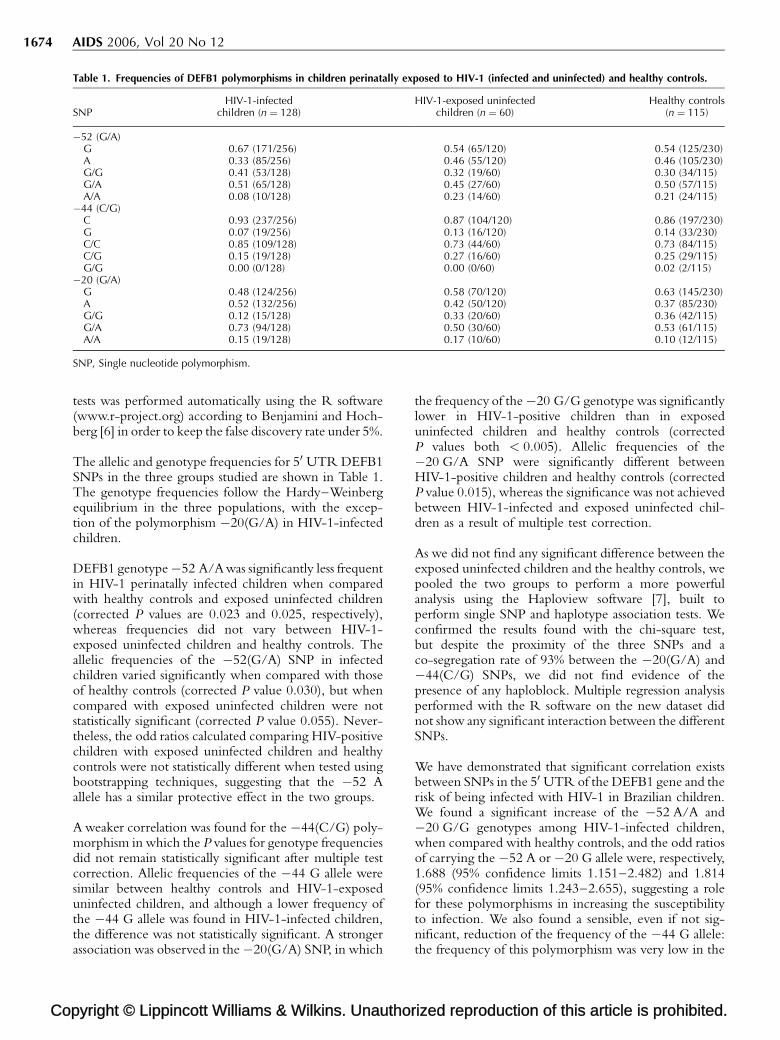
Table 1. Frequencies of DEFB1 polymorphisms in children perinatally exposed to HIV-1 (infected and uninfected) and healthy controls.
SNPHIV-1-infected
children (n ¼ 128)HIV-1-exposed uninfected
children (n ¼ 60)Healthy controls
(n ¼ 115)
�52 (G/A)G 0.67 (171/256) 0.54 (65/120) 0.54 (125/230)A 0.33 (85/256) 0.46 (55/120) 0.46 (105/230)G/G 0.41 (53/128) 0.32 (19/60) 0.30 (34/115)G/A 0.51 (65/128) 0.45 (27/60) 0.50 (57/115)A/A 0.08 (10/128) 0.23 (14/60) 0.21 (24/115)
�44 (C/G)C 0.93 (237/256) 0.87 (104/120) 0.86 (197/230)G 0.07 (19/256) 0.13 (16/120) 0.14 (33/230)C/C 0.85 (109/128) 0.73 (44/60) 0.73 (84/115)C/G 0.15 (19/128) 0.27 (16/60) 0.25 (29/115)G/G 0.00 (0/128) 0.00 (0/60) 0.02 (2/115)
�20 (G/A)G 0.48 (124/256) 0.58 (70/120) 0.63 (145/230)A 0.52 (132/256) 0.42 (50/120) 0.37 (85/230)G/G 0.12 (15/128) 0.33 (20/60) 0.36 (42/115)G/A 0.73 (94/128) 0.50 (30/60) 0.53 (61/115)A/A 0.15 (19/128) 0.17 (10/60) 0.10 (12/115)
SNP, Single nucleotide polymorphism.
tests was performed automatically using the R software(www.r-project.org) according to Benjamini and Hoch-berg [6] in order to keep the false discovery rate under 5%.
The allelic and genotype frequencies for 50 UTR DEFB1SNPs in the three groups studied are shown in Table 1.The genotype frequencies follow the Hardy–Weinbergequilibrium in the three populations, with the excep-tion of the polymorphism �20(G/A) in HIV-1-infectedchildren.
DEFB1 genotype �52 A/A was significantly less frequentin HIV-1 perinatally infected children when comparedwith healthy controls and exposed uninfected children(corrected P values are 0.023 and 0.025, respectively),whereas frequencies did not vary between HIV-1-exposed uninfected children and healthy controls. Theallelic frequencies of the �52(G/A) SNP in infectedchildren varied significantly when compared with thoseof healthy controls (corrected P value 0.030), but whencompared with exposed uninfected children were notstatistically significant (corrected P value 0.055). Never-theless, the odd ratios calculated comparing HIV-positivechildren with exposed uninfected children and healthycontrols were not statistically different when tested usingbootstrapping techniques, suggesting that the �52 Aallele has a similar protective effect in the two groups.
A weaker correlation was found for the �44(C/G) poly-morphism in which the P values for genotype frequenciesdid not remain statistically significant after multiple testcorrection. Allelic frequencies of the �44 G allele weresimilar between healthy controls and HIV-1-exposeduninfected children, and although a lower frequency ofthe �44 G allele was found in HIV-1-infected children,the difference was not statistically significant. A strongerassociation was observed in the �20(G/A) SNP, in which
pyright © Lippincott Williams & Wilkins. Unauthor
the frequency of the �20 G/G genotype was significantlylower in HIV-1-positive children than in exposeduninfected children and healthy controls (correctedP values both < 0.005). Allelic frequencies of the�20 G/A SNP were significantly different betweenHIV-1-positive children and healthy controls (correctedP value 0.015), whereas the significance was not achievedbetween HIV-1-infected and exposed uninfected chil-dren as a result of multiple test correction.
As we did not find any significant difference between theexposed uninfected children and the healthy controls, wepooled the two groups to perform a more powerfulanalysis using the Haploview software [7], built toperform single SNP and haplotype association tests. Weconfirmed the results found with the chi-square test,but despite the proximity of the three SNPs and aco-segregation rate of 93% between the �20(G/A) and�44(C/G) SNPs, we did not find evidence of thepresence of any haploblock. Multiple regression analysisperformed with the R software on the new dataset didnot show any significant interaction between the differentSNPs.
We have demonstrated that significant correlation existsbetween SNPs in the 50 UTR of the DEFB1 gene and therisk of being infected with HIV-1 in Brazilian children.We found a significant increase of the �52 A/A and�20 G/G genotypes among HIV-1-infected children,when compared with healthy controls, and the odd ratiosof carrying the �52 A or �20 G allele were, respectively,1.688 (95% confidence limits 1.151–2.482) and 1.814(95% confidence limits 1.243–2.655), suggesting a rolefor these polymorphisms in increasing the susceptibilityto infection. We also found a sensible, even if not sig-nificant, reduction of the frequency of the �44 G allele:the frequency of this polymorphism was very low in the
ized reproduction of this article is prohibited.
C
Research Letters 1675
Brazilian population when compared with other popu-lations [8], and this fact could account for the lack ofstatistical significance.
Finally, a particular consideration is deserved for thedeparture of the �20 G/A allele from the Hardy–Weinberg equilibrium. The excess of G/A heterozygoussubjects in the exposed-infected children could possiblybe explained by hypothesizing a dominant effect for theA allele, able to increase the susceptibility to HIV-1infection even if present in a single dose.
In conclusion, our results obtained on Brazilian childrenconfirm that the SNPs located in the 50 UTR of theDEFB1 gene can be employed as a marker of risk forHIV-1 infection.
aDepartment of Developmental and ReproductiveSciences, University of Trieste, Trieste, Italy; bInstitutoMaterno Infantil de Pernambuco, Recife, PE, Brazil;and cLaboratorio de Imunopatologia ‘Keizo Azami’,Universidade Federal de Pernambuco, Recife, PE,Brazil.
Received: 29 March 2006; accepted: 18 May 2006.
References
1. Kagan BL, Ganz T, Lehrer RI. Defensins: a family of antimicrobialand cytotoxic peptides. Toxicology 1994; 87:131–149.
2. Quinones-Mateu ME, Lederman MM, Feng Z, Chakraborty B,Weber J, Rangel HR, et al. Human epithelial beta-defensins 2 and3 inhibit HIV-1 replication. AIDS 2003; 17:F39–F48.
3. Leikina E, Delanoe-Ayari H, Melikov K, Cho MS, Chen A, WaringAJ, et al. Carbohydrate-binding molecules inhibit viral fusionand entry by crosslinking membrane glycoproteins. Nat Immu-nol 2005; 6:995–1001.
4. Sun L, Finnegan CM, Kish-Catalone T, Blumenthal R, Garzino-Demo P, La Terra Maggiore GM, et al. Human beta-defensinssuppress human immunodeficiency virus infection: potentialrole in mucosal protection. J Virol 2005; 79:14318–14329.
5. Braida L, Boniotto M, Pontillo A, Tovo PA, Amoroso A, CrovellaS. A single-nucleotide polymorphism in the human beta-defensin1 gene is associated with HIV-1 infection in Italian children.AIDS 2004; 18:1598–1600.
6. Benjamini Y, Hochberg Y. Controlling the false discovery rate: apractical and powerful approach to multiple testing. J R Stat Soc1995; 57:289–300.
7. Barrett JC, Fry B, Maller J, Daly MJ. Haploview: analysis andvisualization of LD and haplotype maps. Bioinformatics 2005;21:263–265.
8. Jurevic RJ, Chrisman P, Mancl L, Livingston R, Dale BA. Single-nucleotide polymorphisms and haplotype analysis in beta-defensin genes in different ethnic populations. Genet Test2002; 6:261–269.
Ezetimibe effectively decreases LDL-cholesterol inHIV-infected patients
Blai Colla,b, Gerard Aragonesa, Sandra Parrab, CarlosAlonso-Villaverdeb and Lluis Masanab
We tested the security and efficacy of ezetimibein the treatment of HIV-associated dyslipemia.
opyright © Lippincott Williams & Wilkins. Unauth
Twenty HIV-infected patients were randomly
assigned to receive ezetimibe 10 mg/day or fluvas-
tatin 80 mg/day. Patients receiving ezetimibe
experienced a statistically significant (P ¼ 0.003)
20% reduction in the concentration of LDL-cho-
lesterol, similar to that observed with fluvastatin
(24%, P between groups 0.70). We concluded that
ezetimibe monotherapy effectively decreases LDL-
cholesterol in HIV-infected patients.
The control of cardiovascular risk factors in HIV-infectedpatients is relevant because the incidence of myocardialinfarction [1] and other atherosclerosis-related events [2]are increasing. Lipid abnormalities are commonly presentin this clinical setting [3], but the majority of 3-hydroxy-3-methylglutaryl coenzyme A reductase inhibitors, withthe exception of pravastatin and fluvastatin, are meta-bolized by the cytochrome P450 3A4, which in turn is alsothe metabolic pathway of many of the antiretroviral agents,especially the protease inhibitors (PI) [4]. Recent evidencesupports theuseof ezetimibe in combination with statins toadd a powerful lipid-lowering effect [5]. However, themetabolism of ezetimibe, which is P450 independent, andthe low incidence of drug interactions and side-effects,make this drug suitable to be tested in monotherapy inHIV-infected patients.
Patients were enrolled during the 3 months of the inclusionperiod if they fulfilled the eligibility criteria: more than6 months on stable HAART, more than 18 years of age, anda fasting LDL-cholesterol concentration of 3.30 mmol/l orgreater. Classic cardiovascular risk factors were recorded,and fasting total cholesterol, HDL-cholesterol, triglycer-ides, and glucosewere determined. LDL-cholesterol valueswere obtained using the Friedewald formula. CD4 andCD8 lymphocyte counts and HIV-1 viral load weredetermined using standard techniques.
Endothelial function was analysed using peripheralarterial tonometry [6]. Briefly, this system (ItamarMedical Ltd., Caesarea, Israel) utilizes a finger probe toassess digital volume changes accompanying pulse waves.The peripheral arterial tonometry data were analysed by acomputer in an operator-independent manner. A ratio ofless than 1.6 was considered to be a marker for endothelialdysfunction [6].
Patients were then randomly assigned (according to theHAART regime: boosted PI or non-nucleosideanalogues) to receive ezetimibe 10 mg/day or fluvastatinextended release 80 mg/day in a 1 : 1 ratio. Patients wereevaluated 2–3 weeks after the initiation of lipid-loweringagents to assess tolerability and adherence, and at 6 weeks,the baseline protocol was re-applied.
Results are expressed as mean (SEM) or in percentages.Univariate analyses, using non-parametric tests, were
orized reproduction of this article is prohibited.
Co
1676 AIDS 2006, Vol 20 No 12
used to compare differences between groups (Mann–Whitney) and between pre and posttreatment (Wilcoxonand McNemar tests). The independent Ethics Commit-tee of the Hospital Universitari Sant Joan approvedthe study.
There were no significant differences in lipid values,age, and baseline endothelial function between patientstaking non-nucleoside analogues (N ¼ 10) and thosewith boosted PI (N ¼ 10). Patients randomly assigned toreceive ezetimibe exhibited higher systolic [137 (5.6)versus 117 (2.7) mmHg, P ¼ 0.01] and diastolic bloodpressure [90 (3.3) versus 76 (4.5) mmHg, P ¼ 0.02] thanthose on fluvastatin. There were no significant differenceseither in the other cardiovascular risk factors or in theHIV-related variables between groups, although most ofthe patients assigned to be given ezetimibe were receivinglopinavir/ritonavir. None of the participants experiencedrelated side-effects and none of them interrupted thelipid-lowering therapies.
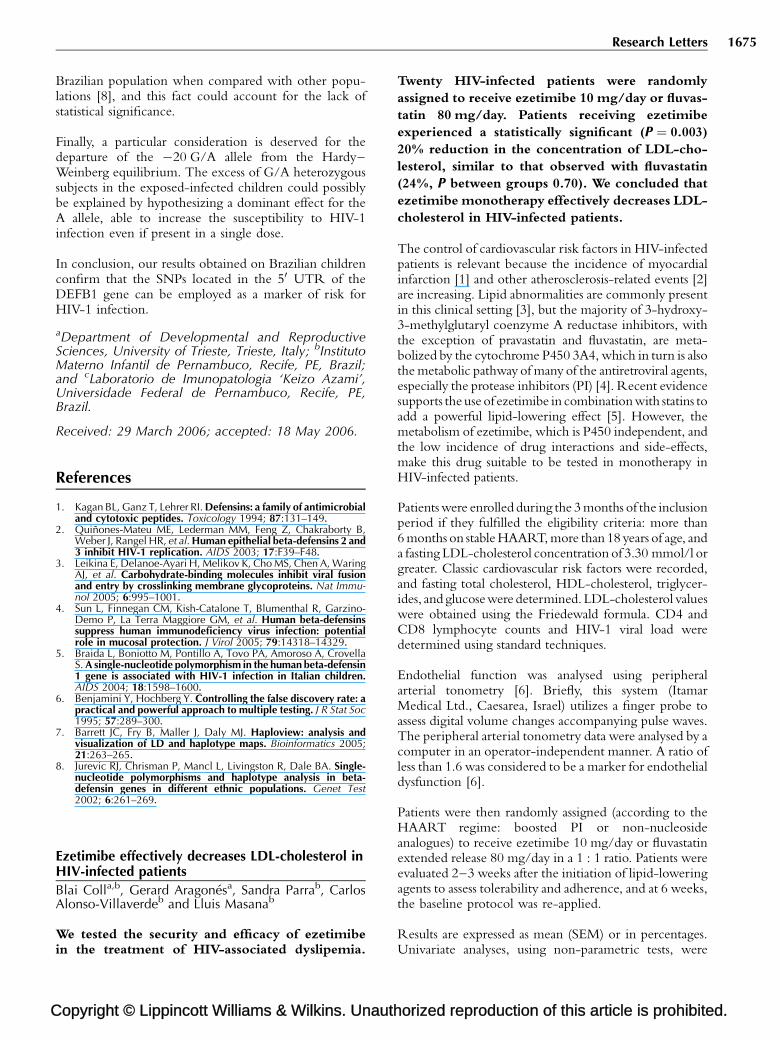
In both groups, total cholesterol and LDL-cholesterolwere significantly decreased after therapy (Fig. 1). Thosepatients receiving ezetimibe 10 mg presented a statisti-cally significant (P ¼ 0.03) 10% reduction in totalcholesterol and a 20% reduction in LDL-cholesterolconcentrations (P ¼ 0.02, Fig. 1). The results in thefluvastatin group were similar, showing a 17% reduction
pyright © Lippincott Williams & Wilkins. Unauthor
4.4
4.9
5.4
5.9
6.4
6.9
7.4
7.9
2.4
2.9
3.4
3.9
4.4
4.9
5.4
5.9
0.6
1.0
1.4
1.8
2.2
2.6
1.0
1.5
2.0
2.5
3.0
Total cholesterol, mmol/l
HDL-cholesterol, mmol/l
Fluvastatin Ezetimibe
Fluvastatin Ezetimibe
* *
Fig. 1. Results of lipid parameters and endothelial function inbars) 6 weeks of ezetimibe (N U 10) or fluvastatin (N U 10).(Wilcoxon test).
in total cholesterol (P ¼ 0.06) and a 24% decrease in theconcentrations of LDL-cholesterol (P ¼ 0.02). We didnot find significant differences in either triglycerides orHDL-cholesterol (Fig. 1). There were no significantdifferences in the reduction of lipid concentrationsbetween groups, showing a similar effect of both lipid-lowering agents (Wilcoxon test, P ¼ 0.2 for totalcholesterol and P ¼ 0.4 for LDL-cholesterol).
Furthermore, those patients receiving ezetimibe did notexhibit significant changes in endothelial function after6 weeks of therapy (Fig. 1). However, those in thefluvastatin group experienced a non-significant (P ¼ 0.5)increase in the rate of endothelial function (11% betterresult in the second evaluation, Fig. 1).
The treatment of HIV-associated dyslipidemia shouldavoid drug–drug interactions and potentially detrimentalconcentrations of statins [7–10]; therefore, the use oflipid-lowering agents without significant interactionswith HAART is highly desirable.
Pravastatin is not preferentially metabolized by cyto-chromes [10], and fluvastatin is metabolized through theCYP2C9 enzyme. Both reduce the concentrations oftotal cholesterol without significant toxicities [10,11],but other lipid-lowering drugs should be evaluated inthis particular group of patients in order to control
ized reproduction of this article is prohibited.
LDL-cholesterol, mmol/l
Endothelial function
Fluvastatin Ezetimibe
Fluvastatin Ezetimibe
**
HIV-infected patients before (white bars) and after (filled�P < 0.05 comparing pre and post-treatment assessment
C
Research Letters 1677
potential toxicities. Ezetimibe is the first available selec-tive cholesterol absorption inhibitor, blocking cholesterolabsorption at the intestinal brush border to reduceLDL-cholesterol [12]. The dual inhibition of cholesterolsynthesis and absorption, through the co-administrationof a statin and ezetimibe, has been shown to providesignificantly greater reductions in LDL-cholesterol thanstatin monotherapy alone [5]. However, if confirmed, wealso support the use of ezetimibe in monotherapy in HIV-infected patients, because it yields similar results to thoseobtained with fluvastatin, and none of the participantsexperienced any ezetimibe-related side-effects.
The small sample size and the different distribution ofthe boosted PI between groups are severe limitationsto be considered. Even then, the results favour the useof ezetimibe to control lipid-related cardiovascular riskfactors.
An important issue addressed in our study was theinfluence of these agents on endothelial function; HIV-infected patients exhibit higher rates of endothelialdysfunction than the non-infected population [13], andthose on PI have even worse values [14]. Agents thatameliorate endothelial function contribute to a reductionin cardiovascular risk, because endothelial dysfunction isthe initial disturbance in the development of atheroscle-rosis [15]. Those patients on ezetimibe, althoughreducing significantly the values of LDL-cholesterol,did not experience any change in endothelial function.Conversely, patients receiving fluvastatin ameliorated,although not significantly, their endothelial function.
In summary, ezetimibe monotherapy effectively decreasesLDL-cholesterol in HIV-infected patients. Because of thesmall sample size, these results should be further addressedin larger trials, but the use of ezetimibe in these patientscan be advised.
aCentre de Recerca Biomedica and bServei deMedicina Interna, Hospital Universitari Sant Joan,Reus, Spain.
Sponsorship: This study was financially supported bythe Fondo de Investigacion Sanitaria (FIS PI041752)and RC/MN (C03/08). B.C. is the recipient of a careerdevelopment award from the Instituto de SaludCarlos III.
Received: 25 April 2006; accepted: 10 May 2006.
opyright © Lippincott Williams & Wilkins. Unauth
References
1. Friis-Møller N, Sabin CA, Weber R, d’Arminio Monforte A, El-Sadr WM, Reiss P, et al., the Data Collection on Adverse Eventsof Anti-HIV Drugs (DAD) Study Group. Combination antire-troviral therapy and the risk of myocardial infarction. N Engl JMed 2003; 349:1993–2003.
2. d’Arminio Monforte A, Sabin CA, Phillips AN, Reiss P, Weber R,Kirk O, et al., the Writing Committee of the DAD Study Group.Cardio- and cerebrovascular events in HIV-infected persons.AIDS 2004; 18:1811–1817.
3. Schambelan M, Benson CA, Carr A, Currier JS, Dube MP, GerberJG, et al. for the International AIDS Society – USA. Manage-ment of metabolic complications associated with antiretroviraltherapy for HIV-1 infection: recommendations of an Interna-tional AIDS Society – USA panel. J Acquir Immune Defic Syndr2002; 31:257–275.
4. Williams D, Feely J. Pharmacokinetic-pharmacodynamic druginteractions with HMG-CoA reductase inhibitors. Clin Pharma-cokinet 2002; 41:343–370.
5. Ballantyne CM, Houri J, Notarbartolo A, Melani L, Lipka LJ,Suresh R, et al., the Ezetimibe Study Group. Effect of ezetimibecoadministered with atorvastatin in 628 patients with primaryhypercholesterolemia: a prospective, randomized, double-blind trial. Circulation 2003; 107:2409–2415.
6. Bonetti PO, Pumper GM, Higano ST, Holmes DR Jr, Kuvin JT,Lerman A. Noninvasive identification of patients with earlycoronary atherosclerosis by assessment of digital reactivehyperemia. J Am Coll Cardiol 2004; 44:2137–2141.
7. Chuck SK, Penzak SR. Risk–benefit of HMG-CoA reductaseinhibitors in the treatment of HIV protease inhibitor-relatedhyperlipidaemia. Expert Opin Drug Safety 2002; 1:5–17.
8. Hsyu PH, Schultz-Smith MD, Lillibridge JH, Lewis RH, Kerr BM.Pharmacokinetic interactions between nelfinavir and 3-hydro-xy-3-methylglutaryl coenzyme A reductase inhibitors atorvas-tatin and simvastatin. Antimicrob Agents Chemother 2001;45:3445–3450.
9. Fichtenbaum CJ, Gerber JG, Rosenkranz SL, Segal Y, Aberg JA,Blaschke T, et al., the NIAID AIDS Clinical Trials Group.Pharmacokinetic interactions between protease inhibitorsand statins in HIV seronegative volunteers: ACTG StudyA5047. AIDS 2002; 16:569–577.
10. Benesic A, Zilly M, Kluge F, Weissbrich B, Winzer R, Klinker H,Langmann P. Lipid lowering therapy with fluvastatin andpravastatin in patients with HIV infection and antiretroviraltherapy: comparison of efficacy and interaction with indinavir.Infection 2004; 32:229–233.
11. Doser N, Kubli S, Telenti A, Marzolini C, Chave JP, Feihl F, et al.Efficacy and safety of fluvastatin in hyperlipidemic proteaseinhibitor-treated HIV-infected patients. AIDS 2002; 16:1982–1983.
12. Nutescu EA, Shapiro NL. Ezetimibe: a selective cholesterolabsorption inhibitor. Pharmacotherapy 2003; 23:1463–1474.
13. Donati KG, Rabagliati R, Iacoviello L, Cauda R. HIV infection,HAART, and endothelial adhesion molecules: current perspec-tives. Lancet Infect Dis 2004; 4:213–222.
14. Nolan D, Watts GF, Herrmann SE, French MA, John M, Mallal S.Endothelial function in HIV-infected patients receiving pro-tease inhibitor therapy: does immune competence affectcardiovascular risk? Q J Med 2003; 96:825–832.
15. Bonetti PO, Lerman LO, Lerman A. Endothelial dysfunction: amarker of atherosclerotic risk. Arterioscler Thromb Vasc Biol2003; 23:169–175.
orized reproduction of this article is prohibited.
Copyright © 2022 FDOKUMEN


![Free Indirect Discourse for the Naive [Edited transcript of talk, 2013]](https://static.fdokumen.com/doc/165x107/63128fbb3ed465f0570a4970/free-indirect-discourse-for-the-naive-edited-transcript-of-talk-2013.jpg)