Variability of Growth in Children Starting Antiretroviral Treatment in Southern Africa
12
Variability of Growth in Children Starting Antiretroviral Treatment in Southern Africa WHAT’S KNOWN ON THIS SUBJECT: HIV-infected children on antiretroviral therapy in low-income settings show initial catch-up in weight and height growth during the first years of treatment, but long-term outcomes remain unknown. WHAT THIS STUDY ADDS: We demonstrate that even after 3 years on antiretroviral therapy, normal values were not reached. Although catch-up growth in weight stagnated after the first year, catch-up growth in height was slower but continued over the whole period. abstract BACKGROUND: Poor growth is an indication for antiretroviral therapy (ART) and a criterion for treatment failure. We examined variability in growth response to ART in 12 programs in Malawi, Zambia, Zimbabwe, Mozambique, and South Africa. METHODS: Treatment naïve children aged ,10 years were included. We calculated weight for age z scores (WAZs), height for age z scores (HAZs), and weight for height z scores (WHZs) up to 3 years after starting ART, by using the World Health Organization standards. Mul- tilevel regression models were used. RESULTS: A total of 17 990 children (range, 238–8975) were followed for 36 181 person-years. At ART initiation, most children were under- weight (50%) and stunted (66%). Lower baseline WAZ, HAZ, and WHZ were the most important determinants of faster catch-up growth on ART. WAZ and WHZ increased rapidly in the first year and stagnated or reversed thereafter, whereas HAZ increased continuously over time. Three years after starting ART, WAZ ranged from 22.80 (95% confi- dence interval [CI]: 23.66 to 22.02) to 21.98 (95% CI: 22.41 to 2 1.48) in children with a baseline z score ,23 and from 20.79 (95% CI: 21.62 to 0.02) to 0.05 (95% CI: 20.42 to 0.51) in children with a baseline WAZ $ 21. For HAZ, the corresponding range was 22.33 (95% CI: 22.62 to 22.02) to 21.27 (95% CI: 21.58 to 21.00) for baseline HAZ ,23 and 20.24 (95% CI: 20.56 to 0.15) to 0.84 (95% CI: 0.53 to 1.16) for HAZ $ 21. CONCLUSIONS: Despite a sustained growth response and catch-up growth in children with advanced HIV disease treated with ART, normal weights and heights are not achieved over 3 years of ART. Pediatrics 2012;130:e966–e977 AUTHORS: Thomas Gsponer, PhD, a Ralf Weigel, MD, MSc, b,c Mary-Ann Davies, MD, d Carolyn Bolton, MD, e,f Harry Moultrie, MD, g,h Paula Vaz, MD, i Helena Rabie, MD, j Karl Technau, MD, MSc, h,k James Ndirangu, MSc, l Brian Eley, MD, m Daniela Garone, MD, n Maureen Wellington, MD, o Janet Giddy, MD, p Jochen Ehmer, MD, q Matthias Egger, MD, MSc, a and Olivia Keiser, PhD, a for IeDEA Southern Africa a Institute of Social and Preventive Medicine, University of Bern, Bern, Switzerland; b Lighthouse Trust Clinic, Kamuzu Central Hospital, Lilongwe, Malawi; c Liverpool School of Tropical Medicine, Liverpool, United Kingdom; d School of Public Health and Family Medicine, University of Cape Town, Cape Town, South Africa; e Centre for Infectious Disease Research in Zambia, Lusaka, Zambia; f University of Alabama, Birmingham, Alabama; g Wits Reproductive Health and HIV Institute (Harriet Shezi Children’ s Clinic, Chris Hani Baragwanath Hospital, Soweto); h University of Witwatersrand, Johannesburg, South Africa; i Paediatric Day Hospital, Maputo, Mozambique; j Tygerberg Academic Hospital, University of Stellenbosch, Stellenbosch, South Africa; k Empilweni Services and Research Unit (Rahima Moosa Mother and Child Hospital, Johannesburg); l Africa Centre for Health and Population Studies, University of KwaZulu-Natal, Somkhele, South Africa; m Red Cross Children’ s Hospital and School of Child and Adolescent Health, University of Cape Town, Cape Town, South Africa; n Médecins Sans Frontières (MSF) South Africa, Khayelitsha, Cape Town, South Africa; o Newlands Clinic, Harare, Zimbabwe; p Sinikithemba Clinic, McCord Hospital, Durban, South Africa; and q SolidarMed ART Programme, Zaka and Bikita Districts, Zimbabwe KEY WORDS HIV, growth, antiretroviral therapy, Southern Africa ABBREVIATIONS ART—antiretroviral therapy CI—confidence interval HAZ—height for age z score IeDEA-SA—International Epidemiological Databases to Evaluate AIDS, Southern Africa IQR—interquartile range LPV/r—lopinavir/ritonavir NNRTI—nonnucleoside reverse transcriptase inhibitor PI—protease inhibitor WAZ—weight for age z score WHZ—weight for height z score WHO—World Health Organization (Continued on last page) e966 GSPONER et al
-
Upload
independent -
Category
Documents
-
view
2 -
download
0
Transcript of Variability of Growth in Children Starting Antiretroviral Treatment in Southern Africa

Variability of Growth in Children Starting AntiretroviralTreatment in Southern Africa
WHAT’S KNOWN ON THIS SUBJECT: HIV-infected children onantiretroviral therapy in low-income settings show initial catch-upin weight and height growth during the first years of treatment,but long-term outcomes remain unknown.
WHAT THIS STUDY ADDS: We demonstrate that even after 3 yearson antiretroviral therapy, normal values were not reached.Although catch-up growth in weight stagnated after the first year,catch-up growth in height was slower but continued over thewhole period.
abstractBACKGROUND: Poor growth is an indication for antiretroviral therapy(ART) and a criterion for treatment failure. We examined variability ingrowth response to ART in 12 programs in Malawi, Zambia, Zimbabwe,Mozambique, and South Africa.
METHODS: Treatment naïve children aged ,10 years were included.We calculated weight for age z scores (WAZs), height for age z scores(HAZs), and weight for height z scores (WHZs) up to 3 years afterstarting ART, by using the World Health Organization standards. Mul-tilevel regression models were used.
RESULTS: A total of 17 990 children (range, 238–8975) were followedfor 36 181 person-years. At ART initiation, most children were under-weight (50%) and stunted (66%). Lower baseline WAZ, HAZ, and WHZwere the most important determinants of faster catch-up growth onART. WAZ and WHZ increased rapidly in the first year and stagnated orreversed thereafter, whereas HAZ increased continuously over time.Three years after starting ART, WAZ ranged from 22.80 (95% confi-dence interval [CI]: 23.66 to 22.02) to 21.98 (95% CI: 22.41 to 21.48) in children with a baseline z score , 23 and from 20.79 (95%CI: 21.62 to 0.02) to 0.05 (95% CI: 20.42 to 0.51) in children witha baseline WAZ $ 21. For HAZ, the corresponding range was 22.33(95% CI: 22.62 to 22.02) to 21.27 (95% CI: 21.58 to 21.00) forbaseline HAZ , 23 and 20.24 (95% CI: 20.56 to 0.15) to 0.84 (95%CI: 0.53 to 1.16) for HAZ $ 21.
CONCLUSIONS: Despite a sustained growth response and catch-upgrowth in children with advanced HIV disease treated with ART, normalweights and heights are not achieved over 3 years of ART. Pediatrics2012;130:e966–e977
AUTHORS: Thomas Gsponer, PhD,a Ralf Weigel, MD, MSc,b,c
Mary-Ann Davies, MD,d Carolyn Bolton, MD,e,f HarryMoultrie, MD,g,h Paula Vaz, MD,i Helena Rabie, MD,j KarlTechnau, MD, MSc,h,k James Ndirangu, MSc,l Brian Eley,MD,m Daniela Garone, MD,n Maureen Wellington, MD,o
Janet Giddy, MD,p Jochen Ehmer, MD,q Matthias Egger, MD,MSc,a and Olivia Keiser, PhD,a for IeDEA Southern AfricaaInstitute of Social and Preventive Medicine, University of Bern,Bern, Switzerland; bLighthouse Trust Clinic, Kamuzu CentralHospital, Lilongwe, Malawi; cLiverpool School of TropicalMedicine, Liverpool, United Kingdom; dSchool of Public Health andFamily Medicine, University of Cape Town, Cape Town, SouthAfrica; eCentre for Infectious Disease Research in Zambia,Lusaka, Zambia; fUniversity of Alabama, Birmingham, Alabama;gWits Reproductive Health and HIV Institute (Harriet SheziChildren’s Clinic, Chris Hani Baragwanath Hospital, Soweto);hUniversity of Witwatersrand, Johannesburg, South Africa;iPaediatric Day Hospital, Maputo, Mozambique; jTygerbergAcademic Hospital, University of Stellenbosch, Stellenbosch,South Africa; kEmpilweni Services and Research Unit (RahimaMoosa Mother and Child Hospital, Johannesburg); lAfrica Centrefor Health and Population Studies, University of KwaZulu-Natal,Somkhele, South Africa; mRed Cross Children’s Hospital andSchool of Child and Adolescent Health, University of Cape Town,Cape Town, South Africa; nMédecins Sans Frontières (MSF) SouthAfrica, Khayelitsha, Cape Town, South Africa; oNewlands Clinic,Harare, Zimbabwe; pSinikithemba Clinic, McCord Hospital,Durban, South Africa; and qSolidarMed ART Programme, Zakaand Bikita Districts, Zimbabwe
KEY WORDSHIV, growth, antiretroviral therapy, Southern Africa
ABBREVIATIONSART—antiretroviral therapyCI—confidence intervalHAZ—height for age z scoreIeDEA-SA—International Epidemiological Databases to EvaluateAIDS, Southern AfricaIQR—interquartile rangeLPV/r—lopinavir/ritonavirNNRTI—nonnucleoside reverse transcriptase inhibitorPI—protease inhibitorWAZ—weight for age z scoreWHZ—weight for height z scoreWHO—World Health Organization
(Continued on last page)
e966 GSPONER et al

Growth retardation is common amongHIV-infected children in general and inparticular in low income settings.1–3
Reasons for growth retardation aremultifactorial and include genetic andenvironmental factors such as poornutrition, low socioeconomic status,and infection by different pathogens.4,5
All of these factors are interrelated andmay decrease immunity and lead tomalabsorption of food and to endocrinedysfunction.6 Growth monitoring identi-fies HIV-infected children eligible forantiretroviral therapy (ART) and is usefulto assess response to therapy,1,7 and it isparticularly important in many settingsin sub-Saharan Africa with limited ac-cess to CD4 count and viral load moni-toring to assess treatment failure.
Although most studies from sub-Saharan Africa described positiveshort-term responses of weight andheight,8–10 results were not consistentand only few studies revealed growthresponse beyond 2 years on ART11–13;several studies revealed no improve-ments in height9,13,14 or stagnation af-ter a short time period,15 whereasothers revealed continuous improve-ments.1,12,16–18 Similarly, most studiesrevealed marked improvements inweight gain after ART start,1,12,16,19 butsome studies revealed no improve-ments.11,20 The short follow-up dura-tion, wide age range (including manyolder children starting ART as theyapproach puberty), and the variabilityin access to virologic monitoring couldexplain some of the differences andalso be a reason that, in general, valuessimilar to those of HIV-uninfected chil-dren were not reached in resource-limited settings.
The aim of this study is to describegrowth responses up to 3 years afterART initiation, to describe variability ofgrowth response between differentcohorts, and to examine associationsbetween patient and site characteristicswithgrowth response inSouthernAfrica.
METHODS
Study Population
The International Epidemiological Data-bases to Evaluate AIDS, Southern Africa(IeDEA-SA) collaboration includes 24programs in 6 southern African coun-tries (www.iedea-sa.org). Data are col-lected at each site as part of routinemonitoring at baseline (ART initiation)and each follow-up visit, by using stan-dardized definitions. Data from the dif-ferent sites are transferred to datacenters at the Universities of CapeTown, South Africa, or Bern, Switzer-land, in a standardized format andmerged at regular intervals. All IeDEA-SA sites with at least 100 children onART were included.
ART-naïve children who initiatedtreatment with at least 3 antiretroviraldrugs at age ,10 years were in-cluded. We excluded children whowere transferred from another site. Achild was considered lost to follow-up if the time between the last visitand the closing date of the cohortwas longer than 6 months. Weightand height measurements were con-verted into age- and gender-adjusted zscores by using the latest WorldHealth Organization (WHO) growthstandards from 2007.21 Underweightwas defined as weight for age z score(WAZ) , 22, stunting as height forage z score (HAZ) , 22, and wastingas weight for height z score (WHZ) ,22. For WHZ, the analysis was limitedto children aged 2 to 5 years becauseWHO reference values were onlyavailable for this age group. We tookweight and height measurements andCD4 cell counts closest to the startingdate of ART (26 months/+1 week) asbaseline values.
Statistical Analysis
We used a multilevel model to accountfor the hierarchical structure ofthe data (ie, repeated anthropomet-ric measurements within a child
and children belonging to differ-ent cohorts). To model the nonlinearincrease of the anthropometric mea-surements on ART over time mostaccurately, we used a second orderfractionalpolynomial transformationoftime22 as described previously.1 Allavailable weight and height measure-ments from ART initiation up to 3 yearsafterward were included in the analy-sis, provided the child had a baselineand at least 1 weight or height mea-surement after the start of ART. Theadjusted model included the followingvariables at ART initiation: gender; age(,2, 2–4, and 5–10 years); WAZ, HAZ,and WHZ (,23, $23 to ,22, $22to,21, and$21); WHO clinical stage(1 or 2, 3, and 4); degree of immu-nodeficiency (“severe,” “advanced,”“mild,” and “asymptomatic” accordingto WHO criteria23); type of ART regimen(nonnucleoside reverse transcriptaseinhibitor [NNRTI]-based, protease in-hibitor [PI]-based, other, and un-known); and time period of ART start(1997–2005, 2005–2006, 2006–2007,and 2008–2010). We also includedinteractions between time and allbaseline variables because it can beexpected that growth response variesby baseline variables. The model wasfitted by using a fully probabilistic ap-proach (see Appendix). The model fitwas visually assessed by plotting thepredicted median with 95% predictionintervals and the observed trajectoriesfor individual children and by the de-viance information criterion. Missingvalues of stage of disease, degree ofimmunodeficiency, and type of regimenwere imputed. We used multinomialregression models with stage of dis-ease, degree of immunodeficiency, andtype of regimen as outcome and age,gender, year of starting ART, andbaseline z score at start of ART aspredictors. Missing data were imputedby randomly sampling from the pre-dictive multinomial distribution. Crudeand adjusted estimates of z scores
ARTICLE
PEDIATRICS Volume 130, Number 4, October 2012 e967
were shown over time and by treat-ment site. In addition, we created 1000z-score trajectories based on the ad-justed model and calculated the per-centages of children in each z-scorecategory over time. We performed 2additional analyses: a complete caseanalysis without multiple imputationand an analysis where we includedonly children who were followed for atleast 3 years. A particular risk factorwas defined as being associated withfaster catch-up growth if it was asso-ciated with higher z scores at 1 yearafter initiating ART. All analyses weredone in R-2.11.1 (The R DevelopmentCore Team, University of Vienna, Vienna,Austria), Stata version 11 (Stata Corp,College Station, TX), and WinBUGS 1.4.3(Lunn et al 2010). In all sites, in-stitutional review boards approved theparticipation in IeDEA-SA.
RESULTS
Study Population and BaselineCharacteristics
A total of 17 990 children from 12 pro-grams in Malawi, Zambia, Zimbabwe,Mozambique, and South Africa wereincluded and followed for 36 181person-years from date of ART initia-tion. Table 1 shows the characteristicsof the sites and gives more details onanthropometric measurements andfood supplementation. In the first 3years after ART start, 1183 childrendied (rate 3.3 per 100 person-years),2611 were lost to follow-up (7.2 per 100person-years), and 878 were trans-ferred out of care in the particularsites (2.4 per 100 person-years).
Table 2 shows the characteristics of thechildren at ART initiation by treatmentsite. One-third of children were aged#2 years, and 37.8% were 5 years orolder. Most children were underweight(49.7%) and stunted (66.1%). The me-dian number of measurements afterstart of ARTwas 6 (interquartile range[IQR]: 2–13) for weight and 4 (IQR:
1–10) for height. The 17 990 childrenincluded in the analysis contributed 154775 weight measurements and 123 006height measurements. A total of 11 015children had a baseline height availableand were thus included in the analysisfor HAZ, and 4155 children were aged2 to 5 years and had a baseline weightand height available and were thus in-cluded in the analysis for WHZ.
Weight for Age
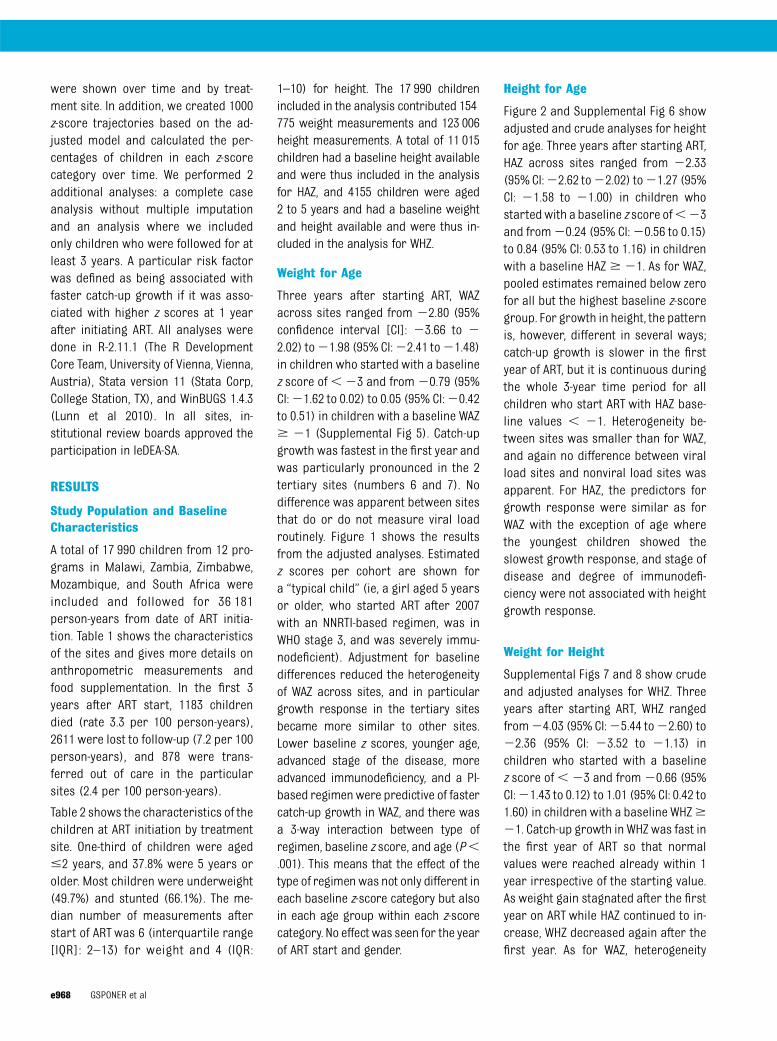
Three years after starting ART, WAZacross sites ranged from 22.80 (95%confidence interval [CI]: 23.66 to 22.02) to21.98 (95% CI:22.41 to21.48)in children who started with a baselinez score of,23 and from20.79 (95%CI:21.62 to 0.02) to 0.05 (95% CI:20.42to 0.51) in children with a baseline WAZ$ 21 (Supplemental Fig 5). Catch-upgrowth was fastest in the first year andwas particularly pronounced in the 2tertiary sites (numbers 6 and 7). Nodifference was apparent between sitesthat do or do not measure viral loadroutinely. Figure 1 shows the resultsfrom the adjusted analyses. Estimatedz scores per cohort are shown fora “typical child” (ie, a girl aged 5 yearsor older, who started ART after 2007with an NNRTI-based regimen, was inWHO stage 3, and was severely immu-nodeficient). Adjustment for baselinedifferences reduced the heterogeneityof WAZ across sites, and in particulargrowth response in the tertiary sitesbecame more similar to other sites.Lower baseline z scores, younger age,advanced stage of the disease, moreadvanced immunodeficiency, and a PI-based regimenwere predictive of fastercatch-up growth in WAZ, and there wasa 3-way interaction between type ofregimen, baseline z score, and age (P,.001). This means that the effect of thetype of regimenwas not only different ineach baseline z-score category but alsoin each age group within each z-scorecategory. No effect was seen for the yearof ART start and gender.
Height for Age
Figure 2 and Supplemental Fig 6 showadjusted and crude analyses for heightfor age. Three years after starting ART,HAZ across sites ranged from 22.33(95% CI:22.62 to22.02) to21.27 (95%CI: 21.58 to 21.00) in children whostartedwith a baseline z score of,23and from20.24 (95% CI:20.56 to 0.15)to 0.84 (95% CI: 0.53 to 1.16) in childrenwith a baseline HAZ$ 21. As for WAZ,pooled estimates remained below zerofor all but the highest baseline z-scoregroup. For growth in height, the patternis, however, different in several ways;catch-up growth is slower in the firstyear of ART, but it is continuous duringthe whole 3-year time period for allchildren who start ART with HAZ base-line values , 21. Heterogeneity be-tween sites was smaller than for WAZ,and again no difference between viralload sites and nonviral load sites wasapparent. For HAZ, the predictors forgrowth response were similar as forWAZ with the exception of age wherethe youngest children showed theslowest growth response, and stage ofdisease and degree of immunodefi-ciency were not associated with heightgrowth response.
Weight for Height
Supplemental Figs 7 and 8 show crudeand adjusted analyses for WHZ. Threeyears after starting ART, WHZ rangedfrom24.03 (95% CI:25.44 to22.60) to22.36 (95% CI: 23.52 to 21.13) inchildren who started with a baselinez score of,23 and from20.66 (95%CI:21.43 to 0.12) to 1.01 (95% CI: 0.42 to1.60) in children with a baseline WHZ$21. Catch-up growth in WHZ was fast inthe first year of ART so that normalvalues were reached already within 1year irrespective of the starting value.As weight gain stagnated after the firstyear on ART while HAZ continued to in-crease, WHZ decreased again after thefirst year. As for WAZ, heterogeneity
e968 GSPONER et al

TABLE1
Characteristicsof
Treatm
entProgramsProvidingARTto
Childrenin
Southern
Africa
Nameof
Treatm
ent
Program
Harriet
Shezi
Khayelitsha
McCord
Hlabisa
Rahima
Moosa
Red
Cross
Tygerberg
Light-house
CIDR
Z-MOH
Pediatric
Day
Newlands
Clinic
SMART-ZIM
Country(City/
Province)
South
Africa
(Sow
eto)
South
Africa
(Cape
Town)
South
Africa
(Durban)
South
Africa
(KwaZulu-
Natal)
South
Africa
(Johannes-
burg)
South
Africa
(Cape
Town)
South
Africa
(Cape
Town)
Malaw
i(Lilongwe)
Zambia
(Lusaka)
Mozam
bique
(Maputo)
Zimbabw
e(Harare)
Zimbabw
e(M
asvingo)
Levelofcare
Alllevels
Primary
Secondary
Primary/
secondary
Alllevels
Tertiary
Tertiary
Alllevels
Primary
Alllevels
Secondary
Primary/
secondary
Mainreasons
forentry
ofpatients
incohort
From ho
spital
wards,
referral
from
other
medical
facilities,
andTB
program
VCT, spontaneous
referral
Spontaneous
referral,
other
family
mem
bers
attending
theclinic
VCT, referral
from
other
sites
From ho
spital
wards,
tuberculosis
program,
orphans
program
Hospitalized
children
with
severe
OIsor
with
advanced
HIV
infection
Referral
from
other
medical
facilities,
from
clinical
research
center
VCT, spontaneous
referral
Referral
from
VCT
andOPD
From ho
spital
wards,
referral
from
other
medical
facilities
Referral
from
other
sites
VCT,referral
from
other
medical
facilities
Routineviralload
monitoring
Yes
Yes
Yes
Yes
Yes
Yes
Yes
NoNo
NoNo
No
Second-line
therapy
available
Yes
Yes
Yes
Yes
Yes
Yes
Yes
Yes
Yes
Yes
Yes
No
Weight
Weightingscale
Children,
2y
Digital
Yes
Yes
Yes
Yes
Yes
Yes
Yes
NoYes
NoNo
NoMechanical
NoNo
NoNo
NoNo
NoYes
NoYes
Yes
Yes
Children$
2y
Digital
NoNo
Yes
Yes
Yes
Yes
Yes
Yes
Yes
NoNo
NoMechanical
Yes
Yes
NoNo
NoNo
NoNo
NoYes
Yes
Yes
Standardized
approach
forclothesa
Yes
Yes
Yes
Yes
Yes
Yes
Yes
Yes
Yes
Yes
Yes
No
Regular
calibration
NoYes
Yes
Yes
NoYes
Yes
Yes
NoYes
NoNo
Height
Children,
2y
measured
whilelying
onback?
Yes
NoYes
Yes
Yes
Yes
Yes
Yes
Yes
Yes
Yes
Yes
Wall-m
ounted
grow
thchart
Yes
Yes
Yes
NoNo
Yes
NoNo
Yes
NoYes
Yes
Standardized
approach
for
shoes?
a
Yes
Yes
Yes
Yes
Yes
Yes
Yes
Yes
Yes
Yes
Yes
No
ARTICLE
PEDIATRICS Volume 130, Number 4, October 2012 e969

across sites was substantial, andadjusting for differences in baselinevariables reduced the heterogeneityonly slightly. Lower baseline z scores,male gender, and severe immunodefi-ciency were predictive for faster catch-up growth in WHZ. No clear effect wasseen for the year of ART start and typeof regimen.
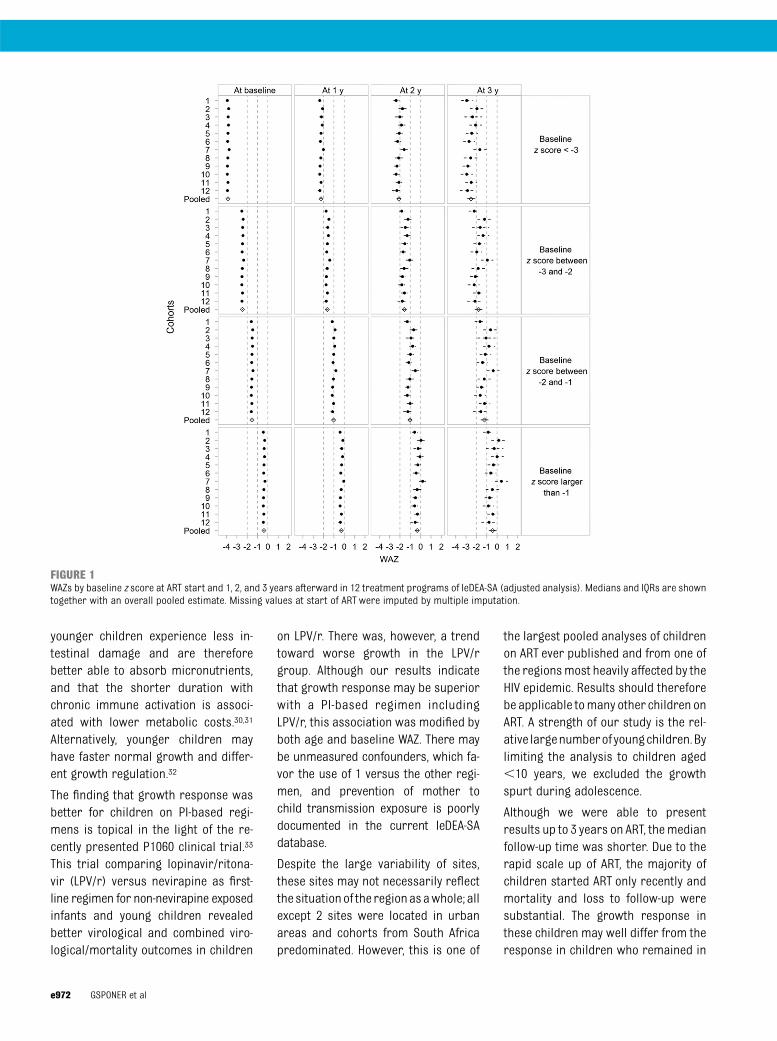
Figure 3 shows the overall pooledestimates across the sites for WAZ, HAZ,and WHZ. The results from the com-plete case and for the multiple impu-tation were similar, whereas childrenwho were followed during the wholetime period had a slightly bettergrowth response (Supplemental Table3). For children who were followed for3 years, the proportion of children indifferent z-score categories over timeis shown in Fig 4. Although over 60%reached WAZ . 21, 46% reached HAZ. 21. For WHZ, this proportion in-creased rapidly to 90% within 1 yearbut decreased again later to over 50%.
DISCUSSION
This collaborative analysis of ~18 000children in 12 ART programs revealedthat although WAZ and WHZ improvedduring the first years of ART, there wasa reversed trend from year 2 onwards.Although catch-up growth in weightwas faster initially, catch-up growth inheight was more constant and contin-ued over the whole 3-year time period.Only children with baseline WAZ andHAZ . 21 approached normal valueswithin 3 years irrespective of age. Inmultivariable analyses, lower baselineWAZ, HAZ, and WHZ were the most im-portant determinants of faster catch-up growth on ART. The use of a PI-basedregimen was associated with fastercatch-up growth in weight and height,whereas other variables were associ-ated only with growth in WAZ (youngerage, advanced stage of the disease) orin height (old age) or not at all (gender,year of ART start).
Few studies have directly comparedweightandheightgrowthbycalculatingWHZ24 or BMI2,25–27 and data are there-fore limited. Because children wereunderweight and stunted and catch-upgrowth in the first year of ART wasparticularly fast for WAZ, the degree ofwasting was only moderate and nor-malized rapidly within 1 year. Althoughthe consistent increase in HAZ over 3years is reassuring, the reasons for theincrease in the proportion of childrenwho are underweight or wasted after 2years on ART need to be studied further.
Our findings differ substantially fromgrowth patterns in high-income set-tings; in our study, normal values ofWAZand HAZ were not reached despite ob-servinggrowthoveranextendedperiodof time. In contrast, in a study of ART-naïve children in the United States,normal WAZ and HAZwere reached after1 and 2 years of ART, respectively,2 butbaseline z scores were much higher. Astudy comparing children from Ugandaand the United Kingdom and Ireland15
revealed that the median change in HAZafter 12 months on ART was smaller inUganda with differences being attrib-uted to lower baseline levels in Ugandanchildren. In a European study includingnonnaïve children,25 it took 5 years toreach normal WAZ, and HAZ did notreach normal values.
We found that the baseline z scoreswere the most important predictors ofgrowth response. However, althoughthe more severely underweight chil-dren showed a more rapid catch-upgrowth on ART, they did not reach thesame weight as children who startedwith higher values. The associationbetween age and growth response wassmaller and less consistent acrossstudies; we and others found thatyoung age is associated with a morerapid catch-up growth in weight butnot height,24 whereas other studiesrevealed associations with weight andheight.2,28,29 It has been speculated thatTA
BLE1
Continued
Nameof
Treatm
ent
Program
Harriet
Shezi
Khayelitsha
McCord
Hlabisa
Rahima
Moosa
Red
Cross
Tygerberg
Light-house
CIDR
Z-MOH
Pediatric
Day
Newlands
Clinic
SMART-ZIM
Food
supplement
Foracutely
malnourished
children
Yes
Yes
Yes
Yes
Yes
Yes
Yes
Yes
NoYes
Yes
Yes
Forchronically
malnourished
children
Yes
Yes
Yes
Yes
Yes
Yes
Yes
Yes
NoYes
Yes
No
CIDR
Z-MOH
,CentreforInfectious
DiseaseResearch
inZambia-M
inistryofHealth;NA,notavailable;OI,opportunisticinfection;OPD,outpatientdepartment;SM
ART-ZIM,Solidarmed
ARTProgrammeZimbabw
e;TB,tuberculosis;VCT,voluntarycounselingand
testing.
aThestandardizationwas
withinandnotbetweensites.
e970 GSPONER et al

TABLE2
Characteristicsof
ChildrenStartingART
Characteristic
StudySite
12
34
56
78
910
1112
Patients,n(%
oftotalchildren)
1987
(11.1)
615(3.4)
345(1.9)
951(5.3)
975(5.4)
829(4.6)
1047
(5.8)
486(2.7)
8975
(49.9)
1048
(5.8)
494(2.8)
238(1.3)
Age,median(IQ
R),m
o4.0(1.7–6.7)
3.2(1.6–5.4)
5.3(2.4–7.2)
4.1(1.7–6.8)
3.3(1.2–6.1)
1.3(0.5–3.6)
1.5(0.6–4.3)
5.7(3.4–7.9)
3.6(1.6–6.8)
3.0(1.5–5.4)
6.4(3.4–8.4)
5.3(1.7–8.1)
Agegroup,n(%
),y
,2
580(29.2)
200(32.5)
70(20.3)
286(30.1)
364(37.3)
518(62.5)
599(57.2)
37(7.6)
2873
(32.0)
367(35.0)
59(11.9)
69(11.9)
2–5
593(29.8)
230(37.4)
92(26.7)
265(27.9)
273(28.0)
156(18.8)
215(20.5)
166(34.2)
2644
(29.5)
374(35.7)
126(25.5)
126(25.5)
5–10
814(41.0)
185(30.1)
183(53.0)
400(42.1)
338(34.7)
155(18.7)
233(22.3)
283(58.2)
3458
(38.5)
307(29.3)
309(62.6)
309(62.6)
Gender
Girl,n
(%)
979(49.3)
290(47.2)
159(46.1)
477(50.2)
484(49.6)
401(48.4)
519(49.6)
243(50.0)
4442
(49.5)
503(48.0)
254(51.4)
123(51.7)
WAZ M
edian(IQ
R)21.91
(23.07
to21.01)
21.00
(21.92
to20.13)
21.41
(22.42
to20.63)
21.25
(22.34
to20.39)
21.92
(23.07
to20.95)
22.51
(23.87
to21.37)
21.82
(23.44
to20.67)
21.70
(23.0
to20.72)
22.20
(23.42
to21.13)
21.57
(22.63
to20.74)
21.78
(22.79
to20.96)
21.84
(23.14
to20.98)
Underw
eight,n(%
)883/1844
(47.9)
104/443(23.5)
39/124
(31.5)
279/869(32.1)
328/674(48.7)
487/807(60.4)
291/620(46.9)
97/225
(43.1)
4679/8553(54.7)
370/977(37.9)
187/423(44.2)
93/198
(47.0)
HAZ Median(IQ
R)22.55
(23.50
to21.63)
22.32
(23.03
to21.60)
21.75
(22.99
to20.97)
21.90
(22.69
to20.32)
22.35
(23.42
to21.23)
22.61
(23.65
to21.68)
22.29
(23.44
to21.16)
22.58
(23.55
to21.00)
22.84
(24.07
to21.69)
22.80
(23.80
to21.64)
22.39
(23.30
to21.59)
NA
Stunted,n(%
)1216/1828(66.5)
69/118
(58.5)
35/77(45.5)
28/62(45.2)
388/665(58.4)
491/753(65.2)
321/578(55.5)
37/60(61.7)
3810/5532(68.9)
626/921(68.0)
262/421(62.2)
NAWHZ M
edian(IQ
R)0.10
(23.49
to2.23)
0.80
(20.78
to2.65)
0.46
(23.33
to3.06)
23.36
(25.51
to2.32)
0.03
(23.97
to2.29)
20.14
(24.54
to3.16)
0.32
(23.14
to3.47)
0.87
(22.72
to3.13)
20.34
(24.95
to23.18)
0.71
(23.41
to3.63)
0.10
(22.98
to2.43)
NA
Wasted,n(%
)53/581
(9.1)
0/96
(0)
3/43
(7.0)
(5/8)(62.5)
34/245
(13.9)
21/148
(14.2)
14/169
(8.2)
8/77
(10.4)
483/2305
(21.0)
34/369
(9.2)
5/114(4.4)
NACD4cellpercentage
n1787
389
164
798
663
802
805
276
5710
711
1620
Median(IQ
R)11.4(7.0–16.0)
14.0(10.0–20.0)
9.4(5–14.2)
14.0(7.0–16.0)12.2(7.1–18.2)12.4(7.7–19.5)16.7(11.0–24.0)11.5(7.6–15.4)
14.4(9.7–20.6)
13.2(9.2–17.7)12.0(10.3–16.0)17.0(11.8–25.5)
Immunodeficiency
No.ofobservations
1784
413
185
799
661
802
826
297
6311
709
272
85Notsignificant,n
(%)
221(12.4)
63(15.3)
14(7.6)
116(14.5)
82(12.4)
67(8.4)
135(16.3)
56(18.9)
1076
(17.1)
91(12.8)
39(14.3)
3(3.5)
Mild,n
(%)
173(9.7)
44(10.7)
18(9.7)
100(12.5)
54(8.2)
65(8.1)
98(11.9)
45(15.2)
802(12.7)
71(10.0)
43(15.8)
9(10.6)
Advanced,n
(%)
293(16.4)
57(13.8)
34(18.4)
152(19.0)
100(15.1)
115(14.3)
128(15.5)
55(18.5)
1330
(21.1)
107(15.1)
69(25.4)
24(28.2)
Severe,n
(%)
1097
(61.5)
249(60.3)
119(64.3)
431(53.9)
425(64.3)
555(69.2)
49(57.7)
141(47.5)
3103
(49.2)
440(62.1)
121(44.5)
49(57.7)
WHO
clinicalstages
3and4,n/total(%)
867/1371
(63.2)
453/615(73.7)
NA702/863(81.3)
283/352(80.4)
714/810(88.2)
738/827(89.2)
419/436(96.1)
5957/8669(68.7)
735/934(78.7%
)40/48(83.3)
200/238(84.0)
Type
ofregimen,n
(%)
NNRTI-based
1054
(53.0)
377(61.3)
254(73.6)
604(63.5)
488(50.1)
358(43.2)
318(30.4)
486(100)
8451
(94.2)
92(8.8)
487(98.6)
238(100)
PI-based
640(32.2)
233(37.9)
81(23.5)
347(36.5)
386(39.6)
451(54.4)
610(58.3)
0(0)
4(0.04)
10(1.0)
5(1.0)
0(0)
Other/unknow
n293(14.8)
5(0.8)
10(2.9)
0(0)
101(10.4)
20(2.4)
119(11.4)
0(0)
520(5.8)
946(90.3)
2(0.4)
0(0)
Outcom
e,n(%
)b
Death
74(3.7)
14(2.3)
15(4.4)
39(4.1)
25(2.6)
116(14.0)
82(7.8)
21(4.3)
749(8.4)
9(0.9)
27(5.5)
12(5.0)
Loss
tofollow-up
4(0.2)
20(3.3)
8(2.8)
23(2.4)
101(10.4)
41(5.0)
74(7.3)
63(14.2)
2233
(27.4)
27(2.6)
0(0)
17(7.2)
Transfer-out
13(0.7)
0(0)
23(6.7)
32(3.4)
52(5.3)
375(45.2)
259(24.7)
107(22.0)
0(0)
13(1.2)
0(0)
4(1.7)
Follow-uptim
e,median(IQ
R),y
b
3.0(3.0–3.0)
3.0(3.0–3.0)
1.4(0.5–2.2)
3.0(3.0–3.0)
3.0(3.0–3.0)
1.3(0.6–3)
2.5(0.9–3)
1.2(0.4–2.5)
1.4(0.5–3.0)
3.0(3.0–3.0)
3.0(3.0–3.0)
3.0(3.0–3.0)
HAZ,height
foragezscore;NA,not
available;WAZ,w
eightforagezscore;WHZ,w
eightforheight
zscore.
aOnlyavailableforchildrenaged
2to5years.
bCensored
after3y.
ARTICLE
PEDIATRICS Volume 130, Number 4, October 2012 e971
younger children experience less in-testinal damage and are thereforebetter able to absorb micronutrients,and that the shorter duration withchronic immune activation is associ-ated with lower metabolic costs.30,31
Alternatively, younger children mayhave faster normal growth and differ-ent growth regulation.32
The finding that growth response wasbetter for children on PI-based regi-mens is topical in the light of the re-cently presented P1060 clinical trial.33
This trial comparing lopinavir/ritona-vir (LPV/r) versus nevirapine as first-line regimen for non-nevirapine exposedinfants and young children revealedbetter virological and combined viro-logical/mortality outcomes in children
on LPV/r. There was, however, a trendtoward worse growth in the LPV/rgroup. Although our results indicatethat growth response may be superiorwith a PI-based regimen includingLPV/r, this association was modified byboth age and baseline WAZ. There maybe unmeasured confounders, which fa-vor the use of 1 versus the other regi-men, and prevention of mother tochild transmission exposure is poorlydocumented in the current IeDEA-SAdatabase.
Despite the large variability of sites,these sites may not necessarily reflectthe situationof the regionasawhole; allexcept 2 sites were located in urbanareas and cohorts from South Africapredominated. However, this is one of
the largest pooled analyses of childrenon ART ever published and from one ofthe regionsmost heavily affected by theHIV epidemic. Results should thereforebe applicable tomany other children onART. A strength of our study is the rel-ative largenumberof youngchildren.Bylimiting the analysis to children aged,10 years, we excluded the growthspurt during adolescence.
Although we were able to presentresults up to 3 years on ART, themedianfollow-up time was shorter. Due to therapid scale up of ART, the majority ofchildren started ART only recently andmortality and loss to follow-up weresubstantial. The growth response inthese children may well differ from theresponse in children who remained in
FIGURE 1WAZs by baseline z score at ART start and 1, 2, and 3 years afterward in 12 treatment programs of IeDEA-SA (adjusted analysis). Medians and IQRs are showntogether with an overall pooled estimate. Missing values at start of ART were imputed by multiple imputation.
e972 GSPONER et al

care. Many studies have revealed thatmortality is high among patients lost tofollow-up,34,35 and they may have stop-ped taking ART. If sicker patients aremore likely to get lost, our analysisoverestimates growth response. Whenwe repeated the analysis with childrenremaining in care during the wholetime period, z scores were in generalsimilar or slightly higher. Therefore,loss to follow-up may not have dis-torted results to an important degree.
Many factors that could influencegrowth response were not recorded,whichmayexplainwhyadjusting for therecorded baseline variables reducedheterogeneity only moderately; we hadno individual level data on nutrition and
food supplementation, nor on socio-economic status, tuberculosis treat-ment, hemoglobin, birth weight, oradherence to therapy. The presence orabsence of peripheral edema was notrecorded and therefore a nutritionalassessment based on WHO definitionswas not possible. The provision offood supplementation that may haveaffected growth trajectories and mea-surements for shoes and clothes wereonly standardized within but not be-tween sites. Children with lower zscores may have received food sup-plements and may therefore have hada better growth response. Becausewe did an intention-to-treat analysis,we ignored treatment interruptions.
Further, stage of disease does not fullycapture the severity of different coin-fections. Similarly, the proportion ofmissing data was relatively high.Results were, however, similarif missing values were completed bymultiple imputation and in the com-plete case analysis. Other limitationsare that no standardized measure-ments of weight and heights weredone, and finally that no comparisonsto HIV-negative children were possiblefor the different sites.
CONCLUSIONS
This study demonstrated that althoughweight and height increased rapidly on
FIGURE 2HAZs by baseline z score at ART start and 1, 2, and 3 years afterward in 11 treatment programs of IeDEA-SA (adjusted analysis). Medians and IQRs are showntogether with an overall pooled estimate. Missing values at start of ART were imputed by multiple imputation. Cohort 12 is missing because no data aboutheights are collected.
ARTICLE
PEDIATRICS Volume 130, Number 4, October 2012 e973
ART and was particularly pronouncedforweight in thefirst yearofART,neitherweight nor height values normalizedduring 3 years of ART. There is an urgentneed to better understand the reasonsfor the large variability in growth re-sponse across sites and to betterdocument individual level and site levelcharacteristics that influence responseto therapy.
APPENDIX: FULL PROBABILITYMODEL
Let Yjk (t) denote the anthropometricmeasure be it WAZ, HAZ, or WHZ for
child j = 1,...,N at time t = 1,..., Twith timein years in cohort k = 1,..., K. The modelcan be written as
The error term ε represents the mea-surement error for each child, and inthe final model is a centered Student’s
FIGURE 3WAZs, HAZs, and WHZs by baseline z score at ART start and 1, 2, and 3 years afterward. Pooled adjusted estimates of treatment programs of IeDEA SouthernAfrica. Medians and IQRs are shown.
Yijk ¼ ajk þ bjk ×ti þ gjk ×ti ×logðtiÞ þ εijk ; εijk e N�0;s2�
ajk ¼ Xaak þ hjk ; hjkeN�0; t2a�bjk ¼ Xbbk þ zjk ; zjkeN
�0; t2b
�gjk ¼ Xggk þ jjk ; jjkeN
�0; t2g
�
ak ¼ Zaa0 þ hk ; hkeN�0; n2a�bk ¼ Zbb0 þ zk ; zkeN
�0; n2b
�gk ¼ Zgg0 þ jk ; jkeN
�0; n2g
�
e974 GSPONER et al
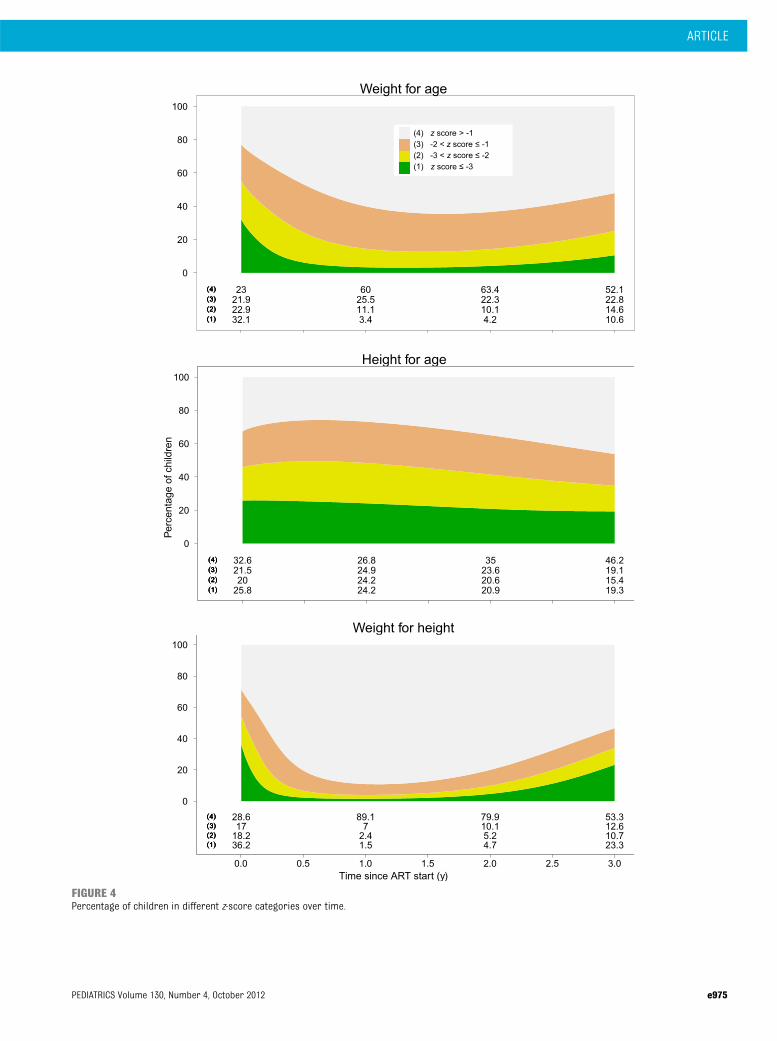
FIGURE 4Percentage of children in different z-score categories over time.
ARTICLE
PEDIATRICS Volume 130, Number 4, October 2012 e975
t test distribution with 3 degrees offreedom and scale parameter s2. Thechildren level random effects dis-tributions are centered Student’s ttest distributions as well with 3degrees of freedom and scale parame-ters ta
2, tb2, and tg
2. The cohort levelrandom effects distributions are cen-tered Student’s t test distributions with3 degrees of freedom and scaleparameters ya
2, yb2, and yg
2. Student’st test distributions were preferred
because these heavy tailed dis-tributions yield robust estimates andoutperform the model with normaldistribution in terms of the devianceinformation criterion.
The prior distributions for a0, b0, andg0 are centered normal with SD = 5. Forthe other a, b, and g parameters, thepriors are centered normalwith SD= 10.
The prior distributions for all scaleparameters are inverseg distributions
with shape and rate parameters equalto 1 and 0.01, respectively.
ACKNOWLEDGMENTSWe thank Marie-Louise Newell for help-ful comments and carefully reading thearticle. We thank all children whosedata were used in this study and theircaregivers. We also thank all who con-tributed to recording and entering dataand preparing and sending it to theIeDEA-SA collaboration.
REFERENCES
1. Weigel R, Phiri S, Chiputula F, et al. Growthresponse to antiretroviral treatment in HIV-infected children: a cohort study fromLilongwe, Malawi. Trop Med Int Health.2010;15(8):934–944
2. Nachman SA, Lindsey JC, Moye J, et al;Pediatric AIDS Clinical Trials Group 377Study Team. Growth of human immunode-ficiency virus-infected children receivinghighly active antiretroviral therapy. PediatrInfect Dis J. 2005;24(4):352–357
3. Sutcliffe CG, van Dijk JH, Munsanje B, et al.Weight and height z-scores improve afterinitiating ART among HIV-infected childrenin rural Zambia: a cohort study. BMC InfectDis. 2011;11(1):54
4. Arpadi SM. Growth failure in children withHIV infection. J Acquir Immune Defic Syndr.2000;25(suppl 1):S37–S42
5. Miller TL. Nutritional aspects of HIV-infected children receiving highly activeantiretroviral therapy. AIDS. 2003;17(suppl1):S130–S140
6. Arpadi SM, Cuff PA, Kotler DP, et al. Growthvelocity, fat-free mass and energy intakeare inversely related to viral load in HIV-infected children. J Nutr. 2000;130(10):2498–2502
7. Benjamin DK Jr, Miller WC, Ryder RW,Weber DJ, Walter E, McKinney RE Jr.Growth patterns reflect response toantiretroviral therapy in HIV-positiveinfants: potential utility in resource-poorsettings. AIDS Patient Care STDS. 2004;18(1):35–43
8. Wamalwa DC, Farquhar C, Obimbo EM, et al.Early response to highly active anti-retroviral therapy in HIV-1-infected Kenyanchildren. J Acquir Immune Defic Syndr.2007;45(3):311–317
9. Fassinou P, Elenga N, Rouet F, et al. Highlyactive antiretroviral therapies among
HIV-1-infected children in Abidjan, Côted’Ivoire. AIDS. 2004;18(14):1905–1913
10. Song R, Jelagat J, Dzombo D, et al. Efficacyof highly active antiretroviral therapy inHIV-1 infected children in Kenya. Pediatrics.2007;120(4). Available at: www.pediatrics.org/cgi/content/full/120/4/e856
11. Bolton-Moore C, Mubiana-Mbewe M,Cantrell RA, et al. Clinical outcomes andCD4 cell response in children receivingantiretroviral therapy at primary healthcare facilities in Zambia. JAMA. 2007;298(16):1888–1899
12. Kabue MM, Kekitiinwa A, Maganda A, RisserJM, Chan W, Kline MW. Growth in HIV-infected children receiving antiretroviraltherapy at a pediatric infectious diseasesclinic in Uganda. AIDS Patient Care STDS.2008;22(3):245–251
13. Nyandiko WM, Ayaya S, Nabakwe E, et al.Outcomes of HIV-infected orphaned andnon-orphaned children on antiretroviraltherapy in western Kenya. J Acquir ImmuneDefic Syndr. 2006;43(4):418–425
14. Reddi A, Leeper SC, Grobler AC, et al. Pre-liminary outcomes of a paediatric highlyactive antiretroviral therapy cohort fromKwaZulu-Natal, South Africa. BMC Pediatr.2007;7:13
15. Kekitiinwa A, Lee KJ, Walker AS, et al; Col-laborative HIV Paediatric Study (CHIPS)Steering Committee; Mulago Cohort Team.Differences in factors associated with initialgrowth, CD4, and viral load responses to ARTin HIV-infected children in Kampala, Uganda,and the United Kingdom/Ireland. J AcquirImmune Defic Syndr. 2008;49(4):384–392
16. Naidoo R, Rennert W, Lung A, Naidoo K,McKerrow N. The influence of nutritionalstatus on the response to HAART in HIV-infected children in South Africa. PediatrInfect Dis J. 2010;29(6):511–513
17. Davies MA, Keiser O, Technau K, et al;International Epidemiologic Databases toEvaluate AIDS Southern Africa (IeDEA-SA)Collaboration. Outcomes of the South AfricanNational Antiretroviral Treatment Programmefor children: the IeDEA Southern Africa col-laboration. S Afr Med J. 2009;99(10):730–737
18. Blè C, Floridia M, Muhale C, et al. Efficacy ofhighly active antiretroviral therapy in HIV-infected, institutionalized orphaned chil-dren in Tanzania. Acta Paediatr. 2007;96(7):1090–1094
19. Yotebieng M, Van Rie A, Moultrie H, MeyersT. Six-month gain in weight, height, and CD4predict subsequent antiretroviral treatmentresponses in HIV-infected South Africanchildren. AIDS. 2010;24(1):139–146
20. Eley B, Davies MA, Apolles P, et al. Anti-retroviral treatment for children. S Afr MedJ. 2006;96(9 pt 2):988–993
21. The WHO Child Growth Standards. Childgrowth standards. Available at: www.who.int/childgrowth/en/. Accessed August 3, 2011
22. Royston P, Altman DG. Regression usingfractional polynomials of continuous cova-riates: parsimonious parametric model-ling. Appl Stat. 1994;43(3):429–467
23. World Health Organization. AntiretroviralTherapy for HIV Infection in Infants andChildren: Towards Universal Access: Rec-ommendations for a Public Health Ap-proach. Geneva, Switzerland: World HealthOrganization; 2006
24. McGrath CJ, Chung MH, Richardson BA,Benki-Nugent S, Warui D, John-Stewart GC.Younger age at HAART initiation is associ-ated with more rapid growth reconsti-tution. AIDS. 2011;25(3):345–355
25. Guillén S, Ramos JT, Resino R, Bellón JM,Muñoz MA. Impact on weight and height withthe use of HAART in HIV-infected children.Pediatr Infect Dis J. 2007;26(4):334–338
e976 GSPONER et al

26. Verweel G, van Rossum AM, Hartwig NG,Wolfs TF, Scherpbier HJ, de Groot R. Treat-ment with highly active antiretroviraltherapy in human immunodeficiency virustype 1-infected children is associated witha sustained effect on growth. Pediatrics.2002;109(2). Available at: www.pediatrics.org/cgi/content/full/109/2/e25
27. Griffiths PL, Rousham EK, Norris SA, Pettifor JM,Cameron N. Socio-economic status and bodycomposition outcomes in urban South Africanchildren. Arch Dis Child. 2008;93(10):862–867
28. Steiner F, Kind C, Aebi C, et al. Growthin human immunodeficiency virus type1-infected children treated with proteaseinhibitors. Eur J Pediatr. 2001;160(10):611–616
29. Buchacz K, Cervia JS, Lindsey JC, et al.Impact of protease inhibitor-containingcombination antiretroviral therapies onheight and weight growth in HIV-infected
children. Pediatrics. 2001;108(4). Avail-able at: www.pediatrics.org/cgi/content/full/108/4/e72
30. Campbell DI, Elia M, Lunn PG. Growth falter-ing in rural Gambian infants is associatedwith impaired small intestinal barrier func-tion, leading to endotoxemia and systemicinflammation. J Nutr. 2003;133(5):1332–1338
31. Miller TL, Agostoni C, Duggan C, Guarino A,Manary M, Velasco CA; HIV Working Group.Gastrointestinal and nutritional complica-tions of human immunodeficiency virusinfection. J Pediatr Gastroenterol Nutr.2008;47(2):247–253
32. Camacho-Hubner C. Normal physiology ofgrowth hormone and insulin-like growthfactors in childhood. Available at: www.endotext.org/neuroendo/neuroendo5a/neuroendoframe5a.htm. Accessed February22, 2012
33. Palumbo P, Violari A, Lindsey J, et al. NVP-vs LPV/r-based ART among HIV+ infants inresource-limited settings: The IMPAACTP1060 Trial. 18th Conference on Retro-viruses and Opportunistic Infections (CROI2011). Abstract 129LB. Available at: www.retroconference.org/2011/Abstracts/42501.htm.Accessed August 19, 2011
34. Brinkhof MW, Pujades-Rodriguez M, EggerM. Mortality of patients lost to follow-up inantiretroviral treatment programmes inresource-limited settings: systematic re-view and meta-analysis. PLoS ONE. 2009;4(6):e5790
35. Weigel R, Hochgesang M, Brinkhof MW,et al. Outcomes and associated risk fac-tors of patients traced after being lost tofollow-up from antiretroviral treatment inLilongwe, Malawi. BMC Infect Dis. 2011;11(31):31
(Continued from first page)
Drs Gsponer, Weigel, Egger, Davies, Eley, and Keiser designed the study; Drs Gsponer and Keiser performed the statistical analyses; and Dr Keiser wrote the firstdraft of the article. All authors contributed to the interpretation of the results and to the final version of the article. Drs Weigel, Bolton, Moultrie, Vaz, Rabie,Technau, Mr Ndirangu, Drs Eley, Garone, Wellington, Giddy, and Ehmer were involved in data acquisition and data management. Dr Gsponer had full access to all ofthe data in the study and takes responsibility for the integrity of the data and the accuracy of the data analysis. Drs Egger and Davies are the principalinvestigators of the International Epidemiological Databases to Evaluate AIDS Southern Africa.
www.pediatrics.org/cgi/doi/10.1542/peds.2011-3020
doi:10.1542/peds.2011-3020
Accepted for publication May 31, 2012
This work was presented as an oral presentation at the 6th International AIDS Society Conference on HIV Pathogenesis, Treatment, and Prevention (IAS July 17–20,2011); Rome, Italy.
Address correspondence to Olivia Keiser, PhD, Institute of Social and Preventive Medicine (ISPM), University of Bern, Finkenhubelweg 11, CH-3012 Bern, Switzerland.E-mail: [email protected]
PEDIATRICS (ISSN Numbers: Print, 0031-4005; Online, 1098-4275).
Copyright © 2012 by the American Academy of Pediatrics
FINANCIAL DISCLOSURE: Dr Moultrie has conducted clinical trials of antiretroviral agents sponsored by Tibotec and GlaxoSmithKline/Viiv within the last 3 years.Dr Moultrie received no salary support or other financial benefit from involvement in the trials, and the investigational products in these trials are not directlyrelated to the current article. The other authors have indicated they have no financial relationships relevant to this article to disclose.
FUNDING: Funded by the National Institute of Allergy and Infectious Diseases, grant 5U01-AI069924–05, the Eunice Kennedy Shriver National Institute of Child Healthand Human Development, and a PROSPER fellowship to Dr Keiser from the Swiss National Science Foundation (grant 32333B_131629). Funded by the NationalInstitutes of Health (NIH).
ARTICLE
PEDIATRICS Volume 130, Number 4, October 2012 e977