Absence of ferroelectricity in BiMnO3 ceramics
7
Absence of ferroelectricity in BiMnO3 ceramics V. Goian, S. Kamba, M. Savinov, D. Nuzhnyy, F. Borodavka, P. Vank, and A. A. Belik Citation: Journal of Applied Physics 112, 074112 (2012); doi: 10.1063/1.4757944 View online: http://dx.doi.org/10.1063/1.4757944 View Table of Contents: http://scitation.aip.org/content/aip/journal/jap/112/7?ver=pdfcov Published by the AIP Publishing Advertisement: [This article is copyrighted as indicated in the abstract. Reuse of AIP content is subject to the terms at: http://scitation.aip.org/termsconditions. Downloaded to ] IP: 147.231.26.229 On: Sun, 27 Oct 2013 12:51:12
-
Upload
independent -
Category
Documents
-
view
0 -
download
0
Transcript of Absence of ferroelectricity in BiMnO3 ceramics

Absence of ferroelectricity in BiMnO3 ceramicsV. Goian, S. Kamba, M. Savinov, D. Nuzhnyy, F. Borodavka, P. Vank, and A. A. Belik Citation: Journal of Applied Physics 112, 074112 (2012); doi: 10.1063/1.4757944 View online: http://dx.doi.org/10.1063/1.4757944 View Table of Contents: http://scitation.aip.org/content/aip/journal/jap/112/7?ver=pdfcov Published by the AIP Publishing Advertisement:
[This article is copyrighted as indicated in the abstract. Reuse of AIP content is subject to the terms at: http://scitation.aip.org/termsconditions. Downloaded to ] IP:
147.231.26.229 On: Sun, 27 Oct 2013 12:51:12

Absence of ferroelectricity in BiMnO3 ceramics
V. Goian,1 S. Kamba,1,a) M. Savinov,1 D. Nuzhnyy,1 F. Borodavka,1 P. Van�ek,1
and A. A. Belik2
1Institute of Physics, Academy of Sciences of the Czech Republic, Na Slovance 2, 18221 Prague 8,Czech Republic2International Center for Materials Nanoarchitectonics (WPI-MANA), National Institute for Materials Science(NIMS), 1-1 Namiki, Tsukuba, Ibaraki 305-0044, Japan
(Received 27 June 2012; accepted 10 September 2012; published online 8 October 2012)
We performed factor-group analysis of all phonons in possible monoclinic C2/c and C2 structures
of BiMnO3 and compared it with our experimental infrared and Raman spectra. We conclude that
the crystal structure is centrosymmetric C2/c in the whole investigated temperature range from 10
to 550 K, therefore BiMnO3 cannot be ferroelectric. We revealed a dielectric relaxation in THz
spectra above the structural phase transition taking place at TC1¼ 475 K giving evidence in strong
lattice anharmonicity and a large dynamical disorder of Bi cations above TC1. Step-like dielectric
anomaly observed at TC1 in THz permittivity reminds antiferroelectric phase transition.
Nevertheless, the low-temperature dielectric studies did not reveal any antiferroelectric or
ferroelectric hysteresis loop. Our experimental results support theoretical paper of Baettig et al.(J. Am. Chem. Soc. 129, 9854 (2007)) claiming that BiMnO3 is not multiferroic but only antipolar
ferromagnet. VC 2012 American Institute of Physics. [http://dx.doi.org/10.1063/1.4757944]
I. INTRODUCTION
BiMnO3 was first time described already in 1960s,1 but
it is intensively studied mainly in the last decade after theo-
retical prediction of Hill (Spaldin) and Rabe2 that this system
could be ferroelectric ferromagnet, because some of the zone
center phonons should be unstable according to their
calculations. Most of multiferroics are ferroelectric antiferro-
magnets and have a small magnetoelectric coupling. Simul-
taneous coexistence of ferromagnetic and ferroelectric order
can enhance the magnetoelectric coupling and, therefore, the
BiMnO3 becomes subject of intensive studies (see review of
Belik3).
There is no doubt in literature about the ferromagnetic
order in BiMnO3, it was confirmed by many researches. Cu-
rie temperature was determined between 99 and 102 K4–7
and the saturated magnetization reaches 3.9 lB at 5 K, which
is close to the expected value of 4.0 lB. Magnetization is ori-
ented along the monoclinic b-axis.8 Ferroelectricity in
BiMnO3 is still subject of many controversial research stud-
ies. In thin films, some papers reported about large room-
temperature (RT) remnant polarizations (Pr¼ 9–16 lC/cm2),9
other authors found only Pr¼ 0.004–0.03 lC/cm2 at low tem-
peratures around 120 K,10,11 some researches did not confirm
any ferroelectricity.3 The same controversial results were
obtained in BiMnO3 ceramics. Two papers10,12 found ferro-
electric hysteresis loops with the Pr values of 0.043 lC/cm2
at 200 K10 and 0.06 lC/cm2 at RT.12 However, the hysteresis
loops were not saturated, which can indicate the loops come
from dielectric losses. There is also no general agreement
about the RT crystal structure of BiMnO3. Some reports
claim non-centrosymmetric C2 structure,13,14 other newer
papers propose centrosymmetric C2/c structure,15–17 which
rules out ferroelectricity in this system. Nevertheless, it
seems that the centrosymmetric C2/c structure can transform
to non-centrosymmetric C2 structure after irradiation of the
bulk samples or after induction of some defects (e.g., oxygen
vacancies) in BiMnO3 lattice.3,12 Some thin films of BiMnO3
are ferroelectric and their structure is non-centrosymmetric
probably due to the non-stoichimetry or large applied
electric field. Newest reports show that the RT C2/c structure
of bulk BiMnO3 is stable from liquid He temperatures up
to TC1¼ 474 K, above which the structure changes to
another C2/c phase.1,4,15,18 Only at TC2¼ 760–770 K, the
structure of BiMnO3 changes to a GdFeO3 type phase with
Pnma space group,4,18 but no details are known about this
structure, because the BiMnO3 system decomposes above
770 K.4
The nature of the phase transition at TC1 is mysterious.
Long time was believed that TC1 is the ferroelectric phase
transition temperature from C2/c to C2 space group. Large
dielectric anomaly was observed at TC1,19 but this anomaly
was not confirmed in other papers. The anomaly probably
comes from Maxwell-Wagner polarization, which arises
from electric conductivity of the ceramics and it is known
that the conductivity of BiMnO3 changes exactly at TC1.18
Although the recent investigations claim that the symmetry
does not change at TC1, pronounced anomalies were
observed in x-ray diffraction, lattice constants, etc.18,20
The question arises how will be demonstrated the struc-
tural phase transition near TC1 in infrared (IR) and Raman
spectra. If the phase transition would be proper and displa-
cive ferroelectric, a ferroelectric soft mode should be
observed. If the phase transition is improper ferroelectric,
some phonons should disappear in high-temperature phase
due to change of selection rules. In the case of order-disorder
ferroelectric phase transition, some dielectric relaxation in
paraelectric phase and peak in permittivity should bea)[email protected].
0021-8979/2012/112(7)/074112/6/$30.00 VC 2012 American Institute of Physics112, 074112-1
JOURNAL OF APPLIED PHYSICS 112, 074112 (2012)
[This article is copyrighted as indicated in the abstract. Reuse of AIP content is subject to the terms at: http://scitation.aip.org/termsconditions. Downloaded to ] IP:
147.231.26.229 On: Sun, 27 Oct 2013 12:51:12
observed at TC1. Simultaneously, some polar phonons should
disappear above TC1 due to transition to centrosymmetric
paraelectric phase. If the symmetry does not change at TC1,
the selection rules for phonon activities do not change, i.e.,
no phonons should disappear above TC1 and only some small
shifts of phonon frequencies are expected.
We will show in this paper that the phonons observed in
IR and Raman spectra of BiMnO3 can be explained within
centrosymmetric monoclinic C2/c structure. Absence of
ferroelectric or antiferroelectric hysteresis loop supports
theoretically predicted25 antipolar order in BiMnO3.
II. EXPERIMENTAL
The BiMnO3 ceramics were prepared using high-purity
Bi2O3 and Mn2O3 powder under 6 GPa in a belt-type high-
pressure apparatus at 1383 K for 60–70 min as described
elsewhere.5,15
Low-frequency (1 Hz–1 MHz) dielectric measurements
were performed between 10 and 300 K using NOVOCON-
TROL Alpha-A High Performance Frequency Analyzer. The
ferroelectric hysteresis loops were measured at frequencies
of 1–50 Hz and temperatures between 10 and 150 K, at
higher temperatures the ceramics were too conducting.
For the terahertz (THz) time-domain transmission
experiments, we used a Ti:sapphire femtosecond laser oscil-
lator. Linearly polarized THz probing pulses were generated
by an optical rectification in [110] ZnTe crystal plate and
detected using the electro-optic sampling with a 1 mm thick
[110] ZnTe crystal. The complex dielectric spectra were
taken in the range 5–50 cm�1 (150 GHz–1.5 THz) at temper-
atures from 10 to 550 K.
Near-normal IR reflectivity spectra were obtained using
a Fourier transform IR spectrometer Bruker IFS 113v. The
IR measurements were performed up to 550 K using a com-
mercial high-temperature sample cell SPECAC P/N 5850.
The same cell was used also for high-temperature THz
experiment in nitrogen atmosphere. In both THz and IR
measurements, Optistat CF cryostat (Oxford Instruments)
with polyethylene (IR) and Mylar (THz) windows were used
for measurements between 10 and 300 K. Frequency range
of the low-temperature IR measurements was limited by
transparency of polyethylene windows (up to 650 cm�1), the
measurements above room temperature were performed up
to 3000 cm�1, which allowed us to determine not only
phonon parameters but also e1, i.e., the sum of electronic
contributions to permittivity.
Near-normal IR reflectivity can be expressed as
RðxÞ ¼�����
ffiffiffiffiffiffiffiffiffiffiffie�ðxÞ
p� 1ffiffiffiffiffiffiffiffiffiffiffi
e�ðxÞp
þ 1
�����
2
; (1)
where complex dielectric function e*(x) can be expressed
using the sum of damped quasiharmonic oscillators and one
Debye relaxation
e�ðxÞ ¼ e1 þXn
j¼1
Dejx2TOj
x2TOj � x2 þ ixcj
þ DeRxR
xR þ ix; (2)
where xTOj, Dej, and cj are the eigenfrequency, dielectric
strength, and damping of the jth polar phonon, respectively.
DeR and xR are dielectric strength and relaxation frequency
of the Debye relaxation, respectively. The static permittivity
e(0) is given by the sum of all contributions
eð0Þ ¼Xn
j¼1
Dej þ DeR þ e1: (3)
Equations (1) and (2) were used for simultaneous fits of
IR reflectivity and THz permittivity.
For high-temperature Raman studies, a Renishaw RM
1000 Micro-Raman spectrometer equipped with a CCD de-
tector and a Linkam THMS 600 temperature cell was used.
Thin ceramic BiMnO3 plates (m¼ 84.5 mg) placed in
aluminum pan were measured in a differential scanning calo-
rimeter Perkin Elmer Pyris Diamond DSC using control and
evaluation software Pyris 4.02. Sample was heated and
cooled three times in the temperature range from 300 to
553 K by a rate of 10 K/min. Nitrogen was used as a purging
gas.
III. RESULTS AND DISCUSSIONS
Broad-band dielectric permittivity as well as results of
hysteresis loops measurements are shown in Fig. 1. The low-
temperature permittivity has intrinsic value around 30
because it corresponds, within accuracy of our measure-
ments, to the sum of phonon and electronic dielectric
strengths (see Eq. (3) and Fig. 1(a)). The conductivity of ce-
ramic grains rapidly increases from �10�8 to �10�5 S/cm
on heating from 20 to 300 K, while the grain boundaries
have conductivity �10�13 S/cm at 20 K, which rapidly
increases on heating above 100 K and reaches values � 10�5
S/cm near room temperature (not shown). From that reason,
tan d increases above 1 and permittivity reaches extrinsic
giant values >103 at temperatures above 100 K. This is well
known Maxwell-Wagner polarization mechanism giving rise
to giant extrinsic permittivities at high temperatures.21
Vibration of ferroelectric domain walls usually contributes
to permittivity, but it was not observed in our case. We found
no significant dielectric dispersion between 1 Hz and
335 GHz below 100 K (see Fig. 1(a)).
We tried to measure as well the ferroelectric hysteresis
loops (see Figure 1(b)), but without success. Above 100 K,
an ellipsoid typical for lossy dielectrics was obtained. At
lower temperatures, only paraelectric behavior is seen. No
signature of ferroelectricity was discovered, our BiMnO3
ceramics behaves like typical paraelectric. We note that the
ferroelectric hysteresis loops in bulk BiMnO3 ceramics were
reported in Refs. 10 and 12, but the observed polarizations
were below 0.1 lC/cm2, and the loops were never saturated.
These could be dielectric lossy loops, whose ellipsoids can
become two artificial sharp heads due to the triangular-
shaped increase and decrease of the applied voltage.22
Sinusoidal change of voltage was used in our case.
We tried to prove whether the previously reported struc-
tural phase transition takes place at TC1 in our BiMnO3
ceramics. Calorimetry measurements presented in inset of
074112-2 Goian et al. J. Appl. Phys. 112, 074112 (2012)
[This article is copyrighted as indicated in the abstract. Reuse of AIP content is subject to the terms at: http://scitation.aip.org/termsconditions. Downloaded to ] IP:
147.231.26.229 On: Sun, 27 Oct 2013 12:51:12

Figure 1(a) clearly reveal a heat anomaly near 470 K (taken
on heating). On cooling, the anomaly is observed 30 K lower,
which gives evidence for first-order character of the phase
transition. The observed change of enthalpy was 1.6 J/g at
TC1. We did not heat up the ceramics above 550 K, because
we were afraid of the chemical decomposition, which occurs
near TC2¼ 760 K.4
Infrared reflectivity spectra plotted at selected tempera-
tures up to 550 K are shown in Fig. 2(a). On heating, one can
see gradual decrease of reflection band intensities due to
increase of phonon damping. Thanks to this fact, some pho-
nons become overlapped and, therefore, they disappear from
the spectra at high temperatures. Two lowest-frequency pho-
nons exhibit small softening towards TC1 (Fig. 3), leading to
a small maximum of phonon permittivity at TC1 (see black
solid squares in Fig. 1(a)). Nevertheless, the most remarkable
change undergo low-frequency THz spectra showing abrupt
increase of both e0 and e00 above TC1 (see open symbols
below 50 cm�1 in Figs. 2(b) and 2(c)). This can be fitted only
by dielectric relaxation (Eq. (1)), which expresses a dynami-
cal disorder of some atoms above TC1. The relaxation fre-
quency slows-down from 4 cm�1 (i.e., 120 GHz) at 550 K to
2.8 cm�1 (84 GHz) at 500 K and finally it disappears below
the structural phase transition at TC1¼ 475 K. The observed
slowing down of dielectric relaxation gives evidence in
order-disorder mechanism of the structural phase transition
at TC1, but the relaxation frequency in THz range is rather
unusual. Most of materials with order-disorder mechanism
of the ferroelectric phase transition exhibit relaxation fre-
quency in microwave or radio-frequency region. On the
other hand, dielectric relaxation only in THz region is rather
rare. It was observed, for example, above antiferroelectric
phase transition in Nd substituted BiFeO3 (Ref. 23) as well
as in antiferroelectric PbZrO3.24 Our discovered step down
of e0(T) seen on cooling at TC1 (see Fig. 1(a)) reminds an
antiferroelectric phase transition. We did not find any anti-
ferroelectric hysteresis loop in Fig. 1(b), but it can be a con-
sequence of relatively low applied electric field 20 kV/cm
(the sample becomes leaky at higher voltage). Possible anti-
polar order in BiMnO3 was theoretically proposed by Baettig
et al.,25 who used LDAþU method of density functional
theory. They found that the Bi3þ lone pairs lead to strong
local polar distortions. The relative orientations of adjacent
lone pairs should be opposite to each other and equivalent.
The question arises, whether the local polarization is
FIG. 1. (a) Temperature dependence of permittivity at various frequencies.
(b) Polarization versus electric field plotted at various temperatures show
paraelectric behavior below 90 K and lossy loop at 115 K. In inset of (a), the
heat flow behavior measured on heating and cooling with a rate of 10 K/min
is shown. The full black squares in (a) figure show sum of phonon contribu-
tions to permittivity, while the blue line and solid points (e0 measured at
335 GHz) take into account also THz dielectric relaxation seen only above
TC1.
FIG. 2. (a) IR reflectivity spectra taken at selected temperatures. (b) Dielec-
tric permittivity e0 and (c) dielectric loss e00 spectra obtained from the fits of
IR reflectivity and THz spectra. The open symbols seen in (b) and (c) below
50 cm�1 are experimental THz dielectric data.
074112-3 Goian et al. J. Appl. Phys. 112, 074112 (2012)
[This article is copyrighted as indicated in the abstract. Reuse of AIP content is subject to the terms at: http://scitation.aip.org/termsconditions. Downloaded to ] IP:
147.231.26.229 On: Sun, 27 Oct 2013 12:51:12
switchable in external electric field (i.e., the system is anti-
ferroelectric) or unswitchable (i.e., just antipolar). Our data
support latter possibility, but new experiments with higher
electric field are necessary for confirmation of the antipolar
order. Note that in both cases, the structure remains centro-
symmetric at all temperatures.
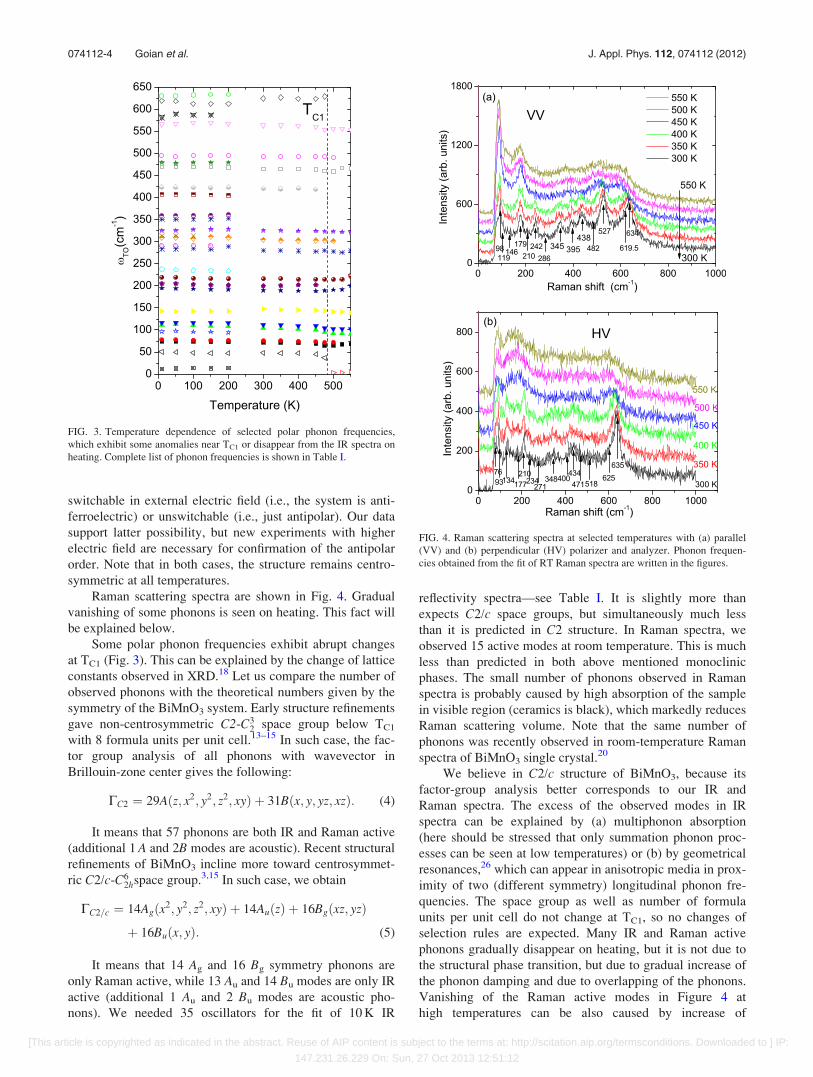
Raman scattering spectra are shown in Fig. 4. Gradual
vanishing of some phonons is seen on heating. This fact will
be explained below.
Some polar phonon frequencies exhibit abrupt changes
at TC1 (Fig. 3). This can be explained by the change of lattice
constants observed in XRD.18 Let us compare the number of
observed phonons with the theoretical numbers given by the
symmetry of the BiMnO3 system. Early structure refinements
gave non-centrosymmetric C2-C32 space group below TC1
with 8 formula units per unit cell.13–15 In such case, the fac-
tor group analysis of all phonons with wavevector in
Brillouin-zone center gives the following:
CC2 ¼ 29Aðz; x2; y2; z2; xyÞ þ 31Bðx; y; yz; xzÞ: (4)
It means that 57 phonons are both IR and Raman active
(additional 1 A and 2B modes are acoustic). Recent structural
refinements of BiMnO3 incline more toward centrosymmet-
ric C2/c-C62hspace group.3,15 In such case, we obtain
CC2=c ¼ 14Agðx2; y2; z2; xyÞ þ 14AuðzÞ þ 16Bgðxz; yzÞþ 16Buðx; yÞ: (5)
It means that 14 Ag and 16 Bg symmetry phonons are
only Raman active, while 13 Au and 14 Bu modes are only IR
active (additional 1 Au and 2 Bu modes are acoustic pho-
nons). We needed 35 oscillators for the fit of 10 K IR
reflectivity spectra—see Table I. It is slightly more than
expects C2/c space groups, but simultaneously much less
than it is predicted in C2 structure. In Raman spectra, we
observed 15 active modes at room temperature. This is much
less than predicted in both above mentioned monoclinic
phases. The small number of phonons observed in Raman
spectra is probably caused by high absorption of the sample
in visible region (ceramics is black), which markedly reduces
Raman scattering volume. Note that the same number of
phonons was recently observed in room-temperature Raman
spectra of BiMnO3 single crystal.20
We believe in C2/c structure of BiMnO3, because its
factor-group analysis better corresponds to our IR and
Raman spectra. The excess of the observed modes in IR
spectra can be explained by (a) multiphonon absorption
(here should be stressed that only summation phonon proc-
esses can be seen at low temperatures) or (b) by geometrical
resonances,26 which can appear in anisotropic media in prox-
imity of two (different symmetry) longitudinal phonon fre-
quencies. The space group as well as number of formula
units per unit cell do not change at TC1, so no changes of
selection rules are expected. Many IR and Raman active
phonons gradually disappear on heating, but it is not due to
the structural phase transition, but due to gradual increase of
the phonon damping and due to overlapping of the phonons.
Vanishing of the Raman active modes in Figure 4 at
high temperatures can be also caused by increase of
FIG. 3. Temperature dependence of selected polar phonon frequencies,
which exhibit some anomalies near TC1 or disappear from the IR spectra on
heating. Complete list of phonon frequencies is shown in Table I.
FIG. 4. Raman scattering spectra at selected temperatures with (a) parallel
(VV) and (b) perpendicular (HV) polarizer and analyzer. Phonon frequen-
cies obtained from the fit of RT Raman spectra are written in the figures.
074112-4 Goian et al. J. Appl. Phys. 112, 074112 (2012)
[This article is copyrighted as indicated in the abstract. Reuse of AIP content is subject to the terms at: http://scitation.aip.org/termsconditions. Downloaded to ] IP:
147.231.26.229 On: Sun, 27 Oct 2013 12:51:12

conductivity18 of the sample on heating. In such case, the
absorption of the laser beam increases (skin depth drastically
decreases) and, therefore, the Raman scattering volume
decreases. Due to this fact, the intensity of Raman-active
phonons is strongly suppressed at high temperatures, and
most of the Raman active modes become undetectable.
One can ask what is the origin of the structural phase
transition at TC1. Based on the analysis of distortions of
MnO6 octahedra, it was suggested that the phase transition
corresponds to the orbital melting transition.15 Such transi-
tion can cause jump of lattice parameters as well as changes
of phonon frequencies observed near TC1. Presence of THz
dielectric relaxation above TC1 gives evidence in dynamical
disorder of some atoms. These can be Bi cations, because
they are finally responsible for antipolar order below TC1.
We should admit that there were reported ferroelectric hys-
teresis loops in thin films,9–11 but applied electric field of
450 kV/cm was much higher than our 20 kV/cm. Such high
electric field can significantly influence the crystal structure.
One can also speculate about non-stoichiometry of the thin
films (Bi is volatile at high temperatures; it is also difficult to
control oxygen stoichiometry in the thin films), because the
ferroelectric hysteresis loop was observed also in non-
stoichiometric bulk samples.12 Effect of the strain on induc-
tion of ferroelectricity in the films can be probably excluded,
because the density functional theory calculation found that
BiMnO3 stays robustly non-ferroelectric under biaxial
strain.27
IV. CONCLUSION
Our studies did not confirm ferroelectricity in BiMnO3
ceramics. No ferroelectric spontaneous polarization was
observed and the number of detected IR and Raman active
phonons corresponds better to centrosymmetric C2/c than to
non-centrosymmetric C2 space group. Small phonon anoma-
lies observed near TC1 cannot be explained by earlier
reported change of symmetry from C2/c to C2. They are
caused by abrupt change of the lattice parameters18 (without
any symmetry change) at TC1, which causes the shifts of
phonon frequencies. Intrinsic permittivity determined from
the THz and IR spectra exhibits abrupt 50% increase at TC1
� 475 K and the saturation at higher temperatures, which
reminds antiferroelectric phase transition. Nevertheless, we
observed no antiferroelectric hysteresis loop if we applied
electric field up to 20 kV/cm. Finally, it can be concluded
that our experimental results support theoretical paper of
Baettig et al.,25 who predicted a centrosymmetric crystal
structure in BiMnO3 with an antipolar order.
ACKNOWLEDGMENTS
This work was supported by the Czech Science Founda-
tion (Project No. P204/12/1163) and M�SMT (COST
MP0904 Project LD12026). A.A.B. acknowledges support
from WPI Initiative (MEXT, Japan), JSPS FIRST Program,
and JSPS Grant (22246083). In addition, the contribution of
F.B. has been supported by the Czech Ministry of Education
(Project SVV-2012-265303) and the Czech Science Founda-
tion (Project No. 202/09/H041).
1F. Sugawara, S. Iiida, Y. Syonno, and S. Akimoto, J. Phys. Soc. Jpn. 25,
1553 (1968).2N. A. Hill and K. M. Rabe, Phys. Rev. B 59, 8759 (1999).3A. A. Belik, J. Solid State Chem. 195, 32 (2012).4E. Montanari, G. Calestani, A. Migliori, M. Dapiaggi, F. Bolzoni, R. Cab-
assi, and E. Gilioli, Chem. Mater. 17, 6457 (2005).5A. A. Belik and E. Takayama-Muromachi, Inorg. Chem. 45, 10224
(2006).6A. A. Belik and E. Takayama-Muromachi, J. Phys.: Condens. Matter. 20,
025211 (2008).7E. Montanari, L. Righi. G. Calestani, A. Migliori, E. Gilioli, and F. Bol-
zoni, Chem. Mater. 17, 1765 (2005).8E. Montanari, G. Castelani, L. Righi, E. Gilioli, F. Bolzoni, K. S. Knight,
and P. G. Radaelli, Phys. Rev. B 75, 220101(R) (2007).9J. Y. Son and Y. H. Shin, Appl. Phys. Lett. 93, 062902 (2008).
10A. M. dos Santos, S. Parashar, A. R. Raju, Y. S. Zhao, A. K. Cheetham,
and C. N. R. Rao, Solid State Commun. 122, 49 (2002).11M. Grizalez, E. Martinez, J. Caicedo, J. Heiras, and P. Prieto, Microelec-
tron. J. 39, 1308 (2008).
TABLE I. Parameters of the polar modes observed at lowest and highest
measured temperatures. First mode in the high-temperature phase is a relax-
ation mode (parameters xR and De), the remaining modes are phonons.
10 K 550 K
No. xTO (cm�1) De c (cm�1) xTO (cm�1) De c (cm�1)
1 3.9 24.5
2 50.5 0.2 30.4 68 6.6 18.7
3 74.2 0.4 1.5
4 78 1.1 3.9
5 95.9 0.3 4.6
6 111.1 7.5 8.4 90.5 1.7 15.3
8 116.8 1.8 9.2 102.1 3 19.7
9 122.8 1.4 12.5 115 2.8 29.2
10 142.5 0.3 9.3 139.1 3.3 40.2
11 161.7 0.9 23.8 153.6 0.3 14
12 194.8 0.9 4.9 200.3 0.4 44.12
13 204.8 0.4 6.5
14 219.8 0.5 3.4 222.5 0.5 41.6
15 225.3 0.2 7.2 249.7 0.45 36.3
16 237.3 0.2 3.3
17 245.2 0.02 2.3
18 283.7 0.1 5.5 280.1 1 54.3
19 292.2 1 14.6
20 309 0.1 5.8
21 313.8 0.25 4.6
22 325.3 1.7 6.4 320.5 3.1 55.7
23 344 1.2 11.4 346.4 0.8 36
24 350 0.6 4.15
25 359 0.8 9.3
26 372.8 0.04 6.5 363.2 1.6 55.83
27 407.2 0.04 5.8
28 423.5 0.4 36.5
29 469.2 0.35 23.6 466.2 1.7 123.03
30 479.5 0.02 6.8
31 494.5 0.2 18.1
32 508.4 0.3 27.2
33 566.2 0.4 12.6 554.2 0.5 53.6
34 581.8 0.1 41.6
35 619.2 0.05 18
36 630 0.03 10.5
074112-5 Goian et al. J. Appl. Phys. 112, 074112 (2012)
[This article is copyrighted as indicated in the abstract. Reuse of AIP content is subject to the terms at: http://scitation.aip.org/termsconditions. Downloaded to ] IP:
147.231.26.229 On: Sun, 27 Oct 2013 12:51:12

12Z. H. Chi, H. Yang, S. M. Feng, F. H. Li, R. C. Yu, and C. Q. Jin, J. Magn.
Magn. Mater. 310, e358 (2007).13T. Atou, H. Chiba, K. Ohoyama, Y. Yamaguchi, and Y. Syono, J. Solid
State Chem. 145, 639 (1999).14A. Moreira dos Santos, A. K. Cheetham, T. Atou, Y. Syono, Y. Yamaguchi,
K. Ohoyama, H. Chiba, and C. N. R. Rao, Phys. Rev. B 66, 64425 (2002).15A. Belik, S. Iikubo, T. Yokosawa, K. Kodama, N. Igawa, S. Shamoto, M.
Azuma, M. Takano, K. Kimoto, Y. Matsui, and E. Takayama-Muromachi,
J. Am. Chem. Soc. 129, 971 (2007).16H. Yang, Z. H. Chi, J. L. Jiang, W. J. Feng, J. F. Dai, C. Q. Jin, and R. C.
Yu, J. Mater. Sci. 43, 3604 (2008).17H. Yang, Z. H. Chi, J. L. Jiang, W. J. Feng, Z. E. Cao, T. Xian, C. Q. Jin,
and R. C. Yu, J. Alloy. Compd. 461, 1 (2008).18T. Kimura, S. Kawamoto, I. Yamada, M. Azuma, M. Takano, and
Y. Tokura, Phys. Rev. B 67, 180401(R) (2003).19Z. H. Chi, C. J. Xiao, S. M. Feng, F. Y. Li, C.Q. Jin, X. M. Wang,
R. Z. Chen, and L.T. Li, J. Appl. Phys. 98, 103519 (2005).
20P. Toulemonde, C. Darie, C. Goujon, M. Legendre, T. Mendonca, M.
Alvarez-Murga, V. Simonet, P. Bordet, P. Bouvier, J. Kreisel, and M.
Mezouar, High Press. Res. 29, 600 (2009).21P. Lunkenheimer, V. Bobnar, A. V. Pronin, A. I. Ritus, A. A. Volkov, and
A. Loidl, Phys. Rev. B 66, 052105 (2002).22A. A. Belik, S. Kamba, M. Savinov, D. Nuznyy, M. Tacibana,
E. Takayama-Muromachi, and V. Goian, Phys. Rev. B 79, 054411 (2009).23V. Goian, S. Kamba, S. Greicius, D. Nuzhnyy, S. Karimi, and I. M.
Reaney, J. Appl. Phys. 110, 074112 (2011).24J. T. Ostapchuk, J. Petzelt, V. �Zelezn�y, S. Kamba, V. Bovtun, V. Poro-
khonskyy, A. F. Pashkin, P. Ku�zel, M. Glinchuk, and I. Bykov, J. Phys.:
Condens. Matter. 13, 2677 (2001).25P. Baettig, R. Seshadri, and N. A. Spaldin, J. Am. Chem. Soc. 129, 9854
(2007).26J. Hlinka, T. Ostapchuk, D. Noujni, S. Kamba, and J. Petzelt, Phys. Rev.
Lett. 96, 027601 (2006).27A. J. Hatt and N. A. Spaldin, Eur. Phys. J. B 71, 435 (2009).
074112-6 Goian et al. J. Appl. Phys. 112, 074112 (2012)
[This article is copyrighted as indicated in the abstract. Reuse of AIP content is subject to the terms at: http://scitation.aip.org/termsconditions. Downloaded to ] IP:
147.231.26.229 On: Sun, 27 Oct 2013 12:51:12