
Vernier judgments in the absence of regular shape information
12
Vision Research 39 (1999) 2349 – 2360 Vernier judgments in the absence of regular shape information Saumil S. Patel, Harold E. Bedell *, Michael T. Ukwade College of Optometry, Uni6ersity of Houston, Houston, TX 77204 -6052, USA Received 30 December 1997; received in revised form 5 August 1998 Abstract Vernier acuity is a form of hyperacuity in which the threshold offset between a test object and a reference object is smaller than the size of a foveal cone. Because the test and the reference objects usually have regular shapes (e.g. rectangular, triangular or circular), relatively few studies have addressed the role of shape information in determining hyperacuity thresholds. In this study, we investigated the effect of shape information on hyperacuity performance using targets of irregular shape with different skew and symmetry properties. Vernier thresholds smaller than 10 arc-sec were obtained for closely spaced asymmetric irregular-shape targets. Thresholds for dots and asymmetric irregular shapes increased with increase in center-to-center gap between the targets. Unlike dots, the thresholds for asymmetric irregular shapes also increased with target area. Although the thresholds for asymmetric irregular shapes were higher than those for dots, thresholds for symmetric irregular shapes were similar. Target skew below a certain level had a negligible effect on Vernier thresholds for asymmetric shapes. Our results suggest the existence of feature-independent neural circuitry that can support hyperacuity thresholds and are consistent with the use of the centroid as a primitive for relative localization. © 1999 Elsevier Science Ltd. All rights reserved. Keywords: Vernier acuity; Hyperacuity; Shape processing; Orientation; Centroid 1. Introduction Two mechanisms have been proposed to explain the highly precise Vernier performance that is achieved for a wide variety of target configurations and conditions. It is suggested that a more sensitive spatial-filter mecha- nism operates for abutting and closely spaced targets, whereas a less sensitive local-sign mechanism signals the direction of Vernier offset for widely separated targets (Westheimer & McKee, 1977a; Wang & Levi, 1994). Although it is unknown what neural computations are actually involved in analyzing Vernier offset from the outputs of spatial filters, two general approaches have been proposed. In the first, reference-based approach (Wilson 1986), the responses of an appropriate class of spatial filters represent the Vernier targets as a point in a complex space (Fig. 1a), which has dimensions such as orientation, spatial frequency, contrast, etc. The location of this point is then compared to a reference point in the same N-dimensional space based either on an internal norm, or a normative value established from the filter responses to a set of null (zero-offset) stimuli. A non-zero value from this comparison process indicates the presence of Vernier offset. The second, symmetry-based approach (Regan & Beverley, 1985; Waugh, Levi & Carney, 1993; Mussap & Levi, 1997), compares the outputs of a pair of spatial filters with symmetric preferred orientations to directly yield a signal for Vernier offset (Fig. 1b). No difference exists between the responses of symmetrically oriented spatial filters when a pair of dot targets is aligned (upper part of Fig. 1b) whereas a non-zero difference indicates the presence and the direction of misalignment. The limited size of cortical receptive fields is assumed to preclude the efficient operation of spatial-filter mech- anisms when the elements that comprise a Vernier stimulus become too widely separated. For widely-sepa- rated targets, a local-sign scheme has been proposed to signal Vernier misalignment, as illustrated in Fig. 1c. In this scheme, the individual elements of the Vernier target are localized on a neural topographic map and the map positions (i.e. local signs) of the elements are then compared. According to Levi & Waugh (1996), * Corresponding author. Fax: +1-713-7432053. E-mail address: [email protected] (H.E. Bedell) 0042-6989/99/$ - see front matter © 1999 Elsevier Science Ltd. All rights reserved. PII:S0042-6989(98)00265-X
-
Upload
independent -
Category
Documents
-
view
0 -
download
0
Transcript of Vernier judgments in the absence of regular shape information

Vision Research 39 (1999) 2349–2360
Vernier judgments in the absence of regular shape information
Saumil S. Patel, Harold E. Bedell *, Michael T. UkwadeCollege of Optometry, Uni6ersity of Houston, Houston, TX 77204-6052, USA
Received 30 December 1997; received in revised form 5 August 1998
Abstract
Vernier acuity is a form of hyperacuity in which the threshold offset between a test object and a reference object is smaller thanthe size of a foveal cone. Because the test and the reference objects usually have regular shapes (e.g. rectangular, triangular orcircular), relatively few studies have addressed the role of shape information in determining hyperacuity thresholds. In this study,we investigated the effect of shape information on hyperacuity performance using targets of irregular shape with different skewand symmetry properties. Vernier thresholds smaller than 10 arc-sec were obtained for closely spaced asymmetric irregular-shapetargets. Thresholds for dots and asymmetric irregular shapes increased with increase in center-to-center gap between the targets.Unlike dots, the thresholds for asymmetric irregular shapes also increased with target area. Although the thresholds forasymmetric irregular shapes were higher than those for dots, thresholds for symmetric irregular shapes were similar. Target skewbelow a certain level had a negligible effect on Vernier thresholds for asymmetric shapes. Our results suggest the existence offeature-independent neural circuitry that can support hyperacuity thresholds and are consistent with the use of the centroid as aprimitive for relative localization. © 1999 Elsevier Science Ltd. All rights reserved.
Keywords: Vernier acuity; Hyperacuity; Shape processing; Orientation; Centroid
1. Introduction
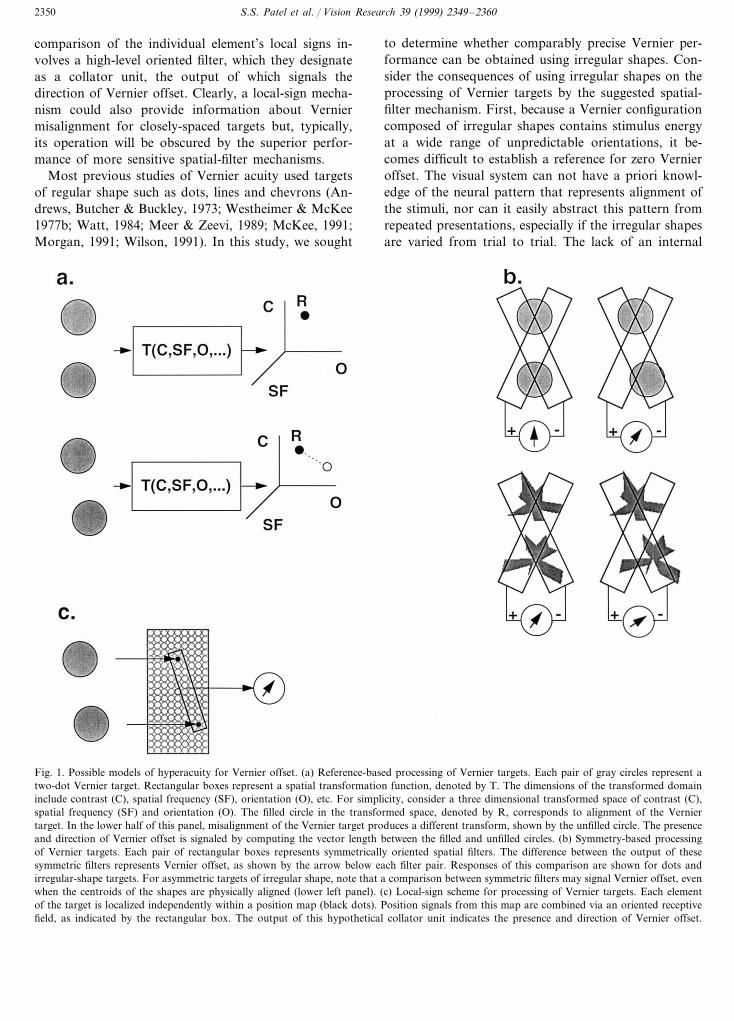
Two mechanisms have been proposed to explain thehighly precise Vernier performance that is achieved fora wide variety of target configurations and conditions.It is suggested that a more sensitive spatial-filter mecha-nism operates for abutting and closely spaced targets,whereas a less sensitive local-sign mechanism signals thedirection of Vernier offset for widely separated targets(Westheimer & McKee, 1977a; Wang & Levi, 1994).Although it is unknown what neural computations areactually involved in analyzing Vernier offset from theoutputs of spatial filters, two general approaches havebeen proposed. In the first, reference-based approach(Wilson 1986), the responses of an appropriate class ofspatial filters represent the Vernier targets as a point ina complex space (Fig. 1a), which has dimensions suchas orientation, spatial frequency, contrast, etc. Thelocation of this point is then compared to a referencepoint in the same N-dimensional space based either on
an internal norm, or a normative value establishedfrom the filter responses to a set of null (zero-offset)stimuli. A non-zero value from this comparison processindicates the presence of Vernier offset. The second,symmetry-based approach (Regan & Beverley, 1985;Waugh, Levi & Carney, 1993; Mussap & Levi, 1997),compares the outputs of a pair of spatial filters withsymmetric preferred orientations to directly yield asignal for Vernier offset (Fig. 1b). No difference existsbetween the responses of symmetrically oriented spatialfilters when a pair of dot targets is aligned (upper partof Fig. 1b) whereas a non-zero difference indicates thepresence and the direction of misalignment.
The limited size of cortical receptive fields is assumedto preclude the efficient operation of spatial-filter mech-anisms when the elements that comprise a Vernierstimulus become too widely separated. For widely-sepa-rated targets, a local-sign scheme has been proposed tosignal Vernier misalignment, as illustrated in Fig. 1c. Inthis scheme, the individual elements of the Verniertarget are localized on a neural topographic map andthe map positions (i.e. local signs) of the elements arethen compared. According to Levi & Waugh (1996),
* Corresponding author. Fax: +1-713-7432053.E-mail address: [email protected] (H.E. Bedell)
0042-6989/99/$ - see front matter © 1999 Elsevier Science Ltd. All rights reserved.
PII: S 0 0 4 2 -6989 (98 )00265 -X
S.S. Patel et al. / Vision Research 39 (1999) 2349–23602350
comparison of the individual element’s local signs in-volves a high-level oriented filter, which they designateas a collator unit, the output of which signals thedirection of Vernier offset. Clearly, a local-sign mecha-nism could also provide information about Verniermisalignment for closely-spaced targets but, typically,its operation will be obscured by the superior perfor-mance of more sensitive spatial-filter mechanisms.
Most previous studies of Vernier acuity used targetsof regular shape such as dots, lines and chevrons (An-drews, Butcher & Buckley, 1973; Westheimer & McKee1977b; Watt, 1984; Meer & Zeevi, 1989; McKee, 1991;Morgan, 1991; Wilson, 1991). In this study, we sought
to determine whether comparably precise Vernier per-formance can be obtained using irregular shapes. Con-sider the consequences of using irregular shapes on theprocessing of Vernier targets by the suggested spatial-filter mechanism. First, because a Vernier configurationcomposed of irregular shapes contains stimulus energyat a wide range of unpredictable orientations, it be-comes difficult to establish a reference for zero Vernieroffset. The visual system can not have a priori knowl-edge of the neural pattern that represents alignment ofthe stimuli, nor can it easily abstract this pattern fromrepeated presentations, especially if the irregular shapesare varied from trial to trial. The lack of an internal
Fig. 1. Possible models of hyperacuity for Vernier offset. (a) Reference-based processing of Vernier targets. Each pair of gray circles represent atwo-dot Vernier target. Rectangular boxes represent a spatial transformation function, denoted by T. The dimensions of the transformed domaininclude contrast (C), spatial frequency (SF), orientation (O), etc. For simplicity, consider a three dimensional transformed space of contrast (C),spatial frequency (SF) and orientation (O). The filled circle in the transformed space, denoted by R, corresponds to alignment of the Verniertarget. In the lower half of this panel, misalignment of the Vernier target produces a different transform, shown by the unfilled circle. The presenceand direction of Vernier offset is signaled by computing the vector length between the filled and unfilled circles. (b) Symmetry-based processingof Vernier targets. Each pair of rectangular boxes represents symmetrically oriented spatial filters. The difference between the output of thesesymmetric filters represents Vernier offset, as shown by the arrow below each filter pair. Responses of this comparison are shown for dots andirregular-shape targets. For asymmetric targets of irregular shape, note that a comparison between symmetric filters may signal Vernier offset, evenwhen the centroids of the shapes are physically aligned (lower left panel). (c) Local-sign scheme for processing of Vernier targets. Each elementof the target is localized independently within a position map (black dots). Position signals from this map are combined via an oriented receptivefield, as indicated by the rectangular box. The output of this hypothetical collator unit indicates the presence and direction of Vernier offset.

S.S. Patel et al. / Vision Research 39 (1999) 2349–2360 2351
reference should render a spatial-filter mechanism thatdepends on such a reference unreliable. If the irregularshapes are also asymmetric, then a spatial-filter mecha-nism that depends on comparing stimulus energy atpairs of symmetric orientations should also becomeunreliable. Vernier acuity for asymmetric irregularshapes might therefore depend on a local-sign mecha-nism, even for closely spaced targets.
Within the local-sign mechanism it is not clear howpositions of individual components of a Vernier targetare obtained for comparison. One possible spatialparameter that is often considered is the centroid of thetarget. The arithmetic centroid of a two-dimensionalvisual object can be defined as the spatial locationwhere the sum of clockwise and counter-clockwise first-order moments of the luminance distribution is zero. Ifthe luminance distribution of the target is homoge-neous, then the centroid can be determined as thegeometric centroid, and defined solely from the positionof the edges. Vernier thresholds that depend on ameasure such as the centroid would be expected to belargely invariant to target rotation. It is widely knownthat the human visual system can detect changes in thecentroid of a luminance distribution that are finer thanthe photoreceptor matrix (Westheimer & McKee,1977a; Morgan & Aiba, 1985). This centroid discrimi-nation is comparable to that of a spatial filter mecha-nism and implies either that spatial filters are directlyinvolved in sensing changes in target centroid (Hess,Dakin & Badcock, 1994; Badcock, Hess & Dobbins,1996) or that the centroid of the target is computed bya separate mechanism of comparable sensitivity. A wayto distinguish between the above possibilities is toselectively lower the sensitivity of one potential mecha-nism, for example by using targets with irregular shapesto lower the sensitivity of the spatial filter mechanism.
Ward, Casco and Watt (1985) measured the ability ofsubjects to judge misalignment of two abutting randomdot clusters. After comparing their data to the perfor-mance of an ideal observer, they concluded that thesubjects primarily used edge cues to accomplish therelative localization task. Whitaker and Walker (1988)used a similar target arrangement and reported relativelocalization performance in the hyperacuity range (B10 arc-sec for �3 square arc-min target area). They,however, concluded that the subjects compared thegeometric centroids of the test and reference targets toaccomplish the task. According to Whitaker andWalker (1988), an important difference from the studyby Ward et al. may be the low dot densities that Wardet al. used. Another difference between the two studiesis the size of the dots. Whitaker and Walker usedsub-minute dots (0.25×0.25 min) within a smallrectangular region (1.7×1.7 min), whereas Ward et al.used larger dots (1.65×1.65 min) within a largerbounding rectangle (50×10 min). In both studies,
thresholds depended greatly on dot density and size. Anadvantage of using solid irregular shapes is that interac-tive effects of dot density and size on Vernier thresholdsare eliminated. Numerous other studies suggest that thecentroid of a target is a fundamental parameter forrelative and absolute localization within the humanvisual system (Toet, Smit, Nienhuis & Koenderink,1988; Yakimoff, Bocheva, & Mitrani, 1990; Morgan &Glennerster, 1991; Vos, Bocheva, Yakimoff & Helsper,1993; Bocheva & Yakimoff, 1996; Hess & Holliday,1996; Whitaker, McGraw, Pacey & Barrett, 1996).
In this study, we compared Vernier thresholds forconfigurations of asymmetric irregular solid shapes, andsolid dot targets of the same area. Thresholds weredetermined for various target areas and inter-targetseparations (gaps). Generalizability was evaluated bydetermining whether the pattern of thresholds changedwhen the original set of asymmetric irregular shapesunderwent rotation. The influence of target symmetryand skew on Vernier thresholds was assessed in twoancillary experiments. An additive variance model is fitto the experimental data.
2. Methods
Except in the experiment involving rotated irregularshapes, the three authors participated as observers inthis study. All had normal corrected acuity and binocu-lar vision. In a normally illuminated room, the observerbinocularly viewed the reflection of a computer screen(640 horizontal×480 vertical; 14 in. diagonal; 256 graylevels) from a mirror that produced an optical distanceof 980 cm. The screen was viewed through an 18-cm-di-ameter circular aperture. Vernier offset thresholds weredetermined for solid bright dots (Fig. 2a) and asymmet-ric irregular shapes (Fig. 2b) of three areas (8.3, 25, 37.5square arc-min) for six center-to-center vertical gaps(4–46 arc-min). Targets were 60 cd/square m presentedon a background of 11 cd/square m. The irregularshapes were 16-sided polygons of known centroid andarea. Details about the construction and the statisticalproperties of the shapes are available in Appendix A.Horizontal Vernier offsets were introduced on each trialusing the method of constant stimuli. In the case ofirregular shapes, each Vernier trial presented a stimuluscomposed of two different shapes, each randomlypicked from a pool of 18. The targets remained on thescreen until the observer responded. The observers re-ported whether the bottom target was perceived to beoffset to the left or right with respect to the top target.Vernier thresholds were the inverse slopes (50–84%correct) of the psychometric functions, fit with a cumu-lative Gaussian using a maximum likelihood method.In all the experiments the average of at least twothreshold measurements was obtained for eachcondition.

S.S. Patel et al. / Vision Research 39 (1999) 2349–23602352
Fig. 2. Vernier test configurations. (a) Dot targets. An outer circularaperture, �1° in diameter, eliminated references from vertical andhorizontal screen edges. From trial to trial, the horizontal position ofboth targets was randomly jittered (max=7.5 arc-min) to mask cuesfrom the position of the targets with respect to the aperture. (b)Asymmetric irregular-shape targets. On each trial, different top andbottom targets were selected randomly from a pool of 18 irregularshapes. The same 18 shapes were rescaled using Adobe Photoshop toobtain the three different target areas tested. The area of the irregularshapes was the same as the corresponding-sized dots.
terling, 1992). Based on these skew calculations, wecreated two sets of shapes. A set of 18 large-skewshapes included the nine rotated shapes with the largestabsolute values of skew and their mirror images, ob-tained by imposing on each a 180° rotation. Thisprocedure ensured that the mean skew in this set iszero, similar to the mean for the set of shapes used inthe main experiment. The set of 18 small-skew stimuliwas constructed in a similar manner, except that thenine shapes with the smallest skew were selected andthen rotated by 180° to create their mirror images.Details about these two sets of stimuli, as well as forthe set of 18 medium skew shapes used in the mainexperiment, are available in Appendix A. Vernierthresholds were obtained using these three sets ofshapes for a target area of 25 square arc-min and acenter-to-center gap of 11 arc-min. Due to changedroom illumination, the targets were 52 cd/square mpresented on a background of 20 cd/square m. Other-wise, the conditions remained unchanged from those inthe main experiments.
A second ancillary experiment investigated how thethresholds depended upon target symmetry. Each irreg-ular shape of the medium skew set was rotated in 1°steps and then divided into right and left half images.The left-half image was discarded and the right half-im-age was mirrored and copied to form a new left half.For each angle of rotation, this process established anew shape, which was symmetrical about the verticalaxis. For each of the original asymmetric shapes, onehaving the same area and x, y centroid location wasretained in a set of 18 symmetric irregular shapes.Vernier thresholds were determined using the proce-dures of the main experiment by sampling from this setof symmetric targets. In this experiment, the shapes hadan area of 25 square arc-min and the center-to-centergap was 11 arc-min.
The statistical analyses were performed using multi-variate repeated measures ANOVAs. For all theANOVAs described in this paper, thresholds were ex-pressed as log arc-sec, so that variances for the differentconditions remained approximately equal. The P-valuesreported in this paper are the higher (lower) of theHuynh-Feldt and Greenhouse-Geisser corrected valuesfor significant (insignificant) effects.
3. Results
3.1. Vernier thresholds for dots 6ersus asymmetricirregular shapes
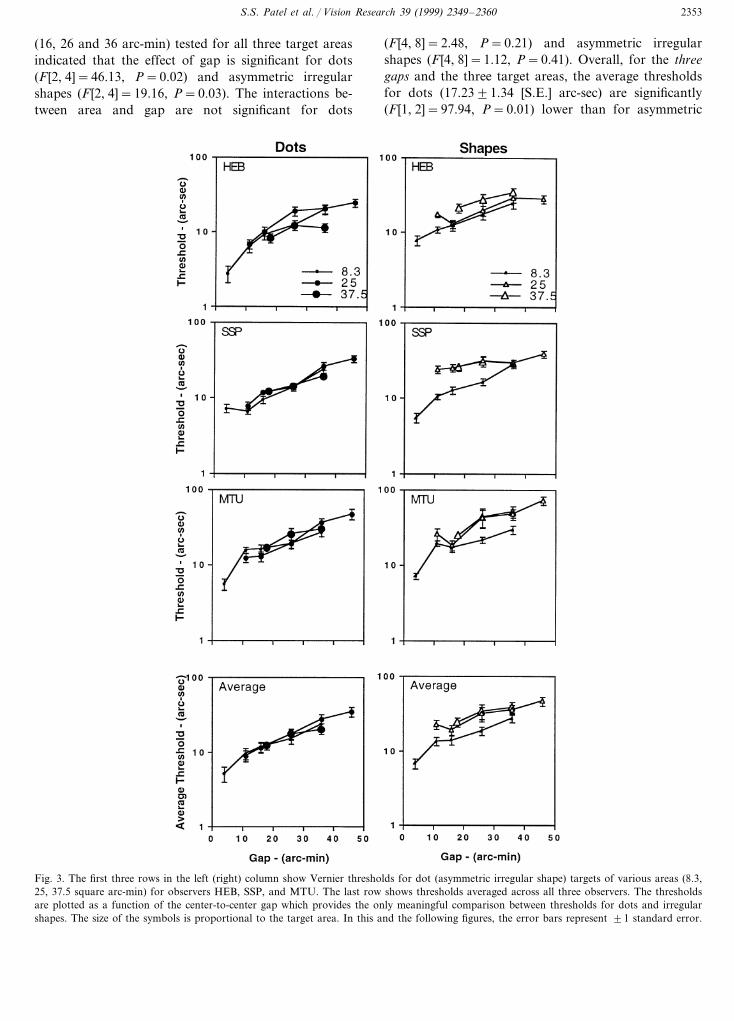
As shown in Fig. 3, the average Vernier thresholdsfor dots and asymmetric irregular shapes increase withcenter-to-center gap for all three target areas. Statisticalanalysis which included only the data for the three gaps
In a control experiment to investigate whetherthresholds are invariant to stimulus rotation, all of thesymmetric irregular shapes of 25 square arc-min wererotated by 90°. Thresholds were obtained for gaps of11, 16, 26, 36 and 46 arc-min using the same protocolas described above. Only observers SP and HB partici-pated in this experiment.
The role that target skew might have played in themain experiment was investigated in a first ancillaryexperiment. All of the asymmetric shapes of 25 squarearc-min were rotated in steps of 1° and the angles ofrotation that yielded the minimum and maximum abso-lute values of x-axis skew were determined. Skew wasdefined as the third order moment of the target’s lumi-nance distribution (Press, Flannery, Teukolsky & Vet-
S.S. Patel et al. / Vision Research 39 (1999) 2349–2360 2353
(16, 26 and 36 arc-min) tested for all three target areasindicated that the effect of gap is significant for dots(F [2, 4]=46.13, P=0.02) and asymmetric irregularshapes (F [2, 4]=19.16, P=0.03). The interactions be-tween area and gap are not significant for dots
(F [4, 8]=2.48, P=0.21) and asymmetric irregularshapes (F [4, 8]=1.12, P=0.41). Overall, for the threegaps and the three target areas, the average thresholdsfor dots (17.2391.34 [S.E.] arc-sec) are significantly(F [1, 2]=97.94, P=0.01) lower than for asymmetric
Fig. 3. The first three rows in the left (right) column show Vernier thresholds for dot (asymmetric irregular shape) targets of various areas (8.3,25, 37.5 square arc-min) for observers HEB, SSP, and MTU. The last row shows thresholds averaged across all three observers. The thresholdsare plotted as a function of the center-to-center gap which provides the only meaningful comparison between thresholds for dots and irregularshapes. The size of the symbols is proportional to the target area. In this and the following figures, the error bars represent 91 standard error.
S.S. Patel et al. / Vision Research 39 (1999) 2349–23602354
irregular shapes (26.5791.95 [S.E.] arc-sec). For thesmallest target area, (8.3 square arc-min), the differencebetween the average Vernier threshold for dots and forasymmetric irregular shapes is insignificant (F=5.7,P=0.14). For the smallest gap (4 arc-min), the averageVernier threshold for dots (5.191.3 [S.E.] arc-sec) isslightly lower than that for asymmetric irregular shapes(6.790.7 [S.E.] arc-sec). It is important to note that theobservers saw all of the irregular-shape targets to havesharp edges and corners, regardless of their area. Thisobservation indicates that optical degradation intro-duced by the eye did not eliminate the high-spatialfrequency components that distinguish the irregularshapes from the dot targets.
As shown in Fig. 3, the average thresholds for dots areessentially area-independent (F [2, 4]=0.67, P=0.5). Onthe other hand, the average thresholds for asymmetricirregular shapes are area-dependent (F [2, 4]=17.28,P=0.045) and increase with target area (Fig. 3). Asmentioned earlier, the interactions between gaps andareas are not significant for dots and asymmetric irreg-ular shapes.
3.2. Rotational in6ariance of thresholds for asymmetricirregular shapes
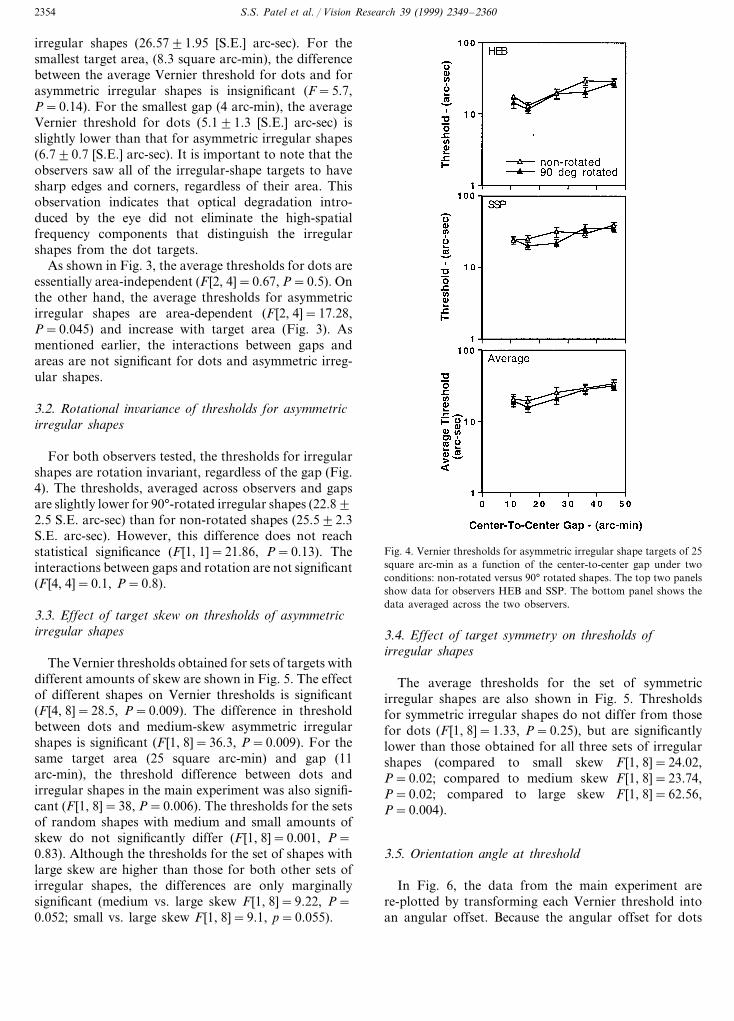
For both observers tested, the thresholds for irregularshapes are rotation invariant, regardless of the gap (Fig.4). The thresholds, averaged across observers and gapsare slightly lower for 90°-rotated irregular shapes (22.892.5 S.E. arc-sec) than for non-rotated shapes (25.592.3S.E. arc-sec). However, this difference does not reachstatistical significance (F [1, 1]=21.86, P=0.13). Theinteractions between gaps and rotation are not significant(F [4, 4]=0.1, P=0.8).
3.3. Effect of target skew on thresholds of asymmetricirregular shapes
The Vernier thresholds obtained for sets of targets withdifferent amounts of skew are shown in Fig. 5. The effectof different shapes on Vernier thresholds is significant(F [4, 8]=28.5, P=0.009). The difference in thresholdbetween dots and medium-skew asymmetric irregularshapes is significant (F [1, 8]=36.3, P=0.009). For thesame target area (25 square arc-min) and gap (11arc-min), the threshold difference between dots andirregular shapes in the main experiment was also signifi-cant (F [1, 8]=38, P=0.006). The thresholds for the setsof random shapes with medium and small amounts ofskew do not significantly differ (F [1, 8]=0.001, P=0.83). Although the thresholds for the set of shapes withlarge skew are higher than those for both other sets ofirregular shapes, the differences are only marginallysignificant (medium vs. large skew F [1, 8]=9.22, P=0.052; small vs. large skew F [1, 8]=9.1, p=0.055).
Fig. 4. Vernier thresholds for asymmetric irregular shape targets of 25square arc-min as a function of the center-to-center gap under twoconditions: non-rotated versus 90° rotated shapes. The top two panelsshow data for observers HEB and SSP. The bottom panel shows thedata averaged across the two observers.
3.4. Effect of target symmetry on thresholds ofirregular shapes
The average thresholds for the set of symmetricirregular shapes are also shown in Fig. 5. Thresholdsfor symmetric irregular shapes do not differ from thosefor dots (F [1, 8]=1.33, P=0.25), but are significantlylower than those obtained for all three sets of irregularshapes (compared to small skew F [1, 8]=24.02,P=0.02; compared to medium skew F [1, 8]=23.74,P=0.02; compared to large skew F [1, 8]=62.56,P=0.004).
3.5. Orientation angle at threshold
In Fig. 6, the data from the main experiment arere-plotted by transforming each Vernier threshold intoan angular offset. Because the angular offset for dots
S.S. Patel et al. / Vision Research 39 (1999) 2349–2360 2355
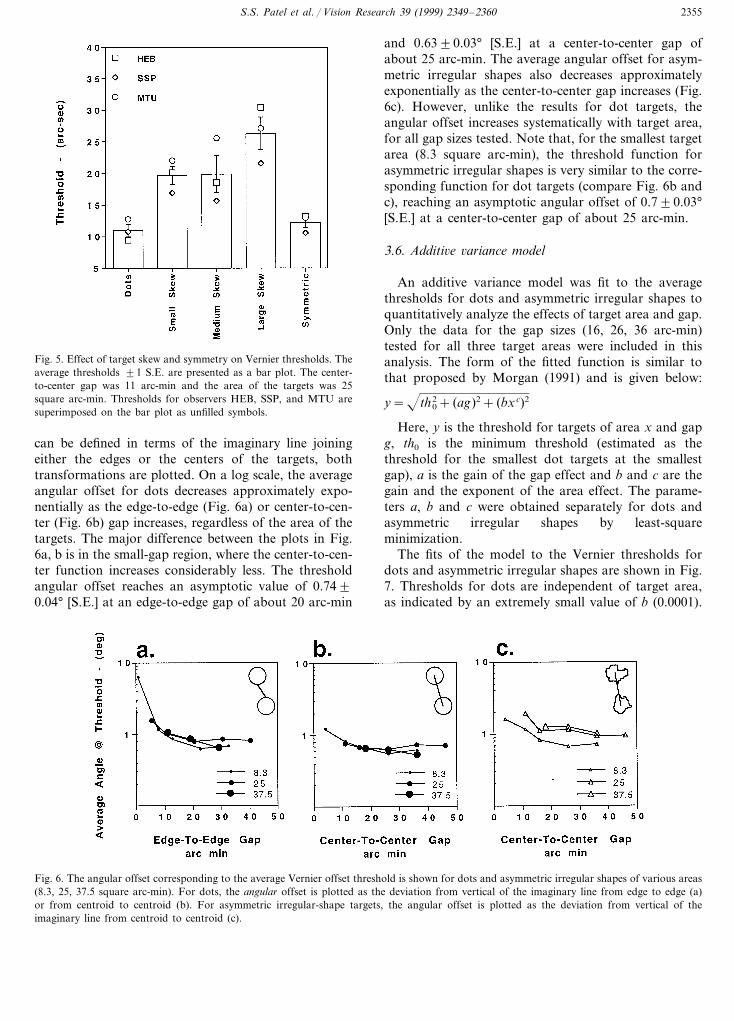
Fig. 5. Effect of target skew and symmetry on Vernier thresholds. Theaverage thresholds 91 S.E. are presented as a bar plot. The center-to-center gap was 11 arc-min and the area of the targets was 25square arc-min. Thresholds for observers HEB, SSP, and MTU aresuperimposed on the bar plot as unfilled symbols.
and 0.6390.03° [S.E.] at a center-to-center gap ofabout 25 arc-min. The average angular offset for asym-metric irregular shapes also decreases approximatelyexponentially as the center-to-center gap increases (Fig.6c). However, unlike the results for dot targets, theangular offset increases systematically with target area,for all gap sizes tested. Note that, for the smallest targetarea (8.3 square arc-min), the threshold function forasymmetric irregular shapes is very similar to the corre-sponding function for dot targets (compare Fig. 6b andc), reaching an asymptotic angular offset of 0.790.03°[S.E.] at a center-to-center gap of about 25 arc-min.
3.6. Additi6e 6ariance model
An additive variance model was fit to the averagethresholds for dots and asymmetric irregular shapes toquantitatively analyze the effects of target area and gap.Only the data for the gap sizes (16, 26, 36 arc-min)tested for all three target areas were included in thisanalysis. The form of the fitted function is similar tothat proposed by Morgan (1991) and is given below:
y=th02+ (ag)2+ (bxc)2
Here, y is the threshold for targets of area x and gapg, th0 is the minimum threshold (estimated as thethreshold for the smallest dot targets at the smallestgap), a is the gain of the gap effect and b and c are thegain and the exponent of the area effect. The parame-ters a, b and c were obtained separately for dots andasymmetric irregular shapes by least-squareminimization.
The fits of the model to the Vernier thresholds fordots and asymmetric irregular shapes are shown in Fig.7. Thresholds for dots are independent of target area,as indicated by an extremely small value of b (0.0001).
can be defined in terms of the imaginary line joiningeither the edges or the centers of the targets, bothtransformations are plotted. On a log scale, the averageangular offset for dots decreases approximately expo-nentially as the edge-to-edge (Fig. 6a) or center-to-cen-ter (Fig. 6b) gap increases, regardless of the area of thetargets. The major difference between the plots in Fig.6a, b is in the small-gap region, where the center-to-cen-ter function increases considerably less. The thresholdangular offset reaches an asymptotic value of 0.7490.04° [S.E.] at an edge-to-edge gap of about 20 arc-min
Fig. 6. The angular offset corresponding to the average Vernier offset threshold is shown for dots and asymmetric irregular shapes of various areas(8.3, 25, 37.5 square arc-min). For dots, the angular offset is plotted as the deviation from vertical of the imaginary line from edge to edge (a)or from centroid to centroid (b). For asymmetric irregular-shape targets, the angular offset is plotted as the deviation from vertical of theimaginary line from centroid to centroid (c).

S.S. Patel et al. / Vision Research 39 (1999) 2349–23602356
Fig. 7. Additive variance model for the effects of target gap and area on Vernier offset threshold. Each data point represents the average thresholdacross the three observers at each gap. The size of the symbol is proportional to the gap. The model parameters, obtained using separateleast-square fits for dots and asymmetric irregular shapes, are shown in the upper left corner of each panel. The fitted curves for each gap aresuperimposed as solid lines.
In contrast, the thresholds for irregular shapes arearea dependent as indicated by a value close to one(0.95). The center-to-center gap exerts similar effectson the thresholds for dots and irregular-shape targets,as indicated by the comparable values of a (0.63 fordots and 0.78 for asymmetric irregular shapes).
4. Discussion
Vernier thresholds in the hyperacuity range arepossible for targets without regular shape informa-tion. It is not surprising that the thresholds for dotsand asymmetric irregular shapes increase with an in-crease in target gap. The fact that the minimumthresholds for dots and asymmetric irregular shapesare not significantly different is an interesting result.These minimum values were obtained for the smallestcenter-to-center gap (4 arc-min) and for the smallesttarget area (8.3 square arc-min). As the mechanismsdepending on internal reference and target symmetryare unlikely to play a role in determining thethresholds for asymmetric irregular shapes, it is plau-sible that a similarly sensitive feature-independentmechanism is responsible. In addition, our data indi-cate that such a mechanism is insensitive to targetrotation, suggesting that a centroid-type computationmay be involved in determining thresholds for asym-metric irregular shapes.
Across the larger gaps (16, 26, 36 arc-min) andtarget areas (8.3, 25, 37.5 square arc-min) tested, thethresholds for dots were significantly lower than thosefor asymmetric irregular shapes. The edge-to-edgegaps computed from the target size and center-to-cen-ter gaps of 16, 26 and 36 arc-min were greater than10 arc-min for all sizes. Note that spatial filter mech-anisms are not believed to mediate Vernier thresholds
at these large gaps (Wang & Levi, 1994; Waugh &Levi 1995; but also see the last paragraph in thissection). The difference in thresholds between dotsand asymmetric irregular shapes may reflect the accu-racy of determining the centroid for different shapes.It is conceivable that different levels of processingmay be involved in determining centroids of regularshapes and irregular shapes. For well defined shapes,high-level learnt rules of geometry may be appliedwhile for irregular shapes a noisier low-level imageanalysis may be involved in determining centroids. Alow-level image-analysis type computation would beanalogous to finding the normalized first order mo-ments in the horizontal and the vertical directions(Levine, 1985). The fact that thresholds for dots arerelatively area independent, whereas those for asym-metric irregular shapes are area dependent, also sup-ports the idea of different centroid computationschemes. An alternative explanation of the differencein thresholds between dots and asymmetric irregularshapes may be based upon the availability of well-defined edge cues for dot target localization. For bothshapes and dots the same low-level scheme may beused, however its accuracy may depend on theamount of high spatial frequency noise at various ori-entations in the targets. From an ideal computationstandpoint, differences in spatial frequencies and ori-entations should not induce errors in low-level cen-troid computations. But the visual system is far fromideal and has limited detector resolution and pre-sumably limited resolution for spatial frequency andorientation. Inaccurate representation of higher spatialfrequencies due to the above-mentioned limitationscould cause centroid computation errors in shapesthat have significant energies at relatively higher fre-quencies. Previously, Morgan and Glennerster (1991)reported that spatial interval acuity is independent of
S.S. Patel et al. / Vision Research 39 (1999) 2349–2360 2357
target size for circular discs, which they explained bynoting that the uncertainty added due to increasedtarget size is offset by a corresponding increase innumber of available samples.
Thresholds obtained with asymmetric irregularshapes of small skew (S.D.�0.001) were also signifi-cantly higher than those obtained with dots. Thethresholds obtained with asymmetric irregular shapesof small skew were similar to those obtained formedium skew. This suggests that a factor other thanskew is responsible for elevation of thresholds forasymmetric irregular shapes compared to dots. Never-theless, Vernier performance is apparently degradedwhen target skew exceeds a certain critical value, asthe thresholds for large-skew, asymmetric irregularshapes were higher than those for shapes with smallor medium skew. As expected from a Regan–Bever-ley type model (Fig. 1b), the thresholds obtained us-ing symmetric irregular shapes were indistinguishablefrom those for dots, suggesting that target asymmetryplays an important role in the elevation of thresholdsfor asymmetric irregular shapes.
For gaps greater than about 15 arc-min, the rea-sonably good fit of the additive variance model sug-gests that Vernier performance may be limited by atleast two independent noise sources: (1) area-depen-dent noise in determining the location of the targetcentroid; and (2) area-independent noise in makingVernier comparisons, which increases with the gap.Compared to the area-independent noise, the area-de-pendent noise for regular shapes like dots is verysmall (Fig. 7) and can be ignored. As mentioned pre-viously, this area independence for regular shapes
may reflect a different rule-based centroid computa-tion scheme which is minimally sensitive to an in-crease in area. However for asymmetric irregularshapes, area-dependent noise is significant and in-creases almost linearly with area (value of c in Fig.7), suggesting a low-level centroid computationscheme; e.g. one that depends on the count of posi-tion detectors involved. Note that the results fromprevious localization studies (Jiang & Levi, 1991;Morgan & Glennerster, 1991; Vos et al., 1993) sug-gest that thresholds depend on the extent of the stim-ulus (e.g. diameter for a circular target) and not thearea as found in this study. The basis for an areadependency in our data is not clear at this time but,as mentioned earlier, a low-level centroid computationscheme (Levine, 1985) would exhibit such dependency.
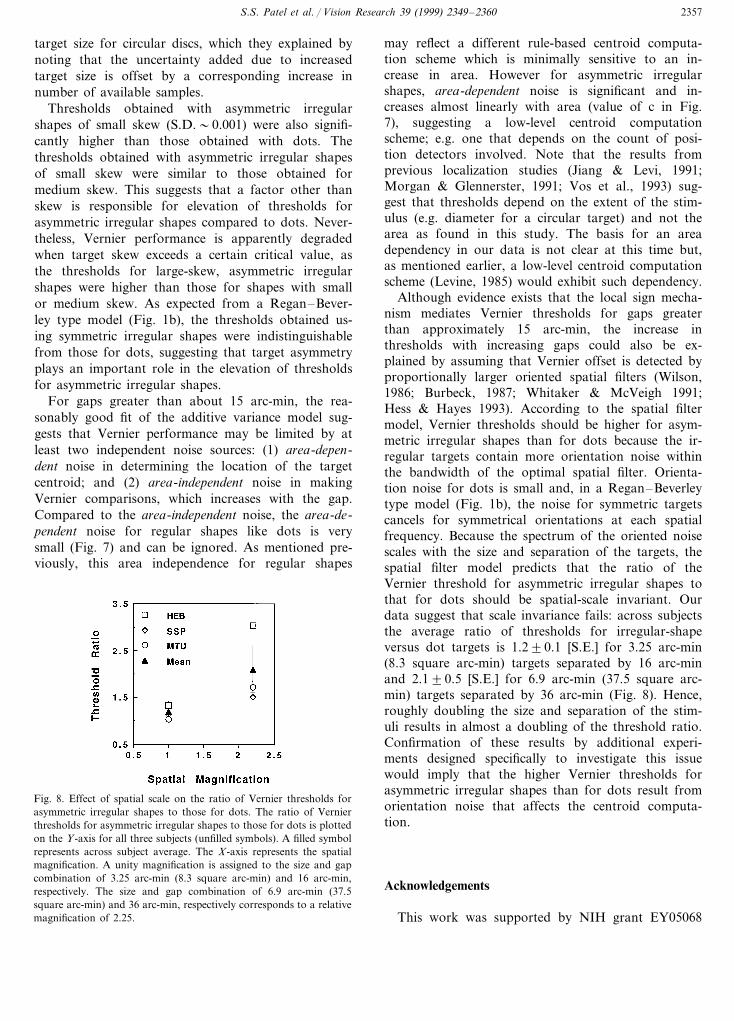
Although evidence exists that the local sign mecha-nism mediates Vernier thresholds for gaps greaterthan approximately 15 arc-min, the increase inthresholds with increasing gaps could also be ex-plained by assuming that Vernier offset is detected byproportionally larger oriented spatial filters (Wilson,1986; Burbeck, 1987; Whitaker & McVeigh 1991;Hess & Hayes 1993). According to the spatial filtermodel, Vernier thresholds should be higher for asym-metric irregular shapes than for dots because the ir-regular targets contain more orientation noise withinthe bandwidth of the optimal spatial filter. Orienta-tion noise for dots is small and, in a Regan–Beverleytype model (Fig. 1b), the noise for symmetric targetscancels for symmetrical orientations at each spatialfrequency. Because the spectrum of the oriented noisescales with the size and separation of the targets, thespatial filter model predicts that the ratio of theVernier threshold for asymmetric irregular shapes tothat for dots should be spatial-scale invariant. Ourdata suggest that scale invariance fails: across subjectsthe average ratio of thresholds for irregular-shapeversus dot targets is 1.290.1 [S.E.] for 3.25 arc-min(8.3 square arc-min) targets separated by 16 arc-minand 2.190.5 [S.E.] for 6.9 arc-min (37.5 square arc-min) targets separated by 36 arc-min (Fig. 8). Hence,roughly doubling the size and separation of the stim-uli results in almost a doubling of the threshold ratio.Confirmation of these results by additional experi-ments designed specifically to investigate this issuewould imply that the higher Vernier thresholds forasymmetric irregular shapes than for dots result fromorientation noise that affects the centroid computa-tion.
Acknowledgements
This work was supported by NIH grant EY05068
Fig. 8. Effect of spatial scale on the ratio of Vernier thresholds forasymmetric irregular shapes to those for dots. The ratio of Vernierthresholds for asymmetric irregular shapes to those for dots is plottedon the Y-axis for all three subjects (unfilled symbols). A filled symbolrepresents across subject average. The X-axis represents the spatialmagnification. A unity magnification is assigned to the size and gapcombination of 3.25 arc-min (8.3 square arc-min) and 16 arc-min,respectively. The size and gap combination of 6.9 arc-min (37.5square arc-min) and 36 arc-min, respectively corresponds to a relativemagnification of 2.25.
S.S. Patel et al. / Vision Research 39 (1999) 2349–23602358
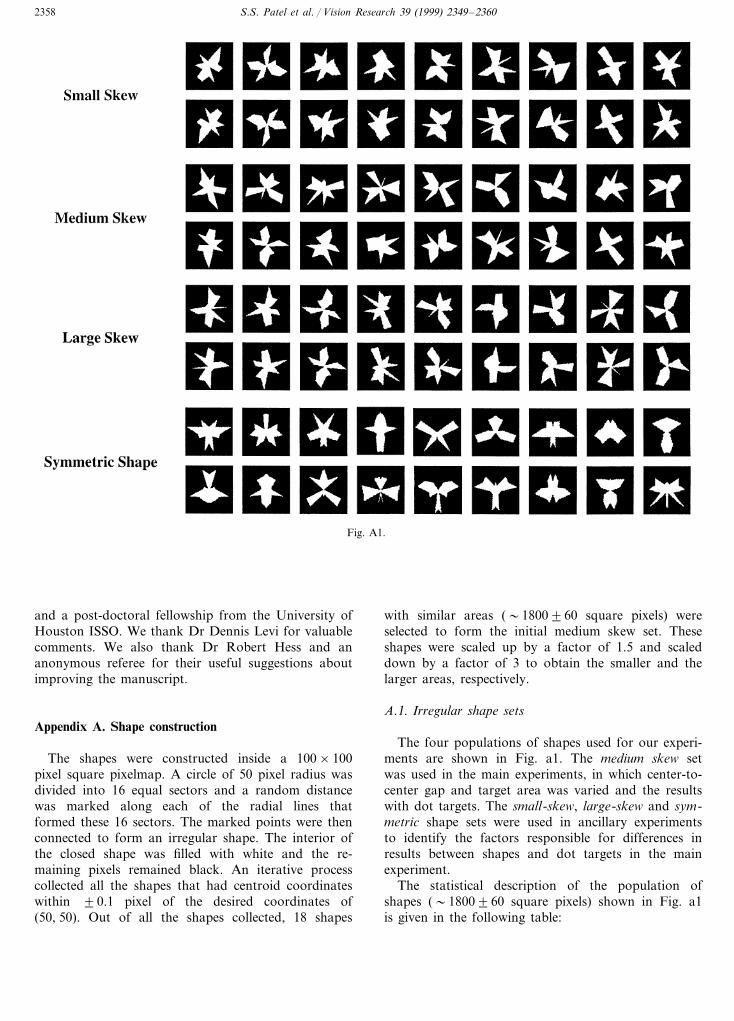
Fig. A1.
and a post-doctoral fellowship from the University ofHouston ISSO. We thank Dr Dennis Levi for valuablecomments. We also thank Dr Robert Hess and ananonymous referee for their useful suggestions aboutimproving the manuscript.
Appendix A. Shape construction
The shapes were constructed inside a 100×100pixel square pixelmap. A circle of 50 pixel radius wasdivided into 16 equal sectors and a random distancewas marked along each of the radial lines thatformed these 16 sectors. The marked points were thenconnected to form an irregular shape. The interior ofthe closed shape was filled with white and the re-maining pixels remained black. An iterative processcollected all the shapes that had centroid coordinateswithin 90.1 pixel of the desired coordinates of(50, 50). Out of all the shapes collected, 18 shapes
with similar areas (�1800960 square pixels) wereselected to form the initial medium skew set. Theseshapes were scaled up by a factor of 1.5 and scaleddown by a factor of 3 to obtain the smaller and thelarger areas, respectively.
A.1. Irregular shape sets
The four populations of shapes used for our experi-ments are shown in Fig. a1. The medium skew setwas used in the main experiments, in which center-to-center gap and target area was varied and the resultswith dot targets. The small-skew, large-skew and sym-metric shape sets were used in ancillary experimentsto identify the factors responsible for differences inresults between shapes and dot targets in the mainexperiment.
The statistical description of the population ofshapes (�1800960 square pixels) shown in Fig. a1is given in the following table:
S.S. Patel et al. / Vision Research 39 (1999) 2349–2360 2359
scymcy UsscxmcxsamaNTarget population type Lsssms
1.00 23.93 0.0000.00 50.00 0.00 50.00 0.00 0.000 0.000 0.000Dots18.00 23.67 0.82 50.01 0.06 49.99 0.0030.08 0.000 0.002 −0.003Small skew
0.73518.00 23.89 0.83 49.99 0.07 49.99 0.06 0.002 0.335 −0.659Medium skew18.00 24.09 0.88 50.01 0.06Large skew 50.03 0.06 0.000 0.835 −0.986 0.98618.00Symmetric shape 24.80 0.50 49.50 0.00 49.87 0.69 0.000 0.000 0.000 0.000
where,
NNumber of shapesMean area (square arc-min) of set ma
S.D. of area (square arc-min) in set sa
Mean centroid—X coordinate in set mcx
S.D. of centroid—X in set scx
Mean centroid—Y corordinate in set mcy
scyS.D. of centroid—Y coordinate in setMean skew if set ms
S.D. of skew in set ss
LsMinimum skew in setMaximum skew in set Us
One pixel 6.91 arc-sec
References
Andrews, D. P., Butcher, A. K., & Buckley, B. R. (1973). Acuitiesfor spatial arrangement in line figures: human and ideal observ-ers compared. Vision Research, 13, 599–620.
Badcock, D. R., Hess, R. F., & Dobbins, K. (1996). Localizationof element clusters: multiple cues. Vision Research, 36, 1467–1472.
Bocheva, N., & Yakimoff, N. (1996). Different mechanisms mayunderlie the performance in relative localization tasks. VisionResearch, 36, 2531–2535.
Burbeck, C. A. (1987). Position and spatial frequency in large scalelocalization judgements. Vision Research, 27, 417–428.
Hess, R. F., & Hayes, A. (1993). Neural recruitment explains ‘We-ber’s law’ of spatial position. Vision Research, 33, 1673–1684.
Hess, R. F., Dakin, S. R., & Badcock, D. (1994). Localization ofelement clusters by the human visual system. Vision Research,34, 2439–2451.
Hess, R. F., & Holliday, I. (1996). Primitives used in spatial local-ization of nonabutting stimuli: peaks or centroids. Vision Re-search, 36, 3821–3826.
Jiang, B. C., & Levi, D. M. (1991). Spatial-interval discriminationin two-dimensions. Vision Research, 31, 1931–1937.
Levi, D. M., & Waugh, S. J. (1996). Position acuity with opposite-contrast polarity features: evidence for a nonlinear collectormechanism for position acuity. Vision Research, 36, 573–588.
Levine, M. D. (1985). Vision in man and machine. New York:McGraw-Hill.
McKee, S. P. (1991). Vision and 6isual dysfunction (5). Boca Raton:CRC.
Meer, P., & Zeevi, Y. (1989). The role of stimulus structure inspatial hyperacuity. Spatial Vision, 4, 141–174.
Morgan, M. J., & Aiba, T. S. (1985). Vernier acuity predicted fromchanges in the light distribution of the retinal image. SpatialVision, 1, 151–161.
Morgan, M. J. (1991). Vision and 6isual dysfunction (10). BocaRaton: CRC.
Morgan, M. J., & Glennerster, A. (1991). Efficiency of locatingcentres of dot-clusters by human observers. Vision Research, 31,2075–2083.
Mussap, A. J., & Levi, D. M. (1997). Vernier acuity with plaidmasks: the role of oriented filters in vernier acuity. Vision Re-search, 37, 1325–1340.
Press, W. H., Flannery, B. P., Teukolsky, S. A., & Vetterling, W.T. (1992). Numerical recipes in pascal. Cambridge: CambridgeUniversity.
Regan, D., & Beverley, K. I. (1985). Post adaptation orientationdiscrimination. Journal of the Optical Society of America A, 2,147–155.
Toet, A., Smit, C. S., Nienhuis, B., & Koenderink, J. J. (1988).The visual assessment of the spatial location of a bright bar.Vision Research, 28, 721–737.
Vos, P. G., Bocheva, N., Yakimoff, N., & Helsper, E. (1993).Perceived location of two-dimensional patterns. Vision Research,33, 2157–2169.
Wang, H., & Levi, D. (1994). Spatial integration in position acuity.Vision Research, 34, 2859–2877.
Ward, R., Casco, C., & Watt, R. J. (1985). The location of noisyvisual stimuli. Canadian Journal of Psychology, 39, 387–399.
Watt, R. J. (1984). Towards a general theory of the visual acuitiesfor shape and spatial arrangement. Vision Research, 24, 1377–1386.
Waugh, S. J., Levi, D. M., & Carney, T. (1993). Orientation,masking, and vernier acuity for line targets. Vision Research,12, 1619–1638.
Waugh, S. J., & Levi, D. M. (1995). Spatial alignment across gaps:contributions of orientation and spatial scale. Journal of theOptical Society of America A, 12, 2305–2317.
Westheimer, G., & McKee, S. P. (1977). Integration regions for visualhyperacuity. Vision Research, 17, 89–93.
Westheimer, G., & McKee, S. P. (1977). Spatial configurations forvisual hyperacuity. Vision Research, 17, 941–947.
Whitaker, D., & Walker, H. (1988). Centroid evaluation in theVernier alignment of random dot clusters. Vision Research, 28,777–784.

S.S. Patel et al. / Vision Research 39 (1999) 2349–23602360
Whitaker, D., & McVeigh, D. (1991). Interaction of spatial fre-quency and separation in Vernier acuity. Vision Research, 31,1205–1212.
Whitaker, D., McGraw, P. V., Pacey, I., & Barrett, B. T. (1996).Centroid analysis predicts visual localization of first- and second-order stimuli. Vision Research, 36, 2957–2970.
Wilson, H. (1986). Responses of spatial mechanisms can explainhyperacuity. Vision Research, 26, 453–469.
Wilson, H. (1991). Vision and 6isual dysfunction (10). Boca Raton:CRC.
Yakimoff, N., Bocheva, N., & Mitrani, L. (1990). Perceiving thecenter of irregular contour quadrangles. Spatial Vision, 5, 51–57.
.


![[2019] CCJ 9 (AJ) - Election Judgments](https://static.fdokumen.com/doc/165x107/63223e3628c445989105af86/2019-ccj-9-aj-election-judgments.jpg)


