REGION-BASED ENDOCARDIUM TRACKING ON REAL-TIME THREE DIMENSIONAL ULTRASOUND
17
Region-Based Endocardium Tracking on Real-Time Three- Dimensional Ultrasound Qi Duan 1 , Elsa D. Angelini 2 , Susan L. Herz 1 , Christopher M. Ingrassia 1 , Kevin D. Costa 1 , Jeffrey W. Holmes 1 , Shunichi Homma 1 , and Andrew F. Laine 1 1 Department of Biomedical Engineering, Columbia University, ET-351, 1210 Amsterdam Avenue, New York, NY 10027, USA 2 Department of Image and Signal Processing, Institut Telecom, Telecom ParisTech, CNRS LTCI, France Abstract Matrix-phased array transducers for real-time three-dimensional ultrasound enable fast, non-invasive visualization of cardiac ventricles. Typically, 3D ultrasound images are semi-automatically segmented to extract the left ventricular endocardial surface at end-diastole and end-systole. Automatic segmentation and propagation of this surface throughout the entire cardiac cycle is a challenging and cumbersome task. If the position of the endocardial surface is provided at one or two time frames during the cardiac cycle, automated tracking of the surface over the remaining time frames could reduce the workload of cardiologists and optimize analysis of 3D ultrasound data. In this paper, we applied a region-based tracking algorithm to track the endocardial surface between two reference frames that were manually segmented. To evaluate the tracking of the endocardium, the method was applied to 40 open-chest dog data sets with 484 frames in total. Ventricular geometry and volumes derived from region-based endocardial surfaces and manual tracing were quantitatively compared, showing strong correlation between the two approaches. Statistical analysis showed that the errors from tracking were within the range of inter-observer variability of manual tracing. Moreover, our algorithm performed well on ischemia data sets, suggesting that the method is robust to abnormal wall motion. In conclusion, the proposed optical flow-based surface tracking method is very efficient and accurate, providing dynamic “interpolation” of segmented endocardial surfaces. Keywords Real-time 3D echocardiography; optical flow; speckle tracking; quantitative evaluation; open-chest ultrasound; LV; endocardium Introduction Cardiac screening using ultrasound is beneficial as it provides the highest temporal resolution, but it is limited to two dimensions in most medical centers. Development of 3D echocardiography began in the late 1980s with the introduction of off-line 3D medical ultrasound imaging systems. Many review articles have been published over the past decade, Corresponding Author: Qi Duan, ET351, 1210 Amsterdam Avenue, New York, NY, 10025, Phone: (212) 854-5996, Fax: (212) 854-5995, Email: [email protected]. Publisher's Disclaimer: This is a PDF file of an unedited manuscript that has been accepted for publication. As a service to our customers we are providing this early version of the manuscript. The manuscript will undergo copyediting, typesetting, and review of the resulting proof before it is published in its final citable form. Please note that during the production process errors may be discovered which could affect the content, and all legal disclaimers that apply to the journal pertain. NIH Public Access Author Manuscript Ultrasound Med Biol. Author manuscript; available in PMC 2010 February 1. Published in final edited form as: Ultrasound Med Biol. 2009 February ; 35(2): 256–265. doi:10.1016/j.ultrasmedbio.2008.08.012. NIH-PA Author Manuscript NIH-PA Author Manuscript NIH-PA Author Manuscript
Transcript of REGION-BASED ENDOCARDIUM TRACKING ON REAL-TIME THREE DIMENSIONAL ULTRASOUND

Region-Based Endocardium Tracking on Real-Time Three-Dimensional Ultrasound
Qi Duan1, Elsa D. Angelini2, Susan L. Herz1, Christopher M. Ingrassia1, Kevin D. Costa1,Jeffrey W. Holmes1, Shunichi Homma1, and Andrew F. Laine1
1 Department of Biomedical Engineering, Columbia University, ET-351, 1210 Amsterdam Avenue, New York,NY 10027, USA
2 Department of Image and Signal Processing, Institut Telecom, Telecom ParisTech, CNRS LTCI, France
AbstractMatrix-phased array transducers for real-time three-dimensional ultrasound enable fast, non-invasivevisualization of cardiac ventricles. Typically, 3D ultrasound images are semi-automaticallysegmented to extract the left ventricular endocardial surface at end-diastole and end-systole.Automatic segmentation and propagation of this surface throughout the entire cardiac cycle is achallenging and cumbersome task. If the position of the endocardial surface is provided at one ortwo time frames during the cardiac cycle, automated tracking of the surface over the remaining timeframes could reduce the workload of cardiologists and optimize analysis of 3D ultrasound data. Inthis paper, we applied a region-based tracking algorithm to track the endocardial surface betweentwo reference frames that were manually segmented. To evaluate the tracking of the endocardium,the method was applied to 40 open-chest dog data sets with 484 frames in total. Ventricular geometryand volumes derived from region-based endocardial surfaces and manual tracing were quantitativelycompared, showing strong correlation between the two approaches. Statistical analysis showed thatthe errors from tracking were within the range of inter-observer variability of manual tracing.Moreover, our algorithm performed well on ischemia data sets, suggesting that the method is robustto abnormal wall motion. In conclusion, the proposed optical flow-based surface tracking method isvery efficient and accurate, providing dynamic “interpolation” of segmented endocardial surfaces.
KeywordsReal-time 3D echocardiography; optical flow; speckle tracking; quantitative evaluation; open-chestultrasound; LV; endocardium
IntroductionCardiac screening using ultrasound is beneficial as it provides the highest temporal resolution,but it is limited to two dimensions in most medical centers. Development of 3Dechocardiography began in the late 1980s with the introduction of off-line 3D medicalultrasound imaging systems. Many review articles have been published over the past decade,
Corresponding Author: Qi Duan, ET351, 1210 Amsterdam Avenue, New York, NY, 10025, Phone: (212) 854-5996, Fax: (212) 854-5995,Email: [email protected]'s Disclaimer: This is a PDF file of an unedited manuscript that has been accepted for publication. As a service to our customerswe are providing this early version of the manuscript. The manuscript will undergo copyediting, typesetting, and review of the resultingproof before it is published in its final citable form. Please note that during the production process errors may be discovered which couldaffect the content, and all legal disclaimers that apply to the journal pertain.
NIH Public AccessAuthor ManuscriptUltrasound Med Biol. Author manuscript; available in PMC 2010 February 1.
Published in final edited form as:Ultrasound Med Biol. 2009 February ; 35(2): 256–265. doi:10.1016/j.ultrasmedbio.2008.08.012.
NIH
-PA Author Manuscript
NIH
-PA Author Manuscript
NIH
-PA Author Manuscript
assessing the progress and limitations of 3D ultrasound technology for clinical screening(Belohlavek, Foley 1993, Fenster and Downey 2000, Ofili and Nanda 1994, Rankin, Fenster1993). These articles reflect the diversity of 3D systems developed for both image acquisitionand reconstruction. Although 2D transducers can be configured to assemble a 3D image froma series of planar views, for truly real-time acquisition, only matrix phased array transducerscan scan true three-dimensional volumes with stationary transducers (Ramm and Smith1990). There are few alternative technologies which also enable real-time acquisition basedon vibrating or fast rotating transducers (Canals, Lamarque 1999, Voormolen, Krenning2006). Real-time 3D ultrasound technology is an improvement over former generations of 3Dsystems because volumetric data can be acquired rapidly (20–25 frames per second), enablingcardiologists to visualize moving cardiac structures from any given plane in real-time. A firstgeneration of real-time three-dimensional ultrasound (RT3D) scanners was introduced in theearly 1990s by Volumetrics© (Ramm and Smith 1990) but low spatial resolution over thewhole cardiac volume prevented the technology from meeting its initial expectation andreaching its full potential. A new generation of RT3D transducers was introduced by PhilipsMedical Systems (Best, The Netherlands) in the 2000s with the SONOS 7500, and mostrecently the iE33 ultrasound system that can acquire a fully sampled cardiac volume in fourcardiac cycles. Four sector acquisitions are performed with each scan, acquiring ¼ of thecardiac volume. These sectors are spatially aggregated to generate one ultrasound volume overone cardiac cycle. This technical design enabled dramatically increased spatial resolution andimage quality. The latest research upgrade of iE33 also enables a true real-time model whichprovides 4D ultrasound streaming data without any spatial compounding (Duan, Shechter2007).
Clinical evaluation of 3D ultrasound data for assessment of cardiac function is performed viavisualization using selected 2D projection planes. Inspection of 3D data sets with 2Dvisualization tools is time demanding, motivating the development of computational tools forquantitative analysis of ventricular function. It has been shown that abnormal ventricular wallmotion can be detected accurately on RT3D data with quantitative four-dimensional analysisof the endocardial surface and computation of local fractional shortening (Herz, Ingrassia2005, Ingrassia, Usyk 2007). Monaghan’s group has also shown that endocardial surface dataderived from RT3D ultrasound is valuable in accessing dyssynchrony (Horstman, Monaghan2007, Kapetanakis, Kearney 2005). These preliminary studies confirmed that RT3D ultrasoundprovides unique and valuable quantitative information about cardiac motion based on manuallyor semi-automatically traced endocardial contours. To facilitate the segmentation process overthe entire cardiac cycle, we evaluated the use of region-based tracking between segmentedframes to alleviate the manual tracing task. In previous research on motion tracking withultrasound data, intensity-based OF tracking methods described in (Bardinet, Cohen 1996,Boukerroui, Noble 2003, Mikic, Krucinski 1998, Paragios 2003, Tsuruoka, Umehara 1996,Yu, Lin 2003) combined local intensity correlation with specific regularizing constraints (e.g.continuity of the displacements). The presence of speckle noise in ultrasound prevents the useof gradient-based methods, however relatively large region-matching methods are robust tothe presence of noise. In this study, we propose a surface tracking application using a 4Dcorrelation-based tracking method on 3D volumetric ultrasound intensity data.
This study aimed to address the following questions, focusing on the left ventricle (LV): Canthe proposed method track the endocardial surface between end-diastole (ED) and end-systole(ES) with reliable positioning accuracy? How does dynamic information derived from trackingon RT3D ultrasound compare to information obtained from a single segmentation method?Can the proposed method be used as a dynamic interpolation tool for tracking the endocardialsurface?
Duan et al. Page 2
Ultrasound Med Biol. Author manuscript; available in PMC 2010 February 1.
NIH
-PA Author Manuscript
NIH
-PA Author Manuscript
NIH
-PA Author Manuscript
MethodsRegion-Based Tracking Utilizing Correlation Metric
In 1981, when Horn and Schunck (Horn and Schunck 1981) proposed the term “optical flow”,it was defined as “the distribution of apparent velocities of movement of brightness patternsin an image”. In other word, the original optical flow definition was referring to a velocity fieldor displacement field of the motion of pixel patterns in an image. Optical flow (OF) trackinginvolves the computation of such fields on deforming objects in an image, based on theassumption that the intensity of the object remains constant over time. In this context, objectmotion is characterized by a flow of pixels with constant intensity. There are two widely usedfamilies of OF computation techniques (Barron, Fleet 1994): (1) Differential techniques(Cremers, Rousson 2007, Frangi, Niessen 2001, Horn and Schunck 1981, Lucas and Kanade1981, Nagel 1983, Yilmaz, Javed 2006) that compute velocity from spatio-temporal derivativesof pixel intensities based on the “optical flow constraint” equation: , withspatial-temporal gradients I* of image I and spatial components of optical flow vector v*(Black and Anandan 1996, Horn and Schunck 1981, Lucas and Kanade 1981), and (2) region-based matching techniques (Anandan 1989, Singh 1990), which compute OF by identifyinglocal displacements that correlate best between two consecutive image frames. Since the firsttwo pilot studies on optical flow estimation (Horn and Schunck 1981, Lucas and Kanade1981) were focused on differential techniques, differential OF accounts for a large portion ofOF-based applications (Ledesma-Carbayo, Kybic 2005, Suhling, Arigovindan 2005, Veronesi,Corsi 2006). Compared to differential OF approaches, region-based methods use similaritymeasures, such as summed-squared differences or cross-correlation coefficients, that are lesssensitive to noise, fast motion, and potential occlusions and discontinuities (Anandan 1989,Bleyer, Gelautz 2005, Convertino 1997, Linguraru, Vasilyev 2006, Revell, Mirmehdi 2004,Singh 1990, Wang, Gu 2007, Xiao, Zhang 2005), while assuming that displacements in smallneighborhoods are similar. Given the relatively high noise corrupting 3D ultrasound volumeseries, we adopted a region-based tracking approach to estimate myocardial surfacedisplacements between two consecutive frames. Specifically, we utilized a correlation metric-based tracking method.
Given two data sets from consecutive time frames: (I (x, t ), I (x, t + Δt)), the displacementvector Δx for pixels in a small neighborhood Ω around each pixel x is estimated by maximizingthe cross-correlation coefficient as follows::
(1)
In this study, correlation-based tracking was performed in 3D to estimate the displacement ofselected voxels between two consecutive ultrasound volumes in the cardiac cycle. The searchwindow Ω was centered around every (5×5×5) pixel volume and was set to size (7×7×7) for avoxel size of 0.6 x 0.6 x 0.6 mm. Regularization of the displacement field was enforced vialocal averaging of the vector values. A priori information on high contrast between themyocardium and the blood was incorporated in the tracking process to avoid tracking in bloodregion and minimize erroneous tracking positions, falling away from the endocardial surfaces.Preprocessing of the RT3D data with a speckle-specific anisotropic diffusion filter previouslydesigned by our group (Duan, Angelini 2004) was applied prior to the tracking.
Duan et al. Page 3
Ultrasound Med Biol. Author manuscript; available in PMC 2010 February 1.
NIH
-PA Author Manuscript
NIH
-PA Author Manuscript
NIH
-PA Author Manuscript
PreprocessingSince noise in the data will degrade the performance in motion tracking algorithms (Bachner,Adam 2007, Yu, Yan 2006), all data sets were pre-smoothed with edge-preserving anisotropicdiffusion as developed in (Duan, Angelini 2004). Anisotropic diffusion methods apply thefollowing heat-diffusion dynamic equation to the gray levels of a given 3D image data set I(x, y, z, t):
(2)
where c (x, y, z, t) is the diffusion parameter, div denotes the divergence operator, and ∇I is thegradient of the image intensity.
In the original work of Perona and Malik (Perona and Malik 1987, Perona and Malik 1990),the concept of anisotropic diffusion was introduced with the selection of a variable diffusionparameter which is a decreasing function g of the gradient of the image data:
(3)
We used the diffusion function proposed by Weickert (Weickert, Romeny 1998) defined as:
(4)
The parameter λ serves as a gradient threshold, defining edge points xk at locations where |∇Ixk|> λ This bell-shaped diffusion function acts as an edge-enhancing filter, with high diffusionvalues in smooth areas and low values at edge points. The structure of the diffusion tensor withseparate weights for each dimension enables to control the direction of the diffusion process,with flows parallel to edge contours.
In the case of noisy textured data, as ultrasound data with speckle noise, as the diffusion processevolves, the characteristics of the image data change and the gradient threshold parameter valueshould therefore be modified. It was reported in a paper by Montagnat et al (Montagnat,Sermesant 2003) that values of significant edges decrease as homogeneous regions in theultrasound data are filtered. Therefore they chose to decrease the threshold gradient over time.Values were selected as a fraction of the cumulative histograms of the data gradients that wererecomputed at each iteration of the diffusion process. In the proposed method, a linear modelwas used to control the gradient weight:
(5)
with λ0 representing an initial gradient value, a the slope parameter and t the time iterationindex. Parameters were set empirically for the data sets processed. In our previous algorithmusing Volumetrics© data (Duan, Angelini 2004), a linearly increasing scheme was used tosuppress the granularity in the acquired images, whereas with the data acquired by the iE33imaging system, such an aggressive diffusion process was not needed. In this paper, adecreasing scheme was used with λ0 =20 and a=−1. Sample cross-section views after denoisingare shown in Figure 1(d–f).
Duan et al. Page 4
Ultrasound Med Biol. Author manuscript; available in PMC 2010 February 1.
NIH
-PA Author Manuscript
NIH
-PA Author Manuscript
NIH
-PA Author Manuscript
Three-Dimensional Ultrasound Data SetsThe OF tracking approach was tested on 40 data sets with 484 frames in total acquired with aniE33 3D ultrasound machine. This data was obtained as part of a separate study under a protocolapproved by Columbia University’s Institutional Animal Care and Use Committee. Fourcoronary artery occlusions were performed on 5 anesthetized, open-chest dogs (20 occlusionstotal). 3D echocardiograms were acquired at baseline and 60–90 seconds after temporaryligation of the left anterior descending (LAD), and left circumflex (LCx) coronary arteries atthe proximal and distal levels. These data sets were obtained by positioning the transducerdirectly on the apex of the heart, providing high image quality in a small field of view. Spatialresolution of the analyzed data was about (0.6 mm)3 and 10–14 frames were acquired duringeach cardiac cycle depending on the heart rate, under an acquisition frame rate at 20–25 framesper second. Cross-sectional views from one of the open-chest baseline data sets at end-diastole(ED) are shown in Figure 1(a–c). The data acquisition was gated by ECG and the ED framewas the first frame for all 4D data series.
SegmentationThe endocardial surface of the left ventricle (LV) was semi-automatically segmented usingTomTec© software by TomTec Inc (Munich, Germany). Manual editing of the endocardialsurface was required. An experienced user performed manual tracing of all time frames on alldata sets, on rotating B-scan views (long-axis views rotating around the central axis of theventricle) and C-scan views (short-axis views at different depths).
Defining a “gold standard” for evaluating the performance of tracking is a challenging task.To evaluate segmentation or boundary extraction methods on clinical data is difficult in generalsince no ground truth can be perfectly defined. As a result, under such circumstances,segmentations from experienced users are usually used as the “ground truth”. In order to takemanual tracing variability into account, discrepancy of segmentation methods are usuallycompared to inter-observer variability (Brandt, Wigstrm 1999, Heijman, Aben 2008, Juergens,Seifarth 2008, Pednekar, Kakadiaris 2003, van Geuns, Baks 2006), viewing the computer-based method as another “observer”. If the discrepancy is comparable to inter-observervariability, then it is safe to consider that the proposed method is acceptable since the error inthe method has fallen within the variance of the ground truth. Following the same rationale,two additional trained cardiologists traced a subset of the data to measure inter-observervariability. We hypothesized that region-based tracking of the endocardial surface from RT3Dultrasound data could achieve comparable accuracy to human observers’ variability. In otherwords, we expected that surface discrepancy between a tracked surface and the correspondingmanual tracing should be similar to the difference between two surfaces traced by two differenttrained users (or cardiologists), i.e. the inter-observer variability.
Tracking with Region-Based TechniqueTracking of the endocardial surface was applied after initialization with manually traced end-diastolic (ED) data. Starting with a set of endocardial surface data (about 650 data points,roughly 1.5 mm apart) defined at ED, the tracking algorithm was used to track the surface intime throughout the entire cardiac cycle. The proposed method was not being applied as asegmentation tool, but used as a surface tracking tool for a given segmentation method. Noadditional reinitialization or forward-and-backward tracking as proposed in (Duan, Angelini2005) was needed, due to high image quality provided by the open-chest acquisition setup.
EvaluationWe evaluated tracking accuracy by quantitatively comparing the dynamic ventricular geometryto the manually segmented surfaces. Segmentation results were typically compared using
Duan et al. Page 5
Ultrasound Med Biol. Author manuscript; available in PMC 2010 February 1.
NIH
-PA Author Manuscript
NIH
-PA Author Manuscript
NIH
-PA Author Manuscript
global measurements such as volume or mean-square errors. In order to provide regionalcomparisons, we proposed a novel comparison method based on a parameterization of theendocardial surface in prolate spheroidal coordinates (Ingrassia, Herz 2003), which haspreviously been used for comparison of ventricular geometry from two 3D ultrasound machinesin (Angelini, Hamming 2002). The endocardial surfaces were registered through time usingthree manually selected anatomical landmarks: the center of the mitral orifice, the endocardialapex, and the equatorial mid-septum point. The surface data was fitted in prolate spheroidalcoordinates (λ,μ,θ), projecting the radial coordinate λ to a 64-element surface mesh with bicubicHermite interpolation, yielding a realistic 3D endocardial surface. The fitting process wasperformed using a custom finite element algorithm.
Fitted nodal values and spatial derivatives of the radial coordinate, λ, were then used to maprelative differences between the two compared surfaces (seg from manual tracing and RT fromRegion-based tracking), ε = (λseg − λRT) / λseg using our custom software. Hammer mappingwas used to preserve relative areas of the flattened endocardial surfaces (Hunter and Smaill1988).
Root mean square errors (RMSE) of the difference in λ, across the entire endocardial surfacewere computed for every time frame, between algorithm-tracked and the manual segmentationresults. Since RMSE is actually the normalized distance between two surfaces, it could providea fairer comparison than conventional point-to-surface metrics under clinical settings.Furthermore, it can be shown that multiplying the focus length of the model with the RMSEmeasurements will provide an upper bound of the point-wise errors. In other words, RMSE isa more conservative, efficient, and clinically relevant version of the conventional metrics.Ventricular volumes were also computed for the manually segmented and the automaticallytracked endocardial surfaces. Finally, relative λ difference maps were generated at end systole(ES), providing a direct quantitative comparison of ventricular geometry. These maps werevisualized with iso-contour lines, representing the fractional difference in λ position betweenthe two surfaces.
ResultsOverall Performance
As mentioned in the previous section, the regional-based tracking algorithm was initialized bymanual tracing of the first frame (end-diastolic (ED) frame) for each of the 40 data sets. Thenthe endocardium was automatically tracked throughout the entire cardiac cycle, which provided444 frames in total where endocardial surface from both manual tracing and automated trackingwere available. A sample result from one data set is shown in Figure 2. The time course ofRMSE for this data set is graphed in Figure 2a, which shows small absolute errors (below 0.07~ 7%) despite error accumulation as previously observed in (Duan, Angelini 2005). Timecourses of the LV volumes estimated from manual tracing (solid line) and tracking (dashedline) are shown in Figure 2b. These two measures were very close especially during the systolicphase except for the last 2–3 frames where accumulated errors became larger. Hammermapping of the percent relative surface discrepancy at end-systole (ES) is shown in Figure 2c.For this data set, 96.7% of the entire endocardial surface generated from algorithm trackinghad less than 10% difference when compared to the manually traced surface.
Across all 444 frames, the mean value of the RMSE was 0.05 with a standard deviation of0.023540. The maximum RMSE value was 0.14. Regarding volume measurements, the meandifference in estimated volume for all 444 frames was 3.93 ml with a standard deviation of2.54 ml. The maximum difference in volume estimation was 13.59 ml. There was a strongcorrelation between volume measurements from region-based tracking and manual tracingwith a correlation coefficient r = 0.93 (r2 = 0.86) and a slope of 0.79 with a bias of 9.8 ml. The
Duan et al. Page 6
Ultrasound Med Biol. Author manuscript; available in PMC 2010 February 1.
NIH
-PA Author Manuscript
NIH
-PA Author Manuscript
NIH
-PA Author Manuscript

regression plot and corresponding Bland-Altman plot are shown in Figure 3(a, b). Averagecomputational time for tracking each frame was 9 seconds with a standard deviation of 0.12seconds and a maximum value of 9.2 seconds. All computations were implemented in Cprogramming language and executed on a 2.4GHz 64-bit AMD single processor server, runningRed Hat Linux Enterprise AS.
Comparison to Inter-Observer VariabilitySince it is difficult to define an absolute “gold standard” for the position of the endocardium,we used an alternate approach to validate our method. Our hypothesis is that region-basedtracking of the endocardium from RT3D ultrasound can achieve comparable accuracy to humanobserver variability. We tested whether the difference between an algorithm-tracked surfaceand the corresponding manual tracing was comparable to the difference between two surfacestraced by separate experienced users, i.e. inter-observer variability.
In order to quantify inter-observer variability, 12 data sets were randomly selected from thetotal 40 data sets. The end-diastolic frame for each data set was traced by two cardiologistsusing separate customized software. All traced surfaces were reconstructed using the methodsdescribed above and differences in surface positions and LV volumes were measured at ED.The reference tracings were similar to those used in the previous section.
On all 12 data sets, the mean value of the RMSE between the two cardiologists was 0.15 witha standard deviation of 0.14. The maximum RMSE value was 0.59. The mean difference inestimated volumes for all frames was 11.83 ml with a standard deviation of 9.64 ml. Themaximum difference in volume estimation was 27.84 ml.
Region-based tracking provided smaller mean and standard deviation values for both RMSEand volume differences. Maximum RMSE and volume error values from region-based trackingwere comparable to mean inter-observer volume differences. To test the hypothesis that theperformance of region-based tracking was comparable to inter-observer errors, RMSE valuesbetween region-based tracking and manual tracing were compared to RMSE values betweentwo experienced users’ tracing by a two-sample t-test. Since our hypothesis is that region-basedtracking has comparable performance with human expert tracing, in terms of RMSE values,the null hypothesis for the statistical test was that RMSE values from region-based trackinghad larger mean value than mean RMSE value from a human expert (a left-tail test), i.e. region-based tracking had worse performance than an expert. Variances for both methods were notassumed equal for the purpose of fairness. The t-test with α=0.05 yielded a result of rejectingthe null-hypothesis with a p-value of 0.018, which indicates that statistically, region-basedtracking is unlikely to have worse performance than manual tracing by multiple experts.
Performance Comparison on Baseline versus OcclusionTo test the performance of region-based tracking on diseased cases with altered wall motion,we compared the ability of region-based tracking to track the endocardium on baseline datasets and during regional ischemia. It is clinically essential that computer-aided diagnostic toolsperform well on abnormal data, which is not often addressed or tested in clinical studiesevaluating the performance of such tools.
The recorded 444 data frames were divided into two groups, a normal group (224 frames) andan ischemia group (220 frames). Statistics on surface discrepancies and volume differences foreach group are reported in Table 1.
To evaluate the difference in mean values of RMSE and volumes for each group, two-samplet-tests with α=0.05 were performed on RMSE values and volume differences. Abnormal datashowed significantly lower RMSE and volume differences than normal data (p=5.97e−14 and
Duan et al. Page 7
Ultrasound Med Biol. Author manuscript; available in PMC 2010 February 1.
NIH
-PA Author Manuscript
NIH
-PA Author Manuscript
NIH
-PA Author Manuscript
0.0085, respectively). An additional statistical power analysis yielded 100% power for RMSEvalues and 75.22% power for volume differences to detect the difference in the discrepancymeasurement between the two groups with a two-sided t-test with type I error level of 0.05.These results suggest that our method may be valuable for clinical applications where abnormalwall motion may be present.
Results of regression plots and Bland-Altman plots for left ventricular volume measures fornormal group and ischemia group were plotted in Figure 3(c–f). The 95% confidence intervalis defined with a center value equal to the mean error and width equal to two standard deviationsof the volume errors. These error intervals were equal to 2.55 ml ± 8.62 ml for normal groupand 1.85 ml ± 7.83 ml.
To best summarize the results for the volume comparisons between the overall manual and OFtracings, the inter-observer results and the two comparisons between manual and OF tracingsfor the normal and ischemia subgroups, five metrics for each study including regressionequation, correlation, standard error of the estimate, mean difference, and limit of agreementand P-value of the t-test, were presented in Table 2.
DiscussionBased on the presented quantitative validation studies, results on comparison between OFtracking and manual tracing were very encouraging. A strong correlation pattern betweenmanual tracing and region-based tracking was found with correlation coefficients as well asthe slope and the bias values comparable to findings in the literature (Angelini, Homma2005, Corsi, Borsari 2001, Sanchez-Ortiz, Wright 2002) on RT3D ultrasound segmentation.
Tracking errors were within the range of inter-observer variability, which were confirmed bystatistical tests. Although the mean values of RMSE and volume differences from region-basedtracking were smaller than from two experienced users, it cannot be inferred that region-basedtracking had better performance. One reason that the errors for the proposed method were lowerwas that the region-based tracking was initialized by the user whose tracing was compared to.If tracking errors were within the range of inter-observer variability, it is nonetheless safe toconclude that when initialized using manual tracing of the ED frame, region-based tracking isa good alternative to tracing every time frame in a RT3D ultrasound study.
The reason that region-based tracking performed better in the ischemia data compared to thenormal data was probably related to the reduced motion due to ischemia, which made trackingeasier. However, this is an important feature compared with shape-based segmentationalgorithms, for which abnormal wall motion sometimes generates abnormal shapes that wouldcomplicate the segmentation process.
Minimal computational time was required for analysis, with region-based tracking requiringless than 2 minutes to track the endocardial surface over the entire cardiac cycle, compared tothe time required for manual tracing by a cardiologist (one hour). This computational time isreasonable for processing RT3D ultrasound data sets in a clinical setting. While measurementsof fractional shortening or ejection fraction require only ED and ES time frames, region-basedtracking may be particularly useful for LV synchrony analysis, which requires the segmentationof the entire cardiac cycle.
Although current RT3D ultrasound can offer 20–25 frames per second, as reported in theacquisition set up of the data used in this paper, the actual number of frames per cardiac cycleis limited by the heart rate as well. In most clinical settings, RT3D ultrasound usually canprovide 16–20 frames per cardiac cycle. Under animal experiments, especially during somedepressed situations such as open chest experiments, the heart rate increases to 110–130 bpm
Duan et al. Page 8
Ultrasound Med Biol. Author manuscript; available in PMC 2010 February 1.
NIH
-PA Author Manuscript
NIH
-PA Author Manuscript
NIH
-PA Author Manuscript
on average so that actual frames available in one cardiac cycle become limited. Moreover,current 3D technology cannot reach a frame rate above hundred frames per second as in 2Dechocardiography. These screening constraints remain limiting factors in the application ofRT3D ultrasound for motion analysis. Moreover, this limitation is not an intrinsic limitationfor the region-based tracking but rather a limitation of current RT3D ultrasound technology.Region-based tracking can work with higher frame rate as well. As the advances of RT3Dultrasound technology, the performance of the proposed framework will also be expected toimprove given the higher temporal resolution of the data.
As pointed out in (Bland and Altman 1986), regression analysis alone is not sufficient tovalidate the performance of novel clinical measurements such as region-based tracking of theendocardium. For this reason, statistical analyses including t-test and power analysis were alsoincluded in the evaluation of our method, which all yielded consistent results.
Lastly, this study was focused on validating the tracking ability of the region-based trackingalgorithm. The displacement field, a by-product of the tracking, also provided novel 4Ddynamic cardiac information that may be useful for analyzing RT3D ultrasound data. Detaileddiscussion on this extension of the method can be found in (Duan, Angelini 2007, Duan,Angelini 2006, Duan, Angelini 2005).
ConclusionA correlation-based tracking method was evaluated for its ability to track the LV endocardialsurface over the entire cardiac cycle in RT3D ultrasound after being initialized with manualsegmentation of the ED frame. Endocardial surface geometries obtained from manualsegmentation and region-based tracking were compared at every time frame in the cardiaccycle. This geometric comparison was mapped and results were promising, showing thatregion-based tracking closely followed the endocardial surface throughout the entire cardiaccycle on 444 data frames. There was a strong correlation between region-based tracking andmanual tracing. Statistical analysis showed that tracking errors were within the range of inter-observer variability with manual tracing by expert cardiologists. Moreover, our algorithmperformed well both on normal and ischemia data, suggesting that our method may be valuablefor clinical applications where abnormal wall motion may be present. This study showed thatregion-based tracking can accurately track the LV endocardial surface, yielding dynamicinformation from RT3D ultrasound data and provides automated dynamic interpolationbetween segmented endocardial surfaces.
AcknowledgementsThis work was partially funded by the National Science Foundation grant BES-02-01617, the American HeartAssociation grant #0151250T and #0640005N, Philips Medical Healthcare, and the New York State NYSTAR/CATTechnology Program. The authors also would like to thank Dr. Jie Wang (The Skirball Animal Center, Orangeburg,NY) for helping with the animal experiments.
ReferencesAnandan P. A computational framework and an algorithm for the measurement of visual motion.
International journal of Computer Vision 1989;2:283–310.Angelini E, Homma S, Pearson G, Holmes J, Laine A. Segmentation of real-time three-dimensional
ultrasound for quantification of ventricular function: a clinical study on right and left ventricles.Ultrasound in Medicine and Biology 2005;31:1143–58. [PubMed: 16176781]
Angelini, ED.; Hamming, D.; Homma, S.; Holmes, J.; Laine, A. Computers in Cardiology. Memphis TN,USA: 2002. Comparison of segmentation methods for analysis of endocardial wall motion with real-time three-dimensional ultrasound; p. 609-12.
Duan et al. Page 9
Ultrasound Med Biol. Author manuscript; available in PMC 2010 February 1.
NIH
-PA Author Manuscript
NIH
-PA Author Manuscript
NIH
-PA Author Manuscript
Bachner N, Adam D, Leitman M, Vered Z. Ultrasound Echocardiographic Assessment of TransmuralInhomogeneity of the Left Ventricular Contraction during the Heart Cycle Computers in Cardiology.2007;34:817–20.
Bardinet E, Cohen LD, Ayache N. Tracking and motion analysis of the left ventricle with deformablesuperquadratics. Medical Image Analysis 1996;1:129–49. [PubMed: 9873925]
Barron JL, Fleet D, Beauchemin S. Performance of optical flow techniques. Int Journal of ComputerVision 1994;12:43–77.
Belohlavek M, Foley DA, Gerber TC, Kinter TM, Greenleaf JF, Seward JB. Three- and four-dimensionalcardiovascular ultrasound imaging: a new era for echocardiography. Mayo Clinic Proceedings1993;68:221–40. [PubMed: 8474264]
Black MJ, Anandan P. The Robust Estimation of Multiple Motions: Parameteric and Piecewise-SmoothFlow Fields. Computer Vision and Image Understanding 1996;63
Bland J, Altman D. Statistical methods for assessing agreement between two methods of clinicalmeasurement. Lancet 1986;i:307–10. [PubMed: 2868172]
Bleyer, M.; Gelautz, M.; Rhemann, C. Region-based Optical Flow Estimation with Treatment ofOcclusions. Joint Hungarian-Austrian Conference on Image Processing and Pattern Recognition;2005. p. 235-42.
Boukerroui, D.; Noble, JA.; Brady, M. Lecture Notes in Computer Science. Vol. 2732. 2003. VelocityEstimation in Ultrasound Images: A Block Matching Approach; p. 586-98.
Brandt E, Wigstrm L, Wranne B. Segmentation of Echocardiographic Image Sequences Using Spatio-temporal Information. Lecture Notes in Computer Science 1999;1679:410–19.
Canals R, Lamarque G, Chatain P. Volumetric ultrasound system for left ventricle motion imaging. IEEETrans Ultrason Ferroelectr Freq Control 1999;46:1527–38. [PubMed: 18244350]
Convertino, G. Region-based optical flow estimation technique for collision avoidance. SPIE - IntelligentRobots and Computer Vision XVI: Algorithms, Techniques, Active Vision, and Materials Handling;1997. p. 118-25.
Corsi C, Borsari M, Consegnati F, Sarti A, Lamberti C, Travaglini A, Shiota T, Thomas JD. Leftventricular endocardial surface detection based on real-time 3D echocardiographic data. EuropeanJournal of Ultrasound 2001;13:41–51. [PubMed: 11251256]
Cremers D, Rousson M, Deriche R. A Review of Statistical Approaches to Level Set Segmentation:Integrating Color, Texture, Motion and Shape. International Journal of Computer Vision2007;72:195–215.
Duan, Q.; Angelini, E.; Gerard, O.; Costa, KD.; Holmes, JW.; Homma, S.; Laine, A. Cardiac MotionAnalysis Based on Optical Flow on Real-Time 3D Ultrasound Data. In: Suri, JS.; Fenster, A.; Chang,R-F.; Kathuria, C., editors. Recent Advances in Diagnostic and Therapeutic 3-D Ultrasound Imagingfor Medical Applications. Artech House: Incorporated; 2007.
Duan, Q.; Angelini, E.; Gerard, O.; Homma, S.; Laine, A. Comparing optical-flow based methods forquantification of myocardial deformations on RT3D ultrasound. IEEE International Symposium onBiomedical Imaging (ISBI); 2006. p. 173-76.
Duan, Q.; Angelini, E.; Herz, SL.; Ingrassia, CM.; Gerard, O.; Costa, KD.; Holmes, JW.; Homma, S.;Laine, A. Dynamic Cardiac Information From Optical Flow Using Four Dimensional Ultrasound.27th Annual International Conference IEEE Engineering in Medicine and Biology Society (EMBS);Shanghai, China. 2005.
Duan, Q.; Angelini, ED.; Herz, SL.; Gerard, O.; Allain, P.; Ingrassia, CM.; Costa, KD.; Holmes, JW.;Homma, S.; Laine, AF. Tracking of LV Endocardial Surface on Real-Time Three-DimensionalUltrasound with Optical Flow. Third International Conference on Functional Imaging and Modelingof the Heart 2005; Barcelona, Spain. 2005. p. 434-45.
Duan, Q.; Angelini, ED.; Laine, A. Assessment of visual quality and spatial accuracy of fast anisotropicdiffusion and scan conversion algorithms for real-time three-dimensional spherical ultrasound. SPIEInternational Symposium Medical Imaging; San Diego, CA, USA. 2004. p. 331-42.
Duan, Q.; Shechter, G.; Gutierrez, LF.; Stanton, D.; Zagorchev, L.; Laine, AF.; Daniel, Elgort.Augmenting CT Cardiac Roadmaps with Segmented Streaming Ultrasound. SPIE InternationalSymposium, Medical Imaging 2007; San Diego, CA. 2007. p. 65090V1-11
Duan et al. Page 10
Ultrasound Med Biol. Author manuscript; available in PMC 2010 February 1.
NIH
-PA Author Manuscript
NIH
-PA Author Manuscript
NIH
-PA Author Manuscript
Fenster, A.; Downey, DB. Three-Dimensional Ultrasound Imaging. In: Jacob, Beutel HLK.; Metter,Richard L., editors. Handbook of Medical Imaging Volume1 Physics and Psychophysics.Bellingham, WA, USA: SPIE- The International Society of Optical Engineering; 2000. p. 463-510.
Frangi AF, Niessen WJ, Viergever MA. Three-dimensional modeling for functional analysis of cardiacimages, a review. IEEE Transactions on Medical Imaging 2001;20:2–25. [PubMed: 11293688]
Heijman E, Aben J-P, Penners C, Niessen P, Guillaume R, Eys Gv, Nicolay K, Strijkers GJ. Evaluationof manual and automatic segmentation of the mouse heart from CINE MR images. Journal ofMagnetic Resonance Imaging 2008;27:86–93. [PubMed: 18050352]
Herz S, Ingrassia C, Homma S, Costa K, Holmes J. Parameterization of left ventricular wall motion fordetection of regional ischemia. Annals of Biomedical Engineering 2005;33:912–19. [PubMed:16060531]
Horn BKP, Schunck BG. Determing Optical Flow. Artificial Intelligence 1981;17:185–203.Horstman JA, Monaghan MJ, Gill EA. Intraventricular Dyssynchrony Assessment by Real-Time Three-
Dimensional Echocardiography. Cardiology Clinics 2007;25:253–60. [PubMed: 17765104]Hunter PJ, Smaill BH. The analysis of cardiac function: a continuum approach. Progress in Biophysics
and Molecular Biology 1988;52:101–64. [PubMed: 3076684]Ingrassia C, Usyk T, Kerckhoffs R, McCulloch A, Costa K, Holmes J. Model-based development of 4-
dimensional wall motion measures. Comp Meth Appl Mech Eng 2007;196:3061–69.Ingrassia, CM.; Herz, SL.; Costa, KD.; Holmes, JW. Impact of Ischemic Region Size on Regional Wall
Motion. Proceedings of the 2003 Annual Fall Meeting of the Biomedical Engineering Society; 2003.Juergens KU, Seifarth H, Range F, Wienbeck S, Wenker M, Heindel W, Fischbach R. Automated
Threshold-Based 3D Segmentation Versus Short-Axis Planimetry for Assessment of Global LeftVentricular Function with Dual-Source MDCT. American Journal of Roentgenology 2008;190:308–14. [PubMed: 18212214]
Kapetanakis S, Kearney M, Siva A, Gall N, Cooklin M, Monaghan M. Real-time three-dimensionalechocardiography: a novel technique to quantify global left ventricular mechanical dyssynchrony.Circulation 2005;112:992–1000. [PubMed: 16087800]
Ledesma-Carbayo MJ, Kybic J, Desco M, Santos A, Sühling M, Hunziker P, Unser M. Spatio-TemporalNonrigid Registration for Ultrasound Cardiac Motion Estimation. IEEE Trans Med Imaging2005;24:1113–26. [PubMed: 16156350]
Linguraru MG, Vasilyev NV, Nido PJd, Howe RD. Atrial Septal Defect Tracking in 3D CardiacUltrasound. Lecture Notes in Computer Science 2006;4190:596–603.
Lucas B, Kanade T. An iterative image registration technique with an application to stereo vision. ProcDARPA IU Workshop. 1981
Lucas, BD.; Kanade, T. An iterative image registration technique with an application to stereo vision.International Joint Conference on Artificial Intelligence (IJCAI); 1981. p. 674-79.
Mikic I, Krucinski S, Thomas JD. Segmentation and tracking in echocardiographic sequences: activecontours guided by optical flow estimates. IEEE transactions on medical imaging 1998;17:274–84.[PubMed: 9688159]
Montagnat J, Sermesant M, Delingette H. Anisotropic filtering for model-based segmentation of 4Dcylindrical echocardiographic images. Pattern Recognition Letters 2003;24:815–28.
Nagel H. Displacement vectors derived from second-order intensity variations in image sequences.Computer Vision Graphics Image Processing 1983;21:85–117.
Ofili EO, Nanda NC. Three-dimensional and four-dimensional echocardiography. Ultrasound MedicalBiology 1994;20
Paragios N. A level set approach for shape-driven segmentation and tracking of the left ventricle. IEEETransactions on Medical Imaging 2003;22:773–76. [PubMed: 12872953]
Pednekar A, Kakadiaris IA, Kurkure U, Muthupillai R, Flamm S. Validation of the AutomaticComputation of the Ejection Fraction from Cine-MRI. Lecture Notes in Computer Science2003;2879:987–89.
Perona, P.; Malik, J. Scale space and edge detection using anisotropic diffusion. IEEE Workshop onComputer Vision; 1987. p. 16-22.
Duan et al. Page 11
Ultrasound Med Biol. Author manuscript; available in PMC 2010 February 1.
NIH
-PA Author Manuscript
NIH
-PA Author Manuscript
NIH
-PA Author Manuscript
Perona P, Malik J. Scale-space and edge detection using anisotropic diffusion. IEEE Trans Pattern AnalMachine Intell 1990;12:629–39.
Ramm OTV, Smith SW. Real time volumetric ultrasound imaging system. Journal of Digital Imaging1990;3:261–66. [PubMed: 2085564]
Rankin RN, Fenster A, Downey DB, Munk PL, Levin MF, Vellet AD. Three-dimensional sonographicreconstruction: technique and diagnostic applications. American Journal of Radiology1993;161:695–702.
Revell J, Mirmehdi M, McNally D. Combined Ultrasound Speckle Pattern Similarity Measures. MedicalImage Understanding and Analysis 2004:149–53.
Sanchez-Ortiz GI, Wright GJT, Clarke N, Declerck J, Banning AP, Noble JA. Automated 3-DEchocardiography Analysis Compared With Manual Delineations and SPECT MUGA. IEEETRANSACTIONS ON MEDICAL IMAGING 2002;21:1069–76. [PubMed: 12564875]
Singh, A. An estimation-theoretic framework for image-flow computation. International Conference onComputer Vision; 1990.
Suhling M, Arigovindan M, Jansen C, Hunziker P, Unser M. Myocardial Motion Analysis From B-ModeEchocardiograms. IEEE Transactions on Image Processing 2005;14:525–36. [PubMed: 15825486]
Tsuruoka, S.; Umehara, M.; Kimura, F.; Wakabayashi, T.; Miyake, Y.; Sekioka, K. Regional wall motiontracking system for high-frame rate ultrasound echocardiography. Proceedings of the 1996 4thInternational Workshop on Advanced Motion Control, AMC’96. Part 1; Tsu, Jpn: IEEE, Piscataway,NJ, USA; 1996. p. 389-94.
van Geuns RJM, Baks T, Gronenschild EHBM, Aben J-PMM, Wielopolski PA, Cademartiri F, de FeyterPJ. Automatic Quantitative Left Ventricular Analysis of Cine MR Images by Using Three-dimensional Information for Contour Detection. Radiology 2006;240:215–21. [PubMed: 16793980]
Veronesi F, Corsi C, Caiani EG, Sarti A, Lamberti C. Tracking of left ventricular long axis from real-time three-dimensional echocardiography using optical flow techniques. IEEE Transactions onInformation Technology in Biomedicine 2006;10:174–81. [PubMed: 16445262]
Voormolen MM, Krenning BJ, Lancee CT, Cate FJt, Roelandt JRTC, Steen AFWvd, Jong Nd. Harmonie3-d echocardiography with a fast-rotating ultrasound transducer. IEEE Trans Ultrason FerroelectrFreq Control 2006;53:1739–47. [PubMed: 17036783]
Wang, T.; Gu, IYH.; Viberg, M.; Cao, Z.; Song, N. Tracking Moving Objects in Video Using EnhancedMean Shift and Region-Based Motion Field. EUSIPCO; 2007. p. 307-11.
Weickert J, Romeny BMtH, Viergever MA. Efficient and reliable schemes for nonlinear diffusionfiltering. IEEE Transactions on Image Processing 1998;7:398–410. [PubMed: 18276260]
Xiao J, Zhang Y, Shah M. Adaptive Region-Based Video Registration. Motion and Video Computing.2005
Yilmaz A, Javed O, Shah M. Object Tracking: A Survey. ACM Computing Surveys 2006;38:1–45.Yu, W.; Lin, N.; Yan, P.; Purushothaman, K.; Sinusas, A.; Thiele, K.; Duncan, JS. Lecture Notes in
Computer Science. Vol. 2674. 2003. Motion Analysis of 3D Ultrasound Texture Patterns; p. 252-61.Yu W, Yan P, Sinusas AJ, Thiele K, Duncan JS. Towards pointwise motion tracking in echocardiographic
image sequences: Comparing the reliability of different features for speckle tracking. Medical ImageAnalysis 2006;10:495–508. [PubMed: 16574465]
Duan et al. Page 12
Ultrasound Med Biol. Author manuscript; available in PMC 2010 February 1.
NIH
-PA Author Manuscript
NIH
-PA Author Manuscript
NIH
-PA Author Manuscript

Figure 1.Cross-sectional views at ED for one of the data: (a–c) original data, and (d–f) the data afterdiffusion process. (a, d) axial, (b, e) elevation and (c, f) azimuth views.
Duan et al. Page 13
Ultrasound Med Biol. Author manuscript; available in PMC 2010 February 1.
NIH
-PA Author Manuscript
NIH
-PA Author Manuscript
NIH
-PA Author Manuscript
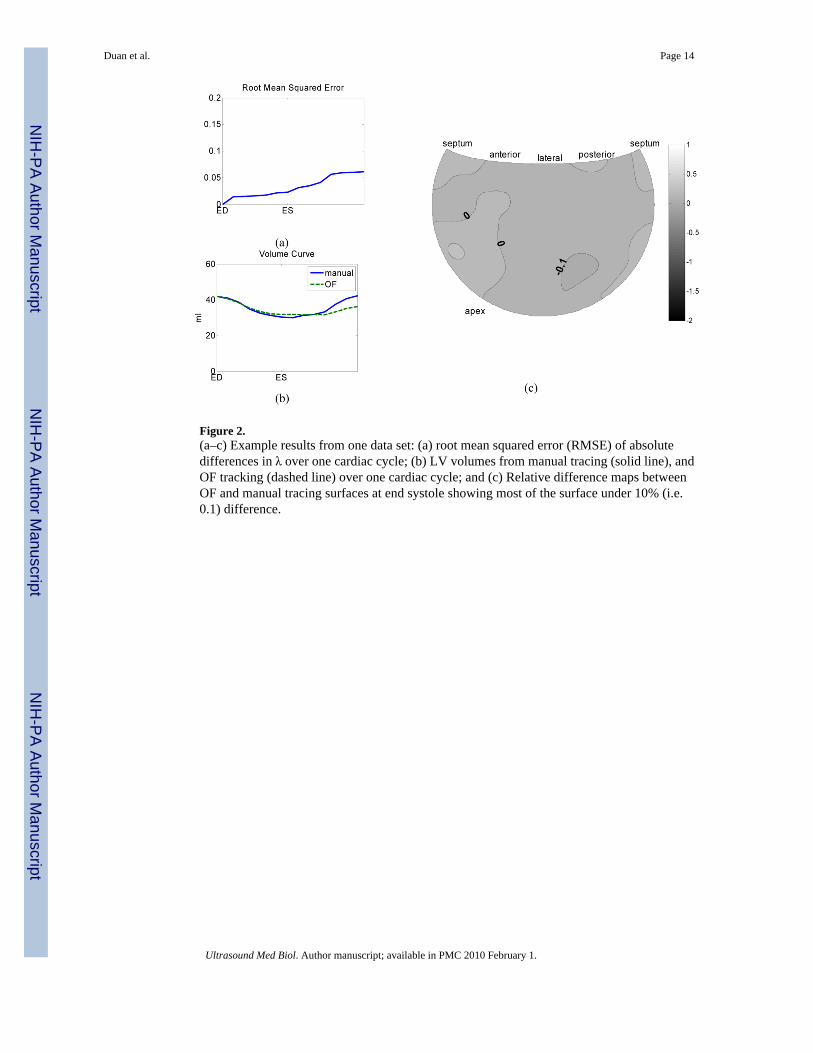
Figure 2.(a–c) Example results from one data set: (a) root mean squared error (RMSE) of absolutedifferences in λ over one cardiac cycle; (b) LV volumes from manual tracing (solid line), andOF tracking (dashed line) over one cardiac cycle; and (c) Relative difference maps betweenOF and manual tracing surfaces at end systole showing most of the surface under 10% (i.e.0.1) difference.
Duan et al. Page 14
Ultrasound Med Biol. Author manuscript; available in PMC 2010 February 1.
NIH
-PA Author Manuscript
NIH
-PA Author Manuscript
NIH
-PA Author Manuscript

Figure 3.Volume comparisons between manual tracing and region-based tracking: (a, b) overallperformance with regression plot (a) and Bland-Altman statistical analysis (b); (c, d)performance on normal group with regression plot (c) and Bland-Altman statistical analysis(d); (e, f) performance on ischemia group with regression plot (e) and Bland-Altman statisticalanalysis (f); Each blue circle represents a single data point; the center black line represents themean value; and the two red dashed lines represent 95% confidence interval.
Duan et al. Page 15
Ultrasound Med Biol. Author manuscript; available in PMC 2010 February 1.
NIH
-PA Author Manuscript
NIH
-PA Author Manuscript
NIH
-PA Author Manuscript

NIH
-PA Author Manuscript
NIH
-PA Author Manuscript
NIH
-PA Author Manuscript
Duan et al. Page 16
Table 1Statistics of surface discrepancies and volume differences for the normal group and the ischemia group
Normal Group Ischemia Group
Mean RMSE 0.06 0.05
STD RMSE 0.03 0.02
Max RMSE 0.14 0.10
Mean Volume Difference (ml) 4.24 3.61
STD Volume Difference (ml) 2.65 2.38
Max Volume Difference (ml) 13.59 11.48
Ultrasound Med Biol. Author manuscript; available in PMC 2010 February 1.

NIH
-PA Author Manuscript
NIH
-PA Author Manuscript
NIH
-PA Author Manuscript
Duan et al. Page 17Ta
ble
2C
orre
latio
n m
easu
res
and
stat
istic
al d
iffer
ence
s: V
olum
e co
mpa
rison
s be
twee
n th
e ov
eral
l man
ual t
raci
ng a
nd re
gion
-bas
ed tr
acki
ng,
inte
r-ob
serv
er v
aria
bilit
y an
d co
mpa
rison
s bet
wee
n m
anua
l tra
cing
and
regi
on-b
ased
trac
king
for t
he n
orm
al a
nd is
chem
ia su
bgro
ups
Stud
yR
egre
ssio
n eq
uatio
nC
orre
latio
nSt
anda
rd e
rror
of t
he e
stim
ate
Mea
n di
ffere
nce
P-V
alue
Ove
rall
y =0
.79x
+ 9
.81
0.93
3.23
10.8
80.
001
Inte
robs
erve
ry
=1.2
3x −
3.7
00.
5412
.96
15.7
80.
16
Nor
mal
y=0.
75x+
10.4
80.
913.
3010
.26
0.00
5
Isch
emia
y=0.
78x+
10.9
30.
923.
039.
650.
034
Ultrasound Med Biol. Author manuscript; available in PMC 2010 February 1.