Robust Shape Tracking With Multiple Models in Ultrasound Images
15
392 IEEE TRANSACTIONS ON IMAGE PROCESSING, VOL. 17, NO. 3, MARCH 2008 Robust Shape Tracking With Multiple Models in Ultrasound Images Jacinto C. Nascimento, Member, IEEE, and Jorge S. Marques Abstract—This paper addresses object tracking in ultrasound images using a robust multiple model tracker. The proposed tracker has the following features: 1) it uses multiple dynamic models to track the evolution of the object boundary, and 2) it models invalid observations (outliers), reducing their influence on the shape estimates. The problem considered in this paper is the tracking of the left ventricle which is known to be a challenging problem. The heart motion presents two phases (diastole and systole) with different dynamics, the multiple models used in this tracker try to solve this difficulty. In addition, ultrasound images are corrupted by strong multiplicative noise which prevents the use of standard deformable models. Robust estimation techniques are used to address this difficulty. The multiple model data associ- ation (MMDA) tracker proposed in this paper is based on a bank of nonlinear filters, organized in a tree structure. The algorithm determines which model is active at each instant of time and updates its state by propagating the probability distribution, using robust estimation techniques. Index Terms—Image analysis, low level features, multiple model data association (MMDA), segmentation, tracking, ultrasound im- ages. I. INTRODUCTION O BJECT tracking in a video sequence is a solved problem when the object shape and motion parameters change slowly and the object boundary is easily detected in the image domain. However, these assumptions are not valid in most cases. Occlusions, multiple motions, and missing boundaries are among the most common difficulties found in object tracking. This paper addresses a difficult problem in the field of med- ical image analysis: automatic tracking of the left ventricle (LV) in (space time) ultrasound B-Mode images. Three main difficulties are considered in this paper. First, we assume that the object motion is not always smooth and may exhibit abrupt changes. Second, the images are corrupted by strong multiplicative noise, leading to many misdetections and false alarms: many detected features do not belong to the object. These features should be considered as outliers and neglected by the tracker since they jeopardize the performance of the tracker and often lead to misleading results. Finally, we assume that the object shape changes during the tracking process. This issue is Manuscript received July 5, 2007; revised November 15, 2007. This work was supported in part by FCT under project Heart 3D and FCT ISR/IST plurianual funding, POSC, FEDER. The associate editor coordinating the review of this manuscript and approving it for publication was Dr. Zoltan Kato. The authors are with the Instituto Superior Tecnico, Instituta de Sistemas e Robotica (IST/ISR), 1049–001 Lisboa, Portugal. Color versions of one or more of the figures in this paper are available online at http://ieeexplore.ieee.org. Digital Object Identifier 10.1109/TIP.2007.915552 addressed using a shape-space representation of the object con- tour to reduce the degrees of freedom. These difficulties are treated in an unified framework as follows: i) prediction with multiple dynamic models is incor- porated in the tracker. The tracker deals with abrupt motion changes by using a bank of switched dynamic models, each of them tailored to a specific shape/motion regime. This allows us to tackle complex motions where the dynamics significantly change; ii)filtering with probabilistic data association. Since the success of the tracker also depends on the observations extracted from the image and how they are handled, data association is crucial to deal with measurement uncertainty, providing a robust mechanism to attenuate the influence of outliers. Data association has its roots in Control theory and it is often used for tracking point targets in cluttered environments [1]. A validation region is used to select the set of admissible observations. Then an association probability (confidence de- gree) is assigned to each observation using a statistical model of the valid observations and outliers; iii) finally, a shape-space model is used to restrict the variation of the object contour. We will assume that the object shape belongs to a subspace with a low dimension which can be learned from the data. This rep- resentation should allow several types of shape deformations. In most of the cases, this representation is appropriate, since the number of modes capturing the main shape deformations is usually much smaller than the original number of feature components used to describe the shape. The approach proposed herein is able to separate the uncer- tainty associated to the system dynamics and the uncertainty produced by shape deformation. This is a key issue since these two features are conceptually different. Multiple dynamic models can describe shape changes in systole and diastole phases, whereas the statistical shape model constrains the range of shape deformations and global motion (e.g., translation, rotation). Thus, we can determine which changes are due to global translation/rotation or to the contraction/expansion of the cardiac muscle. Recent advances in this area include the work [2], which decouples the uncertainties associated to the system dynamics from the shape model, introducing a unified framework for fusing shape information (subspace shape model), system dynamics (dynamic model), and the measurements model (heteroscedastic noise). The main contribution of the current paper is a new frame- work for efficient tracking of objects based on multiple dynamic models. The proposed method is able to cope with missing boundaries, occlusions and motion nonlinearities using multiple models. Furthermore, it overcomes the difficulties associated with clutter and multiplicative noise. 1057-7149/$25.00 © 2008 IEEE
-
Upload
independent -
Category
Documents
-
view
3 -
download
0
Transcript of Robust Shape Tracking With Multiple Models in Ultrasound Images
392 IEEE TRANSACTIONS ON IMAGE PROCESSING, VOL. 17, NO. 3, MARCH 2008
Robust Shape Tracking With MultipleModels in Ultrasound Images
Jacinto C. Nascimento, Member, IEEE, and Jorge S. Marques
Abstract—This paper addresses object tracking in ultrasoundimages using a robust multiple model tracker. The proposedtracker has the following features: 1) it uses multiple dynamicmodels to track the evolution of the object boundary, and 2) itmodels invalid observations (outliers), reducing their influence onthe shape estimates. The problem considered in this paper is thetracking of the left ventricle which is known to be a challengingproblem. The heart motion presents two phases (diastole andsystole) with different dynamics, the multiple models used in thistracker try to solve this difficulty. In addition, ultrasound imagesare corrupted by strong multiplicative noise which prevents theuse of standard deformable models. Robust estimation techniquesare used to address this difficulty. The multiple model data associ-ation (MMDA) tracker proposed in this paper is based on a bankof nonlinear filters, organized in a tree structure. The algorithmdetermines which model is active at each instant of time andupdates its state by propagating the probability distribution, usingrobust estimation techniques.
Index Terms—Image analysis, low level features, multiple modeldata association (MMDA), segmentation, tracking, ultrasound im-ages.
I. INTRODUCTION
OBJECT tracking in a video sequence is a solved problemwhen the object shape and motion parameters change
slowly and the object boundary is easily detected in the imagedomain. However, these assumptions are not valid in mostcases. Occlusions, multiple motions, and missing boundariesare among the most common difficulties found in objecttracking.
This paper addresses a difficult problem in the field of med-ical image analysis: automatic tracking of the left ventricle (LV)in (space time) ultrasound B-Mode images. Threemain difficulties are considered in this paper. First, we assumethat the object motion is not always smooth and may exhibitabrupt changes. Second, the images are corrupted by strongmultiplicative noise, leading to many misdetections and falsealarms: many detected features do not belong to the object.These features should be considered as outliers and neglected bythe tracker since they jeopardize the performance of the trackerand often lead to misleading results. Finally, we assume that theobject shape changes during the tracking process. This issue is
Manuscript received July 5, 2007; revised November 15, 2007. This work wassupported in part by FCT under project Heart 3D and FCT ISR/IST plurianualfunding, POSC, FEDER. The associate editor coordinating the review of thismanuscript and approving it for publication was Dr. Zoltan Kato.
The authors are with the Instituto Superior Tecnico, Instituta de Sistemas eRobotica (IST/ISR), 1049–001 Lisboa, Portugal.
Color versions of one or more of the figures in this paper are available onlineat http://ieeexplore.ieee.org.
Digital Object Identifier 10.1109/TIP.2007.915552
addressed using a shape-space representation of the object con-tour to reduce the degrees of freedom.
These difficulties are treated in an unified framework asfollows: i) prediction with multiple dynamic models is incor-porated in the tracker. The tracker deals with abrupt motionchanges by using a bank of switched dynamic models, each ofthem tailored to a specific shape/motion regime. This allowsus to tackle complex motions where the dynamics significantlychange; ii)filtering with probabilistic data association. Sincethe success of the tracker also depends on the observationsextracted from the image and how they are handled, dataassociation is crucial to deal with measurement uncertainty,providing a robust mechanism to attenuate the influence ofoutliers. Data association has its roots in Control theory and it isoften used for tracking point targets in cluttered environments[1]. A validation region is used to select the set of admissibleobservations. Then an association probability (confidence de-gree) is assigned to each observation using a statistical modelof the valid observations and outliers; iii) finally, a shape-spacemodel is used to restrict the variation of the object contour. Wewill assume that the object shape belongs to a subspace with alow dimension which can be learned from the data. This rep-resentation should allow several types of shape deformations.In most of the cases, this representation is appropriate, sincethe number of modes capturing the main shape deformationsis usually much smaller than the original number of featurecomponents used to describe the shape.
The approach proposed herein is able to separate the uncer-tainty associated to the system dynamics and the uncertaintyproduced by shape deformation. This is a key issue since thesetwo features are conceptually different. Multiple dynamicmodels can describe shape changes in systole and diastolephases, whereas the statistical shape model constrains the rangeof shape deformations and global motion (e.g., translation,rotation). Thus, we can determine which changes are due toglobal translation/rotation or to the contraction/expansion ofthe cardiac muscle.
Recent advances in this area include the work [2], whichdecouples the uncertainties associated to the system dynamicsfrom the shape model, introducing a unified framework forfusing shape information (subspace shape model), systemdynamics (dynamic model), and the measurements model(heteroscedastic noise).
The main contribution of the current paper is a new frame-work for efficient tracking of objects based on multiple dynamicmodels. The proposed method is able to cope with missingboundaries, occlusions and motion nonlinearities using multiplemodels. Furthermore, it overcomes the difficulties associatedwith clutter and multiplicative noise.
1057-7149/$25.00 © 2008 IEEE
NASCIMENTO AND MARQUES: ROBUST SHAPE TRACKING WITH MULTIPLE MODELS IN ULTRASOUND IMAGES 393
The paper is organized as follows. Section II describes re-lated work. Section V describes the proposed tracker based onswitched dynamic models. Section VI presents experimental re-sults and a comparison with a state of the art tracker. Section VIIconcludes the paper.
II. RELATED WORK
The evolution of the LV during the cardiac cycle providesvaluable information which allows the assessment of the heartfunction (e.g., the ejection fraction i.e., the amount of bloodpumped by the heart in each cycle) and the detection of illnesses[3]. Several attempts have been made to estimate the walls ofthe LV during the cardiac cycle in an automated way, in order toallow a quantitative evaluation of the cardiac function. This is,however, a difficult problem since the tracker has to deal withsignificant shape deformations, rapid motion during the systole(contraction) phase and low image quality due to the presence ofnon-Gaussian multiplicative noise produced by scattering. Fur-thermore, the ultrasound images of the heart often show an edgedrop-out effect, i.e., some regions of the ventricle boundary maynot be seen.
Several attempts have been made to solve this problem andtrack the heart cavities in ultrasound sequences. Most of themare based on deformable contours [4]–[10]. One of the first at-tempts [9] uses the snake algorithm and optical flow informationextracted from the sequence of ultrasound images. This initialwork was extended in many ways and alternative shape modelshave been proposed. The following directions were considered.
Boundary representation: The boundary of the left ven-tricle has been approximated by a spline curve (e.g.,B-splines [7], Laplacian splines [11]) or by a Fourierseries expansion whose coefficients are updated at everyframe [10]. The Fourier series is more adapted to the elon-gated shapes of the ventricle. The next step was the use oflearning methods to improve the shape model. Since theventricle has typical deformation modes which are validfor most patients, the shape deformation can be learnedfrom training data using PCA. This approach is followedin active shape models, e.g., [8], [12], [13], and shapesubspace approaches [14]. Other alternatives include theuse of deformable templates [4] and multiple contoursto represent the epicardium and endocardium boundaries[15].Image features: Different kinds of visual cues have beenused for tracking purposes. Some works use optical flow[9], [16], [17] but it is usually difficult to obtain reliableoptical flow estimates from noisy ultrasound images.Other alternatives include region based methods whichcharacterize the statistical properties of the ultrasoundimage inside and outside the ventricle [18]. Image gra-dient [5], [19] and edges [20] have also been used. In thelatter case, it is assumed that there is an intensity transitionassociated to the boundary of the ventricle. This approachalso has some difficulties. The multiplicative noise presentin the endocardium produces false edge points which arenot associated to anatomical details. Furthermore, someimages exhibit the edge drop-out effect which meansthat the boundary of the endocardium is not detected ina given region. The first difficulty can be alleviated by
preprocessing techniques (e.g., median [9], mean [17],integrated backscatter (IBS) [19], filtering or denoisingmethods [21]). This operation reduces speckle noise,but the key difficulties remain to be solved by contourestimation methods.Dynamic models: Time dependence is a valuable sourceof information and it is used in most of the recent ap-proaches [5], [16], [22]. This dependence can be modeledby assuming that the parameters of the elastic curve (e.g.,spline control points or Fourier coefficients) are producedby a dynamic linear system. In most cases, the estimationis performed by Kalman filtering [23], assuming a linearmodel for the motion and for the observations. When theshape parameters are described by a nonlinear equation,particle filtering can be used instead [24]. The model canalso be improved by noticing that the observations (e.g.,edge points) have space-varying statistics i.e., their accu-racy varies along the contour and during the cardiac cycle.Heteroscedastic noise: Sophisticated strategies accountingfor heteroscedastic, i.e., inhomogeneous (space varying)and anisotropic (directional) noise [25] have been recentlyproposed to improve the quality of the tracker [2], [22].The proposed tracker deals with heteroscedastic noise anddecouples motion information from statistical shape con-straints, providing a fusion framework for these three cues.
We follow a different approach in this paper to deal withabrupt motion changes and image noise during the trackingoperation. The proposed tracker is based on multiple dynamicmodels: we assume that parameter evolution is described bytwo dynamic models each of them tailored to a specific motionregime (systole/diastole). Shape estimation is performed byrobust filtering methods which account for invalid (outlier)observations.
Multiple dynamic models has been studied in Controltheory as a way to represent nonstationary dynamic behaviors[26]–[28]. This type of models is also known as switcheddynamic models and they have been applied to deal withabrupt changes in dynamic systems [29]–[31] and tracking ofmanoeuvring targets with radar [1], [32].
The probability distribution of the state vector given the se-quence of observations is no longer Gaussian in this case. It isa mixture of Gaussians with an exponentially growing numberof modes. Therefore, exact inference is infeasible and approxi-mate methods must be used to evaluate the state. This difficultycan be overcome by using mode merging and elimination al-gorithms i.e., by discarding modes with negligible probabilitiesand merging modes with similar parameters [1], [31]. Anotheralternative is the use of particle filtering techniques [24].
The use of switched dynamical models in active contours isscarce. Multiple dynamic models have been used to improveshape tracking in presence of abrupt shape and motion changes[24], [33]. They have also been used for heart segmentation instatic images in [34], assuming that the contour to be estimatedis the trajectory of a random point which moves along the objectboundary. Multiple dynamic models are used to predict differentshapes of the cavities boundary.
The tracker proposed in this paper combines multiple dy-namic models and robust shape tracking using data association.Multiple models are used to represent the heart motion in systole
394 IEEE TRANSACTIONS ON IMAGE PROCESSING, VOL. 17, NO. 3, MARCH 2008
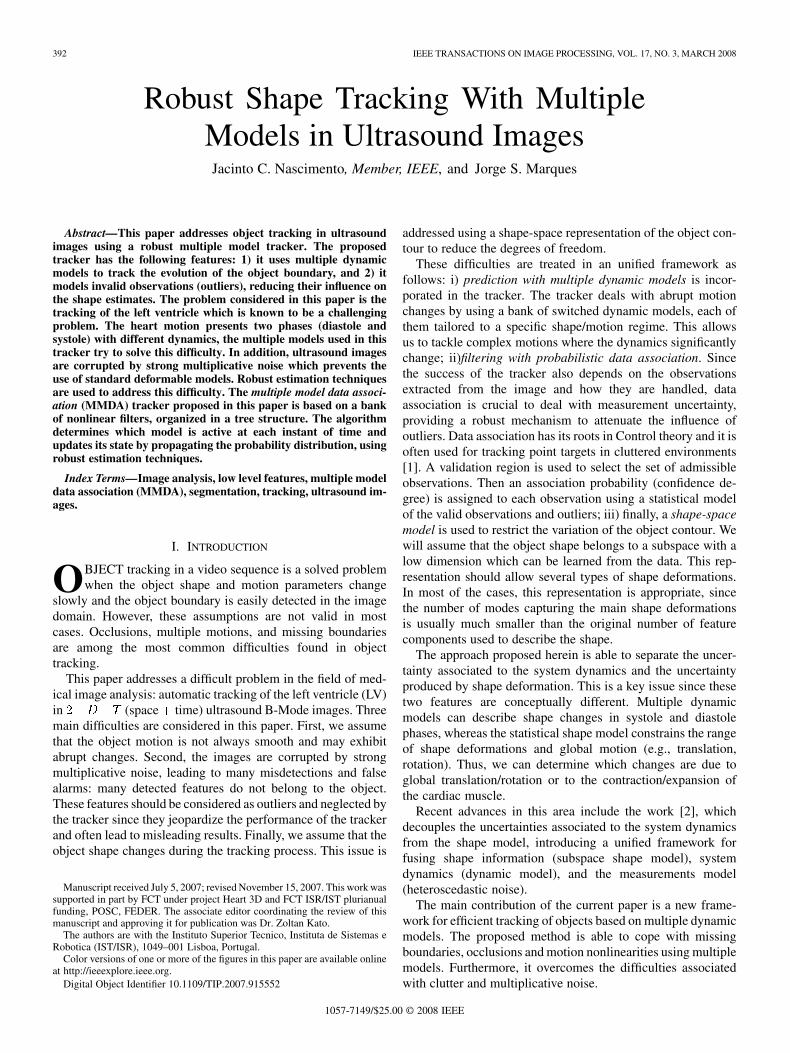
Fig. 1. Features linked to form five strokes (each color is a different stroke).
and diastole phases and robust estimation allows the tracker tocope with outlier features detected in the image. We first com-pute the edge points in the image and link them in strokes. Thenwe explicitly assume that many of them are outliers and shouldbe neglected by the tracker. This is done by associating a bi-nary label to each stroke. The binary labels are unknown andhave to be estimated. In addition, we assume that the evolutionof the shape parameters is complex and cannot be accuratelydescribed by a single dynamic model leading to a robust multi-model tracker which deals with multiple dynamics and outlierobservations.
III. PROBLEM STATEMENT
We wish to track the boundary of the left ventricle in asequence of ultrasound images. The main difficulty lies inthe presence of invalid features (edge points) detected in theimage which do not belong to the ventricle boundary, as well asmissing data. The first difficulty would disappear if every de-tected feature was classified correctly as valid or invalid. Sincewe do not have this information, all possible combinations(interpretations) of valid and invalid low level features shouldbe considered. Unfortunately, the number of edge points, ,is very large and the number of label sequences is toolarge to be considered. To simplify the problem, we associategroups of features in strokes, drastically decreasing the numberof interpretations.
Features are obtained by considering search lines orthogonalto the estimated contour of the left ventricle. All the abrupttransitions of intensities are then detected using a binary mask.This is similar to the method proposed in [35]. Edge segments(strokes) are then obtained by matching feature points usingsome spatial restrictions (e.g., distance from the predicted con-tour). Fig. 1 illustrates the detected features organized in fivedifferent strokes. Details are given in Section V.
We assume that each stroke can be classified as either true(valid) or false (invalid). An interpretation of the detectedstrokes, , is defined as , whereis the label of the th stroke in the interpretation .
Let be the vector of all image features detected at the timeinstant and let be a vector with the true features accordingto the interpretation . Let be a set of parameters defining the
object boundary. It will be assumed that and are relatedby
(1)
where , is the observation matrix (specified in the Appendix)and is the observation vector associated to the th interpre-tation, and is a white Gaussian measurementnoise. Notice that the matrices , , associated with two in-terpretations , , are different since the observation vectores ,
often have different dimensions. It is assumed that the evo-lution of the object parameters, can be described by a set ofswitched dynamic models to be defined in Section IV.
IV. SWITCHED DYNAMIC MODELS
We assume that the shape parameters are described by aset of stochastic difference equations [31]
(2)
where is the label of the active model at in-stant , is the dynamic matrix, is the number of steadystate models, and is a white Gaussian noise.Each value of corresponds to a different dynamic model. Thestate vector contains the parameters needed to specify theobject contour. It is assumed throughout the paper that the ob-ject shape is a transformed version of a reference shape plus alocal deformation, the latter being described by a B-spline (seethe Appendix ). Furthermore, it is assumed that the sequence ofactive labels is a first order Markov process with transitionmatrix defined by
(3)
where and we assume that is independentof previous state values , .
The hybrid state variable includes the statevector and the label of the active model . The evolutionof the hybrid state is characterized by the transition density
, which can be split as follows:
(4)
The first factor can be computed from the dynamic (2) whilethe second term is an entry of the transition matrix . Inthe ventricle tracking problem, we shall consider two dynamicmodels: one for the systolic phase and another for the diastolicphase. The first model contracts the contour while the secondexpands it.
V. MULTIPLE MODEL DATA ASSOCIATION TRACKER
The tracking problem can now be formulated as follows:Given a set of observations which maycontain outliers, what are the best estimates of the state vector
and model label at time ?This is a nonlinear filtering problem which is non-Gaussian
due to the presence of multiple models and outliers. This
NASCIMENTO AND MARQUES: ROBUST SHAPE TRACKING WITH MULTIPLE MODELS IN ULTRASOUND IMAGES 395
problem can be tackled by propagating the a posteriori dis-tribution of the hybrid state for each new frame.This is done in three steps.
• Prediction: This step computes the distribution of the hy-brid state in the next frame , given past ob-servations.
• Measurement: Given a new image, a set of observations(edge strokes) is detected in the vicinity of the predictedcontour.
• Filtering: The a posteriori distribution is up-dated using the observations.
Let us first assume that we have a single dynamic model andall the observations are valid. In this case, the state vector andthe observations are described by a linear dynamic system
(5)
(6)
where , are additive white noise processes. This is a well-known case where inference can easily be performed. The a pos-teriori distribution of the state vector is Gaussian
with mean vector and covariance matrix
(7)
updated by Kalman filtering [36].We now have to extend these ideas to allow multiple dynamic
models switched according to a Markov process and invalid ob-servations (outliers). These two cases will be separately consid-ered.
A. Inference With Switched Dynamic Models
Let us consider a switched dynamic model with valid obser-vations
(8)
(9)
where is the label of the active model at time.
Let us assume we have a sequence of observationsproduced according to (9). These observa-
tions were produced by a sequence of modelswhich is not known.
If the model sequence was known, the a posterioridistribution of the state would be Gaussian
1 with mean vector and covariance matrix ,computed by the Kalman filtering.
Since we do not know the sequence of active models , allsequences have to be considered. In this case the a posterioridistribution is a mixture of Gaussians. Each Gaussian is associ-ated to a different path in the tree
(10)
1In the following the notation, u means that the variable u depends on thepath k ; k being the sequence of model labels up to instant t.
where
(11)
The mean vectors and covariance matrices , are up-dated by Kalman filtering as before. We can imagine that weperform a Kalman filtering iteration in each branch of the tree.Each filtering step is based on a specific dynamic model. Thisprocedure propagates the mixture modes from the root to theleaves. When we arrive at the leaves, we obtain the mode pa-rameters . Only the update of is differentfrom usual Kalman filter equations and it is derived in the Ap-pendix. The Kalman filter equations comprise the prediction andfiltering steps as follows.
Prediction: Computes the modes
(12)
Filtering: Computes the a posteriori distribution of thestate at time for the mode
(13)
where the superscript “ ” denotes the predicted value at timegiven the observation until time , is the Kalman gainand
(14)
variables , , are defined in the Appendix.These are the classic Kalman filter equations assuming is
produced by a time-varying linear model defined by the labelsequence .
The computation of the mixture parameters can be doneusing closed form expressions. The only difficulty which re-mains is the fact that the number of modes grows exponentiallywith tracking time . Fortunately, there are several ways toprune the tree to keep the number of modes bounded [31]. Twomethods which can be used to achieve this goal are componentelimination and merging. Component elimination discardscomponents whose mixing coefficients are smaller thana given threshold, normalizing the others. The eliminatedcomponents produce negligible contribution to the mixturedensity. The second method (component merging), mergessimilar components into a single one. This method avoids theexistence of multiple components with close densities. TheKullback–Leibler divergence is used for deciding wether com-ponents are similar or not. In this paper, component eliminationwas implemented, using a threshold .
396 IEEE TRANSACTIONS ON IMAGE PROCESSING, VOL. 17, NO. 3, MARCH 2008
B. Inference With Outliers
When we have invalid observations (outliers) and multiplemodel, the problem becomes more difficult. Let us assume forthe moment that we know which observations are invalid. In thiscase, we can discard them since they do not convey useful infor-mation. This can be done by throwing away the correspondinglines of the observation matrix defined in the Appendix.
Suppose we have detected strokes in the th frame. Eachof these strokes can be valid or invalid. We, therefore, havedifferent interpretations of the data. Each of them can be identi-fied by a label
The evolution of the state vector and observations can be for-mulated as
(15)
(16)
where is the label of the active model (unknown) and thelabel of the data interpretation (unknown). In this case we havemultiple dynamic models and also multiple observation equa-tions and we do not know which pair is active at each time in-stant.
We could try to apply the same strategy as before to solvethe inference problem. We could consider all the admissible se-quences of active model/data up to time and expressthe a posteriori distribution as a mixture of Gaussians. How-ever, this is unfeasible. The number of dynamic models is usu-ally small (less than 10) but the number of data interpretations ismuch larger (hundreds or thousands). A different strategy mustbe adopted.
The filtering problem with outliers was studied byBar-Shalom in the context of point target tracking in radarsystems [1]. The radar provides echoes corresponding to tar-gets and clutter. The tracker must be able to identify whichobservations are valid and which are invalid. To address thisproblem, Bar-Shalom proposed a probability data association(PDA) filter which assigns a probability (confidence degree) toeach observation. The PDA filter is not optimal but achievesexcellent results in problems where the optimal solution isunfeasible. These ideas can be applied in the context multiplemodel tracking with outliers.
The main hypothesis is the following. We will assume thatthe prediction distribution associated to a path in the tree isstill Gaussian
(17)
where the mean vector and covariance matrix , dependon the path. Equation (17) is not an exact assumption. The mix-ture modes in the presence of outliers are no longer Gaussian.However, this hypothesis is accurate enough to allow good re-sults and leads to closed form expressions for the tracker.
Under this hypothesis, inference can be done in a simple way.The prediction step is the same as before [see (12)], the filtering
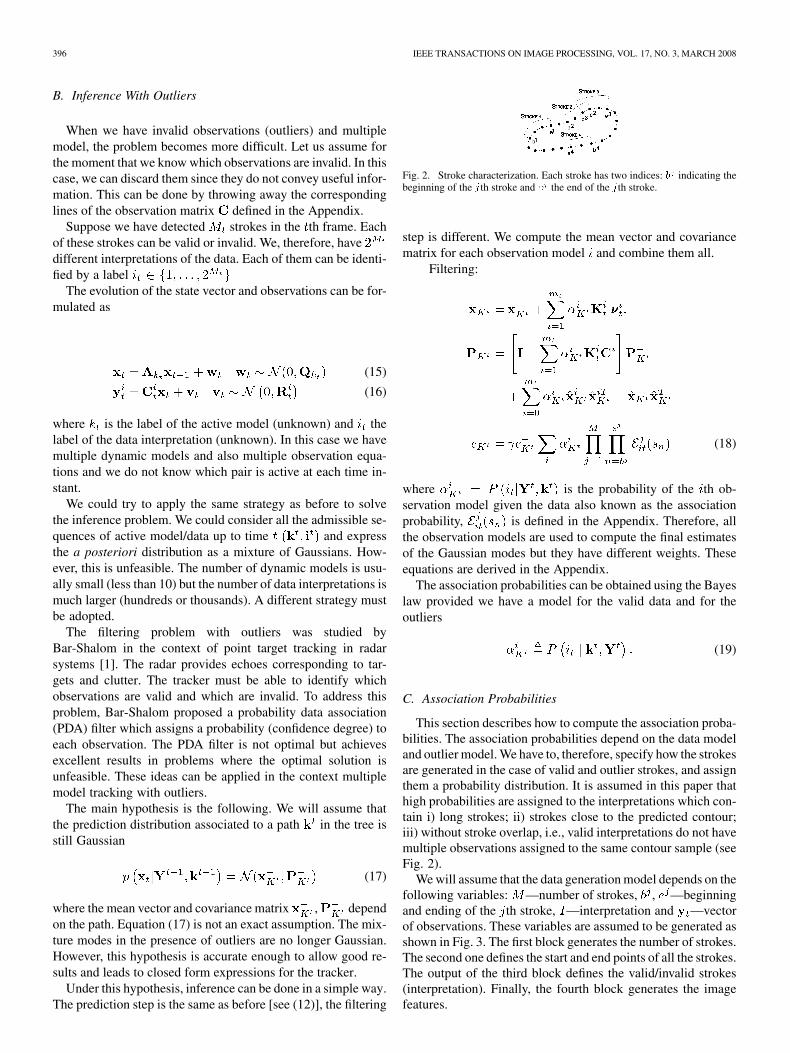
Fig. 2. Stroke characterization. Each stroke has two indices: b indicating thebeginning of the jth stroke and e the end of the jth stroke.
step is different. We compute the mean vector and covariancematrix for each observation model and combine them all.
Filtering:
(18)
where is the probability of the th ob-servation model given the data also known as the associationprobability, is defined in the Appendix. Therefore, allthe observation models are used to compute the final estimatesof the Gaussian modes but they have different weights. Theseequations are derived in the Appendix.
The association probabilities can be obtained using the Bayeslaw provided we have a model for the valid data and for theoutliers
(19)
C. Association Probabilities
This section describes how to compute the association proba-bilities. The association probabilities depend on the data modeland outlier model. We have to, therefore, specify how the strokesare generated in the case of valid and outlier strokes, and assignthem a probability distribution. It is assumed in this paper thathigh probabilities are assigned to the interpretations which con-tain i) long strokes; ii) strokes close to the predicted contour;iii) without stroke overlap, i.e., valid interpretations do not havemultiple observations assigned to the same contour sample (seeFig. 2).
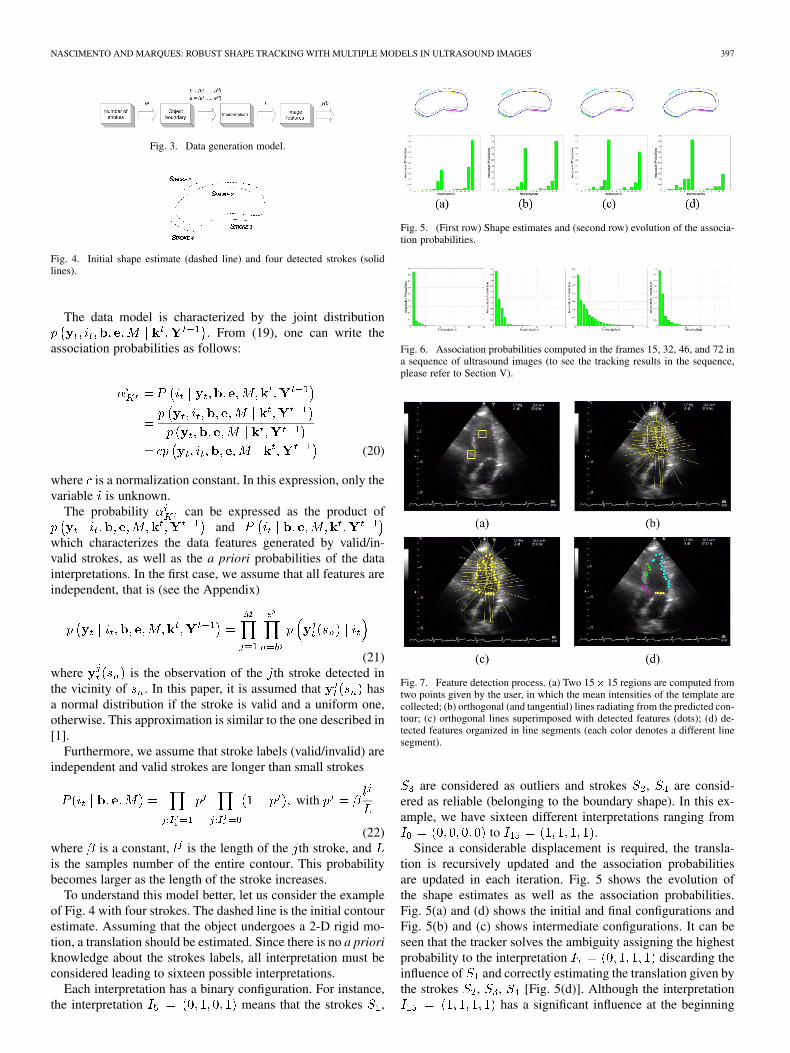
We will assume that the data generation model depends on thefollowing variables: —number of strokes, , —beginningand ending of the th stroke, —interpretation and —vectorof observations. These variables are assumed to be generated asshown in Fig. 3. The first block generates the number of strokes.The second one defines the start and end points of all the strokes.The output of the third block defines the valid/invalid strokes(interpretation). Finally, the fourth block generates the imagefeatures.
NASCIMENTO AND MARQUES: ROBUST SHAPE TRACKING WITH MULTIPLE MODELS IN ULTRASOUND IMAGES 397
Fig. 3. Data generation model.
Fig. 4. Initial shape estimate (dashed line) and four detected strokes (solidlines).
The data model is characterized by the joint distribution. From (19), one can write the
association probabilities as follows:
(20)
where is a normalization constant. In this expression, only thevariable is unknown.
The probability can be expressed as the product ofand
which characterizes the data features generated by valid/in-valid strokes, as well as the a priori probabilities of the datainterpretations. In the first case, we assume that all features areindependent, that is (see the Appendix)
(21)where is the observation of the th stroke detected inthe vicinity of . In this paper, it is assumed that hasa normal distribution if the stroke is valid and a uniform one,otherwise. This approximation is similar to the one described in[1].
Furthermore, we assume that stroke labels (valid/invalid) areindependent and valid strokes are longer than small strokes
with
(22)where is a constant, is the length of the th stroke, andis the samples number of the entire contour. This probabilitybecomes larger as the length of the stroke increases.
To understand this model better, let us consider the exampleof Fig. 4 with four strokes. The dashed line is the initial contourestimate. Assuming that the object undergoes a 2-D rigid mo-tion, a translation should be estimated. Since there is no a prioriknowledge about the strokes labels, all interpretation must beconsidered leading to sixteen possible interpretations.
Each interpretation has a binary configuration. For instance,the interpretation means that the strokes ,
Fig. 5. (First row) Shape estimates and (second row) evolution of the associa-tion probabilities.
Fig. 6. Association probabilities computed in the frames 15, 32, 46, and 72 ina sequence of ultrasound images (to see the tracking results in the sequence,please refer to Section V).
Fig. 7. Feature detection process. (a) Two 15� 15 regions are computed fromtwo points given by the user, in which the mean intensities of the template arecollected; (b) orthogonal (and tangential) lines radiating from the predicted con-tour; (c) orthogonal lines superimposed with detected features (dots); (d) de-tected features organized in line segments (each color denotes a different linesegment).
are considered as outliers and strokes , are consid-ered as reliable (belonging to the boundary shape). In this ex-ample, we have sixteen different interpretations ranging from
to .Since a considerable displacement is required, the transla-
tion is recursively updated and the association probabilitiesare updated in each iteration. Fig. 5 shows the evolution ofthe shape estimates as well as the association probabilities.Fig. 5(a) and (d) shows the initial and final configurations andFig. 5(b) and (c) shows intermediate configurations. It can beseen that the tracker solves the ambiguity assigning the highestprobability to the interpretation discarding theinfluence of and correctly estimating the translation given bythe strokes , , [Fig. 5(d)]. Although the interpretation
has a significant influence at the beginning

398 IEEE TRANSACTIONS ON IMAGE PROCESSING, VOL. 17, NO. 3, MARCH 2008
TABLE IMULTIPLE MODEL DATA ASSOCIATION TRACKER
it decays afterwards. It is interesting to note that there is acompetition between these two interpretations.
Another example is illustrated in Fig. 6. This figure showsthe association probabilities using real data (the probabilitiesare ordered from the highest one to the lowest one) where, onceagain, the distribution of the association probabilities suggeststhe most probable interpretation plays an important role but theothers cannot be ignored.
D. Image Measurement
Let us consider feature extraction. Ideally, we would like todetect all the points belonging to the boundary of the endo-cardium. However, we will also detect many false alarms pro-duced by multiplicative noise and by other structures of theheart. Instead of relying on edge points only, we will link themin order to obtain strokes. Strokes are more reliable and robust
NASCIMENTO AND MARQUES: ROBUST SHAPE TRACKING WITH MULTIPLE MODELS IN ULTRASOUND IMAGES 399
than edge points. For example, small strokes and spurious edgescan be easily eliminated.
Furthermore, we are not interested in all the strokes presentin the image. Since the ventricle wall changes in a predictableway, stroke detection will be guided by the ventricle estimate.We will first predict the ventricle contour in the next frame andperform stroke detection in the vicinity of the predicted contour.
The detection of the edge points is similar to the one describedin [35, Ch. 5, pp. 100–110]. We sample the predicted contour in40 equally spaced points and detect intensity transitions alongdirections orthogonal to the predicted contour [see Fig. 7(b)].This is done by filtering the image profiles along the orthogonaldirections using a binary template of length 11
(23)
where
(24)
is the intensity profile along the th direction, ,are the average intensities inside and outside the contour eval-uated on the first image of the sequence. The average intensityis computed in a 15 15 window inside and outside of the LV.This is done for each new sequence [see Fig. 7(a)]. We note thatmultiple edge points can be detected in some directions. We thenlink the edge points associated to neighboring directions if theirdistances to the contour are similar.
Since we have multiple dynamic models, we will first selectthe most probable model
(25)
where
(26)
After knowing the most probable label, the ventricle shape canbe estimated using the observation equation
(27)
We multiply the matrix by an estimate of the state vectorcomputed using all the leaves of the tree associated to the mostprobable label.
E. Multiple Model Data Association Tracker
Let us summarize the equations of the MMDA tracker. Thetracker is based on the propagation of the a posteriori distri-bution of the hybrid state using a mixture of Gaus-sians. Three main steps are performed for each frame: predic-tion, image measurement and filtering which are described inTable I. As described previously, this method accounts for mul-tiple dynamics and invalid observations (outliers). To deal withthe first difficulty (multiple dynamics) we increase the number
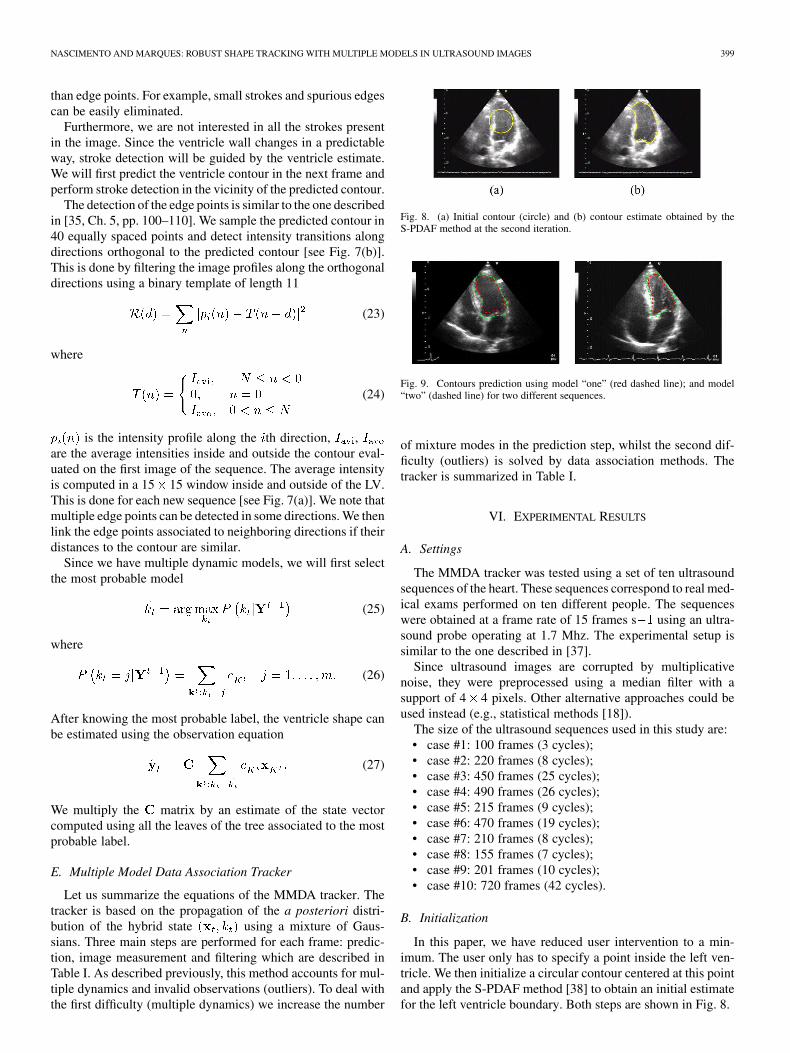
Fig. 8. (a) Initial contour (circle) and (b) contour estimate obtained by theS-PDAF method at the second iteration.
Fig. 9. Contours prediction using model “one” (red dashed line); and model“two” (dashed line) for two different sequences.
of mixture modes in the prediction step, whilst the second dif-ficulty (outliers) is solved by data association methods. Thetracker is summarized in Table I.
VI. EXPERIMENTAL RESULTS
A. Settings
The MMDA tracker was tested using a set of ten ultrasoundsequences of the heart. These sequences correspond to real med-ical exams performed on ten different people. The sequenceswere obtained at a frame rate of 15 frames s using an ultra-sound probe operating at 1.7 Mhz. The experimental setup issimilar to the one described in [37].
Since ultrasound images are corrupted by multiplicativenoise, they were preprocessed using a median filter with asupport of 4 4 pixels. Other alternative approaches could beused instead (e.g., statistical methods [18]).
The size of the ultrasound sequences used in this study are:• case #1: 100 frames (3 cycles);• case #2: 220 frames (8 cycles);• case #3: 450 frames (25 cycles);• case #4: 490 frames (26 cycles);• case #5: 215 frames (9 cycles);• case #6: 470 frames (19 cycles);• case #7: 210 frames (8 cycles);• case #8: 155 frames (7 cycles);• case #9: 201 frames (10 cycles);• case #10: 720 frames (42 cycles).
B. Initialization
In this paper, we have reduced user intervention to a min-imum. The user only has to specify a point inside the left ven-tricle. We then initialize a circular contour centered at this pointand apply the S-PDAF method [38] to obtain an initial estimatefor the left ventricle boundary. Both steps are shown in Fig. 8.
400 IEEE TRANSACTIONS ON IMAGE PROCESSING, VOL. 17, NO. 3, MARCH 2008
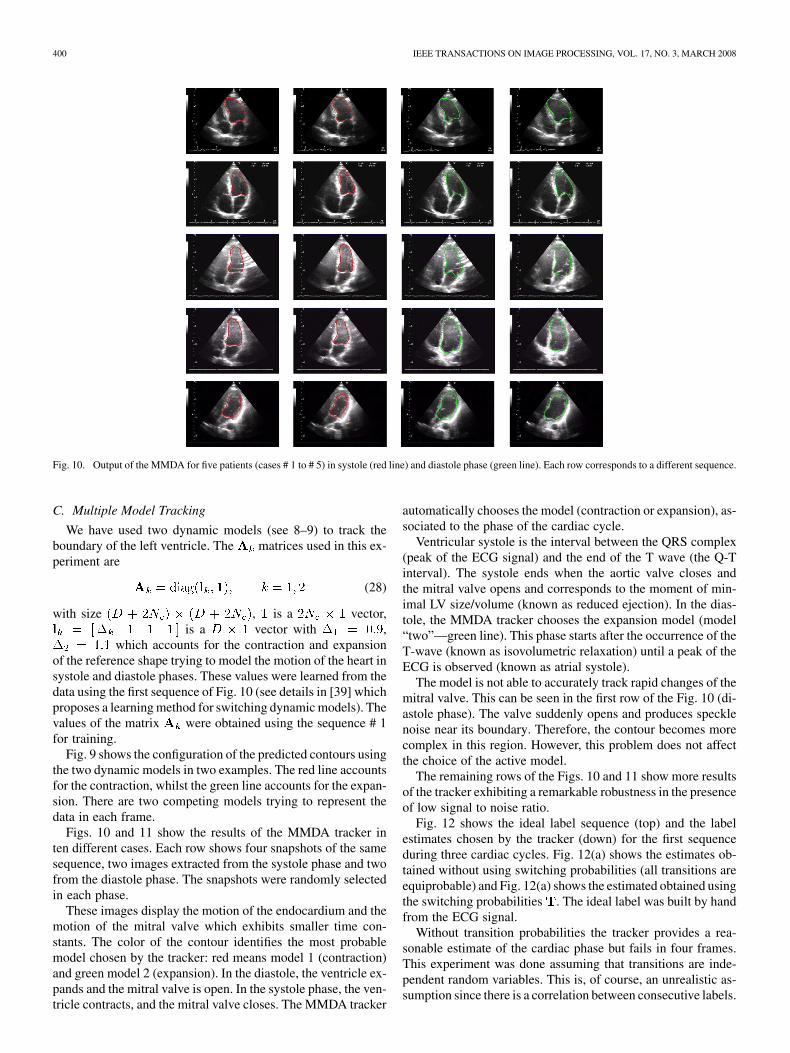
Fig. 10. Output of the MMDA for five patients (cases # 1 to # 5) in systole (red line) and diastole phase (green line). Each row corresponds to a different sequence.
C. Multiple Model Tracking
We have used two dynamic models (see 8–9) to track theboundary of the left ventricle. The matrices used in this ex-periment are
(28)
with size , is a vector,is a vector with ,
which accounts for the contraction and expansionof the reference shape trying to model the motion of the heart insystole and diastole phases. These values were learned from thedata using the first sequence of Fig. 10 (see details in [39] whichproposes a learning method for switching dynamic models). Thevalues of the matrix were obtained using the sequence # 1for training.
Fig. 9 shows the configuration of the predicted contours usingthe two dynamic models in two examples. The red line accountsfor the contraction, whilst the green line accounts for the expan-sion. There are two competing models trying to represent thedata in each frame.
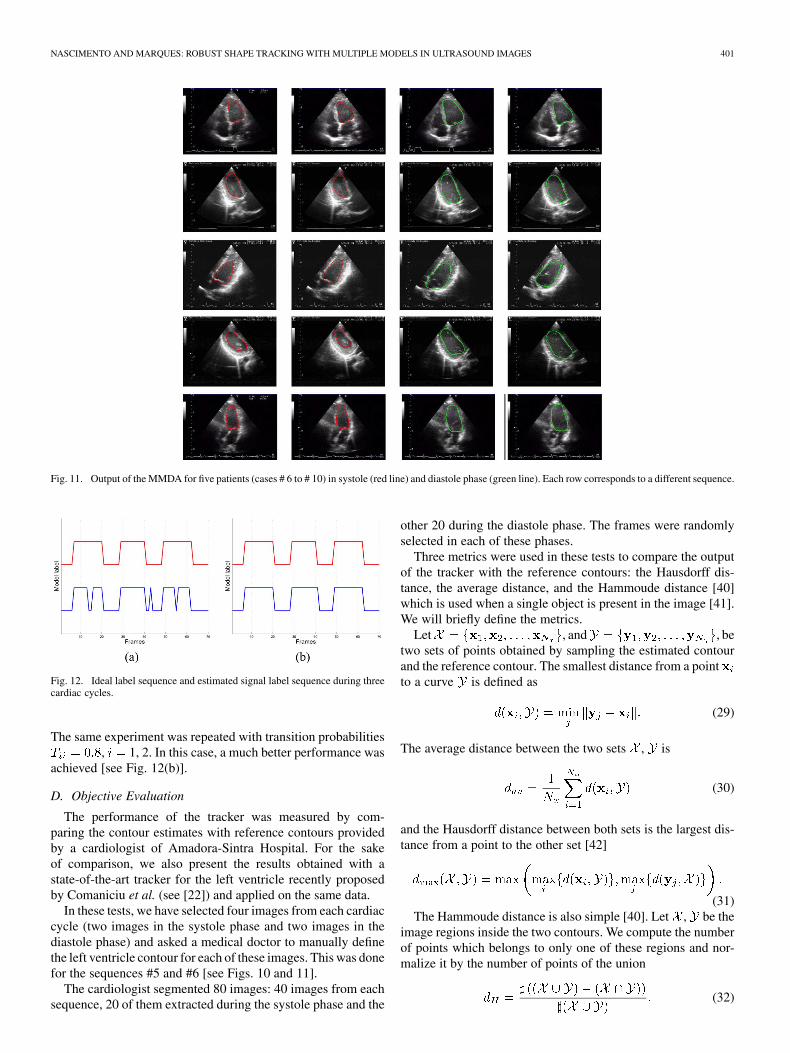
Figs. 10 and 11 show the results of the MMDA tracker inten different cases. Each row shows four snapshots of the samesequence, two images extracted from the systole phase and twofrom the diastole phase. The snapshots were randomly selectedin each phase.
These images display the motion of the endocardium and themotion of the mitral valve which exhibits smaller time con-stants. The color of the contour identifies the most probablemodel chosen by the tracker: red means model 1 (contraction)and green model 2 (expansion). In the diastole, the ventricle ex-pands and the mitral valve is open. In the systole phase, the ven-tricle contracts, and the mitral valve closes. The MMDA tracker
automatically chooses the model (contraction or expansion), as-sociated to the phase of the cardiac cycle.
Ventricular systole is the interval between the QRS complex(peak of the ECG signal) and the end of the T wave (the Q-Tinterval). The systole ends when the aortic valve closes andthe mitral valve opens and corresponds to the moment of min-imal LV size/volume (known as reduced ejection). In the dias-tole, the MMDA tracker chooses the expansion model (model“two”—green line). This phase starts after the occurrence of theT-wave (known as isovolumetric relaxation) until a peak of theECG is observed (known as atrial systole).
The model is not able to accurately track rapid changes of themitral valve. This can be seen in the first row of the Fig. 10 (di-astole phase). The valve suddenly opens and produces specklenoise near its boundary. Therefore, the contour becomes morecomplex in this region. However, this problem does not affectthe choice of the active model.
The remaining rows of the Figs. 10 and 11 show more resultsof the tracker exhibiting a remarkable robustness in the presenceof low signal to noise ratio.
Fig. 12 shows the ideal label sequence (top) and the labelestimates chosen by the tracker (down) for the first sequenceduring three cardiac cycles. Fig. 12(a) shows the estimates ob-tained without using switching probabilities (all transitions areequiprobable) and Fig. 12(a) shows the estimated obtained usingthe switching probabilities . The ideal label was built by handfrom the ECG signal.
Without transition probabilities the tracker provides a rea-sonable estimate of the cardiac phase but fails in four frames.This experiment was done assuming that transitions are inde-pendent random variables. This is, of course, an unrealistic as-sumption since there is a correlation between consecutive labels.
NASCIMENTO AND MARQUES: ROBUST SHAPE TRACKING WITH MULTIPLE MODELS IN ULTRASOUND IMAGES 401
Fig. 11. Output of the MMDA for five patients (cases # 6 to # 10) in systole (red line) and diastole phase (green line). Each row corresponds to a different sequence.
Fig. 12. Ideal label sequence and estimated signal label sequence during threecardiac cycles.
The same experiment was repeated with transition probabilities, 1, 2. In this case, a much better performance was
achieved [see Fig. 12(b)].
D. Objective Evaluation
The performance of the tracker was measured by com-paring the contour estimates with reference contours providedby a cardiologist of Amadora-Sintra Hospital. For the sakeof comparison, we also present the results obtained with astate-of-the-art tracker for the left ventricle recently proposedby Comaniciu et al. (see [22]) and applied on the same data.
In these tests, we have selected four images from each cardiaccycle (two images in the systole phase and two images in thediastole phase) and asked a medical doctor to manually definethe left ventricle contour for each of these images. This was donefor the sequences #5 and #6 [see Figs. 10 and 11].
The cardiologist segmented 80 images: 40 images from eachsequence, 20 of them extracted during the systole phase and the
other 20 during the diastole phase. The frames were randomlyselected in each of these phases.
Three metrics were used in these tests to compare the outputof the tracker with the reference contours: the Hausdorff dis-tance, the average distance, and the Hammoude distance [40]which is used when a single object is present in the image [41].We will briefly define the metrics.
Let , and , betwo sets of points obtained by sampling the estimated contourand the reference contour. The smallest distance from a pointto a curve is defined as
(29)
The average distance between the two sets , is
(30)
and the Hausdorff distance between both sets is the largest dis-tance from a point to the other set [42]
(31)The Hammoude distance is also simple [40]. Let , be the
image regions inside the two contours. We compute the numberof points which belongs to only one of these regions and nor-malize it by the number of points of the union
(32)
402 IEEE TRANSACTIONS ON IMAGE PROCESSING, VOL. 17, NO. 3, MARCH 2008
Fig. 13. (a) Ground truth provided by the cardiologist, (b) left side and (c) rightside.
TABLE IIEVALUATION OF CASE CASE # 5 USING THREE METRICS BETWEEN
THE ESTIMATED CONTOUR AND THE REFERENCE CONTOUR
PROVIDED BY THE SPECIALIST
TABLE IIIEVALUATION OF CASE CASE # 6 USING THREE METRICS BETWEEN
THE ESTIMATED CONTOUR AND THE REFERENCE CONTOUR
PROVIDED BY THE SPECIALIST
The Hausdorff and Hammoude distances are metrics sincethey verify the axioms of a metric. The average distance is nota metric since it is not symmetric, in general,
.If we represent the regions , by two binary images, the
is equal to the Hamming distance between the binary im-ages, normalized by the area of their sum. The Hammoude dis-tance is a normalized version of the Hamming distance which iswidely used to compare binary strings and images in informa-tion theory.
These three distances allow a comparison between pairs ofcontours. To evaluate the algorithm during several frames, wecompute the average value of these metrics. Other statistics canbe used for this purpose, as well [41], [43].
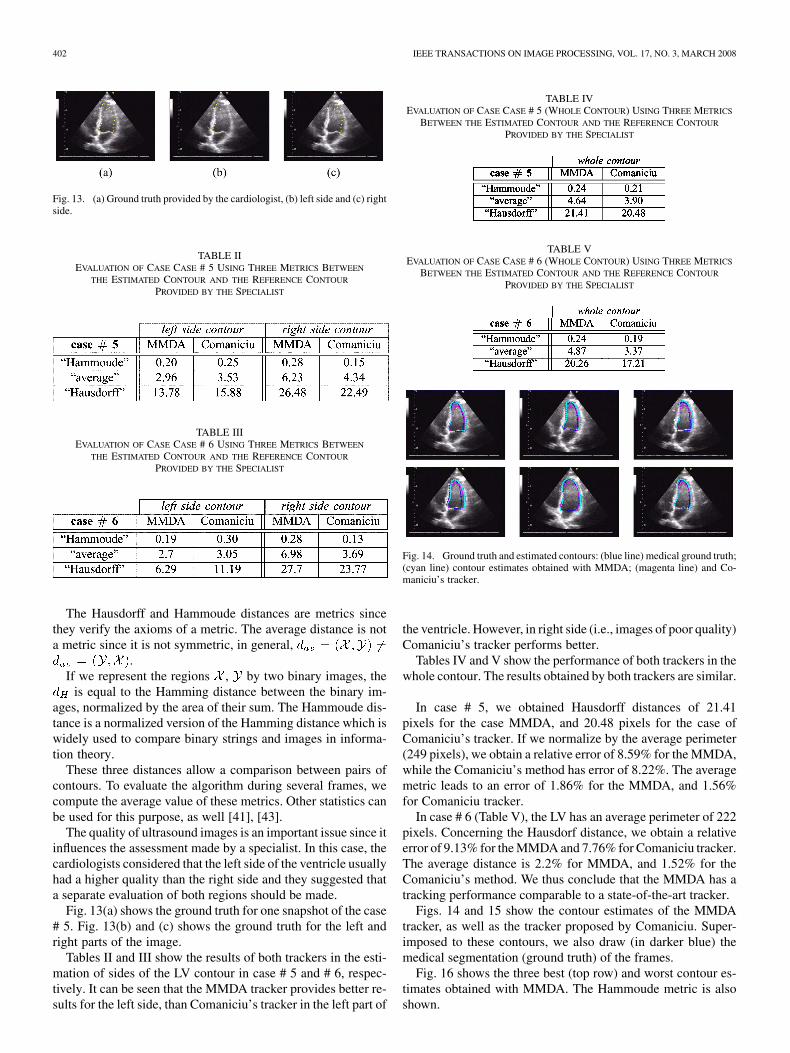
The quality of ultrasound images is an important issue since itinfluences the assessment made by a specialist. In this case, thecardiologists considered that the left side of the ventricle usuallyhad a higher quality than the right side and they suggested thata separate evaluation of both regions should be made.
Fig. 13(a) shows the ground truth for one snapshot of the case# 5. Fig. 13(b) and (c) shows the ground truth for the left andright parts of the image.
Tables II and III show the results of both trackers in the esti-mation of sides of the LV contour in case # 5 and # 6, respec-tively. It can be seen that the MMDA tracker provides better re-sults for the left side, than Comaniciu’s tracker in the left part of
TABLE IVEVALUATION OF CASE CASE # 5 (WHOLE CONTOUR) USING THREE METRICS
BETWEEN THE ESTIMATED CONTOUR AND THE REFERENCE CONTOUR
PROVIDED BY THE SPECIALIST
TABLE VEVALUATION OF CASE CASE # 6 (WHOLE CONTOUR) USING THREE METRICS
BETWEEN THE ESTIMATED CONTOUR AND THE REFERENCE CONTOUR
PROVIDED BY THE SPECIALIST
Fig. 14. Ground truth and estimated contours: (blue line) medical ground truth;(cyan line) contour estimates obtained with MMDA; (magenta line) and Co-maniciu’s tracker.
the ventricle. However, in right side (i.e., images of poor quality)Comaniciu’s tracker performs better.
Tables IV and V show the performance of both trackers in thewhole contour. The results obtained by both trackers are similar.
In case # 5, we obtained Hausdorff distances of 21.41pixels for the case MMDA, and 20.48 pixels for the case ofComaniciu’s tracker. If we normalize by the average perimeter(249 pixels), we obtain a relative error of 8.59% for the MMDA,while the Comaniciu’s method has error of 8.22%. The averagemetric leads to an error of 1.86% for the MMDA, and 1.56%for Comaniciu tracker.
In case # 6 (Table V), the LV has an average perimeter of 222pixels. Concerning the Hausdorf distance, we obtain a relativeerror of 9.13% for the MMDA and 7.76% for Comaniciu tracker.The average distance is 2.2% for MMDA, and 1.52% for theComaniciu’s method. We thus conclude that the MMDA has atracking performance comparable to a state-of-the-art tracker.
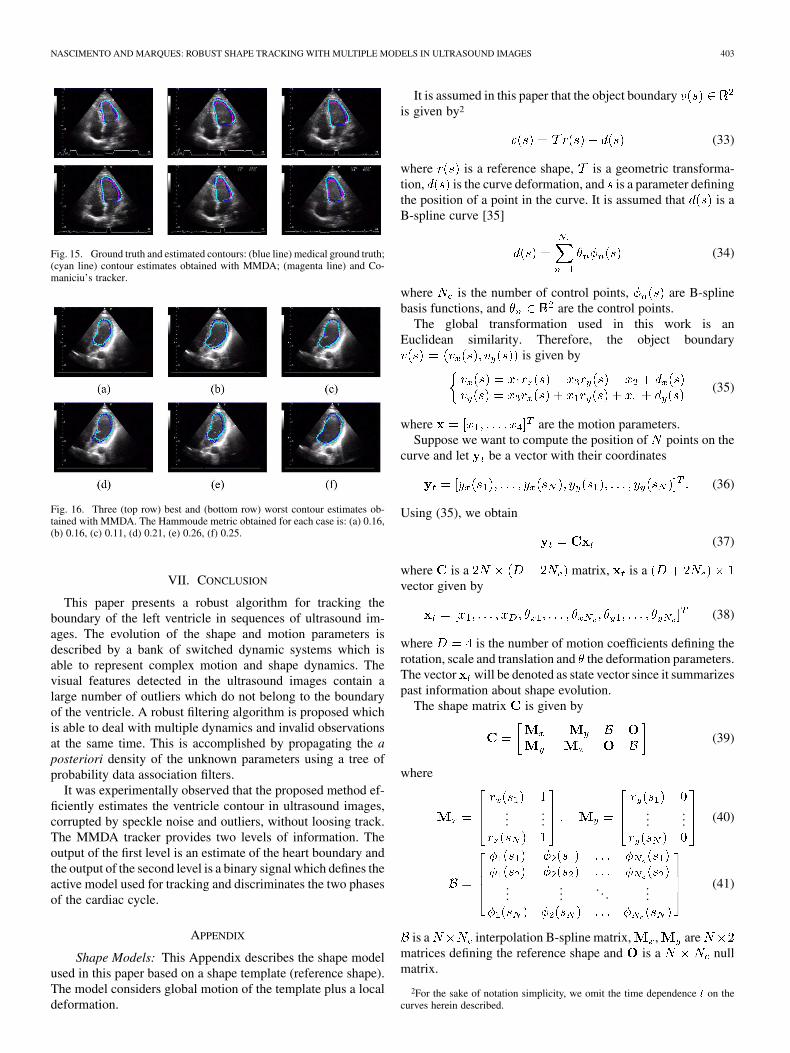
Figs. 14 and 15 show the contour estimates of the MMDAtracker, as well as the tracker proposed by Comaniciu. Super-imposed to these contours, we also draw (in darker blue) themedical segmentation (ground truth) of the frames.
Fig. 16 shows the three best (top row) and worst contour es-timates obtained with MMDA. The Hammoude metric is alsoshown.
NASCIMENTO AND MARQUES: ROBUST SHAPE TRACKING WITH MULTIPLE MODELS IN ULTRASOUND IMAGES 403
Fig. 15. Ground truth and estimated contours: (blue line) medical ground truth;(cyan line) contour estimates obtained with MMDA; (magenta line) and Co-maniciu’s tracker.
Fig. 16. Three (top row) best and (bottom row) worst contour estimates ob-tained with MMDA. The Hammoude metric obtained for each case is: (a) 0.16,(b) 0.16, (c) 0.11, (d) 0.21, (e) 0.26, (f) 0.25.
VII. CONCLUSION
This paper presents a robust algorithm for tracking theboundary of the left ventricle in sequences of ultrasound im-ages. The evolution of the shape and motion parameters isdescribed by a bank of switched dynamic systems which isable to represent complex motion and shape dynamics. Thevisual features detected in the ultrasound images contain alarge number of outliers which do not belong to the boundaryof the ventricle. A robust filtering algorithm is proposed whichis able to deal with multiple dynamics and invalid observationsat the same time. This is accomplished by propagating the aposteriori density of the unknown parameters using a tree ofprobability data association filters.
It was experimentally observed that the proposed method ef-ficiently estimates the ventricle contour in ultrasound images,corrupted by speckle noise and outliers, without loosing track.The MMDA tracker provides two levels of information. Theoutput of the first level is an estimate of the heart boundary andthe output of the second level is a binary signal which defines theactive model used for tracking and discriminates the two phasesof the cardiac cycle.
APPENDIX
Shape Models: This Appendix describes the shape modelused in this paper based on a shape template (reference shape).The model considers global motion of the template plus a localdeformation.
It is assumed in this paper that the object boundaryis given by2
(33)
where is a reference shape, is a geometric transforma-tion, is the curve deformation, and is a parameter definingthe position of a point in the curve. It is assumed that is aB-spline curve [35]
(34)
where is the number of control points, are B-splinebasis functions, and are the control points.
The global transformation used in this work is anEuclidean similarity. Therefore, the object boundary
is given by
(35)
where are the motion parameters.Suppose we want to compute the position of points on the
curve and let be a vector with their coordinates
(36)
Using (35), we obtain
(37)
where is a matrix, is avector given by
(38)
where is the number of motion coefficients defining therotation, scale and translation and the deformation parameters.The vector will be denoted as state vector since it summarizespast information about shape evolution.
The shape matrix is given by
(39)
where
......
...... (40)
......
. . ....
(41)
is a interpolation B-spline matrix, , arematrices defining the reference shape and is a nullmatrix.
2For the sake of notation simplicity, we omit the time dependence t on thecurves herein described.
404 IEEE TRANSACTIONS ON IMAGE PROCESSING, VOL. 17, NO. 3, MARCH 2008
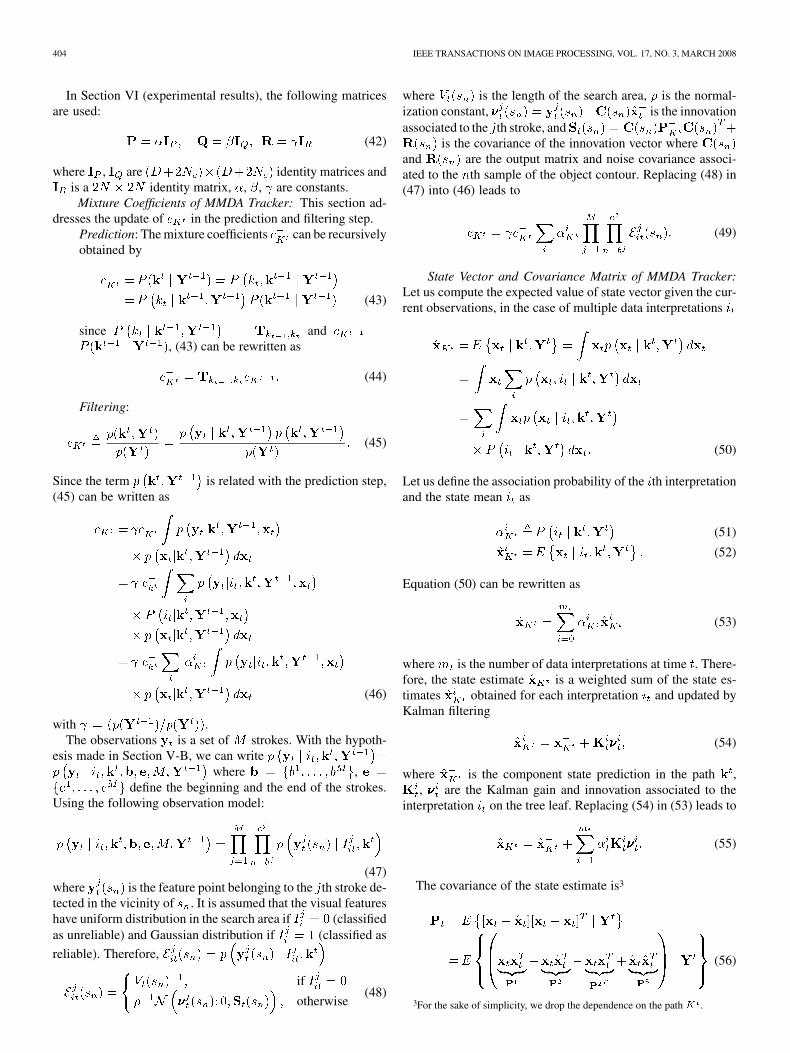
In Section VI (experimental results), the following matricesare used:
(42)
where , are identity matrices andis a identity matrix, , , are constants.
Mixture Coefficients of MMDA Tracker: This section ad-dresses the update of in the prediction and filtering step.
Prediction: The mixture coefficients can be recursivelyobtained by
(43)
since and, (43) can be rewritten as
(44)
Filtering:
(45)
Since the term is related with the prediction step,(45) can be written as
(46)
with .The observations is a set of strokes. With the hypoth-
esis made in Section V-B, we can writewhere ,
define the beginning and the end of the strokes.Using the following observation model:
(47)where is the feature point belonging to the th stroke de-tected in the vicinity of . It is assumed that the visual featureshave uniform distribution in the search area if (classifiedas unreliable) and Gaussian distribution if (classified as
reliable). Therefore,
if
otherwise(48)
where is the length of the search area, is the normal-ization constant, is the innovationassociated to the th stroke, and
is the covariance of the innovation vector whereand are the output matrix and noise covariance associ-ated to the th sample of the object contour. Replacing (48) in(47) into (46) leads to
(49)
State Vector and Covariance Matrix of MMDA Tracker:Let us compute the expected value of state vector given the cur-rent observations, in the case of multiple data interpretations
(50)
Let us define the association probability of the th interpretationand the state mean as
(51)
(52)
Equation (50) can be rewritten as
(53)
where is the number of data interpretations at time . There-fore, the state estimate is a weighted sum of the state es-timates obtained for each interpretation and updated byKalman filtering
(54)
where is the component state prediction in the path ,, are the Kalman gain and innovation associated to the
interpretation on the tree leaf. Replacing (54) in (53) leads to
(55)
The covariance of the state estimate is3
(56)
3For the sake of simplicity, we drop the dependence on the pathK .
NASCIMENTO AND MARQUES: ROBUST SHAPE TRACKING WITH MULTIPLE MODELS IN ULTRASOUND IMAGES 405
where
(57)
The first term is
(58)
The second term in (56) is
(59)
The third term is
(60)
Combining (57) and (59) into (56) yields
(61)
where
(62)
Therefore, (61) can be written as
(63)
ACKNOWLEDGMENT
The authors would like to thank Dr. D. Comaniciu forkindly providing tracking results obtained with his method[2] and for helpful comments. They would also like to thankProf. J. Sanches of the Institute of Systems and Robotics andProf. F. Pinto from the Faculty of Medicine of the Universityof Lisbon for the ultrasound images used in this work, as wellDr. A. Freitas from the Hospital Amadora-Sintra for providingthe ground truth segmentation of the left ventricle.
REFERENCES
[1] Y. Bar-Shalom and T. Fortmann, Tracking and Data Association.New York: Academic, 1988.
[2] X. Zhou, D. Comaniciu, and A. Gupta, “An information fusion frame-work for robust shape tracking,” IEEE Trans. Pattern Anal. Mach. In-tell., vol. 27, no. 1, pp. 115–129, Jan. 2005.
[3] K. Schmailzl and O. Ormerod, Ultrasound in Cardiology. Oxford,U.K.: Blackwell, 1994.
[4] M. Mignotte, J. Meunier, and J.-C. Terdif, “Endocardial boundary es-timation and tracking in echocardiographic images using deformabletemplates and Markov random fields,” Pattern Anal. Appl., vol. 4, no.4, pp. 256–271, 2001.
[5] Y. Akgul and C. Kambhamettu, “A coarse-to-fine deformable contouroptimization framework,” IEEE Trans. Pattern Anal. Mach. Intell., vol.25, no. 2, pp. 174–186, Feb. 2003.
[6] S. Minut and G. Stockman, “Interpolation snakes for border detectionin noisy images,” in Proc. Int. Conf. Computer Vision Theory and Ap-plications, 2006, pp. 25–28.
[7] M. A. T. Figueiredo, J. M. N. Leitao, and A. K. Jain, “Unsupervisedcontour representation and estimation using B-splines and a minimumdescription length criterion,” IEEE Trans. Image Process., vol. 9, no.6, pp. 1075–1087, Jun. 2000.
[8] N. Paragios, M.-P. Jolly, M. Taron, and R. Ramaraj, “Active shapemodels and segmentation of the left ventricle in echocardiography,”presented at the Int. Conf. on Scale Space Theories and PDEs Methodsin Computer Vision, 2005.
[9] D. Adam, H. Hareuveni, and S. Sideman, “Semiautomated bordertracking of cine echocardiogram ventricular images,” IEEE Trans.Med. Imag., vol. MI-6, no. 3, pp. 266–271, Sep. 1987.
[10] L. H. Staib and J. S. Duncan, “Boundary finding with parametricallydeformable models,” IEEE Trans. Pattern Anal. Mach. Intell., vol. 14,no. 11, pp. 1061–1075, Nov. 1992.
[11] D. Suter and F. Chen, “Left ventricular motion reconstruction basedon elastic vector splines,” IEEE Trans. Med. Imag., vol. 19, no. 4, pp.295–305, Apr. 2000.
[12] T. Cootes, C. Taylor, D. Cooper, and J. Haslam, “The use of activeshape models for locating structures in medical images,” Image Vis.Comput., vol. 12, no. 6, pp. 355–366, Jul. 1994.
[13] T. Cootes and C. Taylor, “Statistical models for appearance for medicalimage analysis and computer vision,” in Proc. SPIE Med. Imag., 2001,pp. 236–248.
[14] B. Georgescu, X. Zhou, D. Comaniciu, and B. Rao, “Real-time multi-model tracking of myocardium in echocardiography using robust infor-mation fusion,” presented at the Int. Conf. Medical Image Computingand Computer Assisted Intervention, 2004.
[15] V. Chalana, D. T. Linker, D. R. Haynor, and Y. Kim, “A multiple activecontour model for cardiac boundary detection on echocardiographicsequences,” IEEE Trans. Med. Imag., vol. 15, no. 3, pp. 290–298, Jun.1996.
[16] J. McEachen and J. Duncan, “Shape-based tracking of left ventricularwall motion,” IEEE Trans. Med. Imag., vol. 16, no. 3, pp. 270–283,Jun. 1997.
[17] G. E. Mailloux, F. Langlois, P. Y. Simard, and M. Bertrand, “Restora-tion of the velocity field of the heart from two-dimensional echocardio-grams,” IEEE Trans. Med. Imag., vol. 8, no. 2, pp. 143–153, Jun. 1989.
[18] J. M. Dias and J. Leitão, “Wall position and thickness estimation fromsequences of echocardiograms images,” IEEE Trans. Med. Imag., vol.15, no. 2, pp. 25–38, Feb. 1996.
[19] G. Jacob, A. Noble, and A. Blake, “Robust contour tracking inechocardiographic sequence,” in Proc. 6th Int. Conf. Computer Vision,Bombay, India, 1998, pp. 408–413.
[20] N. Friedland and D. Adam, “Automatic ventricular boundary detectionfrom sequential ultrasound images using simmulated annealing,” IEEETrans. Med. Imag., vol. 8, no. 4, pp. 344–353, Dec. 1989.
[21] J. Sanches, J. Nascimento, and J. Marques, “An unified framework forbayesian denoising for several medical and biological imaging modali-ties,” presented at the IEEE Engineering in Medicine and Biology Soc.Annu. Int. Conf, Aug. 2007.
[22] D. Comaniciu, X. Zhou, and S. Krishnan, “Robust real-time myocar-dial border tracking for echocardiography: An information fusion ap-proach,” IEEE Trans. Med. Imag., vol. 23, no. 7, pp. 849–860, Jul.2004.
[23] D. Terzopoulos and R. Szeliski, Tracking With Kalman Snakes. Cam-bridge, MA: MIT Press, 1993.
[24] M. Isard and A. Blake, “A mixed-state condensation tracker with au-tomatic model-switching,” in Proc. Int. Conf. Computer Vision, 1998,pp. 107–112.
[25] Y. Kanazawa and K. Kanatani, “Do we really have to consider covari-ance matrices for image features?,” in Proc. 8th Int. Conf. ComputerVision, 2001, vol. 37, pp. 586–591.
[26] K. Narandra and C. Xiang, “Adaptive control of discrete-time systemsusing multiple models,” IEEE Trans. Autom. Control, vol. 45, no. 9, pp.1699–1686, Sep. 2000.
[27] K. S. Narandra and J. Balakrishnan, “Adaptive control using multiplemodels,” IEEE Trans. Autom. Control, vol. 42, no. 2, pp. 171–187, Feb.1997.
[28] J. M. Lemos, L. M. Rato, and E. Mosca, “Integrating predictive andswitching control: Basic concepts and an experimental case study,”in Nonlinear Model Predictive Control, F. Allgöwer and A. Zheng,Eds. Basel, Switzerland: Birkhäuser Verlag, 2000, pp. 181–190.
406 IEEE TRANSACTIONS ON IMAGE PROCESSING, VOL. 17, NO. 3, MARCH 2008
[29] C. Chang and M. Athans, “State estimation for discrete systemswith switching parameters,” IEEE Trans. Aerosp. Electron. Syst., vol.AES-14, no. 3, pp. 418–425, May 1978.
[30] V. Petridis and A. Kehagias, “A multi-model algorithm for parameterestimation of time varying nonlinear systems,” Automatica, vol. 34, no.4, pp. 469–475, 1998.
[31] J. Tugnait, “Detection and estimation for abruptly changing systems,”Automatica, vol. 18, no. 5, pp. 607–615, 1982.
[32] J. Evans and R. Evans, “Image-enhanced multiple model tracking,” Au-tomatica, vol. 35, no. 11, pp. 1769–1786, 1999.
[33] J. Nascimento and J. S. Marques, “Robust shape tracking in the pres-ence of cluttered background on image processing,” in Proc. IEEE Int.Conf. Image Processing, Vancouver, BC, Canada, 2002, vol. 3, pp.82–85.
[34] P. Abolmaesumi and M. R. Sirouspour, “An interacting multiplemodel probabilistic data association filter for cavity boundary extrac-tion from ultrasound images,” IEEE Trans. Med. Imag., vol. 23, no. 6,pp. 772–784, Jun. 2004.
[35] A. Blake and M. Isard, Active Contours. New York: Springer, 1998.[36] A. Gelb, Applied Optimal Estimation. Cambridge, MA: MIT Press,
1974.[37] J. Jensen, Estimation of Blood Velocities Using Ultrasound, a Signal
Processing Approach. Cambridge, MA: Cambridge Univ. Press,1996.
[38] J. Nascimento and J. S. Marques, “Robust shape tracking in the pres-ence of cluttered background,” IEEE Trans. Multimedia, vol. 6, no. 8,pp. 852–861, Dec. 2004.
[39] G. Celeux, J. Nascimento, and J. S. Marques, “Learning switching dy-namic models for objects tracking,” Pattern Recognit., vol. 37, no. 9,pp. 1841–1853, Sep. 2004.
[40] A. Hammoude, “Computer-assited endocardial border identificationfrom a sequence of two-dimensional echocardiographic images,” Ph.D.dissertation, Univ. Washington, Seattle, 1988.
[41] V. Chalana and Y. Kim, “A methodology for evaluation of boundarydetection algorithms on medical images,” IEEE Trans. Med. Imag., vol.16, no. 10, pp. 642–652, Oct. 1997.
[42] D. P. Huttenlocher, G. A. Klanderman, and W. J. Rucklidge, “Com-paring images using Hausdorff distance,” IEEE Trans. Pattern Anal.Mach. Intell., vol. 15, no. 9, pp. 850–863, Sep. 1993.
[43] C. Alberola-Lopez, M. Martin-Fernandez, and J. Ruiz-Alzola, “Com-ments on: A methodology for evaluation of boundary detection algo-rithms on medical images,” IEEE Trans. Med. Imag., vol. 23, no. 5, pp.658–660, May 2004.
Jacinto C. Nascimento (M’06) received the E.E.degree from the Instituto Superior de Engenharia deLisboa, Lisbon, Portugal, and the M.Sc. and Ph.D.degrees from the Instituto Superior Técnico (IST),Lisbon, in 1995, 1998, and 2003, respectively.
Currently, he is a Postdoctorate Researcher at ISTaffiliated with the Institute for Systems and Robotics(ISR). His research interests are image processing,shape tracking, robust estimation, medical imaging,and video surveillance.
Jorge S. Marques received the E.E., M.Sc., andPh.D. degrees, and the aggregation title from theTechnical University of Lisbon, Lisbon, Portugal, in1981, 1984, 1990, and 2002, respectively.
Currently, he is an Associate Professor withthe Electrical Engineering Department, InstitutoSuperior Técnico, Lisbon, where he is also a Re-searcher at the Institute for Systems and Robotics.He has published over 120 papers in internationaljournals and conferences and he is the author of thebook Pattern Recognition: Statistical and Neural
Methods, 2nd ed. (in Portuguese) (IST, 2005). His research interests are in theareas of statistical image processing, shape analysis, and pattern recognition.
Dr. Marques was President of the Portuguese Association for Pattern Recog-nition (APRP) from 2001–2003 and a member of the IAPR Governing Board.