r-,* CIVIL ENGINEERING LABORATORY - DTIC
62
LEVELI 0TN no. N-1545 LONG-TERM HOLDING CAPACITY OF STATICALLY title: LOADED ANCHORS IN COHESIVE SOILS author: R. M. Beard date: January 1979 DDC sponsor: NAVAL FACILITIES ENGINEERING COMMAND 17 CD, JUL 617 program Nos: YF52.556.091.01.102 : V T OF r- ,* CIVIL ENGINEERING LABORATORY NAVAL CONSTRUCTION BATTALION CENTER Port Hueneme, California 93043 Approved for public release; distributin unlimited.
-
Upload
khangminh22 -
Category
Documents
-
view
4 -
download
0
Transcript of r-,* CIVIL ENGINEERING LABORATORY - DTIC

LEVELI
0TN no. N-1545
LONG-TERM HOLDING CAPACITY OF STATICALLY
title: LOADED ANCHORS IN COHESIVE SOILS
author: R. M. Beard
date: January 1979
DDCsponsor: NAVAL FACILITIES ENGINEERING COMMAND 17
CD, JUL 617program Nos: YF52.556.091.01.102
: V T OF r-,* CIVIL ENGINEERING LABORATORYNAVAL CONSTRUCTION BATTALION CENTERPort Hueneme, California 93043
Approved for public release; distributin unlimited.

FIR -, r
UnclassifiedSECURITY CLASSIFICATION OF THIS PAGE (Whir. Data Enfird)
READ INSTRUJCTIONSREPORT DOCUMENTATION PAGE BEFORE COMPLETING FORM1. REPORT NUMBE.R 12. GOVT ACCESSION NO. 3. RECIPIENT*S CATALOG NUMBER
TN-1545 DN7870104. TITLE S oII. . TYPE OF REPORT A PERIOD COVERED
LNG- ERM UOLDING APACITY OF STATICALLY NtfnlJn173jn17rbADAD NMORS NOESIVE SOILS.
-. -. 6A PERFORMING ORG. REPORT NUMBER
7. ATHORs0 6 CONTRACT OR GANT IjIMBEA(i)
R.M. Beard
6-i 9 EFORMING ORGANIZATION NAME AND ADDRESS IS. PROGRAM ELEMENT. PROJECT,_TASK
Civil Engineering Laboratory ARA27 WRKUNT UMER
Naval Construction Battalion Center 6 F25N;9.1.0
II. CONTROLLING0 OFFICE NAME AND ADDRESS - I.AbBO4A
Naval Facilities Engineering Command jamrp /7Alexandria, Virginia 22 332 58RBE F AE
14. MONITORING AGENCY NAME & ADDRESS(iI different from,, Contlci,,g Office) IS. SECURITY CLASS. (of Ihi, report)
/. Unclassified
IS.. DE C LASSI FI C ATION 'DO WNG R ADINGI ESCHEDULE
'6. DISTRIBUTION STATEMENT (of tI.f R.,,)
3 Approved for public release; distribution unlimited.
17. DISTRIBUTION STATEMENT (oIfhI. bsr1,.ct o,t-, h Blck 20. ili dIl.-eI from Report
IS. SUPPLEMENTARY NOTES
t9 KEY WORDS (Conlin,, o- 1-1a.o ad. it ... -yard Idervlly by block .- obe,)
Embedment anchors, seafloor soils, soil mechanics, long-term holding capacity, short-termholding capacity, soil creep, finite element method, model tests, field tests.
S0 AS4TRACT rCooriflO* onv r,. ide It n~ces.ay so~d Id-tilfy by block nuor*)
'The Civil Engineering Laboratory has conducted model anchor tests, intermediatescale field tests, laboratory soil investigations, and finite element analyses to optimizeprocedures for estimating long-term holding capacity of statically loaded plate-like anchorsembedded in cohesive seafloor soils. Also, work was done to determine relationshipsbetween long- and short-term holding capacity. This report presents the results of thesetests and analyses. It is concluded that the long-term holding capacity in cohesive soils
continued
DD , 1473 EDITION OF 1 NOV165 IS OBSOLETE UnclassifiedSECURITY CLASSIFICATION OF TIlS PAGE (lNon P., Entered)

UnclassifiedSECURITY CLASSIFICATION OF THIS pAGE(Wher Dtae Entered)
20. Continued
>can be readily analyzed using drained strength parameters and holding capacity factorsoriginally developed for cohesionless soils. It is also concluded that suction is an integralpart of short-term holding capacity and that it should not be ignored. Procedures forestimating both long- and short-term holding capacity are given, and design factors ofsafety are recommended. .-
Library Card
Civil Engineering LaboratoryLONG-TERM HOLDING CAPACITY OF STATICALLY LOADEDANCHORS IN COHESIVE SOILS, by R. M. Beard
TN-1545 58 pp illus January 1979 Unclassified
1. Anchor holding capacity 2. Cohesive soils I. YF52.556.091.01.102The Civil Engineering Laboratory has conducted model anchor tests, intermediate scale
field tests, laboratory soil investigations, and finite element analyses to optimize proceduresfor estimating long-term holding capacity of statically loaded plate-like anchors embedded incohesive seafloor soils. Also, work was done to determine relationships between long- andshort-term holding capacity. This report presents the results of these tests and analyses. It isconcluded that the long-term holding capacity in cohesive soils can be readily analyzed usingdrained strength parameters and holding capacity factors originally developed for cohesionlesssoils. It is also concluded that suction is an integral part of short-term holding capacity and thatit should not be ignored. Procedures for estimating both long- and short-term holding capacityare given, and design factors of safety are recommended.
UnclassifiedSECURITY CLASSIFICATION OF THIS PAGE'WShr DI-. FnIe-d)

CONTENTSFpage
INTRODUCTION .. .. ........... ............. I
Background . . . . . . . . . . . . . . . . . . . . . . . . . . I
Approach and Scope .. .. ........ ............. 6
CREEP OF SEAFLOOR SOILS.....................7
SHORT-TERM TESTING .. .. ......... ............ 9
Procedures. .. .. ........... ............. 9
Results. .. ........ ........... ....... 10
LONG-TERM TESTING .. ..... ........... ........ 1
Procedures .. .. ....... ........... ...... 11Results. .. ........ ........... ....... 12
FINITE ELEMENT MODELING. .. ........ ........... 14
iLONG-TERM FIELD TESTING. .. ......... .......... 16
Procedures .. .. ....... ........... ...... 17
Results. .. ......... ........... ...... 18
DISCUSSION. .. .... ............ ........... 19
Creep .. .. ......... ........... ...... 19
Short-Term Holding Capacity .. .. ....... .......... 20
tLong-Term Holding Capacity .. .. .......... ...... 23
CONCLUSIONS AND RECOMMENDATIONS .. ... ........... 27
ACKNOWLEDGMENTS .. ..... ........... ...... 29
REFERENCES. .. ........ ........... ...... 30
Accosson F~orIf16I GMR;M& 1DDC TABikammouncedJust if bcat ion
B___________
Distribution/
fv'11 iTbi1ity~ godes
Av ai 1 and/or
6e lal1~ ___

INTRODUCTION
Direct embedment anchors are being used more frequently in ocean construc-tion. Their selection stems from three major advantages over conventional anchors:
(1) they can efficiently resist loads in any direction, including uplift loads,
(2) they can be placed at specific points, and (3) they offer a high holding capacity
relative to their weight. The major disadvantages of direct embedment anchors
is that they offer reduced residual holding capacity after the ultimate load
has been reached. They are extracted from the seafloor by the ultimate loads.
As a consequence, direct embedment anchors must be carefully designed to
prevent extraction. The design of direct embedment anchorages can be separated
into three primary capacity considerations: (1) short-term static, (2) long-
term static, and (3) dynamic loading.
This report presents the results of physical and mathematical modeling
of long-term anchor behavior and a procedure for predicting long-term static
holding capacity. Also presented are the results of investigations of short-
term holding capacity affecting the selection of long-term design loads.
Background
The equation used to predict anchor holding capacity (Vesic, 1969) and
patterned after bearing capacity equations for footings is as follows:
F A(cNc + YbDNq)(0. 8 4 + 0.16B/L) (I)

where F = holding capacity
A = fluke area
c = soil cohesion
= soil buoyant unit weight
D = fluke embedment depth
B = fluke width
L = fluke length
N c,Nq = holding capacity factors
This is a general equation that can be applied to deep and shallow anchor embedment
and short- and long-term loading. Research on holding capacity of anchors
has usually centered on determining suitable values for the breakout factors
andNc q"Deep anchor embedment" defines a situation in which the sediment surface
is not affected when the anchor is loaded to failure. As the anchor is displaced
the soil tends to flow from above to below the anchor. "Shallow anchor embedment"
defines a situation in which the soil surface is bulged when the anchor is loaded
to failure. As the anchor is displaced a soil plug over the anchor is pushed
out of the sediment. A term called the "relative depth of embedment," (D/B)
is used to help define shallow and deep anchor behavior. This term is a function
of soil type and strength and determines which of these two modes of failure
will govern when an anchor is extracted.
Short-term capacity is the pullout load when an anchor is loaded rapidly
to failure. In fine-grained soils water flow into or out of the soil does not occur,
excess pore water pressures exist, and the soil's undrained shearing strength,
su, governs the capacity. Long-term capacity is the largest pullout load an
anchor fluke can sustain at a condition where excess pore water pressures
do not exist. For fine-grained soil, an extended time period is required to attain
this condition. Because induced water flow through the soil is complete, the
soil's drained strength properties govern the capacity For coarse-grained soil
this condition is reached almost immediately, and no distinction is made between
short- and long-term capacity.
2

Long-term capacity is, therefore, a design consideration primarily in fine-
grained cohesive soil. The design goal is to avoid situdtions where a safe short-
term load will cause anchor pullout after extended time periods. The short-
term capacity in cohesive soil has received considerable attention (Adams
and Hayes, 1967; Ali, 1968; Bhatnagar, 1969; Vesic, 1969; Kupferman, 1971;
Bemben and Kupferman, 1974). When analysis based on the work of these researchers
is combined with the work of research on cohesionless soils where drained
strength characteristics govern (Adams and Hayes, 1967 and Vesic, 1969),
a complete procedure for predicting anchor holding capacity can be formed
(Beard and Lee, 1975). In essence, holding capacity factors for short-term
capacity in cohesive soil, Nc, and long-term capacity under drained conditions
from research on cohesionless soil, Nq, are available as functions of embedment
ratio, D/B.
Adams and Hayes (1967) conducted the only previously reported long-term
model anchor tests. In three tests in a remolded clay with an undrained shear
strength of 100 to 170 kPa, long term capacities ranged from one-fifth to
one-fifteenth of the short-term capacity as embedment went from deep to
shallow (undefined overconsolidation ratios, OCR's, estimated to range from
50 to 400). In another test an overconsolidated clay was used that was prepared
as a slurry and then consolidated to an undrained shear strength of 10 to 14
kPa. For a deep anchor the long-term capacity was measured as about six-
tenths of the short capacity (undefined OCR estimated to be approximately
30). Adams and Hayes demonstrated that dramatic reductions in the short-
term capacity of anchors can be experienced when loaded long-term. They
suggested the use of drained strength properties as a logical method for estimating
long-term capacity. They applied a theory developed for sands and achieved
reasonable agreement with the measured long-term capacities (measured capacities
were about 80, 180, 80, and 150% of estimated values).
The data of Adams and Hayes were further analyzed by Meyerhof and Adams
(1968). For shallow anchor breakout the following general semitheoretical
relationships were proposed.
3

Circular anchors:
Qu = 7rcBD + S(7T/2) yBD 2 K u tan ) +W (2)
and
Rectangular anchors:
Qu = 2cD(B + L) + yD 2 (2sB + L -B) K u tan + W (3)
where Qu = ultimate uplift load
s = shape factor
y = soil unit weight
Ku = uplift coefficient of earth pressure
0 = soil friction angle
W = weight of uplifted soil
For deep anchors, these expressions were modified:
Circular anchors:
Qu = T cBH + s(IT/2) yB(2D-H) HK u tan W (4)
and
Rectangular anchors:
Qu = 2cH(B + L) + Y(2D-H) H (2sB + L -B) Ku tan + W (5)
where H = limiting vertical extent of the failure surface. These equations
were used to estimate the long-term capacities of the Adams and Hayes tests,
and the agreement was nearly identical to that attained by Adams and Hayes.
Radhakrishna and Adams (1973) have reported the results of two long-
term field tests on cylindrical footings and three long-term field tests on cylindrical
footings with belled bases. The long-term capacities were from 30% to 50%
less than measured short-term capacities. The soil was a fissured clay. Using
4

the methods proposed by Meyerhof and Adams, Radhakrishna and Adams estimated
the long-term capacities and compared them to test results. The estimates
for the belled footing were either too high or too low, depending on whether
peak or residual drained properties were used.
Three problems exist in applying either Vesic's method or Meyerhof and
Adams method for estimating holding capacity in cohesive soil. The first deals
with using the Nc factors that were obtained from tests using somewhat artificial
and unrealistic conditions for seafloor anchors. The second deals with using
N factors for drained cohesive soil that were obtained from tests in dry sands.q
The third deals with using the soil's weight in short-term failure analysis when
the soil involved may be neutrally buoyant within the soil mass.
The N factors do not include the effect of suction. Loading an anchor
creates lower than ambient pressures beneath it that help maintain the sediment
in contact with the fluke. This condition is defined as suction. Since these
negative pressures will dissipate with time, it has been common in previous
research to neglect suction and its contribution to short-term capacity. Model
studies have usually been performed with vented flukes to eliminate suction
forces; if not, correction factors were applied to remove the suction force.
This was done because most of the research was in support of terrestial applications
where venting could take place through partially saturated soils. In the ocean,
however, because total saturation is usually assured, rapid dissipation of the
suction cannot take place unless cavitation occurs (limited to shallow water
and gassy sediments). It is more likely that some amount of suction will act
until final pore pressure equalization is obtained at the long-term condition.
The values of Nq, that were obtained from model anchor tests in dry sand,
control the prediction of long-term capacity in cohesive soil. It would be a
large and potentially unsafe extrapolation to use these factors directly in anchorage
designs without experimental verification in actual cohesive soil.
The soil weight terms in both formulas (Ayb DNq = W, for Nq = 1) are
carryovers from footing and deep foundation analysis that may not apply to
the case of embedment anchors.
5
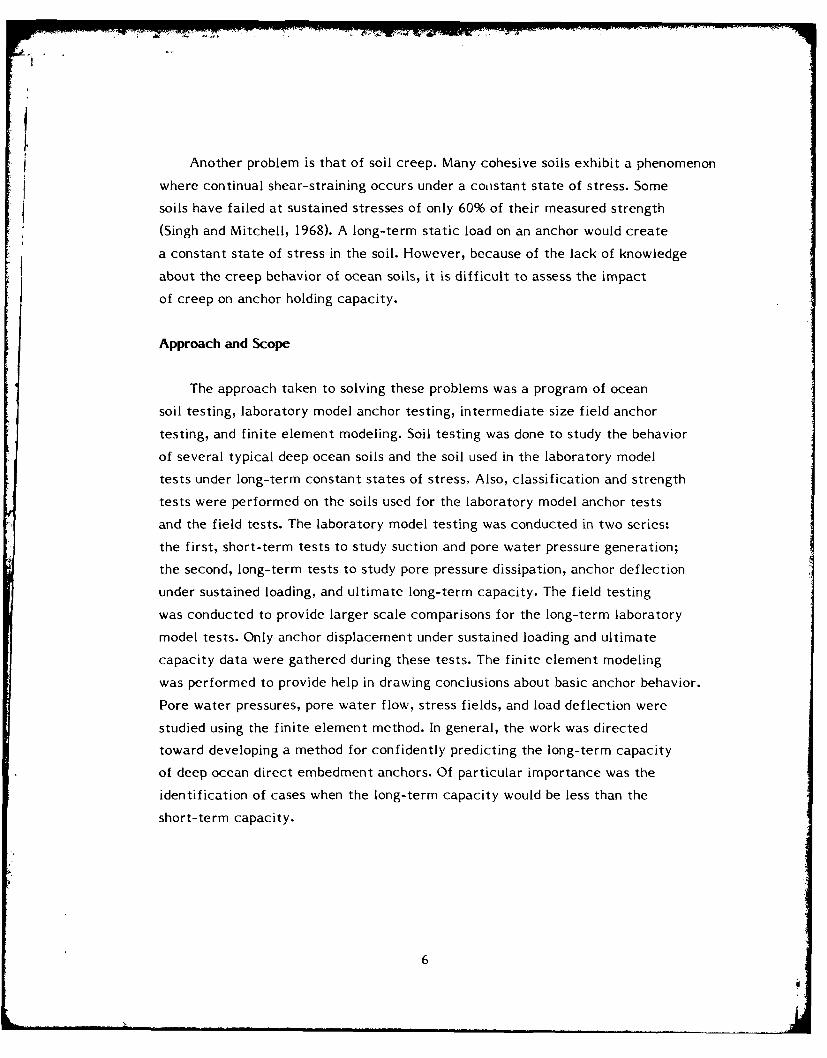
Another problem is that of soil creep. Many cohesive soils exhibit a phenomenon
where continual shear-straining occurs under a costant state of stress. Some
soils have failed at sustained stresses of only 60% of their measured strength
(Singh and Mitchell, 1968). A long-term static load on an anchor would create
a constant state of stress in the soil. However, because of the lack of knowledge
about the creep behavior of ocean soils, it is difficult to assess the impact
of creep on anchor holding capacity.
Approach and Scope
The approach taken to solving these problems was a program of ocean
soil testing, laboratory model anchor testing, intermediate size field anchor
testing, and finite element modeling. Soil testing was done to study the behavior
of several typical deep ocean soils and the soil used in the laboratory model
tests under long-term constant states of stress. Also, classification and strength
tests were performed on the soils used for the laboratory model anchor tests
and the field tests. The laboratory model testing was conducted in two series:
the first, short-term tests to study suction and pore water pressure generation;
the second, long-term tests to study pore pressure dissipation, anchor deflection
under sustained loading, and ultimate long-term capacity. The field testing
was conducted to provide larger scale comparisons for the long-term laboratory
model tests. Only anchor displacement under sustained loading and ultimate
capacity data were gathered during these tests. The finite element modeling
was performed to provide help in drawing conclusions about basic anchor behavior.
Pore water pressures, pore water flow, stress fields, and load deflection were
studied using the finite element method. In general, the work was directed
toward developing a method for confidently predicting the long-term capacity
of deep ocean direct embedment anchors. Of particular importance was the
identification of cases when the long-term capacity would be less than the
short-term capacity.
6
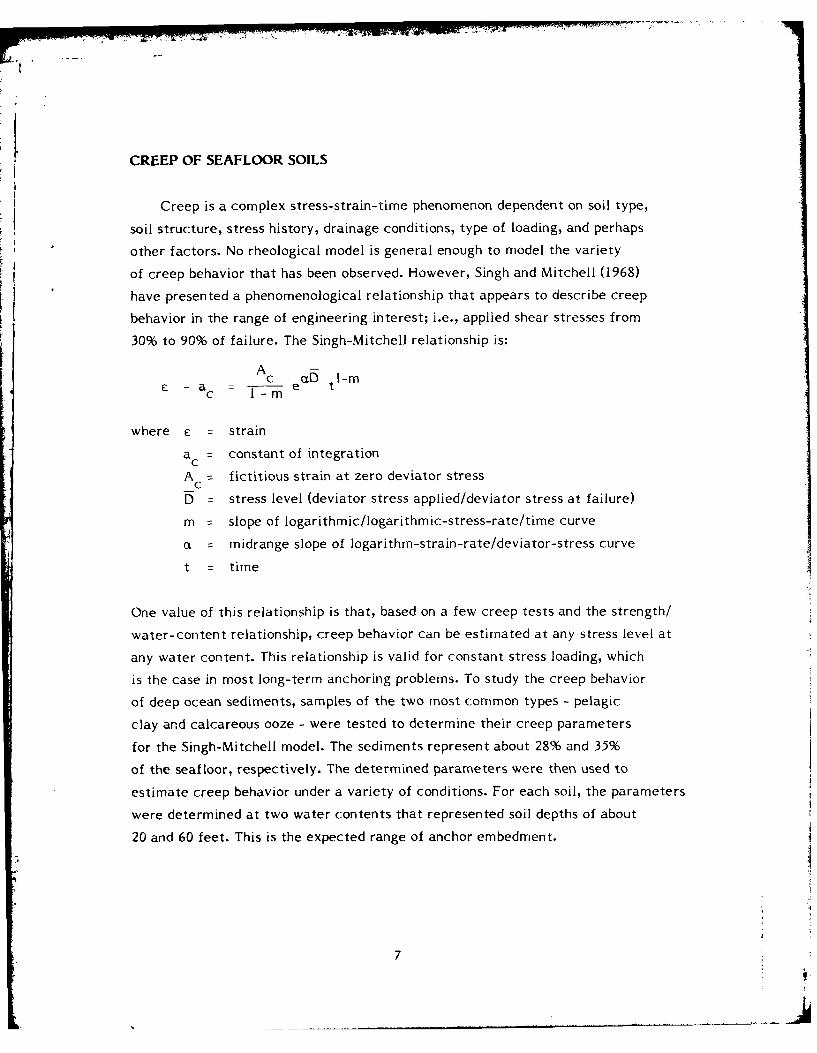
CREEP OF SEAFLOOR SOILS
Creep is a complex stress-strain-time phenomenon dependent on soil type,
soil structure, stress history, drainage conditions, type of loading, and perhaps
other factors. No rheological model is general enough to model the variety
of creep behavior that has been observed. However, Singh and Mitchell (1968)
have presented a phenomenological relationship that appears to describe creep
behavior in the range of engineering interest; i.e., applied shear stresses from
30% to 90% of failure. The Singh-Mitchell relationship is:
A -Ac eaD t -m~ a - e tc -- im
where e strain
a = constant of integrationc
A = fictitious strain at zero deviator stress-C
D stress level (deviator stress applied/deviator stress at failure)
m = slope of logarithmic/logarithmic-stress-rate/time curve
= midrange slope of logarithm-strain-rate/deviator-stress curve
t = time
One value of this relationship is that, based on a few creep tests and the strength/
water-content relationship, creep behavior can be estimated at any stress level at
any water content. This relationship is valid for constant stress loading, which
is the case in most long-term anchoring problems. To study the creep behavior
of deep ocean sediments, samples of the two most common types - pelagic
clay and calcareous ooze - were tested to determine their creep parameters
for the Singh-Mitchell model. The sediments represent about 28% and 35%
of the seafloor, respectively. The determined parameters were then used to
estimate creep behavior under a variety of conditions. For each soil, the parameters
were determined at two water contents that represented soil depths of about
20 and 60 feet. This is the expected range of anchor embedment.
7

I
For the pelagic clay, the parameters of interest were found to be about
the same at each water content. They were A = 0.0064, m = 0.89, and t =
4.4. A comparison between the empirical relationship and the test data at
one of the water contents is shown in Figure 1. For the calcareous ooze, a
single set of parameters did not describe the creep behavior at two water
contents. For softer soil (higher water content), A = 0.003, m = 0.95, and a
= 5.9 gave the best empirical fit. For denser z;oil (lower water content) A =
0.00045, m = 0.79, and cx =7.3 gave the best fit. A comparison between the
data and the empirical fit for softer calcareous ooze is shown in Figure 2.
For Figures 1 and 2 the strains at 1 minute have been force-fitted to the strain
at that stress level in an undrained triaxial shear test.
The determined parameters were used to estimate strain after extended
time periods. Estimated strain at several stress levels at time periods of 1,
2, 5, and 10 years less the instantaneous strain at I minute are presented in
Table I. These values represent a considerable extrapolation of the data on
which the empirical parameters are based. Ten years is about 3 logarithmic
cycles of time greater than the maximum test time. The data do cover about
3 logarithmic cycles of time from I to 5 x 10³ minutes (10 years is 5.25 x 10⁶
minutes). Such extrapolations are, however, the only practical method of estimating
behavior for such long time periods. Table I suggests that creep will not be
a significant problem of anchor behavior in these soils. Strains after periods
of 10 years should not exceed 10%. When other factors such as drainage and
resulting volumetric changes are considered, creep may be of minor importance.
Also, it should be noted that for deviator stress levels of 0.5 (equivalent to
a factor of safety of 2 to short-term failure), the 10-year strains do not exceed
3%.
Creep rupture, defined by an increasing rate of shear until failure is reached,
cannot be described by the Singh-Mitchell model. Their model can be used
only for estimating the amount of strain to be expected under sustained stress
in the range of engineering interest, which is normally between 30% to 90%
of the rupture stress. To learn more about the possibility of creep rupture
at high stress levels, four creep tests were performed at stress levels of 70%
to 90% of failure. Creep rupture was not observed under these sustained stresses.
8

SHORT-TERM TESTING
Short-term anchor pullout tests were conducted to study pore water pressure
generation and suction, to provide a comparative base for the long-term tests,
and study the relationship between short-term and long-term anchor holding
capacity.
Procedures
A total of 26 short-term anchor tests w-e performed - 17 by CEL; 2
by California State University, Long Beach (CSULB) (Yen, 1975); and 7 by
the University of Massachusetts (UM) (Bemben and Kupferman, 1974). Many
were conducted to provide specific background information for cyclic or long-
term static tests, but their inclusion here helps form a more complete statistical
base. The characteristics of the soils used are summarized in Table 2. The soil
shear strengths for tests varied from 0.20 to 11.7 kPa, and OCR's varied from
about I to 10. Embedment ratios ranged from 1.5 to 6. In one test, an embedment
ratio of about 30 was simulated with a surcharge.
The soil was usually placed in barrels as a slurry (the exceptions are the
UM tests) and kept submerged throughout the testing. The soft slurries were
mixed under vacuum. Anchor plates were located at depth as the soil was built
up around and over them. Barrel diameters were a minimum of 5.5 times the
anchor diameters to prevent side wall influence (Erden, 1971). Higher strengths
and OCR's were obtained by consolidating the soil with surface surcharges.
Two lubricated layers of thin plastic film were used to prevent arching of
the surcharge load to the walls of the barrels. Excess pore water pressure
ana surface deflection graphs versus time were used to monitor consolidation.
Undrained shear strength profiles were determined with a vane shear apparatus.
F or some tests, water content and bulk wet density profiles were also obtained.
The degree of saturation was determined for many tests and found to exceed
97% for all cases except for the UM tests.
9 1

The anchors were incrementally loaded to failure. Load was applied to
the anchors through a system of cables and pulleys and a thin shaft connected
to the anchor plate. For some tests where estimated OCR's were from I to
2 and the anchors were deeply embedded, pore water pressures were measured.
The measurements were made in the soil about the anchor at up to 12 locations
and were measured at each load increment. A description and discussion of
the pore water pressure system was presented by Beard (1974). Anchor deflection
versus load data was recorded.
Results
A summary of the test results is presented in Table 3. The trends in the
data are consistent with previous work, Holding capacity increased with anchor
size and soil shear strength. However, when anchor size and sediment strength
were about equal, holding capacities were nearly constant with increased depth.
This suggests that one holding capacity factor, N c' could be applied to almost
all of the data. This is best illustrated by the data in Figure 3 where values
of N are plotted versus values of D/B. The N factors were derived fromc cthe test data using Equation I with N - 0. Except for tests 20-22 (UM) at_qa D/B of 2.1, the Nc's fell about the N - 15 line. It is thought that for tests20-22 (UM) the lack of complete saturation did not allow for full suction to
develop. The remaining 23 tests did exhibit deep behavior. The Nc's of the
tests exhibiting deep anchor behavior were satistically analyzed. The lower
and upper 95% confidence limit from a log normal fit were -18% to +22% of
N'c = 15. In other words when the undrained shear strength is accurately known
and Nc = 15 is used to predict the breakout load, the test result should, 95%
of the time, be within -18% to +22% of the predicted value.
To study the soil weight terms that have been included by previous researchers,
the data for tests 10-19 were analyzed two ways. These tests were chosen
because their soil densities were known more accurately than those of other
tests. The data were analyzed both by ignoring the soil weight term and by
including it. The scatter of the determined N factors for these 10 tests whenc
10 t

..................-.. " .. * 1' r,' q m
the weight term was included was twice what it was when the term was excluded.
The increased scatter of Nc would indicate that inclusion of a soil weight term
is incorrect.
Pore water pressures were measured in the soil around the anchor plates
in tests 3, 4, and 5. Figure 4 shows the locations of the measurement devices
for these tests. The soil was near normally consolidated, and the anchors were
embedded deeply. The approximate pore water pressure distribution is shown
in Figure 5. The changes in pore water pressure were linearly proportional
to the applied load. The pressure distribution shows that the soil above the
anchor is in a general state of compression and that the soil below the anchor
is in a general state of tension.
LONG-TERM TESTING
Two types of long-term model anchor tests were performed. In one type,
in near normally consolidated soil, a load short of causing short-term failure
was applied and anchor and soil behavior monitored with time. In the other
type, many load increments were applied to each anchor with pore water pressure
allowed to dissipate between each increment. This was done in an attempt
to achieve the ultimate long-term capacity, thereby allowing for comparison
of proposed prediction procedures. Eight long-term tests were conducted in
the first manner, three by CEL and five by CSULB (Yen, 1975). Ten long-term
tests were conducted in the second manner, all by CEL.
Procedures
The state of the soils used for the single increment tests can be described
as near normally consolidated. For the multi-increment tests, the soil was
varied from normally consolidated to an overconsolidation ratio of about 35.
For the single increment long-term tests, CEL used soil I and CSULB used
soil 2 described in Table 2. For the multi-increment tests CEL used soil 3 described
11

in Table 2. The tests were set up as described for short-term testing procedures.
Loads were applied with weights through a system of cables and pulleys. Anchor
displacements were monitored at selected time intervals by an automatic
recording system. For the multi-increment tests, new loads were not applied
until the anchors stopped moving or the movement rate became very small.
The typical time between increments was 14 to 30 days. The soils were kept
submerged throughout the tests.
Undrained shear strength profiles were measured for all the tests forestimating short-term capacities. For the multi-increment loading tests, water
content and bulk wet density profiles were also obtained. Soil 3, used for the
multi-increment tests, was tested to determine its drained friction angle and
cohesion intercept and the relationship of these parameters to confining stress
and overconsolidation ratio.
Results
The results are best separated into two categories: one being the single
increment tests that were done primarily to study time-dependent processes
of long-term capacity, and the other being the multi-increment tests that
primarily were done to study the controlling factors at the ultimate long-term
capacity.
Table 4 summarizes the single increment tests program. A plot of displacement
versus time is given in Figure 6 for tests 1-3 in Table 4. The displacement time
history is similar to that observed in a consolidation process. This similarity
is also displayed by the plot of excess pore water pressure versus time in Figure
7. The data are from test 2 for two locations, one is one radius below and the
other two radii above the center of the fluke. The trends in displacement and
pore water pressure dissipation with time were consistent from test to test.
None of the anchors pulled out, even for two tests where the long-term loads
applied were estimated to be 75% of the short-term capacity, including suction.
These results suggest that for near normally consolidated soil, a process of
consolidation occurs above the anchor with consequent soil strengthening.
12

The reverse seems to occur below the anchor fluke. The test results were also
examined by plotting displacement rate versus time (Figure 8). This type of
plot helps to identify trends in behavior after short-term processes such as
consolidation have been completed and is often used in creep studies. Not
all the single increment test data appear on this plot. For tests 4 and 7 of
Table 4, displacements were not large enough to determine displacement rate
values for this plot. In test I of Table 4, displacements were not measured
accurately enough to determine displacement rate values. The data for tests
5 and 8 of Table 4 were similar to those shown in Figure 8, but out of range
of the plot. The upper slopes identify the consolidation phase, and the lower
slopes identify the creep phase. Differences between slopes and locations are
a function of soil and anchor parameters. Of importance is that the displacement
rate continued to decrease with time for all the tests. Because consolidation
and strengthening is occurring in the soil as the displacement rates decrease,
it is apparent that these anchors were not going to pull out. The single increment
tests show that anchors in near normally consolidated soils can sustain long-
term loads that approach their short-term capacity without pulling out.
The multi-increment tests were conducted at varied OCR's and embedment
depths using 50-mm-diameter anchors in soil 3 of Table 2. The test parameters
are summarized in Table 5 along with estimated short-term capacities based
on undrained shear strength profiles and the ultimate long-term capacities
measured. Only for the tests at an embedment ratio of 6 were the long-term
capacities greater than the short-term capacities. Figures 9, 10, and I I are
graphs of displacement versus load for these long-term tests at embedment
ratios of 1.5, 3, and 6, respectively. The same trends are observed in each
graph; tests at higher OCR's resulted in lower displacement at failure and
higher loads at failure than tests at lower OCR's. The relationships between
OCR, relative embedment depths, short-term and long-term holding capacity,
is best illustrated by a graph of the ratio of the long- to short-term capacity
versus the OCR's (Figure 12).
The soil used for the multi-increment anchor tests was tested to determine
its drained strength properties at low confining stresses and low to moderate
13

OCR's, such as those acting during the model anchor tests. Figure 13 presents
the relationships between the drained friction angle, qp, and the maximum past
pressure, Pm" Figure 14 presents the cohesion intercept, F, as a function
of the maximum past pressure. These data were obtained from triaxial shear
tests conducted using Berkeley type cells with air bushings. These parameters,
and c', along with soil density are the key parameters necessary for analyzing
or estimating long-term capacity.
FINITE ELEMENT MODELING
Finite element method (FEM) modeling of holding capacity was done to
confirm the observed results of the model anchor tests and to study a wider
scope of anchor-soil conditions than could be done with physical models. Two
different FEM models were used. One by Ghaboussi and Wilson (1971) was
used to study pore water pressures and direction of pore water flow. The other,
a modified version of Wilson's (1965) bilinear elastic formulation, was used
to study stress states and pore water pressure over a wide range of embedment
ratios and overconsolidation ratios (designated by Henkel's porewater pressure
parameter).* For both models, full suction was allowed to develop below the
anchor.
The FEM results support the results of the physical modeling. For anchors
embedded in normally consolidated soil (a - 0.5), the pore water pressures
generated were positive above the anchor and negative below the anchor. This
was the case even for anchors as shallow as D/B - 2. Flow of the pore water
was generally from the top to the bottom of the anchor as illustrated by Figure
15. For heavily overconsolidated soils (a - -0.6), negative pore water pressures
*Henkel's a parameter (Henkel, 1960) was used because it is a more generalpore pressure parameter than Skempton's pore pressure parameter. It isdefined as the quotient of dividing the difference in the pore pressure changeand the average total stress by the shear stress. The major differencebetween the Henkel and Skempton pore pressure parameters is the inclusionof the intermediate principal stress in Henkel's pore pressure parameterdefinition.
14
t

were the general rule, particularly for low embedment ratios. Even for deeper
cases (i.e., D/B = 10), positive pore water pressures were limited to the hemisphere
of sediment directly above the anchor. The magnitude of the negative pressures
above the fluke was small compared to those pressures in the sediment below
the fluke. This would result in less soil softening above than below the fluke.
When the overconsolidation was reduced (a--0.3), the negative pore water
pressure zone above the anchor at higher embedment ratios did not occur.This indicates that for moderate overconsolidation with higher embedmentratios softening of the soil above the anchor would not occur. This is an indica-
tion of trends that are not easily quantifiable in terms of actual conditions.
No universal relationship exists between the overconsolidation ratio and the
a parameter; it varies from soil to soil. However, when a - -0.6, the overconsoli-
dation ratio is probably 20 or greater. For a--0.3, the overconsolidation is
more moderate - in the range of 4 to 10. For embedment anchor considerations,
it is unlikely that a heavily overconsolidated soil with an a == -0.6 will be en-
countered at embedment depths attainable with present anchor hardware.
On the continental shelves it is probable that moderately overconsolidated
soil will be encountered. In the deep ocean, the prevalent case will be normally
or near normally consolidated soil. The results of the FEM model suggest that
for the most probable embedment soil conditions, negative pore water pressures
will not be generated above the anchor. Therefore, softening of the soil above
the anchor will not be a problem, rather the soil will harden. This is supported
by the data in Table 5; that is, tests at higher embedment ratios had long-term
capacities greater than their short-term capacities even when the soil was
moderately overconsolidated. This does not account for what occurs below
the anchor; in all cases studied, negative pore water pressures were generated
below the anchor. This pressure will lead to soil softening. Under a long-term
condition, the contribution of suction will be lost.
The FEM modeling results support the results of the physical model tests
concerning the contribution of suction to the short-term capacity. Figure 16
is a plot of normalized anchor displacement versus normalized load, defined
as the applied load, L, divided by the product of the undrained shear strength,
15* I z

s and the fluke area of the anchor, A. The normalized load is the same as
c for a purely cohesive soil. The data in Figure 16 represents a deeply embed-ded anchor. Note that failure, defined by a large increase in displacement
with little additional load, occurs between a normalized load of 12 to 15. This
compares well to N c 15, determined from physical modeling.c .
LONG-TERM FIELD TESTING
Field testing was done with intermediate sized anchors to provide a large
scale comparison with the laboratory anchor tests and to provide data using
an anchor embedded and keyed in the typical manner. The typical embedment
technique is for the anchor to be launched on edge from a gun at high velocity
toward the seafloor with the kinetic energy of the anchor being used to overcome
the penetration resistance of the soil. A cable attached to the anchor is dragged
down into the seafloor by the anchor. Keying occurs when the cable is pulled;
the anchor, through mechanical features, is rotated until its main surface
is normal to the direction of pull. This method of anchor installation and keying
undoubtedly disturbs the soil and results in a condition much different from
a laboratory anchor where no disturbance oc -urs. Rocker (1977) found the
short-term field capacity to be about 20% less than values predicted from
laboratory tests.
The site chosen to conduct these tests was a tidal flat at the Mare Island
Naval Shipyard. The soil there is a normally consolidated San Francisco Bay
mud of moderate sensitivity and high compressibility. Others (Duncan and
Buchignani, 1973) have shown that bay mud loses strength when subjected
to sustained loads (i.e., creep susceptible). This type of loading exists during
long-term anchor testing. This soil is generally similar to fine-grained ocean
soils, except perhaps in its creep behavior.
In view of the test conditions and soil characteristics, it was evident that
this would be a good site for investigating long-term holding capacity in the
field.
16

Procedures
Aircraft matting was placed over the tidal flat to provide support forpersonnel and equipment on the very soft soil. Six 0.23 x 0.46-m test anchorswere fired into the tidal flat with a gun at velocities of about 45 rps. Penetra-
tions ranged from 3 to 4 m. Tripods, supported on the aircraft matting, wereplaced over the anchor locations to test the anchors. Five of these anchors
were keyed under short-term loads by pulling against the tripod. These were
essentially short-term tests because a load peak was reached. The other anchorwas not keyed prior to the long-term testing. Long-term loads were appliedto the anchors with deadloads using a block and tackle attached to the tripod.The remoteness of the site from CEL did not allow for changing the load incre-
ments based on a specific time interval or displacement rate. Rather, the
condition of one test would govern when a trip was made to adjust the loadsof all the tests then underway. Thus, the size of the load increments and thelengths of application varied significantly from test to test and within a giventest. Displacements were measured at Lhe cable to the anchor with a ruler.
In-situ vane shear tests were conducted and cores were taken for labora-tory analysis. In the laboratory, classification tests were performed and specificgravity, bulk wet densities, natural water contents, and grain size distribution
were determined. Triaxial tests were performed to determine drained strengthparameters of the soil.
The long-term holding capacity was expected to exceed the short-termholding capacity because the soil was normally consolidated. This presented
problems in load application. To reach the ultimate drained failure condition
a careful process of incrementing the load to allow drainage to occur betweeneach load increment was necessary to prevent rupture at intermediate conditions.
The procedure to accomplish this required applying small load increments
once the short-term failure load was approached. However, the remoteness
of the site necessitated applying large load increments, sometimes as great
as 20% of the short-term holding capacity.
17 t

Results
The soil characteristics at the site are summarized in Table 6. The undrained
shear strength profile in the range of interest was nearly linear from 3.8 kPa
at I meter to 10.7 kPa at 5 meters. The effective overburden pressure was
also nearly linear from 5.3 kPa at I meter to 13.4 kPa at 5 meters. The anchor
depths during long-term loading were between 1.5 and 3 meters. Triaxial tests
were performed after consolidation to stress levels appropriate for these depths,
and the drained strength parameters were found to be I kPa and (V 40
degrees. A summary of the six anchor tests is given in Table 7.
Figure 17 is a graph of anchor tests D, F, and 3, showing the depth of
embedment at the termination of each load increment and the time in days
that each increment was applied. Also plotted is a line of the approximate
mean of the short-term tests conducted by Rocker (1977) at this site and a
line of predicted long-term capacities. Each of these anchors held long-term
loads equalling or exceeding the short-term holding capacities. Note that for
both D and 3 the initial loadings were placed soon after installation. The loads
were small, and the short-term capacity was approached cautiously. By contrast,
in test F the first increment was applied 440 days after keying and approached
the short-term capacity. This load was subsequently reduced during the first
day due to excessive displacements (about 0.5 meter). By careful reapplication
of loads, the short-term holding capacity line was later reached. Significant Iin test J is that the short-term capacity curve was reached in 2 days from
first long-term loading.
Figure 18 is a graph of tests G, I, and K. A problem was experienced with
each of these tests. Test G was loaded long-term 440 days after keying and
progressed well until the wire to the fluke parted under a load of 4.75 kN.
Test I was loaded long-term I day after keying and was approaching the short-
term holding capacity curve when the next increment applied was more than
50% of the existing long-term load (2.7 kN increment on 4.6 kN existing load).
The total load then applied exceeded the short-term capacity, and the anchor
failed. In test K, immediately after the anchor was'keyed, a long-term load
18 t

of about 60% of the short-term capacity was applied, causing large displacements
(0.3 meter). That load was removed and smaller long-term loads applied; however,
the anchor pulled out without ever holding any load longer than 0.3 days.
DISCUSSION
Creep
Because creep is a complex stress-strain time phenomenon dependent
on a variety of factors, it is not surprising that no general procedures exist
for including creep behavior in geotechnical designs. One approach is to design
using the lowest creep rupture strength expected during the life of the facility.
Another approach is to design for a limiting displacement using creep stress-
strain data. Both of these approaches ignore the fact that drainage is occurring
under the applied state of stress. This drainage alters the stress-strain time
response of the soil. Because most creep tests are conducted undrained, the
data are limited in their application. Drained creep tests can be performed,
but it is not possible (except for simple cases) to simulate field drainage condi-
tions. Consequently, a good deal of engineering judgment is required when
dealing with soils that exhibit significant creep behavior.
The samples, whose creep behavior was studied in this work, represent
two general seafloor types: pelagic clay and calcareous ooze. These general
soil types cover 28% and 35% of the seafloor, respectively. For the samples
tested, creep did not appear to be a problem (see Figures 1 and 2 and Table
1). While they do represent these sediment provinces, it must be kept in mind
that the soils are samples from only two locations and that these sediment
provinces cover vast areas of the seafloor. Exceptions to any generalizations
will be found. The character of pelagic clays has been found to be more consis-
tent than calcareous oozes, which can vary considerably in grain size and shape.
However, two factors allow some generalizations: (1) drainage and (2) the
general state of consolidation of these soil types. These soils are generally
19

m - €' ,' l -l ,,if ! : "
.. . . . . . .. . . . . . . . . . . . . . . . . . . .... ....='4:'- '°'":• .. .
near normally consolidated. Under this condition, as shown in the model anchor
testing (Figure 5) and the finite element modelir g of anchors (Figure 15), posi-
tive pore water pressures will be generated above anchors. Therefore, the
drainage will densify the soil above the anchor, reduce expected creep strain,
and increase the creep rupture strength. The factor of safety applied to the
design must also be taken into account. Anchor holding capacity is essentially
a bearing capacity problem, and for bearing capacity problems the factor of
safety against failure is usually 3 for the normally expected maximum load
and usually not less than 2 for the maximum load ever expected. In view of
the lack of experience in using embedment anchors in soil, it is unlikely that
any smaller factors of safety will be used than those in bearing capacity design.
As a result, the deviator stress levels will be 0.5 or less. In Table I, the 10-
year strains are seen to be less than 2.5% for both soils at this stress level.
In summary, it can be generalized that creep will not be a problem in
embedment anchor designs in pelagic clays and calcareous oozes and will play
a minor role in overall anchor behavior. Other cohesive soils need to be evalu-
ated case by case.
Short-Term Holding Capacity
Short-term holding capacity is important in designing an embedment anchor
for long-term loading because it is the holding capacity base that cannot be
exceeded even though the long-term capacity may be greater. Therefore, an
accurate estimate of the short-term capacity is necessary to properly utilize
an embedment anchor's efficiency. The most significant consideration in esti-
mating the short-term holding capacity is whether or not suction will be developed
under the anchor plate. Previous researchers have usually conducted their
tests so that suction did not occur, or they subtracted its effect from measured
breakout forces. The holding capacity factor, Nc , thus obtained for deep anchors
was about 9. Using this value as the limiting holding capacity factor for estimating
short-term holding capacity was recommended by Taylor and Lee (1972). The
results of this work, both in model testing (Figure 3) and finite element analysis
(Figure 16), have shown that with suction the limiting breakout factor is about
15.
20

The logic behind using Nc 9 is that the suction must be lost with time
and, therefore, it should not be included. However, the same process of drainage
that dissipates suction transfers the anchors from a short-term to a long-term
condition. That is, the water flow to relieve the suction pressure comes from
above the anchor (see Figure 15). Consequently, using an Nc greater than 9
as the limiting breakout factor for short-term loading will not give overestima-
tions. Rather the larger breakout factor will lead to better evaluations of
short-term capacity. Some verification of this line of reasoning is given by
tests 6 and 9 in Table 4 and Figures 6 and 8. In these tests, single increment
long-term loads equivalent to 75% of the short-term capacity estimated, using
N = 15, did not cause failure. These loads were 25% larger than the short-c
term capacity estimated, using Nc = 9.
The results of the model tests gave a limiting Nc of 15 (Figure 3), but
the results need to be tempered with the results of field tests. The laboratory
tests represent an ideal condition that, for practical reasons, is not reproduced
in the field. In the field the anchor flukes must be inserted and keyed. In cohe-
sive soils, which usually exhibit a sensitivity, the effect of insertion and keying
is a reduction in the shear strength of the soil. It is not presently possible to
quantify the amount of strength reduction relative to the sensitivity nor to
specify where strength reductions are occurring relative to the fluke. Rocker
(1977) found about a 20% reduction in capacity from these effects. Valent
(1978) analyzed field data from embedment anchor tests in calcareous ooze,
pelagic clay, and terrigenous deposits. He found the data from the tests in
calcareous ooze to be inconclusive but suggestive of significant capacity re-
duction. The reduction in capacity found in the pelagic clay was 30% and
in the terrigenous material the reduction in capacity was 20%. It is unfortunate
that the changes that occur in the soil during penetration and keying cannot
be accounted for systematically. With the field data available it has not been
possible to determine a relationship between soil type and sensitivity and the
reductions observed. In a soil with a particularly high sensitivity (that of the
calcareous ooze was 10), the reduction in the limiting breakout factor appears
to be severe. Conversely, in a soil with very low sensitivity, no reduction in
21

the limiting breakout factor may be found. It may also be possible to obtain
the ideal condition in the field by leaving the anchor unloaded after keying
until the soil regains the strength lost during penetration. It should be stressed
that the problem is not a lack of knowledge about breakout factors but rather
a lack of knowledge about soil strength after penetration and keying.
In view of the fact that a semitheoretical approach to this problem cannot
be developed Valent (1978) has suggested using a single empirical correction
factor for different sediments to account for these effects. The factors would
modify the undrained shear strength used in Equation 1. The factors recom-
mended by Valent for short-term capacity are: f = 0.8 for terrigenous silty
clays and clayey silts, f = 0.7 for pelagic clays, and f = 0.25 for calcareous
ooze. For calcareous oozes the factor is very low, but should be used until
data supporting a higher value is available.
A term, YbDA, for the weight of the soil above the anchor is also included
in short-term holding capacity equations. There are several reasons to doubt
that this term applies to anchors in submerged soils such as seafloor soils.
An identical term is used in pile capacity equations for cohesive soils to account
for the contribution to the pile capacity by soil displaced by the pile; a buoyancy
term that increases pile capacity just as the weight of the pile reduces the
capacity. For embedment anchors little soil is displaced by the anchor and
as a result any buoyancy term would be negligibly small as is the anchor weight.
The equation for estimating short-term holding capacity in cohesive soils
would therefore be
F = N A fs (0.84 + 0.16 B/L) (6)C u
where f = correction factor to account for soil disturbance
The value of N is usually provided in a graph of this factor versus relativec
embedment depth, D/B. The value of N increases as depth of embedment
increases until deep behavior is obtained. The work of others (Ali, 1968; Kupfer-
man, 1971; Bhatnager, 1968; and Adams and Hayes, 1967) has shown that the
22
, ___ S

relative depth at which deep behavior is obtained is also a function of soil
strength. As soil strength increases, the relative embedment depth at which
deep behavior occurs also increases. Taylor and Lee (1972) have graphically
presented these relationships. Figure 19 is similar to that presented by Taylorand Lee except the effect of suction has been included. The increases in N
care equal to the difference in N for deep anchors with suction (Figure 15)
and cand for deep anchors without suction (Figure 9). In doing this, an assumption
has been made that suction force is independent oi relative embedment depth.
This assumption is reasonable except for shallow anchors at D/B's less than
I.
Long-Term Holding Capacity
Estimating long-term holding capacity in cohesive soils is based on the
principle that behavior of cohesive and cohesionless soils is basically the same.
Hence, in cohesive soils with full drainage, the effective stress principle can
be applied using the drained strength parameters T and T. Long-term holding
capacity is defined as a situation where full drainage has occurred (excess
pore water pressures have been dissipated). Using this principle suggests that
holding capacity factors for drained cohesionless soils can be applied to the
analysis of long-term holding capacity in cohesive deposits. To verify this
extrapolation the multi-increment long-term tests were conducted. The data
resulting from these tests (Figures 9, 10, and 11) were compared to predictions
using the methods of Vesic (1969) and Meyerhof and Adams (1968). The values
of c and T were taken from Figures 13 and 14 knowing maximum past pressure
from the soil overburden and applied surcharge loads. Nc's were tak., as those
for long-term loading as given by Taylor and Lee (1972) and presented here
in Figure 20. A comparison of these results is given in Table 8. The short-term
capacities presented are th- same as those in Table 5 and were estimated
using undrained shear strengths and N 's for short-term loading from Figure 19.c
23
L

In Table 8 it can be seen that there is not much difference in the estimated
long-term holding capacities using the N 's of Meyerhof and Adams or thoseq
of Vesic. Out of the range of the test data, however, significant differences
are found in N values from these authors. This is shown in Figure 21 whereqVesic's N 's are plotted with N 's derived from Meyerhof and Adam's method.
q qThe N 's for Meyerhof and Adams method are based on buoyant unit soil weights
q m3 3that were varied from 640 kg/mn at 4) 20 degrees to 880 kg/m at 4 = 40
degrees.
Based on the test results of others (Esquivel-Diaz, 1967 and Bemben and
Kupferman, 1974), better agreement between experimentally obtained N 'sq
and analytical methods is found (Figure 21) using N derived from Meyerhof
and Adam's method. In addition to not fitting the data well, Figure 21 also
shows that Vesic's breakout factors increase even after considerable embedment
is attained. This is inconsistent with test data that show which breakout factors
remain relatively constant with increasing embedment after deep behavior
is attained.
Another comparison of using breakout factors for cohesionless soil in
long-term analysis of cohesive soils is made in Figure 21 where N 's derivedqfrom the long-term multi-increment tests are plotted for comparison with
the theoretical values. The estimated friction angles for these tests range
from about 35 to 45 degrees. The results plot about Meyerhof and Adams Nqcurve for a friction angle of 40 degrees with two exceptions: tests 4 and 8.
These tests represent the extremes of the test parameters: a shallow anchor
in a highly overconsolidated soil, test 4; and a deep anchor in a normally con-
solidated soil, test 8.
In test 4 the measured capacity was almost twice that predicted. This
could result from the cohesion, c, being higher than estimated or from a lack
of full drainage, resulting in a partially undrained failure. Most of the error
is probably coming from the cohesion intercept, not a lack of full drainage.
The previous loads which were 88% and 76% of the failure load, were in place
for 29 and 47 days, respectively, without causing failure. These time intervals
seem long enough to achieve full drainage for an anchor only 75 mm below
24

.,...
the soil surface. While the data in Figure 14 could support use of a higherIcohesion value at the maximum past pressure of about 22 kPa, the difference
could be more associated with difficulties in measuring _ than the actual value
of c. Of importance is that the measured capacity of 38N was greater than
the prediction of about 21N; a safe error.
In test 8 the opposite occurred; the measured capacity was about one-
fifth the estimated capacity. A difficulty in analyzing these data is that the
test soil was loose (normally consolidated) but exhibited a high friction angle.
Based on the maximum past pressure, the estimated value of 4 from Figure
13 is 42 degreesi. This high value is not unusual for loose cohesive soils that
experienced low maximum past pressures. In this case the maximum past pres-
sure was only about 2 kPa. In loose sands at low confining pressure, similar
high friction angles are found. At failure, the fabric of these sands collapses
and only a relatively small volume of sand is involved in the failure (local shear),
compared to dense sands with equivalent friction angles where large volumes
of sand ark, involved in the failure (general shear). Consequently, design values
for these conditions are adjusted to account for these facts. In test 8 a similar
behavior may be responsible for the result observed. The N derived fromqthe test data would indicate a breakout factor for a loose soil was attained
contrary to the breakout factor associated with the estimated friction angle
of 42 degrees. This behavior can be deduced from other tests as well. At each
embedment depth, the calculated N 's increase with an increase in soil densityq
(increase in OCR): low N 's are found for loose soil, high N 's are found forq q
denser soil. In bearing capacity problems, the change in failure mode from
dense to loose soil conditions is handled by using cohesions and friction angle
tangents equal to two-thirds of measured values (Terzaghi and Peck, 1967).
A similar procedure should be used for anchors in loose soils. In regard to test
8 and shown in Figure 21, the determined Nq falls close to values derived from
Meyerhof and Adam's method for 0 25 degrees. The tangent of 25 degrees
is about one-half the tangent of the estimated friction angle of 42 degrees,
which gives some credence for making adjustments to the measured friction
j ~ angle in loose or normally consolidated clays.
25 _
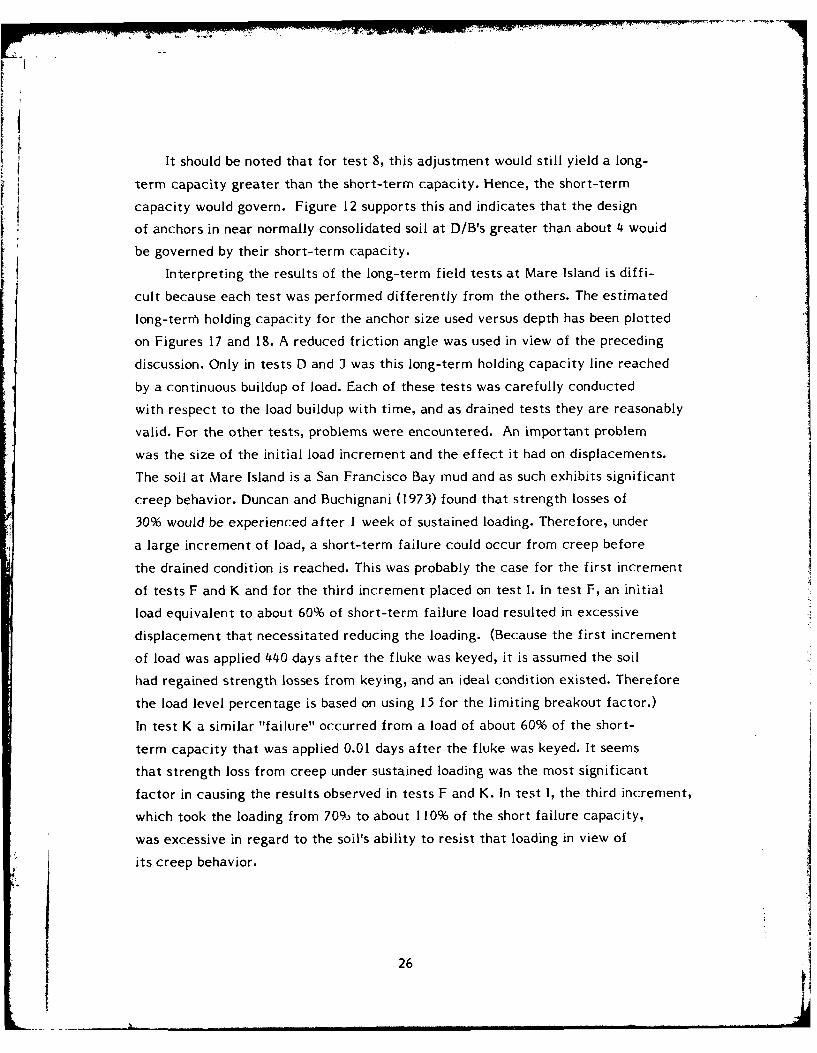
It should be noted that for test 8, this adjustment would still yield a long-
term capacity greater than the short-term capacity. Hence, the short-term
capacity would govern. Figure 12 supports this and indicates that the design
of anchors in near normally consolidated soil at D/B's greater than about 4 wouid
be governed by their short-term capacity.
Interpreting the results of the long-term field tests at Mare Island is diffi-
cult because each test was performed differently from the others. The estimated
long-tern) holding capacity for the anchor size used versus depth has been plotted
on Figures 17 and 18. A reduced friction angle was used in view of the preceding
discussion. Only in tests D and J was this long-term holding capacity line reached
by a continuous buildup of load. Each of these tests was carefully conducted
with respect to the load buildup with time, and as drained tests they are reasonably
valid. For the other tests, problems were encountered. An important problem
was the size of the initial load increment and the effect it had on displacements.
The soil at Mare Island is a San Francisco Bay mud and as such exhibits significant
creep behavior. Duncan and Buchignani (1973) found that strength losses of
30% would be experienced after I week of sustained loading. Therefore, under
a large increment of load, a short-term failure could occur from creep before
the drained condition is reached. This was probably the case for the first increment
of tests F and K and for the third increment placed on test I. In test F, an initial
load equivalent to about 60% of short-term failure load resulted in excessive
displacement that necessitated reducing the loading. (Because the first increment
of load was applied 440 days after the fluke was keyed, it is assumed the soil
had regained strength losses from keying, and an ideal condition existed. Therefore
the load level percentage is based on using 15 for the limiting breakout factor.)
In test K a similar "failure" occurred from a load of about 60% of the short-
term capacity that was applied 0.01 days after the fluke was keyed. It seems
that strength loss from creep under sustained loading was the most significant
factor in causing the results observed in tests F and K. In test I, the third increment,
which took the loading from 70% to about 110% of the short failure capacity,
was excessive in regard to the soil's ability to resist that loading in view of
its creep behavior.
26
I._ _

-, , ,- - . .. -. ,-1 -' "
Test 3, in contrast to the other tests, was not keyed prior to long-term
loading. As can be seen in Figure 17, this anchor was able to sustain a long-
term load of about 60% of its short-term capacity within 0.2 days of initial
loading. This result is quite unlike the results of tests F and K where initial
long-term loads of 60% of their short-term capacity could not be sustained.
Within 2 days the load on this anchor was at 100% of the short-term capacity.
However, this result is confounded by the fact 2 days were taken to build up
the load to the 100% level. What affect this had in terms of increases in the
undrained strength and, hence, in increases in the creep strength is not known.
The result of this one test is not sufficient for making any generalizations
about what to expect in terms of initial anchor response to long-term loads
between pre-keyed or unkeyed flukes.
CONCLUSIONS AND RECOMMENDATIONS
I. Suction under an anchor is an integral part of short-term holding capacity
in cohesive soils and should not be ignored. The limiting breakout factor in cohesive
soil under ideal conditions is about 15. For embedment anchors that are embedded,
keyed, and pulled short-term the holding capacity is 20 to 30% less than predicted
because of soil disturbance that is as yet not quantifiable in relation to soil
type and sensitivity. The weight of the soil above the anchor should not be included
in short-term analysis because of its buoyancy within its own medium.
Short-term holding capacity of embedment anchors in the field should be
estimated using Equation 6 and the holding capacity factors given in Figure
19. It is suggested that Valent's reduction factors be used. The reduction factors
are I 2 0.8 for terrigenous clayey silts and silty clays, f = 0.7 for pelagic clays,
and f = 0.25 for calcareous ooze. For laboratory or other ideal conditions (i.e.,
embedment anchors that have been keyed and then left until the soil has regained
its strength), the short-term capacity should be estimated using Equation 6
and the holding capacity factors given in Figure 19 without reduction factors.
Additional studies should be made of the problem of soil disturbance during
27
27
II

anchor penetration and keying so that strength losses can be quantified to allow
for a more rational approach to this significant problem. More pullout data
in typical ocean soils is required, and such data should be gathered as a part
of each service anchor installation.
2. Long-term holding capacity in cohesive soils can be analyzed using drained
strength parameters. For loose cohesive soils (normally consolidated), drained
strength parameters should be reduced by one-third before selecting breakout
factors to account for a local rather than a general shear failure. Breakout
factors (N q) developed for cohesionless soils can be readily applied to drained
analysis of cohesive soils. The N 's that were derived from Meyerhof and Adam's
theory compared favorably with N 's derived from the long-term model anchorqtests. Using the one-third reduction in drained strength parameters seems valid -
even in sensitive creep-susceptible soil-based on comparisons with the two tests
at Mare Island when drained failures were obtained. Because suction does not
exist under drained conditions, holding capacity factors Nc to be used with
the soilA cohesion should be those developed for the "no suction" case. Based
on the near normal consolidation of deep ocean seafloor sediments, long-term
capacity will not be a critical factor; short-term holding capacity will usually
govern designs. Long-term holding capacity in cohesive soils should be estimated
using Equation I and the holding capacity factors of Figures 20 and 22. For
loose soils drained strength parameters should be reduced one-third as they
are for bearing capacity analysis. To determine N 's the friction angle to useqin Figure 22 should equal the arc tangent of two-thirds the tangent of the measured
friction angle. In cohesive soils that are not creep susceptible, long-term design
loads should be the lesser of the estimated long-term capacity and the estimated
short-term capacity.
3. Creep-susceptible soils require an additional consideration in regard to initial
long-term loading. An anchor in a creep-susceptible soil fails under an initial
sustained load considerably less (40% less in San Francisco Bay mud) than its
short-term capacity even though the long-term capacity based on drained strength
28
n n. ,. mnm nl n nal l I II I I i i i. . . ... . . . .. . . .. .

parameters is greater than the short-term capacity. This occurs because of
losses in the soil's undrained strength from creep under the sustained load before
a drained condition is reached. Creep is not expected to be a frequent problem
in deep ocean sediments.
Long-term design capacity in cohesive soils that are creep-susceptible
should be the lesser of the estimated long-term capacity and a short-term capacity
estimated from the creep rupture strength of the soil before drained conditions
are reached.
4. A Monte Carlo simulation or other statistical evaluation of the error to be
expected in predicting holding capacity should be made. This evaluation would
include the variances to be expected in soil properties, penetration prediction,
keying distance estimation, and holding capacity prediction. The results would
be recommended design factors of safety based on different scenarios of soil
investigation and problem analysis. In lieu of this type of input design factors
of safety are recommended consistent with present practice in bearing capacity
analysis: use a factor of safety between 2 and 3 depending on the nature of
the anchorage and the reliability with which the soil conditions have been deter-
mined.
ACKNOWLEDGMENTS
The author acknowledges Mr. H. 3. Lee for his support and assistance through-
out this investigation, Mr. R. E. Brannen for conducting the model anchor tests
and the finite element analyses, Dr. M. E. Katona for his assistance on the finite
element analyses, Mr. K. Rocker for conducting the long-term field tests, Mr.
F. 0. Lehnhardt for performing the soil tests, and Mr. J. E. Clausner for his
aid in the finite element analyses.
29

REFERENCES
Adams, J. I., and D. C. Hayes (1967). "The uplift capacity of shallow foundations,"
Ontario Hydro Research Quarterly, vol 19, no. I, i967.
Ali, M. S. (1968). Pullout resistance of anchor plates and anchor piles in soft bentonite
clays, Duke University, Soil Mechanics Series no. 17, Durham, N.C. , 1968.
Beard, R. M. (974). Status Report: Development of an expedient site investigation
tool and investigations in long-term anchor holding capacity, Civil Engineering
Laboratory, Letter Report. Port Hueneme, Calif., May 1974.
Beard, R. M., and H. J. Lee (1975). "Holding capacity of direct embedment anchor,"
Proceedings of the Civil Engineering in the Ocean/Ill, vol 1, Specialty Conference
of the American Society of Civil Engineers and the University of Delaware. New
York, NY, American Society of Civil Engineers, Jun 1975, pp 470-485.
Bemben, S. M., and M. Kupferman (1974). The behavior of embedded marine flukes
subjected to static and cyclic loading, Civil Engineering Laboratory, Contract
Report CR 72.0018. Port Hueneme, Calif., 1974.
Bhatnagar, R. S. (i969). Pullout resistance of anchors in silty clay, Duke University,
Soil Mechanics Series no. 18. Durham, N.C. , 1969.
Duncan, J. M., and A. L. Buchignani (1973). "Failure in underwater slopes in San
Francisco Bay," Journal of the Soil Mechanics and Foundations Division, ASCE,
vol 99, no. SM9, Sep 1973.
Erden, S. M. (1971). A study of the extent of the zone of disturbance of anchors
in loose soils. M. S. thesis, University of Massachusetts. Amherst, Mass., May 1971.
Esquivel-Diaz, R. F. (1967). Pullout resistance of deeply buried anchors in sand,
Duke University, Soil Mechanics Series no. 8. Durham, N.C. , 1967.
30
. . . . . I. ,, . .. . ... . . .. . ...... .. . . . . . .. . .. . .. . . . . .. I I I-" II II .. . .. t

'.......... -- i--
Ghaboussi, J., and E. L. Wilson (1971). Flow of compressible fluid in porous elastic
media, University of California, UC-SESM Report 71-12. Berkeley, Calif., Jul
1971.
Henkel, D. J. (1960). "The shear strength of saturated remolded clays," Proceedings
of Research Conference on Shear Strength of Cohesive Soils, American Society
of Civil Engineers, Boulder, Colorado. New York, N.Y., ASCE, Jun 1960, p. 551.
Kupferman, M. 0197 I). The vertical holding capacity of marine anchors in clay
subjected to static and cyclic loading, M. S. thesis, University of Massachusetts.
Amherst, Mass., 1971.
Meyerhof, G. G., and J. I. Adams (1968). "The ultimate uplift capacity of foundations,"
Canadian Geotechnical Journal, National Research Council of Canada, vol 5, no.
4, Nov 1968, pp 225-244.
Radhakrishna, H. S., and J. I. Adams (1973). "Long-term uplift capacity of augered
footings in fissured clay," Canadian Geotechnical Journal, National Research
Council of Canada, vol 10, 1973, pp 647-652.
Rocker, K. R. (1977). Reduction in embedment anchor holding capacity due to
sediment disturbance, Civil Engineering Laboratory, Technical Note No. N-1491.
Port Hueneme, Calif., Jul 1977.
Singh, A., and J. K. Mitchell (1968). "General stress-strain time function for soils,"
Journal of the Soil Mechanics and Foundations Division, ASCE, vol 94, no. SMI,
Jan 1968.
Taylor, R. J., and H. J. Lee (1972). Direct embedment anchor holding capacity.
Naval Civil Engineering Laboratory, Technical Note N-1245. Port Hueneme, Calif.,
Dec 1972.
31

Terzaghi, K., and R. B. Peck (1967). Soil mechanics in engineering practice, Second
Edition. New York, N.Y., John Wiley and Sons, Inc., 1967, p.222.
Valent, P. J. (1978). Results of some uplift capacity tests on direct embedment
anchors, Civil Engineering Laboratory, Technical Note N-1522. Port Hueneme,
Calif., Jun 1978.
Vesic, A. S. (1969). Breakout resistance of objects embedded in ocean bottom,
Naval Civil Engineering Laboratory, Contract Report CR 69.031. Port Hueneme,
Calif., May 1969.
Wilson, E. L. (1965). "Structural analysis of axisymmetric solids," American Institute
of Aeronautics and Astronautics Journal, vol 3, no. 12, Dec 1965, p. 2269.
Yen, B. C. (1975). Deep anchor long-term model tests, Civil Engineering Laboratory,
Contract Report CR 76.003. Port Hueneme, Calif., Dec 1965.
32

Table 1. Estimated Long-Term Creep Strain in Percent for Two TypicalDeep Ocean Soils at Several Stress Levels and Time Periods
Time Long-Term Creep Strain () at Following
Type of Soil Period Deviator Stress LevelsaJ
4 (yr) 0.3 0.5 0.7
Pelagic Clay 1 0.7 1.7 4.12 0.8 1.9 4.55 0.9 2.2 5.1
i0 1.0 2.4 5.6
Calcareous 1 0.3 1.1 3.5Ooze 2 0.3 1.2 3.8w - 91% bj 5 0.4 1.3 4.1
c 15 kPa- 10 0.4 1.4 4.4c
Calcareous 1 0.3 1.2 5.3Ooze 2 0.3 1.4 6.2w -86%-' 5 0.4 1.7 7.6oc =38 kPa c 10 0.5 2.0 8.9
01 03) where (a I - o 3 ) is the principal stress difference
( Co - 03)f and (a I - G3)f is the principal stress difference at failure.-(v = water content.
c
= consolidation stress.
Table 2. Summary of Test Soils Characteristics
Soil I Soil 2 Soil 3 Soil 4Characteristics Tests 1-7 Tests 8-9 Tests 10-19 Tests 20-26
(CEL) (CSULB) (CEL) (UM)
Specific gravity 2.7 2.7 2.6 2.7
Liquid limit,% 53 23 32 115
Plasticity index,% 22 6 8 61
Unified Soil MH CL/ML ML CHClassification
33
t

Table 3. Summary of Short-Term Anchor Tests
Anchor Undrained Breakout CalculatedTest Diameter D/B Shear Strength Apparent Load, I olding Capacity
(mm) Strngt OC N Factor, N
CEL
1 100 5 2.04 2.1 245 14.8
2 100 5 1.58 1.6 215 16.7
3 100 5 1.51 1.6 205 16.7
4 100 5 1.70 1.8 195 14.2
5 100 5 1.65 1.7 220 16.7
6 100 5 0.92 1 135 17.8
7 100 5 1.23 1.3 170 16.8
CSUIB
8 76 5 0.81 1 49 13.2
9 76 3 0 a 5.60 1 350 13.8
CEI.
10 50 1.5 0.20 1 6.7 16.4
11 50 1.5 0.53 2 14 13.2
12 50 1.5 1.05 4.5 27 12.8
13 50 1.5 1.35 10 44 16.2
14 50 3 0.29 1 8.1 13.7
15 50 3 1.10 2 36 15.9
16 50 3 1.35 4.5 43 15.8
17 50 3 2.07 10 71 17.0
18 50 6 0.48 1 13 13.4
19 50 6 1.23 2 35 14.0
UNM
20 76 2.1 2.8 NA 16 6.4
21 76 2.1 6.2 NA 51 9.2
22 76 2.1 4.8 NA 42 9.8
23 76 4.1 9.7 NA 125 14.6
24 76 4.1 7.6 NA 92 13.7
25 76 6.1 8.3 NA 115 15.7
26 76 8.1 11.7 NA 161 15.5
aAchieved with surcharge pressure.
34
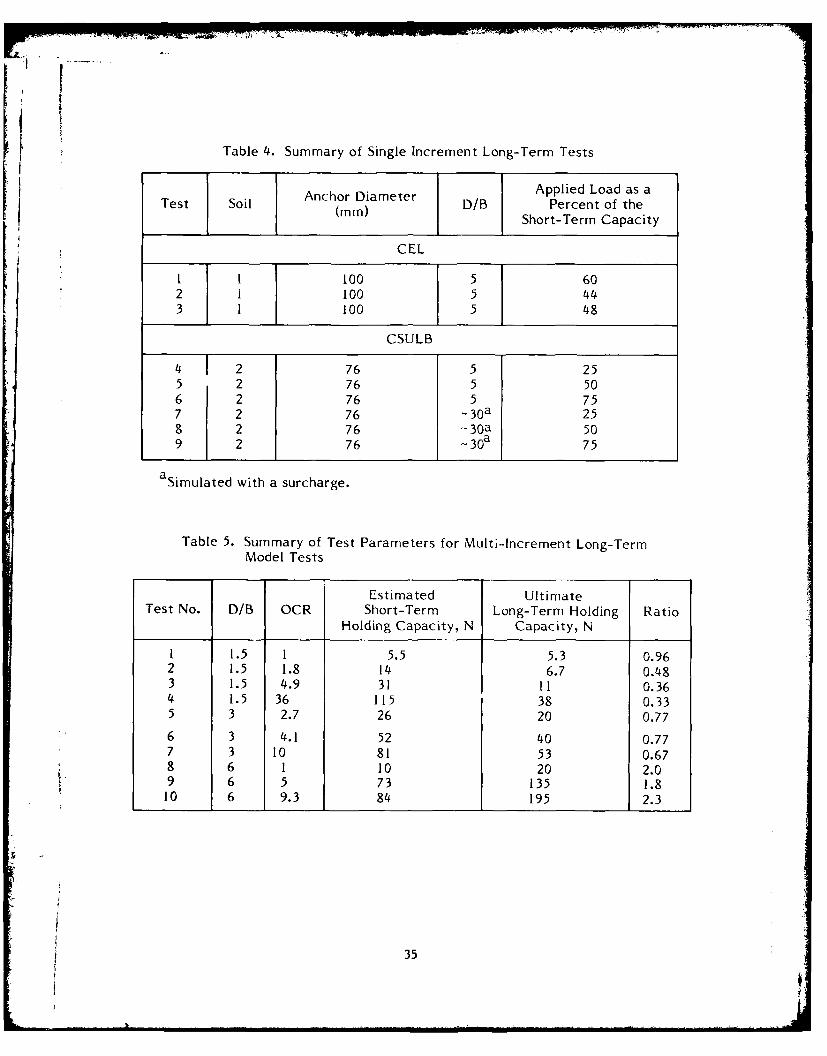
Table 4. Summary of Single Increment Long-Term Tests
Anchor Diameter Applied Load as aTest Soil (mm) D/B Percent of the
Short-Term Capacity
CEL
I 1 100 5 602 i 100 5 443 1 100 5 48
CSULB
4 2 76 5 255 2 76 5 506 2 76 5 757 2 76 - 30a 258 2 76 -30a 509 2 76 - 3 0 a 75
asimulated with a surcharge.
Table 5. Summary of Test Parameters for Multi-Increment Long-TermModel Tests
Estimated UltimateTest No. D/B OCR Short-Term Long-Term Holding Ratio
Holding Capacity, N Capacity, N
1 1.5 1 5.5 5.3 0.962 1.5 1.8 14 6.7 0.483 1.5 4.9 31 11 0.364 1.5 36 115 38 0.335 3 2.7 26 20 0.776 3 4.1 52 40 0.777 3 10 81 53 0.678 6 1 10 20 2.09 6 5 73 135 1.810 6 9.3 84 195 2.3
35

Table 6. Soil Indicies at Mare Island Test Site
Soil Index Value
Specific Gravity 2.7
Liquid Limit, % 100
Plasticity Index, % 50
Sensitivity 4
Unified Soil Classification MH
Table 7. Summary of Mare Island Long-Term Field Tests
Fluke Keying Keyed Maximum DepthIen t Penetration Load Depth Long-Term Failure
Identification (m) (kN) (m) Load (kN) (i)
D 3.6 6.9 2.7 8.7 1.4
F 3.5 7.0 2.6 5.8 1.9
G 3.4 6.2 2.7 4.1 NA
1 3.5 7.1 2.8 6.7 2.3
3 3.6 NA NA 8.3 1.8
K 3.2 7.1 2.8 3.9 2.1
36
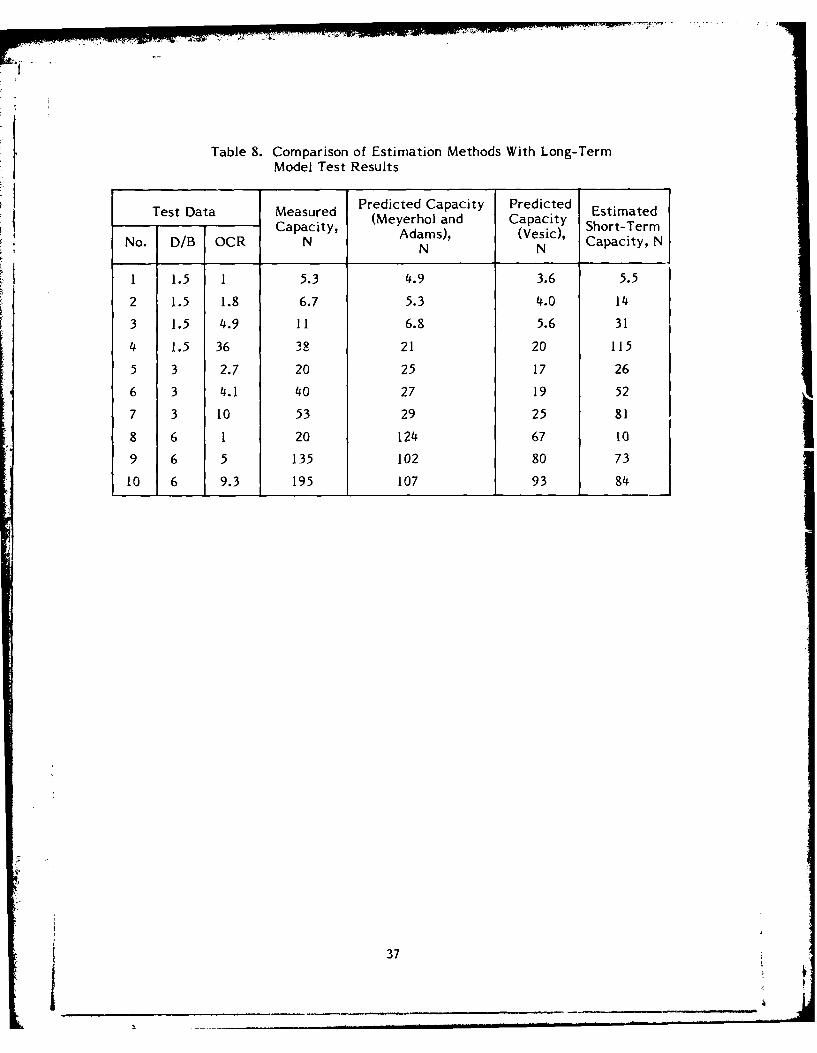
Table 8. Comparison of Estimation Methods With Long-TermModel Test Results
Test Data Measured Predicted Capacity Predicted Estimated
Capacity, (Meyerhol and Capacity Short-TermD/B OCR N Adams), (Vesic),
No. N N Capacity, N
1 1.5 1 5.3 4.9 3.6 5.5
2 1.5 1.8 6.7 5.3 4.0 14
3 1.5 4.9 11 6.8 5.6 31
4 1.5 36 38 21 20 115
5 3 2.7 20 25 17 26
6 3 4.1 40 27 19 52
7 3 10 53 29 25 818 6 1 20 124 67 1o
9 6 5 135 102 80 73
10 6 9.3 195 107 93 84
37

'5. -
3 Empirical
Time (min)
Figure 1. Comparison of observed and empirical strain versus time of apelagic clay in undrained shear creep at different shear stresslevels.
0 ___________________________________
0.47
.0.63
Empirical 1%
4 ac 2.20 psi"? -91%
5 -110 100 1,000 10,000
Time (min)
Figure 2. C&-mparison of observed and empirical axial strain versus time of acalcareous ooze in undrained shear creep at different shear stresslevels.
38

20--~gj 9W
200
0
FlukeTests Diameter
5 CEL 100 mm
0CEL 50 mmim 76 mm
SCSULB 76 mm
shortterm ests.Relative Embedment Depth, 20 5 3
Figure 3. Plot of breakout factor N versus relative embedment depth for
c*
39

anchor shaft
0
0 o-- probes
anchor 0fluke 0 0 0
C 00
0
0
Figure 4. Location of pore water pressure measurement probes for tests 3,4, and 5 relative to the anchor fluke.
Test 5 (CEL)Load= 5 3N
+0.02
+0.05
+0.10
anchor plate
equi-pressure-0.02 line
-0.01
I CL
Figure 5. Pore water pressure distribution around anchor plate normalizedby the pressure on the plate.
40

--
*1.
0E
UU E
6 L.4-
C0
4-,C
EL.UC
U,
-EE- Ee~~
~;U,
~,,0I.. ~.
>4-
4--
O~.CuU
4.,L.
00 0
N N
(WW) iu~w~.,sjdn0
41

+4 _______________________________
+2
1 radiu boeo
anchor
0 -2
Tim abomm) cor
at~~~ twoiu bocaion neanatethncor
-4 1
1S L2 Testsa oatryTet
0~
S CS LBT sti 6* O Q- o\
0
10- 3o. 0
00
101 102 103 104 105Time (min)
Figure S. Rate of displacement versus elapsed time.
42
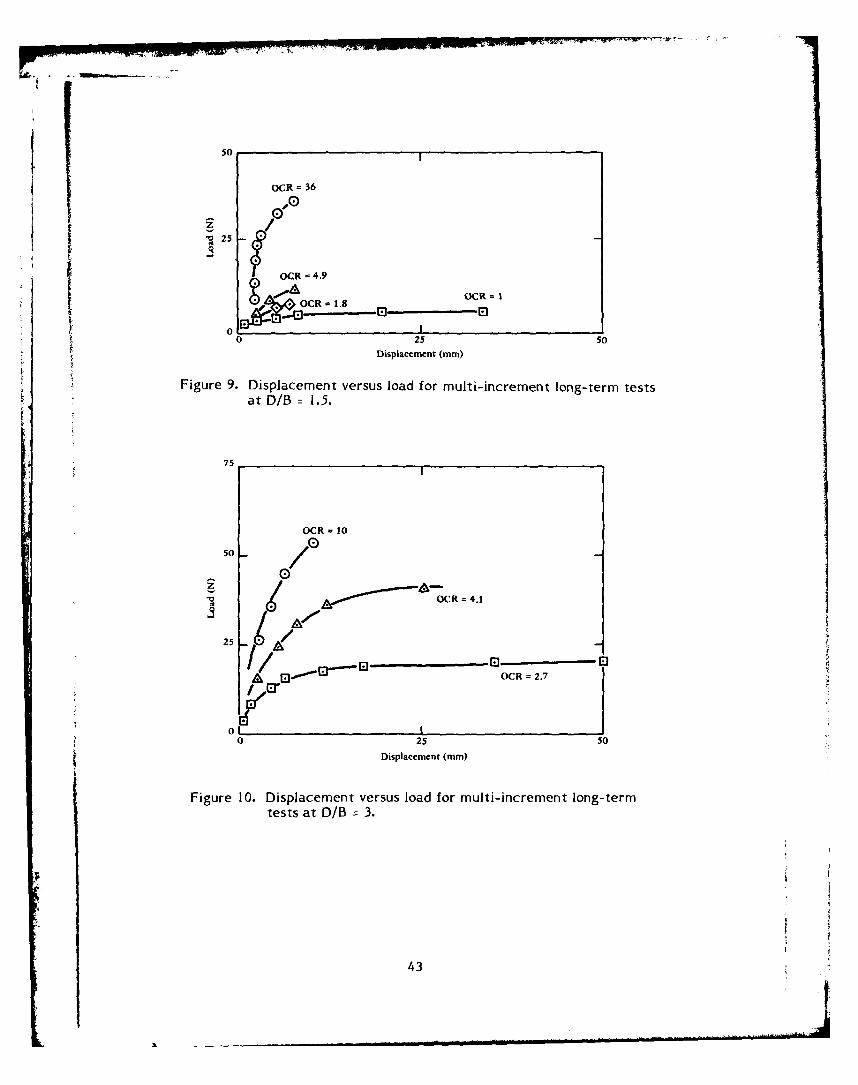
OCR 36
*~25
*1 OCR =4.9
OC -1.8
0 25 50
Displacement (mm)
Figure 9. Displacement versus load for multi-increment long-term tests
at D/B =1.5.
75______________________________________
OCR - 10
500
6 OCR =4.1
25 6A
A E)OE OCR= 2.7
01 Displacement (mm) 5
Figure 10. Displacement versus load for multi-increment long-termtests at D/B 3.
43

200
7' OCR 9.3
175 -
150
7'I/
,o /
I 'OCR =5125
IA
S100
75/
25 / OCR = 1
I i I
0 25 50 75 100
Displacement (mm)
Figure It. Displacement versus load for multi-increment long-termtests at D/B = 6.
44

3.0 I
2.5
1.0
2.®.B 3 / =
00
COC
0.545

25
300
C \0.2 35
C
0
45
1 10 100 200
Maximum Past Pressure (kPa)
Figure 13. Drained friction angle versus maximum past pressures forsoil used in multi-increment long-term model anchor tests.
000.5
c 0 .0 5 pm
0 10
0 15 30 45 60
Maximum Past Pressure (kPa)
Figure 14. Cohesion versus maximum past pressure for soil used inmulti-increment long-term model anchor tests.
46

115
10/
Figure 1. Lodigraoediet onrof fluerid e fl w it frm inalticlmn model
for co 10sin oral y hsctonoiae.eiet
20____________________________________47___

*( Tes D.
1 estimated long-term
\ capacities
T 21
A229.2 16011 116
!.7::10460 78
o 2 33 78 5s8
10.1 2.4mean of short-term
;. . 0:60\ capacities1 .1 0.1 0.1.0
YNA Numbers indicate length ofloading in days.
4
Notes
F - Initial increment too largej- Not keyed under short-term load
5 1 -II I0 2.5 5.0 7.5 10.0
Load (kN)
Figure 17. Long-term tests at Mare Island during which the short-termcapacity was exceeded under long-term loading.
48
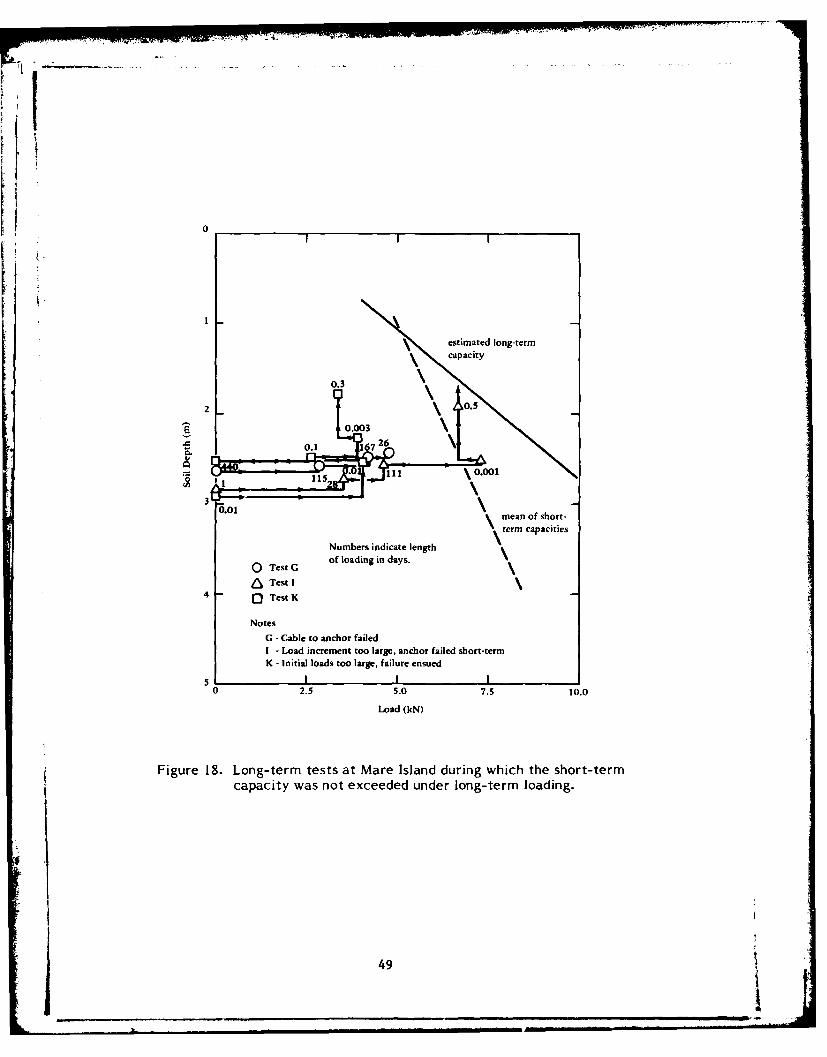
m ~~ ~~ . . . . . .... .. . . . . . . . . .. . . . . . . • • '
70
estimated long-term
0.3 a
00.00
\ mean of short-term capacities
Numbers indicate length
of loading in days.
A Test I4 0 Test K
Notes
G -Cable to anchor failedI - Load increment too large, anchor failed short-termK - Initial loads too large, failure ensued
0 2.5 5.0 7.5 10.0
Load (kN)
Figure 18. Long-term tests at Mare Island during which the short-termcapacity was not exceeded under long-term loading.
49

i
20
15
z
10
.a_.
0
0 I0 2 4 6 8 10
Relative Embedment Depth, D/B
Figure 19. Short-term holding capacity factors for ideal conditions incohesive soils under short-term loading.
50

8
Iz
6 4
th 6
2 ,
0
U 51

-0 CL
0 0i
El~
.0*-0 -Y4-
I0 'a
AI
b J314 nUej
52j

___ __ __ ___ ___V__
_ _ _ _ _ _ _ __in_ _ _ _ _ _ A4
-0
'S..
N'1031AA31:tdv) Buplo
53,

DISTRIBUTION LIST
AFI HQ PRI FS Washington I(R P Reid)AFB AICL'('/XR.'l nda II Ft.; ('ES('H. %%right-Pattermin. HQ'I.Icti..I Ai Cmd (R. F, Fisher). ILangle AF:B VA:
NIA('ID* (Col. 1P. ihon pson) Scott. LI.: SANISO(NINNI: Norton AF B (CA: Stinfo LijbrarNx Offutt NE.AR('IICSULIAB Ctide 54T. San D~iego. CAARMY B\II)SC-RF (H. Mclellan) Hunt%\ ille AL.: l)AEN-NICE-I) 'ashington DC: Tech, Ref. Div.. Fort Huachuca.
AZ-\RMY C'OASTAL. ENGR RSCtI CF'N Fort Bek oir V A: R.J iho)\%ski.t Fort Belvolir VA.-R,\NY CORPS OIF NGINFI:RS NIRI)-Eng. I)i%..(Omatha NI-: Scat tlc Dist. LI brar%. Seattle WAARMY CRRFL. A. Kos.,es. Hanoiver NHA.RMY~ I-N( IVIN'NLEI)-S. HunmsIlle AL: Finded-Sr. Huintsville. Al.
ARMY L.N( \%AAURWAY S EXP SIA ILihrar%. Vicksburg NISARNMY 1: \(R DISTU. LibrarN. Portland OR-RN I N VIRON. HYGIENE AGCY Ater Qual I% IDoner). Aberdeen Pi-iw Ground. NID
ARMN NIAIEFRIAI.S & NIECHANICS RFSEARCH CE NTER D)r. Lentle. \\tcrtoun NMAARMY Nh MBIL EQLLIP R&D) CON)M Nr. Ceviasco. Fort BelvoirM 1I)ARMY NI* RANSIP)RTATION SCHOOL NIAJ I Sskecne\,. ('ode ATSP ('1-TF Fort Eustis VAASSLI SECRIITARN 01: THE NAVY Spec. Assist Energ (P. Vaternian?. Nashington DC': Spec. Assist Submarines.
NN ashinglon IX'B URE11AU OF RFCL.ANIATION CodJe 1512 (C. Sclander) D~enier (0C'INCI -ANI ('i\ ii Engr. Supp. Plans. Ofr Norfolk. VA('NM NNIAI1 084246 (Iicterle) Wash. DC'('NO Code \OP-964. Washington DC(: Code OP 323. Washington DC(: (Code OP 987 %a:shington D)(: (Code OP-413
%Wish. LX': C'ode OPNAV )9B324 1(H): Coide OPNAV 22. \%ish L)C: ('ode OPNAV 23. Wish DC(: OP987J &iBoosrnan. Pentagon
('0)NCBPAC Operations Off. Niakalapa HI'OMNNAVBEACH PHI BREFTLRAGRU ONE San LDiego ('A
('ONINAVNIARIANAS ('ode N4. Guamn(( NI( CEANSYSPA('SCE. Pearl Harbor HIDEFE:NSE I)('UMFNTATION ('TR Aleitandi'ia. VAI)FFENSt: LN'ELI.GEN('E AGENC'Y LDir.. Vashington DC(l)LSIE Atm% Logistics Nlgt ('enter. Fort L~ee. VA[IN A S.IL. % ahington LDCDODl F \Plosises Safety Board ( L.ibrar\ ' .%ashington DC'L) D~r. CohenIII NSRIX' (ode 4111 (R. (ijerich). Bethesda NIL)MARINE: ( )RPS HQS ('ode LIE-2. Wishington D)CMCAS ('ode S4. Qiiantico VANI('IE( \SAP RF:P. Quantico VA: P&S LDiv Quantico VAMIILIARY SEALLFI ('ONINIANI)Washington LDCNAL: PM 0 Sigonella SicilyNAS (C0. Guantanamno Bit) Cuba: ('ode 187M0. Bruns\% ick NI F: LDir. Itil. INis _ Bermuda: ENS Buchhol/. Pensacola.
Fl.: P% 1). \% M~ott Giroe PANAIL1. RFSFAR('H C'OUNCIL Naval Studies Board. Washington D)CNAVACI Mod. London UKNAV('(.1 )SSYSL AB ('O. Panama City Fl.: Code 423 (1). Good). Panama C'ity FL: C'ode 715 0i. Nlittlcmant Panama
('its. 1:1: ('ode 715 0J. Qtuirk) Panamna City. FL: ('ode 772 tC B Kocsv ( Panama C'it\ Fl.: Librars Panama C'it\ . Fl.NAV(( )NIMAREANISTRS'I A SC'E Unit I Naples Italy\AV('()NIISTIA ('ode 401 Nea Nlakri. GireeceNAV F IRAPR( )IEVCEN Tech. LibraryNAVEDL)"IRAC'FN Engr D~ept (('oide 42) Nesrt. RINAVFI.FXSYS('ONI ('ode PNIIF-I24-6!. Washington LD(NAVFAC PV.(. Brassd) Wales UKNAVFA('PV.O. lesses DENAVFACENGCOM ('ode (043 Ale~tandria. VA: ('ode ((44 Alexandria. VA: ('oide t0451 Alcxandria. VA: ('ode (W53).
Potter) Alcxandria. VA: ('ode (454B Alemandria. Va: C'ode t04133 Alexandria. VA: (ode 0(4H5 Alc~andria. VA:(Code 10(1 Alexandria. VA: ('odte 10133 (J. L1eimanis) Alestandria. VA: Code 10(23 1 NI. C'arr) Alcxandria. VA: ('ode1023 (F. Stevens) Acietandria. VA: Codle 2t014 (M~r. Taam(. Pearl Harbor HI: NMorrison Yap. C'aroline Is.: P) \knresser Alitandria. VA: PC'-22 (F. Spencer) Alexandria. VA: PL~-2 Ponce P.R. Al~nra VA
54

NAVFACFNGCONI - CHES D)IV. (ode 101 %ish. D)C: Code 405 %ash. I)C: Scheessele. Code 402. "ash. )
Norfolk VANAVFACENGCOM - NORTH DIV. (Boretskl Philadelphia. PA: CO: C'ode 09P tlCI)R AlJ Ste\%artl (Code 1028.
RI)T&EI(). Philadelphia PA: Design INiv. (R. Masinol. Philadelphia PA: RoIC('. Contracts. (Crane INNAVEACENGCONI - PAC D)IV. (ode 09[Xi uIDonosan(. Pearl Harbor. HI: ('oide 4(02. RIYI'&E. Pearl Harbor HI:
C'omnmander. PeatlI H-arbor. HINAVFACENGiC()N1 - SOUTH D)IV. (ode 'A). RIY&I&EO. Charleston SC': D~ir., Ne\% Orleans LANAVFACENGC)M - WEST DIV. 09P/20: RIYI&EI.( ('ode 2011 San Bruno. CANAVEACENGCOM CONTRACT 01CC. South%\est Pac. Mianila. PI: ()ICC/RoIC('. Balboa ('anal Zone: R( I(CCAF
Guam: R01('(' ANTD lIV.. Norfolk VA: R( (((C. D~iego Garcia Island: R( l('(. Keflavik. Iceland: RoWfC.Pacific. San B3ruo1 (CA
NAV FORCARI B Commander (N42). Puerto RicoNAVHOSP 1.1'R. Eksbernd. Puerto RicoNAVOCEAN( ode 160W Bat% St. L.ouis. NISNAVOCEANSYS('l-N (Code 409 (1). Gi. Mloore). San Diego (CA: Code 4473 Basside I ibratr. San IDiego. CA: Code 52
(H. 'lalkington) San D~iego CA: Code 5204 (J. Stachi\\ 1. San D~iego. CA: C'ode 5214 (H. \k heeler). San D~iego CA:('ode 5224 (RiJones) San D~iego CA: (Code 6565 (Tech. Lih.). San D~iego (CA
NAVPGSC0I. Code 61 W1. (0. \k lon( Montere\ ('CA: 1). Leipper. Nlontere CA: F. Thornton. Montere% CA: J.Gjarrison Niontere\ ('A: LCI)R K.('. Kelle\ Niontere% CA
NAVPHIBASE (C0. A('B 2 Norfolk. VA: (Code S31'. Norfolk VA: I)ir-. Amphib. Warfare Brd Staff. Norfolk. VA:01('. U!'ONE Norfolk. Va
NAVSC()LCECOFF ('35 Port Hueneme. CA: ('0. ('ode ('44A Port Hueneme. ('ANAVSFASYSCONI Code ((325. Program Mgr. "aishington. DC(: ('ode 00(' (1.1'R. MacDougal). Wkashington DC(:
(Code SEA OOC \%ashington. D)CNAVSE(' (ode 6034 (L~ibrar'y). "Washington DC(NA VSH IPREPI:A('I ihrary. GuamNAVSHIPYI): ('ode 202.4. Long Beach ('A: ('ode 4401 Por'tsmouth NH: Salvage Supt. Phila.. PA: Tech 1.ibrar\.
Vallejio. ('ANAVSTA ('0 Roosevelt Roads P.R. Puerto Rico: Engr. D~ir., Rota Spain: P~k 0. Keflavik Iceland: RO1('(. Rota Spatin:
Utilities Engr Off. (I.TJG A.S. Ritchie). Rot SpainNAVSTlA BISHOPS PO)INT Harbor Clear. Unit oine. Pearl Harbor. HINAVSL BASE I.TJG D.W. Peck. Groton. CTNAVSL'REPAC (ode 3(0. San D~iego. ('A
NAV1A PNCEN Code 2636 OW. Bonner). China Lake ('ANAV~k PNSTA E.ARL.E Code (192. C'olts Neck NJ: ENS G.A. F.~y alibrook CA.NAVXDIVlNGUL' rA.M. Parisi. Panama C'ity l.N('B(' ('lAOIC Port Huenenme ('A: ('ode 101 Davis% ille. RI: ('ode 155. Port Hueneme ('A: ('ode 156. Port Hueneme.
('A: P%\ Engrg. Gulfport NISNC'R 203. C'ommanderNNI('B 133 (ENS '1 V. Nielen): 5. Operations Dept.: 74. (CO: T1HREE. Operations (1ff.NOAA ILihrar Rockisille. MD)NORI)A ('oide 410 Ba% St. Louis. NIS: ('ode 440 (Ocean Rsch Off) Bay St. Louis NISNRI ('ode "X) 0O. \Nalshi. ltkashington DC(: ('ode 8(441 iR.A. Skop?. Wkashington DC': Rosenthal. ('ode 84401. \kash.
DcNA\( )('ANSYS('l'N Hassaii Lab (1). Moore). Ha\%aiiN' ('ode 131 Nei,% London. CTU: ('ode EAI 23 tR.S. Munn). Ness London CT1: ('ode S332. B-8(0 (J. 'ilco~i: (Code
I'A 13 (G. Dt: lit (ru/1. Ne%% london CTI(K'EANAV Nlangmt Info lI.. Arlington VA(KE-ANSY SIAN'! I.1 A.R. (iiancola. Norfolk VAOFFICE SE('RE'I ARYOF D)EFENSE OASI) (MRA&l.( Pentagon (T. ('asbergl. Washington. IDCONR ('DR Harlett. Boston MA: BROF)F. ('0 Boston NMA: ('ode 48(1. Arlington VA: ('ode 481 Bat% St. Louis. NIS:
('ode 74HKIE Arlington VA: D~r. A. Lautfer. Pasadena ('APNMT( Patt. (Counsel. Point Mlugu (CAP'~kC A('EOffice iIlTJG St. Gjermaint Norfolk VA: ('0. (Great Lakes IL~: Code 121K' (Lib'ar (San D~iego. ('A: ('ode
128. Guam: ('ode 2W0. Oakland ('A: Librar% . Subic Bay. R. P.: XO Oakland. ('ASP('( (ode 122B. Mechanicsburg, PA: P%%(Code 120(1 Mechanicsburg PAU.S. ME1 'R(HANT MARINE ACAD)EMY Kings Point. NY (Reprint Custodian)US GiEO)LOGICAL. SU'RVEY. Off. Marine Geology. Piteleki. Reston VAU'SCG IG-E(V( Washington D~c: i(,-ECV/61) ( Burkhart) V. ashington. DC(: G'EOE-4/61 IT. IDossdi. V. ihington I)'
55

USCCG AC AIFNIN 1.1 N. Stramandi. Nec% london CTL SCC. R&D C)ENT'IER CO ( ,roon. ("1:1). Nlot heri'a. CGroloi (A': IAJI6C R. IDair. Giroton CUT'L SN A Occan S,,. I:ng Dept (Dr. Monne% )An napoili. %IlD: P'th 1) 1 ngr. i%. W. Bradford) Annapoli% MD)A11FERICAN L'NIV IRSITY 'A ashingbon IW' (NI Norton,(Cl.W. DEPI 01: NAVIGAI]ON & OCEAN IDFV. Sacramento. CA (G Ari'mtrongt('AlF S1K ARITIME ACADEMY Vallejo. (CA tL.ibrai'\ ICAl.IFORNIA INS'1 ILI'UFF OF' I- 1:'NoI.OGN Pasa.dena (CA i eck Ref. Rmt)CAIFORNIA SlIATE FULNIVERSITYN lONG BEACH. C'A tCHI. APAI Ht lONG BIACH. CA (N FN)CATIHOIC U'NV. Nlech Engr D~ept. Prof. Nied/%%ccki. 'Aa~h.. IDCCO(I 1. 0 RAIDO S'I .'IE , IV.. fOOT'IHI HI. ('ANIPIS Fort C'olinsm (NeisollCO R (RNEF .1 UN I VEFR S IlItY h;tca N Y I(Se r iiI% D~ept. Fngr 1. i h,DAME ,S & MOORE lIBRARN L.OS ANGiEIIS. CADLKE I:,LNIV MEDICAl. (CENTER B. Niuga. D~urham \C: DURHAM. NC (VESICIE )RI DA ATlAN IIC UNIV ERSIY Nr )OCA RATO N . IT MC Al .IS'IER : Boca Ralon El1. io cean Flnpr Dept.. C.
I:IARII)A' T-C'HNOI.OGIC'Al. UNIVERSITrY ORI.ANI). El1. M ARTIMAN t(it RGIA I NSITITLA'1: 01:'.ECHNOF.( ( Y Atlanta GA (B. %Ia/antiINST1IlE FLTOF MARINE SCIENCE:S Morehead C'it\ NC tIiiectorlIOV. A S1IAE 11I NIVE RSIlY* Ames IA (CF Dept. Hand%)KEEN E. S'I A'I' ('(1.1.M EC Keene N H (Cunningham IlEHIGH UNIVERSHlY BIEUHIEHEMI. PA tMARINF (jE II CHNICAI. I 'NB.. RI('HARI)St Bethlehem PA
(Fritz Engr. I.ab No. 13. Bectdlet: Bethlehem PA l ~inderman I ib. No.311. I leck~iciner lL-IBRARY OF CONGRESS %\ ASHINCJON. l)C SCIENC'ES & TCH I)MAINE MARIIMENI AC'ADEMIY( %Wman) C'asline %IE:: C'ASI'INF. \Il- i I IBRARNI\11C'111ICAN 'rEC-(H N( -OCI('Al. IN IVERSHlY Houighton. MI ItHaas)MIr Cambridge MIA: Combridge MA tRni Mt-500.1 lech. Reports. I- ngr. Ilbi. r: ( ambridge NIAMA hitn)NAT[. AC'AIENIY tOF ENG AIEFXANI)RIA. VA iSF-ARIE1. JR.NORTHWEFSTERN L'NIV Z.11. Ba/ant I-Aanston 14.NN CITYC(OMINILNIY COI.IE61iE BROOKl.YN. NYiHBRARNNYS ENERGY OIEICE lib,'ar% Albanl% NNL NIV. N( IRE l)AME Katona. Notre Danme. INOREC.ON S'IAl'E LNIVKRSI*IN(IE D~ept Cra.e) C'or'alli'.. tR COMMt RNA I IS. OR W(H D(I P1 . litI I )I: C'oi~ali
R (School of O ceanogra ph%PEN NSN lVANIA Sl A'E I: NIV FRSITY S'IAl. 11.1V ,1. PA IS\N M) Rij: State ( ollege PA i Applied R~ch I abi:
UN IVERSIY PARK. PA (CoilOISKIPI'RI) 1: tNIVERSIIN Ilafa~ette IN 1leonairds: I .ala~ette. INs I AIIwhaclfl: I aatte~i. IN1 Wl I ngr I itlSAN DIEGOC( STATE 11'NI V 1. N oora n Sail D iego. ('A: D r. Kriislna moort h%. San D iego ('ASCRIPPS INSl IlUIK F OF 0C'IAN( )(RAPIN IA 1(11 I.N. ( A iADAMSiSE: A'*II+. LK Prof Sch\% aeglcr Seattle \% ASOLI HNN FKS'I RSCH INS] King. San Anlonio. IX: R. Iellait. SaIn Antonio IXSTIANFORI) INI F>RSI IN Fngr lib. Stanford A': SIANF:ORD. (ANi l)oA i ASiSIl 1: UNIV. 01t NIKA YO RK Buffalo. NY: IorI Schu) icr NN it ongobadlilIFKXAS A&N I UNIVERSIl I College Station IX (CI. Dept. Fierbichi: 'A.H I edhetter (ollege Station. I XLN IVEIRSI I N tIF (Al l RN IA BER KFIlN. ('A (( E D1)1" PU (iI'.RA IKi: BI RKIl I.N. ( A WC 1 PUT'.
NIf ICII IK I i: Be,'kele% ('A i Iept of Natal Arch. I: Berkele% ('A 11I Iiearom: DA\VIS. ('A ((T'I' 'l. IAN I ((R):I.IRMO RE. ('A 0IANN RFN('I1' IIRORI AB. 1tKAR/t: I a Jolla ('N IAcq. Dept. lib. ('-07r5( Mi.
Ituncatn. Berkelc% ('A: SAN IIG(. C'A. I.A JOll A. ('A ISI' R( (KItL NIVIKRSI I N Of' ( ONNIK(''lIC'I'' (roton 'I'i lnst. NMarine Sci. Iii'.rrUN\IV FKRSI I N OU II)' I A AREK IKV\ U'KS. 1)1K MIR. l \1 N ARIN I' OP1 RAl II INS. INtIKRI I/I N. v: %aL DI
(Dept of 0%i il I nginering. C'hessonI, NM% lRSIN OF HA'A AllI H INOIAIIU. i tSC'IlKN('K ANN I) IIK(H. D)IV.)L NI% I RSIIN'O (If IlINOIS NMet/ Ref Rm. Urbana If.: U RBANA. 11I tIDA\ISS(IN : It RBANA 1. II IBRARN I'
U RBANA N1 1 (NI 'AARK,: Urbana If- (Cf.K Dept. \N. CGambletLNMV FRSI I N OFIM NSSA('HL I'SF[I'S i Iferonemust. Amlhcr't MIA ('F D~eptLUNIV lRSI IN OF MIC HIGAN Ann Arlitr Nl tRicharttU NIV*I-RSIIN OF NI BRASKA-l.INCOI.N lincoln. NFK tRo%s Ice Shelf Pro~i.)INIV F RSI I N 01I NI ' HAMIPSHIREK DL'RHANI. NH OIAVOIFININ I- RSI IN O1 NI'A% MEXIC"O J NieI'.on-Ingr NI% & C'iiil S%- D~i%. Altiqterque: NI
I NI F: R SI IN 1)1 RHoI)F ISI.ANI) KINGSI'( N. RI d'AZIStI NVI'RSI IN OF So. C'AI IORNIA I'ni' So. Calif
56

UNIVERSITY OFTEXASIntNiinSiliha.PrtAknsXUNIVERSITN OF IEXAS AU AUSTIN A~tiln' IX (R. Olson)L NIV ERSITIYOF~ %AASH INGION Settle 'A A t(M. Sherift: SEATI*1lE1-. 'A AAPPI.IFD PHN SIC'S I.A[3t: SEAliL'[E.
W&A (MiERCHANT): SEATTLEF. 'A A (OCEAN ENG RSCH L.AB. GRAY): SEAl"I.E. %% A (PACIFIC MARINEENVIRON. L.AB.. HAL.PERN 1: Seattle 'A A (I . Lhngei'): Seattle, \% A Transportation. Construction & (jeom. IDiv
VENTURA COUNTY ENVIRON RESOU RCE AGENCY Venuia. CA Tech LiraryALEREI DA. YEE & ASSOC. Honolulu HIANIETEK Offshore Re%. & Engr D~i\ARCAIR CO. 1). Young. L~ancaster OHARV ID GRANT Ol.YMPIA. \\ AATl.ANTIC RICHFIEI)D CO. DALLAS. TX (SMITH)AUSIRALIA Dept. P\% (A. Hick%). NlellbourneBECHTFEt. CORP. SAN ERANCISCO. CA )PHEIS)BEL.GIUMl HAECON. N.V.. (GenmBEIHIEFHENI STEL. CO. IDisintlke. Bethelchem. PABRANDI IND)US SERV INC. J. Buehler. Hacienda Heighs C'ABRO\. N & C'AI.I)EI.l. E I Saundeis \kalnut Creek. CAHRO'A N & ROOXT Houston IX (1). %\ aid)CANAD)A Can-Dive Serv\ices iEnglish) North Vancouiver: library. Calgais. Albertui: lockheed Petro. Seri. ldW. Ne"
'Aesinhinster B.C.: lockheed Petrol. Srv. Ltd.. Ness 'Aestniinster BC: NMem Univ Ness foundland )Chairi). St John%:Nova Scotia Rsch Found. Corp. IDartrnotith. Nova Scotia: Surse~ or. Nenninger & Chenevert Inc .. lontical:'A arnock Herscv Prof. Srv .td. La Sale. Quebec
(CF BRAUN CO DuL Bouchet. MITrra Hill. NJCHEVRON OIL. FIEl.D RESEARCH CO. [.A HABRA. CA (BROOKS)COL-UMBIA GUL.FTRANSMIISSION CO. HOUSTON. I-X (ENGJ. 1.1.)CONCRETE TECHNOLO' GY CORP. TACOMIA. 'kA AMN)ERSON)III.INGiHANI PRECASTl F. McHale. Honoltul HII)RAVO C'ORP Pittsburgh PA ('Airight)I)URL.ACH. O'NEAI.. JENKINS & ASSOC. Columbia SCNOR%\ AYDIE'INORSKE VERITAS lirr.OsloEVAILUATION ASSOC. INC KING OFI P3RU SSIA. PA tIEDELA:tEXXON PRODUCTION RESE:ARCH CO Houstoa. UX. (ChaoFRA N C FDr. LDutert re. Bou logne: 1.. P1 is kin. Paris: Roger L .aC'roivs ParisG(YOECHNICAl. ENGINEERS INC. \kinchester. NIA P!aulding)(jOt II INC. Shad% Side N~l) (Ches. Inst. Dik.. "A. Paull)HAL.EY *N& AIMIRIC'H. INC. C'ambridge NIA (Aldrich. Jr.iHONEY%%EI.. INC. Minneapiolis NIN (Residential Engr Fib.)ITALY NI. ('aironi. Milan: Sergio Tattoni NMilano: Torino (F. l-ei)MIAKAI ()CEAN ENGjRNG INC. Kailtia. HIl.AMNI -IX)HERTY GE( ).O0iICAI. ( BSFRV. Palisade.s NYN )NICo~ ): Palisades NY tSel\%%n)I.IN 0EFSHORF ENGRG P. ('boi,%. San Francisco ('ALOCK H E 1 l ) NIISSII.ES & SPACE ('0. INC. I-,Trinible. Sunn% vale C'A: Nip- Naval Arch & M~ar Eng Sunns sa%:le.
CA': Sunn\\ale C'AN Rynessic/): Sunnyvale. CA (Ph illips)LO0CKHEEDOC'EAN I.ABORATO*RY San D~iego CA WE, Simpson)MARATH(ON 0H, L C0) Houston TX (C. Sea\ )MARINE CONC'RETE STRU'CTULRE-'S INC. NIFFAIRIE. IA tINGRAHANIMlC (LELIAND ENGiINEERS INC Houston IX (B. NMcClellandlNICI)()N NEl. AIRC'RALI C0). Dept 50t1 R.H. la~man). St l-ouis NI))MEI)AI.L. & ASS)C. INC. i.t. CGAFFEY 11 SANTA ANA. ('ANIFXI(() R. C'ardenasN1l01BII. PIPL{ LINE CO. I)AI.I.AS. I X \IGR OF ENGR (NACK)NIL 'SFR. RUTI+ I XiE:.\'A NT'\ oRTIH .NI) II HN\S'I ON NEN ORK tRIC'HARI)SiNI-% 'A/.AI.ANI) Ness Zealand Concrete Research Assoc. I ibrariant. PoriruaNI ,'\ PORT NE\AS SHIPBI.I) & I)RY D0CK ('0. Nessport Nesss VA T-ech. L ib.)N0M )RAN A."Thruim. ITrondheim: 1)-Il N( RSKF VL:RI'IAS (Rorent OsloIt: I. Foss. I slo: J. C'reed. Ski: Noseian
I ech L ni% I Brandt/aeg). I rondheim(KE :A N E:'NGINE:'ERS SAL SAL-IT0. CA tRN CKIt(KLIANi RESOURCE ENG. INC. HOL ST0N. IX tANI)E-RSoN,PACIFIC MIARINE lE11 'CHNOIOG6Y long Beach. C'A(%\ agnertP()RT11I.ANI) CLNI ENT ASSOC. SKO KIE. 11. )C0REL.Yt: Skokie It. (Rsch & Ic\ Ilab. lib.)
57

Pki SCON CORP IO~ SON. Nil) KFlA+iR)PUERTo RICO Puierto Rico (Rsch Pi.) N~~qe RR J BRO%% N ASSOCi MNcKeehan). Houston, 'IXRAND0 CORP. Saata MN.'Qi,,: C A tA. Laupa IRAYMOND INTERNATIONAL. INC. F (ollk Soil Tech D~ept. Pennsauken. NJSANDlIA LABORATORIES Librar% IDi%.. Livermnore CASCHU PACK ASSOC So. NOR%%A 1.IK. ('I SCH UPACK)
t SEATECH CORP. NIIANI. 1:l. 1PFRONIjSHEL DVELOPNENTCO.HoutonTX C. ellr~ n:Houston TX (F. Do~ k)
SHELL. Oil- CO. HOUSTION. TX (NIARSHAII: Hou%bonlTX (R. de Ct%tongr-ene): I. Boai. Hou%tn I'XSOUTH AMIERICA N. Nouci. Valencia. Venezuelaii S"A EDEN (ke reeb Inst: \'BB (librar%). Stockholmr TlDIE'k ATER C( NS" R. CO Norfolk VA (ffo~ ir)TR'A SYSTEMlS REDONDO BEACH. CA i l)AUUNITED) KINGDOM) A. lkenbon. London: Britikh Ernba%sN (Info. Offrj. %%a~hington DC: Cement & Concrete Assoc
%% exham Springs. Slough Bucks: I). lec. London: I). Nc%%. G. Nlaunsell & Partners. London: J. Derrington.london: I ibrar-. Hi isol: R. Rudham Oxford'hiie: Sha%% & Hation iF. Hansen). london: Taylor. \koodrom Consir(014131. Southal I. NI iddlc%e\': I a~lor. %*oodrim Constr ( St ubbs)(. SoLd hal . NlI ddklee In i. of Bristol ( R. Niorpan).Bristol
V.ESTINGHOUSE ElECI RIC CORP. Annapol% Nil) (Oceanic Di% Lib. Brxan)%\ISS. JANNEY. ELMSINR. & ASSOC Northbrook. It. cl).V . lPteiferi%\Nt CL.APP LABS - BATTEU..I-E I)LXBURY. NIA (LIBRARYi: Du~butr'. MA (Richards)"OOD1MARI)-CI.Y DE C'ONSULTANTS (A. Harrigan) San Francisco: PlYMIOUTH NIFL IN6i PA (('ROSS. 111)AD)AMS. ('APT- (R Ianine. (CAAl. SNIOOTS Los Angeles. (ABARA. JOHN I'. Lakc%%ood. ('0BRAHIZ la Jolla. (ABRo%\ N. ROBERT n'l~~ Al.BU'LLOCK La CanadaF HEU LZE Boulder CORT . BESI ER Old Sa~ brook CTIR.Q. PALNMER Kaitua. HIENERGY R&I ADI)N H. Sko\% ho. %Aashington. DC(-1..'%. NI ERNIEI. %%ashingion D)C\kNI lAI.BOT Orange CA
58