Identification of quantitative trait loci affecting reproduction in pigs1,2,3
BioMed CentralGenetics Selection Evolution
ss
Open AcceResearchQuantitative trait loci for resistance to trichostrongylid infection in Spanish Churra sheepBeatriz Gutiérrez-Gil1, Jorge Pérez2, Lorena Álvarez, Maria Martínez-Valladares2,3, Luis-Fernando de la Fuente1, Yolanda Bayón1, Aranzazu Meana4, Fermin San Primitivo1, Francisco-Antonio Rojo-Vázquez2,3 and Juan-José Arranz*1Address: 1Departamento de Producción Animal, Facultad de Veterinaria, Universidad de León, 24071, León, Spain, 2Departamento de Sanidad Animal, Facultad de Veterinaria, Universidad de León, 24071, León, Spain, 3Instituto de Ganadería de Montaña, Centro Mixto Universidad de León-CSIC Finca Marzanas s/n - CP 24346 - Grulleros, León, Spain and 4Departamento de Sanidad Animal, Facultad de Veterinaria, Universidad Complutense, 28040 Madrid, Spain
Email: Beatriz Gutiérrez-Gil - [email protected]; Jorge Pérez - [email protected]; Lorena Álvarez - [email protected]; Maria Martínez-Valladares - [email protected]; Luis-Fernando de la Fuente - [email protected]; Yolanda Bayón - [email protected]; Aranzazu Meana - [email protected]; Fermin San Primitivo - [email protected]; Francisco-Antonio Rojo-Vázquez - [email protected]; Juan-José Arranz* - [email protected]
* Corresponding author
AbstractBackground: For ruminants reared on grazing systems, gastrointestinal nematode (GIN) parasiteinfections represent the class of diseases with the greatest impact on animal health andproductivity. Among the many possible strategies for controlling GIN infection, the enhancementof host resistance through the selection of resistant animals has been suggested by many authors.Because of the difficulty of routinely collecting phenotypic indicators of parasite resistance,information derived from molecular markers may be used to improve the efficiency of classicalgenetic breeding.
Methods: A total of 181 microsatellite markers evenly distributed along the 26 sheep autosomeswere used in a genome scan analysis performed in a commercial population of Spanish Churrasheep to detect chromosomal regions associated with parasite resistance. Following a daughterdesign, we analysed 322 ewes distributed in eight half-sib families. The phenotypes studied includedtwo faecal egg counts (LFEC0 and LFEC1), anti-Teladorsagia circumcincta LIV IgA levels (IgA) andserum pepsinogen levels (Peps).
Results: The regression analysis revealed one QTL at the 5% genome-wise significance level onchromosome 6 for LFEC1 within the marker interval BM4621-CSN3. This QTL was found to besegregating in three out of the eight families analysed. Four other QTL were identified at the 5%chromosome-wise level on chromosomes 1, 10 and 14. Three of these QTL influenced faecal eggcount, and the other one had an effect on IgA levels.
Conclusion: This study has successfully identified segregating QTL for parasite resistance traits ina commercial population. For some of the QTL detected, we have identified interestingcoincidences with QTL previously reported in sheep, although most of those studies have been
Published: 28 October 2009
Genetics Selection Evolution 2009, 41:46 doi:10.1186/1297-9686-41-46
Received: 1 July 2009Accepted: 28 October 2009
This article is available from: http://www.gsejournal.org/content/41/1/46
© 2009 Gutiérrez-Gil et al; licensee BioMed Central Ltd. This is an Open Access article distributed under the terms of the Creative Commons Attribution License (http://creativecommons.org/licenses/by/2.0), which permits unrestricted use, distribution, and reproduction in any medium, provided the original work is properly cited.
Page 1 of 10(page number not for citation purposes)
Genetics Selection Evolution 2009, 41:46 http://www.gsejournal.org/content/41/1/46
focused on young animals. Some of these coincidences might indicate that some commonunderlying loci affect parasite resistance traits in different sheep breeds. The identification of newQTL may suggest the existence of complex host-parasite relationships that have unique featuresdepending on the host-parasite combination, perhaps due to the different mechanisms underlyingresistance in adult sheep (hypersensitivity reactions) and lambs (immunity). The most significantQTL identified on chromosome 6 for LFEC1 may be the target for future fine-mapping researchefforts.
BackgroundFor ruminants reared on grazing systems, gastrointestinalnematode parasite infections represent the class of dis-eases with the greatest impact on animal health and pro-ductivity [1]. Due to the growing incidence ofanthelmintic resistance among most parasite species,there is a need for a sustainable control of gastrointestinalnematode (GIN) parasites. Among the potential strate-gies, enhancement of host resistance through the selectionof resistant animals has been suggested by many research-ers. Because of the difficulty of routine collection of phe-notypic indicators of parasite resistance, informationbased on molecular markers can be used to improve theefficiency of classical genetic breeding.
Most studies on the detection of QTL for parasite resist-ance in sheep have been carried out in sheep populationsspecialised for meat and/or wool production [2,3], andparticularly in young animals [4-7]. However, the varietyof sheep breeds and nematode species considered in thesestudies has resulted in little consensus among the resultsreported.
In the present study, we carried out a genome scan basedon a daughter design in a commercial population of Span-ish Churra sheep, an indigenous dairy breed from theregion of Castilla y León where the traditional breedingsystem is based on autochthonous grazing breeds. Evenwhen gastrointestinal parasite infections in Churra sheepare moderate, Strongylid nematode parasites are known tocause substantial production losses in the Churra flocksdue to subclinical infection and reduction of the generalimmune response [8]. In addition, the infection of youngreplacement females turned out to pasture for the firsttime may lead to clinical signs of disease such as diarrhoeaand even death in some cases [8].
Previously, we quantified the proportion of the pheno-typic variation of four parasite resistance traits that areunder genetic control [9]. The occurrence of heritable var-iation has been observed for the four parasite traits stud-ied, which suggests that genetic improvement is possiblefor these traits. However, the low heritability estimatesobtained for the studied indicators of parasite resistance
(ranging from 0.09 to 0.21), together with the difficulty ofroutinely collecting these phenotypes, suggests that theuse of marker assisted selection might be of special inter-est for enhancing the response to selection of these traits.Based on this, and taking advantage of the genotypicinformation generated in a previous genome screeningprogram undertaken in Churra sheep, we performed aninitial QTL scan for four parasite traits measured in eighthalf-sib families of the Selection Nucleus of ANCHE(National Association of Spanish Churra sheep Breeders).
MethodsSampled Animals and MeasurementsThe experimental design used in the present study is thedaughter design described by Soller and Genizi [10]. Weanalysed a total of 322 ewes belonging to eight half-sibfamilies, with an average family size of 40.25 daughtersper sire (range: 19-84). Samples from these animals werecollected from seven flocks included in the SelectionNucleus of ANCHE (National Association of SpanishChurra sheep Breeders).
As indicators of parasite resistance following natural infec-tion, we used the phenotypes studied by Gutiérrez-Gil etal. [9] for the estimation of genetic parameters of parasiteresistance traits in a larger population of Churra sheep(928 ewes). From the 928 animals sampled for parasiteresistance traits, those animals belonging to half-familygroups with at least about 20 ewes were selected for thepresent QTL detection experiment, avoiding the analysisof very small families. Hence a total of 322 animals wereincluded in the genome scan analysis reported here. Themethodology and techniques used to determine thesephenotypes have been described in detail by Gutiérrez-Gilet al. [9]. Below is a brief description of the four pheno-types analysed, followed by a brief comment on the aspectof parasite resistance to which each trait is related:
(i) FEC0: Faecal egg count per gram (epg) at day 0 ofthe experiment, when all sampled animals receivedanthelmintic treatment. A modified McMaster tech-nique was used to determine faecal egg counts. Afterthe anthelmintic treatment the animals were exposedto natural infection in the fields following the normal
Page 2 of 10(page number not for citation purposes)
Genetics Selection Evolution 2009, 41:46 http://www.gsejournal.org/content/41/1/46
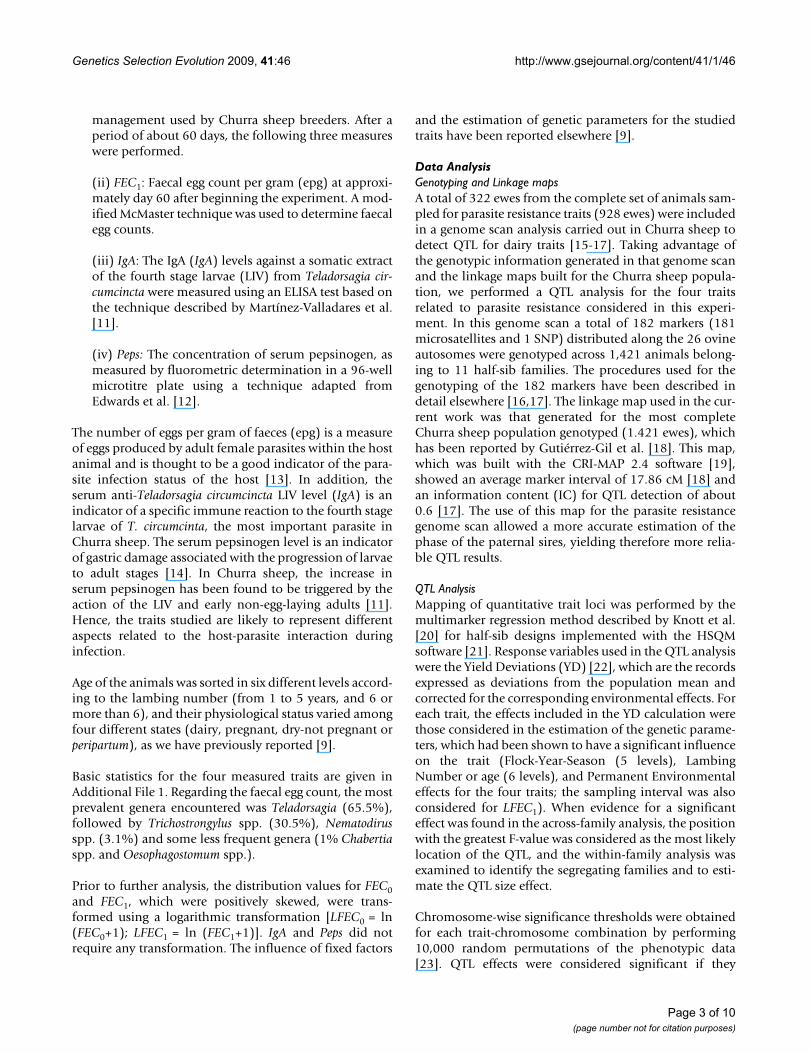
management used by Churra sheep breeders. After aperiod of about 60 days, the following three measureswere performed.
(ii) FEC1: Faecal egg count per gram (epg) at approxi-mately day 60 after beginning the experiment. A mod-ified McMaster technique was used to determine faecalegg counts.
(iii) IgA: The IgA (IgA) levels against a somatic extractof the fourth stage larvae (LIV) from Teladorsagia cir-cumcincta were measured using an ELISA test based onthe technique described by Martínez-Valladares et al.[11].
(iv) Peps: The concentration of serum pepsinogen, asmeasured by fluorometric determination in a 96-wellmicrotitre plate using a technique adapted fromEdwards et al. [12].
The number of eggs per gram of faeces (epg) is a measureof eggs produced by adult female parasites within the hostanimal and is thought to be a good indicator of the para-site infection status of the host [13]. In addition, theserum anti-Teladorsagia circumcincta LIV level (IgA) is anindicator of a specific immune reaction to the fourth stagelarvae of T. circumcinta, the most important parasite inChurra sheep. The serum pepsinogen level is an indicatorof gastric damage associated with the progression of larvaeto adult stages [14]. In Churra sheep, the increase inserum pepsinogen has been found to be triggered by theaction of the LIV and early non-egg-laying adults [11].Hence, the traits studied are likely to represent differentaspects related to the host-parasite interaction duringinfection.
Age of the animals was sorted in six different levels accord-ing to the lambing number (from 1 to 5 years, and 6 ormore than 6), and their physiological status varied amongfour different states (dairy, pregnant, dry-not pregnant orperipartum), as we have previously reported [9].
Basic statistics for the four measured traits are given inAdditional File 1. Regarding the faecal egg count, the mostprevalent genera encountered was Teladorsagia (65.5%),followed by Trichostrongylus spp. (30.5%), Nematodirusspp. (3.1%) and some less frequent genera (1% Chabertiaspp. and Oesophagostomum spp.).
Prior to further analysis, the distribution values for FEC0and FEC1, which were positively skewed, were trans-formed using a logarithmic transformation [LFEC0 = ln(FEC0+1); LFEC1 = ln (FEC1+1)]. IgA and Peps did notrequire any transformation. The influence of fixed factors
and the estimation of genetic parameters for the studiedtraits have been reported elsewhere [9].
Data AnalysisGenotyping and Linkage mapsA total of 322 ewes from the complete set of animals sam-pled for parasite resistance traits (928 ewes) were includedin a genome scan analysis carried out in Churra sheep todetect QTL for dairy traits [15-17]. Taking advantage ofthe genotypic information generated in that genome scanand the linkage maps built for the Churra sheep popula-tion, we performed a QTL analysis for the four traitsrelated to parasite resistance considered in this experi-ment. In this genome scan a total of 182 markers (181microsatellites and 1 SNP) distributed along the 26 ovineautosomes were genotyped across 1,421 animals belong-ing to 11 half-sib families. The procedures used for thegenotyping of the 182 markers have been described indetail elsewhere [16,17]. The linkage map used in the cur-rent work was that generated for the most completeChurra sheep population genotyped (1.421 ewes), whichhas been reported by Gutiérrez-Gil et al. [18]. This map,which was built with the CRI-MAP 2.4 software [19],showed an average marker interval of 17.86 cM [18] andan information content (IC) for QTL detection of about0.6 [17]. The use of this map for the parasite resistancegenome scan allowed a more accurate estimation of thephase of the paternal sires, yielding therefore more relia-ble QTL results.
QTL AnalysisMapping of quantitative trait loci was performed by themultimarker regression method described by Knott et al.[20] for half-sib designs implemented with the HSQMsoftware [21]. Response variables used in the QTL analysiswere the Yield Deviations (YD) [22], which are the recordsexpressed as deviations from the population mean andcorrected for the corresponding environmental effects. Foreach trait, the effects included in the YD calculation werethose considered in the estimation of the genetic parame-ters, which had been shown to have a significant influenceon the trait (Flock-Year-Season (5 levels), LambingNumber or age (6 levels), and Permanent Environmentaleffects for the four traits; the sampling interval was alsoconsidered for LFEC1). When evidence for a significanteffect was found in the across-family analysis, the positionwith the greatest F-value was considered as the most likelylocation of the QTL, and the within-family analysis wasexamined to identify the segregating families and to esti-mate the QTL size effect.
Chromosome-wise significance thresholds were obtainedfor each trait-chromosome combination by performing10,000 random permutations of the phenotypic data[23]. QTL effects were considered significant if they
Page 3 of 10(page number not for citation purposes)
Genetics Selection Evolution 2009, 41:46 http://www.gsejournal.org/content/41/1/46
exceeded the 5% chromosome-wise significance thresh-old (pc-value < 0.05). Genome-wide p-values wereobtained by applying the following Bonferroni correction:Pgenomewise = 1-(1-Pchromosomewise)(1/r), where r indicates thecontribution of the chromosome to the total genomelength [24]. The r parameter was calculated based on thelast update of the Australian sheep linkage map [25] (con-sulted September 2008). The results of the within-familyanalyses were used to identify the families segregating foreach of the QTL identified at the whole population level(those with a within-family pc < 0.05, as determinedthrough permutation testing). Correction for multipletraits was not performed due to the preliminary nature ofthe genome scan so that we could compare our resultswith other studies [24]. Empirical 95% confidence inter-vals (95% CI) were calculated by the bootstrappingmethod [26].
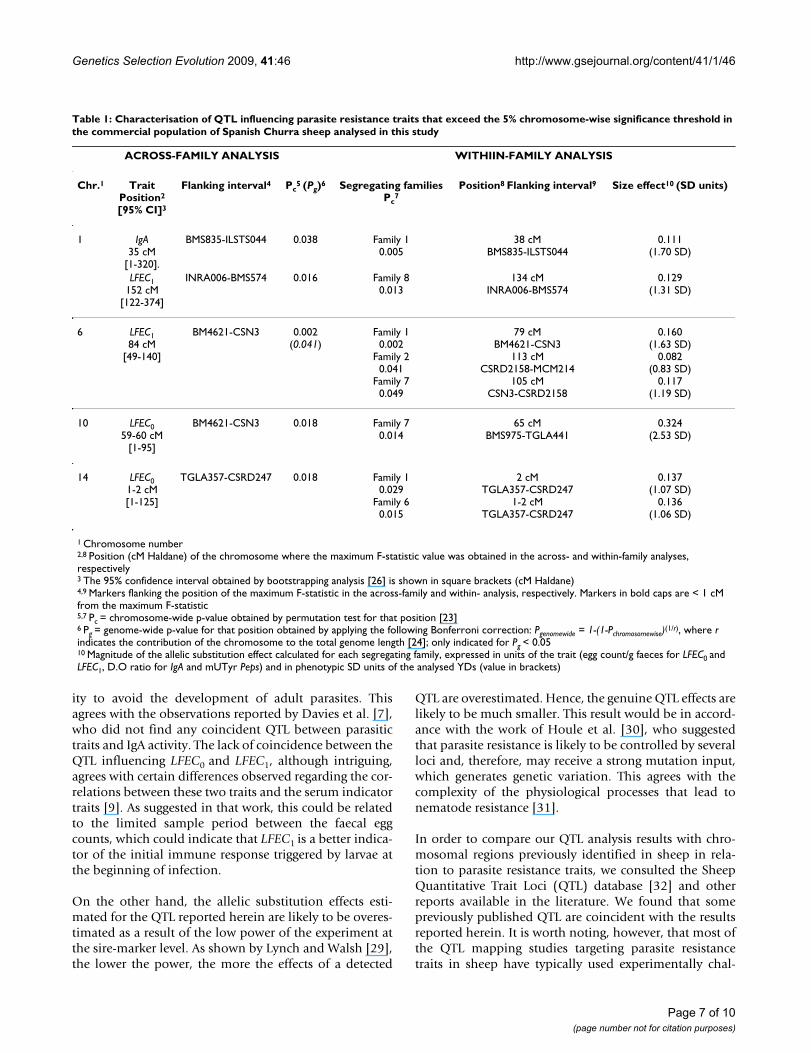
ResultsThe regression analysis revealed five significant QTL at the5% chromosome-wise level on chromosomes 1, 6, 10 and14, and the QTL on chromosome 6 exceeded the 5%genome-wise significance level. Details regarding the QTLposition, significance level and 95% CI calculated for allthe QTL identified by the across-family regression analysisare given in Table 1, along with the position and esti-mated effect for each of the segregating families identifiedin the within-family analysis.
Significant QTL were found for three out of the four traitsinvestigated. Four of the significant linkage associationsidentified influenced the faecal egg count, and one chro-mosomal region was associated with the IgA serum indi-cator. No QTL were observed for Peps. The statisticalprofiles for the four parasite resistance traits obtained
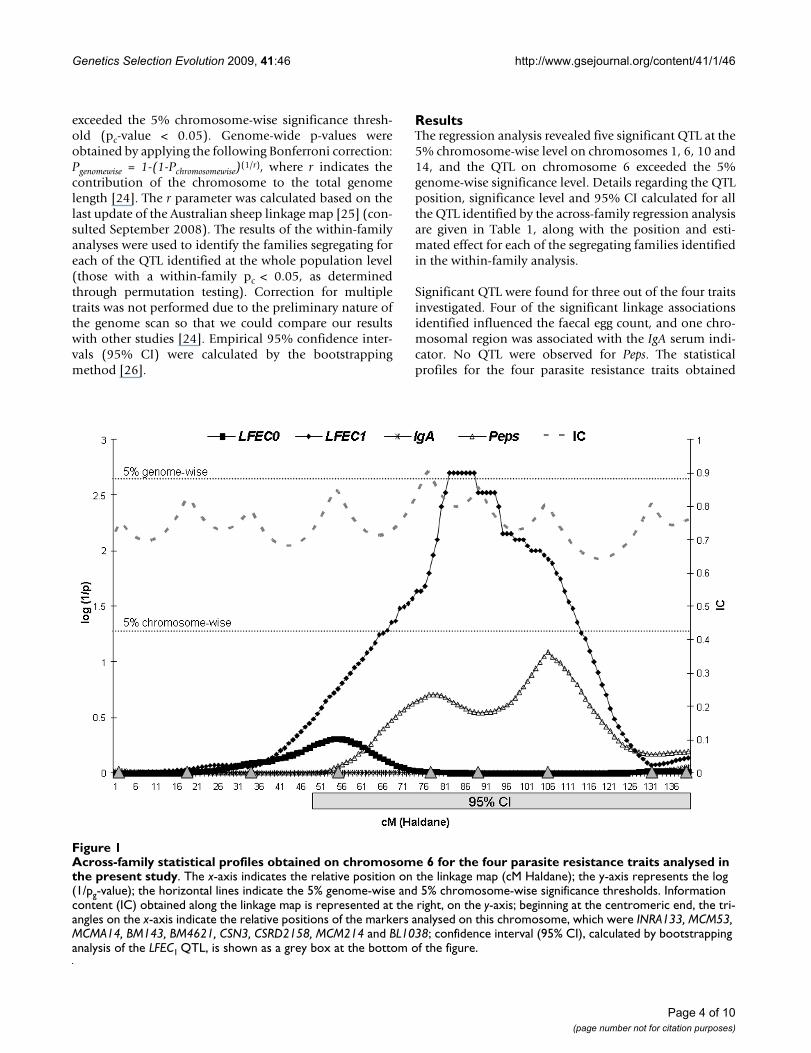
Across-family statistical profiles obtained on chromosome 6 for the four parasite resistance traits analysed in the present studyFigure 1Across-family statistical profiles obtained on chromosome 6 for the four parasite resistance traits analysed in the present study. The x-axis indicates the relative position on the linkage map (cM Haldane); the y-axis represents the log (1/pg-value); the horizontal lines indicate the 5% genome-wise and 5% chromosome-wise significance thresholds. Information content (IC) obtained along the linkage map is represented at the right, on the y-axis; beginning at the centromeric end, the tri-angles on the x-axis indicate the relative positions of the markers analysed on this chromosome, which were INRA133, MCM53, MCMA14, BM143, BM4621, CSN3, CSRD2158, MCM214 and BL1038; confidence interval (95% CI), calculated by bootstrapping analysis of the LFEC1 QTL, is shown as a grey box at the bottom of the figure.
Page 4 of 10(page number not for citation purposes)

Genetics Selection Evolution 2009, 41:46 http://www.gsejournal.org/content/41/1/46
along the four chromosomes where the significant QTLwere detected are represented in Figures 1 and 2.
The most significant QTL was located on the second halfof chromosome 6, within the marker interval BM4621-CSN3, and influenced LFEC1 (Figure 1). This QTL reachedgenome-wise significance (pg = 0.041) and was found tosegregate in three out of the eight analysed half-sib groups(Families 1, 2 and 7). For Family 1, which showed thehighest significance level, the QTL position suggested bythe within-family analysis was coincident with the resultsof the across-family analysis. For the two other segregatingfamilies, the QTL were localised within the first and sec-ond downstream marker intervals with regard to the QTLacross-family position. Here, it should be noted that theestimation of the across-family QTL position may bebiased towards the marker with the highest informative-ness in the region, microsatellite marker BM4621, forwhich all the sires included in the study were hetero-zygous. This discrepancy regarding the within-family QTLpositions may explain the large 95% CI obtained for thisQTL, which spanned 91 cM of the chromosome length.However, the possibility that the effect detected at theacross-family level can be due to different QTL segregatingin the different families can not be ruled out. The magni-tude of the allelic substitution effect for this QTL in thesegregating families ranged from 0.83 (Family 2) to 1.63(Family 1) phenotypic SD units (Table 1).
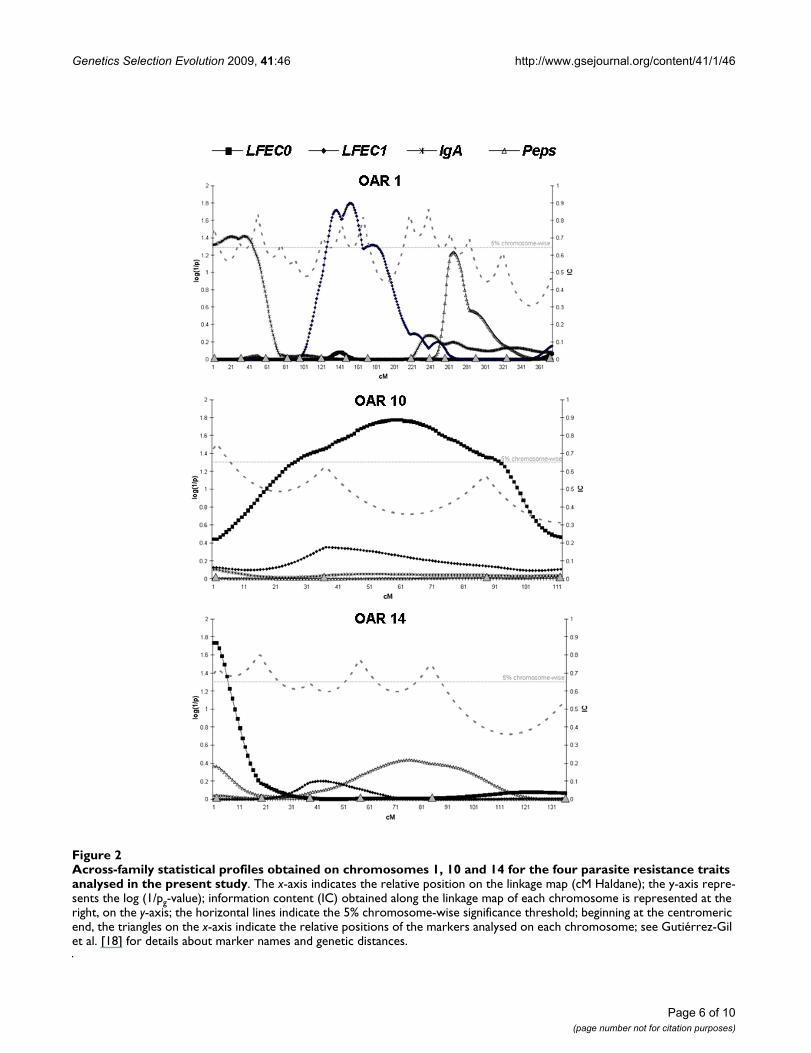
On chromosome 1, a QTL associated with LFEC1 was alsofound at the 5% chromosome-wise significance level. ThisQTL was found in the central region of the chromosome(152 cM). Close to the proximal end of the same chromo-some, there was evidence for an additional 5% chromo-some-wise significant QTL influencing IgA. The other twosignificant QTL identified by the across-family analysiswere found on chromosomes 10 and 14 and showedeffects on LFEC0. The QTL on chromosome 10 was locatedapproximately in the middle of the chromosome, whereasthe QTL on chromosome 14 was found at the proximalend, close to the first marker analysed on this chromo-some.
For each of the QTL identified at the 5% chromosome-wise level, only one family within the population wasfound to be segregating. The exception to this was the QTLidentified on chromosome 14, where the within-familyanalysis indicates that two of the eight sires are likely to beheterozygous for this QTL (Families 1 and 6). The QTLposition suggested by the within-family analysis for thesetwo families was coincident with that estimated in theacross-family analysis. The magnitude of the estimatedallelic substitution effects for the QTL identified at the 5%chromosome-wise level ranged from 0.83 (chromosome
6 QTL for LFEC1, Family 2) to 2.53 (chromosome 10 QTLfor LFEC0, Family 7) phenotypic SD units.
DiscussionVia a genome scan analysis, this study, based on thedaughter design described by Soller and Genizi [10], hasidentified five QTL influencing parasite resistance traits onfour sheep autosomes. Considering that two independenttraits were analysed (according to a principal componentanalysis performed with the SAS® package [27]; results notshown), the numbers of tests in our experiment expectedby chance alone to be significant at the 5% genome-wiseand chromosome-wise level are 0.13 and 2.6, respectively.We identified one and four significant associations in ouracross-family analysis for these respective significance lev-els, providing evidence in favour of genuine segregatingQTL for parasite resistance traits in the studied populationof Churra sheep.
By adapting the method proposed by Weller et al. [28] toour experimental conditions (e.g., the number of ewesand families analysed, marker density and marker inform-ativeness), we estimated that the power of this experimentto detect a QTL with two alleles that occur with equal fre-quency and influence a trait with a heritability of 0.20 var-ied between 16% (0.3 phenotypic SD units) and 42% (0.5phenotypic SD units) according to the magnitude of theallelic substitution effect that we considered. This estima-tion was performed assuming a type I error rate of 0.05and 10% recombination between a marker and the QTL.Hence, we should take into account the fact that the lownumber of animals analysed in the regression analysis hadan important negative influence on the statistical power ofthe experiment, and that a substantial proportion of gen-uine segregating QTL, especially those with small effects,may not have been identified by the across-family regres-sion analysis performed. Therefore, we suggest that someof the other regions that were identified at a lower signifi-cance level in the across-family analysis might representgenuine QTL segregating in individual families. Some ofthese weak associations, e.g., QTL identified at the 10%chromosome-wise significance level for Peps on chromo-somes 1, 2 and 24, IgA on chromosomes 9 and 13, andLFEC1 on chromosome 26 (data not shown), might beconfirmed if additional animals were to be included in theanalyses.
The lack of coincidence among the QTL identified for thedifferent traits analysed here supports our previouslymentioned hypothesis that the traits studied may repre-sent different aspects of the host-parasite interaction dur-ing infection. It is possible that the QTL detected for IgAand Peps could be related to the early response to incom-ing larvae (i.e., hypersensitivity reactions), whereas theQTL for faecal egg counts may be associated with the abil-
Page 5 of 10(page number not for citation purposes)
Genetics Selection Evolution 2009, 41:46 http://www.gsejournal.org/content/41/1/46
Page 6 of 10(page number not for citation purposes)
Across-family statistical profiles obtained on chromosomes 1, 10 and 14 for the four parasite resistance traits analysed in the present studyFigure 2Across-family statistical profiles obtained on chromosomes 1, 10 and 14 for the four parasite resistance traits analysed in the present study. The x-axis indicates the relative position on the linkage map (cM Haldane); the y-axis repre-sents the log (1/pg-value); information content (IC) obtained along the linkage map of each chromosome is represented at the right, on the y-axis; the horizontal lines indicate the 5% chromosome-wise significance threshold; beginning at the centromeric end, the triangles on the x-axis indicate the relative positions of the markers analysed on each chromosome; see Gutiérrez-Gil et al. [18] for details about marker names and genetic distances.
Genetics Selection Evolution 2009, 41:46 http://www.gsejournal.org/content/41/1/46
ity to avoid the development of adult parasites. Thisagrees with the observations reported by Davies et al. [7],who did not find any coincident QTL between parasitictraits and IgA activity. The lack of coincidence between theQTL influencing LFEC0 and LFEC1, although intriguing,agrees with certain differences observed regarding the cor-relations between these two traits and the serum indicatortraits [9]. As suggested in that work, this could be relatedto the limited sample period between the faecal eggcounts, which could indicate that LFEC1 is a better indica-tor of the initial immune response triggered by larvae atthe beginning of infection.
On the other hand, the allelic substitution effects esti-mated for the QTL reported herein are likely to be overes-timated as a result of the low power of the experiment atthe sire-marker level. As shown by Lynch and Walsh [29],the lower the power, the more the effects of a detected
QTL are overestimated. Hence, the genuine QTL effects arelikely to be much smaller. This result would be in accord-ance with the work of Houle et al. [30], who suggestedthat parasite resistance is likely to be controlled by severalloci and, therefore, may receive a strong mutation input,which generates genetic variation. This agrees with thecomplexity of the physiological processes that lead tonematode resistance [31].
In order to compare our QTL analysis results with chro-mosomal regions previously identified in sheep in rela-tion to parasite resistance traits, we consulted the SheepQuantitative Trait Loci (QTL) database [32] and otherreports available in the literature. We found that somepreviously published QTL are coincident with the resultsreported herein. It is worth noting, however, that most ofthe QTL mapping studies targeting parasite resistancetraits in sheep have typically used experimentally chal-
Table 1: Characterisation of QTL influencing parasite resistance traits that exceed the 5% chromosome-wise significance threshold in the commercial population of Spanish Churra sheep analysed in this study
ACROSS-FAMILY ANALYSIS WITHIIN-FAMILY ANALYSIS
Chr.1 Trait Position2
[95% CI]3
Flanking interval4 Pc5 (Pg)6 Segregating families
Pc7
Position8 Flanking interval9 Size effect10 (SD units)
1 IgA 35 cM
[1-320].
BMS835-ILSTS044 0.038 Family 10.005
38 cMBMS835-ILSTS044
0.111(1.70 SD)
LFEC1 152 cM
[122-374]
INRA006-BMS574 0.016 Family 80.013
134 cMINRA006-BMS574
0.129(1.31 SD)
6 LFEC1 84 cM
[49-140]
BM4621-CSN3 0.002(0.041)
Family 10.002
Family 20.041
Family 70.049
79 cMBM4621-CSN3
113 cMCSRD2158-MCM214
105 cMCSN3-CSRD2158
0.160(1.63 SD)
0.082(0.83 SD)
0.117(1.19 SD)
10 LFEC059-60 cM
[1-95]
BM4621-CSN3 0.018 Family 70.014
65 cMBMS975-TGLA441
0.324(2.53 SD)
14 LFEC01-2 cM[1-125]
TGLA357-CSRD247 0.018 Family 10.029
Family 60.015
2 cMTGLA357-CSRD247
1-2 cMTGLA357-CSRD247
0.137(1.07 SD)
0.136(1.06 SD)
1 Chromosome number2,8 Position (cM Haldane) of the chromosome where the maximum F-statistic value was obtained in the across- and within-family analyses, respectively3 The 95% confidence interval obtained by bootstrapping analysis [26] is shown in square brackets (cM Haldane)4,9 Markers flanking the position of the maximum F-statistic in the across-family and within- analysis, respectively. Markers in bold caps are < 1 cM from the maximum F-statistic5,7 Pc = chromosome-wide p-value obtained by permutation test for that position [23]6 Pg = genome-wide p-value for that position obtained by applying the following Bonferroni correction: Pgenomewide = 1-(1-Pchromosomewise)(1/r), where r indicates the contribution of the chromosome to the total genome length [24]; only indicated for Pg < 0.0510 Magnitude of the allelic substitution effect calculated for each segregating family, expressed in units of the trait (egg count/g faeces for LFEC0 and LFEC1, D.O ratio for IgA and mUTyr Peps) and in phenotypic SD units of the analysed YDs (value in brackets)
Page 7 of 10(page number not for citation purposes)
Genetics Selection Evolution 2009, 41:46 http://www.gsejournal.org/content/41/1/46
lenged animals, and that the parasite species consideredvary between studies. In addition, most of the previouslyreported studies consider parasite resistance traits meas-ured in young animals, mainly meat production lambs.
Marshall et al. [33] recently reported a QTL on chromo-some 1 for Haemonchus contortus faecal egg count in 13-month-old Australian sheep. This QTL is close to themarker ADMST4, which maps within the flanking intervalof the chromosome 1 QTL reported here for LFEC1. At theproximal end of the same chromosome, within themarker interval EPCDV010-ILSTS044, Díez-Tascón et al.[5] reported a within-family QTL for faecal strongyle eggcount and an across-family significant QTL for adult T.columbriformis recovered from the gastric contents of out-crossed lambs at slaughter. These significant associationsco-localise with the position of the chromosome 1 QTLinfluencing IgA that was identified in Churra sheep in ouranalysis.
On chromosome 6, Beh et al. [4] reported a genome-wisesignificant QTL for faecal T. columbriformis egg count inlambs after primary challenge. This QTL was confirmed tohave a chromosome-wise significance following a second-ary challenge and mapped to the interval between mark-ers MCMA22 and MCM214. According to the latestversion of the Australian Sheep Linkage Map (v 4.7) [25],the first of these two markers is 16 cM distal to CSN3(male map), one of the markers flanking the genome-wisesignificant QTL identified by our across-family regressionanalysis.
On chromosome 14, Davies et al. [7] reported three QTLrelated to Nematodirus egg count in Scottish blackfacelambs that were located in the last third of the chromo-some, whereas the QTL for LFEC0 that we identifiedmapped to the centromeric end of chromosome 14.
Considering the low resolution of the preliminarygenome scans that have been reported thus far regardingQTL position, some of these coincidences might indicatecommon underlying loci affecting parasite resistancetraits. However, this possibility should be confirmed withfurther studies. Taking into account the high degree of var-iation between different experiments due to factors suchas the type of parasite exposure (natural or artificial chal-lenge), the parasite species, the phenotypic indicators andthe breeds of sheep studied, the identification of non-coincident QTL in different experiments may suggest theexistence of complex host-parasite relationships that haveunique features that depend on the host-parasite combi-nation.
Curiously, our analysis did not find any significant associ-ation within two of the regions for which consensus has
been found in different studies. These are the regions closeto IFNG on chromosome 3 [7,34] and the histocompati-bility complex (MHC) region on chromosome 20[7,35,36]. This discrepancy may be explained by the factthat the studies that found significant associations inthese two regions were focused on lambs, whereas ourstudy considered adult ewes. Marshall et al. [33] reportedan important age and/or immune status specificity of theQTL for resistance to Haemonchus contortus that they iden-tified in Australian sheep. This specificity is based on thelow overlapping levels observed for the QTL that influ-enced the faecal egg counts measured in animals 6 and 13months of age. This kind of age-specific mode of actioncould apply to most parasite infections, which would pro-vide support at the genetic level for the hypothesis sug-gested by Stear et al. [37] that describes the differentmechanisms controlling GIN parasite infections in lambs(antibody response) and adult sheep (hypersensitivityreaction). Also, Balic et al. [38] suggested that the genesthat control key mechanisms preventing the establish-ment of worms in primary infections are different fromthose involved in subsequent infections. This idea isbased on the different pathways that are involved ininnate and acquired resistance. However, this hypothesisis challenged by the fact that overall immunity has beensuccessfully achieved through selection for acquiredresistance rather than via resistance to primary exposure toworms [31]. All these observations highlight the complex-ity of parasite resistance and the difficulty of completelyunderstanding the genetic architecture of the physiologi-cal mechanisms underlying resistance as well as resilience.As mentioned by Dominik [31], consistency in protocols,experimental materials and analysis approaches wouldfacilitate the generation of phenotypic information thatwould help to increase our knowledge on this topic.
ConclusionIn conclusion, we present evidence for a significantnumber of QTL that influence parasite resistance indicatortraits in adult dairy sheep. Some of these linkage associa-tions appear to confirm and support the presence of pre-viously published QTL for parasite resistance in lambs,which could indicate that common genes underlie thesetraits throughout an animal's life. This study represents astarting point for a better understanding of the geneticarchitecture of parasite resistance in Churra dairy sheep.Further fine-mapping research efforts focused on the mostpromising regions, e.g., the genome-wise significant QTLidentified on chromosome 6, might be simplified assheep SNP chips become affordable.
Competing interestsThe authors declare that they have no competing interests.
Page 8 of 10(page number not for citation purposes)

Genetics Selection Evolution 2009, 41:46 http://www.gsejournal.org/content/41/1/46
Authors' contributionsBG-G coordinated the genotyping experiments, per-formed error-checking on genotype data, contributed tointerpretation of results and drafted the manuscript. JP,AM and MMV obtained the parasite resistance phenotypicdata by collection and analysis of the corresponding sam-ples. LA and YB performed microsatellite genotyping.LFdlF participated in the design and coordination of thestudy, performed the analyses of genetic parameters andhelped to draft the manuscript. FSP selected the animalsto be sampled and compiled genealogical information.FARV supervised the collection of phenotypic data andrevised the manuscript. JJA conceived of the study,selected the initial marker panel, performed QTL analysesand participated in drafting the manuscript. All authorsread and approved the final manuscript.
Additional material
AcknowledgementsThis work was supported by the Spanish Ministry of Education and Science (Projects 1FD97-0225 and 1FD97-0427) and by the European Union through the project genesheepsafety (QLK5-2000-00656). Financial sup-port from the Castilla and León regional government (Junta de Castilla y León) by a grant for research groups of excellence (Project GR43) is acknowledged. Beatriz Gutiérrez-Gil is funded by the "Juan de la Cierva Pro-gram" of the Spanish Ministry of Education and Science.
References1. Perry BD, Randolph RF, McDermott JJ, Sones KR, Thornton PK:
Investing in animal health research to alleviate poverty.2002:148 [http://www.ilri.org/InfoServ/Webpub/Fulldocs/InvestAnim/index.htm]. International Livestock Research Institute (ILRI), Nairobi,Kenya
2. Morris CA, Bisset SA, Vlassoff A, West CJ, Wheeler M: Geneticparameters for Nematodirus spp. egg counts in Romneylambs in New Zealand. Anim Sci 2004, 79:33-39.
3. Bishop SC, Jackson F, Coop RL, Stear MJ: Genetic parameters forresistance to nematode infections in Texel lambs and theirutility in breeding programmes. Anim Sci 2004, 78:185-194.
4. Beh KJ, Hulme DJ, Callaghan MJ, Leish Z, Lenane I, Windon RG, Mad-dox JF: A genome scan for quantitative trait loci affectingresistance to Trichostrongylus colubriformis in sheep. AnimGenet 2002, 33:97-106.
5. Diez-Tascon C, Macdonald PA, Dodds KG, McEwan JC, CrawfordAM: A screen of chromosome 1 for QTL affecting nematoderesistance in an ovine outcross population. Proceedings of the7th World Congress on Genetics Applied to Livestock Production: 19-23August 2002; Montpellier 2002:13-37.
6. Crawford AM, Paterson KA, Dodds KG, Diez Tascon C, WilliamsonPA, Roberts Thomson M, Bisset SA, Beattie AE, Greer GJ, Green RS,Wheeler R, Shaw RJ, Knowler K, McEwan JC: Discovery of quanti-
tative trait loci for resistance to parasitic nematode infectionin sheep: I. Analysis of outcross pedigrees. BMC Genomics 2006,18(7):178.
7. Davies G, Stear MJ, Benothman M, Abuagob O, Kerr A, Mitchell S,Bishop SC: Quantitative trait loci associated with parasiticinfection in Scottish blackface sheep. Heredity 2006,96:252-258.
8. Rojo-Vázquez FA: The present status of helminth infections insmall ruminants in Spain: prevalence, anthelmintic resist-ance and some considerationson their control. Proceedings ofthe IXth European Multicolloquium of Parasitology: 18-23 July, Valencia2004:227-231.
9. Gutiérrez-Gil B, Pérez J, de la Fuente LF, Meana A, Martínez-Valla-dares M, San Primitivo F, Rojo-Vázquez FA, Arranz JJ: Geneticparameters for resistance to trichostrongylidinfection indairy sheep. Animal in press.
10. Soller MA, Genizi A: The efficiency of experimental designs forthe detection of linkage between a marker locus and a locusaffecting a quantitative trait in segregating populations. Bio-metrics 1978, 34:47-55.
11. Martínez-Valladares M, Vara-Del Río MP, Cruz-Rojo MA, Rojo-Vázquez FA: Genetic resistance to the infection by Teladorsa-gia circumcincta: IgA and parameters measured at slaughterin Churra sheep. Parasite Immunol 2005, 27:213-218.
12. Edwards K, Jepson RP, Wood KF: Value of plasma pepsinogenestimation. Br Med J 1960, 2:30-31.
13. Stear MJ, Bairden K, Duncan JL, Gettinby G, McKellar QA, Murray M,Wallace DS: The distribution of faecal nematode egg counts inScottish Blackface lambs following natural, predominantlyOstertagia circumcincta infection. Parasitology 1995,110:573-581.
14. Murray M, Jennings FW, Armour J: Bovine ostertagiasis: struc-ture, function and mode of differentiation of the bovine gas-tric mucosa and kinetics of the worm loss. Res Vet Sci 1970,11:417-427.
15. Gutiérrez-Gil B, El-Zarei MF, Bayón Y, de la Fuente LF, San PrimitivoF, Arranz JJ: Genome Scan analysis for detection of QTL influ-encing somatic cell score in dairy sheep. J Dairy Sci 2007,90:422-426.
16. Gutiérrez-Gil B, El-Zarei MF, Alvarez L, Bayón Y, de la Fuente LF, SanPrimitivo F, Arranz JJ: Quantitative Trait Loci underlying uddermorphology traits in dairy sheep. J Dairy Sci 2008, 91:3672-3681.
17. Gutiérrez-Gil B, El-Zarei MF, Alvarez L, Bayón Y, de la Fuente LF, SanPrimitivo F, Arranz JJ: Quantitative trait loci underlying milkproduction traits in sheep. Anim Genet 2009, 40:423-434.
18. Gutiérrez-Gil B, Arranz JJ, El-Zarei MF, Álvarez L, Pedrosa S, SanPrimitivo F, Bayón Y: A male linkage map constructed for QTLmapping in Spanish Churra sheep. J Anim Breed Genet 2008,125:201-204.
19. Green P, Falls K, Crooks S: Documentation for CRI-MAP, ver-sion 2.4. Washington University School of Medicine, St Louis, USA;1990.
20. Knott SA, Elsen JM, Haley CS: Methods for multiple-markermapping of quantitative trait loci in half-sib populations.Theor Appl Genet 1996, 93:71-80.
21. Coppieters W, Kvasz A, Farnir F, Arranz JJ, Grisart B, Mackinnon M,Georges M: A rank-based nonparametric method for mappingquantitative trait loci in outbred half-sib pedigrees: applica-tion to milk production in a granddaughter design. Genetics1998, 149:1547-1555.
22. Vanraden PM, Wiggans GR: Derivation, calculation, and use ofnational animal model information. J Dairy Sci 1991,74:2737-2746.
23. Churchill G, Doerge R: Empirical threshold values for quantita-tive trait mapping. Genetics 1994, 138:963-971.
24. De Koning DJ, Janss LL, Rattink AP, van Oers PA, de Vries BJ,Groenen MA, Piel JJ van der, de Groot PN, Brascamp EW, van Aren-donk JA: Detection of quantitative trait loci for backfat thick-ness and intramuscular fat content in pigs (Sus scrofa).Genetics 1999, 152:1679-1690.
25. Australian Sheep Gene Mapping Web Site [http://rubens.its.unimelb.edu.au/~jillm/jill.htm]
26. Visscher PM, Thompson R, Haley CS: Confidence intervals inQTL mapping by bootstrapping. Genetics 1996, 143:1013-1020.
27. SAS® Institute Inc: SAS/STAT® User's Guide, Version 6.12.Cary, NC, USA. 1999.
Additional file 1Descriptive statistics of phenotypes analysed in this study. The data pro-vided represents basis statistic of parasite resistance traits including: the total number of observations analysed, mean, range, percentage of 0-val-ues and SD for each studied trait.Click here for file[http://www.biomedcentral.com/content/supplementary/1297-9686-41-46-S1.DOC]
Page 9 of 10(page number not for citation purposes)

Genetics Selection Evolution 2009, 41:46 http://www.gsejournal.org/content/41/1/46
Publish with BioMed Central and every scientist can read your work free of charge
"BioMed Central will be the most significant development for disseminating the results of biomedical research in our lifetime."
Sir Paul Nurse, Cancer Research UK
Your research papers will be:
available free of charge to the entire biomedical community
peer reviewed and published immediately upon acceptance
cited in PubMed and archived on PubMed Central
yours — you keep the copyright
Submit your manuscript here:http://www.biomedcentral.com/info/publishing_adv.asp
BioMedcentral
28. Weller JI, Kashi Y, Soller M: Power of daughter and granddaugh-ter designs for determining linkage between marker loci andquantitative trait loci in diary cattle. J Dairy Sci 1990,73:2525-2537.
29. Lynch M, Walsh JB: Genetics and Analysis of Quantitative-Traits. Sinauer Associates, Inc.; 1998:475.
30. Houle D, Morikawa B, Lynch M: Comparing mutational variabil-ities. Genetics 1996, 143:1467-1483.
31. Dominik S: Quantitative trait loci for internal nematoderesistance in sheep: a review. Genet Sel Evol 2005, 37(Suppl1):S83-96.
32. Sheep Quantitative Trait Loci (QTL) database (Sheep-QTLdb) [http://sphinx.vet.unimelb.edu.au/QTLdb/]
33. Marshall K, Maddox JF, Lee SH, Zhang Y, Kahn L, Graser HU, GondroC, Walkden-Brown SW, Werf JH van der: Genetic mapping ofquantitative trait loci for resistance to Haemonchus contor-tus in sheep. Anim Genet 2009, 40:262-272.
34. Coltman DW, Wilson K, Pilkington JG, Stear MJ, Pemberton JM: Amicrosatellite polymorphism in the gamma interferon geneis associated with resistance to gastrointestinal nematodesin a naturally-parasitized population of Soay sheep. Parasitol-ogy 2001, 122:571-582.
35. Schwaiger FW, Gostomski D, Stear MJ, Duncan JL, McKellar QA,Epplen JT, et al.: An ovine Major Histocompatibilty ComplexDRB1 allele is associated with low faecal egg counts follow-ing natural, predominantly Ostertagia circumcincta infec-tion. Int J Parasitol 1995, 25:815-822.
36. Janssen M, Weimann C, Gauly M, Erhardt G: Associations betweeninfections with haemonchus contortus and genetic markerson ovine chromosome 20. Proceedings of the 7th World Congresson Genetics Applied to Livestock Production: 19-23 August 2002; Montpel-lier 2002:13-11.
37. Stear MJ, Strain S, Bishop SC: Mechanisms underlying resistanceto nematode infection. Int J Parasitol 1999, 29:51-56.
38. Balic A, Bowles VM, Liu YS, Meeusen EN: Local immuneresponses in sensitized sheep following challenge infectionwith Teladorsagia circumcincta. Parasite Immunol 2003,25:375-381.
Page 10 of 10(page number not for citation purposes)
Copyright © 2022 FDOKUMEN