Identification of quantitative trait loci affecting reproduction in pigs1,2,3
11
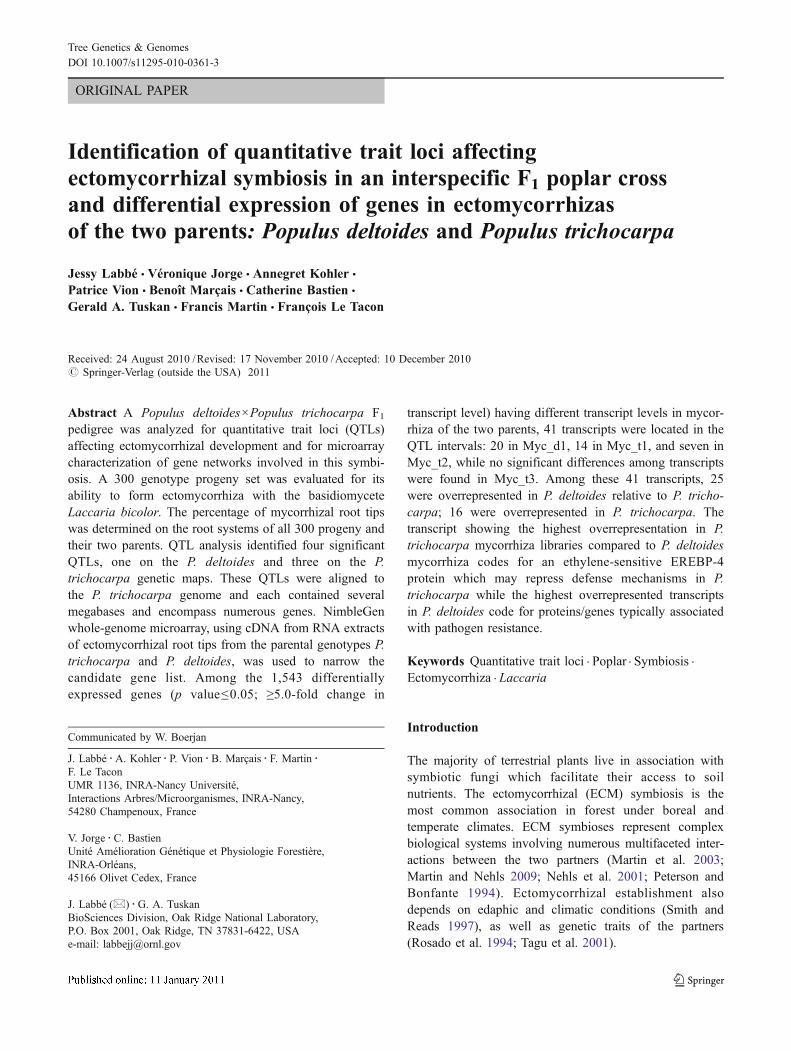
ORIGINAL PAPER Identification of quantitative trait loci affecting ectomycorrhizal symbiosis in an interspecific F 1 poplar cross and differential expression of genes in ectomycorrhizas of the two parents: Populus deltoides and Populus trichocarpa Jessy Labbé & Véronique Jorge & Annegret Kohler & Patrice Vion & Benoît Marçais & Catherine Bastien & Gerald A. Tuskan & Francis Martin & François Le Tacon Received: 24 August 2010 / Revised: 17 November 2010 / Accepted: 10 December 2010 # Springer-Verlag (outside the USA) 2011 Abstract A Populus deltoides × Populus trichocarpa F 1 pedigree was analyzed for quantitative trait loci (QTLs) affecting ectomycorrhizal development and for microarray characterization of gene networks involved in this symbi- osis. A 300 genotype progeny set was evaluated for its ability to form ectomycorrhiza with the basidiomycete Laccaria bicolor . The percentage of mycorrhizal root tips was determined on the root systems of all 300 progeny and their two parents. QTL analysis identified four significant QTLs, one on the P. deltoides and three on the P. trichocarpa genetic maps. These QTLs were aligned to the P. trichocarpa genome and each contained several megabases and encompass numerous genes. NimbleGen whole-genome microarray, using cDNA from RNA extracts of ectomycorrhizal root tips from the parental genotypes P. trichocarpa and P. deltoides, was used to narrow the candidate gene list. Among the 1,543 differentially expressed genes (p value ≤ 0.05; ≥5.0-fold change in transcript level) having different transcript levels in mycor- rhiza of the two parents, 41 transcripts were located in the QTL intervals: 20 in Myc_d1, 14 in Myc_t1, and seven in Myc_t2, while no significant differences among transcripts were found in Myc_t3. Among these 41 transcripts, 25 were overrepresented in P. deltoides relative to P. tricho- carpa; 16 were overrepresented in P. trichocarpa. The transcript showing the highest overrepresentation in P. trichocarpa mycorrhiza libraries compared to P. deltoides mycorrhiza codes for an ethylene-sensitive EREBP-4 protein which may repress defense mechanisms in P. trichocarpa while the highest overrepresented transcripts in P. deltoides code for proteins/genes typically associated with pathogen resistance. Keywords Quantitative trait loci . Poplar . Symbiosis . Ectomycorrhiza . Laccaria Introduction The majority of terrestrial plants live in association with symbiotic fungi which facilitate their access to soil nutrients. The ectomycorrhizal (ECM) symbiosis is the most common association in forest under boreal and temperate climates. ECM symbioses represent complex biological systems involving numerous multifaceted inter- actions between the two partners (Martin et al. 2003; Martin and Nehls 2009; Nehls et al. 2001; Peterson and Bonfante 1994). Ectomycorrhizal establishment also depends on edaphic and climatic conditions (Smith and Reads 1997), as well as genetic traits of the partners (Rosado et al. 1994; Tagu et al. 2001). Communicated by W. Boerjan J. Labbé : A. Kohler : P. Vion : B. Marçais : F. Martin : F. Le Tacon UMR 1136, INRA-Nancy Université, Interactions Arbres/Microorganismes, INRA-Nancy, 54280 Champenoux, France V. Jorge : C. Bastien Unité Amélioration Génétique et Physiologie Forestière, INRA-Orléans, 45166 Olivet Cedex, France J. Labbé (*) : G. A. Tuskan BioSciences Division, Oak Ridge National Laboratory, P.O. Box 2001, Oak Ridge, TN 37831-6422, USA e-mail: [email protected] Tree Genetics & Genomes DOI 10.1007/s11295-010-0361-3
Transcript of Identification of quantitative trait loci affecting reproduction in pigs1,2,3
ORIGINAL PAPER
Identification of quantitative trait loci affectingectomycorrhizal symbiosis in an interspecific F1 poplar crossand differential expression of genes in ectomycorrhizasof the two parents: Populus deltoides and Populus trichocarpa
Jessy Labbé & Véronique Jorge & Annegret Kohler &
Patrice Vion & Benoît Marçais & Catherine Bastien &
Gerald A. Tuskan & Francis Martin & François Le Tacon
Received: 24 August 2010 /Revised: 17 November 2010 /Accepted: 10 December 2010# Springer-Verlag (outside the USA) 2011
Abstract A Populus deltoides×Populus trichocarpa F1pedigree was analyzed for quantitative trait loci (QTLs)affecting ectomycorrhizal development and for microarraycharacterization of gene networks involved in this symbi-osis. A 300 genotype progeny set was evaluated for itsability to form ectomycorrhiza with the basidiomyceteLaccaria bicolor. The percentage of mycorrhizal root tipswas determined on the root systems of all 300 progeny andtheir two parents. QTL analysis identified four significantQTLs, one on the P. deltoides and three on the P.trichocarpa genetic maps. These QTLs were aligned tothe P. trichocarpa genome and each contained severalmegabases and encompass numerous genes. NimbleGenwhole-genome microarray, using cDNA from RNA extractsof ectomycorrhizal root tips from the parental genotypes P.trichocarpa and P. deltoides, was used to narrow thecandidate gene list. Among the 1,543 differentiallyexpressed genes (p value≤0.05; ≥5.0-fold change in
transcript level) having different transcript levels in mycor-rhiza of the two parents, 41 transcripts were located in theQTL intervals: 20 in Myc_d1, 14 in Myc_t1, and seven inMyc_t2, while no significant differences among transcriptswere found in Myc_t3. Among these 41 transcripts, 25were overrepresented in P. deltoides relative to P. tricho-carpa; 16 were overrepresented in P. trichocarpa. Thetranscript showing the highest overrepresentation in P.trichocarpa mycorrhiza libraries compared to P. deltoidesmycorrhiza codes for an ethylene-sensitive EREBP-4protein which may repress defense mechanisms in P.trichocarpa while the highest overrepresented transcriptsin P. deltoides code for proteins/genes typically associatedwith pathogen resistance.
Keywords Quantitative trait loci . Poplar . Symbiosis .
Ectomycorrhiza . Laccaria
Introduction
The majority of terrestrial plants live in association withsymbiotic fungi which facilitate their access to soilnutrients. The ectomycorrhizal (ECM) symbiosis is themost common association in forest under boreal andtemperate climates. ECM symbioses represent complexbiological systems involving numerous multifaceted inter-actions between the two partners (Martin et al. 2003;Martin and Nehls 2009; Nehls et al. 2001; Peterson andBonfante 1994). Ectomycorrhizal establishment alsodepends on edaphic and climatic conditions (Smith andReads 1997), as well as genetic traits of the partners(Rosado et al. 1994; Tagu et al. 2001).
Communicated by W. Boerjan
J. Labbé :A. Kohler : P. Vion :B. Marçais : F. Martin :F. Le TaconUMR 1136, INRA-Nancy Université,Interactions Arbres/Microorganismes, INRA-Nancy,54280 Champenoux, France
V. Jorge : C. BastienUnité Amélioration Génétique et Physiologie Forestière,INRA-Orléans,45166 Olivet Cedex, France
J. Labbé (*) :G. A. TuskanBioSciences Division, Oak Ridge National Laboratory,P.O. Box 2001, Oak Ridge, TN 37831-6422, USAe-mail: [email protected]
Tree Genetics & GenomesDOI 10.1007/s11295-010-0361-3

Poplars are pioneer trees living in riparian ecosystems.They are associated with a great variety of arbuscularmycorrhizal fungi and ectomycorrhizal fungi without whichthey could not colonized these disturbed habitats. Selectedpoplar exhibiting a large susceptibility to ectomycorrhizalcolonization could have an advantage when planting on todisturbed sites. But the absence of ectomycorrhizal inoculumin these types of sites could be a disadvantage, requiringartificial inoculation. In richer soils, like previously clearedagricultural sites, the selection of clones less dependent onectomycorrhizal colonization could be another strategy.
The development and functioning of ectomycorrhizasinvolve the expression of numerous genes encoding fordevelopmental proteins and/or regulatory enzymes both inthe fungi and their partners (Martin et al. 2007). The geneticpredisposition and molecular adaptation needed for mycor-rhizal establishment most likely involve the combined actionof numerous gene networks (Martin and Nehls 2009). Onequantitative trait loci (QTL) related to ectomycorrhizalformation was located on Populus trichocarpa linkage groupIIIa also containing a QTL involved in the pathogenicinteraction with the fungus Melampsora larici-populina, thecausal agent of leaf rust (Tagu et al. 2005). The recent releaseof genomic resources, such as the Laccaria bicolor genome(Martin et al. 2008) and the P. trichocarpa genome (Tuskanet al. 2006), will facilitate the identification of genetic factorsinvolved in these complex interactions.
Here, we (1) confirmed and extended the previous QTLanalysis (Tagu et al. 2005) by positioning QTLs involved inroot colonization by L. bicolor on two improved Populusgenetic maps, using an extended progeny set (300 F1individuals), (2) anchored the QTL markers on the P.trichocarpa genomic sequence, and (3) created a candidategene list from these QTL intervals. Using a whole-genomeoligoarray of P. trichocarpa (Tuskan et al. 2006), we alsocompared the differential gene expression between P.trichocarpa and Populus deltoides ECMs. Finally, wedetermined whether genes showing a differential expressionbetween the parents exhibiting a low ectomycorrhizalcolonization (P. deltoides) and the parent exhibiting a highectomycorrhizal colonization (P. trichocarpa) were locatedin QTL intervals related to ectomycorrhizal colonization.
Material and methods
Biological materials
Plant material consisted of 300 clonally replicated F1progeny from an interspecific P. deltoides (female parentfrom Illinois, no. 73028-62) by P. trichocarpa (male parentfrom Washington, no. 101-74) control-cross family (Family54B, Pop2; Lefèvre et al. 1998; Tagu et al. 2001; Tagu et al.
2005). Ectomycorrhizal formation was evaluated by inoc-ulating the two parents and the 300 progeny with L. bicolorS238N (Di Battista et al. 1996; Tagu et al. 2001). The 300F1 genotypes were chosen at random among the 336genotypes used for the construction of the genetic maps(Jorge et al. 2005). Moreover, these 300 genotypes includedthe 90 genotypes used for the construction of the initialPop2 genetic map (Faivre-Rampant et al. 1999). The L.bicolor S238N fungal strain, issued from the INRA-Nancycollection of ectomycorrhizal fungi, was maintained onPachlewski’s medium (Pachlewski and Pchlevska 1974).This model fungal strain was chosen for its ability to formectomycorrhizas with Populus and for the availability of itsgenome and transcriptome (Martin et al. 2008; Peter et al.2003; Tagu et al. 2001). Mycelium was produced on apeat–vermiculite nutrient mixture and grown in glass jarsfor 2 months in the dark at 25°C and kept at 4°C before use(Duponnois and Garbaye 1991).
Inoculation
Internode cuttings of each progeny and the two parentswere rooted and individually inoculated at the same time in1–l pots containing a mixture of fungal inoculum (1:9; v/v)and calcinated attapulgite (Oil Dri US Special, Damolin,Denmark; http://www.damolin.dk). Inoculated cuttingswere grown for three-and-a-half months in a greenhouseat 15–28°C, photoperiod 12 h at INRA-Nancy (48°41′37″N, 6°11′05″ E) during spring. Cuttings were watered twicedaily and received a weekly nutrient application asdescribed in Frey-Klett et al. (1997). In order to controlenvironmental heterogeneity of the greenhouse, eight clonalreplicates for each genotype were randomly distributed ineight blocks. Each block contained one rooted cutting ofeach of the 300 progeny and the two parents.
Measurements
The percentage of mycorrhizal colonization, as describedby Tagu et al. (2001; 2005) was determined three-and-a-half months after inoculation by eight observers. All theobservers observed randomly the plants within eight blocksand block after block. Each root system was rinsed with tapwater, cut in 1-cm pieces and analyzed under a dissectingmicroscope. For each root system, 100 apices wererandomly examined and assessed as mycorrhizal or non-mycorrhizal. Approximately 25,000 colonized root tipswere examined.
Statistical analysis
The percentage of mycorrhizal colonization was trans-formed using an arcsine √X/100 function prior to variance
Tree Genetics & Genomes
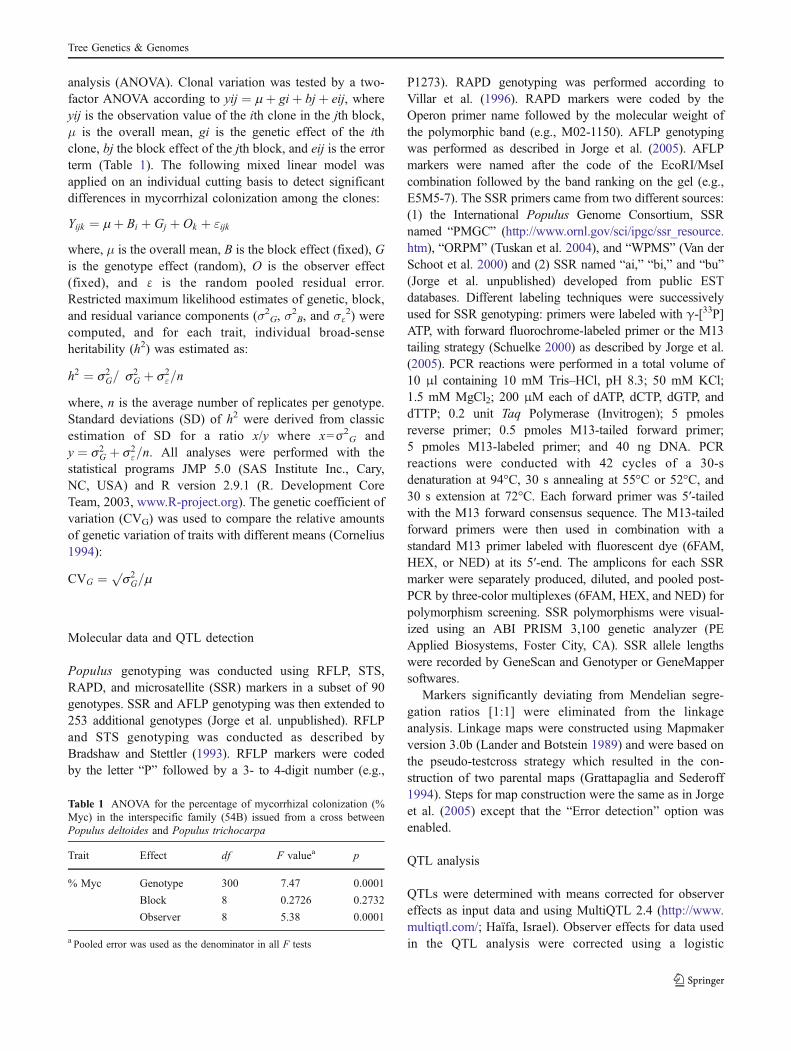
analysis (ANOVA). Clonal variation was tested by a two-factor ANOVA according to yij ¼ mþ giþ bjþ eij, whereyij is the observation value of the ith clone in the jth block,μ is the overall mean, gi is the genetic effect of the ithclone, bj the block effect of the jth block, and eij is the errorterm (Table 1). The following mixed linear model wasapplied on an individual cutting basis to detect significantdifferences in mycorrhizal colonization among the clones:
Yijk ¼ mþ Bi þ Gj þ Ok þ "ijk
where, μ is the overall mean, B is the block effect (fixed), Gis the genotype effect (random), O is the observer effect(fixed), and ε is the random pooled residual error.Restricted maximum likelihood estimates of genetic, block,and residual variance components (σ2G, σ
2B, and σε
2) werecomputed, and for each trait, individual broad-senseheritability (h2) was estimated as:
h2 ¼ s2G= s2
G þ s2"=n
� �
where, n is the average number of replicates per genotype.Standard deviations (SD) of h2 were derived from classicestimation of SD for a ratio x/y where x=σ2
G andy ¼ s2
G þ s2"=n. All analyses were performed with the
statistical programs JMP 5.0 (SAS Institute Inc., Cary,NC, USA) and R version 2.9.1 (R. Development CoreTeam, 2003, www.R-project.org). The genetic coefficient ofvariation (CVG) was used to compare the relative amountsof genetic variation of traits with different means (Cornelius1994):
CVG ¼ ps2G=m
Molecular data and QTL detection
Populus genotyping was conducted using RFLP, STS,RAPD, and microsatellite (SSR) markers in a subset of 90genotypes. SSR and AFLP genotyping was then extended to253 additional genotypes (Jorge et al. unpublished). RFLPand STS genotyping was conducted as described byBradshaw and Stettler (1993). RFLP markers were codedby the letter “P” followed by a 3- to 4-digit number (e.g.,
P1273). RAPD genotyping was performed according toVillar et al. (1996). RAPD markers were coded by theOperon primer name followed by the molecular weight ofthe polymorphic band (e.g., M02-1150). AFLP genotypingwas performed as described in Jorge et al. (2005). AFLPmarkers were named after the code of the EcoRI/MseIcombination followed by the band ranking on the gel (e.g.,E5M5-7). The SSR primers came from two different sources:(1) the International Populus Genome Consortium, SSRnamed “PMGC” (http://www.ornl.gov/sci/ipgc/ssr_resource.htm), “ORPM” (Tuskan et al. 2004), and “WPMS” (Van derSchoot et al. 2000) and (2) SSR named “ai,” “bi,” and “bu”(Jorge et al. unpublished) developed from public ESTdatabases. Different labeling techniques were successivelyused for SSR genotyping: primers were labeled with γ-[33P]ATP, with forward fluorochrome-labeled primer or the M13tailing strategy (Schuelke 2000) as described by Jorge et al.(2005). PCR reactions were performed in a total volume of10 μl containing 10 mM Tris–HCl, pH 8.3; 50 mM KCl;1.5 mM MgCl2; 200 μM each of dATP, dCTP, dGTP, anddTTP; 0.2 unit Taq Polymerase (Invitrogen); 5 pmolesreverse primer; 0.5 pmoles M13-tailed forward primer;5 pmoles M13-labeled primer; and 40 ng DNA. PCRreactions were conducted with 42 cycles of a 30-sdenaturation at 94°C, 30 s annealing at 55°C or 52°C, and30 s extension at 72°C. Each forward primer was 5′-tailedwith the M13 forward consensus sequence. The M13-tailedforward primers were then used in combination with astandard M13 primer labeled with fluorescent dye (6FAM,HEX, or NED) at its 5′-end. The amplicons for each SSRmarker were separately produced, diluted, and pooled post-PCR by three-color multiplexes (6FAM, HEX, and NED) forpolymorphism screening. SSR polymorphisms were visual-ized using an ABI PRISM 3,100 genetic analyzer (PEApplied Biosystems, Foster City, CA). SSR allele lengthswere recorded by GeneScan and Genotyper or GeneMappersoftwares.
Markers significantly deviating from Mendelian segre-gation ratios [1:1] were eliminated from the linkageanalysis. Linkage maps were constructed using Mapmakerversion 3.0b (Lander and Botstein 1989) and were based onthe pseudo-testcross strategy which resulted in the con-struction of two parental maps (Grattapaglia and Sederoff1994). Steps for map construction were the same as in Jorgeet al. (2005) except that the “Error detection” option wasenabled.
QTL analysis
QTLs were determined with means corrected for observereffects as input data and using MultiQTL 2.4 (http://www.multiqtl.com/; Haïfa, Israel). Observer effects for data usedin the QTL analysis were corrected using a logistic
Table 1 ANOVA for the percentage of mycorrhizal colonization (%Myc) in the interspecific family (54B) issued from a cross betweenPopulus deltoides and Populus trichocarpa
Trait Effect df F valuea p
% Myc Genotype 300 7.47 0.0001
Block 8 0.2726 0.2732
Observer 8 5.38 0.0001
a Pooled error was used as the denominator in all F tests
Tree Genetics & Genomes

regression. The option “marker restoration” was used toreduce the effect of missing data. The Kosambi mappingfunction was chosen for recalculation of maps on genotypicdata. Single trait analysis was performed using a combina-tion of interval mapping and multiple interval mapping.That is, the entire genome was first scanned using the oneQTL model then a two-linked QTL model was used.Permutation tests (1,000 runs), comparing hypotheses H1—there is one QTL on the chromosome vs. H0—no QTL onthe chromosome, were run to obtain chromosome-wisestatistical significance. For chromosomes for which a singleQTL was detected, permutation tests (1,000 runs) were runto compare the hypotheses H2—two-linked QTLs in thechromosome vs. H1. Subsequently, when p(H2vsH1)≤0.05,permutations were run to compare H2 vs. H0. A two-linkedQTL model was only accepted, if the two intervals were notadjacent to each other. To reduce calculation time, fullpermutations for the two-linked QTL models were onlyconducted with 1,000 runs when the p value was ≤0.1 after100 runs. In a last step, multiple interval mapping wasperformed including all the significant intervals mappingQTLs (single and two-linked QTLs). A QTL was declaredsignificant when p≤0.05. For the remaining significantQTLs, permutations were run per chromosome, using pvalue thresholds of 0.05 per chromosome. Bootstrapanalysis was performed to estimate the 95% confidenceinterval. QTL analysis was performed with the geneticmaps of P. deltoides and P. trichocarpa (Jorge et al. 2005).
RNA extraction and cDNA synthesis
Ectomycorrhizal root tips from P. trichocarpa and P.deltoides inoculated with L. bicolor S238N were harvestedand instantly frozen in liquid nitrogen. Total RNA wasextracted from three biological replicates (3×2 ECMs) ofeach genotype using the RNeasy micro kit (ref.74004,QIAGEN Courtaboeuf, France) following manufacturer’sinstructions. An in-column digestion step with DNAse I(ref.79254, QIAGEN Courtaboeuf, France) was included inthe RNA purification. RNA quality was verified usingExperion High sens Capillary gels (BIO-RAD, France).The cDNAs for NimbleGen microarrays were synthesizedusing the Super Smart cDNA Synthesis kit (ref.635000,Clontech-Takara Bio Saint-Germain-en-Laye, France).
NimbleGen microarrays
The Populus whole-genome expression array version 2.0(DiFazio et al. unpublished data) manufactured by Nim-bleGen Systems Limited (Madison, WI), containing dupli-cate sets of three independent, non-identical 60-mer probesper gene model plus control probes and labeling controlsfor a total of 65,965 probe sets corresponding to 55,970
gene models predicted on the P. trichocarpa genomesequence version 1.0 and 9,995 aspen cDNA sequences(Populus tremula, Populus tremuloides, and P. tremula×P.tremuloides), was used for expression analysis. ThePopulus version 2.0 oligoarray is fully described in theplatform Gene Expression Omnibus (GEO) at NCBI (http://www.ncbi.nlm.nih.gov/geo; GPL2699). Single dye labelingof samples and hybridization procedures were performed atthe NimbleGen facilities (NimbleGen Systems, Reykjavik,Iceland) following their standard protocol. Expression datawere processed to assure a high specificity in the followingmanner: (1) all independent 60-mer oligos for the 55,970genes were blasted against the Populus genome v1.1(Tuskan et al. 2006) available on http://genome.jgi-psf.org/Poptr1_1/Poptr1_1.home.html and only probes withless than 10% homology to gene models other than thegene model target were retained for the further analysis.Due to this stringent filtering, about 30% of the genes(16,667) were excluded since all three independent probesfailed the given specificity and (2) fluorescence data werenormalized using quantile normalization and Robust Multi-chip Average (Irizarry et al. 2003) implemented in theARRAYSTAR software (DNASTAR, Madison, WI) and 3)A Student’s t test, with FDR (Benjamini-Hochberg)multiple testing corrections, was applied to the duplicatesets on the array and the three biological repetitions usingARRAYSTAR software. Transcripts with a significant pvalue (<0.05) and ≥5.0-fold change in transcript level wereconsidered as differentially expressed between P. tricho-carpa ECM and P. deltoides ECM. Average expressionlevels from the three biological repetitions were calculatedfor each gene and were used for the calculation of theexpression ratio. The complete expression dataset isavailable as series (accession number GSE26416) at theGene Expression Omnibus at NCBI (http://www.ncbi.nlm.nih.gov/geo/).
Results
Mycorrhizal colonization
Fourteen weeks after inoculation, root systems of the300 progeny and two parental genotypes were exclu-sively colonized by L. bicolor. No greenhouse inhabitingcontaminant ectomycorrhizal fungi, such as Thelephoraterrestris, were observed on the roots. Progeny andparental clones could be ranked based on their degree ofmycorrhizal colonization (Fig. 1). The two parents greatlydiffered in their mycorrhizal colonization rate; P. tricho-carpa exhibited a colonization rate of 45%±2, whereas P.deltoides showed a rate of 15%±3. The percentages ofECM colonization among the progeny varied from 8%
Tree Genetics & Genomes

(hybrid clone No. 661300230) to 88% (hybrid clone N°661300592), with an average of 47%. The geneticvariation in this interspecific hybrid family was assessedby a linear mixed model (Table 1). ANOVA resultsshowed a significant genotype and observer effects. Noblock effect was detected. The broad-sense heritability ofthe percentage of mycorrhizal colonization was 0.40 (CVG=20.82%) before correction of the observer effect while aftercorrection it was 0.38 (CVG=22.94%).
QTL detection
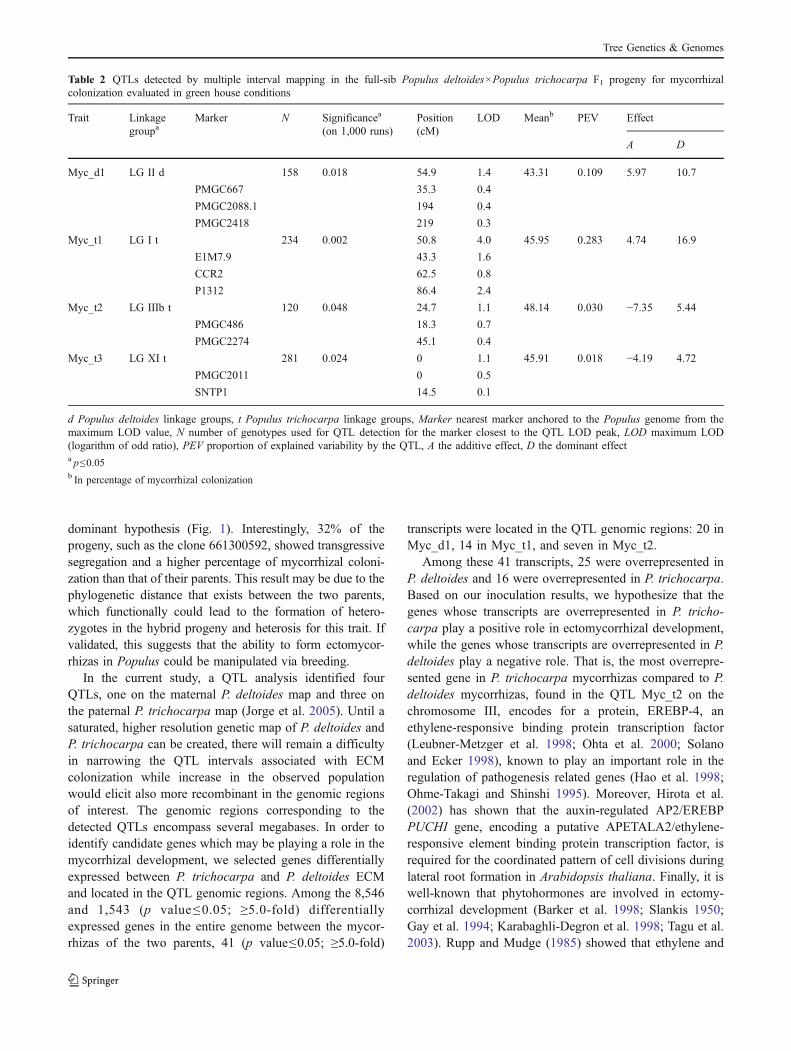
A single QTL (Myc_d1 on linkage group LG II d),explaining 10.9% of the variation of the mycorrhizalcolonization, was detected (LOD score=1.4, significance=0.018; Table 2) on the genetic map of P. deltoides (Jorge etal. 2005). On the genetic map of P. trichocarpa (Jorge et al.2005), three QTLs—Myc_t1, Myc_t2m, and Myc_t3—respectively explaining 28.3%, 3.0%, and 1.8% of themycorrhizal colonization trait, were detected on therespective linkage groups LG I t (LOD score=4.0,significance=0.002), LG III t (LOD score=1.1, signifi-cance=0.048), and LG XI t (LOD score=1.1, significance=0.024; Table 2). None of these QTLs co-localized withQTLs for partial resistance to Melampsora×columbiana orM. larici-populina (Tagu et al. 2005; Yin et al. 2004). Thenearest flanking SSR and/or SNP markers allowed the
positioning of these QTL regions onto the Populus genomev2.0 (Tuskan et al. 2006). These QTL intervals encom-passed 15 Mb on the Populus chromosome II (Myc_d1),4.2 Mb on the chromosome I (Myc_t1), 2.4 Mb on thechromosome III (Myc_t2), and 1.7 Mb on the chromosomeXI (Myc_t3).
Analysis of microarrays transcript profiling
Among all genes, 2,034 myccorhiza-regulated transcriptscorresponded to the QTL intervals, i.e., Myc_d1 (1528),Myc_t1 (264), and Myc_t2 (242). No significant transcriptswere found for QTL Myc_t3. By considering a change ingene expression at a ≥5-fold difference between P.trichocarpa ECM and P. deltoides ECM, we found 210transcripts associated with Myc_d1 (154), Myc_t1 (27), andMyc_t3 (29) out of a total of 8,546 differentially expressedacross the entire genome. In a second step involving thefour QTLs, we identified 41 transcripts which displayed asignificant (p value≤0.05) ≥5-fold gene expression amongthe 1,543 (p value≤0.05; ≥5.0-fold) differentially expressedgenes between the mycorrhizas of the two parents (Table 3).Five of the 41 transcripts were among the ten mostdifferentially represented transcripts between P. trichocarpaECM and P. deltoides ECM (Table 4). Of these 41transcripts, 27 corresponded to genes of known functionand 14 to genes of unknown function.
Discussion
The current study confirmed the results of Rosado et al.(1994) and Tagu et al. (2001; 2005), who showed that theability to form ectomycorrhizas in Pinus elliotii and P.trichocarpa×P. deltoides, respectively, was partially underthe genetic control of the host. Using 146 progenies fromthe 54B family, Tagu et al. (2001, 2005) found that theheritability of the mycorrhizal development ranged between0.49 (Tagu et al. 2001) and 0.09 (Tagu et al. 2005). With alarger progeny (300 clones), our statistical analyses haveshown a significant genotype effect on ectomycorrhizalformation and a broad-sense heritability of the percentageof mycorrhizal colonization of 0.38 (CVG=22.94%),indicating moderate genetic control of the trait. Our results,as in previous studies (Tagu et al. 2001; 2005), indicate alarge difference in the response of the two parents to L.bicolor colonization (45% for P. trichocarpa and 15% for P.deltoides). The mean of the progeny in our study was 47%(vs. 35% in Tagu et al. 2005) was not significantly differentfrom that of the P. trichocarpa parent. We thus hypothesizethat the genes involved in ECM colonization are dominantand inherited from the P. trichocarpa parent, just as thebimodality in the distribution might be explained by the
Fig. 1 Distribution of Populus deltoides (female) and Populustrichocarpa (male) and their F1 progeny following their rootcolonization by Laccaria bicolor. The bars represent the number ofgenotypes distributed in each class according to their percentages ofmycorrhizal colonization. The percentage of P. deltoides is identifiedby the pink line while that of P. trichocarpa is identified by the blueline
Tree Genetics & Genomes
dominant hypothesis (Fig. 1). Interestingly, 32% of theprogeny, such as the clone 661300592, showed transgressivesegregation and a higher percentage of mycorrhizal coloni-zation than that of their parents. This result may be due to thephylogenetic distance that exists between the two parents,which functionally could lead to the formation of hetero-zygotes in the hybrid progeny and heterosis for this trait. Ifvalidated, this suggests that the ability to form ectomycor-rhizas in Populus could be manipulated via breeding.
In the current study, a QTL analysis identified fourQTLs, one on the maternal P. deltoides map and three onthe paternal P. trichocarpa map (Jorge et al. 2005). Until asaturated, higher resolution genetic map of P. deltoides andP. trichocarpa can be created, there will remain a difficultyin narrowing the QTL intervals associated with ECMcolonization while increase in the observed populationwould elicit also more recombinant in the genomic regionsof interest. The genomic regions corresponding to thedetected QTLs encompass several megabases. In order toidentify candidate genes which may be playing a role in themycorrhizal development, we selected genes differentiallyexpressed between P. trichocarpa and P. deltoides ECMand located in the QTL genomic regions. Among the 8,546and 1,543 (p value≤0.05; ≥5.0-fold) differentiallyexpressed genes in the entire genome between the mycor-rhizas of the two parents, 41 (p value≤0.05; ≥5.0-fold)
transcripts were located in the QTL genomic regions: 20 inMyc_d1, 14 in Myc_t1, and seven in Myc_t2.
Among these 41 transcripts, 25 were overrepresented inP. deltoides and 16 were overrepresented in P. trichocarpa.Based on our inoculation results, we hypothesize that thegenes whose transcripts are overrepresented in P. tricho-carpa play a positive role in ectomycorrhizal development,while the genes whose transcripts are overrepresented in P.deltoides play a negative role. That is, the most overrepre-sented gene in P. trichocarpa mycorrhizas compared to P.deltoides mycorrhizas, found in the QTL Myc_t2 on thechromosome III, encodes for a protein, EREBP-4, anethylene-responsive binding protein transcription factor(Leubner-Metzger et al. 1998; Ohta et al. 2000; Solanoand Ecker 1998), known to play an important role in theregulation of pathogenesis related genes (Hao et al. 1998;Ohme-Takagi and Shinshi 1995). Moreover, Hirota et al.(2002) has shown that the auxin-regulated AP2/EREBPPUCHI gene, encoding a putative APETALA2/ethylene-responsive element binding protein transcription factor, isrequired for the coordinated pattern of cell divisions duringlateral root formation in Arabidopsis thaliana. Finally, it iswell-known that phytohormones are involved in ectomy-corrhizal development (Barker et al. 1998; Slankis 1950;Gay et al. 1994; Karabaghli-Degron et al. 1998; Tagu et al.2003). Rupp and Mudge (1985) showed that ethylene and
Table 2 QTLs detected by multiple interval mapping in the full-sib Populus deltoides×Populus trichocarpa F1 progeny for mycorrhizalcolonization evaluated in green house conditions
Trait Linkagegroupa
Marker N Significancea
(on 1,000 runs)Position(cM)
LOD Meanb PEV Effect
A D
Myc_d1 LG II d 158 0.018 54.9 1.4 43.31 0.109 5.97 10.7
PMGC667 35.3 0.4
PMGC2088.1 194 0.4
PMGC2418 219 0.3
Myc_t1 LG I t 234 0.002 50.8 4.0 45.95 0.283 4.74 16.9
E1M7.9 43.3 1.6
CCR2 62.5 0.8
P1312 86.4 2.4
Myc_t2 LG IIIb t 120 0.048 24.7 1.1 48.14 0.030 −7.35 5.44
PMGC486 18.3 0.7
PMGC2274 45.1 0.4
Myc_t3 LG XI t 281 0.024 0 1.1 45.91 0.018 −4.19 4.72
PMGC2011 0 0.5
SNTP1 14.5 0.1
d Populus deltoides linkage groups, t Populus trichocarpa linkage groups, Marker nearest marker anchored to the Populus genome from themaximum LOD value, N number of genotypes used for QTL detection for the marker closest to the QTL LOD peak, LOD maximum LOD(logarithm of odd ratio), PEV proportion of explained variability by the QTL, A the additive effect, D the dominant effecta p≤0.05b In percentage of mycorrhizal colonization
Tree Genetics & Genomes
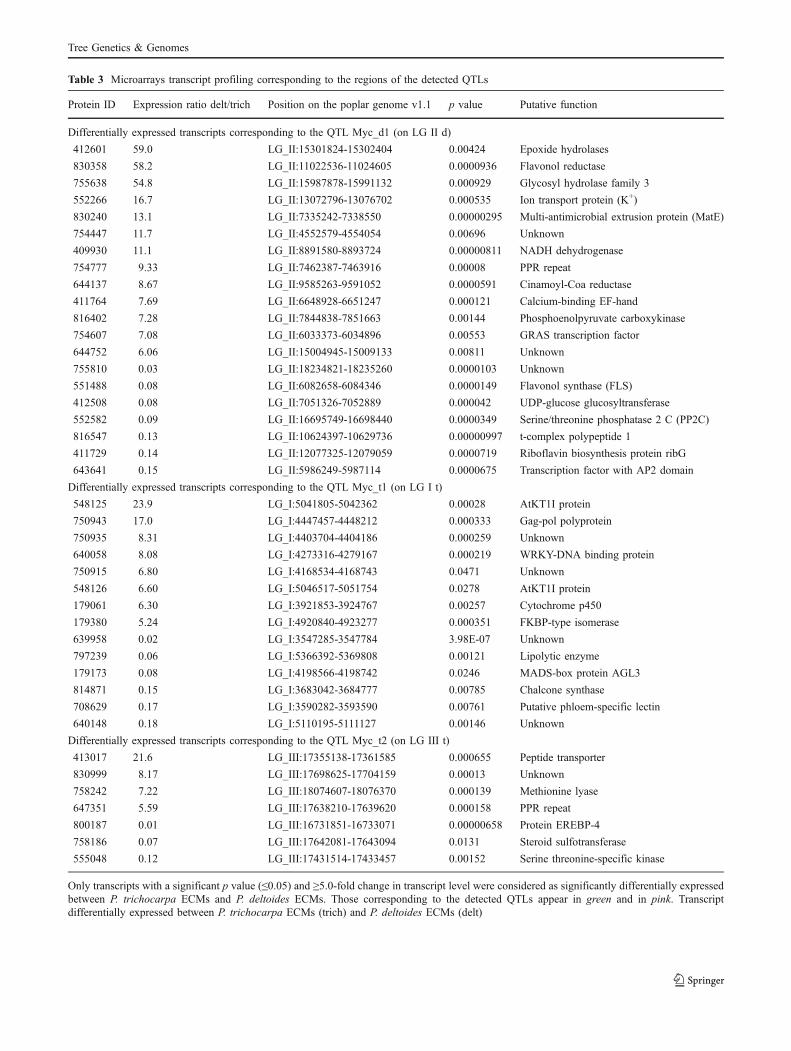
Table 3 Microarrays transcript profiling corresponding to the regions of the detected QTLs
Protein ID Expression ratio delt/trich Position on the poplar genome v1.1 p value Putative function
Differentially expressed transcripts corresponding to the QTL Myc_d1 (on LG II d)
412601 59.0 LG_II:15301824-15302404 0.00424 Epoxide hydrolases
830358 58.2 LG_II:11022536-11024605 0.0000936 Flavonol reductase
755638 54.8 LG_II:15987878-15991132 0.000929 Glycosyl hydrolase family 3
552266 16.7 LG_II:13072796-13076702 0.000535 Ion transport protein (K+)
830240 13.1 LG_II:7335242-7338550 0.00000295 Multi-antimicrobial extrusion protein (MatE)
754447 11.7 LG_II:4552579-4554054 0.00696 Unknown
409930 11.1 LG_II:8891580-8893724 0.00000811 NADH dehydrogenase
754777 9.33 LG_II:7462387-7463916 0.00008 PPR repeat
644137 8.67 LG_II:9585263-9591052 0.0000591 Cinamoyl-Coa reductase
411764 7.69 LG_II:6648928-6651247 0.000121 Calcium-binding EF-hand
816402 7.28 LG_II:7844838-7851663 0.00144 Phosphoenolpyruvate carboxykinase
754607 7.08 LG_II:6033373-6034896 0.00553 GRAS transcription factor
644752 6.06 LG_II:15004945-15009133 0.00811 Unknown
755810 0.03 LG_II:18234821-18235260 0.0000103 Unknown
551488 0.08 LG_II:6082658-6084346 0.0000149 Flavonol synthase (FLS)
412508 0.08 LG_II:7051326-7052889 0.000042 UDP-glucose glucosyltransferase
552582 0.09 LG_II:16695749-16698440 0.0000349 Serine/threonine phosphatase 2 C (PP2C)
816547 0.13 LG_II:10624397-10629736 0.00000997 t-complex polypeptide 1
411729 0.14 LG_II:12077325-12079059 0.0000719 Riboflavin biosynthesis protein ribG
643641 0.15 LG_II:5986249-5987114 0.0000675 Transcription factor with AP2 domain
Differentially expressed transcripts corresponding to the QTL Myc_t1 (on LG I t)
548125 23.9 LG_I:5041805-5042362 0.00028 AtKT1I protein
750943 17.0 LG_I:4447457-4448212 0.000333 Gag-pol polyprotein
750935 8.31 LG_I:4403704-4404186 0.000259 Unknown
640058 8.08 LG_I:4273316-4279167 0.000219 WRKY-DNA binding protein
750915 6.80 LG_I:4168534-4168743 0.0471 Unknown
548126 6.60 LG_I:5046517-5051754 0.0278 AtKT1I protein
179061 6.30 LG_I:3921853-3924767 0.00257 Cytochrome p450
179380 5.24 LG_I:4920840-4923277 0.000351 FKBP-type isomerase
639958 0.02 LG_I:3547285-3547784 3.98E-07 Unknown
797239 0.06 LG_I:5366392-5369808 0.00121 Lipolytic enzyme
179173 0.08 LG_I:4198566-4198742 0.0246 MADS-box protein AGL3
814871 0.15 LG_I:3683042-3684777 0.00785 Chalcone synthase
708629 0.17 LG_I:3590282-3593590 0.00761 Putative phloem-specific lectin
640148 0.18 LG_I:5110195-5111127 0.00146 Unknown
Differentially expressed transcripts corresponding to the QTL Myc_t2 (on LG III t)
413017 21.6 LG_III:17355138-17361585 0.000655 Peptide transporter
830999 8.17 LG_III:17698625-17704159 0.00013 Unknown
758242 7.22 LG_III:18074607-18076370 0.000139 Methionine lyase
647351 5.59 LG_III:17638210-17639620 0.000158 PPR repeat
800187 0.01 LG_III:16731851-16733071 0.00000658 Protein EREBP-4
758186 0.07 LG_III:17642081-17643094 0.0131 Steroid sulfotransferase
555048 0.12 LG_III:17431514-17433457 0.00152 Serine threonine-specific kinase
Only transcripts with a significant p value (≤0.05) and ≥5.0-fold change in transcript level were considered as significantly differentially expressedbetween P. trichocarpa ECMs and P. deltoides ECMs. Those corresponding to the detected QTLs appear in green and in pink. Transcriptdifferentially expressed between P. trichocarpa ECMs (trich) and P. deltoides ECMs (delt)
Tree Genetics & Genomes

auxin induce mycorrhiza-like roots on Pinus mugo. In theEucalyptus globulus–Pisolithus microcarpus ectomycor-rhiza, Tagu et al. (2003) showed that many plant genesare overexpressed during the mycorrhizal development andthat the expression of the EgHypar gene, exhibitinghomology with plant auxin-induced glutathione-S-trans-ferases, was overexpressed not only in the ectomycorrhiza,but also by exogenous application of auxin. The upregula-tion of EREBP-4 in our study fits well with the previousknowledge on the involvement of hormonal interactions inectomycorrhizal establishment.
Alternatively, microarray analysis in P. deltoides mycor-rhizas compared to P. trichocarpa mycorrhizas detectedtranscripts for genes encoding proteins such as epoxidehydrolase, multi-antimicrobial extrusion proteins, AtKT1Iproteins, WRKY proteins, and cytochrome p450, allreportedly playing roles in plant defenses (Gomi et al.2003; Kiyosue et al. 1994; Li et al. 2008; Zou et al. 2004).Indeed, the epoxide hydrolase activity has been reported to
be involved in the mechanisms of defense in plant–fungusinteractions (Gomi et al. 2003). Epoxide hydrolase functionin combination with the cytochrome p450 during thereticulation of cutin biopolymers in the cuticle layers ofplant cell wall and are thought to create a physical barrieragainst pathogen attack (Blée and Schuber 1992; Hambergand Fahlstadius 1992; Pinot et al. 1995). In addition toparticipation in the cutin biosynthesis, this enzyme produ-ces epoxy fatty acids that may also act as antimicrobialcompounds against fungal and bacterial pathogens (Kato etal. 1983, 1985; Masui et al. 1989; Ohta et al. 1990).Similarly, it is known that AtKT1I proteins inhibit theactivity of extracellular proteases and can trigger bothsalicylic acid- and jasmonate/ethylene-dependent defensegene expression (Kariola et al. 2005; Li et al. 2004; Li et al.2008; Ohme-Takagi and Shinshi 2000). Likewise, WRKYproteins are known to be induced in response to fungalelicitor and play an important role in the regulation of earlydefense–response genes (Eulgem et al. 1999; Zou et al.
Table 4 Microarrays transcript profiling—the top ten transcripts corresponding to the most up- and downregulated genes across the entirePopulus genome
Top of up-/downregulatedgene in whole genome
ProteinID
Expression ratioP. deltoides/P.trichocarpa
Position on thepoplar genomev1.1
p value Putative function
Overexpression in P. deltoides
1 806759 86.6 LG_XIII:952125-953621 0.0011 Epoxide hydrolases
2 412601 59.0 LG_II:15301824-15302404 0.00424 Epoxide hydrolases
3 830358 58.2 LG_II:11022536-11024605 0.0000936 Flavonol reductase
4 755638 54.8 LG_II:15987878-15991132 0.000929 Glycosyl hydrolase family 3
5 753870 54.4 LG_II:348822-349424 0.0000115 Ubiquitin ligase
6 569526 53.3 LG_XII:1635212-1636804 0.00000124 Unknown
7 654260 53.0 LG_VI:18130929-18131375 0.000641 Steroid binding protein
8 679320 50.7 scaffold_594:4284-4879 0.000000548 Isomerase
9 769294 50.6 LG_X:9340218-9341318 0.0102 Protease inhibitor
10 772380 49.2 LG_XII:1447519-1447952 0.00000123 Ubiquitin ligase
Overexpression in P. trichocarpa
1 259627 0.003 LG_XVIII:12445734-12446451 0.0000994 Plastocyanin
2 767919 0.004 LG_IX:6507424-6509210 0.000000399 Alcohol dehydrogenase
3 788513 0.005 scaffold_314:36977-38287 0.00000041 Unknown
4 649437 0.007 LG_IX:3238298-3239099 0.00000239 Unknown
5 669706 0.009 LG_XVIII:11936887-11937445 0.00000132 Unknown
6 675468 0.009 scaffold_243:83053-83671 0.00000306 Unknown
7 800187 0.010 LG_III:16731851-16733071 0.00000658 Protein EREBP-4
8 829444 0.012 LG_I:6809419-6811292 0.0092 Putative flavonol reductase
9 670561 0.012 scaffold_120:512204-517789 0.000000977 Unknown
10 278262 0.012 scaffold_2047:1741-3229 0.00141 Methyltransferase
11 727226 0.012 LG_XI:13839049-13841721 0.000000498 Auxin efflux Carrier
Only transcripts with a significant p value (≤0.05) and ≥5.0-fold change in transcript level were considered as significantly differentially expressedbetween P. trichocarpa ECMs and P. deltoides ECMs. Those corresponding to the detected QTLs appear in green and in pink. Transcriptdifferentially expressed between P. trichocarpa ECMs (trich) and P. deltoides ECMs (delt)
Tree Genetics & Genomes
2004). Thus, upregulation of this suite of genes in P.deltoides mycorrhizas may explain the lower mycorrhizalrates relative to P. trichocarpa. Indeed, the activation ofdefense mechanisms in P. deltoides may inhibit L. bicolorcolonization, while in P. trichocarpa this inhibition may berepressed by the overexpression of EREBP-4 ethylene-sensitive transcription factor. Our results support theconclusions by Felten et al. (2010), Rupp et al. (1989),and Splivallo et al. (2009) that ethylene, released byLaccaria, plays a role in primary response of the hostplant. Thus, the initial steps in successful colonization mayinvolve Laccaria manipulating the host’s metabolic ma-chinery and subsequently, decreasing their defenses.
There are limitations to the QTL approach presented inthis study. A higher resolution QTL map is needed tonarrow down the list of candidate genes. Validation of thedetected QTLs different instead of alternate environmentsand alternate pedigrees is needed. The comparison of thegene expression between the mycorrhizas of the twoparents integrates only a part of the interactions which takeplace during mycorrhizal establishment (i.e., early recogni-tion and signal exchange, physical contact of the myceliumon the root, internal colonization, etc.). Nevertheless, thecombination of QTL analysis and whole-genome micro-array analysis does provide a list of candidate genes whichappear to be involved into mycorrhizal that merit furtherinvestigation. In summation, based on our results, theinteractions involved in mycorrhizal establishment andcolonization are extremely complex and may not be asmutualistic as initially assumed.
Acknowledgments This project was supported by grants from theEuropean Commission project ENERGYPOPLAR and EVOLTREE(to FM). JL was supported by a scholarship from the INRA, RegionLorraine, the ORNL, and the U.S. Department of Energy. Oak RidgeNational Laboratory (ORNL) is managed by UT-Battelle, LLC for theUS Department of Energy under contract no. DE-AC05-00OR2272.We thank Christine Delaruelle, Béatrice Palin, Judith Richter,Verónica Pereda, Saskia Reinhart, Anne Delaruelle, Simon Duchêne,Aurore Coince, and Jean-Louis Churin for their assistance in theinoculation and in measuring the colonization rates. We also thankDenis Tagu for his help and fruitful discussions.
References
Barker SJ, Tagu D, Delp G (1998) Regulation of root and fungalmorphogenesis in mycorrhizal symbiosis. Plant Physiol116:1201–1207
Blée E, Schuber F (1992) Occurrence of fatty acid epoxide hydrolasesin soybean (Glycine max). Purification and characterization ofthe soluble form. Biochem J 282:711–714
Bradshaw HD, Stettler RF (1993) Molecular genetics of growth anddevelopment in Populus. I. Triploidy in hybrid poplars. TheorAppl Genet 86:301–307
Cornelius J (1994) Heritabilities and additive genetic coefficient ofvariation in forest trees. Can J For Res 24:372–379
Di Battista C, Selosse MA, Bouchard D, Stenström E, Le Tacon F (1996)Variations in symbiotic efficiency, phenotypic characters and ploidylevel among different isolates of the ectomycorrhizal basidiomyceteLaccaria bicolor strain S238. Mycol Res 100:1315–1324
Duponnois R, Garbaye J (1991) Mycorrhization helper bacteriaassociated with Douglas fir-Laccaria laccata symbiosis: effectsin aseptic and glasshouse conditions. Ann Sci For 48:239–251
Eulgem T, Rushton PJ, Schmelzer E, Hahlbrock K, Somssich IE (1999)Early nuclear events in plant defense signaling: rapid gene activationby WRKY transcription factors. EMBO J 18:4689–4699
Faivre-Rampant P, Bastien C, Augustin S, Breton V, Delplanque A,Mourier MC, Kertadikara A, Laurans F, Lefèvre F, Lesage MC,Menard M, Pinon J, Saintagne C, Valadon A, Villar M, Prat D(1999) Locating genomic regions involved in pest resistance inpoplars. Proceedings of the International Poplar Symposium II,IUFRO, Orléans, France pp31
Felten J, Legué V, Ditengou FA (2010) Lateral root stimulation in theearly interaction between Arabidopsis thaliana and the ectomy-corrhizal fungus Laccaria bicolor. Plant Signal Behav 5:1–4
Frey-Klett P, Pierrat JC, Garbaye J (1997) Location and survival ofmycorrhiza helper Pseudomonas fluorescens during establish-ment of ectomycorrhizal symbiosis between Laccaria bicolorand Douglas-fir. Appl Environ Microbiol 63:139–144
Gay G, Normand L, Marmeisse R, Sotta B, Debaud JC (1994) Auxinoverproducer mutants of Hebeloma cylindrosporum Romagnesihave increased mycorrhizal activity. New Phytol 128:645–657
Gomi K, Yamamato H, Akimitsu K (2003) Epoxide hydrolase: amRNA induced by the fungal pathogen Alternaria alternata onrough lemon (Citrus jambhiri Lush). Plant Mol Biol 53:189–199
Grattapaglia D, Sederoff R (1994) Genetic linkage maps of Eucalyptusgrandis and Eucalyptus urophylla using a pseudo-testcrossmapping strategy and RAPD markers. Genetics 137:1121–1137
Hamberg M, Fahlstadius P (1992) On the specificity of a fatty acidepoxygenase in broad bean (Vicia faba L.). Plant Physiol 99:987–995
Hao D, Ohme-Takagi M, Sarai A (1998) Unique mode of GCC boxrecognition by the DNA-binding domain of ethylene-responsiveelement-binding factor (ERF Domain) in plants. J Biol Chem273:26857–26861
Hirota A, Kato T, Fukaki H, Aida M, Tasaka M (2002) The auxin-regulated AP2/EREBP gene PUCHI is required for morphogen-esis in the early lateral root primordium of Arabidopsis. PlantCell 19:2156–2168
Irizarry RA, Hobbs B, Collin F, Beazer-Barclay YD, Antonellis KJ,Scherf U, Speed TP (2003) Speed, exploration, normalization,and summaries of high density oligonucleotide array probe leveldata. Biostatistics 4:249–264
Jorge V, Dowkiw A, Faivre-Rampant P, Bastien C (2005) Geneticarchitecture of qualitative and quantitative Melampsora larici-populina leaf rust resistance in hybrid poplar: genetic mappingand QTL detection. New Phytol 167:113–127
Karabaghli-Degron C, Sotta B, Bonnet M, Gay G, Le Tacon F (1998)The auxin transport inhibitor 2, 3, 5-triiodobenzoic acid (TIBA)inhibits the stimulation of in vitro lateral root formation and thecolonization of the tap-root cortex of Norway spruce (Piceaabies) seedlings by the ectomycorrhizal fungus Laccaria bicolor.New Phytol 140(4):723–733
Kariola T, Brader G, Li J, Palva ET (2005) Chlorophyllase 1 adamage control enzyme affects the balance between defensepath-ways in plants. Plant Cell 17:282–294
Kato T, Yamaguchi Y, Uehara T, Yokoyama T, Namai T, Yamanaka S(1983) Defense mechanism of the rice plant against rice blastdisease. Naturwissenschaften 70:200–201
Kato T, Yamaguchi Y, Abe N, Uehara T, Namai T, Kodama M,Shiobara Y (1985) Structure and synthesis of unsaturated
Tree Genetics & Genomes

trihydroxy C18 fatty acids in rice plants suffering from rice blastdisease. Tetrahedron Lett 26:2357–2360
Kiyosue T, Beetham JK, Pinot F, Hammock BD, Yamaguchi-Shinozaki K, Shinozaki K (1994) Characterization of anArabidopsis cDNA for a soluble epoxide hydrolase gene that isinducible by auxin and water stress. Plant J 6:259–269
Lander ES, Botstein D (1989) Mapping Mendelian factors underlyingquantitative traits using RFLP linkage maps. Genetics 121:185–199
Lefèvre F, Mc G-M, Faivre-Rampant P, Villar M (1998) A single genecluster controls incompatibility and partial resistance to variousMelampsora larici-populina races in hybrid poplars. Phytopa-thology 88:156–163
Leubner-Metzger G, Petruzzelli L, Waldvogel R, Vögeli-Lange R, MeinsF (1998) Ethylene-responsive element binding protein (EREBP)expression and the transcriptional regulation of class I-1, 3-glucanaseduring tobacco seed germination. Plant Mol Biol 38:785–795
Li J, Brader G, Palva ET (2004) The WRKY70 transcription factor: anode of convergence for jasmonate-mediated and salicylate-mediated signals in plant defense. Plant Cell 2004(16):319–331
Li J, Bradera G, Tapio Palva E (2008) Kunitz trypsin inhibitor: anantagonist of cell death triggered by phytopathogens andfumonisin B1 in Arabidopsis. Mol Plant 1:482–495
Martin F, Nehls U (2009) Harnessing ectomycorrhizal genomics forecological insights. Cur Opin Plant Biol 12:508–515
Martin F, Duplessis S, Ditengou F, Lagrange H, Voiblet C, Lapeyrie F(2003) Developmental cross talking in the ectomycorrhizal symbi-osis: signals and communication genes. New Phytol 151:145–154
Martin F, Kohler A, Duplessis S (2007) Living in harmony in thewood underground: ectomycorrhizal genomics. Cur Opin PlantBiol 10:204–210
Martin F, Aerts A, Ahrén D, Brun A, Duchaussoy F, Gibon J, KohlerA, Lindquist E, Pereda V, Salamov A, Shapiro HJ, Wuyts J,Blaudez D, Buée M, Brokstein P, Canbäck B, Cohen D, CourtyPE, Coutinho PM, Danchin EGJ, Delaruelle C, Detter JC,Deveau A, DiFazio S, Duplessis S, Fraissinet-Tachet L, LucicE, Frey-Klett P, Fourrey C, Feussner I, Gay G, Grimwood J,Hoegger PJ, Jain P, Kilaru S, Labbé J, Lin YC, Legué V, LeTacon F, Marmeisse R, Melayah D, Montanini B, Muratet M,Nehls U, Niculita-Hirzel H, Oudot-Le Secq MP, Peter M,Quesneville H, Rajashekar B, Reich M, Rouhier N, Schmutz J,Yin T, Chalot M, Henrissat B, Kües U, Lucas S, Van de Peer Y,Podila G, Polle A, Pukkila PJ, Richardson PM, Rouzé P, SandersIR, Stajich JE, Tunlid A, Tuskan G, Grigoriev IV (2008)Symbiosis insights from the genome of the mycorrhizal basidio-mycete Laccaria bicolor. Nature 452:88–92
Masui H, Kondo T, Kojima M (1989) An antifungal compound9,12,13-trihydroxy-(E)-10- octadecenoic acid from Colocasiaantiquorum inoculated with Ceratocystis fimbriata. Phytochem-istry 28:2613–2615
Nehls U, Mikolajewski S, Magel E, Hampp R (2001) Carbohydratemetabolism in ectomycorrhizas: gene expression, monosaccha-ride transport and metabolic control. New Phytol 150:533–541
Ohme-Takagi M, Shinshi H (1995) Ethylene-inducible DNA bindingproteins that interact with an ethylene-responsive element. PlantCell 7:173–182
Ohme-Takagi M, Shinshi H (2000) Three ethylene-responsivetranscription factors in tobacco with distinct transactivationfunctions. Plant J 22:29–38
Ohta H, Shida K, Peng LY, Furusawa I, Shishiyama J, Aibara S,Morita Y (1990) The occurrence of lipid hydroperoxide-decom-posing activities in rice and the relationship of such activities tothe formation of antifungal substances. Plant CellPhysiol 31(8):1117–1122
Ohta M, Ohme-Takagi M, Shinshi H (2000) Three ethylene-responsive transcriptional factors in tobacco with distinct trans-activation functions. Plant Cell 12:393–404
Pachlewski R, Pchlevska J (1974) Studies on symbiotic properties ofmycorrhizal fungi of pine (Pinus sylvestris L.) with the aid of themethod of mycorrhizal synthesis in pure cultures on agar. PhDThesis. Forest Institute, Warsaw
Peter M, Courty PE, Kohler A, Delaruelle C, Martin D, Tagu D, Frey-Klett P, Duplessis S, Chalot M, Podila G, Martin F (2003)Analysis of expressed sequence tags from the ectomycorrhizalbasidiomycete Laccaria bicolor and Pisolithus microcarpus.New Phytol 159:117–129
Peterson L, Bonfante P (1994) Comparative structure of vesicular-arbuscularmycorrhizas and ectomycorrhizas. In: Robson AD,Abbort LK, Malajczuk N (eds) Management of mycorrhizas inagriculture, horticulture and forestery. Kluwer, Dordrecht, pp 79–88
Pinot F, Grant DF, Beetham JK, Parker AG, Borhan B, Landt S, JonesAD, Hammock BD (1995) Molecular and biochemical evidencefor the involvement of the Asp333-His523 pair in catalyticmechanism of soluble epoxide hydrolase. J Biol Chem 270:7968–7974
Rosado SCS, Kropp BR, Piché Y (1994) Genetics of ectomycorrhizalsymbiosis. I. Host plant variability and heritability of ectomycor-rhizal root traits. New Phytol 126:105–110
Rupp LA, Mudge W (1985) Ethephon and auxin induce mycorrhiza-like changes in the morphology of root organ cultures of mugopine. Physiol Plant 64:316–322
Rupp LA, DeVries HE, Mudge KW (1989) Effect of aminocyclopro-pane carboxylic acid and aminoethoxyvinylglycine on ethyleneproduction by ectomycorrhizal fungi. Can J Bot 67:483–485
Schuelke M (2000) An economic method for the fluorescent labelingof PCR fragments. Nat Biotechnol 18:233–234
Slankis V (1950) Effect of α-naphthalene-acetic acid on dichotomousbranching of isolated roots of Pinus sylvestris. Physiol Plant3:40–44
Smith SE, Reads DJ (eds) (1997) Mycorrhizal symbiosis. Academic,San Diego
Solano R, Ecker JR (1998) Ethylene gas: perception, signaling andresponse. Cur Opin Plant Biol 1:393–398
Splivallo R, Fischer U, Gobel C, Feussner I, Karlovsky P (2009)Truffles regulate plant root morphogenesis via the production ofauxin and ethylene. Plant Physiol 150:218–229
Tagu D, Faivre-Rampant P, Lapeyrie Frey-klett P, Vion P, Villar M(2001) Variation in the ability to form ectomycorrhizas in the F1progeny of an interspecific poplar (Populus spp.) cross. Mycor-rhiza 10:237–240
Tagu D, Palin B, Balestrini R, Gelhaye E, Lapeyrie F, Jacquot JP,Sautière PE, Bonfante P, Martin F (2003) Characterization ofa symbiosis- and auxin-regulated glutathione-S-transferasefrom Eucalyptus globulus roots. Plant Physiol Biochem41:611–618
Tagu D, Bastien C, Faivre-Rampant P, Garbaye J, Vion P, Villar M,Martin F (2005) Genetic analysis of phenotypic variation forectomycorrhiza formation an interspecific F1 poplar full-sibfamily. Mycorrhiza 15:87–91
Tuskan GA, Gunter LE, Yang ZMK, Yin TM, Sewell MM, DiFazioSP (2004) Characterization of microsatellites revealed bygenomic sequencing of Populus trichocarpa. Can J For Res34:85–93
Tuskan GA, DiFazio S, Jansson S, Bohlmann J, Grigoriev I, HellstenU, Putnam N, Ralph S, Rombauts S, Salamov A, Schein J, SterckL, Aerts A, Bhalerao RR, Bhalerao BD, Boerjan W, Brun A,Brunner A, Busov V, Campbell M, Carlson J, Chalot M,Chapman J, Chen GL, Cooper D, Coutinho PM, Couturier J,Covert S, Cronk Q, Cunningham R, Davis J, Degroeve S,Déjardin A, dePamphilis C, Detter J, Dirks B, Dubchak I,Duplessis S, Ehlting J, Ellis B, Gendler K, Goodstein D,Gribskov M, Grimwood J, Groover A, Gunter L, Hamberger B,
Tree Genetics & Genomes
Heinze B, Helariutta Y, Henrissat B, Holligan D, Holt R,Huang W, Islam-Faridi N, Jones S, Jones-Rhoades M,Jorgensen R, Joshi C, Kangasjärvi J, Karlsson J, Kelleher C,Kirkpatrick R, Kirst M, Kohler A, Kalluri U, Larimer F,Leebens-Mack J, Leplé JC, Locascio P, Lou Y, Lucas S,Martin F, Montanini B, Napoli C, Nelson DR, Nelson C,Nieminen K, Nilsson O, Pereda V, Peter G, Philippe R, PilateG, Poliakov A, Razumovskaya J, Richardson P, Rinaldi C,Ritland K, Rouzé P, Ryaboy D, Schmutz J, Schrader J,Segerman B, Shin H, Siddiqui A, Sterky F, Terry A, Tsai CJ,Uberbacher E, Unneberg P, Vahala J, Wall K, Wessler S, YangG, Yin T, Douglas C, Marra M, Sandberg G, Van de Peer Y,Rokhsar D (2006) The genome of black cottonwood, Populustrichocarpa. Science 313:1596–1604
Van der Schoot J, Pospiskova M, Vosman B, Smulders MJM (2000)Development and characterization of microsatellite markers inblack poplar (Populus nigra L.). Theor Appl Genet 101:317–322
Villar M, Lefèvre F, Bradshaw HD, Teissier du Cros E (1996)Molecular genetics of rust resistance in poplars (Melampsoralarici-populina Kleb/Populus sp.) by bulked segregant analysis ina 2×2 factorial mating design. Genetics 143:531–536
Yin TM, DiFazio SP, Gunter LE, Jawdy SS, Tuskan GA (2004)Mapping the rust resistant loci MXC3 and MER in Populustrichocarpa and assessing the intermarker linkage disequilibriumin the MXC3 region. New Phytol 164:95–106
Zou X, Seemann JR, Neuman D, Shen QJ (2004) AWRKY Gene fromcreosote bush encodes an activator of the abscisic acid signalingpathway. J Biol Chem 279:55770–55779
Tree Genetics & Genomes