Quantitative trait loci mapping of Cercospora leaf spot resistance in mungbean, Vigna radiata (L.)...
10
Quantitative trait loci mapping of Cercospora leaf spot resistance in mungbean, Vigna radiata (L.) Wilczek Sompong Chankaew • Prakit Somta • Worawit Sorajjapinun • Peerasak Srinives Received: 15 March 2010 / Accepted: 23 June 2010 / Published online: 14 July 2010 Ó Springer Science+Business Media B.V. 2010 Abstract Cercospora leaf spot (CLS) caused by the fungus Cercospora canescens Illis & Martin is a serious disease in mungbean (Vigna radiata (L.) Wilczek), and disease can reduce seed yield by up to 50%. We report here for the first time quantitative trait loci (QTL) mapping for CLS resistance in mungbean. The QTL analysis was conducted using F 2 (KPS1 9 V4718) and BC 1 F 1 [(KPS1 9 V4718) 9 KPS1] populations developed from crosses between the CLS-resistant mungbean V4718 and CLS-susceptible cultivar Kamphaeng Saen 1 (KPS1). CLS resistance in F 2 populations was evaluated under field conditions during the wet seasons of 2008 and 2009, and resistance in BC 1 F 1 was evaluated under field conditions during the wet season in 2008. Seven hundred and fifty-three simple sequence repeat (SSR) markers from various legumes were used to assess polymorphism between KPS1 and V4718. Subse- quently, 69 polymorphic markers were analyzed in the F 2 and BC 1 F 1 populations. The results of segregation analysis indicated that resistance to CLS is controlled by a single dominant gene, while composite interval mapping consistently identified one major QTL (qCLS) for CLS resistance on linkage group 3 in both F 2 and BC 1 F 1 populations. qCLS was located between markers CEDG117 and VR393, and accounted for 65.5–80.53% of the disease score variation depending on seasons and populations. An allele from V4718 increased the resistance. The SSR markers flanking qCLS will facilitate transferral of the CLS resistance allele from V4718 into elite mungbean cultivars. Keywords Mungbean Á Cercospora leaf spot Á Simple sequence repeat Á Vigna radiata Á QTL Á Cercospora canescens Introduction Mungbean, Vigna radiata (L.) Wilczek, is an impor- tant legume crop in South and Southeast Asia. Over 90% of mungbean production occurs in South Asia, where India is the largest producer. In some countries such as Thailand and the Philippines mungbean is the Electronic supplementary material The online version of this article (doi:10.1007/s11032-010-9478-1) contains supplementary material, which is available to authorized users. S. Chankaew Program in Plant Breeding, Faculty of Agriculture at Kamphaeng Saen, Kasetsart University, Kamphaeng Saen, Nakhon Pathom 73140, Thailand P. Somta Á P. Srinives (&) Department of Agronomy, Faculty of Agriculture at Kamphaeng Saen, Kasetsart University, Kamphaeng Saen, Nakhon Pathom 73140, Thailand e-mail: [email protected] W. Sorajjapinun AVRDC-The World Vegetable Center, Asian Regional Center, Kasetsart University, Kamphaeng Saen, Nakhon Pathom 73140, Thailand 123 Mol Breeding (2011) 28:255–264 DOI 10.1007/s11032-010-9478-1
Transcript of Quantitative trait loci mapping of Cercospora leaf spot resistance in mungbean, Vigna radiata (L.)...

Quantitative trait loci mapping of Cercospora leaf spotresistance in mungbean, Vigna radiata (L.) Wilczek
Sompong Chankaew • Prakit Somta •
Worawit Sorajjapinun • Peerasak Srinives
Received: 15 March 2010 / Accepted: 23 June 2010 / Published online: 14 July 2010
� Springer Science+Business Media B.V. 2010
Abstract Cercospora leaf spot (CLS) caused by the
fungus Cercospora canescens Illis & Martin is a
serious disease in mungbean (Vigna radiata (L.)
Wilczek), and disease can reduce seed yield by up to
50%. We report here for the first time quantitative trait
loci (QTL) mapping for CLS resistance in mungbean.
The QTL analysis was conducted using F2 (KPS1 9
V4718) and BC1F1 [(KPS1 9 V4718) 9 KPS1]
populations developed from crosses between the
CLS-resistant mungbean V4718 and CLS-susceptible
cultivar Kamphaeng Saen 1 (KPS1). CLS resistance in
F2 populations was evaluated under field conditions
during the wet seasons of 2008 and 2009, and
resistance in BC1F1 was evaluated under field
conditions during the wet season in 2008. Seven
hundred and fifty-three simple sequence repeat (SSR)
markers from various legumes were used to assess
polymorphism between KPS1 and V4718. Subse-
quently, 69 polymorphic markers were analyzed in the
F2 and BC1F1 populations. The results of segregation
analysis indicated that resistance to CLS is controlled by
a single dominant gene, while composite interval
mapping consistently identified one major QTL (qCLS)
for CLS resistance on linkage group 3 in both F2 and
BC1F1 populations. qCLS was located between markers
CEDG117 and VR393, and accounted for 65.5–80.53%
of the disease score variation depending on seasons and
populations. An allele from V4718 increased the
resistance. The SSR markers flanking qCLS will
facilitate transferral of the CLS resistance allele from
V4718 into elite mungbean cultivars.
Keywords Mungbean � Cercospora leaf spot �Simple sequence repeat � Vigna radiata �QTL � Cercospora canescens
Introduction
Mungbean, Vigna radiata (L.) Wilczek, is an impor-
tant legume crop in South and Southeast Asia. Over
90% of mungbean production occurs in South Asia,
where India is the largest producer. In some countries
such as Thailand and the Philippines mungbean is the
Electronic supplementary material The online version ofthis article (doi:10.1007/s11032-010-9478-1) containssupplementary material, which is available to authorized users.
S. Chankaew
Program in Plant Breeding, Faculty of Agriculture
at Kamphaeng Saen, Kasetsart University,
Kamphaeng Saen, Nakhon Pathom 73140, Thailand
P. Somta � P. Srinives (&)
Department of Agronomy, Faculty of Agriculture
at Kamphaeng Saen, Kasetsart University,
Kamphaeng Saen, Nakhon Pathom 73140, Thailand
e-mail: [email protected]
W. Sorajjapinun
AVRDC-The World Vegetable Center, Asian Regional
Center, Kasetsart University, Kamphaeng Saen,
Nakhon Pathom 73140, Thailand
123
Mol Breeding (2011) 28:255–264
DOI 10.1007/s11032-010-9478-1

most important legume crop, popular because of its
early maturity (60–65 days), relative drought toler-
ance and ability to fix atmospheric nitrogen in
association with soil Rhizobium. Seeds of mungbean
contain high levels of protein (ca. 25%) with high-
quality amino acid profiles, and thus become an
inexpensive source of dietary protein for poor people
and vegetarians in the region. Sprouts and green pods
of mungbean are considered high in vitamins and
minerals. Plant parts are used as fodder and manure.
Although mungbean can be grown as a monocrop, it
is commonly grown as a component in various
cropping systems owing to its early maturity.
One of the most important factors affecting
mungbean production in Asia is Cercospora leaf spot
(CLS) disease, a foliar disease caused by the
biotrophic fungus Cercospora canescens Illis &
Martin (Chupp 1953). The disease is widespread in
Asia and especially devastating in the warm-wet
growing season. The fungus initially causes spotting
on mungbean leaves; the spots increase in number
and size during flowering, but the increment is most
rapid at the pod-filling stage. In susceptible varieties,
infection expands rapidly resulting in premature
defoliation and reduction in size of pods and seeds
(Grewal et al. 1980), and thus causes yield losses of
up to 50% if there is no protection (AVRDC 1984).
Although this disease can be controlled by spraying
with fungicide, the practice increases farmers’ pro-
duction costs and has adverse affects on human health
and the environment. Moreover, regular spraying can
cause development of chemical resistance in the
pathogen. The use of resistant varieties is the most
desirable strategy to manage the disease in an
economical and environmentally-friendly way.
Information on inheritance of resistance to CLS
disease is useful in breeding for resistant cultivars.
Genetic studies of inheritance of CLS resistance,
using different resistant sources, revealed that the
resistance is controlled by either a single dominant
gene (AVRDC 1974; Thakur et al. 1977; Lee 1980),
or a single recessive gene (Mishra et al. 1988), or
quantitative genes (AVRDC 1980; Leabwon and
Oupadissakoon 1984). Although the above informa-
tion is useful for breeders in developing the resistant
varieties, progress in selecting CLS-resistant geno-
types in large breeding programs is still limited. This
is mainly due to the fact that CLS occurs only in the
rainy season, which is the primary growing season for
mungbean. Thus field evaluation for resistance can be
done in only one season per year, albeit mungbean is
considered among the shortest season crop in the
world and can be grown 3–4 times a year. Molecular
markers linking to the gene controlling resistance can
aid selection and advance the generation year-round
(Collard and Mackill 2008), thus overcoming the
limitations of conventional breeding methods. Gene
or quantitative trait loci (QTL) mapping in mungbean
has been conducted for resistance to insects and dis-
eases such as bruchids, powdery mildew and mung-
bean yellow mosaic virus (see Somta and Srinives
2007 for review), but not CLS.
In this paper, we report for the first time QTL
mapping for resistance to Cercospora leaf spot in
mungbean. The objectives of this study were to
determine the genetics and genome position of CLS
resistance in mungbean accession V4718.
Materials and methods
Plant materials and DNA extraction
F1, F2 and BC1F1 mungbean populations were
developed from V4718 and Kamphaeng Saen 1
(KPS1). V4718 is an accession originally from India
and is reported to be highly resistant to CLS in
Taiwan (AVRDC 1980). It also showed high resis-
tance to the disease in Thailand (Somta P, unpub-
lished data). KPS1 is a commercial mungbean
cultivar from Thailand susceptible to CLS. V4718
was used as male parent and crossed onto KPS1 to
developed F1 hybrids. The F1 hybrids were self-
pollinated and used as female parent to backcross
to KPS1 in order to develop F2 and BC1F1 popula-
tions, respectively. F2 and BC1F1 individuals were
self-pollinated, and their F3 and BC1F2 seeds were
used for phenotyping. The F2 and BC1F1 mapping
populations comprised 155 and 76 individuals,
respectively.
Total genomic DNA was extracted from young
leaves of KPS1, V4718, F2 and BC1F1 individuals
using the method described by Lodhi et al. (1994)
with a slight modification. The DNA was quantified
against a lambda DNA on 1.0% agarose gel stained
with ethidium bromide and diluted to 1 ng/ll for PCR
amplification.
256 Mol Breeding (2011) 28:255–264
123

Evaluation of disease resistance
For the F2 population, the parents, F1 and F2:3
progenies were planted in a randomized complete
block design (RCBD) with two replications in the wet
seasons (August to October) of 2008 and 2009 at
Kasetsart University, Kamphaeng Saen Campus,
Nakhon Pathom, Thailand. In the case of the BC1F1
population, the parents, F1 and BC1F2 progenies were
planted in RCBD with two replications during the wet
season of 2008. In all experiments, each entry was
sown in a single row of 2 m long with 12.5 cm intra-
row and 50 cm inter-row spacings, with two plants
per hill (ca. 32 plants/row). Ten days prior to planting
these materials, a highly susceptible mungbean
germplasm, V1197, was sown around and between
the experimental blocks as a natural source of CLS
inoculums. At 20, 25 and 30 days after planting
(DAP), spore suspensions were artificially inoculated
to all entries. After inoculation, conidia taken from
infected plants were examined using a light micro-
scope to confirm that the disease symptoms were the
results of infection by C. canescens. Infection on the
leaves of each plant was scored for CLS reaction at
40 DAP on a scale of 1–5, where 1 = no visual
disease infection, 2 = 1–25% leaf area infected,
3 = 26–50% leaf area infected, 4 = 51–75% leaf
area infected, and 5 = 76–100% leaf area infected.
Scoring was conducted by a panel of three trained
staff. Lines with the disease score 1 or 2 were
classified as resistant, and those with disease score 3,
4 or 5 were considered susceptible. The average
scores across plants in each row were used for
statistical and QTL analyses in each of the three
experiments.
SSR marker analysis
Seven hundred and fifty-three simple sequence repeat
(SSR) primer pairs from various legumes were used
to detect polymorphism between KPS1 and V4718.
Among them, 433 were from mungbean [V. radiata
(L.) Wilczek] (Kumar et al. 2002a, b; Gwag et al.
2006; Somta et al. 2008, 2009; Seehalak et al. 2009;
Tangphatsornruang et al. 2009), 188 from azuki bean
[V. angularis (Ohwi) Ohwi & Ohashi] (Wang et al.
2004), 46 from cowpea [V. unguiculata (L.) Walp.]
(Li et al. 2001), and 86 from common bean (Phase-
olus vulgaris L.) (Gaitan-Solıs et al. 2002; Guerra-
Sanz 2004; Buso et al. 2006; Blair et al. 2003). All
the polymorphic markers were used to analyze the F2
population. Upon linkage map construction in the F2
population, only polymorphic markers on linkage
group 3 were used to analyze the BC1F1 population.
PCR was carried out in a total volume of 10 ll
containing 2 ng of DNA template, 19 Taq buffer,
2 mM MgCl2, 0.2 mM dNTPs, 1 U Taq DNA
polymerase (Fermentas) and 5 pmol each of forward
and reverse primers. Amplification was performed in
a GeneAmp� PCR System 9700 thermocycler
(Applied Biosystems) programmed as follow: 94�C
for 2 min followed by 35 cycles of 94�C for 30 s,
50–65�C for 30 s, 72�C for 1 min, with a final
extension step of 72�C for 10 min. The PCR products
were separated on 5% denaturing polyacrylamide gel
and visualized by silver staining.
Chi-square analysis
A chi-square (v2) test (Mather 1951) was used to
determine goodness of fit to 3:1 and 1:1 (resis-
tance:susceptible) ratio in the F2 and BC1F1 popula-
tions, respectively.
Linkage and QTL analyses
Genetic linkage maps were constructed with JoinMap
3.0 (Van Ooijen and Voorrips 2001) using data from
the F2 population. The calculation was set with the
minimum logarithm of the odds (LOD score) at 3.0
and the maximum recombination frequency (r) at 0.5,
using the Kosambi mapping function (Kosambi
1944). Since genetic linkage maps of Asian Vigna,
which mungbean belongs to, are highly conserved
(Chaitieng et al. 2006; Somta et al. 2006), markers
that were common to the azuki bean map reported by
Han et al. (2005) were compared and assigned to
linkage groups. In BC1F1 population, only linkage
group 3 was constructed, and used for QTL
confirmation.
QTL associating with CLS resistance were pre-
liminarily determined by single regression analysis
(Kearsey and Pooni 1996) using R-program. Single
marker analysis is useful for identifying marker(s)
linked to a trait or a QTL. It also gives a clue to the
number, effect and location of the QTL for a trait. To
locate QTL for resistance to CLS, a composite
interval mapping (CIM) (Zeng 1994) was performed
Mol Breeding (2011) 28:255–264 257
123

using WinQTL Cartographer 2.5 (Wang et al. 2007).
The analysis was done on the data of line means from
individual experiments. Permutation tests (Churchill
and Doerge 1994) were run 10,000 times at the
significance level of P = 0.01 to determine a LOD
score threshold for declaring a significant QTL.
Results
Mode of inheritance of CLS resistance
In the experiments conducted in 2008, disease
symptoms of CLS appeared at 20 days after inocu-
lation (DAI). KPS1 was highly susceptible (disease
score 5) to the disease, whereas V4718 was immune
to the disease (disease score 1). All F1 plants were
immune to the disease, suggesting that CLS resis-
tance in V4718 was conditioned by a dominant
gene. F2 and BC1F1 progenies differed in their CLS
response. The disease scores varied from 1 to 5 in
both populations with means of 2.26 and 3.60,
respectively (Fig. 1). In the F2 population, 116 lines
were classified as resistant and 39 lines as suscepti-
ble. Chi-square analysis revealed that the segregation
fitted with a 3:1 resistant:susceptible ratio (v2 =
0.002, P = 0.963) (Table 1). In the BC1F1 popula-
tion, 30 and 46 lines were classified as resistant and
susceptible, respectively. The segregation followed
a 1:1 resistant:susceptible ratio (v2 = 3.368, P =
0.067) (Table 1). These results indicated that resis-
tance to CLS disease in V4718 was inherited to KPS1
as a single dominant gene.
The result from the F2 population conducted in
2009 was similar to that of 2008. The disease
symptoms first appeared at 20 DAI. KPS1 was highly
susceptible, while V4718 and the F1 population were
highly resistant. Disease scoring in the F2 plants
ranged from 1 to 4.50 with the mean of 1.97 (Fig. 1),
and again 116 of them (although not exactly the same
lines) were classified as resistant and 39 as suscep-
tible (Table 1). The results confirmed that CLS
resistance in V4718 was conditioned by a single
gene.
Construction of an SSR linkage map
The genomes of V4718 and KPS1 were rather
similar. Although 496 out of 753 (65.87%) SSR
markers amplified DNA of the two genotypes
(Table 2), only 69 (13.91%) of the amplifiable
markers showed polymorphism. Of these SSRs, 27
were from mungbean, 41 from azuki bean, and 1
from cowpea (Table 2). None of the common bean
SSRs showed polymorphism between the parents. In
the F2 population, 56 markers could be assigned to
the linkage map (Fig. 2), while 13 markers remained
unlinked. The linkage map consisted of 11 linkage
groups (LGs) (LOD C 3) with a total genetic distance
(a)
(b)
(c)
Fig. 1 Frequency distribution of disease scores for response to
Cercospora leaf spot in the F2 population (KPS1 9 V4718)
evaluated in rainy season of 2008 (a) and 2009 (b), and in
BC1F1 population [(KPS1 9 V4718) 9 KPS1] evaluated in
rainy season of 2008 (c)
258 Mol Breeding (2011) 28:255–264
123
of 995.6 cM (Fig. 2) and an average density of 17.78
cM per marker. The LGs were named after azuki
bean LGs reported previously by Han et al. (2005).
Based on 30 common markers locating on our linkage
map and that of Han et al. (2005), all of them were
conserved on both maps with a few inversions of
marker order (Electronic Supplementary Material
S1). This indicates high genome homology between
mungbean and azuki bean.
When all the markers on LG 3 of the F2 linkage
map were used to construct a linkage map in the
BC1F1 population, LG 3 of the BC1F1 was 59.2 cM in
length.
Locating the QTL conditioning CLS resistance
Single regression analysis in the F2 population using
phenotypic data from the years 2008 and 2009 showed
that seven markers, namely CEDC031, CEDG044,
CEDG084, CEDG117, CEDG305, VR108 and
VR393, associated with CLS resistance (P \ 0.01)
(Table 3). All of them were located on LG 3, except
CEDG044 which was located on LG 11 (Fig. 2).
When the 2008 data were employed, the coefficient of
determination (R2) of these markers ranged from
3.26% (CEDG044) to 50.71% (VR108). From the
2009 data, the R2 of the seven markers ranged from
2.48% (CEDG044) to 44.55% (CEDG117). All the
markers were also found associating with CLS resis-
tance in the BC1F1 population (Table 3). The R2 of the
markers ranged from 6.11% (CEDG044) to 80.81%
(CEDG117).
Permutation analyses (10,000 runs at P = 0.01)
for the 2008 and 2009 data of the F2 population
revealed that LOD score thresholds for QTL were
19.4 and 15.8, respectively. In both years, CIM
consistently identified one major QTL for CLS
resistance (Table 4; Fig. 3). The QTL was designated
qCLS-1. It was located between markers CEDG117
and VR393 on LG 3 at 26.91 and 24.91 cM using the
2008 and 2009 data, respectively. The qCLS-1
showed a LOD score of 42.91 and 29.13, and
explained 78.22 and 65.15% of the phenotypic
variation in the 2008 and 2009 data, respectively.
Additive effects of the qCLS-1 were –1.46 and –0.81
while dominant effects were –0.76 and –0.50, in the
disease scores for 2008 and 2009 data, respectively.
The allele from V4718 contributed to the reduction in
disease score (increasing resistance).
The QTL for resistance identified in the F2
population was confirmed by the analysis in BC1F1
population. The LOD score threshold for QTL in the
BC1F1 population as determined by permutation was
16.7. CIM detected one major QTL, designated
qCLS-2, on LG 3 at 31.6 cM between markers
CEDG117 and VR393 (Table 4; Fig. 3). qCLS-2 was
1.9 and 6.6 cM away from CEDG117 and VR393,
respectively. The QTL exhibited a LOD score of
32.15 and accounted for 80.53% of the disease
variation. The additive effect of the qCLS-2 was
–2.92 of disease score, while the dominance effect
could not be estimated in a backcross model. The
allele from V4718 decreased the disease score and
appeared to be the same as qCLS-1.
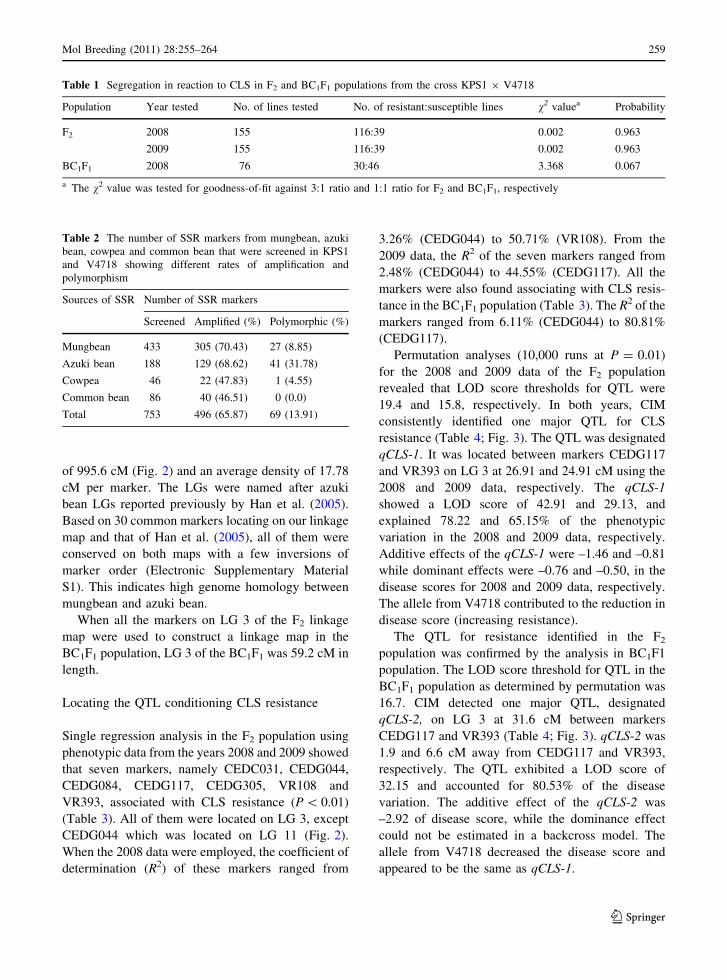
Table 1 Segregation in reaction to CLS in F2 and BC1F1 populations from the cross KPS1 9 V4718
Population Year tested No. of lines tested No. of resistant:susceptible lines v2 valuea Probability
F2 2008 155 116:39 0.002 0.963
2009 155 116:39 0.002 0.963
BC1F1 2008 76 30:46 3.368 0.067
a The v2 value was tested for goodness-of-fit against 3:1 ratio and 1:1 ratio for F2 and BC1F1, respectively
Table 2 The number of SSR markers from mungbean, azuki
bean, cowpea and common bean that were screened in KPS1
and V4718 showing different rates of amplification and
polymorphism
Sources of SSR Number of SSR markers
Screened Amplified (%) Polymorphic (%)
Mungbean 433 305 (70.43) 27 (8.85)
Azuki bean 188 129 (68.62) 41 (31.78)
Cowpea 46 22 (47.83) 1 (4.55)
Common bean 86 40 (46.51) 0 (0.0)
Total 753 496 (65.87) 69 (13.91)
Mol Breeding (2011) 28:255–264 259
123

Discussion
Although several mungbean accessions were identi-
fied as highly resistant to CLS disease, only a few of
them (including V4718) showed stable resistance in
different seasons and years in Taiwan (Hartman et al.
1993). We demonstrated in this study that V4718 also
exhibited a stable resistance to CLS in Thailand over
2 years. Therefore, V4718 is a potential source for
exploiting the resistance gene.
Broad- and narrow-sense heritability of CLS
resistance have been estimated to be as high as 99
and 75%, respectively (Hartman et al. 1993). How-
ever, different modes of inheritance of the resistance
were reported by different research groups (AVRDC
1974, 1980; Thakur et al. 1977; Mishra et al. 1988;
Lee 1980), suggesting that there may be more than
one source of resistance to CLS. In our study, the
segregation of 3:1 and 1:1 for resistant and suscep-
tible progenies in the F2 and BC1F1 populations,
respectively, confirmed that a single dominant gene
controls the resistance. Thus it should not be difficult
for a plant breeder to transfer the resistance gene
from V4718 to susceptible cultivars by using standard
VR4130.0
CEDG2847.4
CEDG00619.7
LG2A
CEDG2440.0
VR25623.3
GBssr-MB8745.6
DMB-SSR16066.4
CEDAAG00299.0
CEDC050107.1
LG2B
CEDC0310.0CEDG0846.4VR10811.3
CEDG11720.9
VR39333.7
CEDG30550.9
LG3
CEDC0550.0
DMB-SSR19944.9CEDG15448.3
CEDG08866.3
CEDG232108.9
DMB-SSR167134.1
VR-SSR035157.1
LG4
CEDG0140.0
MB-SSR3942.7
DMB-SSR21856.9
LG5
VR0950.0
CEDG03750.8
CEDG12171.5
CEDG245119.9
LG6
CEDG0730.0
CEDG04040.4GBssr-MB09145.5
CEDG24786.2
CEDG071138.2
LG8
VR-SSR0100.0
DMB-SSR13017.5
CEDG30429.5
CEDG25943.0
VM2779.0
MB-SSR8796.2VR098103.1
VR354120.0
CEDG228133.6
CEDG173152.0
LG9
VR2930.0
CEDG19829.5
LG10A
CEDG1160.0
CEDG15040.3
CEDG00850.1
CEDG02158.2
CEDG24379.6
LG10B
MB-SSR1640.0
VR30431.2VR30537.5
CEDG04444.7
CEDG18185.6
LG11
Fig. 2 An SSR linkage map of mungbean constructed from F2 population from the cross KPS1 9 V4718
260 Mol Breeding (2011) 28:255–264
123

breeding methods for a self-pollinated species such as
backcross, bulk and pedigree breeding.
We are the first group to identify QTL for CLS
resistance in mungbean. Identification of a single
major QTL for the resistance to CLS by CIM in both
F2 and BC1F1 is in agreement with the Mendelian
segregation of the resistance. The same QTL was
detected in different environments (years) and pop-
ulations, although the weather conditions between the
two environments were relatively different (Elec-
tronic Supplementary Material S2). Using the F2 data,
the QTL detected in 2008 and 2009 data were nearly
the same, while the variations explained by the QTL
(R2) were comparable. Therefore, the major QTL
detected is considered highly robust. Although
another small effect QTL was detected on LG 11
by marker regression analysis, its effect is too small
to use in marker-assisted selection (MAS) (Table 3).
The level of polymorphism between V4718 and
KPS1 is low, as only 13.91% of 496 SSR markers
were polymorphic. This is because the two mung-
beans were cultivated varieties. However, Xu et al.
(2008) reported that the gene pool of cultivated
mungbean is much narrower than that of azuki bean.
Table 3 SSR markers associated with Cercospora leaf spot disease in F2 and BC1F1 populations as revealed by single regression
analysis
Markers (LGa) Population Year 2008 Year 2009
R2 (%)b Probability R2 (%)b Probability
CEDG031 (3) F2 37.16 \0.0001 31.24 \0.0001
BC1F1 28.49 \0.0001
CEDG084 (3) F2 39.60 \0.0001 32.77 \0.0001
BC1F1 46.53 \0.0001
VR108 (3) F2 50.71 \0.0001 43.96 \0.0001
BC1F1 73.79 \0.0001
CEDG117 (3) F2 50.61 \0.0001 44.55 \0.0001
BC1F1 80.81 \0.0001
VR393 (3) F2 42.28 \0.0001 32.50 \0.0001
BC1F1 62.67 \0.0001
CEDG305 (3) F2 23.94 \0.0001 22.69 \0.0001
BC1F1 26.87 \0.0001
CEDG044 (11) F2 3.26 0.0151 2.48 0.0297
BC1F1 6.11 0.0205
a Linkage groupb Coefficient of determination
Table 4 Quantitative trait loci conditioning resistance to Cercospora leaf spot in the F2 (KPS1 9 V4718) and BC1F1
[(KPS1 9 V4718) 9 KPS1] populations as detected by composite interval mapping
Population Year QTL namea LGb Marker interval Position (cM)c LOD score PVE (%)d Additive
effect
Dominant
effect
F2 2008 qCLS-1 3 CEDG117–VR393 26.91 42.91 78.22 –1.46 –0.76
2009 qCLS-1 3 CEDG117–VR393 24.91 29.13 65.15 –0.81 –0.50
BC1F1 2008 qCLS-2 3 CEDG117–VR393 31.67 32.15 80.53 –2.92
a QTL that showed similar position and effect in the same population were assigned the same nameb Linkage groupc Position on the linkage groupd Percentage of phenotypic variance explained by the QTL
Mol Breeding (2011) 28:255–264 261
123

The low polymorphism between the parental mung-
beans resulted in low genome coverage of the genetic
linkage map developed in the current study. Although
the mungbean linkage map developed in this study
and the azuki bean linkage map developed by Han
et al. (2005) revealed high genome conservation,
our map is lacking in LG 1 and LG 7 (Electronic
Supplementary Material S1). Thus minor QTL in LG
1 and LG 7, if any exist, were not detected.
There are few reports of QTL studies in mungbean
(Somta and Srinives 2007). qCLS identified in this
study shows no linkage with QTL (genes) previously
reported in mungbean for resistance to insects [azuki
bean weevil (Callosobruchus chinensis L.) and pod-
sucking bug (Riptortus clavatus Thunberg)] (Hong
2006), and to powdery mildew disease (caused by
fungus Erysiphe polygoni D.C.) (Kasettranan et al.
2010). This confirms the report by Thakur et al.
Fig. 3 Position of the QTL conditioning Cercospora leaf spot
resistance (qCLS) and LOD score plotted for composite
interval mapping (CIM) on linkage group 3 in the F2 (a) and
BC1F1 (b) populations derived from the cross KPS1 9 V4718.
The solid and dashed lines parallel to the linkage map in
a represents LOD threshold from F2 data in 2008 and 2009,
respectively. The solid line parallel to the linkage map in
b represents LOD threshold from BC1F1 data in 2008
262 Mol Breeding (2011) 28:255–264
123

(1977) that genes conferring resistance to CLS and
powdery mildew disease inherited independently.
Thus it would be easier to apply MAS to select for
unlinked rather than linked genes in order to improve
resistance to these biotic stresses.
Since C. canescens cannot be maintained by
artificial culture and only occurs in the wet season,
traditional breeding for resistance can be done in only
one crop per year. However, field screening for
resistance is laborious and inefficient if the weather is
not suitable for disease occurrence or if the disease is
not uniformly distributed in the field. These limita-
tions and difficulties can be overcome by MAS. The
qCLS was confirmed for its position and effect, and
therefore CEDG117 and VR393 flanking it are
valuable tools for selecting CLS-resistant genotypes
in mungbean breeding programs by enabling the
breeder to select for resistance progenies off-season
and then confirm existence of the resistance gene by
evaluating the progenies in the wet season. This
should help accelerate breeding for CLS resistance in
mungbean.
Acknowledgments This research was supported by the
National Science and Technology Development Agency
(NSTDA), Thailand. S. Chankaew is grateful to NSTDA for a
Master student scholarship. The authors thank Dr. Akito Kaga of
the National Institute of Agrobiological Sciences, Japan, for
providing azuki bean SSR marker information on LG 3. We also
thank the Center for Agricultural Biotechnology, Kasetsart
University, Kamphaeng Saen Campus, Thailand for lab facilities.
References
AVRDC (1974) AVRDC Progress Report 1974. Asian vege-
table research and development center, Shanhua, Taiwan,
Republic of China. 978
AVRDC (1980) AVRDC Progress Report 1980. Asian vege-
table research and development center, Shanhua, Taiwan,
Republic of China
AVRDC (1984) AVRDC Progress Report 1984. Asian vege-
table research and development center, Shanhua, Taiwan,
Republic of China
Blair MW, Pedraza F, Buendia HF, Gaitan-Solıs E, Beebe SE,
Gepts P, Thome J (2003) Development of a genome-wide
anchored microsatellite map of common bean (Phaseolusvulgaris L.). Theor Appl Genet 107:1362–1374
Buso GSC, Amaral ZPS, Brondani RPV, Ferreira ME (2006)
Microsatellite markers for the common bean Phaseolusvulgaris. Mol Ecol Notes 6:252–254
Chaitieng B, Kaga A, Tomooka N, Isemura T, Kuroda Y,
Vaughan DA (2006) Development of a black gram [Vignamungo (L.) Hepper] linkage map and its comparison with
an azuki bean [Vigna angularis (Willd.) Ohwi and
Ohashi] linkage map. Theor Appl Genet 113:1261–1269
Chupp C (1953) A monograph of the fungus genus Cercos-pora. Cornell University, Ithaca
Churchill GA, Doerge RW (1994) Emprirical threshold values
for quantitative trait mapping. Genetics 138:963–971
Collard BC, Mackill DJ (2008) Marker-assisted selection: an
approach for precision plant breeding in the twenty-first
century. Phil Trans R Soc B 363:557–572
Gaitan-Solıs E, Duque MC, Edwards KJ, Thome J (2002)
Microsatellite repeats in common bean (Phaseolus vul-garis): isolation, characterization, and cross-species
amplification in Phaseolus ssp. Crop Sci 42:2128–2136
Grewal JS, Machendra P, Kulshrestha DP (1980) Control of
Cercospora leaf spot of green gram by spraying Bavistin.
Indian J Agric Sci 50:707–711
Guerra-Sanz JM (2004) New SSR markers of Phaseolus vul-garis from sequence databases. Plant Breed 123:87–89
Gwag JG, Chung WK, Chung HK, Lee JH, Ma KH, Dixit A,
Park YJ, Cho EG, Kim TS, Lee SH (2006) Character-
ization of new microsatellite markers in mungbean, Vignaradiata (L.). Mol Ecol Notes 6:1132–1134
Han OK, Kaga A, Isemura T, Wang XW, Tomooka N,
Vaughan DA (2005) A genetic linkage map for azuki bean
[Vigna angularis (Willd.) Ohwi & Ohashi]. Theor Appl
Genet 111:1288–1299
Hartman GL, Wang TC, Kim DW (1993) Field evaluation of
mungbeans for resistance to Cercospora leaf spot and
powdery mildew. Int J Pest Manage 39:418–421
Hong MG (2006) Development of molecular marker for the
resistance gene to Callosobruchus chinensis (L.) and
Riptortus clavatus Thunberg in Vigna radiata (L.). MS
thesis, Seoul National University, Korea
Kasettranan W, Somta P, Srinives P (2010) Mapping of
quantitative trait loci controlling powdery mildew resis-
tance in mungbean (Vigna radiata (L.) Wilczek). J Crop
Sci Biotech (submitted)
Kearsey MJ, Pooni HS (1996) The genetical analysis of
quantitative traits. Chapman & Hall, London
Kosambi DD (1944) The estimation of map distances from
recombination values. Ann Eugen 12:172–175
Kumar SV, Tan G, Quah SC, Yusoff K (2002a) Isolation of
microsatellite markers in mungbean, Vigna radiata. Mol
Ecol Notes 2:96–98
Kumar SV, Tan SG, Quah SC, Yusoff K (2002b) Isolation and
characterization of seven tetranucleotide microsatellite
loci in mungbean, Vigna radiata. Mol Ecol Notes
2:293–295
Leabwon U, Oupadissakoon S (1984) Inheritance of resistance
to Cercospora leaf spot in mungbean. Kasetsart J (Nat Sci)
18:14–19
Lee YB (1980) Inheritance study on resistance to Cercospora
leaf spot in mungbean. Asian Vegetable Research and
Development Center, Shanhua, Taiwan
Li C-D, Fatokun CA, Ubi B, Singh BB, Scoles GJ (2001)
Determining genetic similarities and relationships among
cowpea breeding lines and cultivars by microsatellite
markers. Crop Sci 41:189–197
Lodhi MA, Ye GN, Weeden NF, Reisch BI (1994) A simple
and efficient method for DNA extraction from grapevine
cultivars and Vitis species. Plant Mol Biol Rep 12:6–13
Mol Breeding (2011) 28:255–264 263
123

Mather K (1951) The measurement of linkage in heredity.
Methuen and Co. Ltd., London
Mishra SP, Asthana AN, Lallan Yadav (1988) Inheritance of
Cercospora leaf spot resistance in mungbean, Vignaradiata (L.) Wilczek. Plant Breed 100:228–229
Seehalak W, Somta P, Musch W, Srinives P (2009) Micro-
satellite markers for mungbean developed from sequence
database. Mol Ecol Resour 9:862–864
Somta P, Srinives P (2007) Genome research in mungbean
(Vigna radiata (L.) Wilczek) and blackgram (V. mungo(L.) Hepper). ScienceAsia 33 (Suppl 1):69–74
Somta P, Kaga A, Tomooka N, Kashiwaba K, Isemura T, Cha-
itieng B, Srinives P, Vaughan DA (2006) Development of
an interspecific Vigna linkage map between Vigna umbel-lata (Thunb.) Ohwi & Ohashi and V. nakashimae (Ohwi)
Ohwi & Ohashi and its use in analysis of bruchid resistance
and comparative genomics. Plant Breed 125:77–84
Somta P, Musch W, Kongsamai B, Chanprame S, Nakasathien
S, Toojinda T, Sorajjapinun W, Seehaluk W, Tragoonrung
S, Srinives P (2008) New microsatellite markers isolated
from mungbean (Vigna radiata (L.) Wilczek). Mol Ecol
Resour 8:1155–1157
Somta P, Seehalak W, Srinives P (2009) Development, char-
acterization and cross-species amplification of mungbean
(Vigna radiata) genic microsatellite markers. Conserv
Genet 10:1939–1943
Tangphatsornruang S, Somta P, Uthaipaisanwong P, Chanprasert
J, Sangsrakru D, Seehalak W, Sommanas W, Tragoonrung S,
Srinives P (2009) Characterization of microsatellites and
gene contents from genome shotgun sequences of mungbean
(Vigna radiata (L.) Wilczek). BMC Plant Biol 9:137
Thakur RP, Patel PN, Verma JP (1977) Genetical relationships
between reactions to bacterial leaf spot, yellow mosaic
and Cercopsora leaf spot diseases in mungbean (Vignaradiata). Euphytica 26:765–774
Van Ooijen JW, Voorrips RE (2001) JoinMap�3.0: software
for the calculation of genetic linkage maps. Plant
Research International, Wageningen
Wang XW, Kaga A, Tomooka N, Vaughan DA (2004) The
development of SSR markers by a new method in plants
and their application to gene flow studies in azuki bean
(Vigna angularis (Willd.) Ohwi & Ohashi). Theor Appl
Genet 109:352–360
Wang S, Basten CJ, Zeng Z-B (2007) Windows QTL cartog-
rapher 2.5. Department of statistics, North Carolina State
University, Raleigh
Xu HX, Jing T, Tomooka N, Kaga A, Isemura T, Vaughan DA
(2008) Genetic diversity of the azuki bean (Vigna angu-laris (Willd.) Ohwi & Ohashi) gene pool as assessed by
SSR markers. Genome 51:728–738
Zeng Z-B (1994) Precision mapping of quantitative trait loci.
Genetics 136:1457–1466
264 Mol Breeding (2011) 28:255–264
123