EFFECT OF TREE AGE ON VARIATION OF PINUS RADIATA D. DON CHEMICAL COMPOSITION
Upload
khangminh22Category
view
0download
0
Botanical Studies on Mung bean
(Vigna radiata) Plants Under Some
Growth Conditions
By
Ibrahim Abd EL-Moniem Ibrahim Ismaiel
B.Sc. Agricultural Science, 1998
In Agricultural Botany
Fac. Agric., Moshtohor, Zagazig Univ.
A Thesis Submitted in partial Fulfillment
Of
the Requirements for the Degree of
Master of Science
IN
Agricultural Science
(Agricultural Botany)
Department of Agricultural Botany
Faculty of Agriculture, Moshtohor
Zagazig University, Benha Branch
2004

CONTENTS
Page
INTRODUCTION 1-5
REVIEW OF LITERATURE 6-28
I- Effect of the NPK fertilization levels on the vegetative growth 6
II- Effect of the NPK fertilization levels on the yield and yield characters 9
III- Effect of the the NPK fertilization levels on the chemical
constituents 22
IV- Effect of the NPK fertilization levels on the internal structure 26
MATERIALS AND METHODS 29-38
EXPERIMENTAL RESULTS 39-133
I- Effect of the NPK levels on the seed germination of the two assigned
mung bean cultivars 39
II- Effect of the NPK levels on plant growth characters of the two
assigned mung bean cultivars 42
II.1- Cultivar Giza-1 42
II.2- Cultivar Kawmi-1 66
III- Effect of the NPK levels on the yield and yield components of the two
assigned mung bean cultivars 89
III.1- Cultivar Giza-1 89
III.2- Cultivar Kawmi-1 93
IV- Effect of the NPK levels on percentage of the flower setting of the two
assigned mung bean cultivars 95
V- Effect of the NPK levels on the biological and chemical constituents of the
two assigned mung bean cultivars 97
V.1- Photosynthetic pigments 97
V.1.1- Cultivar Giza-1 (30 and 69 days after sowing) 97
V.1.2- Cultivar Kawmi-1 (30 and 60 days after sowing) 98
V.2- N, P, K and total crude protein contents 100
V.2.1- Cultivar Giza-1 100
V.2.2- Cultivar Kawmi-1 100
V.3- carbohydrate content (mg/g dry weight) of the
mung bean cultivars Giza-1 and kawmi-1 108
V.3.1- Cultivar Giza-1 108
V.3.2- Cultivar Kawmi-1 112
VI- Effect of the NPK levels on the anatomical structure of the two
assigned mung bean cultivars 117
VI.1- Leaf blade 117
VI.2- leaf midrib 118
VI.3- Stem 119
VI.4- Flower pedicle 120
DISSCUSSION 134-147
SUMMERY 148-158
REFERENCES 159-170
ARABIC SUMMERY -
List of abbreviations
% percentage
micron = 1/1000 millimeter
nm nanometer = 1/1000000 millimeter
~ nearly
±% percentage of increase or decrease relative to control
w/v weight to volume
R (control) recommended dose without rhizobium inoculation
(control)
R+I recommended dose associated with rhizobium inoculation
0C celsius degree
1/2R half recommended dose without rhizobium inoculation
1/2R+I half recommended dose associated with rhizobium
inoculation
2R double recommended dose without rhizobium inoculation
2R+I double recommended dose associated with rhizobium
inoculation
AGR absolute growth rate
av. average
CGR crop growth rate
cm. centimeter
CP crude protein
Cv. cultivar
Dal or Dahl a spicy past made from the dry seed
DAP diammonium phosphate
DAS days after sowing
DM dry matter
e.x. for example
fed. feddan = 4200 m2
Fig. figure
g. or gm gram = 1/1000 kilo gram
ha hectare = 2.4709 feddan
HF high fertility
i.e = for example
K potassium
Kg kilo gram = 1000 gram
L.A.I leaf area index
L.S.D least significant difference
m2 miter squired
mls. (plur.) milliliter = 1/1000 liter
N nitrogen
N normal
NS non significant
P phosphorous
P. radiatus Phseolus radiatus = mungbean = green gram
RF recommended fertility
RGR relative growth rate
SEP seed emergence percentage
ssp single superphosphat
t. ton = 1000 kilo gram
V. radiata Vigna radiata = mungbean = green gram
viz namely

1
INTRODUCTION
The mung bean (Vigna radiata) is a member of the legume
family (Fabaceae). This family is a wide spread family as it
occupies the third largest family of flowering plants, with
approximately 650 genera and nearly 20,000 species (Doyle, 1994).
Mung bean has many local names “mung bean, mash, golden gram
or green gram”.
The species ranges from large tropical canopy trees to small
herbs found in temperate zones, humid tropics, aride zones, high
lands, savannas, and low lands (NAS/NRC, 1979).
Pulses are important world food crops because they provide
an inexpensive source of vegetable dietary protein. In many
densely populated areas of the world, the economy does not support
large-scale production and utilization of animal protein. In those
areas, the protein in people’s diets may be augmented by
supplementation with the protein-rich pulse seeds. In addition to
being less expensive than animal protein, pulse seeds provide a
source of rich protein for those people who prefere vegetable to
animal protein in their diet for cultural or religious reasons. Pulse
seed proteins nutrionally complement the proteins in cereal seeds;
when eaten together a diet nutrionally balanced in protein may be
enjoyed.
In this investigation mung bean was chosen to be the scientific
material for many advantages. It is considered as a new introduced
crop in Egypt and little is known about its nutrient requirements

2
and perfect ways of application and practices; this is why in this
research the work is scoped on fertilization and the application of
rhizobium aiming to increase the productivity of this crop. In
Egypt, this crop might be a promising source of human and animal
food especially during summer season. Lastly, it matures quickly
(about 70-90 days) and it does not compete with the main winter
crops as wheat or berseem (Trifolium alexandrenum).
Hence, mung bean should be considered in the future a
promising crop especially in the reclaimed lands. This crop is a
new introduced one in several countries i.e. Australia and China
(Imrie and Lawn 1991).
Botanical features of mung bean (Vigna radiata L.
(Wilckzek)) plant
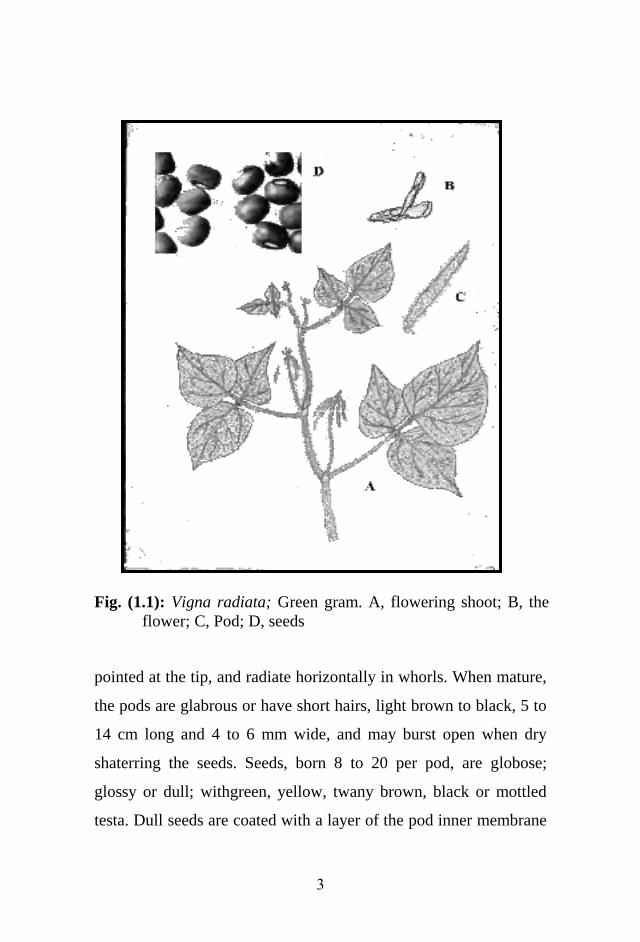
Discription of the mung bean have been published by
Baldev, 1988 (fig. 1.1). The mung bean is an annual, semi erect to
erect or sometimes twining, deep- rooted herb, 25-100 cm tall.
Stems branch at the base and covered with short fine brownish
hairs. Leaves are alternate and trifoliate, or sometimes with five
leafletes. Leaflets are medium to dark green, broadly ovate,
sometimes lobbed, rounded at the base and pointed at the apex, 5 to
12 cm long, and 2 to 10 cm wide. The crop begins flowering 50 to
60 days after sowing, and then continue flowering for a few weeks;
the leaves dry down but may not drop off completely. From 10 to
25 flowers are born in axillary clusters or racemes. The flowers are
greenish to bright yellow, with a graytinged keel, 1 to 1.75 cm in
diameter. The pods are cylindirical, straight to strongly curved,
3
Fig. (1.1): Vigna radiata; Green gram. A, flowering shoot; B, the
flower; C, Pod; D, seeds
pointed at the tip, and radiate horizontally in whorls. When mature,
the pods are glabrous or have short hairs, light brown to black, 5 to
14 cm long and 4 to 6 mm wide, and may burst open when dry
shaterring the seeds. Seeds, born 8 to 20 per pod, are globose;
glossy or dull; withgreen, yellow, twany brown, black or mottled
testa. Dull seeds are coated with a layer of the pod inner membrane

4
which may be translucid or pigmented and which covers a shiny
testa. Seeds vary in weight from 15 to 85 milligrams, generally
averaging 25 to 30 thousand seeds per kilogram. The hilum is
round, flat (non-concave) and white. Seed germination is epigeal.
Flowers are self-fertile and highly self-polinated. Flowering is
indeterminate and may continue over a period of several weeks if
the plant stays healthy. Pods mature in about 20 days after
flowering. Rapid senscence does not occure.
Origin and distribution of Mung bean
The crop is of ancient cultivation in India and the plant is
not found in a wild state. It is probably derived from Phaselus
radiatus L., which occurs wild throughout India and Burma, and
which is occasionally cultivated, (Ligon, 1945).
Green gram is said to have been widely cultivated in India
and adjacent regions for several thousand years, and to have spread
at an early time into other Asian countries and to northern Africa.
Its present wide distribution throughout the tropics and subtropics
of Africa, the west of India, north of America and Australia is
comparatively recent. Currently, green gram is the most important
seed legume in Thailand and the Philippines; it ranks second in Sri
Lanka and third in each of India, Burma, Bangladesh and
Indonesia. It is a minor crop in Australia, China, Iran, Kenya,
Korea, Malaysia, the Middle East, Peru, Taiwan and the USA
(Summerfield and Roberts, 1985).
5
Economical aspects of mung bean
Vigna radiata is an important crop in India, where it is
considered as the most important among the pulses, free from the
heaviness and tendency to flatulence which is associated with other
pulses. An ethnic use of mung bean is for dal (or dahl); a spicy past
made from the dry seed. The seeds of mung bean are parched and
ground into flour after removal of the testa, the flour being used in
various Indian and Chinese dishes. The green pods are eaten as a
vegetable. In China and United States it is used for bean sprouts.
The bean are soaked overnight, drained and placed in containers in
a dark room. They are sprinkled with warm water every few hours
and the sprouts are ready in about a week. One pound of dry beans
gives 6-8 lb of sprouts. The haulms are used as fodder and the
husks and split beans are a useful livestock food. The crop is also
grown for hay, green manure and as cover crop (Duke, 1981).
6
REVIEW OF LITERATURE
II--EEffffeecctt ooff tthhee NNPPKK ffeerrttiilliizzaattiioonn lleevveellss oonn tthhee vveeggeettaattiivvee ggrroowwtthh::
Basu, et al., (1989) found that, applying 20, 30 or 40 kg
N/ha proved that the shoot dry weight of Vigna radiata cv. B1 was
increased with the applications up to 40 kg N.
Gupta and Rai (1989) showed that, V. radiata crops sown
on 5 Apr. produced longer roots with greater number of lateral
roots than those sown on 15 Mar. or 26 Apr. Increasing P rates
from 0 to 15 and 30 kg/ha increased root length and proliferation.
Sadasivam, et al., (1990) found that, Vigna radiata cv. CO3
produced 50.3, 53.8, 49.7 and 61.8 g dry matter yield/plant with no
K, 25 kg K2O/ha, 1% KCl spray and 1% K2SO4 spray at flowering,
respectively.
Sangakkara (1990) studied the effects of 0-120 kg K2O/ha
applied as a basal dressing or split application (60:40 at planting
and flowering) on growth parameters of mung beans. K application
did not affect germination and establishment but increased plant
growth rate.
Kothari and Saraf (1990) recorded that, increasing P rates
from 0 to 13 and 26 kg/ha increased dry matter accumulation in
different plant organs of V. radiata. Partitioning of dry matter in
different plant parts (leaves, stalks, pod husks, seeds) at harvest was
affected by P rates.
Reddy, et al., (1990) recorded that applying 0 or 50 kg
P2O5/ha as a basal dressing or 50 kg P2O5/ha in 2 equal split

7
dressings at sowing and flowering increased dry matter
accumulation in green gram [Vigna radiata].
Thind, et al., (1990) studied utilization of 30, 60 and 90 kg
P2O5/ha applied as diammonium phosphate solution in V. radiata.
Using 60 kg P2O5/ha gave the highest dry matter yields.
Singh and Hiremath (1990) reported that, applying 20 or
50 kg P2O5/ha to Vigna radiata, increase CGR, RGR, unit leaf rate
and LAI.
Narayanan, et al., (1991) assessed growth and nutrient
uptake in 45-d-old plants of green gram [Vigna radiata] at
recommended (NPK at 25 + 22 + 42 kg/ha) and high (NPK at 50 +
44 + 84 kg/ha) fertility levels (RF and HF, respectively). HF
increased dry matter production and the AGR, but did not change
the RGR compared with RF.
Khamparia (1995) recorded that the total dry matter
production of mung [Vigna radiata] cv. J-8 was increased by P
application alone or in combination with microphos inoculation.
Shukla and Dixit (1996a) showed that, P application at 60
kg P2O5/ha delayed flowering of green gram [Vigna radiata]
compared with the absence of P.
Saxena, et al., (1996) recorded that the seed yield of green
gram [Vigna radiata] cv. T 44 was positively correlated with leaf
area, DM/plant and number of branches.
Singh, et al., (1999) showed that, green gram [Vigna
radiata] cv. NDM-1 was given 0-26.4 kg P /ha. Growth was

8
increased with increasing both of P rate up to 26.4 kg/ha P and S
rate up to 40 kg S/ha.
Mitra, et al., (1999) stated that the green gram (Vigna
radiata) cv. GM-9002 had greater dry matter at harvest than cv.
UPM 79-12 or MH-309.
Prasad, et al., (2000) studied the effect of four potassium
levels viz., 0, 10, 20 and 30 mg K kg -1 soil (designated as K0,
K10, K20 and K30, respectively) on summer mung bean (cv. T-
44). Total biomass production increased with K20 and K30 in
comparison to control.
Battacharya and Ali (2002) stated that, the highest increase
in the plant dry matter of the investigated 6 genotypes of chickpea
(Cicer arietinum) was occurred at maturity stage. The plant relative
growth rate, however, exhibited the opposite trend. While the
highest leaf area varied with genotypes, mostly at flowering stage
or 30 days after podding. The differences in leaf area were low
during initial growth stage, increased 45 days after sowing until
flowering and then declined. They reported also that, the greater N
(52 Kg/ha) resulted in greater vegetative growth and leaf area of
chickpea (Cicer arietinum) but these advantages were not reflected
in yield. The higher N level (52 Kg/ha) increased dry matter/plant
and leaf area more significantly than control (zero kg/ha).
Kumar and Puri (2002) mentioned that, the increase of P
rate from 25 to 50 Kg/ha P2O5 resulted in significant increase in
plant height and straw yield of french bean (Phaseolus vulgaris)
compared with the control (without P). The two investigated

9
cultivars were significantly varied in all determined growth
attributes.
Ramesh et al., (2002) found that, increasing the N dose
from 0 to 100% of the recommended dose caused significant
increase in the dry matter accumulation of soybean.
Singh and Verma (2002) tested the response of french bean
(Phaseolus vulgaris) to 5 N levels (0, 30, 60, 90 and 120 Kg N/ha)
and 3 P levels (0, 30 and 60 Kg P2O5/ha). Higher dose of N (120
Kg) and P (60 Kg) resulted in higher growth (plant height, number
of branches/plant and straw yield/ha).
Prajapati et al., (2003) studied the effects of increasing N
rates from 0 to 40, 80 and 120 Kg N/ha on growth and yield
parameters as well as seed yield of french bean (Phaseolus
vulgaris). Applying the highest N rate (120 Kg) gave the highest
significant values of growth attributes (plant height, dry
weight/plant, number of branches/plant) compared with the control
(without N).
Yeman and Skjelvag (2003) applied 0, 30 and 60Kg /ha-1
P2O5 to Pisum sativum and observed that the biomass, leaf area
index and number of branches/plant positively responded with an
increase of P rate.
IIII--EEffffeecctt ooff tthhee NNPPKK ffeerrttiilliizzaattiioonn lleevveellss oonn tthhee yyiieelldd aanndd yyiieelldd
cchhaarraacctteerrss::
Ahmed, et al., (1986) reported that phosphorus application
up to 60kg/ha-1 progressively and significantly enhanced the growth
and yield parameters of mung bean (Vigna radiata L.).

11
Kamat, et al., (1986) recorded that application of 50 kg
P2O5/ha to mung [Vigna radiata] and urd [V. mungo] increased
seed yields by 16-19%.
Mahadkar and Saraf (1988a) recorded that the seed yield
of Vigna radiata was increased by increasing N and P rates and 40
kg P2O5/ha was the most effective.
Maiti, et al., (1988) applying 60 or 100 kg/ha each of P2O5
and K2O to green gram [Vigna radiata] found that, application of
50 kg N/ha increased leaf chlorophyll contents. Application of N
increased the V. radiata seed yields by 15-20% compared with that
without N.
Patel, et al., (1988) mentioned that, the application of 20 kg
P2O5/ha increased 1000-seed weight and gave average seed yields
of 0.75 t/ha compared with 0.57 t/ha without P. Yields were not
further increased with 40-60 kg P2O5/ha.
Basu, et al., (1989) found that applying 20, 30 or 40 kg
N/ha gave yields of 0.91, 0.98 and 0.90 t, resp., compared with 0.70
t without N.
Reddy, et al., (1989) showed that, P. radiatus [Vigna
radiata] and P. mungo [V. mungo] were given 0 or 21.9 kg P/ha as
a basal dressing or split equally between a basal application and
flowering. Split P application increased seed yield in both species
compared with the single application.
Basu and Bandyopadhyay (1990) recorded that, Vigna
radiata was given 0-40 kg N/ha. Number of pods/plant, seeds/pod

11
and 1000-seed wt increased with increasing N rates up to 30 kg
N/ha.
Duque and Pessanha (1990) stated that the varieties of
mung bean (Vigna radiata) were significantly varied in seed
production. Nitrogen fertilizer had greater effect on 100-seed
weight and seed yield.
Kothari and Saraf (1990) recorded that, the seed yield of
V. radiata was significantly increased by increasing P rates from 0
to 13 and 26 kg/ha.
Leelavathi, et al., (1990) applied 0, 25, 50, 100 or 200 kg
N/ha at 30 days after sowing and proved that, increasing N rates up
to 50 kg/ha increased seed yields of 5 cultivars of green gram
[Vigna radiata].
Reddy, et al., (1990) recorded that application of P
increased number of pods/plant, seeds/pod and 1000-seed weight of
green gram [Vigna radiata]. Applying 0 or 50 kg P2O5/ha as a basal
dressing or 50 kg P2O5/ha in 2 equal split dressings at sowing and
flowering produced seed yields of 65.09, 99.56 and 108.61 g/m2,
respectively.
Sadasivam, et al., (1990) claimed that, Vigna radiata cv. CO3
gave 809, 833, 870 and 890 kg seed/ha with no K, 25 kg K2O/ha, 1%
KCl spray and 1% K2SO4 spray at flowering, respectively.
Sangakkara (1990) studied the effects of 0-120 kg K2O/ha
applied as a basal dressing or split application (60:40 at planting
and flowering) on yield parameters and seed quality of mung beans.
12
K application increased the number of flowers/plant, percentage
pod set, seeds/pod, 100-seed wt and yield/plant. In the short
maturing cv. MI 5, seed yield and quality increased with the basal
application up to 80 kg K/ha and a split application up to 60 kg
K/ha. In the long maturing cv. Type 61, seed yield and quality
increased with a basal application up to 100 kg K/ha or a split
application up to 80kg K/ha.
Singh and Hiremath (1990) reported that, applying 20 or
50 kg P2O5/ha to Vigna radiata, increased 100-seed weight and
gave seed yields of 0.84-0.90 and 0.94-0.99 t/ha, resp., compared
with 0.73 t without P.
Singh and Kumari (1990) noticed that, the seed yields of
V. radiata were increased from 345 to 623 kg/ha with increasing K
rates from 30 to 60 kg K/ha.
Thakuria and Saharia (1990) proved that, yields of green
gram [Vigna radiata] were increased from 518 to 720 kg/ha by
applying 20 kg P2O5/ha and did not show further increase with
application of 40-60 kg P2O5/ha.
Yadav (1990) indicated that, seed yields of mung beans
were increased by increasing N rates from 0 to 10 and 20 kg/ha.
Bali, et al., (1991) studied the effects of 20-60 kg N and 0-
90 kg P2O5/ha on yield of V. radiata cv. P.S. 16. Seed yield, 1000-
seed wt and LAI increased with up to 40 kg N and 60 kg P2O5/ha.
Patel and Patel (1991) confirmed the beneficial effects of
increasing P rate from 0 to 60 kg/ha on yield of green gram [Vigna
13
radiata] cv. Gujarat 2 and Type 44. Type 44 gave the higher seed
yield, number of pods/plant, pod length and number of seeds/plant.
Sarkar and Banik (1991) proved that, green gram [Vigna
radiata] given 0, 10 or 20 kg N/ha gave seed yields of 0.90-0.91,
1.10-1.13 and 1.23-1.30 t/ha, resp. The difference between 10 and
20 kg N/ha was not significant. Applying 30 or 60 kg P2O5 gave
yields of 1.07-1.14 and 1.38-1.43 t/ha, resp., compared with 0.70-
7.80 t without P application.
Rajput, et al., (1992) determined the response of mung
bean grown in a P-deficient soil to different combinations of N, P
and K. Average seed yield was 553 kg/ha without fertilization and
the highest (803 kg/ha) with 34 kg N + 67 kg P. BRM23 cv.
exhibited higher seed yield (728 kg/ha) than cultivar BRM41 (682
kg/ha).
Ardeshna, et al., (1993) reported that, seed yield of green
gram [Vigna radiata] was increased with N application up to 20 kg
N/ha (0.75 t/ha) as urea, and also with increasing P levels up to 40
kg P2O5 (0.77 t) as single superphosphate.
Chovatia, et al., (1993) recorded that seeds of green gram
[Vigna radiata] cv. K 851 were given 0, 20, 40 or 60 kg P2O5/ha
as single superphosphate. The seed yields were increased with
increasing P level up to 40 kg P2O5/ha.
Dewangan, et al., (1993) stated that, the highest seed yield
of Vigna radiata came with 60 kg P2O5/ha.
14
Padhi and Samantaray (1993) mentioned that, black gram
[V. mungo] cv. Sarala were given 0, 10 or 20 kg N and 40 kg
P2O5/ha. Seed yield reached the highest value with 10 kg + 40 kg
P2O5.
Sharma, et al., (1993) stated that, seed yield of Vigna
radiata cv. Pusa Baisakhee increased with increasing levels of P up
to or equivalent of 60 kg P/ha with a starter application of N.
Singh, et al., (1993) applied 0-40 kg N/ha to mung beans [Vigna
radiata] cv. MH 85-61. They showed that, N application increased seed
yield. Application of 30 kg N gave the highest seed yield.
Thimmegowda (1993) In field trials green gram [Vigna
radiata] grown after kharif [monsoon] rice were given 0, 50 or
100% of the recommended NPK fertilizer rates. The seed yield
reached the highest value with the recommended fertilizer rates.
Thind, et al., (1993) showed that, Vigna radiata cv. PS-7
received 0, 30, 60 or 90 kg P2O5/ha as diammonium phosphate. The
yield response to P depended on soil fertility. Dry matter yield was
the highest with 90 kg P2O5 after 30 days growth and with 60 kg
P2O5 after 60 days growth.
Anil, et al., (1994) compared 12 P application treatments and
found that, Vigna radiata cv. K851 seed yield exhibited its the highest
with the application of 50 kg P2O5/ha superphosphate (1.30 t/ha).
Bachchhav, et al., (1994) applied N fertilizer rates (0-45 kg/ha) to
green gram [Vigna radiata] cv. Phule M 2. They found that seed yield was
increased with increasing N rate up to 30 kg N (1.65 t).
15
Badole and Umale (1994) recorded that green gram [Vigna
radiata] cv. TAP 7 was given 0, 25, 50, 75 or 100% of the
recommended N + P fertilizers given as urea and single
superphosphate, respectively and seeds were inoculated with
Rhizobium. NP application and seed treatment increased seed
yields. With the fertilizer treatments, application of 50% of the
recommended NP rate gave the highest yield of 1.17 t/ha.
Dhillon, et al., (1994) recorded that, the seed yield of green
gram [Vigna radiata] was increased with increasing P level up to
40 kg P2O5/ha in low and medium P soils and up to 20 kg P2O5/ha
in high P soils. They concluded that, in addition to Olsen's
extractable P, soil texture and organic carbon content are the
determining factors influencing response to P.
Hoshiyar, et al., (1994) showed that green gram [Vigna
radiata] yield was increased with the application of 30 or 60 kg
P2O5/ha compared with that without P application.
Patel and Patel (1994) stated that green gram [Vigna
radiata] given 20 kg N + 40 kg P2O5/ha (recommended rate) gave
the highest seed yield (1.74 t/ha). Applying only 25 or 50% of the
recommended N + P rate significantly decreased seed yield.
Patro and Sahoo (1994) found that mung beans cv. Dhauli
and PDM 54 given 0, 15, 30, 45 or 60 kg P2O5/ha gave seed yields
of 706, 974, 1049, 1234 and 1254 kg/ha, respectively. Yield was
not significantly different among cultivars.

16
Badole and Umale (1995) found that, green gram [Vigna
radiata] cv. TAP 7, received no fertilizers or 25, 50, 75 or 100% of
the recommended fertilizers [not specified] gave seed yields of
0.92, 1.04, 1.17, 1.13 and 0.99 t/ha, respectively.
Gajendra and Singh (1995) reported that, green gram
[Vigna radiata] cv. T-44 was grown alone and received 20 kg N +
40 kg P2O5, 10 kg N + 20 kg P2O5 or 5 kg N + 10 kg P2O5. Green
gram yield reached the highest value (0.52 t) with the application of
20 kg N + 40 kg P2O5.
Khamparia (1995) recorded that seed yields of mung
[Vigna radiata] cv. J-8 were increased by P application alone or in
combination with microphos inoculation.
Kumbhar, et al., (1995) found that, significant positive
correlation was detected between green gram [Vigna radiata] yield,
N uptake and available N in soil.
Mahalle and Matte (1995) showed that, green gram [Vigna
radiata] cv. Kopargaon and TAP 7 grown in clay soil (containing
53.8 kg/ha available P2O5) were given 40 kg P/ha as single
superphosphate, diammonium phosphate or ammonium
polyphosphate and a basal dressing of 20 kg N as urea. Kopargaon
seed yield was not affected by P source. TAP 7 seed yield was
increased by P application and was highest with SSP (0.20 t/ha).
The control yield of TAP 7 was 0.17 t.
Asghar, et al., (1996) studied the effect of different
potassium levels (0, 25, 50, 75, 100 and 125 kg/ha) and a basal
17
dose of 20 kg N and 50 kg P2O5/ha on yield and quality of mung
beans. The number of pods/plant and number of seeds/pod, seed
yield/ha were significantly influenced by potassium application.
The highest seed yield (1.67 t/ha) was obtained with application of
75 kg K2O/ha.
Deka and Kakati (1996) used 0-60 kg P2O5/ha for V.
radiata cv. K-851 and found that the seed yield was significantly
increased with increasing P level up to 40 kg P2O5/ha.
Saxena, et al., (1996) showed that, green gram [Vigna
radiata] cv. T44 was given 0, 30 or 60 kg P2O5 and 0, 20 or 40 kg
K2O/ha. Seed yield reached its highest values with 60 kg P2O5 in
1988, and increased with up to 30 kg P2O5 1989. In both seasons,
seed yield was the highest with 20 kg K2O. In 1988 the application
of 60 kg P2O5 + 20 kg K2O gave the highest seed yield (0.87 t).
Seed yield was positively correlated with number of Pods, seed
yield/plant, 1000-seed weight and harvest index.
Shukla and Dixit (1996b) showed that, green gram [Vigna
radiata] cv. Pusa Baisakhi was given 0-60 kg P2O5/ha. The yield
was increased with increasing P level up to 40 kg P2O5.
Thakur, et al., (1996) applied 0, 25, 50 or 75 kg P2O5/ha for
green gram (Vigna radiata). Seed yield averaged 0.91, 1.00, 1.24
and 1.13 t/ha at the four P rates, respectively.
Mandal and Sinha (1997) showed that, the green gram
[Vigna radiata] was grown after mustard [Brassica juncea], which
was given 0, 20, 40 or 60 kg P2O5 and 0, 10, or 20 kg borax/ha. The

18
green gram seed yield reached the highest (1.52 t/ha) in plots
previously given 40 kg P2O5 + 10 kg borax/hectare. However, this
residual treatment combination was statistically at par with 40 kg
P2O5 + 20 kg borax/hectare.
Ramamoorthy and Raj (1997) using Mussoorie rock
phosphate found that the obtained seed yield of green gram [Vigna
radiata] was the highest with 25 kg P2O5/ha compared with that
without applied P.
Rawankar, et al., (1997) recorded that, seed yields of green
gram and pigeon peas were increased with increasing N level up to
30 kg N/ha (0.67 and 0.75 t, respectively).
Sharma, et al., (1997) applied 0, 25, 50 or 75 kg P2O5/ha
for green gram [Vigna radiata] cv. Pant Moong 2. Seed yield was
increased with increasing P level up to 50 kg P2O5 (1.22 t/ha).
Mishra, et al., (1998) stated that, mung beans (Vigna
radiata) cv. K-851 were given 0, 25 or 50 kg P2O5/ha. Seed yield
was 422, 624 and 714 kg/ha with the P rates as listed.
Maldal and Ray (1999) said that, mung (Vigna radiata) cv.
B105, B1 and Hooghly local were untreated or given 20, 30 or 40
kg N/ha as urea. Yield was increased by N. Hooghly local showed
the best overall performance.
Mandal and Sikder (1999) indicated that, mung beans
(Vigna radiata) cv. BARI Mug-5 grown on saline soil, were given
0, 50 or 100 kg N/ha and 0, 75 or 150 kg P/ha. Growth and yield
were significantly increased with N application, while P

19
significantly increased the setting of pods and seeds. Root growth
was significantly improved by individual and combined application
of the fertilizers. Interactions of the fertilizers stimulated the
formation of pods and seeds together with seed yield.
Mitra, et al., (1999) recorded that the green gram (Vigna
radiata) cv. GM-9002 had the greater number of pods/plant,
seeds/pod, 1000-seed weight, seed yield and total biomass yield
than the cv. UPM 79-12 or MH-309.
Singh, et al., (1999) showed that, green gram [Vigna
radiata] cv. NDM-1 was given 0-26.4 kg P /ha. Yield and yield
components generally were progressively increased up to 26.4 kg P
and 40 kg S/ha.
Upadhyay, et al., (1999) mentioned that, green gram [Vigna
radiata] was given 0-60 kg P2O5/ha. The seed yield was increased
with P application up to 40 kg P2O5 (2.01 t).
Chowdhury, et al., (2000) apply 0, 25, 50, 75 or 100 P/ha
for mung bean line NM92. The dry matter production increased
with increasing the P rate. Total dry matter production prior to and
at flowering was about 20 and 50% of the total dry matter at
maturity. Dry matter accumulation after flowering greatly
influenced seed yield, as most of the photosynthate produced at this
stage is used for pod and seed development. Seeds contributed the
majority of dry matter content at harvest.
Prasad, et al., (2000) studied the effect of four potassium
levels viz., 0, 10, 20 and 30 mg K kg -1 soil (designated as K0,
21
K10, K20 and K30, respectively) on summer mung bean (cv. T-
44). The grain yield increased with potassium application but the
result was statistically non-significant.
Ram and Dixit (2000) reported that, green gram cv. K-851
were given 0, 20, 40 or 60 kg P/ha. The yield was increased with
increasing P rate.
Teotia, et al., (2000) investigated the effect of different
levels of P (0, 30, 60, and 120 kg P2O5/ha) applied as single
superphosphate on yield of V. radiata cv. Pant Moong-2.
Increasing levels of P significantly increased the grain and straw
yields of the treated plants more than the control.
Kumar and Puri (2002) mentioned that, increasing P rate
from 25 to 50 Kg/ha P2O5 resulted in significant increase in yield
and all yield attributes (pods/plant, seeds/pod, 1000-seed weight
and seeds yield) of french bean (Phaseolus vulgaris) compared
with the control (no P). The two investigated cultivars significantly
varied in all determined yield attributes.
Singh and Verma (2002) tested the response of french bean
(Phaseolus vulgaris) to 5 N levels (0, 30, 60, 90 and 120 Kg N/ha)
and 3 P levels (0, 30 and 60 Kg P2O5/ha). The high dose of N (120
Kg) and P (60 Kg) resulted in higher yield and yield attributes
(pods/plant, seeds/pod, 100-seed weight and grain yield/ha).
Anbumani et al., (2003) tabulated that, the application of N
at 10Kg/ha-1 each a 50 per cent flowering and pod development
stages along with a basal application of 25:50 N and P2O5 ha-1
21
Kg/ha had a marked increase in yield components (number of
pods/plant, number of seeds/pod and pod length), seed and halum
yield in comparison with control. The increase in yield was 45.8,
21.5 and 2.7% more than those of no N (control), basal application
alone (25:50 N and P2O5 ha-1) and basal + DAP foliar spray (2%)
twice, respectively.
Kumar and Chandra (2003) showed that, P application
significantly increased the plant dry matter and grain yield of mung
bean (Vigna radiate) more than that with no P application. The
grain yield/ha was increased to 600, 613, 683 and 700 Kg/ha by
applying 0, 25, 50 and 75 Kg/ha of P2O5, respectively.
Meena et al., (2003) recorded that, the grain and straw
yields and total uptake of N, P and K in checkpea (Cicer arietinum)
plants were significantly increased with the increase of phosphorus
levels from 0 to 60 Kg P2O5/ha. However, the data particularly
those of seed and straw yields that recorded at 30 and 60 Kg
P2O5/ha were significantly equal.
Yeman and Skjelvag (2003) using 0, 30 and 60Kg /ha-1
P2O5 for Pisum sativum found that pods/m2 and yield positively
responded while seeds/pod and seeds weight were not significantly
affected by P application.
Prajapati et al., (2003) studied the effects of increasing N
rates from 0 to 40, 80 and 120 Kg N/ha on growth and yield
parameters as well as seed yield of french bean (Phaseolus
vulgaris). Applying the highest N rate (120 Kg) gave the highest
22
significant increase in values of the yield attributes (pods/plant,
seeds/pod, pod length and 100 seed weight) as well as seed yield.
IIIIII--EEffffeecctt ooff tthhee NNPPKK ffeerrttiilliizzaattiioonn lleevveellss oonn tthhee cchheemmiiccaall
ccoonnssttiittuueennttss::
Reddy (1985) recorded that, V. radiata fertilized with 0-60
kg P2O5 and/or 0-30 kg K2O/ha gave the highest yields of CP (0.35
t CP/ha) with 30 kg P2O5/ha compared with 0.15 t without PK.
Ahmed, et al., (1986) reported that phosphorus application
up to 60kg/ha-1 increased grain and straw protein of mung bean
(Vigna radiata L.).
Kamat, et al., (1986) recorded that application of 50 kg
P2O5/ha to mung [Vigna radiata] and urd [V. mungo] increased N,
P and K uptake and seed protein content.
Mahadkar and Saraf (1988a) studied the changes in N and
P contents and uptake in leaves and stems of Vigna radiata at
different growth stages as affected by N and P application. N
content was higher in the leaves than in stems while P content was
similar in the two organs. N and P contents were the highest at 45
and 30 days after sowing, resp. Application of N and P fertilizers
increased N and P contents in seeds; 40 kg P2O5/ha was the most
effective.
Mahadkar and Saraf (1988c) showed that, V. radiata, in a
pot trial, was given 0 and 16 kg P/ha and 0 and 20 kg N as a basal
application or top dressing or both. The percent N derived from
fertilizer was the greatest at early seedling stage then declined after
flowering. Fertilizer N uptake in leaf and seed was higher than in

23
stem and husk. The fertilizer N uptake and fertilizer use efficiency
increased with application of P.
Maiti, et al., (1988) applying 60 or 100 kg/ha each of P2O5
and K2O to green gram [Vigna radiata] and found that, application
of 50 kg N/ha increased leaf chlorophyll contents.
Gupta and Rai (1989) showed that V. radiata crops sown on 5
Apr. showed higher P uptake than those sown on 15 Mar. or 26 Apr.
Increasing P rates from 0 to 15 and 30 kg/ha increased P uptake.
Reddy, et al., (1989) showed that, P. radiatus [Vigna
radiata] and P. mungo [V. mungo] were given 0 or 21.9 kg P/ha as
a basal dressing or equally splited between a basal application and
flowering. P application increased the energy content of the whole
plant in both species, especially when applied in split doses. Split P
application also increased photosynthetic efficiency in both species
compared with that of a single application.
Basu and Bandyopadhyay (1990) recorded that, Vigna
radiata was given 0-40 kg N/ha. N uptake was increased also with
increasing N rates up to 30 kg N/ha. N uptake decreased with the
highest N application rate.
Reddy, et al., (1990) recorded that increasing P level from 0
to 50 kg P2O5/ha (as a basal dressing or 50 kg P2O5/ha in 2 equal
split dressings at sowing and flowering) increased protein contents
of green gram [Vigna radiata].
Singh and Kumari (1990) studied the nutrient contents in
V. radiata 0, 30 or 60 kg K and Mn/ha. The K content in both seeds

24
and straw was increased by applying K. The K application
decreased N and P contents in seeds and straw.
Thind, et al., (1990) studied utilization of 30, 60 and 90 kg
P2O5/ha applied as diammonium phosphate solution in V. radiata.
Increasing P rates increased P uptake. P utilization was low in (7.4-
8.0%) and utilization of applied P varied in different soil types.
Narayanan, et al., (1991) assessed growth and nutrient
uptake in plants aged 45days of green gram [Vigna radiata] at
recommended (N + P + K at 25 + 22 + 42 kg/ha) and high (NPK at
50 + 44 + 84 kg/ha) fertility levels (RF and HF, respectively). HF
increased the N, P and K uptake but decreased their utilization
efficiency (dry matter production/unit nutrient per week).
Patel and Patel (1991) confirmed the beneficial effects of
increasing P rate from 0 to 60 kg/ha on yield of green gram [Vigna
radiata] cv. Gujarat 2 and Type 44. Protein yield increased with increasing
P rate and Type 44 gave higher protein yield than Gujarat 2 cv.
Ghildiyal (1992) recorded that, the rate of photosynthesis of
Vigna radiata plants was declined after flowering in the control plants
but remained constant until 20 days after flowering in urea-treated plants.
Sharma, et al., (1993) stated that, N, P, K and S uptake of
Vigna radiata cv. Pusa Baisakhee was increased due to increasing
P application rate.
Singh, et al., (1993) applied 0-40 kg N/ha to mong beans
[Vigna radiata] cv. MH 85-61. They noticed that, N application
increased N uptake and seed and straw N concentration.
25
Datta (1994) found in field experiments that, mung bean
(Vigna radiata) in particular mung bean cv. MH-309 was highly
responded to P application. P application increased both P
extractability and P content in mung bean seeds.
Garcia, et al., (1994) recorded that, ammonium-N decreased
amount of fixed nitrogen. The amount of fixed nitrogen was higher in the
control plants than in cut plants. They suggested that fertilizer application
to the mung bean plants might had beneficial effect only when applied
during the seedling stage when the infection process is just beginning and
during the seed-filling stage when the nodules are already senescing and
large amounts of N are being mobilized to the developing pod. It was
also demonstrated that the upper leaves were the major source of
photoassimilates for nodule growth and nodule enzyme activity in mung
beans.
Asghar, et al., (1996) stated that the protein contents in
seeds of mung beans was significantly influenced by potassium
application (0, 25, 50, 75, 100 and 125 kg/ha).
Deka and Kakati (1996) recorded that the V. radiata cv. K-851
plants were given 0-60 kg P2O5/ha. Total N and P uptake at harvest
was significantly increased with P application rate up to 40 kg P2O5/ha.
Thakur, et al., (1996) applied 0, 25, 50 or 75 kg P2O5/ha for
green gram (Vigna radiata). P uptake reached its maximum with 50 kg
P2O5.
Mohanty, et al., (1999) detected elevated level in total
sugar in leaf and root samples of fertilized Vigna radiata plants.
26
Bharti, et al., (2000) studied the responses of green grams
(K-851) with three levels of N (0, 18.75, 25 kg/ha) and P (0, 37.50,
50 kg/ha). Results showed that green gram responded well to
higher doses of N and P fertilizers for yield, quality and nutrient
uptake and content.
Prasad, et al., (2000) studied the effect of four potassium levels
viz., 0, 10, 20 and 30 mg K kg -1 soil (designated as K0, K10, K20 and
K30, respectively) on summer mung bean (cv. T-44). Increasing
potassium levels significantly increased the potassium uptake.
Singh and Verma (2002) tested the response of french bean
(Phaseolus vulgaris) to 5 N levels (0, 30, 60, 90 and 120 Kg N/ha)
and 3 P levels (0, 30 and 60 Kg P2O5/ha). Higher dose of N (120 Kg)
and P (60 Kg) resulted in higher P and N content in seed and straw.
Yeman and Skjelvag (2003) recorded that increasing P
application rate from 0 to 30 and 60Kg /ha P2O5 enhanced P and N
contents in shoots and roots and crude protein (CP) content in
cotyledon flours of Pisum sativum.. CP content increased from
24.9% of dry matter (DM) at P0 to 26.2% at P2 and from 24.3% at
P0 to 25.2% at P2, in Dekoko and Ater seeds, respectively, while
total sugars were decreased with the increase in P application rate.
IIVV--EEffffeecctt ooff tthhee NNPPKK ffeerrttiilliizzaattiioonn lleevveellss oonn tthhee iinntteerrnnaall
ssttrruuccttuurree::
Radin and Boyer (1982) found that, the response pattern for leaf
and cell expansion under P-deficiency was similar to that occurring under
nitrogen stress in sunflower plants, and, thus, could be viewed as a
common response associated with nutritional stresses.
27
Radin and Eidenbock (1984) found that, the inhibition of
leaf expansion was associated with smaller leaf epidermal cells.
Treeby et al., (1987) found that, phosphorus concentration
in leaf epidermal cells was lower when P nutrition was limited.
Fredeen et al., (1989) suggested that, the inhibition of leaf
expansion might be a direct effect of phosphorus deprivation and
the restriction of leaf epidermal cell expansion occurred when P
nutrition was limited.
Hoefnagel et al., (1993) found that, in cell suspension
culture studies, the mineral nutrient supply affected the rate of cell
division.
Sano et al., (1999) found that, in cell suspension culture, the
total phosphorus deprivation resulted in cells entering a "static
state" for a relatively long period of time, and that upon re-supply
of phosphorus the cell cycle is re-established.
Cheira et al., (2002) recorded that the expansion of soybean
leaves under phosphorus stress was limited by the number of cell
divisions, which would imply control of cell division by a common
regulatory factor within the leaf canopy, as a decreased number of
leaves with P-deficiency implies changes in leaf initiation rates and
activity of the shoot apical meristem. In the whole plant system, the
supply of P is not entirely shut off, as P is remobilized from storage
pools and senescing tissue. There were no differences in cell
expansion rate of both epidermal and palisade mesophyll cell layers
in comparison with the control, as cell layers were slower to
28
development and cells were smaller, which resulted in leaves that
were ~30% thinner under P stress than the control. Also, it was
found that, decreased transverse expansion of the palisade
mesophyll increased transverse cell density in the leaf, which
would, presumably, increased the concentration of chlorophyll.

29
MATERIALS AND METHODS
The experiments that were performed in the present
investigation were carried out at the Experimental Station,
Moshtohor, Faculty of Agriculture, Zagazig University during the
two successive growing seasons 2001 and 2002. Morphological
characters, yield components and chemical constituents as well as
internal structure of mung bean (Vigna radiata) plants as affected
by different levels of fertilizers and rhizobium (Rhizobium
jabonicum) inoculation were considered in this study.
Pots 30 cm. in diameter each containing 11 Kg of soil
mixture consisted of clay and sand at rate of 2:1 (by weight) was
used. In the seasons of 2001 and 2002, the mung bean seeds of each
cultivar (Giza-1 and Kawmi-1) were sown on the 24th may in pots.
Each experiment was carried out in a randomized complete design
with six replicates.
I- Source of mung bean seeds and inoculation of seeds by
rhizobium:
The two mung bean cultivars namely, Giza-1 and Kawmi-1
were secured from The Legume Research Department, Field Crop
Institute, Agricultural Research Center, Giza, Egypt. Sufficient
amount of the seeds from each cultivar were inoculated, as
recommended with rhizobium as follows:
1 - The rhizobium material was mixed with water containing
sucrose.

31
2 - Sugar solution mixed with rhizobium was added to the
seeds.
3 - Inoculated seeds were immediately sown in pots and
irrigated immediately.
The rest seeds from each cultivar were sown without
rhizobium inoculation.
IIII-- AApppplliieedd FFeerrttiilliizzeerrss::
NPK were considered as a compound fertilizer as proposed
for the mung bean (recommended by Field Crop Institute,
Agriculture Research Centre) was taken for comparison as the
control. This control was uninoculated by rhizobium. NPK
fertilizers were applied as follows:
- Ammonium sulfate (20.6% N).
- Calcium super phosphate (15.5% P).
- Potassium sulfate (48% K).
These fertilizers were applied to the two treatments, i.e. half
recommended (1/2R) and double recommended (2R) for each
cultivar Table (1). The calculated amounts for each of the three
levels of fertiliser treatments i.e. recommended, half recommended
and double recommended were divided into three portions i.e. 10%,
50%, and 40% which were added to pots at sowing, flowering start,
and start filling pods, respectively as indicated in Table (1).

31
Table (1): The fertilizer levels as well as the applied fertilizers,
their amount (per pot) and time of application.
Time of application at Fertilizers and
its amount
(g/pot)
Treatments Pod filling
start
40%
Flowering
start
(50%)
Sowing
time
(10%)
0.0660 0.0825 0.0165 0.165 N *Recommended
level (R) 0.4400 0.5500 0.1100 0.171 P
0.2200 0.2750 0.0550 0.264 K
0.0332 0.0415 0.0083 0.083 N Half
Recommended
level (1/2R)
0.2200 0.2750 0.0550 0.086 P
0.1100 0.1375 0.0275 0.132 K
0.1320 0.1650 0.0330 0.330 N Double
Recommended
level (2R)
0.8800 1.1000 0.2200 0.342 P
0.4400 0.5500 0.1100 0.528 K
* Equivalent to about 73, 100 and 50 kg/feddan from ammonium
sulfate (20.6% N), calcium super phosphate (15.5% P) and
potassium sulfate 48% K) respectively.
IIIIII-- SSoowwiinngg aanndd sseeeeddlliinngg eemmmmeerrggeennccyy::
Twenty of healthy looking and uniformed seeds of the two-
assigned mung bean cultivars were sown per pot. Both distance and
depth of seeds were nearly constant. These pots were irrigated
twice weekly with equal amount of water.
The rate of seedling emergency in the different treatments
was determined according to the formula presented by Edmond &
Drapala (1958) as follows:
Seedling emergency rate (M days) = Gn ... G2 G1
Gn)(Nn x .. G2) x (N2 G1)(N1x
As: M days = The mean number of days required for
emergency, N1 = Number of days passed from sowing till first
count, N2 = number of days passed from sowing till second
count…to Nn, G1 = Number of emerged seeds at the first count and
G2 = Number of emerged seeds at the second count….to Gn.

32
Fourteen days after sowing, thinning took-place and only 4
seedlings were left per pot. The irrigation took-place three times
weekly.
It worth to mention that the plants were sprayed with
acaricide malathion three times during each growing season, the
first was after about one month as a protective dosage; the other
two were applied when needed to get rid of the red acaris.
IIVV-- SSaammpplleess aanndd cchhaarraacctteerrss uunnddeerr ssttuuddyy::
Three samples were taken from each particular treatments
i.e. half recommended (1/2R) and double recommended doses (2R),
as well as the control (recommended dose) at monthly intervals
(each replicate was of four plants). The first sample was taken one
month after sowing and the second was taken two months after
sowing (i.e. at the beginning of flowering). The third sample was
taken three months after sowing (it was at harvest time).
The plant samples were washed thoroughly with tap water
in order to remove the adhered clay. Then, the following studies
were considered:
A- Morphological characters:
1. Mean number of leaves per plant.
2. Mean length of the main stem (cm.).
3. Mean diameter of the stem (cm.).
4. Mean length of the root (cm.).
5. Mean volume of the root (cm.3) according to Hanson
and Churchill (1968).

33
6. Mean number of primary branches developed on the
main stem.
7. Mean of total leaf area per plant (cm2) according to
Derieux et al, (1973).
8. Fresh and dry weights (g) of the roots and shoots.
As for dried samples, the excised roots and shoots of plants
were chopped and enveloped in paper bags then left to dry in the
oven at 700C for 48 hours till complete dryness.
B- Yield characters:
1. Flower setting percentage.
2. Mean number of matured dry pods per plant.
3. Mean weight of matured dry pods per plant (gm.).
4. Mean length of matured dry pods per plant (cm.).
5. Mean diameter of matured dry pods per plant (cm.).
6. Mean number of seeds per pod.
7. Mean seed weight per plant (gm.).
C- Anatomical studies:
It was intended to carry out a comparative microscopic
study on the internal structure of the leaves, stems, and flower
pedicle base in both mung bean cultivars Giza-1 and Kawmi-1 to
show the most prominent response to the investigated treatments.
Specimens of the anatomical studies taken from plants aged 60
days (flowering stage), where the certain leaflet of the fifth leaf as
well as the fifth internode were taken from the main stem apically,
but the pedicle was taken from the second inflorescence on the
main stem basically of the two cultivars.

34
Specimens were killed and fixed for 48 hr. in FAA solution
composed of formalin, glacial acetic acid and ethyl alcohol 70 % at
rate of 10:5:85 (by volume), respectively. The selected materials
were removed from the FAA solution, washed in 50 % ethyl
alcohol, dehydrated in a normal ethyl alcohol series, embedded in
paraffin wax (melting point 560C.), sectioned to a thickness of 15-
25 microns, double stained with safranine-fast green, cleared in
xylene and mounted in canada balsam (Willey, 1971). Sections
were examined microscopically and read to detect anatomical
manifestations of noticeable responses resulted from investigated
treatments.
D- Chemical Analysis and some bioconstituents:
All the chemical determinations were carried out in the
second season on dried leaves, stems, roots and mature pods of
treated and untreated plants of the two investigated mung bean
cultivars, except that of chlorophyll’s determination that was
carried out in the two successive seasons at 30 and 60 days after
sowing (DAS).
1)- Chlorophyll's determination:
Chlorophyll's concentration in fresh leaf blades was
determined according to Arnon (1949). All steps were performed in
dim light and as rapidly as possible. 0.2 g fresh leaf blades sample
was taken in a mortar with a pinch of CaCO3, and acid washed
sand, then extracted with 10 mls of 85% aqueous acetone solution,
and ground till the slurry is completely homogenized. The
homogenate was filtered and the slurry was washed many times
35
with 85% aqueous acetone solution until the mortar be devoid of
green colour. The filtrate was combined in a measuring flask (100
ml) and completed to the mark with 85% acetone solution.
Chlorophyll contents were adjusted to mg/g fresh weight. The
absorbance (A) of Chlorophyll’s concentration was calculated
according to (AOAC, 1990).
2)- Total Carbohydrates (Total Sugars), Total Reducing, and
Non-Reducing Sugars Determinations:
The total carbohydrates, reducing sugars and non-reducing
sugars were determined (expressed as milligram glucose per gram
dry weight) after acid hydrolysis (in the aqueous extract) and
spectrophotometrically measured as follows: A certain weight (0.2
g) of the ground samples was placed in a test tube then sulfuric acid
(10 ml. 1N) was added. The tube was covered with a condenser and
placed in a water bath at 1000C for two hours. The solution was
then filtered into a measuring flask (100ml.) and completed to the
mark with distilled water.
2.1) Total Carbohydrates (Total Sugars) Determination:
The total hydrolysable carbohydrates was determined with
the phenol-sulforic acid method (Dubois et al., 1956), as follows:
One ml. of aqueous extract was mixed with phenol (1ml. 5% w/v)
and concentrated sulfuric acid (5ml.) was then added by fast
delivery pipette. The mixture was then shaken gently and left to
cool for 15 minutes.
The blank experiment was carried out using water instead of
sugar solution. The developed yellow-orange colour was measured
36
at 490 nm. A standard curve was prepared by using pure glucose
with a suitable concentration.
2.2)- Total Reducing Sugars Determination:
Reducing sugars were determined in the aqueous extract
(Somogy, 1952), as follows:
One ml. of the aqueous extract was placed in a test tube and
one ml. of alkaline reagent (described after-wards) was added. A
blank lacking sugars similarly prepared. The contents were mixed
by shaking, all tubes were placed simultaneously in a water bath at
1000C and boiled for 20 minutes (accurately timed).
All tubes were then removed and quickly cooled in a beaker
containing cold water. One ml. of arsenomolybdate reagent
(described after-wards) was subsequently added to each tube
followed by occasional shaking; five minutes at least were allowed
for reaction to take place. Each tube was then made up to a final
volume of 10 ml. using distilled water, whereas contents were
mixed by inversion. The concentration of reducing sugars were
spectrophotometrecally measured at 660 nm after setting the
spectrophotometer to 100% trancmitancy with the water blank.
Alkaline copper reagent:
One liter of this reagent contains 4 gm. of CuSo4.5H2O, 16
gm. NaHCO3, 180 gm. Na2SO4 and 12 gm. Rochelle salt
Arsenomolybdate reagent:
Each 500 ml. of this reagent contains 25 gm. ammonium
molybdate, 3 gm. disodiumhydrogenarsenate and 29 ml. sulfuric
37
acid. Then solution was stored in glass stoppered brown bottle at
370C for 24 hours. The reagent should be yellow with no green tint.
2.3)- Total Non-Reducing Sugars Determination:
Non-reducing sugars were then calculated as the difference
between the total sugars and reducing sugars.
3)- Total Nitrogen and Crude Protein Determinations:
Wet digestion of the dried, milled sample materials with
concentrated sulphoric acid and perchloric acid were used. Total
nitrogen content was determined by using the modified micro-
kjeldhahl method described by Pregl (1945). This method includes
two modifications, the first one is the usage of (4%) boric acid
solution for receiving the distillate and the second one is by using
of mixed indicator of bromocresol green and methyl red. Crude
protein was obtained by multiplying nitrogen content by 6.25,
(A.O.A.C., 1990).
4)- Phosphorus and Potassium determination:
The wet digested samples as for nitrogen determination
were used in phosphorous, potassium determination as follows:
4.1)- Phosphorous determination:
Phosphorus was colorimetrically determined at wavelength
of 650 nm. using ascorbic acid according to Sandell (1950).
4.2)- Potassium Determination:
Potassium was determined by using Flame-photometric
method (Carl-Zeiss model) as described by Horneck and Hanson
(1998).

38
VV-- SSttaattiissttiiccaall aannaallyyssiiss::
Data concerning morphological and yield characters of the
two investigated mung bean cultivars in both seasons were
subjected to analysis of variance according to Snedecor and
Cochran (1982). The least significant difference of each character
was also calculated.
39
RREESSUULLTTSS
II-- EEFFFFEECCTT OOFF NNPPKK LLEEVVEELLSS OONN SSEEEEDD GGEERRMMIINNAATTIIOONN OOFF TTHHEE
TTWWOO AASSSSIIGGNNEEDD MMUUNNGG BBEEAANN CCUULLTTIIVVAARRSS::
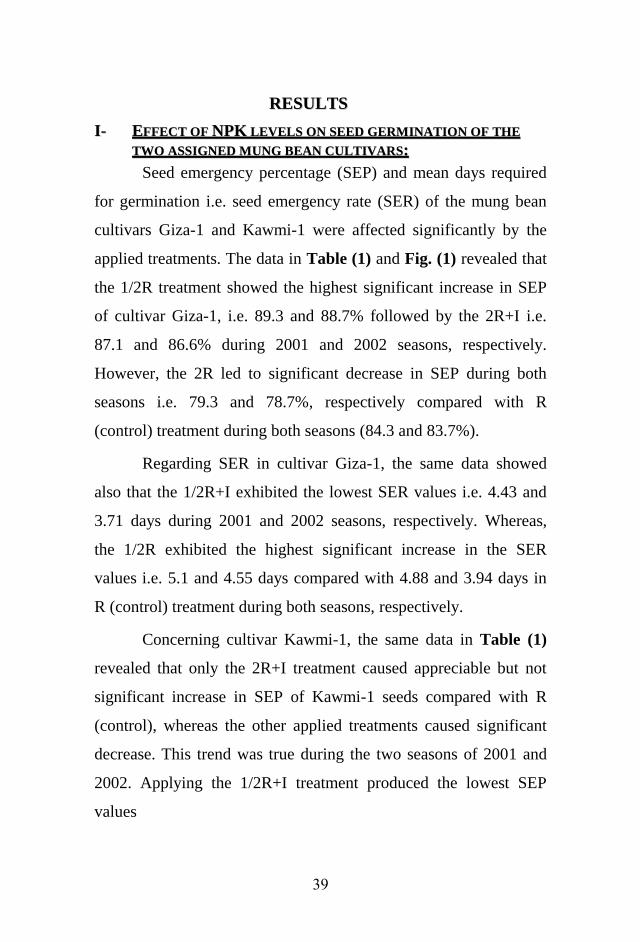
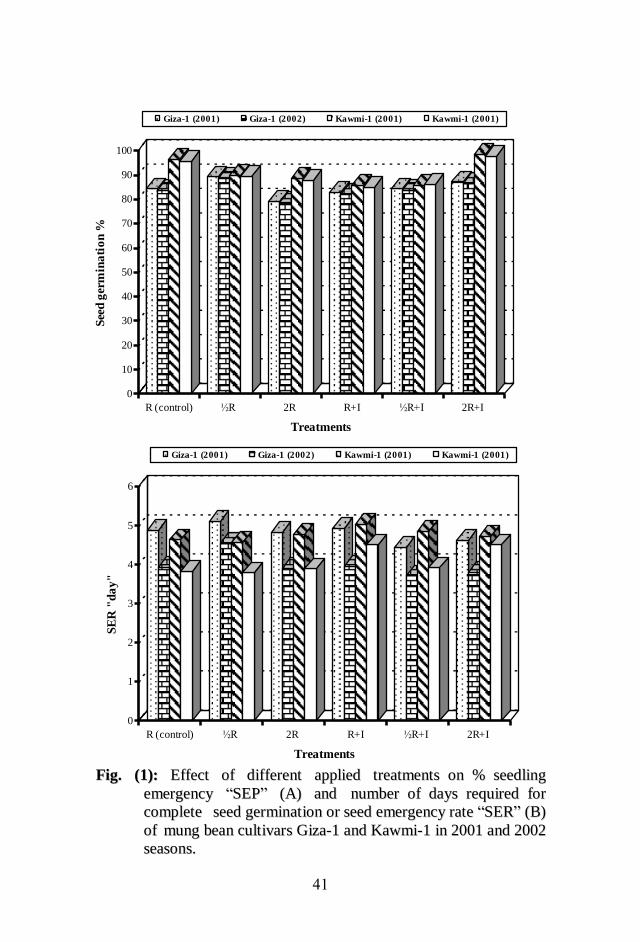
Seed emergency percentage (SEP) and mean days required
for germination i.e. seed emergency rate (SER) of the mung bean
cultivars Giza-1 and Kawmi-1 were affected significantly by the
applied treatments. The data in Table (1) and Fig. (1) revealed that
the 1/2R treatment showed the highest significant increase in SEP
of cultivar Giza-1, i.e. 89.3 and 88.7% followed by the 2R+I i.e.
87.1 and 86.6% during 2001 and 2002 seasons, respectively.
However, the 2R led to significant decrease in SEP during both
seasons i.e. 79.3 and 78.7%, respectively compared with R
(control) treatment during both seasons (84.3 and 83.7%).
Regarding SER in cultivar Giza-1, the same data showed
also that the 1/2R+I exhibited the lowest SER values i.e. 4.43 and
3.71 days during 2001 and 2002 seasons, respectively. Whereas,
the 1/2R exhibited the highest significant increase in the SER
values i.e. 5.1 and 4.55 days compared with 4.88 and 3.94 days in
R (control) treatment during both seasons, respectively.
Concerning cultivar Kawmi-1, the same data in Table (1)
revealed that only the 2R+I treatment caused appreciable but not
significant increase in SEP of Kawmi-1 seeds compared with R
(control), whereas the other applied treatments caused significant
decrease. This trend was true during the two seasons of 2001 and
2002. Applying the 1/2R+I treatment produced the lowest SEP
values

41
TTaabbllee ((11)):: EEffffeecctt ooff ddiiffffeerreenntt aapppplliieedd ttrreeaattmmeennttss oonn %% sseeeeddlliinngg eemmeerrggeennccyy ((SSEEPP)) aanndd nnuummbbeerr
ooff ddaayyss rreeqquuiirreedd ffoorr ccoommpplleettee sseeeedd ggeerrmmiinnaattiioonn oorr sseeeedd eemmeerrggeennccyy rraattee ((SSEERR)) ooff
mmuunngg bbeeaann ccuullttiivvaarrss GGiizzaa--11 aanndd KKaawwmmii--11 iinn 22000011 aanndd 22000022 sseeaassoonnss..
Cultivar Treatment Season
2001 2002 SEP % SER "day" SEP % SER "day"
Giza-1
R (control) 84.3 4.88 83.7 3.94
1/2R 89.3 5.10 88.7 4.55
2R 79.3 4.82 78.7 3.91
R+I 82.8 4.93 81.9 3.96
1/2R+I 84.3 4.43 83.7 3.71
2R+I 87.1 4.61 86.6 3.80
L.S.D. at 5% 1.56 0.14 1.64 0.15
Kawmi-1
R (control) 96.4 4.64 95.7 3.82
1/2R 90.0 4.58 89.5 3.79
2R 88.5 4.78 87.8 3.89
R+I 85.7 5.02 84.8 4.51
1/2R+I 85.7 4.85 86.1 3.92
2R+I 98.5 4.72 97.8 4.51
L.S.D. at 5% 3.51 0.06 2.31 0.132
i.e. 85.7 and 86.1% compared with 96.4 and 95.7% in R (control)
treatment during 2001 and 2002 seasons, respectively. The same
data showed also that most applied NPK treatments (in particular
those associated with rhizobial inoculation during 2001 season)
significantly increased SER value compared with R (control).
41
0
10
20
30
40
50
60
70
80
90
100
See
d g
erm
ina
tio
n %
R (control) ½R 2R R+I ½R+I 2R+I
Treatments
Giza-1 (2001) Giza-1 (2002) Kawmi-1 (2001) Kawmi-1 (2001)
0
1
2
3
4
5
6
SE
R "
da
y"
R (control) ½R 2R R+I ½R+I 2R+I
Treatments
Giza-1 (2001) Giza-1 (2002) Kawmi-1 (2001) Kawmi-1 (2001)
FFiigg.. ((11)):: EEffffeecctt ooff ddiiffffeerreenntt aapppplliieedd ttrreeaattmmeennttss oonn %% sseeeeddlliinngg
eemmeerrggeennccyy ““SSEEPP”” ((AA)) aanndd nnuummbbeerr ooff ddaayyss rreeqquuiirreedd ffoorr
ccoommpplleettee sseeeedd ggeerrmmiinnaattiioonn oorr sseeeedd eemmeerrggeennccyy rraattee ““SSEERR”” ((BB))
ooff mmuunngg bbeeaann ccuullttiivvaarrss GGiizzaa--11 aanndd KKaawwmmii--11 iinn 22000011 aanndd 22000022
sseeaassoonnss..
A
42
IIII-- EEFFFFEECCTT OOFF NNPPKK LLEEVVEELLSS OONN PPLLAANNTT GGRROOWWTTHH CCHHAARRAACCTTEERRSS
OOFF TTHHEE TTWWOO AASSSSIIGGNNEEDD MMUUNNGG BBEEAANN CCUULLTTIIVVAARRSS::
The vegetative growth characters of mung bean plants of
Giza-1 and Kawmi-1 as affected by the different treatments were
investigated at 30, 60 and 90 days after sowing during the two
successive growing seasons 2001 and 2002.
IIII..11-- CCUULLTTIIVVAARR GGIIZZAA--11::
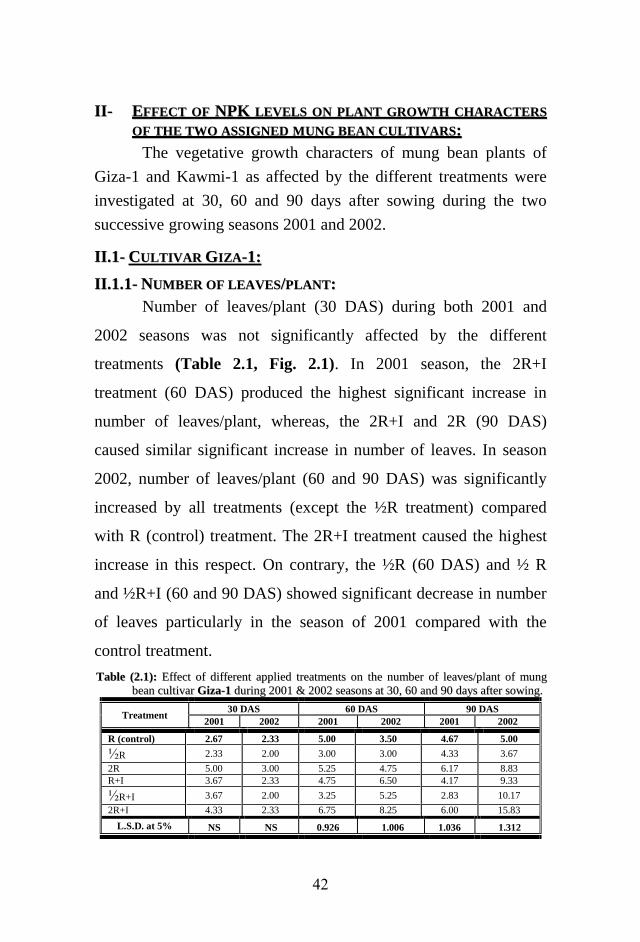
IIII..11..11-- NNUUMMBBEERR OOFF LLEEAAVVEESS//PPLLAANNTT::
Number of leaves/plant (30 DAS) during both 2001 and
2002 seasons was not significantly affected by the different
treatments (Table 2.1, Fig. 2.1). In 2001 season, the 2R+I
treatment (60 DAS) produced the highest significant increase in
number of leaves/plant, whereas, the 2R+I and 2R (90 DAS)
caused similar significant increase in number of leaves. In season
2002, number of leaves/plant (60 and 90 DAS) was significantly
increased by all treatments (except the ½R treatment) compared
with R (control) treatment. The 2R+I treatment caused the highest
increase in this respect. On contrary, the ½R (60 DAS) and ½ R
and ½R+I (60 and 90 DAS) showed significant decrease in number
of leaves particularly in the season of 2001 compared with the
control treatment.
TTaabbllee ((22..11)):: EEffffeecctt ooff ddiiffffeerreenntt aapppplliieedd ttrreeaattmmeennttss oonn tthhee nnuummbbeerr ooff lleeaavveess//ppllaanntt ooff mmuunngg
bbeeaann ccuullttiivvaarr GGiizzaa--11 dduurriinngg 22000011 && 22000022 sseeaassoonnss aatt 3300,, 6600 aanndd 9900 ddaayyss aafftteerr ssoowwiinngg..
Treatment 30 DAS 60 DAS 90 DAS
2001 2002 2001 2002 2001 2002
R (control) 2.67 2.33 5.00 3.50 4.67 5.00 ½R 2.33 2.00 3.00 3.00 4.33 3.67 2R 5.00 3.00 5.25 4.75 6.17 8.83 R+I 3.67 2.33 4.75 6.50 4.17 9.33 ½R+I 3.67 2.00 3.25 5.25 2.83 10.17 2R+I 4.33 2.33 6.75 8.25 6.00 15.83
L.S.D. at 5% NS NS 0.926 1.006 1.036 1.312

43
0
1
2
3
4
5
6
7
No
. of
lea
ves
/pla
nt
R (control) ½R 2R R+I ½R+I 2R+I
Treatments
30 DAS 60 DAS 90 DAS Mean
0
2
4
6
8
10
12
14
16
No
. of
lea
ves
/pla
nt
R (control) ½R 2R R+I ½R+I 2R+I
Treatments
FFiigg.. ((22..11)):: EEffffeecctt ooff ddiiffffeerreenntt aapppplliieedd ttrreeaattmmeennttss oonn tthhee nnuummbbeerr ooff
lleeaavveess//ppllaanntt ooff mmuunngg bbeeaann ccuullttiivvaarr GGiizzaa--11 dduurriinngg sseeaassoonnss ooff
22000011 ((AA)) aanndd 22000022 ((BB)) aatt 3300,, 6600 aanndd 9900 ddaayyss aafftteerr ssoowwiinngg..
A
B
44
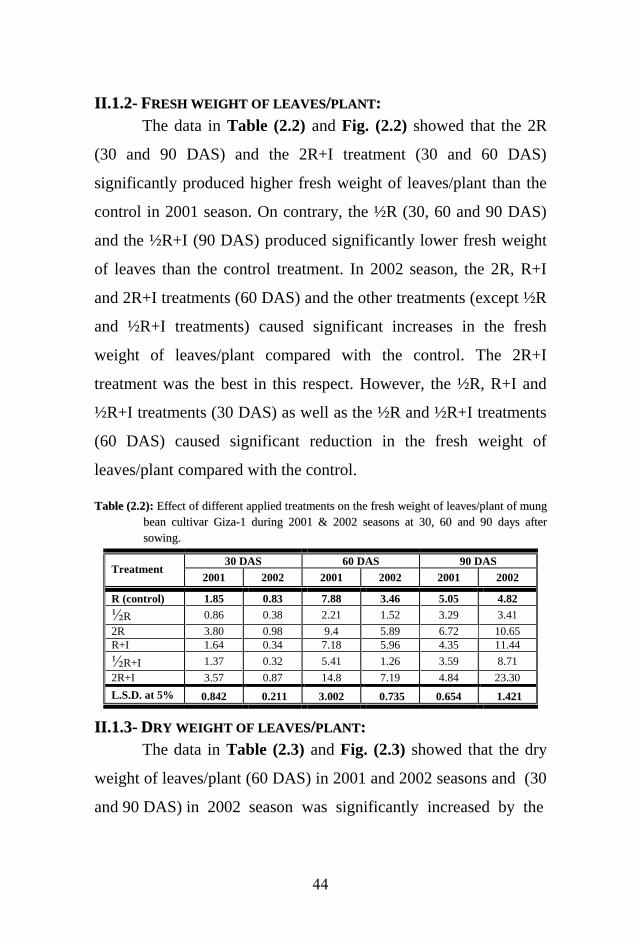
IIII..11..22-- FFRREESSHH WWEEIIGGHHTT OOFF LLEEAAVVEESS//PPLLAANNTT::
The data in Table (2.2) and Fig. (2.2) showed that the 2R
(30 and 90 DAS) and the 2R+I treatment (30 and 60 DAS)
significantly produced higher fresh weight of leaves/plant than the
control in 2001 season. On contrary, the ½R (30, 60 and 90 DAS)
and the ½R+I (90 DAS) produced significantly lower fresh weight
of leaves than the control treatment. In 2002 season, the 2R, R+I
and 2R+I treatments (60 DAS) and the other treatments (except ½R
and ½R+I treatments) caused significant increases in the fresh
weight of leaves/plant compared with the control. The 2R+I
treatment was the best in this respect. However, the ½R, R+I and
½R+I treatments (30 DAS) as well as the ½R and ½R+I treatments
(60 DAS) caused significant reduction in the fresh weight of
leaves/plant compared with the control.
TTaabbllee ((22..22)):: EEffffeecctt ooff ddiiffffeerreenntt aapppplliieedd ttrreeaattmmeennttss oonn tthhee ffrreesshh wweeiigghhtt ooff lleeaavveess//ppllaanntt ooff mmuunngg
bbeeaann ccuullttiivvaarr GGiizzaa--11 dduurriinngg 22000011 && 22000022 sseeaassoonnss aatt 3300,, 6600 aanndd 9900 ddaayyss aafftteerr
ssoowwiinngg..
Treatment 30 DAS 60 DAS 90 DAS
2001 2002 2001 2002 2001 2002
R (control) 1.85 0.83 7.88 3.46 5.05 4.82 ½R 0.86 0.38 2.21 1.52 3.29 3.41 2R 3.80 0.98 9.4 5.89 6.72 10.65 R+I 1.64 0.34 7.18 5.96 4.35 11.44 ½R+I 1.37 0.32 5.41 1.26 3.59 8.71 2R+I 3.57 0.87 14.8 7.19 4.84 23.30 L.S.D. at 5% 0.842 0.211 3.002 0.735 0.654 1.421
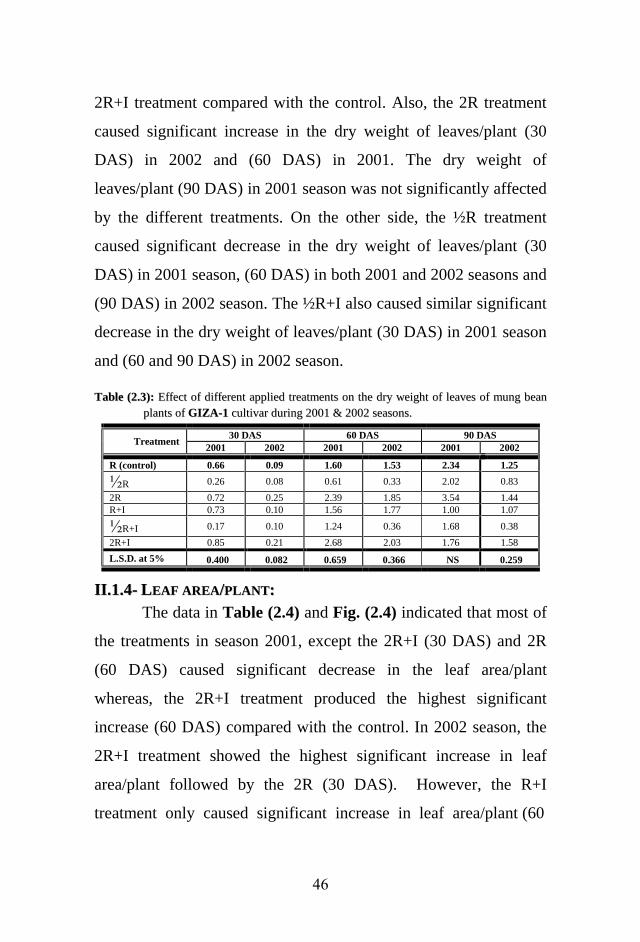
IIII..11..33-- DDRRYY WWEEIIGGHHTT OOFF LLEEAAVVEESS//PPLLAANNTT::
The data in Table (2.3) and Fig. (2.3) showed that the dry
weight of leaves/plant (60 DAS) in 2001 and 2002 seasons and (30
and 90 DAS) in 2002 season was significantly increased by the

45
0
2
4
6
8
10
12
14
16
Fre
sh w
eig
ht
of
lea
ves
/pla
nt
R (control) 1/2R 2R R+I 1/2R+I 2R+I
Treatments
30 DAS 60 DAS 90 DAS Mean
0
5
10
15
20
25
Fre
sh
weig
ht
of
leaves/p
lan
t
R (control) ½R 2R R+I ½R+I 2R+I
Treatments
FFiigg.. ((22..22)):: EEffffeecctt ooff ddiiffffeerreenntt aapppplliieedd ttrreeaattmmeennttss oonn tthhee ffrreesshh wweeiigghhtt
ooff lleeaavveess//ppllaanntt ooff mmuunngg bbeeaann ccuullttiivvaarr GGiizzaa--11 dduurriinngg sseeaassoonnss ooff
22000011 ((AA)) aanndd 22000022 ((BB)) aatt 3300,, 6600 aanndd 9900 ddaayyss aafftteerr ssoowwiinngg..
A
B
46
2R+I treatment compared with the control. Also, the 2R treatment
caused significant increase in the dry weight of leaves/plant (30
DAS) in 2002 and (60 DAS) in 2001. The dry weight of
leaves/plant (90 DAS) in 2001 season was not significantly affected
by the different treatments. On the other side, the ½R treatment
caused significant decrease in the dry weight of leaves/plant (30
DAS) in 2001 season, (60 DAS) in both 2001 and 2002 seasons and
(90 DAS) in 2002 season. The ½R+I also caused similar significant
decrease in the dry weight of leaves/plant (30 DAS) in 2001 season
and (60 and 90 DAS) in 2002 season.
TTaabbllee ((22..33)):: EEffffeecctt ooff ddiiffffeerreenntt aapppplliieedd ttrreeaattmmeennttss oonn tthhee ddrryy wweeiigghhtt ooff lleeaavveess ooff mmuunngg bbeeaann
ppllaannttss ooff GGIIZZAA--11 ccuullttiivvaarr dduurriinngg 22000011 && 22000022 sseeaassoonnss..
Treatment 30 DAS 60 DAS 90 DAS
2001 2002 2001 2002 2001 2002
R (control) 0.66 0.09 1.60 1.53 2.34 1.25 ½R 0.26 0.08 0.61 0.33 2.02 0.83 2R 0.72 0.25 2.39 1.85 3.54 1.44 R+I 0.73 0.10 1.56 1.77 1.00 1.07 ½R+I 0.17 0.10 1.24 0.36 1.68 0.38 2R+I 0.85 0.21 2.68 2.03 1.76 1.58 L.S.D. at 5% 0.400 0.082 0.659 0.366 NS 0.259
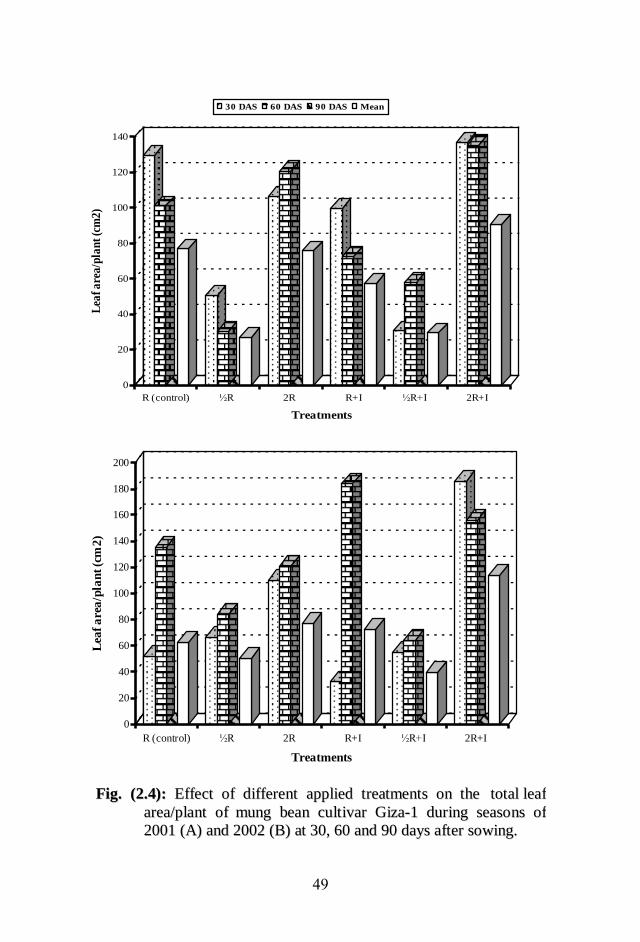
IIII..11..44-- LLEEAAFF AARREEAA//PPLLAANNTT::
The data in Table (2.4) and Fig. (2.4) indicated that most of
the treatments in season 2001, except the 2R+I (30 DAS) and 2R
(60 DAS) caused significant decrease in the leaf area/plant
whereas, the 2R+I treatment produced the highest significant
increase (60 DAS) compared with the control. In 2002 season, the
2R+I treatment showed the highest significant increase in leaf
area/plant followed by the 2R (30 DAS). However, the R+I
treatment only caused significant increase in leaf area/plant (60

47
0
0.5
1
1.5
2
2.5
3
3.5
4
Dry
weig
ht
of
leaves/p
lan
t
R (control) 1/2R 2R R+I 1/2R+I 2R+I
Treatments
30 DAS 60 DAS 90 DAS Mean
0
0.5
1
1.5
2
2.5
Dry
weig
ht
of
leaves/p
lan
t
R (control) ½R 2R R+I ½R+I 2R+I
Treatments
FFiigg.. ((22..33)):: EEffffeecctt ooff ddiiffffeerreenntt aapppplliieedd ttrreeaattmmeennttss oonn tthhee ddrryy wweeiigghhtt ooff
lleeaavveess ooff mmuunngg bbeeaann ppllaannttss ooff ccuullttiivvaarr GGiizzaa--11 dduurriinngg sseeaassoonnss
ooff 22000011 ((AA)) aanndd 22000022 ((BB)) aatt 3300,, 6600 aanndd 9900 ddaayyss aafftteerr ssoowwiinngg..
A
B

48
DAS) compared with the control. The R+I treatment (30 DAS) and
the ½R and ½R+I treatments (60 DAS) significantly decreased leaf
area/plant compared with the control.
TTaabbllee ((22..44)):: EEffffeecctt ooff ddiiffffeerreenntt aapppplliieedd ttrreeaattmmeennttss oonn tthhee lleeaaff aarreeaa//ppllaanntt ooff mmuunngg bbeeaann ccuullttiivvaarr
GGiizzaa--11 dduurriinngg 22000011 && 22000022 sseeaassoonnss aatt 3300,, 6600 aanndd 9900 ddaayyss aafftteerr ssoowwiinngg..
Treatment 30 DAS 60 DAS 90 DAS
2001 2002 2001 2002 2001 2002
R (control) 129.41 51.86 101.14 135.11 -- -- ½R 50.54 66.46 30.34 84.23 -- -- 2R 106.35 109.70 120.87 121.08 -- -- R+I 99.66 32.43 72.66 183.87 -- -- ½R+I 30.62 54.81 57.76 64.04 -- -- 2R+I 137.09 185.50 135.53 155.92 -- -- L.S.D. at 5% 19.52 27.63 20.68 21.65 - -
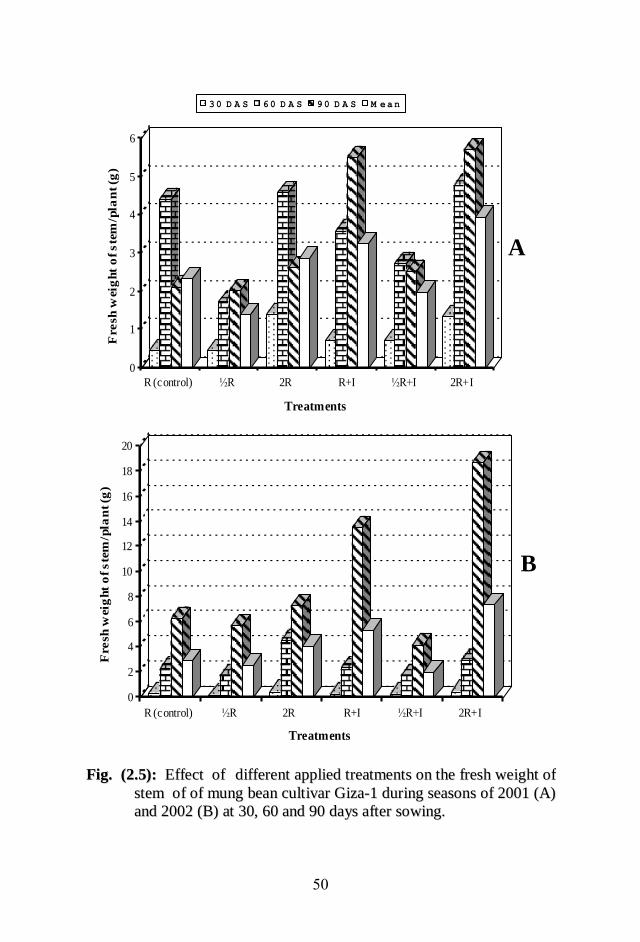
IIII..11..55-- FFRREESSHH WWEEIIGGHHTT OOFF SSTTEEMM::
In 2001 season, the data in Table (2.5) and Fig. (2.5) proved
that the 2R and 2R+I (30 DAS) and the R+I and 2R+I (90 DAS)
exhibited the highest significant increase in the fresh weight of
stem. However, in 2002 season, the treatments 2R+I (30, 60 and 90
DAS), the 2R (30 and 60 DAS) and R+I (90 DAS) significantly
produced higher fresh weight of stem than the R (control).
Applying the ½R (60 DAS) in 2001 season and (30 DAS) in 2002
season, ½R+I (90 DAS) in 2002 season caused significant decrease
in the fresh weight of the stem compared with R (control).
TTaabbllee ((22..55)):: EEffffeecctt ooff ddiiffffeerreenntt aapppplliieedd ttrreeaattmmeennttss oonn tthhee ffrreesshh wweeiigghhtt ooff sstteemm ooff mmuunngg bbeeaann
ppllaanntt ccuullttiivvaarr GGiizzaa--11 dduurriinngg 22000011 && 22000022 sseeaassoonnss aatt 3300,, 6600 aanndd 9900 ddaayyss aafftteerr
ssoowwiinngg..
Treatment 30 DAS 60 DAS 90 DAS
2001 2002 2001 2002 2001 2002
R (control) 0.46 0.32 4.42 2.30 2.12 6.31 ½R 0.45 0.20 1.74 1.76 2.03 5.71 2R 1.41 0.45 4.58 4.53 2.62 7.27 R+I 0.71 0.28 3.59 2.33 5.50 13.49 ½R+I 0.71 0.29 2.73 1.76 2.54 4.14 2R+I 1.36 0.46 4.79 2.98 5.71 18.72 L.S.D. at 5% 0.353 0.114 1.794 0.650 1.078 1.561
49
0
20
40
60
80
100
120
140
Lea
f a
rea
/pla
nt
(cm
2)
R (control) ½R 2R R+I ½R+I 2R+I
Treatments
30 DAS 60 DAS 90 DAS Mean
0
20
40
60
80
100
120
140
160
180
200
Lea
f a
rea
/pla
nt
(cm
2)
R (control) ½R 2R R+I ½R+I 2R+I
Treatments
FFiigg.. ((22..44)):: EEffffeecctt ooff ddiiffffeerreenntt aapppplliieedd ttrreeaattmmeennttss oonn tthhee ttoottaall lleeaaff
aarreeaa//ppllaanntt ooff mmuunngg bbeeaann ccuullttiivvaarr GGiizzaa--11 dduurriinngg sseeaassoonnss ooff
22000011 ((AA)) aanndd 22000022 ((BB)) aatt 3300,, 6600 aanndd 9900 ddaayyss aafftteerr ssoowwiinngg..
51
0
1
2
3
4
5
6
Fresh
weig
ht
of ste
m/p
lan
t (g
)
R (control) ½R 2R R+I ½R+I 2R+I
Treatments
30 D A S 60 D A S 90 D A S M ean
0
2
4
6
8
10
12
14
16
18
20
Fresh
weig
ht
of ste
m/p
lan
t (g
)
R (control) ½R 2R R+I ½R+I 2R+I
Treatments
FFiigg.. ((22..55)):: EEffffeecctt ooff ddiiffffeerreenntt aapppplliieedd ttrreeaattmmeennttss oonn tthhee ffrreesshh wweeiigghhtt ooff
sstteemm ooff ooff mmuunngg bbeeaann ccuullttiivvaarr GGiizzaa--11 dduurriinngg sseeaassoonnss ooff 22000011 ((AA))
aanndd 22000022 ((BB)) aatt 3300,, 6600 aanndd 9900 ddaayyss aafftteerr ssoowwiinngg..
A
B
51
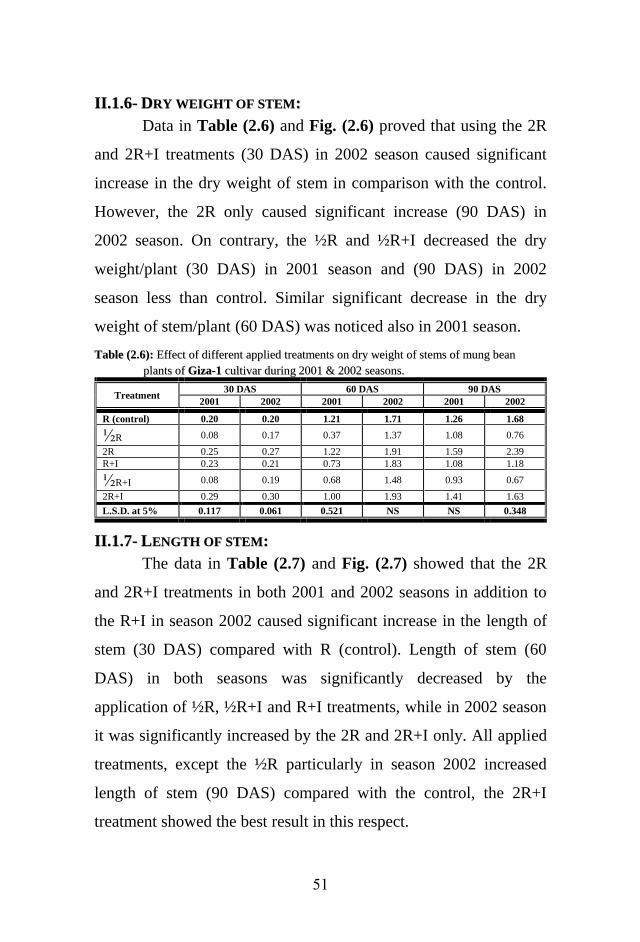
IIII..11..66-- DDRRYY WWEEIIGGHHTT OOFF SSTTEEMM::
Data in Table (2.6) and Fig. (2.6) proved that using the 2R
and 2R+I treatments (30 DAS) in 2002 season caused significant
increase in the dry weight of stem in comparison with the control.
However, the 2R only caused significant increase (90 DAS) in
2002 season. On contrary, the ½R and ½R+I decreased the dry
weight/plant (30 DAS) in 2001 season and (90 DAS) in 2002
season less than control. Similar significant decrease in the dry
weight of stem/plant (60 DAS) was noticed also in 2001 season.
TTaabbllee ((22..66)):: EEffffeecctt ooff ddiiffffeerreenntt aapppplliieedd ttrreeaattmmeennttss oonn ddrryy wweeiigghhtt ooff sstteemmss ooff mmuunngg bbeeaann
ppllaannttss ooff GGiizzaa--11 ccuullttiivvaarr dduurriinngg 22000011 && 22000022 sseeaassoonnss..
Treatment 30 DAS 60 DAS 90 DAS
2001 2002 2001 2002 2001 2002
R (control) 0.20 0.20 1.21 1.71 1.26 1.68 ½R 0.08 0.17 0.37 1.37 1.08 0.76 2R 0.25 0.27 1.22 1.91 1.59 2.39 R+I 0.23 0.21 0.73 1.83 1.08 1.18 ½R+I 0.08 0.19 0.68 1.48 0.93 0.67 2R+I 0.29 0.30 1.00 1.93 1.41 1.63 L.S.D. at 5% 0.117 0.061 0.521 NS NS 0.348
IIII..11..77-- LLEENNGGTTHH OOFF SSTTEEMM::
The data in Table (2.7) and Fig. (2.7) showed that the 2R
and 2R+I treatments in both 2001 and 2002 seasons in addition to
the R+I in season 2002 caused significant increase in the length of
stem (30 DAS) compared with R (control). Length of stem (60
DAS) in both seasons was significantly decreased by the
application of ½R, ½R+I and R+I treatments, while in 2002 season
it was significantly increased by the 2R and 2R+I only. All applied
treatments, except the ½R particularly in season 2002 increased
length of stem (90 DAS) compared with the control, the 2R+I
treatment showed the best result in this respect.

52
0
0.2
0.4
0.6
0.8
1
1.2
1.4
1.6
Dry w
eig
ht
of
ste
m/p
lan
t (g
)
R (control) ½R 2R R+I ½R+I 2R+I
Treatments
30 DAS 60 DAS 90 DAS M ean
0
0.5
1
1.5
2
2.5
Dry
wei
gh
t o
f st
em/p
lan
t (g
)
R (control) ½R 2R R+I ½R+I 2R+I
Treatments
FFiigg.. ((22..66)):: EEffffeecctt ooff ddiiffffeerreenntt aapppplliieedd ttrreeaattmmeennttss oonn ddrryy wweeiigghhtt ooff
sstteemmss ooff mmuunngg bbeeaann ccuullttiivvaarr GGiizzaa--11 dduurriinngg sseeaassoonnss ooff 22000011
((AA)) aanndd 22000022 ((BB)) aatt 3300,, 6600 aanndd 9900 ddaayyss aafftteerr ssoowwiinngg..
A
B
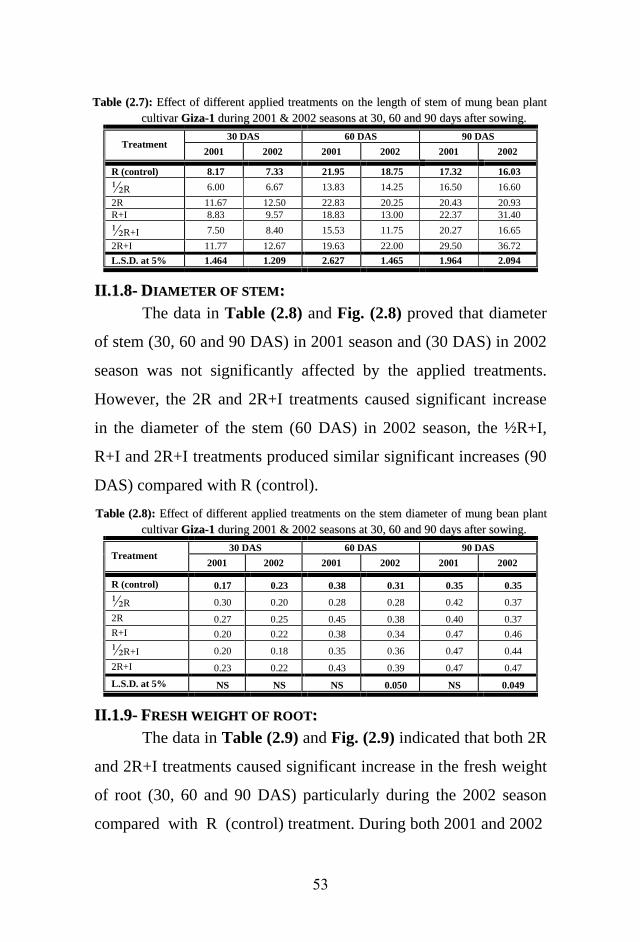
53
TTaabbllee ((22..77)):: EEffffeecctt ooff ddiiffffeerreenntt aapppplliieedd ttrreeaattmmeennttss oonn tthhee lleennggtthh ooff sstteemm ooff mmuunngg bbeeaann ppllaanntt
ccuullttiivvaarr GGiizzaa--11 dduurriinngg 22000011 && 22000022 sseeaassoonnss aatt 3300,, 6600 aanndd 9900 ddaayyss aafftteerr ssoowwiinngg..
Treatment 30 DAS 60 DAS 90 DAS
2001 2002 2001 2002 2001 2002
R (control) 8.17 7.33 21.95 18.75 17.32 16.03 ½R 6.00 6.67 13.83 14.25 16.50 16.60 2R 11.67 12.50 22.83 20.25 20.43 20.93 R+I 8.83 9.57 18.83 13.00 22.37 31.40 ½R+I 7.50 8.40 15.53 11.75 20.27 16.65 2R+I 11.77 12.67 19.63 22.00 29.50 36.72 L.S.D. at 5% 1.464 1.209 2.627 1.465 1.964 2.094
IIII..11..88-- DDIIAAMMEETTEERR OOFF SSTTEEMM::
The data in Table (2.8) and Fig. (2.8) proved that diameter
of stem (30, 60 and 90 DAS) in 2001 season and (30 DAS) in 2002
season was not significantly affected by the applied treatments.
However, the 2R and 2R+I treatments caused significant increase
in the diameter of the stem (60 DAS) in 2002 season, the ½R+I,
R+I and 2R+I treatments produced similar significant increases (90
DAS) compared with R (control).
TTaabbllee ((22..88)):: EEffffeecctt ooff ddiiffffeerreenntt aapppplliieedd ttrreeaattmmeennttss oonn tthhee sstteemm ddiiaammeetteerr ooff mmuunngg bbeeaann ppllaanntt
ccuullttiivvaarr GGiizzaa--11 dduurriinngg 22000011 && 22000022 sseeaassoonnss aatt 3300,, 6600 aanndd 9900 ddaayyss aafftteerr ssoowwiinngg..
Treatment 30 DAS 60 DAS 90 DAS
2001 2002 2001 2002 2001 2002
R (control) 0.17 0.23 0.38 0.31 0.35 0.35 ½R 0.30 0.20 0.28 0.28 0.42 0.37 2R 0.27 0.25 0.45 0.38 0.40 0.37 R+I 0.20 0.22 0.38 0.34 0.47 0.46 ½R+I 0.20 0.18 0.35 0.36 0.47 0.44 2R+I 0.23 0.22 0.43 0.39 0.47 0.47 L.S.D. at 5% NS NS NS 0.050 NS 0.049
IIII..11..99-- FFRREESSHH WWEEIIGGHHTT OOFF RROOOOTT::
The data in Table (2.9) and Fig. (2.9) indicated that both 2R
and 2R+I treatments caused significant increase in the fresh weight
of root (30, 60 and 90 DAS) particularly during the 2002 season
compared with R (control) treatment. During both 2001 and 2002

54
0
5
10
15
20
25
30
Ste
m l
en
gth
/pla
nt
(cm
)
R (control) ½R 2R R+I ½R+I 2R+I
Treatments
3 0 D A S 6 0 D A S 9 0 D A S M e a n
0
5
10
15
20
25
30
35
40
Ste
m len
gth
/pla
nt
(cm
)
R (control) ½R 2R R+I ½R+I 2R+I
Treatments
FFiigg.. ((22..77)):: EEffffeecctt ooff ddiiffffeerreenntt aapppplliieedd ttrreeaattmmeennttss oonn sstteemm lleennggtthh ooff
mmuunngg bbeeaann ccuullttiivvaarr GGiizzaa--11 dduurriinngg sseeaassoonnss ooff 22000011 ((AA)) aanndd 22000022
((BB)) aatt 3300,, 6600 aanndd 9900 ddaayyss aafftteerr ssoowwiinngg..
A
B

55
0
0.05
0.1
0.15
0.2
0.25
0.3
0.35
0.4
0.45
0.5
Ste
m d
iam
ete
r/p
lan
t (c
m)
R (control) ½R 2R R+I ½R+I 2R+I
Treatments
30 DAS 60 DAS 90 DAS M ean
0
0.05
0.1
0.15
0.2
0.25
0.3
0.35
0.4
0.45
0.5
Ste
m d
iam
eter
/pla
nt
(cm
)
R (control) ½R 2R R+I ½R+I 2R+I
Treatments
FFiigg.. ((22..88)):: EEffffeecctt ooff ddiiffffeerreenntt aapppplliieedd ttrreeaattmmeennttss oonn tthhee sstteemm ddiiaammeetteerr
ooff mmuunngg bbeeaann ccuullttiivvaarr GGiizzaa--11 dduurriinngg sseeaassoonnss ooff 22000011 ((AA)) aanndd
22000022 ((BB)) aatt 3300,, 6600 aanndd 9900 ddaayyss aafftteerr ssoowwiinngg..
A
B
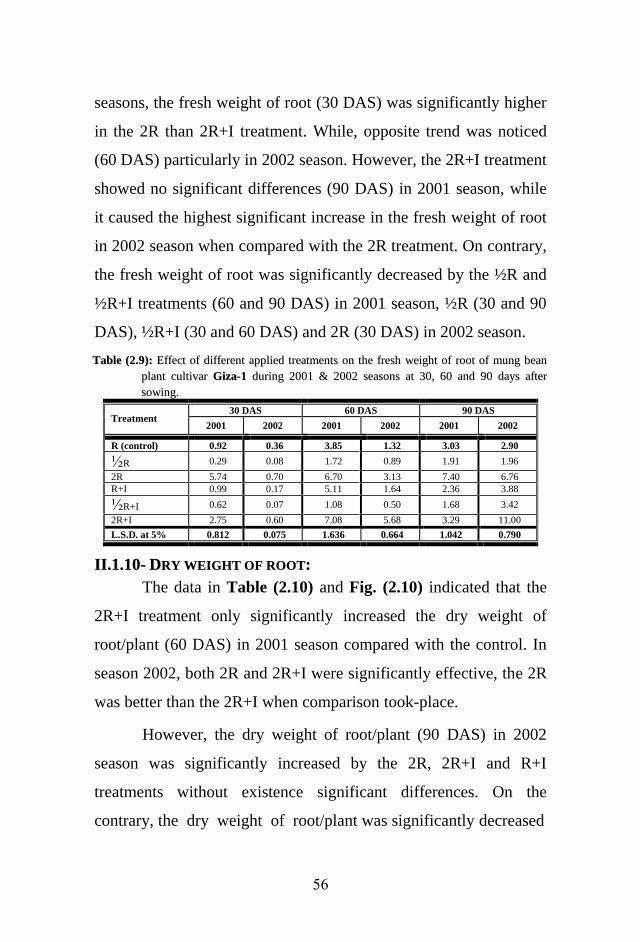
56
seasons, the fresh weight of root (30 DAS) was significantly higher
in the 2R than 2R+I treatment. While, opposite trend was noticed
(60 DAS) particularly in 2002 season. However, the 2R+I treatment
showed no significant differences (90 DAS) in 2001 season, while
it caused the highest significant increase in the fresh weight of root
in 2002 season when compared with the 2R treatment. On contrary,
the fresh weight of root was significantly decreased by the ½R and
½R+I treatments (60 and 90 DAS) in 2001 season, ½R (30 and 90
DAS), ½R+I (30 and 60 DAS) and 2R (30 DAS) in 2002 season.
TTaabbllee ((22..99)):: EEffffeecctt ooff ddiiffffeerreenntt aapppplliieedd ttrreeaattmmeennttss oonn tthhee ffrreesshh wweeiigghhtt ooff rroooott ooff mmuunngg bbeeaann
ppllaanntt ccuullttiivvaarr GGiizzaa--11 dduurriinngg 22000011 && 22000022 sseeaassoonnss aatt 3300,, 6600 aanndd 9900 ddaayyss aafftteerr
ssoowwiinngg..
Treatment 30 DAS 60 DAS 90 DAS
2001 2002 2001 2002 2001 2002
R (control) 0.92 0.36 3.85 1.32 3.03 2.90 ½R 0.29 0.08 1.72 0.89 1.91 1.96 2R 5.74 0.70 6.70 3.13 7.40 6.76 R+I 0.99 0.17 5.11 1.64 2.36 3.88 ½R+I 0.62 0.07 1.08 0.50 1.68 3.42 2R+I 2.75 0.60 7.08 5.68 3.29 11.00 L.S.D. at 5% 0.812 0.075 1.636 0.664 1.042 0.790
IIII..11..1100-- DDRRYY WWEEIIGGHHTT OOFF RROOOOTT::
The data in Table (2.10) and Fig. (2.10) indicated that the
2R+I treatment only significantly increased the dry weight of
root/plant (60 DAS) in 2001 season compared with the control. In
season 2002, both 2R and 2R+I were significantly effective, the 2R
was better than the 2R+I when comparison took-place.
However, the dry weight of root/plant (90 DAS) in 2002
season was significantly increased by the 2R, 2R+I and R+I
treatments without existence significant differences. On the
contrary, the dry weight of root/plant was significantly decreased

57
0
1
2
3
4
5
6
7
8
Fre
sh w
eig
ht
of
roo
t/p
lan
t (g
)
R (control) ½R 2R R+I ½R+I 2R+I
Treatments
30 DAS 60 DAS 90 DAS Mean
0
2
4
6
8
10
12
Fre
sh w
eig
ht
of
roo
t/p
lan
t (g
)
R (control) ½R 2R R+I ½R+I 2R+I
Treatments
FFiigg.. ((22..99)):: EEffffeecctt ooff ddiiffffeerreenntt aapppplliieedd ttrreeaattmmeennttss oonn tthhee ffrreesshh wweeiigghhtt ooff
rroooott ooff mmuunngg bbeeaann ccuullttiivvaarr GGiizzaa--11 dduurriinngg sseeaassoonnss ooff 22000011 ((AA))
aanndd 22000022 ((BB)) aatt 3300,, 6600 aanndd 9900 ddaayyss aafftteerr ssoowwiinngg..
A
B

58
by the ½R and ½R+I in 2001 season (30 DAS) and 2002 season (60
and 90 DAS) compared with the control treatment.
TTaabbllee ((22..1100)):: EEffffeecctt ooff ddiiffffeerreenntt aapppplliieedd ttrreeaattmmeennttss oonn ddrryy wweeiigghhtt ooff rroooott ooff mmuunngg bbeeaann ppllaannttss
ooff GGIIZZAA--11 ccuullttiivvaarr dduurriinngg 22000011 && 22000022 sseeaassoonnss..
Treatment 30 DAS 60 DAS 90 DAS
2001 2002 2001 2002 2001 2002
R (control) 0.50 0.10 0.97 0.61 1.54 0.77 ½R 0.08 0.04 0.50 0.18 0.77 0.38 2R 0.54 0.32 1.40 2.94 1.90 1.31 R+I 0.41 0.11 1.11 0.66 1.00 1.12 ½R+I 0.09 0.04 0.61 0.19 1.68 0.24 2R+I 0.62 0.42 1.65 2.26 1.76 1.30 L.S.D. at 5% 0.340 NS 0.500 0.270 0.626 0.207
IIII..11..1111-- LLEENNGGTTHH OOFF RROOOOTT::
Data in Table (2.11) and Fig. (2.11) proved that the 2R and
2R+I treatments (60 and 90 DAS) in 2001 season significantly
increased the length of root compared with the control. The 2R (30
and 90 DAS), R+I (90 DAS) and 2R (60 and 90 DAS) in 2002
season showed similar effects. On contrary, the ½R and ½R+I
treatments particularly in 2002 season and also the R+I (30 DAS)
in both seasons significantly decreased the length of root/plant
compared with the control treatment.
TTaabbllee ((22..1111)):: EEffffeecctt ooff ddiiffffeerreenntt aapppplliieedd ttrreeaattmmeennttss oonn tthhee rroooott lleennggtthh ooff mmuunngg bbeeaann ppllaanntt
ccuullttiivvaarr GGiizzaa--11 dduurriinngg 22000011 && 22000022 sseeaassoonnss aatt 3300,, 6600 aanndd 9900 ddaayyss aafftteerr ssoowwiinngg..
Treatment 30 DAS 60 DAS 90 DAS
2001 2002 2001 2002 2001 2002
R (control) 31.00 22.67 32.65 36.75 23.40 22.03 ½R 10.00 8.33 29.00 33.25 19.63 18.48 2R 35.00 23.00 36.00 40.00 34.27 33.45 R+I 27.00 9.33 32.33 34.00 26.00 11.47 ½R+I 24.00 8.20 22.50 27.63 11.32 11.50 2R+I 32.50 18.17 36.63 40.00 28.32 25.12 L.S.D. at 5% 1.956 2.393 3.681 2.772 2.281 1.347
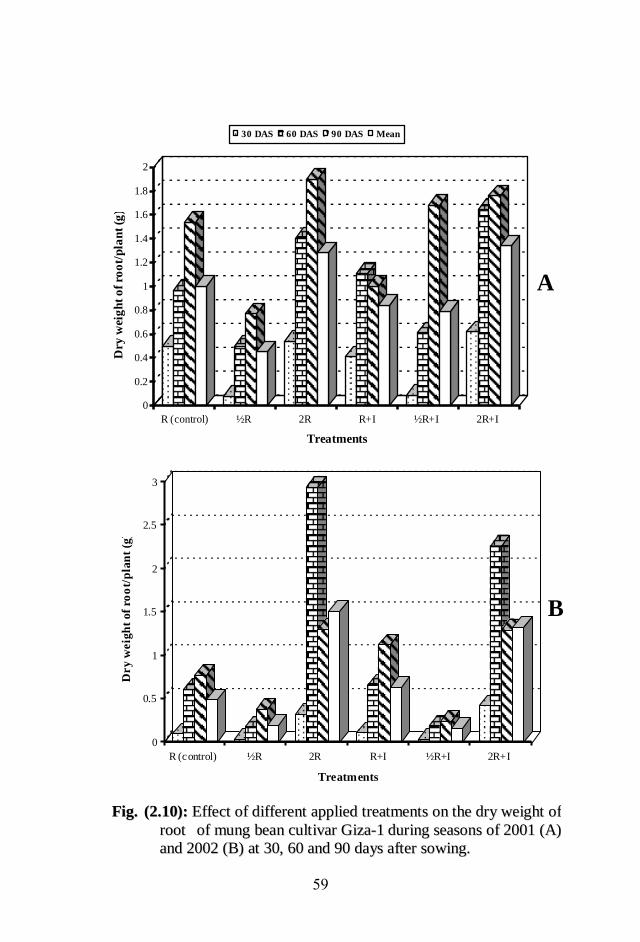
59
0
0.2
0.4
0.6
0.8
1
1.2
1.4
1.6
1.8
2
Dry
wei
gh
t o
f ro
ot/
pla
nt
(g)
R (control) ½R 2R R+I ½R+I 2R+I
Treatments
30 DAS 60 DAS 90 DAS Mean
0
0.5
1
1.5
2
2.5
3
Dry w
eig
ht
of
roo
t/p
lan
t (g
)
R (control) ½R 2R R+I ½R+I 2R+I
Treatments
FFiigg.. ((22..1100)):: EEffffeecctt ooff ddiiffffeerreenntt aapppplliieedd ttrreeaattmmeennttss oonn tthhee ddrryy wweeiigghhtt ooff
rroooott ooff mmuunngg bbeeaann ccuullttiivvaarr GGiizzaa--11 dduurriinngg sseeaassoonnss ooff 22000011 ((AA))
aanndd 22000022 ((BB)) aatt 3300,, 6600 aanndd 9900 ddaayyss aafftteerr ssoowwiinngg..
A
B

61
0
5
10
15
20
25
30
35
40
Ro
ot
len
gth
/pla
nt
(cm
)
R (control) ½R 2R R+I ½R+I 2R+I
Treatments
30 DAS 60 DAS 90 DAS Mean
0
5
10
15
20
25
30
35
40
Ro
ot
len
gth
/pla
nt
(cm
)
R (control) ½R 2R R+I ½R+I 2R+I
Treatments
FFiigg.. ((22..1111)):: EEffffeecctt ooff ddiiffffeerreenntt aapppplliieedd ttrreeaattmmeennttss oonn tthhee rroooott lleennggtthh ooff
mmuunngg bbeeaann ccuullttiivvaarr GGiizzaa--11 dduurriinngg sseeaassoonnss ooff 22000011 ((AA)) aanndd
22000022 ((BB)) aatt 3300,, 6600 aanndd 9900 ddaayyss aafftteerr ssoowwiinngg..
A
B
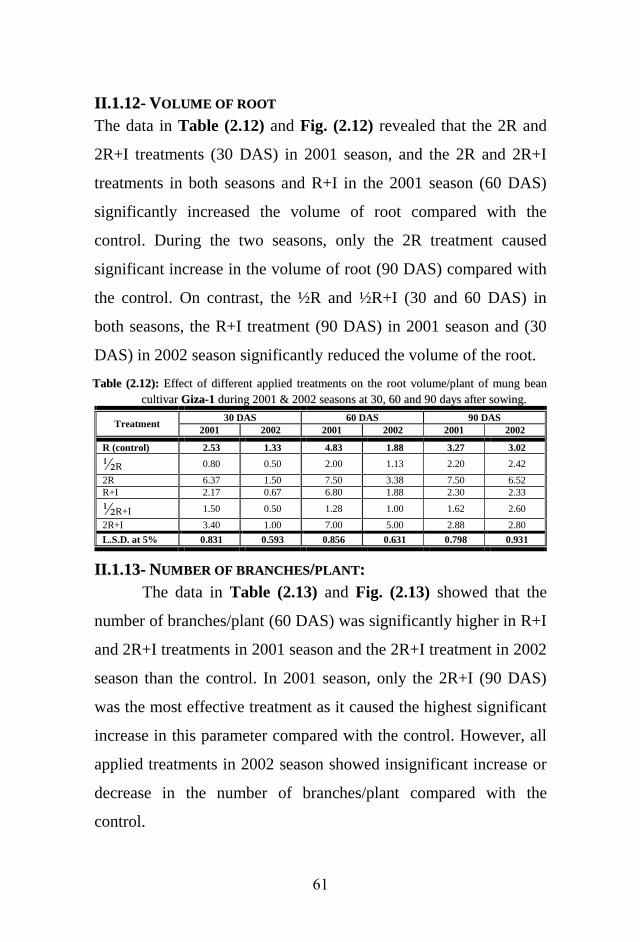
61
IIII..11..1122-- VVOOLLUUMMEE OOFF RROOOOTT
The data in Table (2.12) and Fig. (2.12) revealed that the 2R and
2R+I treatments (30 DAS) in 2001 season, and the 2R and 2R+I
treatments in both seasons and R+I in the 2001 season (60 DAS)
significantly increased the volume of root compared with the
control. During the two seasons, only the 2R treatment caused
significant increase in the volume of root (90 DAS) compared with
the control. On contrast, the ½R and ½R+I (30 and 60 DAS) in
both seasons, the R+I treatment (90 DAS) in 2001 season and (30
DAS) in 2002 season significantly reduced the volume of the root.
TTaabbllee ((22..1122)):: EEffffeecctt ooff ddiiffffeerreenntt aapppplliieedd ttrreeaattmmeennttss oonn tthhee rroooott vvoolluummee//ppllaanntt ooff mmuunngg bbeeaann
ccuullttiivvaarr GGiizzaa--11 dduurriinngg 22000011 && 22000022 sseeaassoonnss aatt 3300,, 6600 aanndd 9900 ddaayyss aafftteerr ssoowwiinngg..
Treatment 30 DAS 60 DAS 90 DAS
2001 2002 2001 2002 2001 2002
R (control) 2.53 1.33 4.83 1.88 3.27 3.02 ½R 0.80 0.50 2.00 1.13 2.20 2.42 2R 6.37 1.50 7.50 3.38 7.50 6.52 R+I 2.17 0.67 6.80 1.88 2.30 2.33 ½R+I 1.50 0.50 1.28 1.00 1.62 2.60 2R+I 3.40 1.00 7.00 5.00 2.88 2.80 L.S.D. at 5% 0.831 0.593 0.856 0.631 0.798 0.931
IIII..11..1133-- NNUUMMBBEERR OOFF BBRRAANNCCHHEESS//PPLLAANNTT::
The data in Table (2.13) and Fig. (2.13) showed that the
number of branches/plant (60 DAS) was significantly higher in R+I
and 2R+I treatments in 2001 season and the 2R+I treatment in 2002
season than the control. In 2001 season, only the 2R+I (90 DAS)
was the most effective treatment as it caused the highest significant
increase in this parameter compared with the control. However, all
applied treatments in 2002 season showed insignificant increase or
decrease in the number of branches/plant compared with the
control.

62
0
1
2
3
4
5
6
7
Ro
ot
vo
lum
e/p
lan
t (c
m3)
R (control) ½R 2R R+I ½R+I 2R+I
Treatments
30 DAS 60 DAS 90 DAS M ean
0
1
2
3
4
5
6
7
8
Ro
ot
vo
lum
e/p
lan
t (c
m3)
R (control) ½R 2R R+I ½R+I 2R+I
Treatments
FFiigg.. ((22..1122)):: EEffffeecctt ooff ddiiffffeerreenntt aapppplliieedd ttrreeaattmmeennttss oonn tthhee rroooott
vvoolluummee//ppllaanntt ooff mmuunngg bbeeaann ccuullttiivvaarr GGiizzaa--11 dduurriinngg sseeaassoonnss ooff
22000011 ((AA)) aanndd 22000022 ((BB)) aatt 3300,, 6600 aanndd 9900 ddaayyss aafftteerr ssoowwiinngg..
A
B

63
TTaabbllee ((22..1133)):: EEffffeecctt ooff ddiiffffeerreenntt aapppplliieedd ttrreeaattmmeennttss oonn nnuummbbeerr ooff bbrraanncchheess//ppllaanntt ooff mmuunngg
bbeeaann ccuullttiivvaarr GGiizzaa--11 dduurriinngg 22000011 && 22000022 sseeaassoonnss aatt 3300,, 6600 aanndd 9900 ddaayyss aafftteerr
ssoowwiinngg..
Treatment 30 DAS 60 DAS 90 DAS
2001 2002 2001 2002 2001 2002
R (control) 0.00 0.00 0.00 2.50 0.00 1.17 ½R 0.00 0.00 0.00 1.50 0.00 1.50 2R 0.00 0.00 0.00 3.00 0.00 2.17 R+I 0.00 0.00 1.00 2.17 0.00 0.67 ½R+I 0.00 0.00 0.00 1.83 0.00 0.17 2R+I 0.00 0.00 1.25 3.17 1.50 2.00 L.S.D. at 5% 0.00 0.00 0.303 0.664 0.350 0.994
IIII..11..1144-- NNUUMMBBEERR OOFF IINNFFLLOORREESSCCEENNCCEESS//PPLLAANNTT::
The data in Table (2.14) and Fig. (2.14) showed that the 2R
(60 DAS) and 2R+I (90 DAS) were the best treatments, as they
caused the highest significant increase in the number of
inflorescences/plant in both 2001 and 2002 seasons. Number of
inflorescences/plant (90 DAS) was significantly improved also with
the 2R and 2R+I in 2001 season but this was true with the R+I and
2R+I in 2002 season compared with the control. On the contrary,
the ½R treatment significantly decreased the number of
inflorescences/plant (90 DAS) particularly during 2002 season.
TTaabbllee ((22..1144)):: EEffffeecctt ooff ddiiffffeerreenntt aapppplliieedd ttrreeaattmmeennttss oonn nnuummbbeerr ooff iinnfflloorreesscceennccee//ppllaanntt ooff mmuunngg
bbeeaann ccuullttiivvaarr GGiizzaa--11 dduurriinngg 22000011 && 22000022 sseeaassoonnss aatt 3300,, 6600 aanndd 9900 ddaayyss aafftteerr
ssoowwiinngg..
Treatment 30 DAS 60 DAS 90 DAS
2001 2002 2001 2002 2001 2002
R (control) 0.00 0.00 3.75 2.67 1.75 3.00 ½R 0.00 0.00 2.00 2.33 1.25 1.83 2R 0.00 0.00 6.00 3.83 6.75 3.83 R+I 0.00 0.00 3.25 5.83 1.75 4.33 ½R+I 0.00 0.00 2.25 5.00 1.50 2.33 2R+I 0.00 0.00 4.75 8.00 3.50 5.67 L.S.D. at 5% - - 1.950 0.922 0.783 1.002

64
0
0.2
0.4
0.6
0.8
1
1.2
1.4
1.6
No
. of
bra
nch
es/p
lan
t
R (control) ½R 2R R+I ½R+I 2R+I
Treatments
30 DAS 60 DAS 90 DAS Mean
0
0.5
1
1.5
2
2.5
3
3.5
No
. o
f b
ra
nch
es/p
lan
t
R (control) ½R 2R R+I ½R+I 2R+I
Treatments
FFiigg.. ((22..1133)):: EEffffeecctt ooff ddiiffffeerreenntt aapppplliieedd ttrreeaattmmeennttss oonn tthhee nnuummbbeerr ooff
bbrraanncchheess//ppllaanntt ooff mmuunngg bbeeaann ccuullttiivvaarr GGiizzaa--11 dduurriinngg sseeaassoonnss ooff
22000011 ((AA)) aanndd 22000022 ((BB)) aatt 3300,, 6600 aanndd 9900 ddaayyss aafftteerr ssoowwiinngg..
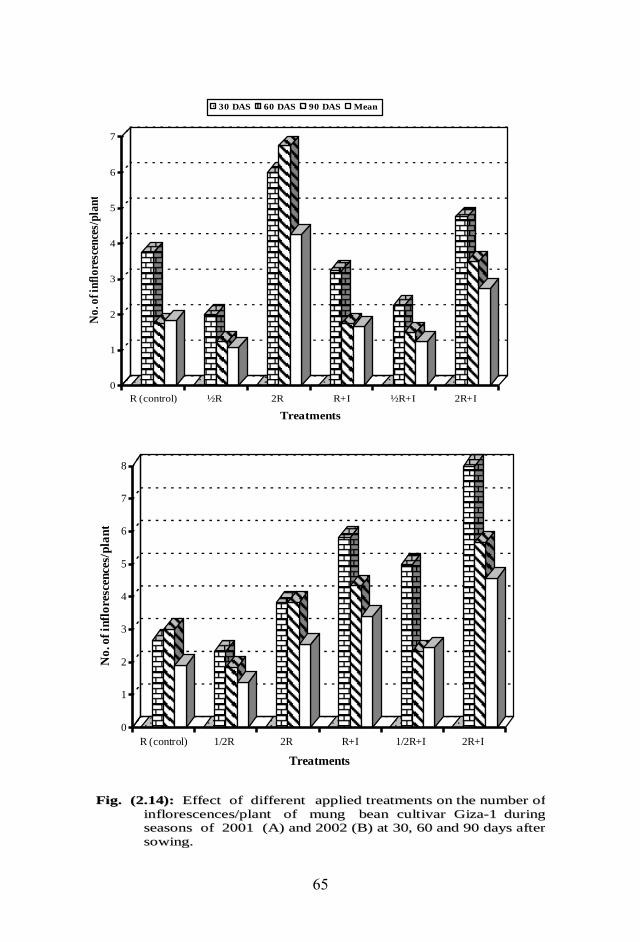
65
0
1
2
3
4
5
6
7
No
. of
infl
ore
scen
ces/
pla
nt
R (control) ½R 2R R+I ½R+I 2R+I
Treatments
30 DAS 60 DAS 90 DAS Mean
0
1
2
3
4
5
6
7
8
No
. of
infl
ore
scen
ces/
pla
nt
R (control) 1/2R 2R R+I 1/2R+I 2R+I
Treatments
FFiigg.. ((22..1144)):: EEffffeecctt ooff ddiiffffeerreenntt aapppplliieedd ttrreeaattmmeennttss oonn tthhee nnuummbbeerr ooff
iinnfflloorreesscceenncceess//ppllaanntt ooff mmuunngg bbeeaann ccuullttiivvaarr GGiizzaa--11 dduurriinngg
sseeaassoonnss ooff 22000011 ((AA)) aanndd 22000022 ((BB)) aatt 3300,, 6600 aanndd 9900 ddaayyss aafftteerr
ssoowwiinngg..
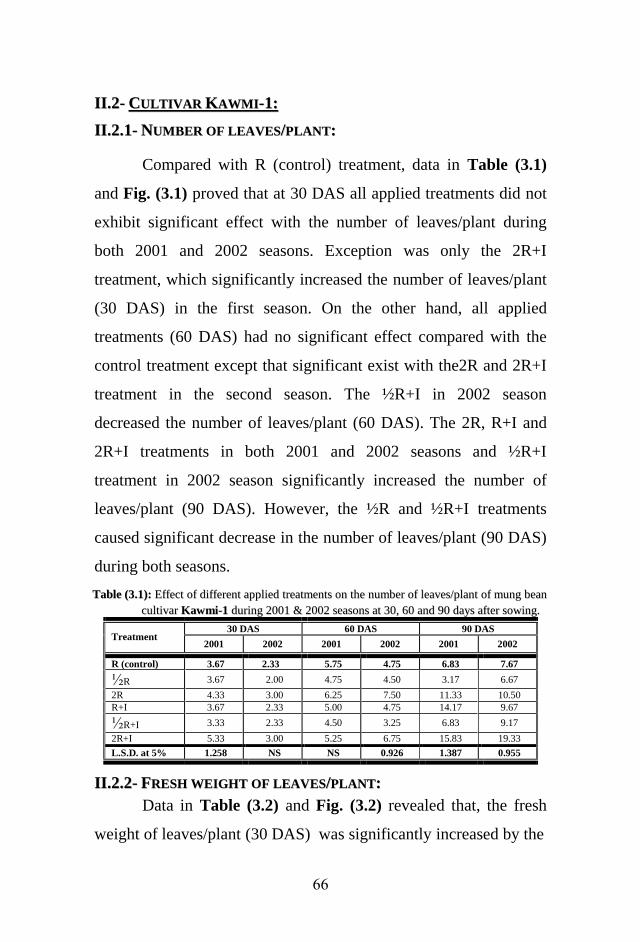
66
IIII..22-- CCUULLTTIIVVAARR KKAAWWMMII--11::
IIII..22..11-- NNUUMMBBEERR OOFF LLEEAAVVEESS//PPLLAANNTT::
Compared with R (control) treatment, data in Table (3.1)
and Fig. (3.1) proved that at 30 DAS all applied treatments did not
exhibit significant effect with the number of leaves/plant during
both 2001 and 2002 seasons. Exception was only the 2R+I
treatment, which significantly increased the number of leaves/plant
(30 DAS) in the first season. On the other hand, all applied
treatments (60 DAS) had no significant effect compared with the
control treatment except that significant exist with the2R and 2R+I
treatment in the second season. The ½R+I in 2002 season
decreased the number of leaves/plant (60 DAS). The 2R, R+I and
2R+I treatments in both 2001 and 2002 seasons and ½R+I
treatment in 2002 season significantly increased the number of
leaves/plant (90 DAS). However, the ½R and ½R+I treatments
caused significant decrease in the number of leaves/plant (90 DAS)
during both seasons.
TTaabbllee ((33..11)):: EEffffeecctt ooff ddiiffffeerreenntt aapppplliieedd ttrreeaattmmeennttss oonn tthhee nnuummbbeerr ooff lleeaavveess//ppllaanntt ooff mmuunngg bbeeaann
ccuullttiivvaarr KKaawwmmii--11 dduurriinngg 22000011 && 22000022 sseeaassoonnss aatt 3300,, 6600 aanndd 9900 ddaayyss aafftteerr ssoowwiinngg..
Treatment 30 DAS 60 DAS 90 DAS
2001 2002 2001 2002 2001 2002
R (control) 3.67 2.33 5.75 4.75 6.83 7.67
½R 3.67 2.00 4.75 4.50 3.17 6.67
2R 4.33 3.00 6.25 7.50 11.33 10.50
R+I 3.67 2.33 5.00 4.75 14.17 9.67
½R+I 3.33 2.33 4.50 3.25 6.83 9.17
2R+I 5.33 3.00 5.25 6.75 15.83 19.33
L.S.D. at 5% 1.258 NS NS 0.926 1.387 0.955
IIII..22..22-- FFRREESSHH WWEEIIGGHHTT OOFF LLEEAAVVEESS//PPLLAANNTT::
Data in Table (3.2) and Fig. (3.2) revealed that, the fresh
weight of leaves/plant (30 DAS) was significantly increased by the
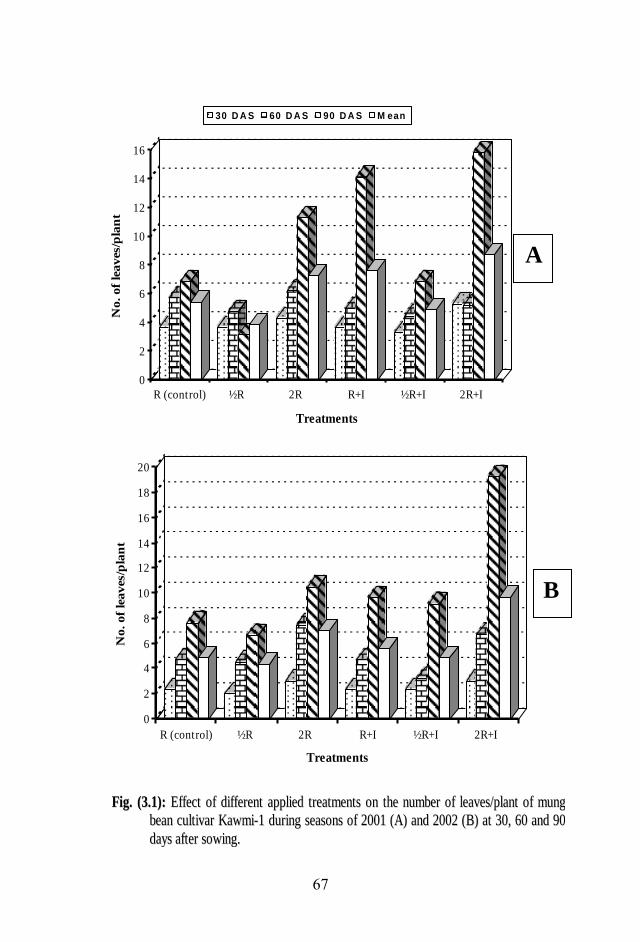
67
0
2
4
6
8
10
12
14
16
No
. of
lea
ves/p
lan
t
R (control) ½R 2R R+I ½R+I 2R+I
Treatments
30 D A S 60 D A S 90 D A S M ean
0
2
4
6
8
10
12
14
16
18
20
No
. of
lea
ves/p
lan
t
R (control) ½R 2R R+I ½R+I 2R+I
Treatments
FFiigg.. ((33..11)):: EEffffeecctt ooff ddiiffffeerreenntt aapppplliieedd ttrreeaattmmeennttss oonn tthhee nnuummbbeerr ooff lleeaavveess//ppllaanntt ooff mmuunngg
bbeeaann ccuullttiivvaarr KKaawwmmii--11 dduurriinngg sseeaassoonnss ooff 22000011 ((AA)) aanndd 22000022 ((BB)) aatt 3300,, 6600 aanndd 9900
ddaayyss aafftteerr ssoowwiinngg..
A
B
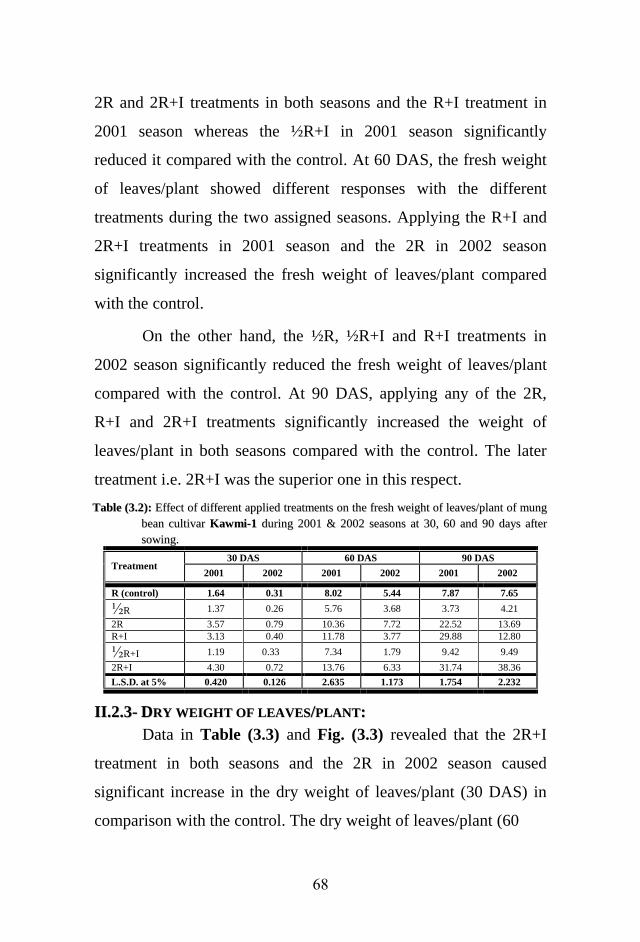
68
2R and 2R+I treatments in both seasons and the R+I treatment in
2001 season whereas the ½R+I in 2001 season significantly
reduced it compared with the control. At 60 DAS, the fresh weight
of leaves/plant showed different responses with the different
treatments during the two assigned seasons. Applying the R+I and
2R+I treatments in 2001 season and the 2R in 2002 season
significantly increased the fresh weight of leaves/plant compared
with the control.
On the other hand, the ½R, ½R+I and R+I treatments in
2002 season significantly reduced the fresh weight of leaves/plant
compared with the control. At 90 DAS, applying any of the 2R,
R+I and 2R+I treatments significantly increased the weight of
leaves/plant in both seasons compared with the control. The later
treatment i.e. 2R+I was the superior one in this respect.
TTaabbllee ((33..22)):: EEffffeecctt ooff ddiiffffeerreenntt aapppplliieedd ttrreeaattmmeennttss oonn tthhee ffrreesshh wweeiigghhtt ooff lleeaavveess//ppllaanntt ooff mmuunngg
bbeeaann ccuullttiivvaarr KKaawwmmii--11 dduurriinngg 22000011 && 22000022 sseeaassoonnss aatt 3300,, 6600 aanndd 9900 ddaayyss aafftteerr
ssoowwiinngg..
Treatment 30 DAS 60 DAS 90 DAS
2001 2002 2001 2002 2001 2002
R (control) 1.64 0.31 8.02 5.44 7.87 7.65
½R 1.37 0.26 5.76 3.68 3.73 4.21
2R 3.57 0.79 10.36 7.72 22.52 13.69
R+I 3.13 0.40 11.78 3.77 29.88 12.80
½R+I 1.19 0.33 7.34 1.79 9.42 9.49
2R+I 4.30 0.72 13.76 6.33 31.74 38.36
L.S.D. at 5% 0.420 0.126 2.635 1.173 1.754 2.232
IIII..22..33-- DDRRYY WWEEIIGGHHTT OOFF LLEEAAVVEESS//PPLLAANNTT::
Data in Table (3.3) and Fig. (3.3) revealed that the 2R+I
treatment in both seasons and the 2R in 2002 season caused
significant increase in the dry weight of leaves/plant (30 DAS) in
comparison with the control. The dry weight of leaves/plant (60
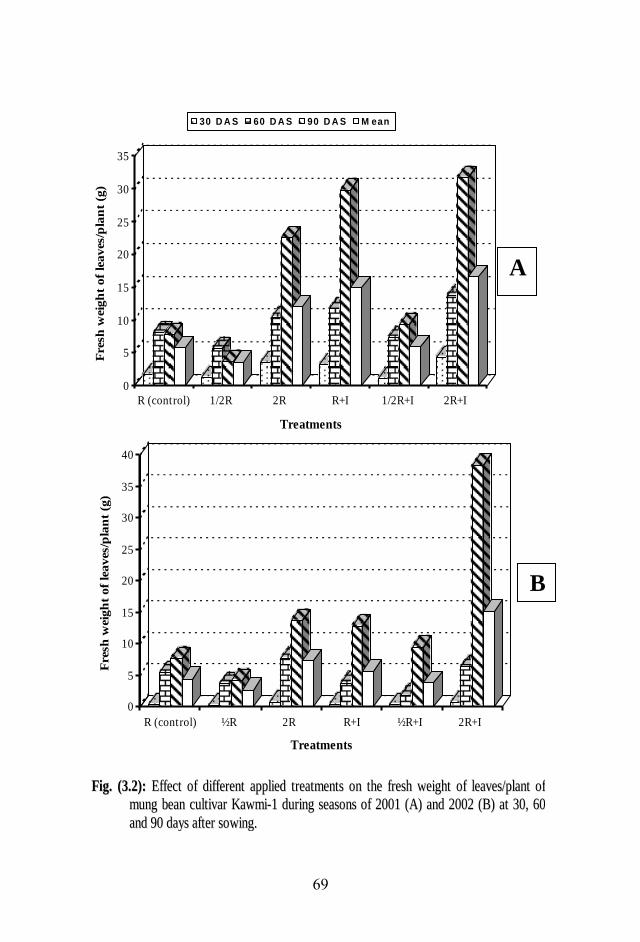
69
0
5
10
15
20
25
30
35
Fresh
weig
ht
of
lea
ves/p
lan
t (g
)
R (control) 1/2R 2R R+I 1/2R+I 2R+I
Treatments
30 D A S 60 D A S 90 D A S M ean
0
5
10
15
20
25
30
35
40
Fresh
weig
ht
of
lea
ves/p
lan
t (g
)
R (control) ½R 2R R+I ½R+I 2R+I
Treatments
FFiigg.. ((33..22)):: EEffffeecctt ooff ddiiffffeerreenntt aapppplliieedd ttrreeaattmmeennttss oonn tthhee ffrreesshh wweeiigghhtt ooff lleeaavveess//ppllaanntt ooff
mmuunngg bbeeaann ccuullttiivvaarr KKaawwmmii--11 dduurriinngg sseeaassoonnss ooff 22000011 ((AA)) aanndd 22000022 ((BB)) aatt 3300,, 6600
aanndd 9900 ddaayyss aafftteerr ssoowwiinngg..
A
B
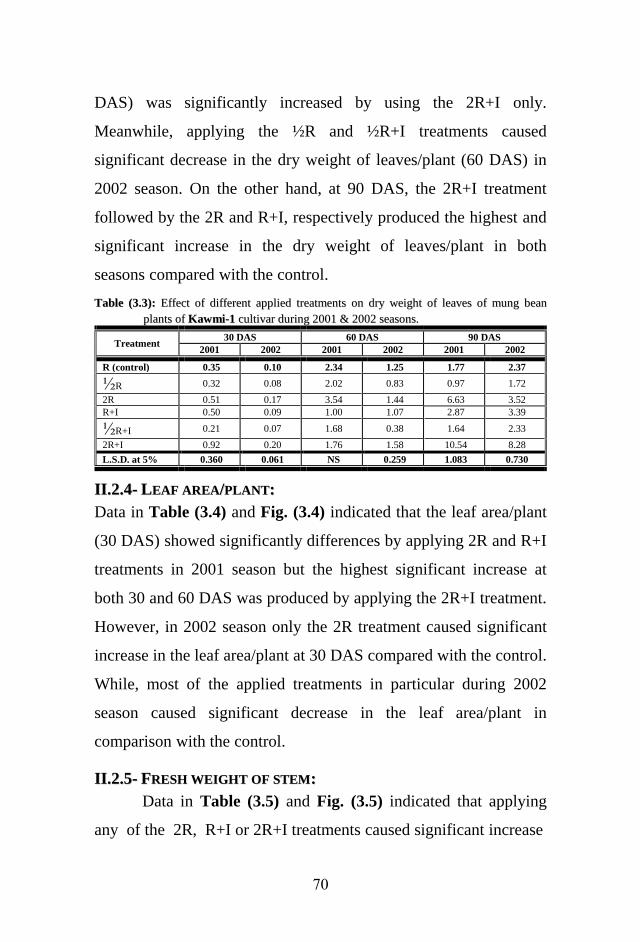
71
DAS) was significantly increased by using the 2R+I only.
Meanwhile, applying the ½R and ½R+I treatments caused
significant decrease in the dry weight of leaves/plant (60 DAS) in
2002 season. On the other hand, at 90 DAS, the 2R+I treatment
followed by the 2R and R+I, respectively produced the highest and
significant increase in the dry weight of leaves/plant in both
seasons compared with the control.
TTaabbllee ((33..33)):: EEffffeecctt ooff ddiiffffeerreenntt aapppplliieedd ttrreeaattmmeennttss oonn ddrryy wweeiigghhtt ooff lleeaavveess ooff mmuunngg bbeeaann
ppllaannttss ooff KKaawwmmii--11 ccuullttiivvaarr dduurriinngg 22000011 && 22000022 sseeaassoonnss..
Treatment 30 DAS 60 DAS 90 DAS
2001 2002 2001 2002 2001 2002
R (control) 0.35 0.10 2.34 1.25 1.77 2.37 ½R 0.32 0.08 2.02 0.83 0.97 1.72 2R 0.51 0.17 3.54 1.44 6.63 3.52 R+I 0.50 0.09 1.00 1.07 2.87 3.39 ½R+I 0.21 0.07 1.68 0.38 1.64 2.33 2R+I 0.92 0.20 1.76 1.58 10.54 8.28 L.S.D. at 5% 0.360 0.061 NS 0.259 1.083 0.730
IIII..22..44-- LLEEAAFF AARREEAA//PPLLAANNTT::
Data in Table (3.4) and Fig. (3.4) indicated that the leaf area/plant
(30 DAS) showed significantly differences by applying 2R and R+I
treatments in 2001 season but the highest significant increase at
both 30 and 60 DAS was produced by applying the 2R+I treatment.
However, in 2002 season only the 2R treatment caused significant
increase in the leaf area/plant at 30 DAS compared with the control.
While, most of the applied treatments in particular during 2002
season caused significant decrease in the leaf area/plant in
comparison with the control.
IIII..22..55-- FFRREESSHH WWEEIIGGHHTT OOFF SSTTEEMM::
Data in Table (3.5) and Fig. (3.5) indicated that applying
any of the 2R, R+I or 2R+I treatments caused significant increase
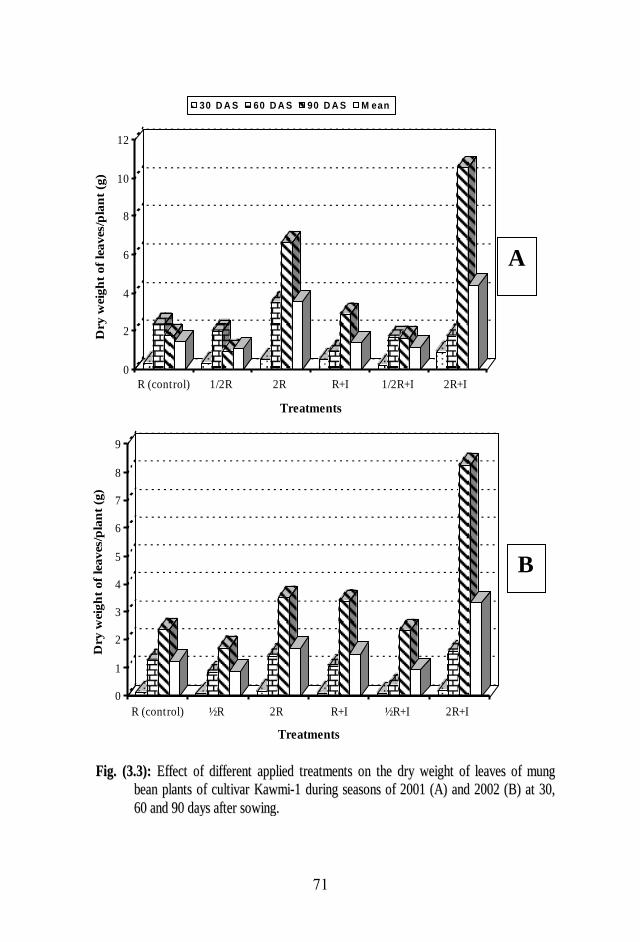
71
0
2
4
6
8
10
12
Dry
weig
ht
of
lea
ves/p
lan
t (g
)
R (control) 1/2R 2R R+I 1/2R+I 2R+I
Treatments
30 D A S 60 D A S 90 D A S M ean
0
1
2
3
4
5
6
7
8
9
Dry
weig
ht
of
lea
ves/p
lan
t (g
)
R (control) ½R 2R R+I ½R+I 2R+I
Treatments
FFiigg.. ((33..33)):: EEffffeecctt ooff ddiiffffeerreenntt aapppplliieedd ttrreeaattmmeennttss oonn tthhee ddrryy wweeiigghhtt ooff lleeaavveess ooff mmuunngg
bbeeaann ppllaannttss ooff ccuullttiivvaarr KKaawwmmii--11 dduurriinngg sseeaassoonnss ooff 22000011 ((AA)) aanndd 22000022 ((BB)) aatt 3300,,
6600 aanndd 9900 ddaayyss aafftteerr ssoowwiinngg..
A
B

72
TTaabbllee ((33..44)):: EEffffeecctt ooff ddiiffffeerreenntt aapppplliieedd ttrreeaattmmeennttss oonn tthhee lleeaaff aarreeaa//ppllaanntt ooff mmuunngg bbeeaann ccuullttiivvaarr
KKaawwmmii--11 dduurriinngg 22000011 && 22000022 sseeaassoonnss aatt 3300,, 6600 aanndd 9900 ddaayyss aafftteerr ssoowwiinngg..
Treatment 30 DAS 60 DAS 90 DAS
2001 2002 2001 2002 2001 2002
R (control) 68.83 147.50 167.80 165.67 -- -- ½R 51.49 141.60 86.98 102.15 -- --
2R 99.91 183.64 188.18 189.34 -- --
R+I 89.21 105.52 200.0 59.00 -- --
½R+I 41.10 95.09 137.47 99.12 -- --
2R+I 135.26 65.04 488.52 103.84 -- --
L.S.D. at 5% 15.63 20.41 78.56 26.51 - -
TTaabbllee ((33..55)):: EEffffeecctt ooff ddiiffffeerreenntt aapppplliieedd ttrreeaattmmeennttss oonn tthhee ffrreesshh wweeiigghhtt ooff sstteemm ooff mmuunngg bbeeaann
ppllaanntt ccuullttiivvaarr KKaawwmmii--11 dduurriinngg 22000011 && 22000022 sseeaassoonnss aatt 3300,, 6600 aanndd 9900 ddaayyss aafftteerr
ssoowwiinngg..
Treatment 30 DAS 60 DAS 90 DAS
2001 2002 2001 2002 2001 2002
R (control) 0.75 0.20 5.34 2.88 7.67 10.76
½R 0.71 0.16 3.87 3.68 3.94 6.01
2R 1.36 0.37 6.05 3.14 11.56 11.13
R+I 1.25 0.26 6.33 1.75 20.68 14.79
½R+I 0.52 0.16 4.46 1.17 7.62 8.31
2R+I 1.31 0.26 6.56 2.65 30.40 23.40
L.S.D. at 5% 0.247 0.059 1.837 NS 3.525 1.373
in the fresh weight of stem/plant at 30 and 90 DAS particularly
during the 2001 season compared with the control. While, applying
the ½R and ½R+I caused significant decrease in the fresh weight of
stem/plant (90 DAS) particularly during 2002 season. At 60 DAS,
all the treatments in both seasons showed no significant variation in
fresh weight of stem compared with the control.
IIII..22..66-- DDRRYY WWEEIIGGHHTT OOFF SSTTEEMM::
Data in Table (3.6) and Fig. (3.6) showed that the 2R treatment
caused significant increase in the dry weight of stem at 30 and 60
DAS in 2002 season only whereas, R+I and 2R+I treatments increased
it (90 DAS) in both 2001 and 2002 seasons compared with the
control. In this respect, the 2R+I treatment was significantly better
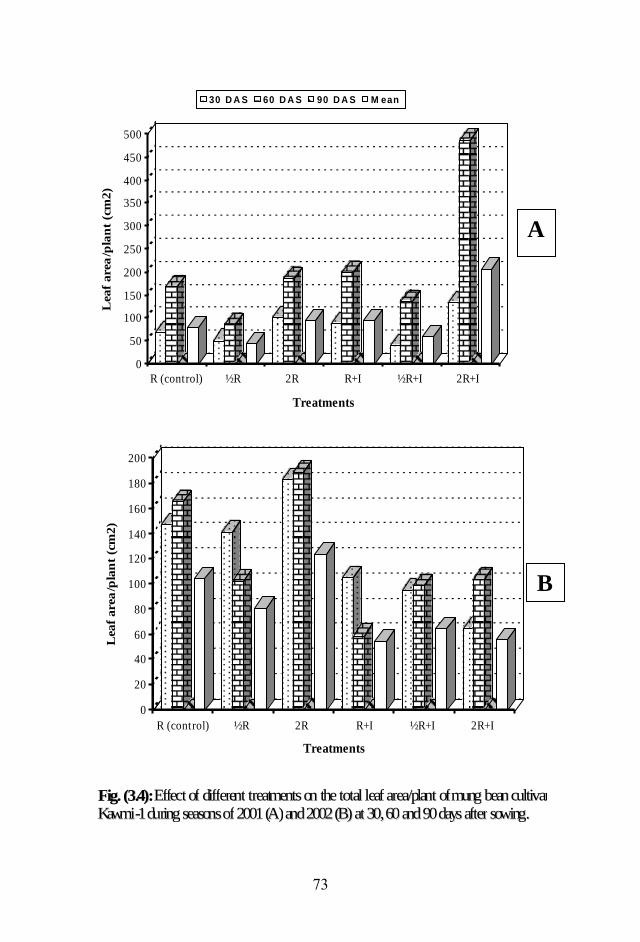
73
0
50
100
150
200
250
300
350
400
450
500
Lea
f area
/pla
nt
(cm
2)
R (control) ½R 2R R+I ½R+I 2R+I
Treatments
30 D A S 60 D A S 90 D A S M ean
0
20
40
60
80
100
120
140
160
180
200
Lea
f area
/pla
nt
(cm
2)
R (control) ½R 2R R+I ½R+I 2R+I
Treatments
A
B
F F i i g g . . ( ( 3 3 . . 4 4 ) ) : : E E f f f f e e c c t t o o f f d d i i f f f f e e r r e e n n t t t t r r e e a a t t m m e e n n t t s s o o n n t t h h e e t t o o t t a a l l l l e e a a f f a a r r e e a a / / p p l l a a n n t t o o f f m m u u n n g g b b e e a a n n c c u u l l t t i i v v a a r r K K a a w w m m i i - - 1 1 d d u u r r i i n n g g s s e e a a s s o o n n s s o o f f 2 2 0 0 0 0 1 1 ( ( A A ) ) a a n n d d 2 2 0 0 0 0 2 2 ( ( B B ) ) a a t t 3 3 0 0 , , 6 6 0 0 a a n n d d 9 9 0 0 d d a a y y s s a a f f t t e e r r s s o o w w i i n n g g . .
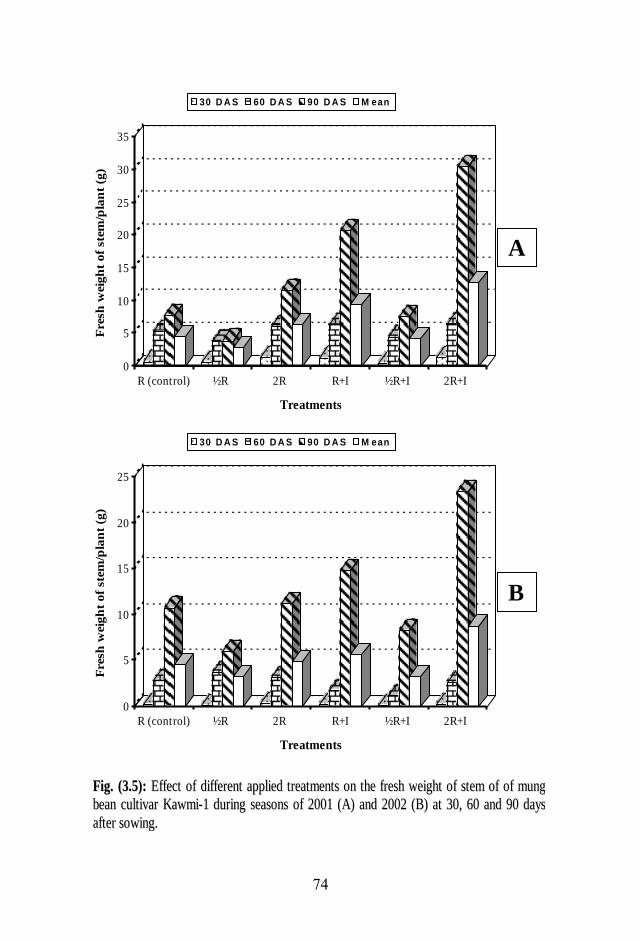
74
0
5
10
15
20
25
30
35
Fresh
weig
ht
of
ste
m/p
lan
t (g
)
R (control) ½R 2R R+I ½R+I 2R+I
Treatments
30 D A S 60 D A S 90 D A S M ean
0
5
10
15
20
25
Fresh
weig
ht
of
ste
m/p
lan
t (g
)
R (control) ½R 2R R+I ½R+I 2R+I
Treatments
30 D A S 60 D A S 90 D A S M ean
FFiigg.. ((33..55)):: EEffffeecctt ooff ddiiffffeerreenntt aapppplliieedd ttrreeaattmmeennttss oonn tthhee ffrreesshh wweeiigghhtt ooff sstteemm ooff ooff mmuunngg
bbeeaann ccuullttiivvaarr KKaawwmmii--11 dduurriinngg sseeaassoonnss ooff 22000011 ((AA)) aanndd 22000022 ((BB)) aatt 3300,, 6600 aanndd 9900 ddaayyss
aafftteerr ssoowwiinngg..
A
B

75
than the R+I in 2002 season only. On contrast, applying the ½R
treatment caused significant decrease in the dry weight of stem at 60
and 90 DAS in 2002 season. Also, in 2002 season the dry weight of
stem (60 DAS) was decreased significantly by using the ½R+I
treatment compared with the control.
TTaabbllee ((33..66)):: EEffffeecctt ooff ddiiffffeerreenntt aapppplliieedd ttrreeaattmmeennttss oonn ddrryy wweeiigghhtt ooff sstteemmss ooff mmuunngg bbeeaann
ppllaannttss ooff KKaawwmmii--11 ccuullttiivvaarr dduurriinngg 22000011 && 22000022 sseeaassoonnss..
Treatment 30 DAS 60 DAS 90 DAS
2001 2002 2001 2002 2001 2002
R (control) 0.12 0.16 1.26 1.68 1.69 6.96 ½R 0.11 0.11 1.08 0.76 1.83 4.16 2R 0.14 0.23 1.59 2.39 2.84 6.60 R+I 0.14 0.17 1.08 1.18 7.07 8.55 ½R+I 0.07 0.13 0.93 0.67 1.93 5.15 2R+I 0.21 0.19 1.41 1.63 7.93 14.13 L.S.D. at 5% NS 0.063 NS 0.348 1.198 1.508
IIII..22..77-- LLEENNGGTTHH OOFF SSTTEEMM::
Data in Table (3.7) and Fig. (3.7) showed that applying
2R+I treatment in both 2001 and 2002 seasons significantly
increased the length of stem (30 DAS) whereas, 2R and R+I
increased it in 2001 season only compared with the control. On
contrary, applying the ½R treatment caused significant decrease in
the length of stem (30 DAS) in 2002 season. Compared with
control, the stem length (60 DAS) was significantly increased by
the 2R in 2002 season only while, applying the R+I and ½R+I in
both seasons and ½R in 2001 season significantly decreased it. The
length of stem (90 DAS) was significantly increased by R+I and
2R+I treatments in both seasons and the 2R one in 2002 season. On
the opposite side, applying ½R in both seasons and ½R+I in 2001
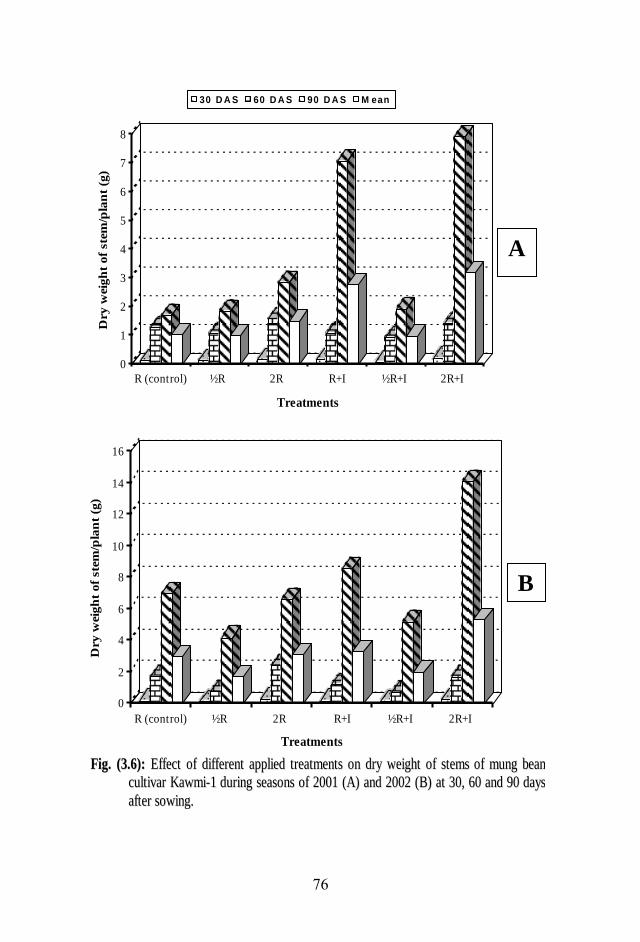
76
0
1
2
3
4
5
6
7
8
Dry
weig
ht
of
ste
m/p
lan
t (g
)
R (control) ½R 2R R+I ½R+I 2R+I
Treatments
30 D A S 60 D A S 90 D A S M ean
0
2
4
6
8
10
12
14
16
Dry
weig
ht
of
ste
m/p
lan
t (g
)
R (control) ½R 2R R+I ½R+I 2R+I
Treatments
FFiigg.. ((33..66)):: EEffffeecctt ooff ddiiffffeerreenntt aapppplliieedd ttrreeaattmmeennttss oonn ddrryy wweeiigghhtt ooff sstteemmss ooff mmuunngg bbeeaann
ccuullttiivvaarr KKaawwmmii--11 dduurriinngg sseeaassoonnss ooff 22000011 ((AA)) aanndd 22000022 ((BB)) aatt 3300,, 6600 aanndd 9900 ddaayyss
aafftteerr ssoowwiinngg..
A
B
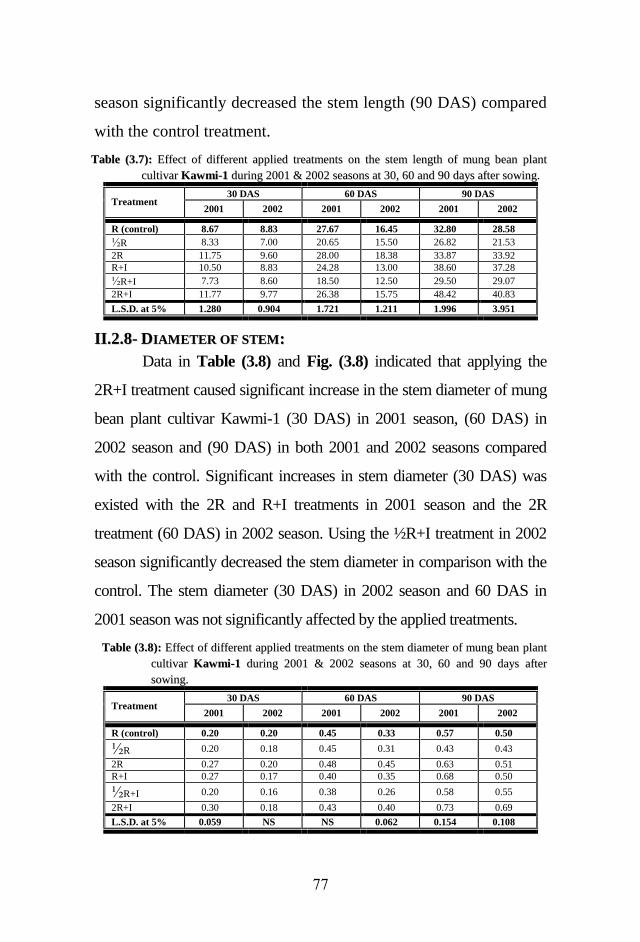
77
season significantly decreased the stem length (90 DAS) compared
with the control treatment.
TTaabbllee ((33..77)):: EEffffeecctt ooff ddiiffffeerreenntt aapppplliieedd ttrreeaattmmeennttss oonn tthhee sstteemm lleennggtthh ooff mmuunngg bbeeaann ppllaanntt
ccuullttiivvaarr KKaawwmmii--11 dduurriinngg 22000011 && 22000022 sseeaassoonnss aatt 3300,, 6600 aanndd 9900 ddaayyss aafftteerr ssoowwiinngg..
Treatment 30 DAS 60 DAS 90 DAS
2001 2002 2001 2002 2001 2002
R (control) 8.67 8.83 27.67 16.45 32.80 28.58
½R 8.33 7.00 20.65 15.50 26.82 21.53
2R 11.75 9.60 28.00 18.38 33.87 33.92
R+I 10.50 8.83 24.28 13.00 38.60 37.28
½R+I 7.73 8.60 18.50 12.50 29.50 29.07
2R+I 11.77 9.77 26.38 15.75 48.42 40.83
L.S.D. at 5% 1.280 0.904 1.721 1.211 1.996 3.951
IIII..22..88-- DDIIAAMMEETTEERR OOFF SSTTEEMM::
Data in Table (3.8) and Fig. (3.8) indicated that applying the
2R+I treatment caused significant increase in the stem diameter of mung
bean plant cultivar Kawmi-1 (30 DAS) in 2001 season, (60 DAS) in
2002 season and (90 DAS) in both 2001 and 2002 seasons compared
with the control. Significant increases in stem diameter (30 DAS) was
existed with the 2R and R+I treatments in 2001 season and the 2R
treatment (60 DAS) in 2002 season. Using the ½R+I treatment in 2002
season significantly decreased the stem diameter in comparison with the
control. The stem diameter (30 DAS) in 2002 season and 60 DAS in
2001 season was not significantly affected by the applied treatments.
TTaabbllee ((33..88)):: EEffffeecctt ooff ddiiffffeerreenntt aapppplliieedd ttrreeaattmmeennttss oonn tthhee sstteemm ddiiaammeetteerr ooff mmuunngg bbeeaann ppllaanntt
ccuullttiivvaarr KKaawwmmii--11 dduurriinngg 22000011 && 22000022 sseeaassoonnss aatt 3300,, 6600 aanndd 9900 ddaayyss aafftteerr
ssoowwiinngg..
Treatment 30 DAS 60 DAS 90 DAS
2001 2002 2001 2002 2001 2002
R (control) 0.20 0.20 0.45 0.33 0.57 0.50
½R 0.20 0.18 0.45 0.31 0.43 0.43
2R 0.27 0.20 0.48 0.45 0.63 0.51
R+I 0.27 0.17 0.40 0.35 0.68 0.50
½R+I 0.20 0.16 0.38 0.26 0.58 0.55
2R+I 0.30 0.18 0.43 0.40 0.73 0.69
L.S.D. at 5% 0.059 NS NS 0.062 0.154 0.108
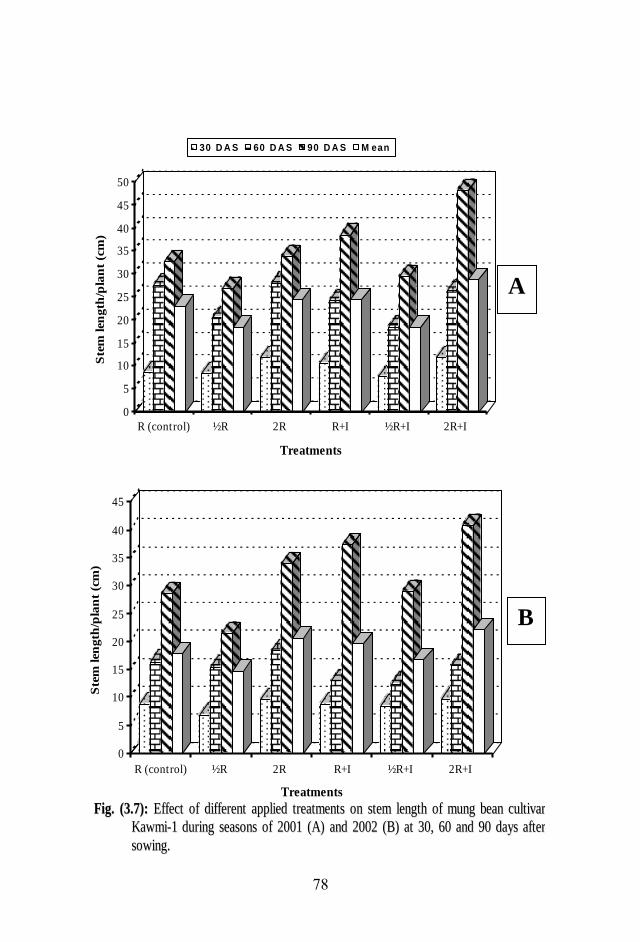
78
0
5
10
15
20
25
30
35
40
45
50
Ste
m len
gth
/pla
nt
(cm
)
R (control) ½R 2R R+I ½R+I 2R+I
Treatments
30 D A S 60 D A S 90 D A S M ean
0
5
10
15
20
25
30
35
40
45
Ste
m len
gth
/pla
nt
(cm
)
R (control) ½R 2R R+I ½R+I 2R+I
Treatments
FFiigg.. ((33..77)):: EEffffeecctt ooff ddiiffffeerreenntt aapppplliieedd ttrreeaattmmeennttss oonn sstteemm lleennggtthh ooff mmuunngg bbeeaann ccuullttiivvaarr
KKaawwmmii--11 dduurriinngg sseeaassoonnss ooff 22000011 ((AA)) aanndd 22000022 ((BB)) aatt 3300,, 6600 aanndd 9900 ddaayyss aafftteerr
ssoowwiinngg..
A
B

79
0
0.1
0.2
0.3
0.4
0.5
0.6
0.7
0.8
Ste
m d
iam
ete
r/p
lan
t (c
m)
R (control) ½R 2R R+I ½R+I 2R+I
Treatments
30 D A S 60 D A S 90 D A S M ean
0
0.1
0.2
0.3
0.4
0.5
0.6
0.7
Ste
m d
iam
ete
r/p
lan
t (c
m)
R (control) ½R 2R R+I ½R+I 2R+I
Treatments
FFiigg.. ((33..88)):: EEffffeecctt ooff ddiiffffeerreenntt aapppplliieedd ttrreeaattmmeennttss oonn tthhee sstteemm ddiiaammeetteerr ooff mmuunngg bbeeaann
ccuullttiivvaarr KKaawwmmii--11 dduurriinngg sseeaassoonnss ooff 22000011 ((AA)) aanndd 22000022 ((BB)) aatt 3300,, 6600 aanndd 9900 ddaayyss
aafftteerr ssoowwiinngg..
A
B
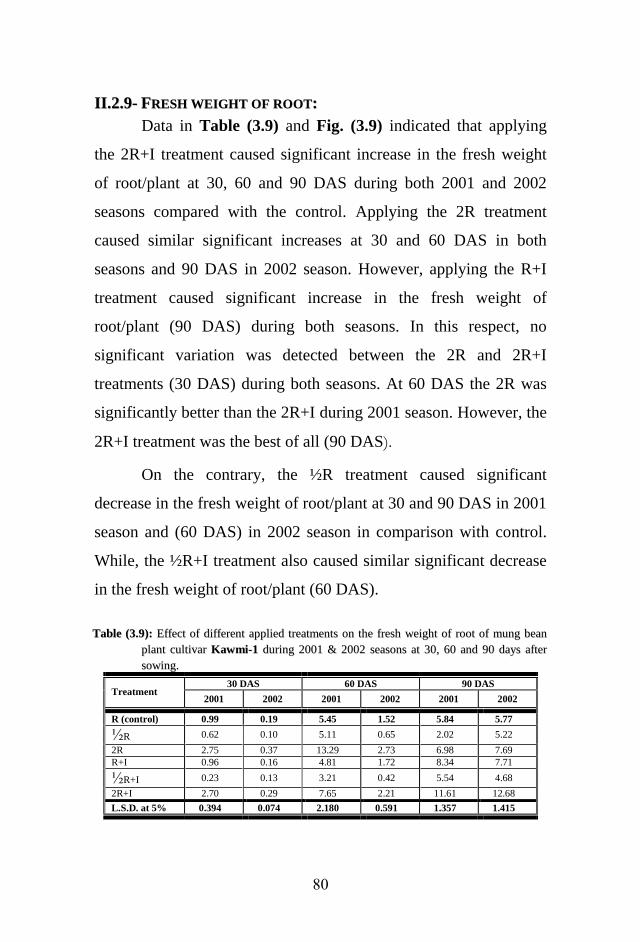
81
IIII..22..99-- FFRREESSHH WWEEIIGGHHTT OOFF RROOOOTT::
Data in Table (3.9) and Fig. (3.9) indicated that applying
the 2R+I treatment caused significant increase in the fresh weight
of root/plant at 30, 60 and 90 DAS during both 2001 and 2002
seasons compared with the control. Applying the 2R treatment
caused similar significant increases at 30 and 60 DAS in both
seasons and 90 DAS in 2002 season. However, applying the R+I
treatment caused significant increase in the fresh weight of
root/plant (90 DAS) during both seasons. In this respect, no
significant variation was detected between the 2R and 2R+I
treatments (30 DAS) during both seasons. At 60 DAS the 2R was
significantly better than the 2R+I during 2001 season. However, the
2R+I treatment was the best of all (90 DAS).
On the contrary, the ½R treatment caused significant
decrease in the fresh weight of root/plant at 30 and 90 DAS in 2001
season and (60 DAS) in 2002 season in comparison with control.
While, the ½R+I treatment also caused similar significant decrease
in the fresh weight of root/plant (60 DAS).
TTaabbllee ((33..99)):: EEffffeecctt ooff ddiiffffeerreenntt aapppplliieedd ttrreeaattmmeennttss oonn tthhee ffrreesshh wweeiigghhtt ooff rroooott ooff mmuunngg bbeeaann
ppllaanntt ccuullttiivvaarr KKaawwmmii--11 dduurriinngg 22000011 && 22000022 sseeaassoonnss aatt 3300,, 6600 aanndd 9900 ddaayyss aafftteerr
ssoowwiinngg..
Treatment 30 DAS 60 DAS 90 DAS
2001 2002 2001 2002 2001 2002
R (control) 0.99 0.19 5.45 1.52 5.84 5.77
½R 0.62 0.10 5.11 0.65 2.02 5.22
2R 2.75 0.37 13.29 2.73 6.98 7.69
R+I 0.96 0.16 4.81 1.72 8.34 7.71
½R+I 0.23 0.13 3.21 0.42 5.54 4.68
2R+I 2.70 0.29 7.65 2.21 11.61 12.68
L.S.D. at 5% 0.394 0.074 2.180 0.591 1.357 1.415

81
0
2
4
6
8
10
12
14
Fresh
weig
ht
of
ro
ot/
pla
nt
(g)
R (control) ½R 2R R+I ½R+I 2R+I
Treatments
30 D A S 60 D A S 90 D A S M ean
0
2
4
6
8
10
12
14
Fresh
weig
ht
of
ro
ot/
pla
nt
(g)
R (control) ½R 2R R+I ½R+I 2R+I
Treatments
FFiigg.. ((33..99)):: EEffffeecctt ooff ddiiffffeerreenntt aapppplliieedd ttrreeaattmmeennttss oonn tthhee ffrreesshh wweeiigghhtt ooff rroooott ooff mmuunngg bbeeaann
ccuullttiivvaarr KKaawwmmii--11 dduurriinngg sseeaassoonnss ooff 22000011 ((AA)) aanndd 22000022 ((BB)) aatt 3300,, 6600 aanndd 9900 ddaayyss
aafftteerr ssoowwiinngg..
A
B
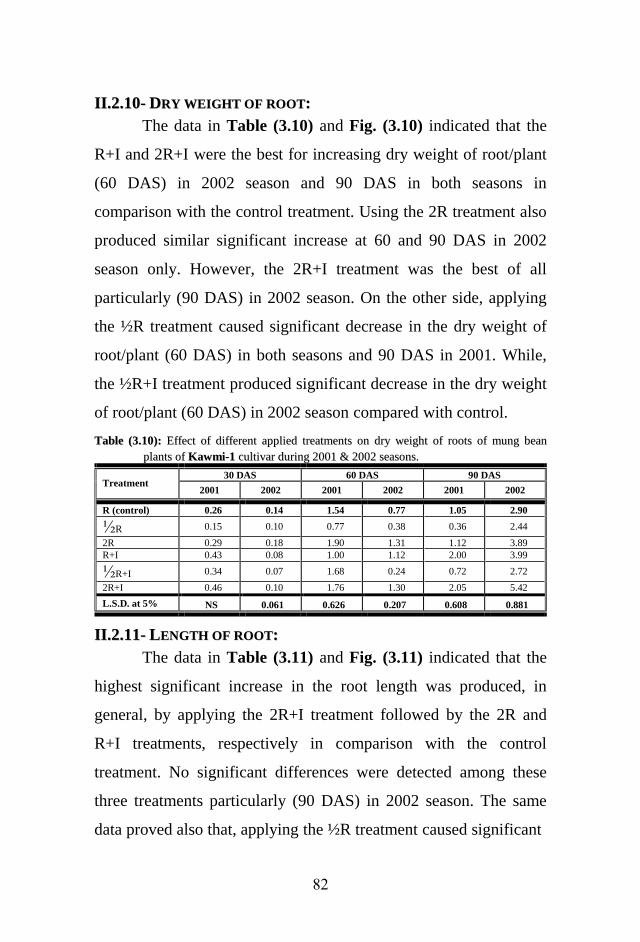
82
IIII..22..1100-- DDRRYY WWEEIIGGHHTT OOFF RROOOOTT::
The data in Table (3.10) and Fig. (3.10) indicated that the
R+I and 2R+I were the best for increasing dry weight of root/plant
(60 DAS) in 2002 season and 90 DAS in both seasons in
comparison with the control treatment. Using the 2R treatment also
produced similar significant increase at 60 and 90 DAS in 2002
season only. However, the 2R+I treatment was the best of all
particularly (90 DAS) in 2002 season. On the other side, applying
the ½R treatment caused significant decrease in the dry weight of
root/plant (60 DAS) in both seasons and 90 DAS in 2001. While,
the ½R+I treatment produced significant decrease in the dry weight
of root/plant (60 DAS) in 2002 season compared with control.
TTaabbllee ((33..1100)):: EEffffeecctt ooff ddiiffffeerreenntt aapppplliieedd ttrreeaattmmeennttss oonn ddrryy wweeiigghhtt ooff rroooottss ooff mmuunngg bbeeaann
ppllaannttss ooff KKaawwmmii--11 ccuullttiivvaarr dduurriinngg 22000011 && 22000022 sseeaassoonnss..
Treatment 30 DAS 60 DAS 90 DAS
2001 2002 2001 2002 2001 2002
R (control) 0.26 0.14 1.54 0.77 1.05 2.90 ½R 0.15 0.10 0.77 0.38 0.36 2.44 2R 0.29 0.18 1.90 1.31 1.12 3.89 R+I 0.43 0.08 1.00 1.12 2.00 3.99 ½R+I 0.34 0.07 1.68 0.24 0.72 2.72 2R+I 0.46 0.10 1.76 1.30 2.05 5.42 L.S.D. at 5% NS 0.061 0.626 0.207 0.608 0.881
IIII..22..1111-- LLEENNGGTTHH OOFF RROOOOTT::
The data in Table (3.11) and Fig. (3.11) indicated that the
highest significant increase in the root length was produced, in
general, by applying the 2R+I treatment followed by the 2R and
R+I treatments, respectively in comparison with the control
treatment. No significant differences were detected among these
three treatments particularly (90 DAS) in 2002 season. The same
data proved also that, applying the ½R treatment caused significant

83
0
0.5
1
1.5
2
2.5
Dry
weig
ht
of
ro
ot/
pla
nt
(g)
R (control) ½R 2R R+I ½R+I 2R+I
Treatments
30 DAS 60 DAS 90 DAS Mean
0
1
2
3
4
5
6
Dry
weig
ht
of
ro
ot/
pla
nt
(g)
R (control) ½R 2R R+I ½R+I 2R+I
Treatments
FFiigg.. ((33..1100)):: EEffffeecctt ooff ddiiffffeerreenntt aapppplliieedd ttrreeaattmmeennttss oonn tthhee ddrryy wweeiigghhtt ooff rroooott ooff mmuunngg bbeeaann
ccuullttiivvaarr KKaawwmmii--11 dduurriinngg sseeaassoonnss ooff 22000011 ((AA)) aanndd 22000022 ((BB)) aatt 3300,, 6600 aanndd 9900 ddaayyss
aafftteerr ssoowwiinngg..
A
B
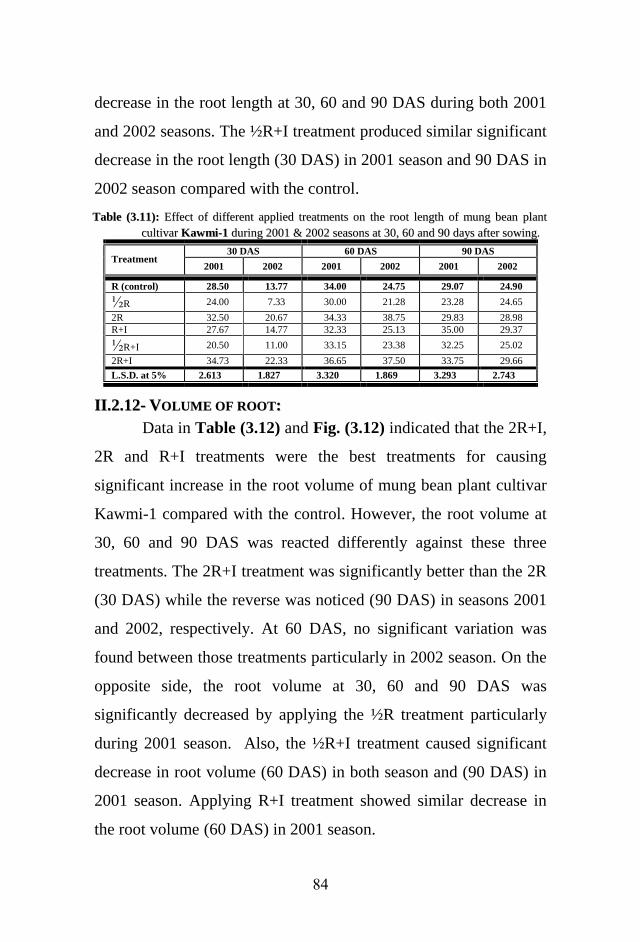
84
decrease in the root length at 30, 60 and 90 DAS during both 2001
and 2002 seasons. The ½R+I treatment produced similar significant
decrease in the root length (30 DAS) in 2001 season and 90 DAS in
2002 season compared with the control.
TTaabbllee ((33..1111)):: EEffffeecctt ooff ddiiffffeerreenntt aapppplliieedd ttrreeaattmmeennttss oonn tthhee rroooott lleennggtthh ooff mmuunngg bbeeaann ppllaanntt
ccuullttiivvaarr KKaawwmmii--11 dduurriinngg 22000011 && 22000022 sseeaassoonnss aatt 3300,, 6600 aanndd 9900 ddaayyss aafftteerr ssoowwiinngg..
Treatment 30 DAS 60 DAS 90 DAS
2001 2002 2001 2002 2001 2002
R (control) 28.50 13.77 34.00 24.75 29.07 24.90
½R 24.00 7.33 30.00 21.28 23.28 24.65
2R 32.50 20.67 34.33 38.75 29.83 28.98
R+I 27.67 14.77 32.33 25.13 35.00 29.37
½R+I 20.50 11.00 33.15 23.38 32.25 25.02
2R+I 34.73 22.33 36.65 37.50 33.75 29.66
L.S.D. at 5% 2.613 1.827 3.320 1.869 3.293 2.743
IIII..22..1122-- VVOOLLUUMMEE OOFF RROOOOTT::
Data in Table (3.12) and Fig. (3.12) indicated that the 2R+I,
2R and R+I treatments were the best treatments for causing
significant increase in the root volume of mung bean plant cultivar
Kawmi-1 compared with the control. However, the root volume at
30, 60 and 90 DAS was reacted differently against these three
treatments. The 2R+I treatment was significantly better than the 2R
(30 DAS) while the reverse was noticed (90 DAS) in seasons 2001
and 2002, respectively. At 60 DAS, no significant variation was
found between those treatments particularly in 2002 season. On the
opposite side, the root volume at 30, 60 and 90 DAS was
significantly decreased by applying the ½R treatment particularly
during 2001 season. Also, the ½R+I treatment caused significant
decrease in root volume (60 DAS) in both season and (90 DAS) in
2001 season. Applying R+I treatment showed similar decrease in
the root volume (60 DAS) in 2001 season.

85
0
5
10
15
20
25
30
35
40
Ro
ot
len
gh
t/p
lan
t (c
m)
R (control) ½R 2R R+I ½R+I 2R+I
Treatments
30 D A S 60 D A S 90 D A S M ean
0
5
10
15
20
25
30
35
40
Ro
ot
len
gh
t/p
lan
t (c
m)
R (control) ½R 2R R+I ½R+I 2R+I
Treatments
FFiigg.. ((33..1111)):: EEffffeecctt ooff ddiiffffeerreenntt aapppplliieedd ttrreeaattmmeennttss oonn tthhee rroooott lleennggtthh ooff mmuunngg bbeeaann
ccuullttiivvaarr KKaawwmmii--11 dduurriinngg sseeaassoonnss ooff 22000011 ((AA)) aanndd 22000022 ((BB)) aatt 3300,, 6600 aanndd 9900 ddaayyss
aafftteerr ssoowwiinngg..
A
B
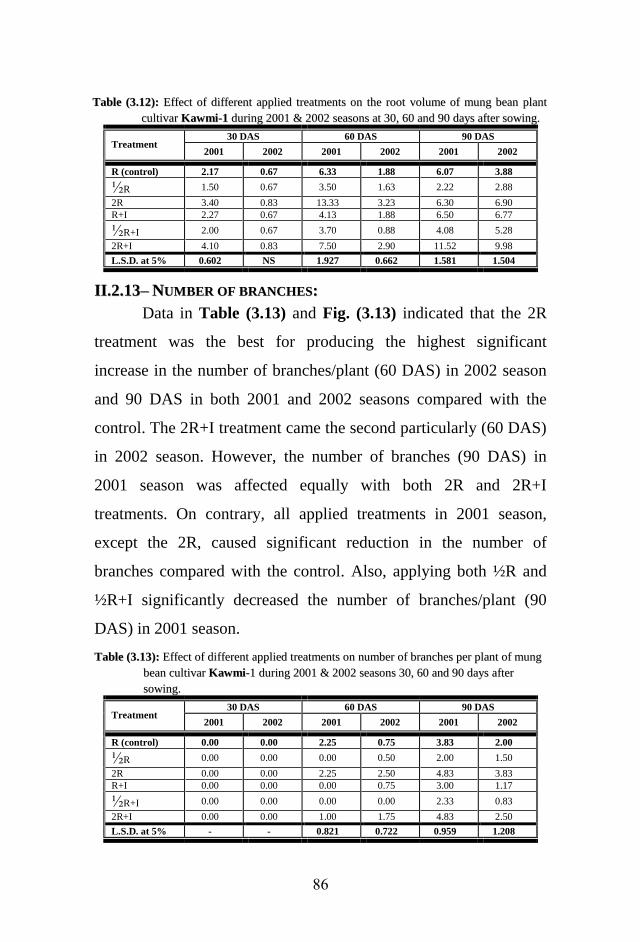
86
TTaabbllee ((33..1122)):: EEffffeecctt ooff ddiiffffeerreenntt aapppplliieedd ttrreeaattmmeennttss oonn tthhee rroooott vvoolluummee ooff mmuunngg bbeeaann ppllaanntt
ccuullttiivvaarr KKaawwmmii--11 dduurriinngg 22000011 && 22000022 sseeaassoonnss aatt 3300,, 6600 aanndd 9900 ddaayyss aafftteerr ssoowwiinngg..
Treatment 30 DAS 60 DAS 90 DAS
2001 2002 2001 2002 2001 2002
R (control) 2.17 0.67 6.33 1.88 6.07 3.88
½R 1.50 0.67 3.50 1.63 2.22 2.88
2R 3.40 0.83 13.33 3.23 6.30 6.90
R+I 2.27 0.67 4.13 1.88 6.50 6.77
½R+I 2.00 0.67 3.70 0.88 4.08 5.28
2R+I 4.10 0.83 7.50 2.90 11.52 9.98
L.S.D. at 5% 0.602 NS 1.927 0.662 1.581 1.504
IIII..22..1133–– NNUUMMBBEERR OOFF BBRRAANNCCHHEESS::
Data in Table (3.13) and Fig. (3.13) indicated that the 2R
treatment was the best for producing the highest significant
increase in the number of branches/plant (60 DAS) in 2002 season
and 90 DAS in both 2001 and 2002 seasons compared with the
control. The 2R+I treatment came the second particularly (60 DAS)
in 2002 season. However, the number of branches (90 DAS) in
2001 season was affected equally with both 2R and 2R+I
treatments. On contrary, all applied treatments in 2001 season,
except the 2R, caused significant reduction in the number of
branches compared with the control. Also, applying both ½R and
½R+I significantly decreased the number of branches/plant (90
DAS) in 2001 season.
TTaabbllee ((33..1133)):: EEffffeecctt ooff ddiiffffeerreenntt aapppplliieedd ttrreeaattmmeennttss oonn nnuummbbeerr ooff bbrraanncchheess ppeerr ppllaanntt ooff mmuunngg
bbeeaann ccuullttiivvaarr KKaawwmmii--11 dduurriinngg 22000011 && 22000022 sseeaassoonnss 3300,, 6600 aanndd 9900 ddaayyss aafftteerr
ssoowwiinngg..
Treatment 30 DAS 60 DAS 90 DAS
2001 2002 2001 2002 2001 2002
R (control) 0.00 0.00 2.25 0.75 3.83 2.00
½R 0.00 0.00 0.00 0.50 2.00 1.50
2R 0.00 0.00 2.25 2.50 4.83 3.83
R+I 0.00 0.00 0.00 0.75 3.00 1.17
½R+I 0.00 0.00 0.00 0.00 2.33 0.83
2R+I 0.00 0.00 1.00 1.75 4.83 2.50
L.S.D. at 5% - - 0.821 0.722 0.959 1.208
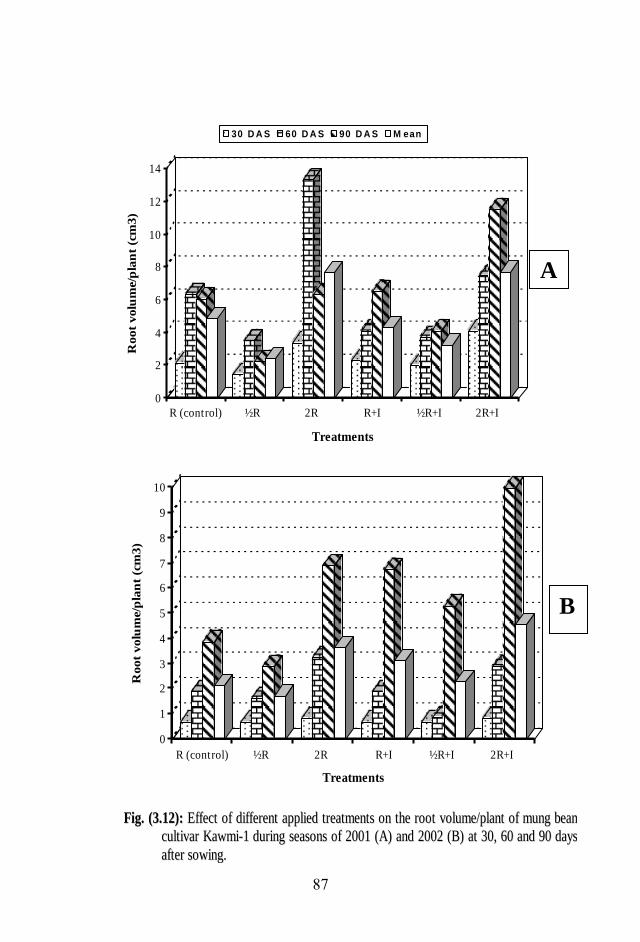
87
0
2
4
6
8
10
12
14
Ro
ot
volu
me/p
lan
t (c
m3)
R (control) ½R 2R R+I ½R+I 2R+I
Treatments
30 D A S 60 D A S 90 D A S M ean
0
1
2
3
4
5
6
7
8
9
10
Ro
ot
volu
me/p
lan
t (c
m3)
R (control) ½R 2R R+I ½R+I 2R+I
Treatments
FFiigg.. ((33..1122)):: EEffffeecctt ooff ddiiffffeerreenntt aapppplliieedd ttrreeaattmmeennttss oonn tthhee rroooott vvoolluummee//ppllaanntt ooff mmuunngg bbeeaann
ccuullttiivvaarr KKaawwmmii--11 dduurriinngg sseeaassoonnss ooff 22000011 ((AA)) aanndd 22000022 ((BB)) aatt 3300,, 6600 aanndd 9900 ddaayyss
aafftteerr ssoowwiinngg..
A
B

88
0
0.5
1
1.5
2
2.5
3
3.5
4
4.5
5
No
. of
bra
nch
es/p
lan
t
R (control) ½R 2R R+I ½R+I 2R+I
Treatments
30 D A S 60 D A S 90 D A S M ean
0
0.5
1
1.5
2
2.5
3
3.5
4
No
. of
bra
nch
es/p
lan
t
R (control) ½R 2R R+I ½R+I 2R+I
Treatments
FFiigg.. ((33..1133)):: EEffffeecctt ooff ddiiffffeerreenntt aapppplliieedd ttrreeaattmmeennttss oonn tthhee nnuummbbeerr ooff bbrraanncchheess//ppllaanntt ooff
mmuunngg bbeeaann ccuullttiivvaarr KKaawwmmii--11 dduurriinngg sseeaassoonnss ooff 22000011 ((AA)) aanndd 22000022 ((BB)) aatt 3300,, 6600
aanndd 9900 ddaayyss aafftteerr ssoowwiinngg..
A
B

89
IIII..22..1144-- NNUUMMBBEERR OOFF IINNFFLLOORREESSCCEENNCCEESS::
Data in Table (3.14) and Fig. (3.14) indicated that the
number of inflorescences per plant (90 DAS) was significantly
increased by the 2R and 2R+I treatments in the two seasons, i.e.
2001 and 2002 seasons and R+I treatment in 2001 season. The
number of inflorescences (60 DAS) in 2001 season was not
significantly affected by most of treatments except the ½R
treatment that caused significantly reduction in comparison with
the control. The number of inflorescences could not measured (30
DAS) in both seasons and (60 DAS) in 2002 season.
TTaabbllee ((33..1144)):: EEffffeecctt ooff ddiiffffeerreenntt aapppplliieedd ttrreeaattmmeennttss oonn nnuummbbeerr ooff iinnfflloorreesscceenncceess ppeerr ppllaanntt ooff
mmuunngg bbeeaann ccuullttiivvaarr KKaawwmmii--11 dduurriinngg 22000011 && 22000022 sseeaassoonnss 3300,, 6600 aanndd 9900 ddaayyss aafftteerr
ssoowwiinngg..
Treatment 30 DAS 60 DAS 90 DAS
2001 2002 2001 2002 2001 2002
R (control) 0.00 0.00 2.50 0.00 8.67 7.17
½R 0.00 0.00 0.00 0.00 5.83 5.83
2R 0.00 0.00 2.50 0.00 15.33 10.17
R+I 0.00 0.00 3.25 0.00 14.17 9.17
½R+I 0.00 0.00 2.00 0.00 8.00 6.00
2R+I 0.00 0.00 3.25 0.00 14.67 12.50
L.S.D. at 5% - - 0.959 - 3.626 2.074
III- EEFFFFEECCTT OOFF NNPPKK LLEEVVEELLSS OONN TTHHEE YYIIEELLDD AANNDD YYIIEELLDD
CCOOMMPPOONNEENNTTSS OOFF TTHHEE TTWWOO AASSSSIIGGNNEEDD MMUUNNGG BBEEAANN
CCUULLTTIIVVAARRSS::
IIIIII..11 CCUULLTTIIVVAARR GGIIZZAA--11::
IIIIII..11..11-- LLEENNGGTTHH AANNDD DDIIAAMMEETTEERR OOFF PPOODDSS::
Data in Table (4.1) and indicated that both 2R and 2R+I
treatments caused significant increase in the pod length in 2001
season only while the ½R treatment decreased it significantly
compared with the control treatment. However, the pod length was
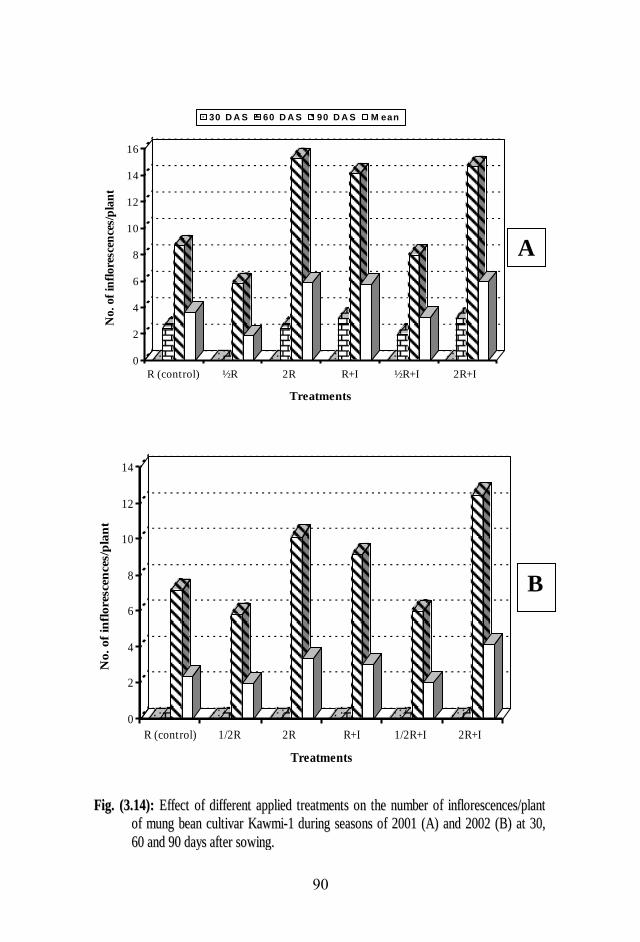
91
0
2
4
6
8
10
12
14
16
No. of
infl
ore
scen
ces/
pla
nt
R (control) ½R 2R R+I ½R+I 2R+I
Treatments
30 D A S 60 D A S 90 D A S M ean
0
2
4
6
8
10
12
14
No
. of
infl
orescen
ces/p
lan
t
R (control) 1/2R 2R R+I 1/2R+I 2R+I
Treatments
FFiigg.. ((33..1144)):: EEffffeecctt ooff ddiiffffeerreenntt aapppplliieedd ttrreeaattmmeennttss oonn tthhee nnuummbbeerr ooff iinnfflloorreesscceenncceess//ppllaanntt
ooff mmuunngg bbeeaann ccuullttiivvaarr KKaawwmmii--11 dduurriinngg sseeaassoonnss ooff 22000011 ((AA)) aanndd 22000022 ((BB)) aatt 3300,,
6600 aanndd 9900 ddaayyss aafftteerr ssoowwiinngg..
A
B
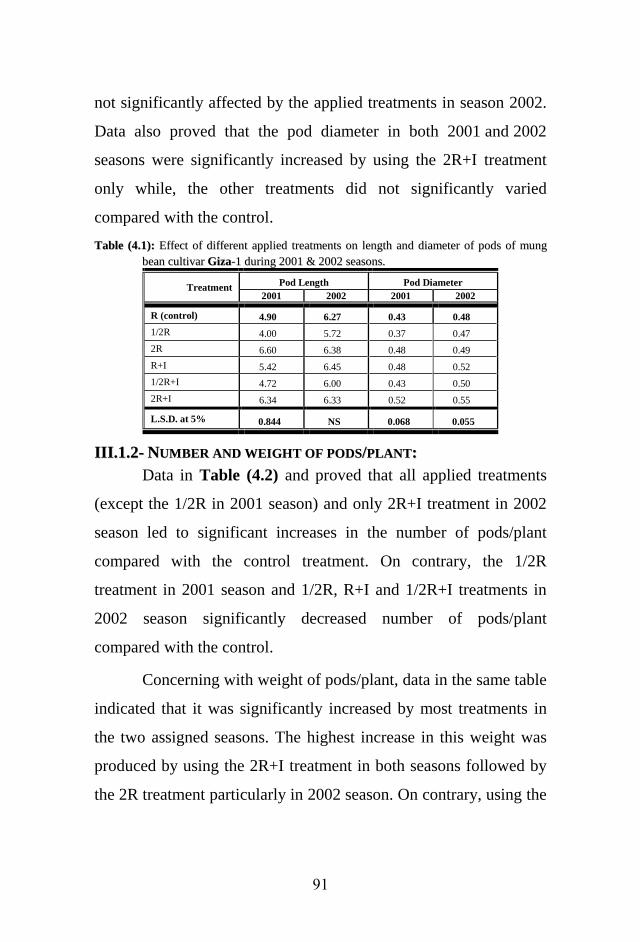
91
not significantly affected by the applied treatments in season 2002.
Data also proved that the pod diameter in both 2001 and 2002
seasons were significantly increased by using the 2R+I treatment
only while, the other treatments did not significantly varied
compared with the control.
TTaabbllee ((44..11)):: EEffffeecctt ooff ddiiffffeerreenntt aapppplliieedd ttrreeaattmmeennttss oonn lleennggtthh aanndd ddiiaammeetteerr ooff ppooddss ooff mmuunngg
bbeeaann ccuullttiivvaarr GGiizzaa--11 dduurriinngg 22000011 && 22000022 sseeaassoonnss..
Treatment Pod Length Pod Diameter
2001 2002 2001 2002
R (control) 4.90 6.27 0.43 0.48
1/2R 4.00 5.72 0.37 0.47
2R 6.60 6.38 0.48 0.49
R+I 5.42 6.45 0.48 0.52
1/2R+I 4.72 6.00 0.43 0.50
2R+I 6.34 6.33 0.52 0.55
L.S.D. at 5% 0.844 NS 0.068 0.055
IIIIII..11..22-- NNUUMMBBEERR AANNDD WWEEIIGGHHTT OOFF PPOODDSS//PPLLAANNTT::
Data in Table (4.2) and proved that all applied treatments
(except the 1/2R in 2001 season) and only 2R+I treatment in 2002
season led to significant increases in the number of pods/plant
compared with the control treatment. On contrary, the 1/2R
treatment in 2001 season and 1/2R, R+I and 1/2R+I treatments in
2002 season significantly decreased number of pods/plant
compared with the control.
Concerning with weight of pods/plant, data in the same table
indicated that it was significantly increased by most treatments in
the two assigned seasons. The highest increase in this weight was
produced by using the 2R+I treatment in both seasons followed by
the 2R treatment particularly in 2002 season. On contrary, using the

92
1/2R treatment particularly in 2001 season significantly decreased
weight of pods/plant.
TTaabbllee ((44..22)):: EEffffeecctt ooff ddiiffffeerreenntt aapppplliieedd ttrreeaattmmeennttss oonn nnuummbbeerr aanndd wweeiigghhtt ooff ppooddss//ppllaanntt ooff
mmuunngg bbeeaann ccuullttiivvaarr GGiizzaa--11 dduurriinngg 22000011 && 22000022 sseeaassoonnss..
Treatment Pod No. Pod We.
2001 2002 2001 2002
R (control) 6.50 10.67 3.19 5.68
1/2R 4.33 8.33 2.09 4.60
2R 8.50 11.5 4.35 8.46
R+I 11.33 9.00 4.50 7.40
1/2R+I 8.50 8.000 3.27 7.19
2R+I 15.83 12.33 5.81 9.80
L.S.D. at 5% 0.861 1.087 0.776 0.483
IIIIII..11..33-- NNUUMMBBEERR AANNDD WWEEIIGGHHTT OOFF SSEEEEDDSS//PPOODD::
Data in Table (4.3) and proved that the 2R followed by
2R+I then R+I treatments produced the highest significant increase
in the number of seeds/pod particularly in 2001 season. However,
the number of seeds/plant was not significantly affected with
application of most treatments except that of 1/2R+I, which
significantly decreased it in 2002 season in compared with the
control.
TTaabbllee ((44..33)):: EEffffeecctt ooff ddiiffffeerreenntt aapppplliieedd ttrreeaattmmeennttss oonn nnuummbbeerr aanndd wweeiigghhtt ooff sseeeeddss//ppoodd ooff
mmuunngg bbeeaann ccuullttiivvaarr GGiizzaa--11 dduurriinngg 22000011 && 22000022 sseeaassoonnss..
Treatment Seed No. Seed We.
2001 2002 2001 2002
R (control) 4.00 11.17 2.89 4.73
1/2R 3.50 10.17 1.74 3.57
2R 6.50 11.17 3.04 5.78
R+I 5.28 10.33 4.25 4.96
1/2R+I 4.55 9.83 2.98 4.73
2R+I 5.58 11.17 4.63 7.53
L.S.D. at 5% 0.921 1.283 0.772 0.651
As for weight of seeds/pod, the data showed that the 2R+I in
2001 and 2002 seasons, R+I in 2001 season and 2R in 2002 season
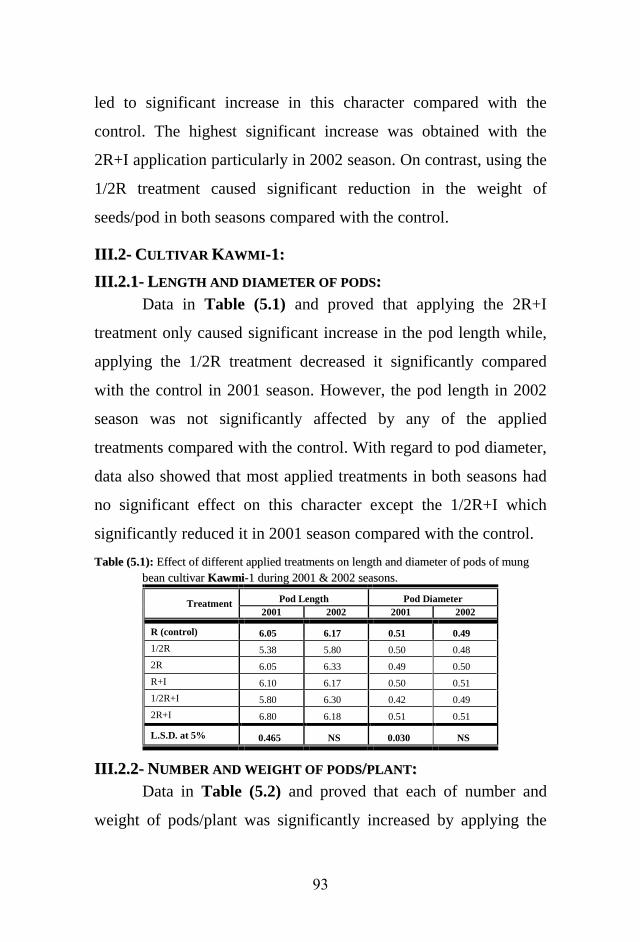
93
led to significant increase in this character compared with the
control. The highest significant increase was obtained with the
2R+I application particularly in 2002 season. On contrast, using the
1/2R treatment caused significant reduction in the weight of
seeds/pod in both seasons compared with the control.
IIIIII..22-- CCUULLTTIIVVAARR KKAAWWMMII--11::
IIIIII..22..11-- LLEENNGGTTHH AANNDD DDIIAAMMEETTEERR OOFF PPOODDSS::
Data in Table (5.1) and proved that applying the 2R+I
treatment only caused significant increase in the pod length while,
applying the 1/2R treatment decreased it significantly compared
with the control in 2001 season. However, the pod length in 2002
season was not significantly affected by any of the applied
treatments compared with the control. With regard to pod diameter,
data also showed that most applied treatments in both seasons had
no significant effect on this character except the 1/2R+I which
significantly reduced it in 2001 season compared with the control.
TTaabbllee ((55..11)):: EEffffeecctt ooff ddiiffffeerreenntt aapppplliieedd ttrreeaattmmeennttss oonn lleennggtthh aanndd ddiiaammeetteerr ooff ppooddss ooff mmuunngg
bbeeaann ccuullttiivvaarr KKaawwmmii--11 dduurriinngg 22000011 && 22000022 sseeaassoonnss..
Treatment Pod Length Pod Diameter
2001 2002 2001 2002
R (control) 6.05 6.17 0.51 0.49
1/2R 5.38 5.80 0.50 0.48
2R 6.05 6.33 0.49 0.50
R+I 6.10 6.17 0.50 0.51
1/2R+I 5.80 6.30 0.42 0.49
2R+I 6.80 6.18 0.51 0.51
L.S.D. at 5% 0.465 NS 0.030 NS
IIIIII..22..22-- NNUUMMBBEERR AANNDD WWEEIIGGHHTT OOFF PPOODDSS//PPLLAANNTT::
Data in Table (5.2) and proved that each of number and
weight of pods/plant was significantly increased by applying the
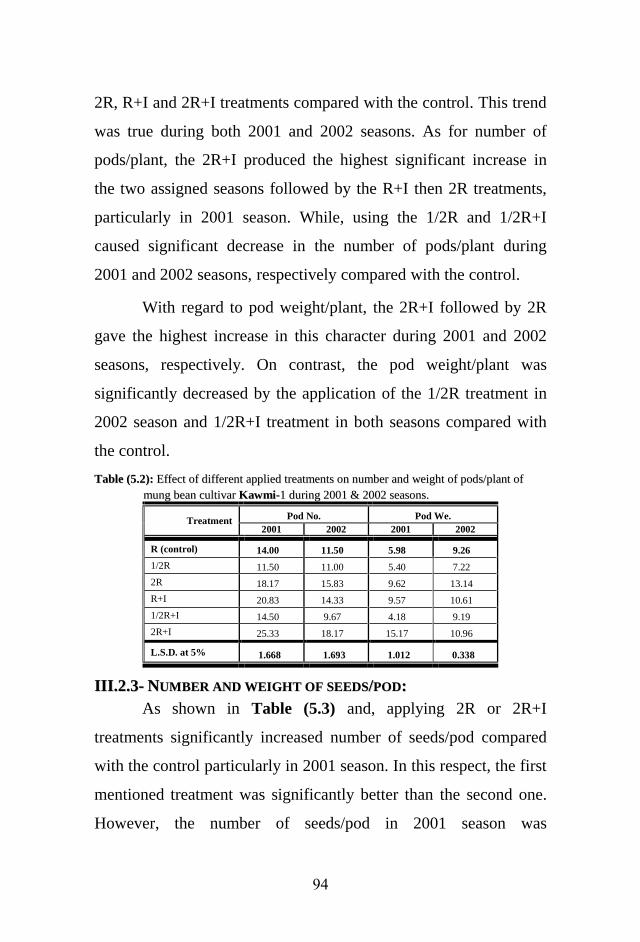
94
2R, R+I and 2R+I treatments compared with the control. This trend
was true during both 2001 and 2002 seasons. As for number of
pods/plant, the 2R+I produced the highest significant increase in
the two assigned seasons followed by the R+I then 2R treatments,
particularly in 2001 season. While, using the 1/2R and 1/2R+I
caused significant decrease in the number of pods/plant during
2001 and 2002 seasons, respectively compared with the control.
With regard to pod weight/plant, the 2R+I followed by 2R
gave the highest increase in this character during 2001 and 2002
seasons, respectively. On contrast, the pod weight/plant was
significantly decreased by the application of the 1/2R treatment in
2002 season and 1/2R+I treatment in both seasons compared with
the control.
TTaabbllee ((55..22)):: EEffffeecctt ooff ddiiffffeerreenntt aapppplliieedd ttrreeaattmmeennttss oonn nnuummbbeerr aanndd wweeiigghhtt ooff ppooddss//ppllaanntt ooff
mmuunngg bbeeaann ccuullttiivvaarr KKaawwmmii--11 dduurriinngg 22000011 && 22000022 sseeaassoonnss..
Treatment Pod No. Pod We.
2001 2002 2001 2002
R (control) 14.00 11.50 5.98 9.26
1/2R 11.50 11.00 5.40 7.22
2R 18.17 15.83 9.62 13.14
R+I 20.83 14.33 9.57 10.61
1/2R+I 14.50 9.67 4.18 9.19
2R+I 25.33 18.17 15.17 10.96
L.S.D. at 5% 1.668 1.693 1.012 0.338
IIIIII..22..33-- NNUUMMBBEERR AANNDD WWEEIIGGHHTT OOFF SSEEEEDDSS//PPOODD::
As shown in Table (5.3) and, applying 2R or 2R+I
treatments significantly increased number of seeds/pod compared
with the control particularly in 2001 season. In this respect, the first
mentioned treatment was significantly better than the second one.
However, the number of seeds/pod in 2001 season was

95
significantly lower with the 1/2R, R+I and 1/2R+I treatments than
the control.
The same data also showed that applying the 2R, R+I and
2R+I caused significant increases in weight of seeds/pod during
both seasons compared with the control. In this respect, the highest
significant increase was produced by the 2R+I treatment. On the
other side, using the 1/2R treatment in 2001 season and the 1/2R+I
treatment in 2002 season significantly decreased the weight of
seeds/plant compared with the control treatment.
TTaabbllee ((55..33)):: EEffffeecctt ooff ddiiffffeerreenntt aapppplliieedd ttrreeaattmmeennttss oonn nnuummbbeerr aanndd wweeiigghhtt ooff sseeeeddss//ppllaanntt ooff
mmuunngg bbeeaann ccuullttiivvaarr KKaawwmmii--11 dduurriinngg 22000011 && 22000022 sseeaassoonnss..
Treatment Seed No. Seed We.
2001 2002 2001 2002
R (control) 6.05 10.33 3.39 6.55
1/2R 5.37 10.67 2.50 6.40
2R 7.95 11.17 5.79 7.71
R+I 5.07 11.33 4.76 8.15
1/2R+I 4.33 11.50 2.84 5.42
2R+I 6.82 11.50 7.64 8.42
L.S.D. at 5% 0.591 NS 0.677 0.579
IIVV--EEFFFFEECCTTSS OOFF NNPPKK LLEEVVEELLSS OONN PPEERRCCEENNTTAAGGEE OOFF FFLLOOWWEERR
SSEETTTTIINNGG OOFF TTHHEE TTWWOO AASSSSIIGGNNEEDD MMUUNNGG BBEEAANN CCUULLTTIIVVAARRSS::
Regarding to the mung bean cultivar Giza-1, the data in Table (6)
clearly indicated that, percentage of flower setting was significantly
enhanced with most applied treatments in 2001 season but the
reverse was true in 2002 season compared with the control. In the
first season, applying the 2R+I treatment resulted in the highest
percentage of setting followed by the 2R then R+I treatments,
respectively. While, the 1/2R+I treatment showed the lowest
significant increase in this respect. However, the 1/2R treatment in
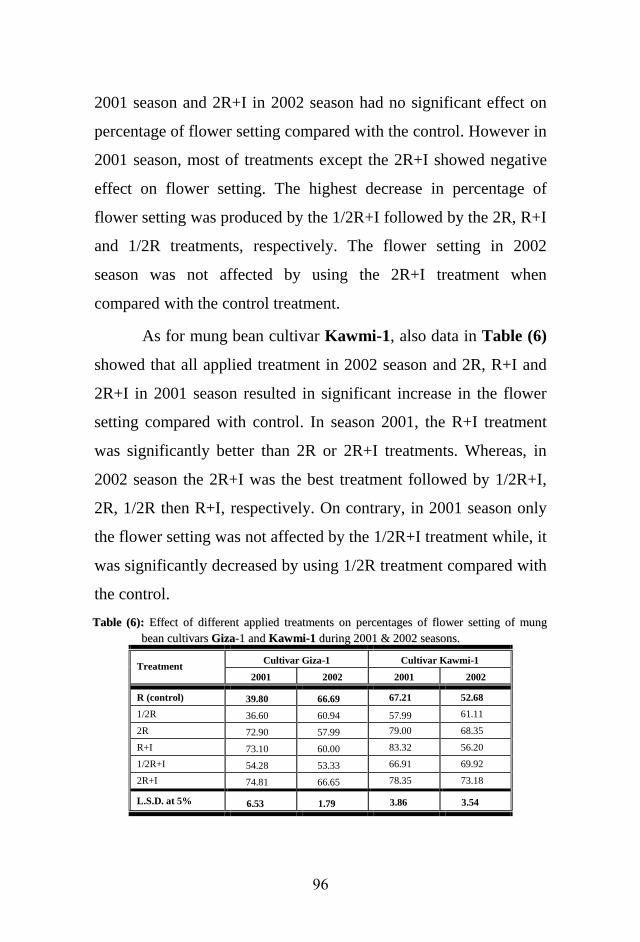
96
2001 season and 2R+I in 2002 season had no significant effect on
percentage of flower setting compared with the control. However in
2001 season, most of treatments except the 2R+I showed negative
effect on flower setting. The highest decrease in percentage of
flower setting was produced by the 1/2R+I followed by the 2R, R+I
and 1/2R treatments, respectively. The flower setting in 2002
season was not affected by using the 2R+I treatment when
compared with the control treatment.
As for mung bean cultivar Kawmi-1, also data in Table (6)
showed that all applied treatment in 2002 season and 2R, R+I and
2R+I in 2001 season resulted in significant increase in the flower
setting compared with control. In season 2001, the R+I treatment
was significantly better than 2R or 2R+I treatments. Whereas, in
2002 season the 2R+I was the best treatment followed by 1/2R+I,
2R, 1/2R then R+I, respectively. On contrary, in 2001 season only
the flower setting was not affected by the 1/2R+I treatment while, it
was significantly decreased by using 1/2R treatment compared with
the control.
TTaabbllee ((66)):: EEffffeecctt ooff ddiiffffeerreenntt aapppplliieedd ttrreeaattmmeennttss oonn ppeerrcceennttaaggeess ooff fflloowweerr sseettttiinngg ooff mmuunngg
bbeeaann ccuullttiivvaarrss GGiizzaa--11 aanndd KKaawwmmii--11 dduurriinngg 22000011 && 22000022 sseeaassoonnss..
Treatment Cultivar Giza-1 Cultivar Kawmi-1
2001 2002 2001 2002
R (control) 39.80 66.69 67.21 52.68
1/2R 36.60 60.94 57.99 61.11
2R 72.90 57.99 79.00 68.35
R+I 73.10 60.00 83.32 56.20
1/2R+I 54.28 53.33 66.91 69.92
2R+I 74.81 66.65 78.35 73.18
L.S.D. at 5% 6.53 1.79 3.86 3.54

97
VV-- EEFFFFEECCTTSS OOFF NNPPKK LLEEVVEELLSS OONN TTHHEE BBIIOOLLOOGGIICCAALL AANNDD
CCHHEEMMIICCAALL CCOONNSSTTIITTUUEENNTTSS OOFF TTHHEE TTWWOO AASSSSIIGGNNEEDD MMUUNNGG
BBEEAANN CCUULLTTIIVVAARRSS::
VV..11-- PPHHOOTTOOSSYYNNTTHHEETTIICC PPIIGGMMEENNTTSS::
VV..11..11-- CCUULLTTIIVVAARR GGIIZZAA--11 ((3300 AANNDD 6600 DDAAYYSS AAFFTTEERR SSOOWWIINNGG))::
The results about chlorophyll and carotenoid content in
plant leaves of mung bean cultivar Giza-1 at 30 and 60 days after
sowing as affected by the applied treatments are shown in Tables
(7.1) and (7.2), respectively.
The results in (Table 7.1) proved that the R+I treatment in
2001 season and the 2R treatment in 2002 season caused
appreciable increase in leaf content of photosynthetic pigments i.e.
chlorophyll “a“, “b“ and carotenoids as well as their sum pigments
(30 DAS) compared with the control treatment.
TTaabbllee ((77..11)):: EEffffeecctt ooff ddiiffffeerreenntt aapppplliieedd ttrreeaattmmeennttss oonn tthhee lleeaaff ccoonntteenntt ooff pphhoottoossyynntthheettiicc
ppiiggmmeennttss ((mmgg//gg ffrreesshh wweeiigghhtt)) ooff mmuunngg bbeeaann ccuullttiivvaarr GGiizzaa--11,, oonnee mmoonntthh aafftteerr
ssoowwiinngg dduurriinngg 22000011 && 22000022 sseeaassoonnss..
Season Treatment
Chlorophyll Caroten.
Total
pigments (a) (b) (a+b)
2001
R (control) 0.518 0.376 0.894 0.887 1.781
1/2R 0.546 0.195 0.741 0.731 1.472
2R 0.501 0.254 0.755 0.852 1.607
R+I 0.577 0.357 0.934 0.941 1.875
1/2R+I 0.533 0.317 0.850 0.915 1.765
2R+I 0.462 0.318 0.780 0.887 1.667
2002
R (control) 0.764 0.529 1.293 0.456 1.749
1/2R 0.556 0.386 0.942 0.344 1.286
2R 1.205 0.914 2.119 0.629 2.748
R+I 0.696 0.433 1.129 1.138 2.267
1/2R+I 0.647 0.386 1.033 1.105 2.138
2R+I 0.562 0.384 0.946 1.072 2.018
However, in season 2002 the carotenoids and total pigments in
leaves of plants that received 2R, R+I, 1/2R+I or 2R+I were relatively
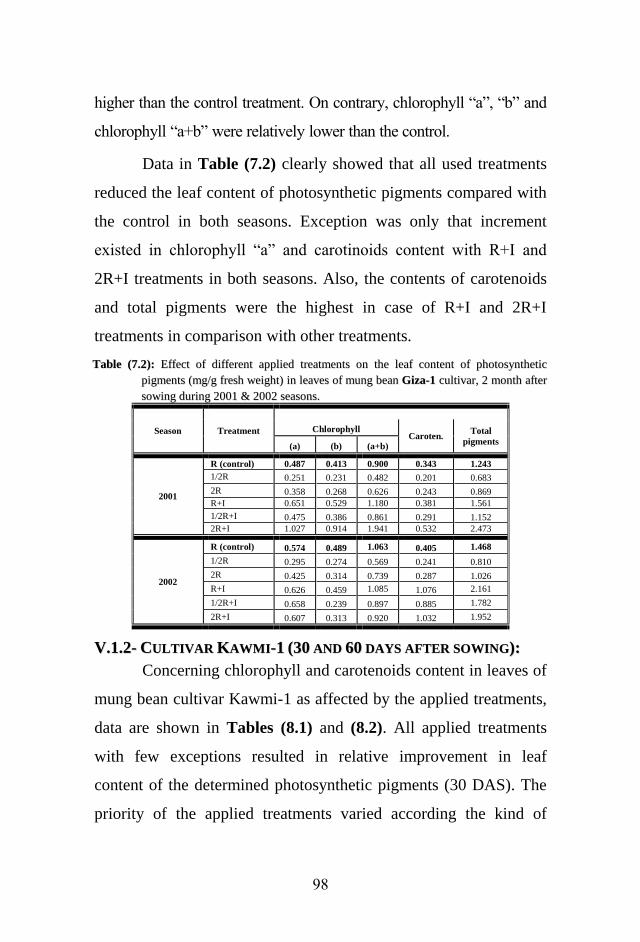
98
higher than the control treatment. On contrary, chlorophyll “a”, “b” and
chlorophyll “a+b” were relatively lower than the control.
Data in Table (7.2) clearly showed that all used treatments
reduced the leaf content of photosynthetic pigments compared with
the control in both seasons. Exception was only that increment
existed in chlorophyll “a” and carotinoids content with R+I and
2R+I treatments in both seasons. Also, the contents of carotenoids
and total pigments were the highest in case of R+I and 2R+I
treatments in comparison with other treatments.
TTaabbllee ((77..22)):: EEffffeecctt ooff ddiiffffeerreenntt aapppplliieedd ttrreeaattmmeennttss oonn tthhee lleeaaff ccoonntteenntt ooff pphhoottoossyynntthheettiicc
ppiiggmmeennttss ((mmgg//gg ffrreesshh wweeiigghhtt)) iinn lleeaavveess ooff mmuunngg bbeeaann GGiizzaa--11 ccuullttiivvaarr,, 22 mmoonntthh aafftteerr
ssoowwiinngg dduurriinngg 22000011 && 22000022 sseeaassoonnss..
Season Treatment
Chlorophyll Caroten.
Total
pigments (a) (b) (a+b)
2001
R (control) 0.487 0.413 0.900 0.343 1.243
1/2R 0.251 0.231 0.482 0.201 0.683
2R 0.358 0.268 0.626 0.243 0.869
R+I 0.651 0.529 1.180 0.381 1.561
1/2R+I 0.475 0.386 0.861 0.291 1.152
2R+I 1.027 0.914 1.941 0.532 2.473
2002
R (control) 0.574 0.489 1.063 0.405 1.468
1/2R 0.295 0.274 0.569 0.241 0.810
2R 0.425 0.314 0.739 0.287 1.026
R+I 0.626 0.459 1.085 1.076 2.161
1/2R+I 0.658 0.239 0.897 0.885 1.782
2R+I 0.607 0.313 0.920 1.032 1.952
VV..11..22-- CCUULLTTIIVVAARR KKAAWWMMII--11 ((3300 AANNDD 6600 DDAAYYSS AAFFTTEERR SSOOWWIINNGG))::
Concerning chlorophyll and carotenoids content in leaves of
mung bean cultivar Kawmi-1 as affected by the applied treatments,
data are shown in Tables (8.1) and (8.2). All applied treatments
with few exceptions resulted in relative improvement in leaf
content of the determined photosynthetic pigments (30 DAS). The
priority of the applied treatments varied according the kind of

99
pigment. The highest values of chlorophyll a and a+b was existed
with the 2R treatment while, the 2R+I treatment produced the
highest values of chlorophyll a, carotenoids and total pigments in
both 2001 and 2002 seasons. On contrary, using the 1/2R+I
treatment only caused relative decrease in the leaf content of
chlorophyll fractions (a, b and a+b) in 2001 season and a and a+b
in 2002 season compared with the control (Table 8.1).
TTaabbllee ((88..11)):: EEffffeecctt ooff ddiiffffeerreenntt aapppplliieedd ttrreeaattmmeennttss oonn tthhee lleeaaff ccoonntteenntt ooff pphhoottoossyynntthheettiicc
ppiiggmmeennttss ((mmgg//gg ffrreesshh wweeiigghhtt)) iinn lleeaavveess ooff mmuunngg bbeeaann KKaawwmmii--11 ccuullttiivvaarr,, oonnee mmoonntthh
aafftteerr ssoowwiinngg dduurriinngg 22000011 && 22000022 sseeaassoonnss..
Season Treatment
Chlorophyll Caroten.
Total
pigments (a) (b) (a+b)
2001
R (control) 0.453 0.273 0.726 0.663 1.389
1/2R 0.541 0.414 0.955 0.763 1.718
2R 0.489 0.497 0.986 0.763 1.749
R+I 0.465 0.365 0.830 0.691 1.521
1/2R+I 0.410 0.291 0.701 0.752 1.453
2R+I 0.546 0.417 0.963 0.855 1.818
2002
R (control) 0.521 0.323 0.844 0.783 1.627
1/2R 0.635 0.489 1.124 0.898 2.022
2R 0.581 0.585 1.166 0.902 2.068
R+I 0.544 0.435 0.979 0.815 1.794
1/2R+I 0.487 0.346 0.833 0.893 1.726
2R+I 0.646 0.496 1.142 0.987 2.129
After 60 DAS, the tabulated data in Tables (8.2) showed
that all applied treatments increased the leaf content of
photosynthetic pigments compared with the control. This trend was
true during both 2001 and 2002 seasons. Using the 2R treatment in
2002 season only decreased the value of carotenoids compared with
the control. The same data showed that by applying the R+I
treatment the highest contents of all measured photosynthetic
pigments existed in both seasons.

111
TTaabbllee ((88..22)):: EEffffeecctt ooff ddiiffffeerreenntt aapppplliieedd ttrreeaattmmeennttss oonn tthhee lleeaaff ccoonntteenntt ooff pphhoottoossyynntthheettiicc
ppiiggmmeennttss ((mmgg//gg ffrreesshh wweeiigghhtt)) iinn lleeaavveess ooff mmuunngg bbeeaann KKaawwmmii--11 ccuullttiivvaarr,, 22 mmoonntthheess
aafftteerr ssoowwiinngg dduurriinngg 22000011 && 22000022 sseeaassoonnss..
Season Treatment
Chlorophyll Caroten.
Total
pigments (a) (b) (a+b)
2001
R (control) 0.689 0.500 1.189 0.388 1.577
1/2R 0.827 0.527 1.354 0.476 1.830
2R 0.728 0.731 1.459 0.345 1.804
R+I 1.231 0.958 2.189 0.613 2.802
1/2R+I 0.944 0.750 1.694 0.437 2.131
2R+I 0.745 0.671 1.416 0.390 1.806
2002
R (control) 0.732 0.540 1.272 0.413 1.685
1/2R 0.882 0.562 1.444 0.512 1.956
2R 0.771 0.778 1.549 0.369 1.918
R+I 1.308 1.019 2.327 0.657 2.984
1/2R+I 1.000 0.792 1.792 0.469 2.261
2R+I 0.797 0.714 1.511 0.418 1.929
VV..22-- NN,, PP,, KK AANNDD TTOOTTAALL CCRRUUDDEE PPRROOTTEEIINN CCOONNTTEENNTT::
The N, P, K and crude protein contents in the whole plants
at 30 days after sowing and in different organs i.e. leaves, stem and
roots after 60 and 90 days after sowing and pods at 90 days after
sowing as affected by the applied treatments were investigated. The
obtained results are shown in Tables (9.1, 9.2, 9.3, 9.4 and 9.5) for
cultivar Giza-1 and Tables (10.1, 10.2, 10.3, 10.4 and 10.5) for
cultivar Kawmi-1.
VV..22..11-- CCUULLTTIIVVAARR GGIIZZAA--11::
VV..22..11..11-- WWHHOOLLEE PPLLAANNTT ((3300 DDAAYYSS AAFFTTEERR SSOOWWIINNGG))::
Data in Table (9.1) showed that the highest contents of N,
P, K and crude protein in the whole plant of cultivar Giza-1 were
produced by the 1/2R treatment. Also, the P content in case of the
2R treatment, K content in case of R+I, 1/2R+I and 2R+I were
higher than control. On contrary, N and crude protein contents were
lower in plants received the 2R, R+I, 1/2R+I and 2R+I treatments
than the control. Similarly, the P content was lower in plants that

111
received R+I, 1/2R+I and 2R+I treatments than the control.
Besides, the highest decrease in the N, P and crude protein contents
was associated with the application of R+I and 1/2R+I treatments.
TTaabbllee ((9..11)):: EEffffeecctt ooff ddiiffffeerreenntt aapppplliieedd ttrreeaattmmeennttss oonn NNPPKK ccoonntteennttss aanndd ccrruuddee pprrootteeiinn ccoonntteennttss
((gg//110000 gg ddrryy wweeiigghhtt)) iinn tthhee wwhhoollee ppllaanntt ooff mmuunngg bbeeaann ccuullttiivvaarr GGiizzaa--11 aatt 3300 ddaayyss
aafftteerr ssoowwiinngg dduurriinngg 22000022 sseeaassoonn..
Treatment N % P % K % Total crude protein
%
R (control) 1.82 0.235 2.24 11.37
1/2R 2.80 0.395 3.04 17.50
2R 1.26 0.255 2.24 7.87
R+I 0.70 0.110 2.72 4.37
1/2R+I 0.70 0.130 2.40 4.37
2R+I 1.12 0.135 2.56 7.00
VV..22..11..22-- LLEEAAVVEESS ((6600 AANNDD 9900 DDAAYYSS AAFFTTEERR SSOOWWIINNGG))::
Data in Table (9.2) showed that all applied treatments
resulted in relative increases in the leaf contents of N, P, K and
crude protein (with few exceptions) either at 60 or 90 days after
sowing in comparison with the control. The 2R treatment induced
the highest increase in the leaf contents of N and crude protein
whereas the 1/2R+I showed the highest increase in the leaf contents
of P and K (60 DAS) compared with the control.
TTaabbllee ((99..22)):: EEffffeecctt ooff ddiiffffeerreenntt aapppplliieedd ttrreeaattmmeennttss oonn NNPPKK ccoonntteennttss aanndd ccrruuddee pprrootteeiinn ccoonntteennttss
((gg//110000 gg ddrryy wweeiigghhtt)) iinn tthhee lleeaavveess ooff mmuunngg bbeeaann ccuullttiivvaarr GGiizzaa--11 aatt 6600 aanndd 9900 ddaayyss
aafftteerr ssoowwiinngg dduurriinngg 22000022 sseeaassoonn..
Days after sowing
(DAS) Treatment N % P % K %
Total crude
protein %
60 DAS
R (control) 8.20 5.34.0 4..8 17.50
1/2R 4.90 1.4875 4.32 30.62
2R 6.44 1.4375 3.36 40.25
R+I 3.51 1.5375 4.16 21.87
1/2R+I 5.18 1.6500 4.80 32.37
2R+I 5.19 1.5625 2.32 31.81
90 DAS
R (control) ..30 5..800 ...8 8.75
1/2R 1.84 1.1125 2.88 5.25
2R 1.96 1.1250 3.20 12.25
R+I 4.34 1.3750 4.64 27.12
1/2R+I 1.82 1.1500 4.48 11.37
2R+I 2.80 1.1875 2.56 17.50
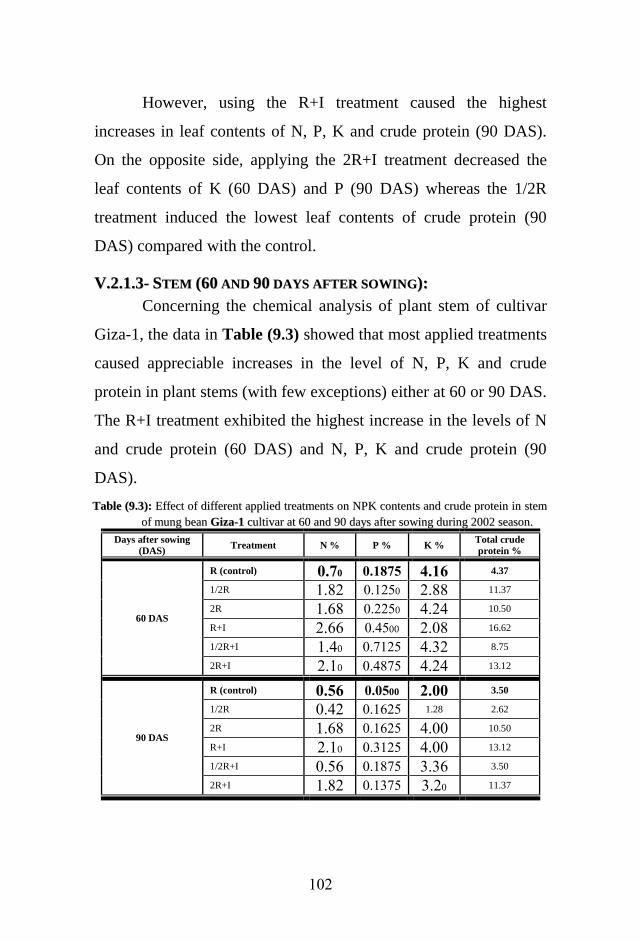
112
However, using the R+I treatment caused the highest
increases in leaf contents of N, P, K and crude protein (90 DAS).
On the opposite side, applying the 2R+I treatment decreased the
leaf contents of K (60 DAS) and P (90 DAS) whereas the 1/2R
treatment induced the lowest leaf contents of crude protein (90
DAS) compared with the control.
VV..22..11..33-- SSTTEEMM ((6600 AANNDD 9900 DDAAYYSS AAFFTTEERR SSOOWWIINNGG))::
Concerning the chemical analysis of plant stem of cultivar
Giza-1, the data in Table (9.3) showed that most applied treatments
caused appreciable increases in the level of N, P, K and crude
protein in plant stems (with few exceptions) either at 60 or 90 DAS.
The R+I treatment exhibited the highest increase in the levels of N
and crude protein (60 DAS) and N, P, K and crude protein (90
DAS).
TTaabbllee ((99..33)):: EEffffeecctt ooff ddiiffffeerreenntt aapppplliieedd ttrreeaattmmeennttss oonn NNPPKK ccoonntteennttss aanndd ccrruuddee pprrootteeiinn iinn sstteemm
ooff mmuunngg bbeeaann GGiizzaa--11 ccuullttiivvaarr aatt 6600 aanndd 9900 ddaayyss aafftteerr ssoowwiinngg dduurriinngg 22000022 sseeaassoonn..
Days after sowing
(DAS) Treatment N % P % K %
Total crude
protein %
60 DAS
R (control) 5..0 5..2.0 3..4 4.37
1/2R 1.82 1.1250 2.88 11.37
2R 1.68 1.2250 4.24 10.50
R+I 2.66 1.4500 2.18 16.62
1/2R+I 1.40 1.7125 4.32 8.75
2R+I 2.10 1.4875 4.24 13.12
90 DAS
R (control) 5.04 5.5000 8.55 3.50
1/2R 1.42 1.1625 1.28 2.62
2R 1.68 1.1625 4.11 10.50
R+I 2.10 1.3125 4.11 13.12
1/2R+I 1.56 1.1875 3.36 3.50
2R+I 1.82 1.1375 3.20 11.37

113
Whereas, the 1/2R+I treatment induced the highest increase
in the levels of P and K (60 DAS) compared with the control. On
contrary, stems of mung bean plants that received the 1/2R
treatments contained lower amounts of P and K (60 DAS) and N, K
and crude protein (90 DAS) than the control.
VV..22..11..44-- RROOOOTTSS ((6600 AANNDD 9900 DDAAYYSS AAFFTTEERR SSOOWWIINNGG))::
Data in Table (9.4) showed that roots of mung bean plants
of cultivar Giza-1 that received most applied treatments contained
higher amounts of N, P, K and crude protein than control. The 2R
treatment produced the highest amounts of N and crude protein (60
DAS) while, the R+I treatment produced the highest amounts of P
and K (60 DAS) and N, P, K and crude protein (90 DAS).
TTaabbllee ((99..44)):: EEffffeecctt ooff ddiiffffeerreenntt aapppplliieedd ttrreeaattmmeennttss oonn NNPPKK ccoonntteennttss aanndd ccrruuddee pprrootteeiinn iinn rroooottss
ooff mmuunngg bbeeaann ccuullttiivvaarr GGiizzaa--11 aatt 6600 aanndd 9900 ddaayyss aafftteerr ssoowwiinngg dduurriinngg 22000022 sseeaassoonn..
Days after sowing
(DAS) Treatment N % P % K %
Total crude
protein %
60 DAS
R (control) 5.23 5..4.0 ...8 5.25
1/2R 1.56 1.1375 1.28 3.50
2R 4.34 1.4250 2.24 27.12
R+I 2.94 1.5750 4.11 18.37
1/2R+I 1.68 1.4625 3.14 10.50
2R+I 1.56 1.1750 2.88 3.50
90 DAS
R (control) 5..2 5.5.80 ..82 6.12
1/2R 1.67 1.1250 0.56 4.18
2R 1.42 1.1000 2.18 2.62
R+I 1.68 1.3625 3.14 10.50
1/2R+I 1.42 1.1250 1.92 2.62
2R+I 1.26 1.2250 2.00 7.87
Meanwhile, the roots of plants that received the 1/2R
treatment contained lower amounts of N, K and crude protein at
both 60 and 90 DAS compared with the control. The roots of plants
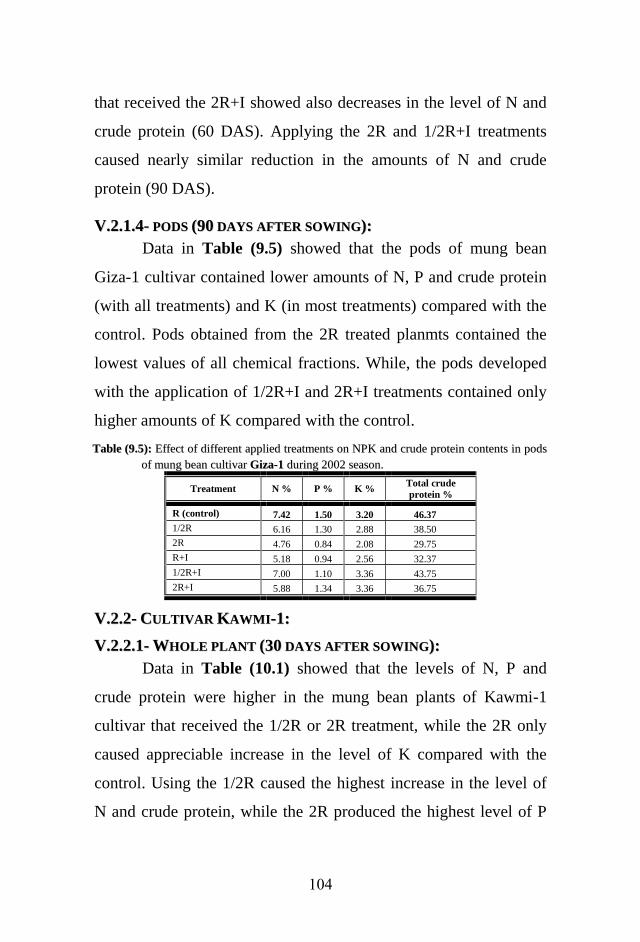
114
that received the 2R+I showed also decreases in the level of N and
crude protein (60 DAS). Applying the 2R and 1/2R+I treatments
caused nearly similar reduction in the amounts of N and crude
protein (90 DAS).
VV..22..11..44-- PPOODDSS ((9900 DDAAYYSS AAFFTTEERR SSOOWWIINNGG))::
Data in Table (9.5) showed that the pods of mung bean
Giza-1 cultivar contained lower amounts of N, P and crude protein
(with all treatments) and K (in most treatments) compared with the
control. Pods obtained from the 2R treated planmts contained the
lowest values of all chemical fractions. While, the pods developed
with the application of 1/2R+I and 2R+I treatments contained only
higher amounts of K compared with the control.
TTaabbllee ((99..55)):: EEffffeecctt ooff ddiiffffeerreenntt aapppplliieedd ttrreeaattmmeennttss oonn NNPPKK aanndd ccrruuddee pprrootteeiinn ccoonntteennttss iinn ppooddss
ooff mmuunngg bbeeaann ccuullttiivvaarr GGiizzaa--11 dduurriinngg 22000022 sseeaassoonn..
Treatment N % P % K % Total crude
protein %
R (control) 7.42 1.50 3.20 46.37
1/2R 6.16 1.30 2.88 38.50
2R 4.76 0.84 2.08 29.75
R+I 5.18 0.94 2.56 32.37
1/2R+I 7.00 1.10 3.36 43.75
2R+I 5.88 1.34 3.36 36.75
VV..22..22-- CCUULLTTIIVVAARR KKAAWWMMII--11::
VV..22..22..11-- WWHHOOLLEE PPLLAANNTT ((3300 DDAAYYSS AAFFTTEERR SSOOWWIINNGG))::
Data in Table (10.1) showed that the levels of N, P and
crude protein were higher in the mung bean plants of Kawmi-1
cultivar that received the 1/2R or 2R treatment, while the 2R only
caused appreciable increase in the level of K compared with the
control. Using the 1/2R caused the highest increase in the level of
N and crude protein, while the 2R produced the highest level of P
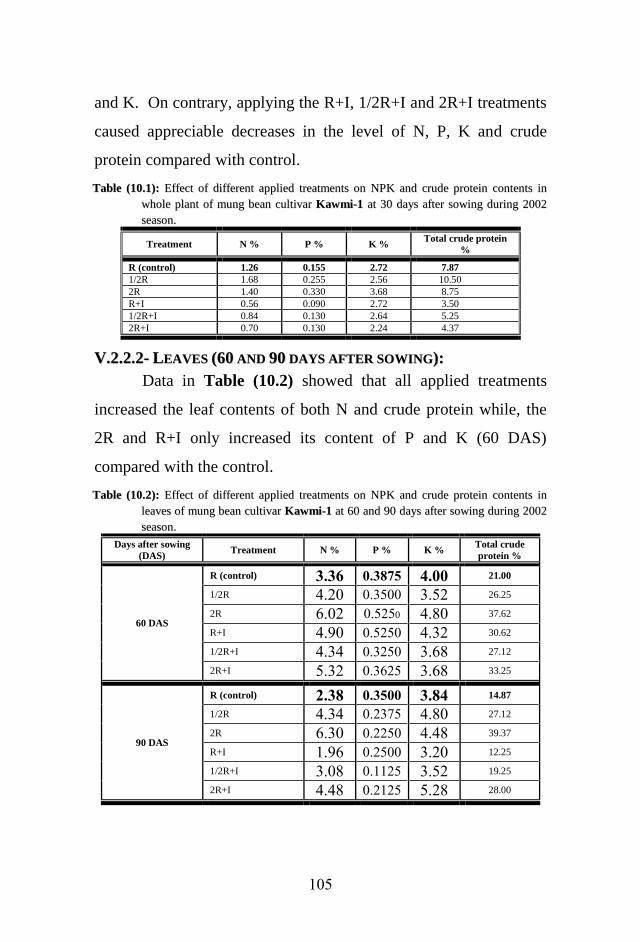
115
and K. On contrary, applying the R+I, 1/2R+I and 2R+I treatments
caused appreciable decreases in the level of N, P, K and crude
protein compared with control.
TTaabbllee ((1100..11)):: EEffffeecctt ooff ddiiffffeerreenntt aapppplliieedd ttrreeaattmmeennttss oonn NNPPKK aanndd ccrruuddee pprrootteeiinn ccoonntteennttss iinn
wwhhoollee ppllaanntt ooff mmuunngg bbeeaann ccuullttiivvaarr KKaawwmmii--11 aatt 3300 ddaayyss aafftteerr ssoowwiinngg dduurriinngg 22000022
sseeaassoonn..
Treatment N % P % K % Total crude protein
%
R (control) 1.26 0.155 2.72 7.87
1/2R 1.68 0.255 2.56 10.50
2R 1.40 0.330 3.68 8.75
R+I 0.56 0.090 2.72 3.50
1/2R+I 0.84 0.130 2.64 5.25
2R+I 0.70 0.130 2.24 4.37
VV..22..22..22-- LLEEAAVVEESS ((6600 AANNDD 9900 DDAAYYSS AAFFTTEERR SSOOWWIINNGG))::
Data in Table (10.2) showed that all applied treatments
increased the leaf contents of both N and crude protein while, the
2R and R+I only increased its content of P and K (60 DAS)
compared with the control.
TTaabbllee ((1100..22)):: EEffffeecctt ooff ddiiffffeerreenntt aapppplliieedd ttrreeaattmmeennttss oonn NNPPKK aanndd ccrruuddee pprrootteeiinn ccoonntteennttss iinn
lleeaavveess ooff mmuunngg bbeeaann ccuullttiivvaarr KKaawwmmii--11 aatt 6600 aanndd 9900 ddaayyss aafftteerr ssoowwiinngg dduurriinngg 22000022
sseeaassoonn..
Days after sowing
(DAS) Treatment N % P % K %
Total crude
protein %
60 DAS
R (control) 4.44 5.42.0 3.55 21.00
1/2R 4.21 1.3511 3.52 26.25
2R 6.12 1.5250 4.81 37.62
R+I 4.91 1.5251 4.32 30.62
1/2R+I 4.34 1.3251 3.68 27.12
2R+I 5.32 1.3625 3.68 33.25
90 DAS
R (control) 8.42 5.4055 4.23 14.87
1/2R 4.34 1.2375 4.81 27.12
2R 6.31 1.2251 4.48 39.37
R+I 1.96 1.2511 3.21 12.25
1/2R+I 3.18 1.1125 3.52 19.25
2R+I 4.48 1.2125 5.28 28.00

116
The highest contents of N, P, K and crude protein were
existed with the 2R treatment. On the contrary, applying the 1/2R,
1/2R+I and 2R+I decreased both P and K levels in leaves (60 DAS)
compared with the control. At 90 DAS, all applied treatments
reduce the leaf content of P compared with control. The leaf
contents of N and crude protein also were increased by all
treatments except the R+I. In general, all determined minerals and
calculated crude protein were lower in leaves of plants that received
the R+I treatment compared with the control.
VV..22..22..33-- SSTTEEMM ((6600 AANNDD 9900 DDAAYYSS AAFFTTEERR SSOOWWIINNGG))::
Data in Table (10.3) showed that all applied treatments
(with few exceptions) increased the N, P, K and crude protein
contents in plant stems compared with the control.
TTaabbllee ((1100..33)):: EEffffeecctt ooff ddiiffffeerreenntt aapppplliieedd ttrreeaattmmeennttss oonn NNPPKK aanndd ccrruuddee pprrootteeiinn ccoonntteennttss iinn
sstteemm ooff mmuunngg bbeeaann ccuullttiivvaarr KKaawwmmii--11 aatt 6600 aanndd 9900 ddaayyss aafftteerr ssoowwiinngg dduurriinngg 22000022
sseeaassoonn..
Days after sowing
(DAS) Treatment N % P % K %
Total crude
protein %
60 DAS
R (control) ..35 5..555 4.44 8.75
1/2R 1.98 1.3111 3.39 6.12
2R 1.96 1.4375 4.48 12.25
R+I 1.68 1.5875 4.24 10.50
1/2R+I 1.82 1.2511 4.11 11.37
2R+I 2.24 1.2751 3.52 14.00
90 DAS
R (control) 5.23 5..2.0 4.42 5.25
1/2R 1.71 1.1125 2.72 4.37
2R 1.54 1.1125 3.92 9.62
R+I 2.11 1.2751 3.36 13.12
1/2R+I 1.26 1.2251 3.68 7.87
2R+I 1.96 1.2251 4.32 12.25
The 2R+I treatment induced the highest increase in the
contents of N and crude protein (60 DAS) and K (90 DAS) while
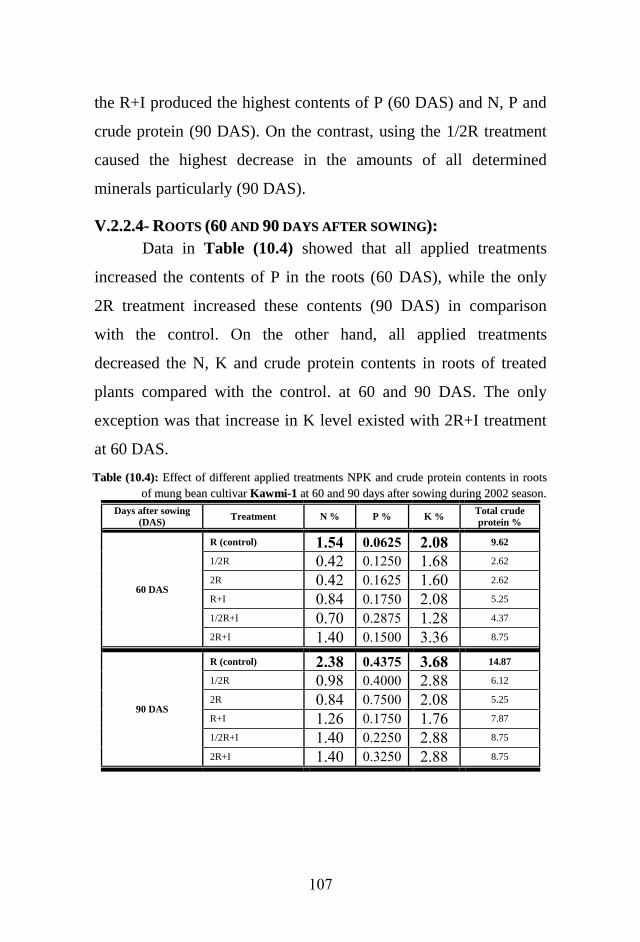
117
the R+I produced the highest contents of P (60 DAS) and N, P and
crude protein (90 DAS). On the contrast, using the 1/2R treatment
caused the highest decrease in the amounts of all determined
minerals particularly (90 DAS).
VV..22..22..44-- RROOOOTTSS ((6600 AANNDD 9900 DDAAYYSS AAFFTTEERR SSOOWWIINNGG))::
Data in Table (10.4) showed that all applied treatments
increased the contents of P in the roots (60 DAS), while the only
2R treatment increased these contents (90 DAS) in comparison
with the control. On the other hand, all applied treatments
decreased the N, K and crude protein contents in roots of treated
plants compared with the control. at 60 and 90 DAS. The only
exception was that increase in K level existed with 2R+I treatment
at 60 DAS.
TTaabbllee ((1100..44)):: EEffffeecctt ooff ddiiffffeerreenntt aapppplliieedd ttrreeaattmmeennttss NNPPKK aanndd ccrruuddee pprrootteeiinn ccoonntteennttss iinn rroooottss
ooff mmuunngg bbeeaann ccuullttiivvaarr KKaawwmmii--11 aatt 6600 aanndd 9900 ddaayyss aafftteerr ssoowwiinngg dduurriinngg 22000022 sseeaassoonn..
Days after sowing
(DAS) Treatment N % P % K %
Total crude
protein %
60 DAS
R (control) ..03 5.5480 8.52 9.62
1/2R 1.42 1.1251 1.68 2.62
2R 1.42 1.1625 1.61 2.62
R+I 1.84 1.1751 2.18 5.25
1/2R+I 1.71 1.2875 1.28 4.37
2R+I 1.41 1.1511 3.36 8.75
90 DAS
R (control) 8.42 5.34.0 4.42 14.87
1/2R 1.98 1.4111 2.88 6.12
2R 1.84 1.7511 2.18 5.25
R+I 1.26 1.1751 1.76 7.87
1/2R+I 1.41 1.2251 2.88 8.75
2R+I 1.41 1.3251 2.88 8.75

118
VV..22..22..55-- PPOODDSS ((9900 DDAAYYSS AAFFTTEERR SSOOWWIINNGG))::
Data in Table (10.5) showed that all applied treatments induced
higher contents of crude protein in pods of cultivar Kawmi-1, than
the control. However, the fruit contents of N (R+I, 1/2R+I and
2R+I), P (1/2R and R+I) and K (1/2R) were higher than the N, P
and K contents in pods of control (R treatment). On contrary, the
fruit contents of K (in most treatments), N and P (2R) and P
(1/2R+I and 2R+I) were lower than R (control).
TTaabbllee ((1100..55)):: EEffffeecctt ooff ddiiffffeerreenntt aapppplliieedd ttrreeaattmmeennttss NNPPKK aanndd ccrruuddee pprrootteeiinn ccoonntteennttss iinn ppooddss ooff
mmuunngg bbeeaann ccuullttiivvaarr KKaawwmmii--11 dduurriinngg 22000022 sseeaassoonn
Treatment N % P % K % Total crude
protein %
R (control) ..03 ...2 4.08 47.12
1/2R 11.91 2.15 4.11 74.37
2R 7.56 1.39 3.14 47.25
R+I 11.16 1.85 3.52 69.12
1/2R+I 11.18 1.56 3.36 63.00
2R+I 9.11 1.44 3.20 56.87
VV..33-- CCAARRBBOOHHYYDDRRAATTEE CCOONNTTEENNTT ((MMGG//GG DDRRYY WWEEIIGGHHTT)) OOFF TTHHEE
MMUUNNGG BBEEAANN CCUULLTTIIVVAARRSS GGIIZZAA--11 AANNDD KKAAWWMMII--11::
VV..33..11-- CCUULLTTIIVVAARR GGIIZZAA--11::
VV..33..11..11-- WWHHOOLLEE PPLLAANNTT ((3300 DDAAYYSS AAFFTTEERR SSOOWWIINNGG))::
As for the carbohydrates contents in the whole plant of
cultivar Giza-1, the data in Table (11.1) showed that all applied
treatments increased both non-reducing and total sugars contents,
whereas decreased reducing sugars contents compared with the
control. The 1/2R treatment caused the highest increases in both
non-reducing and total sugars whereas the R+I caused the highest
reduction in the reducing sugars compared with the control.

119
TTaabbllee ((1111..11)):: EEffffeecctt ooff ddiiffffeerreenntt aapppplliieedd ttrreeaattmmeennttss oonn tthhee ccaarrbboohhyyddrraatteess ccoonntteennttss ((mmgg//gg ddrryy
wweeiigghhtt)) iinn tthhee wwhhoollee ppllaanntt ooff mmuunngg bbeeaann ccuullttiivvaarr GGiizzaa--11 aatt 3300 ddaayyss aafftteerr ssoowwiinngg
dduurriinngg 22000022 sseeaassoonn
Treatment Reducing sugars Non-Reducing
sugars Total sugars
R (control) 45.28 64.99 110.27
1/2R 25.59 85.74 111.33
2R 21.66 76.20 97.86
R+I 11.16 85.64 96.80
1/2R+I 25.81 75.02 100.83
2R+I 22.31 67.92 90.23
VV..33..11..22-- LLEEAAVVEESS ((6600 AANNDD 9900 DDAAYYSS AAFFTTEERR SSOOWWIINNGG))::
Data in Table (11.2) showed that the leaves of plant treated
with any treatment contained higher amounts of reducing and total
sugars than those leaves of the control treatment. This trend was
true at both 60 and 90 DAS. However, the highest contents of both
reducing and total sugars at 60 and 90 DAS were existed with the
1/2R and 2R+I treatments, respectively.
TTaabbllee ((1111..22)):: EEffffeecctt ooff ddiiffffeerreenntt aapppplliieedd ttrreeaattmmeennttss oonn tthhee ccaarrbboohhyyddrraatteess ccoonntteennttss ((mmgg//gg ddrryy
wweeiigghhtt)) iinn lleeaavveess ooff mmuunngg bbeeaann ccuullttiivvaarr GGiizzaa--11 aatt 6600 aanndd 9900 ddaayyss aafftteerr ssoowwiinngg
dduurriinngg 22000022 sseeaassoonn..
Days after sowing
(DAS) Treatment
Reducing
sugars
Non-
Reducing
sugars
Total sugars
60 DAS
R (control) .3.42 4..3.4 ....204 1/2R 127.75 11.673 139.423 2R 114.19 23.112 137.312 R+I 85.31 35.558 121.868 1/2R+I 87.16 39.11 126.171 2R+I 86.19 52.173 138.363
90 DAS
R (control) 8..8. .4..8 35..84 1/2R 92.78 8.47 111.254 2R 59.79 12.19 71.889 R+I 116.34 44.32 151.662 1/2R+I 119.52 49.19 158.719 2R+I 127.99 77.48 215.476

111
On the other hand, the leaves of plant treated with 1/2R or
2R treatments contained lower contents of the non-reducing sugars
at 60 and 90 DAS. The lowest and highest values of the non-
reducing sugars were obtained with 1/2R and 2R+I treatments,
respectively.
VV..33..11..33-- SSTTEEMMSS ((6600 AANNDD 9900 DDAAYYSS AAFFTTEERR SSOOWWIINNGG))::
Data in Table (11.3) showed that carbohydrate fractions in
stems (60 and 90 DAS) as affected by the applied treatments was
greatly varied. The carbohydrate fractions in stem (60 DAS) were
higher, in general, than the control particularly the total sugars.
TTaabbllee ((1111..33)):: EEffffeecctt ooff ddiiffffeerreenntt aapppplliieedd ttrreeaattmmeennttss oonn tthhee ccaarrbboohhyyddrraatteess ccoonntteennttss ((mmgg//gg ddrryy
wweeiigghhtt)) iinn sstteemm ooff mmuunngg bbeeaann ccuullttiivvaarr GGiizzaa--11 aatt 6600 aanndd 9900 ddaayyss aafftteerr ssoowwiinngg dduurriinngg
22000022 sseeaassoonn..
Days after sowing
(DAS) Treatment
Reducing
sugars
Non-
Reducing
sugars
Total sugars
60 DAS
R (control) 80.2. 2..250 .5..4.0 1/2R 41.56 89.381 131.941 2R 25.81 146.269 172.179 R+I 136.94 44.681 181.621 1/2R+I 38.5 136.759 175.259 2R+I 24.28 152.14 176.321
90 DAS
R (control) 44... 4..0.4 .0.384 1/2R 41.34 28.849 71.189 2R 42.44 17.994 61.434 R+I 38.72 24.683 63.413 1/2R+I 8.31 31.389 38.699 2R+I 17.5 24.486 41.986
At 60 DAS, contents of reducing sugars in case of 2R+I
treatment and the non-reducing sugars in case of the R+I treatment
were lower than the control. Moreover, using the R+I treatment
produced the highest contents of both reducing and total sugars,

111
while the 2R+I induced the highest increase in the non-reducing
sugars (60 DAS) in comparison with the control. At 90 DAS,
contents of both non-reducing and total sugars in case of all
treatments and the reducing sugars in case of the 1/2R+I and 2R+I
treatments were lower than the corresponding values in the control.
However, the 2R, 1/2R and R+I treatments, in respective, increased
the contents of reducing sugars in stem (90 DAS) compared with
the control.
VV..33..11..44-- RROOOOTTSS ((6600 AANNDD 9900 DDAAYYSS AAFFTTEERR SSOOWWIINNGG))::
Data in Table (11.4) showed that all applied treatments, in
general, caused appreciable increase in the carbohydrate fractions
in the roots (60 and 90 DAS) compared with the control. The
highest contents of reducing, non-reducing and total sugars (60 and
90 DAS) were existed with the 2R+I and R+I treatments,
respectively. Whereas, the 1/2R, 2R and R+I, in respective,
decreased the amounts of the reducing sugars (60 DAS) only in
comparison with the control treatment.
VV..33..11..55-- PPOODDSS ((9900 DDAAYYSS AAFFTTEERR SSOOWWIINNGG))::
With regard to cultivar Giza-1 in Table (11.5), the obtained
results indicated that all applied treatments caused appreciable
increases in the fruit contents of all determined carbohydrate
fractions compared with the pods of the control treatment. Using
the 2R+I treatment caused the highest accumulation of the reducing
sugars, while the R+I resulted in the highest values of the non-
reducing and total sugars in pods of cultivar Giza-1.
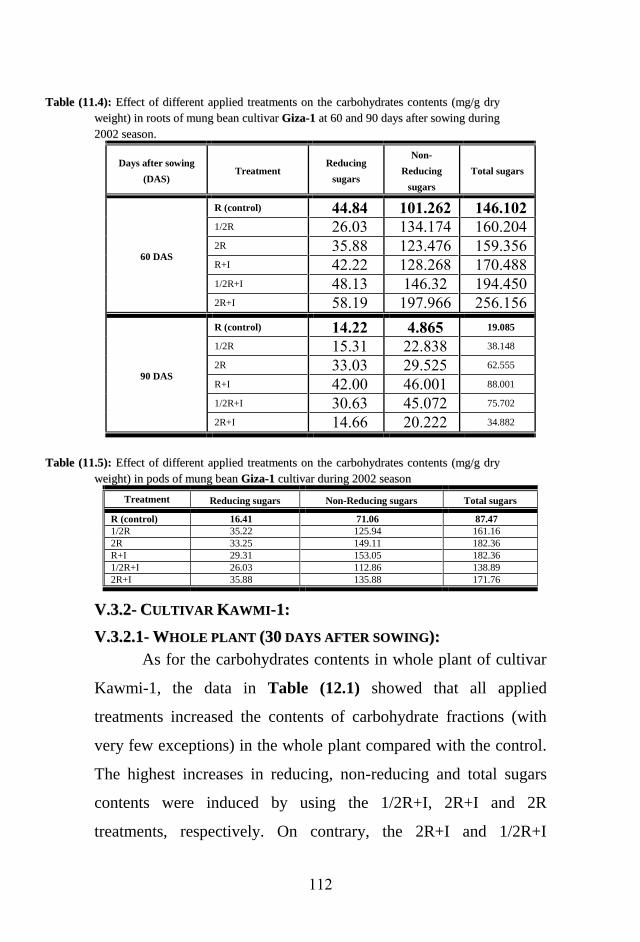
112
TTaabbllee ((1111..44)):: EEffffeecctt ooff ddiiffffeerreenntt aapppplliieedd ttrreeaattmmeennttss oonn tthhee ccaarrbboohhyyddrraatteess ccoonntteennttss ((mmgg//gg ddrryy
wweeiigghhtt)) iinn rroooottss ooff mmuunngg bbeeaann ccuullttiivvaarr GGiizzaa--11 aatt 6600 aanndd 9900 ddaayyss aafftteerr ssoowwiinngg dduurriinngg
22000022 sseeaassoonn..
Days after sowing
(DAS) Treatment
Reducing
sugars
Non-
Reducing
sugars
Total sugars
60 DAS
R (control) 33.23 .5..848 .34..58 1/2R 26.13 134.174 161.214 2R 35.88 123.476 159.356 R+I 42.22 128.268 171.488 1/2R+I 48.13 146.32 194.451 2R+I 58.19 197.966 256.156
90 DAS
R (control) .3.88 3.240 19.085
1/2R 15.31 22.838 38.148
2R 33.13 29.525 62.555
R+I 42.11 46.111 88.001
1/2R+I 31.63 45.172 75.702
2R+I 14.66 21.222 34.882
TTaabbllee ((1111..55)):: EEffffeecctt ooff ddiiffffeerreenntt aapppplliieedd ttrreeaattmmeennttss oonn tthhee ccaarrbboohhyyddrraatteess ccoonntteennttss ((mmgg//gg ddrryy
wweeiigghhtt)) iinn ppooddss ooff mmuunngg bbeeaann GGiizzaa--11 ccuullttiivvaarr dduurriinngg 22000022 sseeaassoonn
Treatment Reducing sugars Non-Reducing sugars Total sugars
R (control) 16.41 71.06 87.47
1/2R 35.22 125.94 161.16
2R 33.25 149.11 182.36
R+I 29.31 153.05 182.36
1/2R+I 26.03 112.86 138.89
2R+I 35.88 135.88 171.76
VV..33..22-- CCUULLTTIIVVAARR KKAAWWMMII--11::
VV..33..22..11-- WWHHOOLLEE PPLLAANNTT ((3300 DDAAYYSS AAFFTTEERR SSOOWWIINNGG))::
As for the carbohydrates contents in whole plant of cultivar
Kawmi-1, the data in Table (12.1) showed that all applied
treatments increased the contents of carbohydrate fractions (with
very few exceptions) in the whole plant compared with the control.
The highest increases in reducing, non-reducing and total sugars
contents were induced by using the 1/2R+I, 2R+I and 2R
treatments, respectively. On contrary, the 2R+I and 1/2R+I
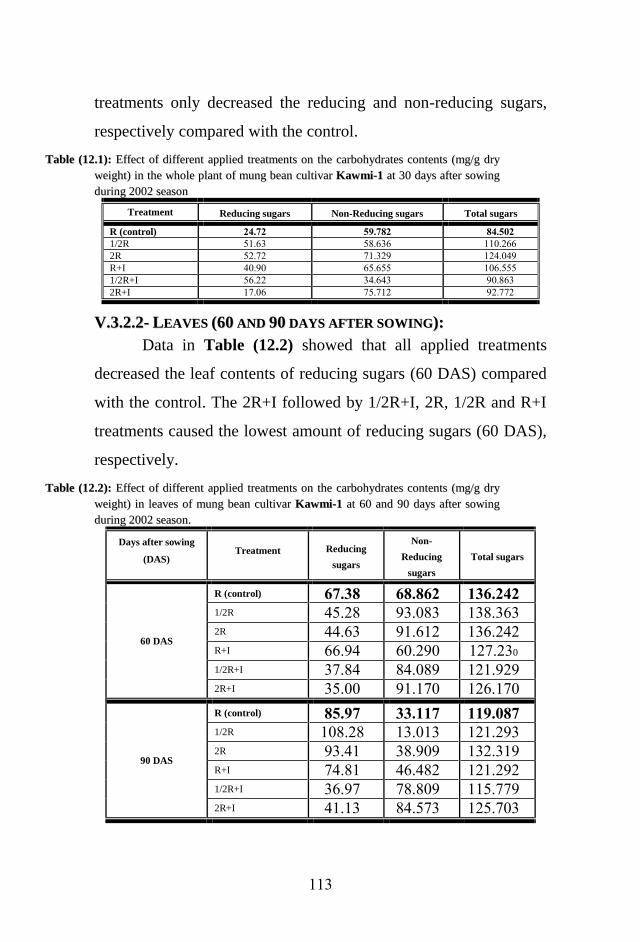
113
treatments only decreased the reducing and non-reducing sugars,
respectively compared with the control.
TTaabbllee ((1122..11)):: EEffffeecctt ooff ddiiffffeerreenntt aapppplliieedd ttrreeaattmmeennttss oonn tthhee ccaarrbboohhyyddrraatteess ccoonntteennttss ((mmgg//gg ddrryy
wweeiigghhtt)) iinn tthhee wwhhoollee ppllaanntt ooff mmuunngg bbeeaann ccuullttiivvaarr KKaawwmmii--11 aatt 3300 ddaayyss aafftteerr ssoowwiinngg
dduurriinngg 22000022 sseeaassoonn
Treatment Reducing sugars Non-Reducing sugars Total sugars
R (control) 83..8 0...28 23.058
1/2R 51.63 58.636 111.266
2R 52.72 71.329 124.149
R+I 41.91 65.655 116.555
1/2R+I 56.22 34.643 91.863
2R+I 17.16 75.712 92.772
VV..33..22..22-- LLEEAAVVEESS ((6600 AANNDD 9900 DDAAYYSS AAFFTTEERR SSOOWWIINNGG))::
Data in Table (12.2) showed that all applied treatments
decreased the leaf contents of reducing sugars (60 DAS) compared
with the control. The 2R+I followed by 1/2R+I, 2R, 1/2R and R+I
treatments caused the lowest amount of reducing sugars (60 DAS),
respectively.
TTaabbllee ((1122..22)):: EEffffeecctt ooff ddiiffffeerreenntt aapppplliieedd ttrreeaattmmeennttss oonn tthhee ccaarrbboohhyyddrraatteess ccoonntteennttss ((mmgg//gg ddrryy
wweeiigghhtt)) iinn lleeaavveess ooff mmuunngg bbeeaann ccuullttiivvaarr KKaawwmmii--11 aatt 6600 aanndd 9900 ddaayyss aafftteerr ssoowwiinngg
dduurriinngg 22000022 sseeaassoonn..
Days after sowing
(DAS) Treatment Reducing
sugars
Non-
Reducing
sugars
Total sugars
60 DAS
R (control) 4..42 42.248 .44.838
1/2R 45.28 93.183 138.363
2R 44.63 91.612 136.242
R+I 66.94 61.291 127.230
1/2R+I 37.84 84.189 121.929
2R+I 35.11 91.171 126.171
90 DAS
R (control) 20... 44.... ....52.
1/2R 118.28 13.113 121.293
2R 93.41 38.919 132.319
R+I 74.81 46.482 121.292
1/2R+I 36.97 78.819 115.779
2R+I 41.13 84.573 125.713
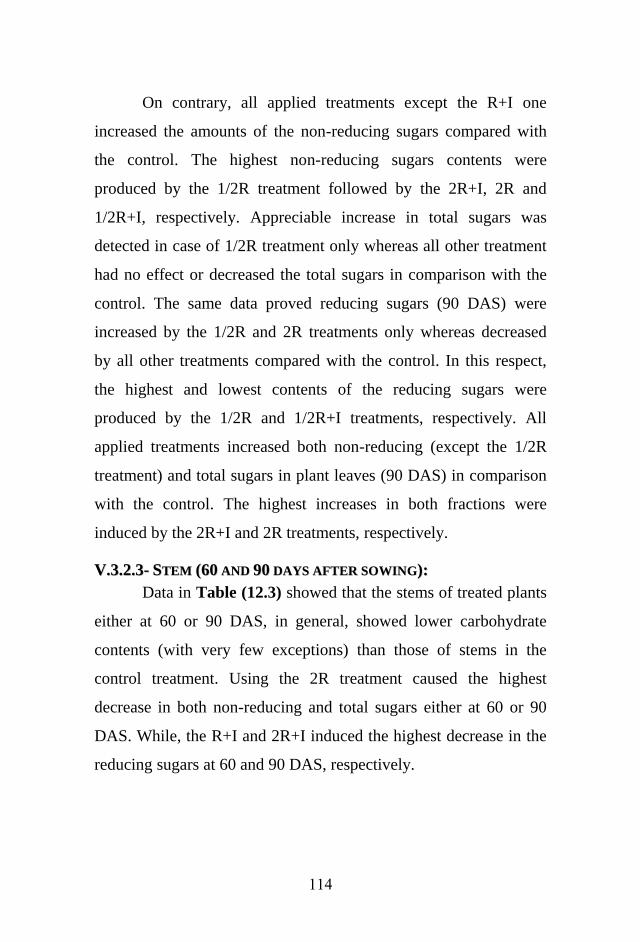
114
On contrary, all applied treatments except the R+I one
increased the amounts of the non-reducing sugars compared with
the control. The highest non-reducing sugars contents were
produced by the 1/2R treatment followed by the 2R+I, 2R and
1/2R+I, respectively. Appreciable increase in total sugars was
detected in case of 1/2R treatment only whereas all other treatment
had no effect or decreased the total sugars in comparison with the
control. The same data proved reducing sugars (90 DAS) were
increased by the 1/2R and 2R treatments only whereas decreased
by all other treatments compared with the control. In this respect,
the highest and lowest contents of the reducing sugars were
produced by the 1/2R and 1/2R+I treatments, respectively. All
applied treatments increased both non-reducing (except the 1/2R
treatment) and total sugars in plant leaves (90 DAS) in comparison
with the control. The highest increases in both fractions were
induced by the 2R+I and 2R treatments, respectively.
VV..33..22..33-- SSTTEEMM ((6600 AANNDD 9900 DDAAYYSS AAFFTTEERR SSOOWWIINNGG))::
Data in Table (12.3) showed that the stems of treated plants
either at 60 or 90 DAS, in general, showed lower carbohydrate
contents (with very few exceptions) than those of stems in the
control treatment. Using the 2R treatment caused the highest
decrease in both non-reducing and total sugars either at 60 or 90
DAS. While, the R+I and 2R+I induced the highest decrease in the
reducing sugars at 60 and 90 DAS, respectively.
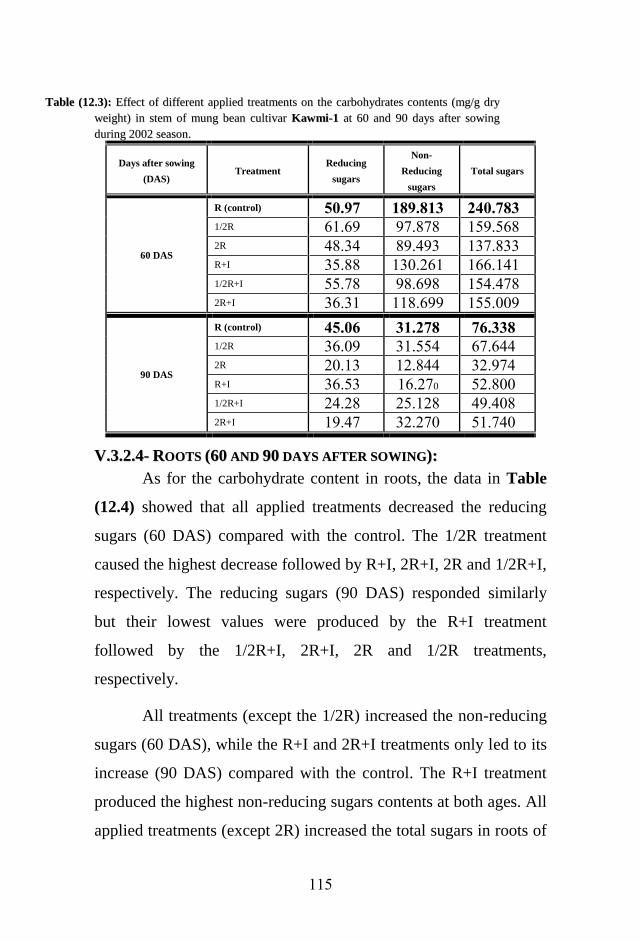
115
TTaabbllee ((1122..33)):: EEffffeecctt ooff ddiiffffeerreenntt aapppplliieedd ttrreeaattmmeennttss oonn tthhee ccaarrbboohhyyddrraatteess ccoonntteennttss ((mmgg//gg ddrryy
wweeiigghhtt)) iinn sstteemm ooff mmuunngg bbeeaann ccuullttiivvaarr KKaawwmmii--11 aatt 6600 aanndd 9900 ddaayyss aafftteerr ssoowwiinngg
dduurriinngg 22000022 sseeaassoonn..
Days after sowing
(DAS) Treatment
Reducing
sugars
Non-
Reducing
sugars
Total sugars
60 DAS
R (control) 05... .2..2.4 835..24
1/2R 61.69 97.878 159.568
2R 48.34 89.493 137.833
R+I 35.88 131.261 166.141
1/2R+I 55.78 98.698 154.478
2R+I 36.31 118.699 155.119
90 DAS
R (control) 30.54 4..8.2 .4.442
1/2R 36.19 31.554 67.644
2R 21.13 12.844 32.974
R+I 36.53 16.270 52.811
1/2R+I 24.28 25.128 49.418
2R+I 19.47 32.271 51.741
VV..33..22..44-- RROOOOTTSS ((6600 AANNDD 9900 DDAAYYSS AAFFTTEERR SSOOWWIINNGG))::
As for the carbohydrate content in roots, the data in Table
(12.4) showed that all applied treatments decreased the reducing
sugars (60 DAS) compared with the control. The 1/2R treatment
caused the highest decrease followed by R+I, 2R+I, 2R and 1/2R+I,
respectively. The reducing sugars (90 DAS) responded similarly
but their lowest values were produced by the R+I treatment
followed by the 1/2R+I, 2R+I, 2R and 1/2R treatments,
respectively.
All treatments (except the 1/2R) increased the non-reducing
sugars (60 DAS), while the R+I and 2R+I treatments only led to its
increase (90 DAS) compared with the control. The R+I treatment
produced the highest non-reducing sugars contents at both ages. All
applied treatments (except 2R) increased the total sugars in roots of
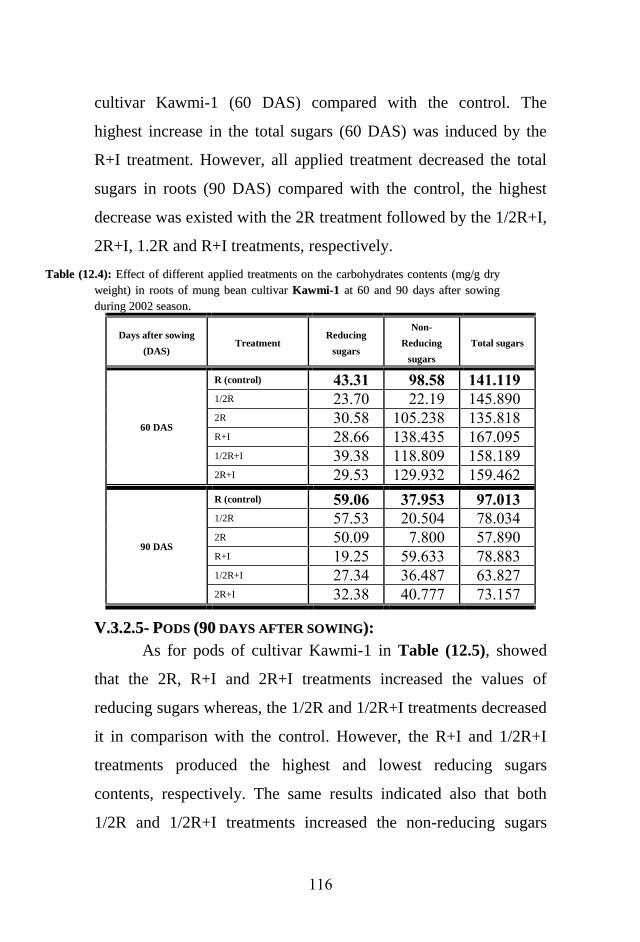
116
cultivar Kawmi-1 (60 DAS) compared with the control. The
highest increase in the total sugars (60 DAS) was induced by the
R+I treatment. However, all applied treatment decreased the total
sugars in roots (90 DAS) compared with the control, the highest
decrease was existed with the 2R treatment followed by the 1/2R+I,
2R+I, 1.2R and R+I treatments, respectively.
TTaabbllee ((1122..44)):: EEffffeecctt ooff ddiiffffeerreenntt aapppplliieedd ttrreeaattmmeennttss oonn tthhee ccaarrbboohhyyddrraatteess ccoonntteennttss ((mmgg//gg ddrryy
wweeiigghhtt)) iinn rroooottss ooff mmuunngg bbeeaann ccuullttiivvaarr KKaawwmmii--11 aatt 6600 aanndd 9900 ddaayyss aafftteerr ssoowwiinngg
dduurriinngg 22000022 sseeaassoonn..
Days after sowing
(DAS) Treatment
Reducing
sugars
Non-
Reducing
sugars
Total sugars
60 DAS
R (control) 34.4. .2.02 .3.....
1/2R 23.71 22.19 145.891
2R 31.58 115.238 135.818
R+I 28.66 138.435 167.195
1/2R+I 39.38 118.819 158.189
2R+I 29.53 129.932 159.462
90 DAS
R (control) 0..54 4...04 ...5.4
1/2R 57.53 21.514 78.134
2R 51.19 7.811 57.891
R+I 19.25 59.633 78.883
1/2R+I 27.34 36.487 63.827
2R+I 32.38 41.777 73.157
VV..33..22..55-- PPOODDSS ((9900 DDAAYYSS AAFFTTEERR SSOOWWIINNGG))::
As for pods of cultivar Kawmi-1 in Table (12.5), showed
that the 2R, R+I and 2R+I treatments increased the values of
reducing sugars whereas, the 1/2R and 1/2R+I treatments decreased
it in comparison with the control. However, the R+I and 1/2R+I
treatments produced the highest and lowest reducing sugars
contents, respectively. The same results indicated also that both
1/2R and 1/2R+I treatments increased the non-reducing sugars
117
whereas the other treatments (2R, R+I and 2R+I) decreased it
compared with the control. The R+I treatment produced the lowest
value of the non-reducing sugars contents followed by 2R+I and
2R, respectively. The pods of Kawmi-1 cultivar that produced after
the application of 1/2R, 2R and 1/2R+I contained higher contents
whereas those produced with the R+I treatment contained lower
content of total sugars compared with the control.
TTaabbllee ((1122..55)):: EEffffeecctt ooff ddiiffffeerreenntt aapppplliieedd ttrreeaattmmeennttss oonn tthhee ccaarrbboohhyyddrraatteess ccoonntteennttss ((mmgg//gg ddrryy
wweeiigghhtt)) iinn ppooddss ooff mmuunngg bbeeaann ccuullttiivvaarr KKaawwmmii--11 dduurriinngg 22000022 sseeaassoonn
Treatment Reducing sugars Non-Reducing sugars Total sugars
R (control) .5..3 .20.854 ..4..34
1/2R 11.28 191.168 211.448
2R 24.72 182.129 216.749
R+I 27.34 163.515 191.845
1/2R+I 9.63 191.818 211.448
2R+I 21.11 175.146 196.146
VVII-- EEFFFFEECCTT OOFF NNPPKK LLEEVVEELLSS OONN TTHHEE AANNAATTOOMMIICCAALL SSTTRRUUCCTTUURREE
OOFF TTHHEE TTWWOO AASSSSIIGGNNEEDD MMUUNNGG BBEEAANN CCUULLTTIIVVAARRSS::
VVII..11-- LLEEAAFF BBLLAADDEE::
VVII..11..11–– CCUULLTTIIVVAARR GGIIZZAA--11::
Data in Table (13.1) proved that, the 2R (Photo 1a) and
2R+I (Photo 1b) treatments were the most effective treatments, as
they showed the highest increase in the thickness of blade (4.7%
and 5.1%), thickness of the upper epidermis (95.4% and 81.7%),
lower epidermis (43.6% and 36.5%) and thickness of palisade
tissue (6.3% and 5.1%), respectively compared with the control
(Photo 1c), respectively. The 2R treatment exhibited the highest
increase in the thickness of mesophill tissue (10.7%), meanwhile
the 2R+I treatment showed the greatest decrease in this character.
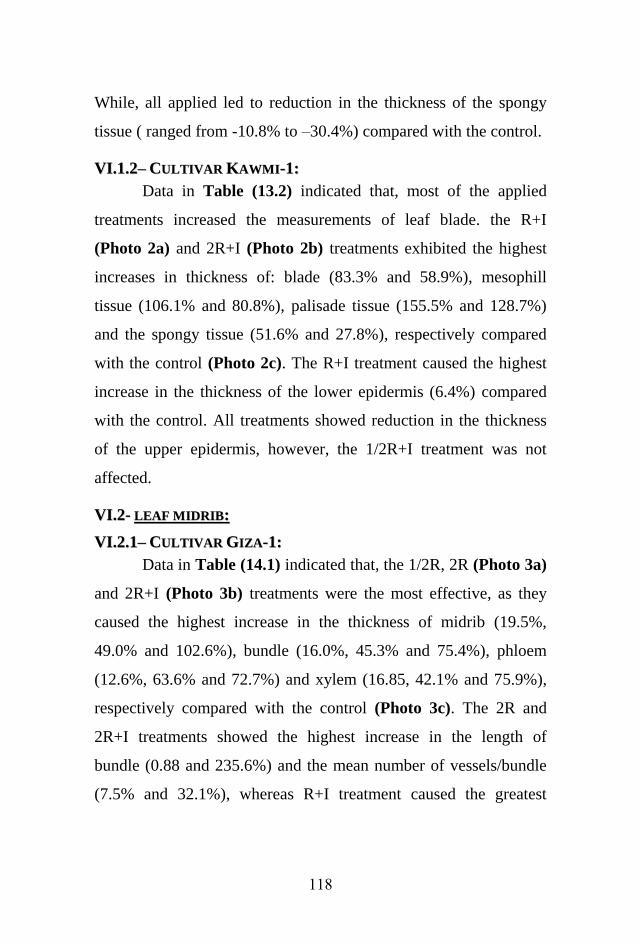
118
While, all applied led to reduction in the thickness of the spongy
tissue ( ranged from -10.8% to –30.4%) compared with the control.
VVII..11..22–– CCUULLTTIIVVAARR KKAAWWMMII--11::
Data in Table (13.2) indicated that, most of the applied
treatments increased the measurements of leaf blade. the R+I
(Photo 2a) and 2R+I (Photo 2b) treatments exhibited the highest
increases in thickness of: blade (83.3% and 58.9%), mesophill
tissue (106.1% and 80.8%), palisade tissue (155.5% and 128.7%)
and the spongy tissue (51.6% and 27.8%), respectively compared
with the control (Photo 2c). The R+I treatment caused the highest
increase in the thickness of the lower epidermis (6.4%) compared
with the control. All treatments showed reduction in the thickness
of the upper epidermis, however, the 1/2R+I treatment was not
affected.
VVII..22-- LLEEAAFF MMIIDDRRIIBB::
VVII..22..11–– CCUULLTTIIVVAARR GGIIZZAA--11::
Data in Table (14.1) indicated that, the 1/2R, 2R (Photo 3a)
and 2R+I (Photo 3b) treatments were the most effective, as they
caused the highest increase in the thickness of midrib (19.5%,
49.0% and 102.6%), bundle (16.0%, 45.3% and 75.4%), phloem
(12.6%, 63.6% and 72.7%) and xylem (16.85, 42.1% and 75.9%),
respectively compared with the control (Photo 3c). The 2R and
2R+I treatments showed the highest increase in the length of
bundle (0.88 and 235.6%) and the mean number of vessels/bundle
(7.5% and 32.1%), whereas R+I treatment caused the greatest

119
reduction in the length of bundle (-33.4%) and also, mean number
of vessels/bundle (-30.2%) compared with the control.
VVII..22..22–– CCUULLTTIIVVAARR KKAAWWMMII--11::
Data in Table (14.2) showed that, applying any of the
assigned treatments led to obvious increase in all characters under-
study. The R+I (Photo 4a) and 2R+I (Photo 4b) treatments
induced the highest increase in the thickness of midrib (191.0%
and249.8%), bundle (224.7% and 149.0%), phloem (552.9% and
362.8%), xylem (165.9% and 110.8%), diameter of the widest
vessel (57.4% and 41.2%) and the mean number of vessels/bundle
(67.5% and 42.5%), respectively compared with the control (Photo
4c). The 2R and 2R+I treatments caused the highest increase in the
length of bundle (448.8% and 488.8%) compared with the control
treatment, respectively.
VVII..33–– IINNTTEERRNNAALL SSTTRRUUCCTTUURREE OOFF TTHHEE SSTTEEMM::
VVII..33..11–– CCUULLTTIIVVAARR GGIIZZAA--11::
Data in Table (15.1) showed that, all applied treatments
increased the diameter of the hollow pith (17.8 to 360.8%) and the
diameter of the stem (13.3 to 47.2%), however, the 2R (Photo 5a) and
1/2R+I treatments exhibited the highest increase in this respect. Also,
all treatments increased the thickness of xylem tissue (15.4 to 97.4%),
the 2R+I (Photo 5b) and 1/2R treatments gave the highest increase
compared with the control (Photo 5c). However, all treatments
decreased the diameter of the widest vessel by - 33.4 to -63.2% and
the thickness of epidermis by -16.6 to -66.8%. On the other hand,
nearly all treatments increased the thickness of the stem wall (6.6 to
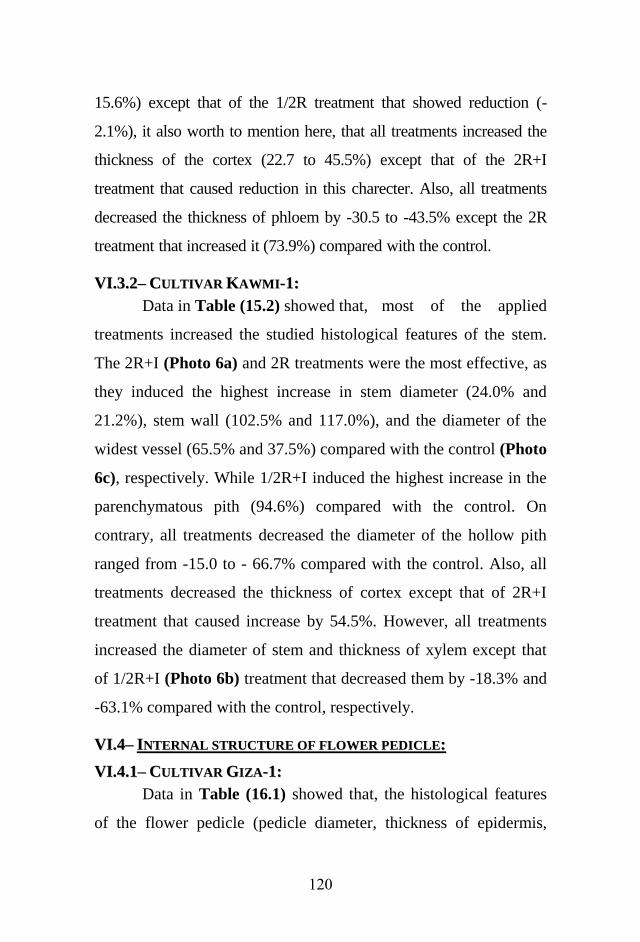
121
15.6%) except that of the 1/2R treatment that showed reduction (-
2.1%), it also worth to mention here, that all treatments increased the
thickness of the cortex (22.7 to 45.5%) except that of the 2R+I
treatment that caused reduction in this charecter. Also, all treatments
decreased the thickness of phloem by -30.5 to -43.5% except the 2R
treatment that increased it (73.9%) compared with the control.
VVII..33..22–– CCUULLTTIIVVAARR KKAAWWMMII--11::
Data in Table (15.2) showed that, most of the applied
treatments increased the studied histological features of the stem.
The 2R+I (Photo 6a) and 2R treatments were the most effective, as
they induced the highest increase in stem diameter (24.0% and
21.2%), stem wall (102.5% and 117.0%), and the diameter of the
widest vessel (65.5% and 37.5%) compared with the control (Photo
6c), respectively. While 1/2R+I induced the highest increase in the
parenchymatous pith (94.6%) compared with the control. On
contrary, all treatments decreased the diameter of the hollow pith
ranged from -15.0 to - 66.7% compared with the control. Also, all
treatments decreased the thickness of cortex except that of 2R+I
treatment that caused increase by 54.5%. However, all treatments
increased the diameter of stem and thickness of xylem except that
of 1/2R+I (Photo 6b) treatment that decreased them by -18.3% and
-63.1% compared with the control, respectively.
VVII..44–– IINNTTEERRNNAALL SSTTRRUUCCTTUURREE OOFF FFLLOOWWEERR PPEEDDIICCLLEE::
VVII..44..11–– CCUULLTTIIVVAARR GGIIZZAA--11::
Data in Table (16.1) showed that, the histological features
of the flower pedicle (pedicle diameter, thickness of epidermis,

121
cortex, phloem, xylem, diameter of pith and diameter of the widest
vessel) in cultivar Giza-1 were differently affected by the applied
treatments. The 1/2R+I, R+I, 2R and 2R+I treatments were the
most effective compared with R treatment (control) (Photo 7c). As,
the 2R+I (Photo 7a) treatment induced the highest increases in
pedicle diameter (12.3%), thickness of epidermis (33.3%), phloem
(60.4%), xylem (6.2%) and diameter of the widest vessel (33.5%),
whereas 2R caused the highest increase in thickness of cortex
(73.3%). On the contrary, the 1/2R treatment (Photo 7b) seems to
be the least effective treatment, as it led to reduction in the most of
the investigated features of the flower pedicle.
VVII..44..22–– CCUULLTTIIVVAARR KKAAWWMMII--11::
Against Giza-1, most of the investigated anatomical features
of the flower pedicle in cultivar Kawmi-1 were decreased by all
applied treatments (Table 16.2). The highest decreases in thickness
of cortex (- 61.9%) and phloem (- 57.1%) and mean number of
vessels/row (- 50.0%) were induced by 2R+I (Photo 8a), R+I and
2R, respectively. While, 1/2R+I caused the highest decrease in
diameter of pedicle (- 57.7%), thickness of xylem (- 80.3%),
diameter of pith (- 48.9%) and diameter of the widest vessel (-
64.8%). Among all measurements, only the thickness of epidermis
was increased with R+I, 2R and 2R+I by 64.4, 11.9% and 5.6%,
respectively, while, it was decreased by 1/2R (Photo 8b) (- 6.2%)
and not affected by 1/2R+I compared with R (control) (Photo 8
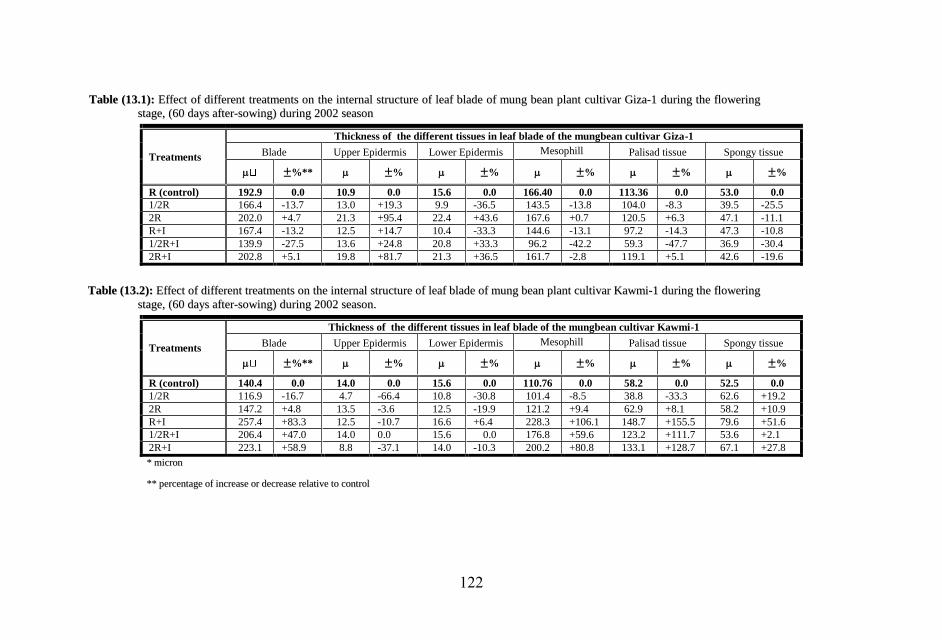
122
TTaabbllee ((1133..11)):: EEffffeecctt ooff ddiiffffeerreenntt ttrreeaattmmeennttss oonn tthhee iinntteerrnnaall ssttrruuccttuurree ooff lleeaaff bbllaaddee ooff mmuunngg bbeeaann ppllaanntt ccuullttiivvaarr GGiizzaa--11 dduurriinngg tthhee fflloowweerriinngg
ssttaaggee,, ((6600 ddaayyss aafftteerr--ssoowwiinngg)) dduurriinngg 22000022 sseeaassoonn
Treatments
Thickness of the different tissues in leaf blade of the mungbean cultivar Giza-1
Blade Upper Epidermis Lower Epidermis Mesophill Palisad tissue Spongy tissue
±%** ±% ±% ±% ±% ±%
R (control) 192.9 0.0 10.9 0.0 15.6 0.0 166.40 0.0 113.36 0.0 53.0 0.0
1/2R 166.4 -13.7 13.0 +19.3 9.9 -36.5 143.5 -13.8 104.0 -8.3 39.5 -25.5
2R 202.0 +4.7 21.3 +95.4 22.4 +43.6 167.6 +0.7 120.5 +6.3 47.1 -11.1
R+I 167.4 -13.2 12.5 +14.7 10.4 -33.3 144.6 -13.1 97.2 -14.3 47.3 -10.8
1/2R+I 139.9 -27.5 13.6 +24.8 20.8 +33.3 96.2 -42.2 59.3 -47.7 36.9 -30.4
2R+I 202.8 +5.1 19.8 +81.7 21.3 +36.5 161.7 -2.8 119.1 +5.1 42.6 -19.6
TTaabbllee ((1133..22)):: EEffffeecctt ooff ddiiffffeerreenntt ttrreeaattmmeennttss oonn tthhee iinntteerrnnaall ssttrruuccttuurree ooff lleeaaff bbllaaddee ooff mmuunngg bbeeaann ppllaanntt ccuullttiivvaarr KKaawwmmii--11 dduurriinngg tthhee fflloowweerriinngg
ssttaaggee,, ((6600 ddaayyss aafftteerr--ssoowwiinngg)) dduurriinngg 22000022 sseeaassoonn..
Treatments
Thickness of the different tissues in leaf blade of the mungbean cultivar Kawmi-1
Blade Upper Epidermis Lower Epidermis Mesophill Palisad tissue Spongy tissue
±%** ±% ±% ±% ±% ±%
R (control) 140.4 0.0 14.0 0.0 15.6 0.0 110.76 0.0 58.2 0.0 52.5 0.0
1/2R 116.9 -16.7 4.7 -66.4 10.8 -30.8 101.4 -8.5 38.8 -33.3 62.6 +19.2
2R 147.2 +4.8 13.5 -3.6 12.5 -19.9 121.2 +9.4 62.9 +8.1 58.2 +10.9
R+I 257.4 +83.3 12.5 -10.7 16.6 +6.4 228.3 +106.1 148.7 +155.5 79.6 +51.6
1/2R+I 206.4 +47.0 14.0 0.0 15.6 0.0 176.8 +59.6 123.2 +111.7 53.6 +2.1
2R+I 223.1 +58.9 8.8 -37.1 14.0 -10.3 200.2 +80.8 133.1 +128.7 67.1 +27.8
** mmiiccrroonn
**** ppeerrcceennttaaggee ooff iinnccrreeaassee oorr ddeeccrreeaassee rreellaattiivvee ttoo ccoonnttrrooll

123
Pt
= P
alis
ad t
issu
e
St
= S
pongy t
issu
e
Photo (1): Effect of NPK fertilization treatments 2R (A), 2R+I (B)
and R control (C) on the anatomical structure of leaf blade of
the mung bean plant cultivar Giza-1. (100X).
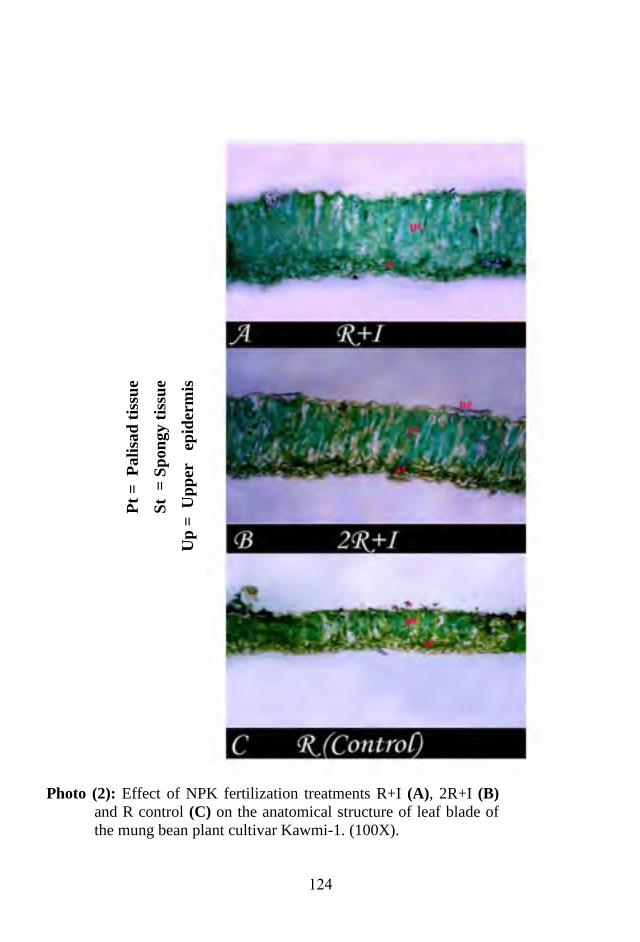
124
Pt
= P
ali
sad
tis
sue
St
= S
pon
gy t
issu
e
Up
= U
pp
er e
pid
erm
is
Photo (2): Effect of NPK fertilization treatments R+I (A), 2R+I (B)
and R control (C) on the anatomical structure of leaf blade of
the mung bean plant cultivar Kawmi-1. (100X).
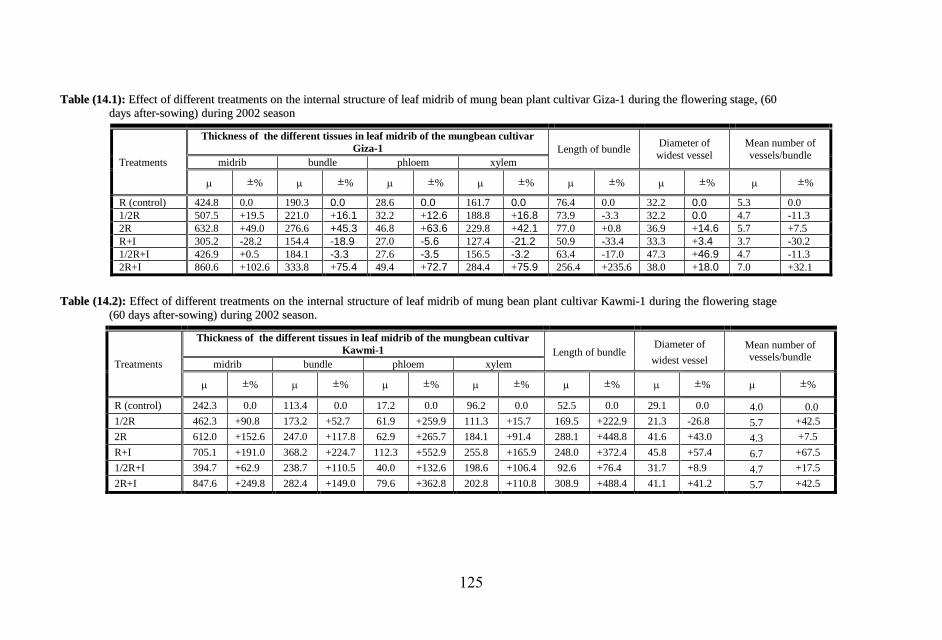
125
TTaabbllee ((1144..11)):: EEffffeecctt ooff ddiiffffeerreenntt ttrreeaattmmeennttss oonn tthhee iinntteerrnnaall ssttrruuccttuurree ooff lleeaaff mmiiddrriibb ooff mmuunngg bbeeaann ppllaanntt ccuullttiivvaarr GGiizzaa--11 dduurriinngg tthhee fflloowweerriinngg ssttaaggee,, ((6600
ddaayyss aafftteerr--ssoowwiinngg)) dduurriinngg 22000022 sseeaassoonn
Thickness of the different tissues in leaf midrib of the mungbean cultivar
Giza-1 Length of bundle Diameter of
widest vessel
Mean number of
vessels/bundle Treatments midrib bundle phloem xylem
±% ±% ±% ±% ±% ±% ±%
R (control) 424.8 0.0 190.3 0.0 28.6 0.0 161.7 0.0 76.4 0.0 32.2 0.0 5.3 0.0
1/2R 507.5 +19.5 221.0 +16.1 32.2 +12.6 188.8 +16.8 73.9 -3.3 32.2 0.0 4.7 -11.3
2R 632.8 +49.0 276.6 +45.3 46.8 +63.6 229.8 +42.1 77.0 +0.8 36.9 +14.6 5.7 +7.5
R+I 305.2 -28.2 154.4 -18.9 27.0 -5.6 127.4 -21.2 50.9 -33.4 33.3 +3.4 3.7 -30.2
1/2R+I 426.9 +0.5 184.1 -3.3 27.6 -3.5 156.5 -3.2 63.4 -17.0 47.3 +46.9 4.7 -11.3
2R+I 860.6 +102.6 333.8 +75.4 49.4 +72.7 284.4 +75.9 256.4 +235.6 38.0 +18.0 7.0 +32.1
TTaabbllee ((1144..22)):: EEffffeecctt ooff ddiiffffeerreenntt ttrreeaattmmeennttss oonn tthhee iinntteerrnnaall ssttrruuccttuurree ooff lleeaaff mmiiddrriibb ooff mmuunngg bbeeaann ppllaanntt ccuullttiivvaarr KKaawwmmii--11 dduurriinngg tthhee fflloowweerriinngg ssttaaggee
((6600 ddaayyss aafftteerr--ssoowwiinngg)) dduurriinngg 22000022 sseeaassoonn..
Thickness of the different tissues in leaf midrib of the mungbean cultivar
Kawmi-1 Length of bundle Diameter of
widest vessel
Mean number of vessels/bundle
Treatments midrib bundle phloem xylem
±% ±% ±% ±% ±% ±% ±%
R (control) 242.3 0.0 113.4 0.0 17.2 0.0 96.2 0.0 52.5 0.0 29.1 0.0 4.0 0.0
1/2R 462.3 +90.8 173.2 +52.7 61.9 +259.9 111.3 +15.7 169.5 +222.9 21.3 -26.8 5.7 +42.5
2R 612.0 +152.6 247.0 +117.8 62.9 +265.7 184.1 +91.4 288.1 +448.8 41.6 +43.0 4.3 +7.5
R+I 705.1 +191.0 368.2 +224.7 112.3 +552.9 255.8 +165.9 248.0 +372.4 45.8 +57.4 6.7 +67.5
1/2R+I 394.7 +62.9 238.7 +110.5 40.0 +132.6 198.6 +106.4 92.6 +76.4 31.7 +8.9 4.7 +17.5
2R+I 847.6 +249.8 282.4 +149.0 79.6 +362.8 202.8 +110.8 308.9 +488.4 41.1 +41.2 5.7 +42.5
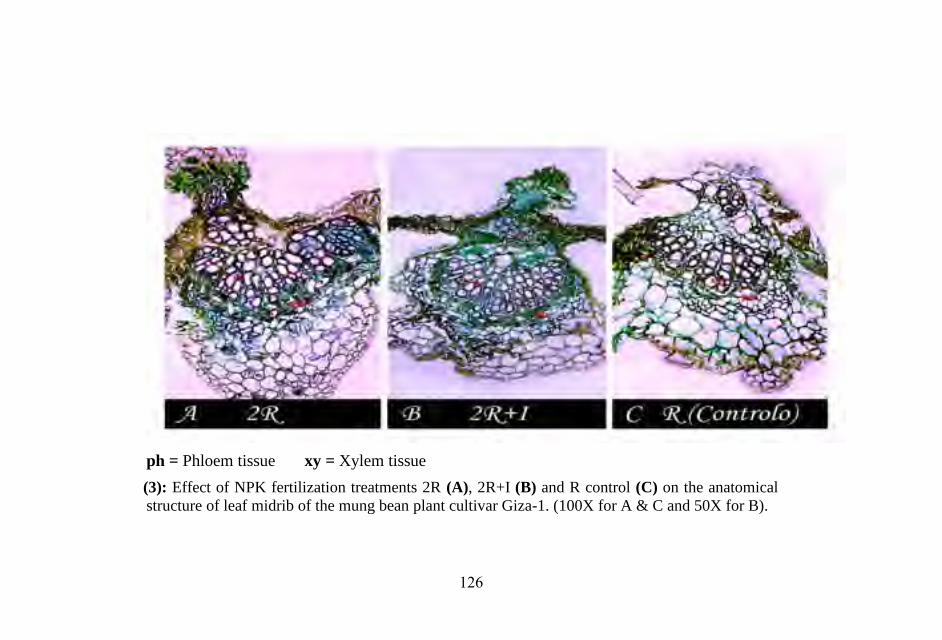
126
ph = Phloem tissue xy = Xylem tissue
Photo (3): Effect of NPK fertilization treatments 2R (A), 2R+I (B) and R control (C) on the anatomical
structure of leaf midrib of the mung bean plant cultivar Giza-1. (100X for A & C and 50X for B).
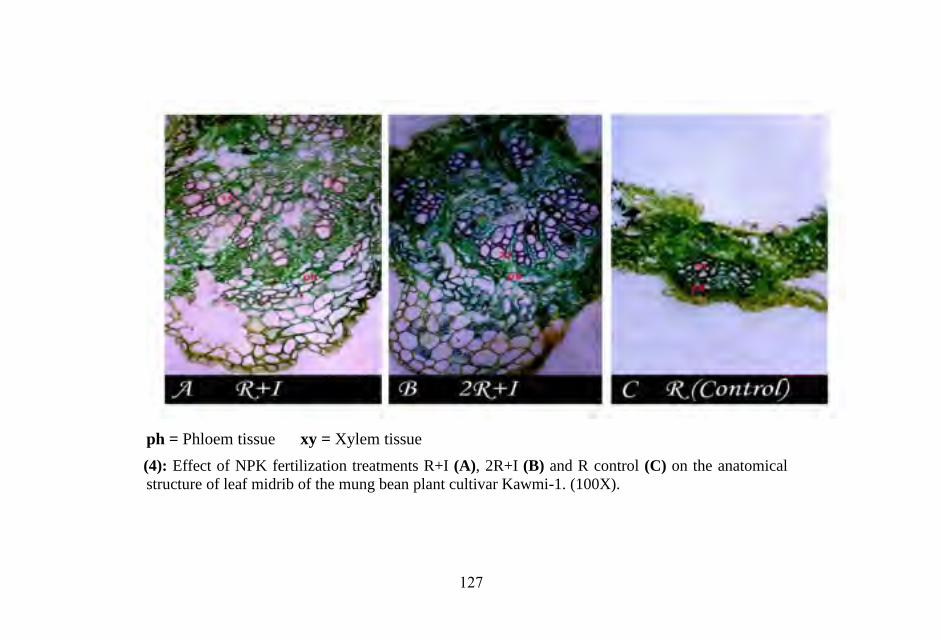
127
ph = Phloem tissue xy = Xylem tissue
Photo (4): Effect of NPK fertilization treatments R+I (A), 2R+I (B) and R control (C) on the anatomical
structure of leaf midrib of the mung bean plant cultivar Kawmi-1. (100X).

128
TTaabbllee ((1155..11)):: EEffffeecctt ooff ddiiffffeerreenntt ttrreeaattmmeennttss oonn tthhee iinntteerrnnaall ssttrruuccttuurree ooff tthhee mmaaiinn sstteemm ooff mmuunngg bbeeaann ppllaanntt ccuullttiivvaarr GGiizzaa--11 dduurriinngg tthhee fflloowweerriinngg ssttaaggee,, ((6600 ddaayyss
aafftteerr--ssoowwiinngg)) dduurriinngg 22000022 sseeaassoonn
Treatments
Thickness of the different tissues in stem of the mungbean cultivar Giza-1 Diameter of
hollow pith
Diameter of
widest vessel Diameter of Stem Stem Wall Epidermis Cortex Phloem Xylem Paranchymatous
Pith
±% ±% ±% ±% ±% ±% ±% ±% ±%
R (control) 3.052 0.0 1373.8 0.0 34.3 0.0 297.4 0.0 143.5 0.0 464.9 0.0 433.7 0.0 304.7 0.0 87.4 0.0
1/2R 3.522 +15.4 1344.9 -2.1 11.4 -66.8 365.0 +22.7 93.6 -34.8 834.4 +79.5 - - 832.0 +173.1 58.2 -33.4
2R 4.492 +47.2 1684.3 +22.6 22.9 -33.2 405.5 +36.3 249.6 +73.9 596.0 +28.2 410.3 -5.4 1404.0 +360.8 51.0 -41.6
R+I 3.583 +17.4 1464.5 +6.6 17.2 -49.9 392.0 +31.8 81.1 -43.5 536.4 +15.4 437.8 +0.9 654.2 +114.7 32.2 -63.2
1/2R+I 4.242 +39.0 1588.2 +15.6 28.6 -16.6 432.6 +45.5 93.6 -34.8 643.4 +38.4 390.0 -10.1 1066.0 +249.9 37.4 -57.2
2R+I 3.457 +13.3 1549.1 +12.8 34.3 0.0 283.9 -4.5 99.8 -30.5 917.9 +97.4 213.2 -50.8 358.8 +17.8 44.7 -48.9
TTaabbllee ((1155..22)):: EEffffeecctt ooff ddiiffffeerreenntt ttrreeaattmmeennttss oonn tthhee iinntteerrnnaall ssttrruuccttuurree ooff tthhee mmaaiinn sstteemm ooff mmuunngg bbeeaann ppllaanntt ccuullttiivvaarr KKaawwmmii--11 dduurriinngg tthhee fflloowweerriinngg ssttaaggee,, ((6600
ddaayyss aafftteerr--ssoowwiinngg)) dduurriinngg 22000022 sseeaassoonn..
Thickness of the different tissues in stem of the mungbean cultivar Kawmi-1 Diameter of
hollow pith
Diameter of
widest vessel Diameter of Stem Stem Wall Epidermis Cortex Phloem Xylem Paranchymatous
Pith
Treatments mm ±% ±% ±% ±% ±% ±% ±% ±% ±%
R (control) 2.556 0.0 654.1 0.0 18.7 0.0 94.6 0.0 81.1 0.0 187.2 0.0 272.5 0.0 1248.0 0.0 33.3 0.0
1/2R 2.757 +7.8 1170.4 +78.9 37.4 +100.0 43.0 -54.5 135.2 +66.7 565.8 +202.2 389.0 +42.8 416.0 -66.7 38.5 +15.6
2R 3.098 +21.2 1419.1 +117.0 49.9 +166.8 44.7 -52.7 70.3 -13.3 422.2 +125.5 832.0 +205.3 260.0 -79.2 45.8 +37.5
R+I 2.841 +11.1 890.2 +36.1 24.9 +33.2 34.4 -63.6 108.1 +33.3 286.0 +52.8 436.8 +60.3 1060.8 -15.0 41.6 +24.9
1/2R+I 2.087 -18.3 679.7 +3.9 31.2 +66.8 27.5 -70.9 21.6 -73.4 69.0 -63.1 530.4 +94.6 728.0 -41.7 36.4 +9.3
2R+I 3.169 +24.0 1324.6 +102.5 43.6 +133.2 146.2 +54.5 86.5 +6.7 757.1 +304.4 291.2 +6.9 520.0 -58.3 55.1 +65.5
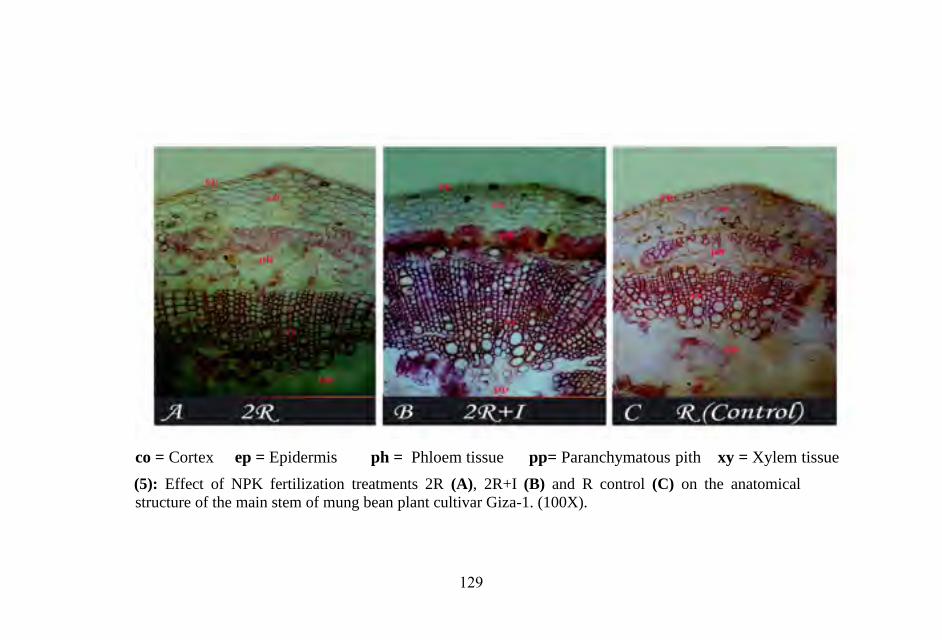
129
co = Cortex ep = Epidermis ph = Phloem tissue pp= Paranchymatous pith xy = Xylem tissue
Photo (5): Effect of NPK fertilization treatments 2R (A), 2R+I (B) and R control (C) on the anatomical
structure of the main stem of mung bean plant cultivar Giza-1. (100X).

131
co = Cortex ep = Epidermis ph = Phloem tissue pp = Paranchymatous pith xy = Xylem tissue
Photo (6): Effect of NPK fertilization treatments 2R+I (A), 1/2R+I (B) and R control (C) on the anatomical
structure of the main stem of mung bean plant cultivar Kawmi-1. (100X).
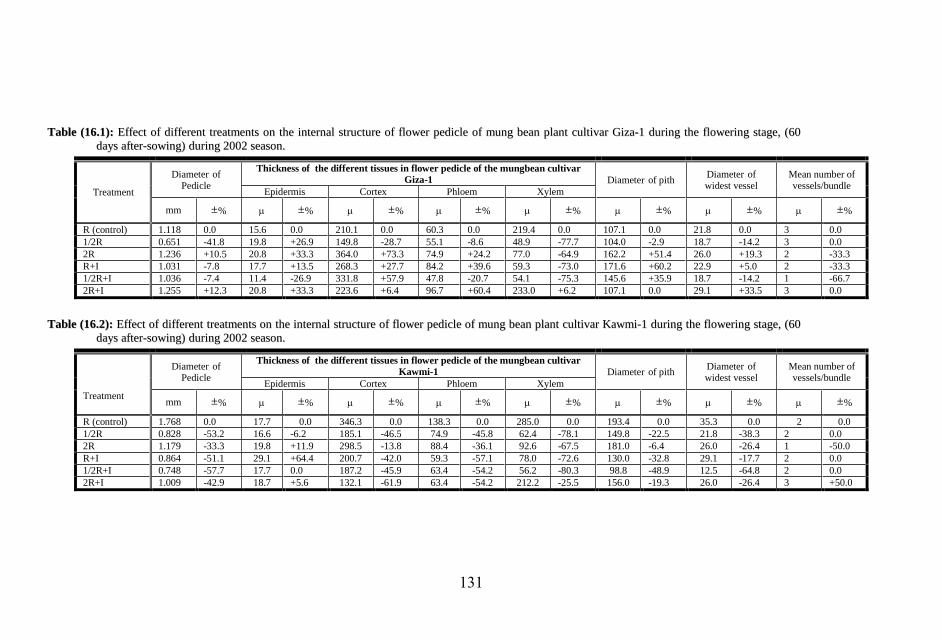
131
TTaabbllee ((1166..11)):: EEffffeecctt ooff ddiiffffeerreenntt ttrreeaattmmeennttss oonn tthhee iinntteerrnnaall ssttrruuccttuurree ooff fflloowweerr ppeeddiiccllee ooff mmuunngg bbeeaann ppllaanntt ccuullttiivvaarr GGiizzaa--11 dduurriinngg tthhee fflloowweerriinngg ssttaaggee,, ((6600
ddaayyss aafftteerr--ssoowwiinngg)) dduurriinngg 22000022 sseeaassoonn..
Treatment Diameter of
Pedicle
Thickness of the different tissues in flower pedicle of the mungbean cultivar
Giza-1 Diameter of pith Diameter of widest vessel
Mean number of vessels/bundle
Epidermis Cortex Phloem Xylem
mm ±% ±% ±% ±% ±% ±% ±% ±%
R (control) 1.118 0.0 15.6 0.0 210.1 0.0 60.3 0.0 219.4 0.0 107.1 0.0 21.8 0.0 3 0.0
1/2R 0.651 -41.8 19.8 +26.9 149.8 -28.7 55.1 -8.6 48.9 -77.7 104.0 -2.9 18.7 -14.2 3 0.0
2R 1.236 +10.5 20.8 +33.3 364.0 +73.3 74.9 +24.2 77.0 -64.9 162.2 +51.4 26.0 +19.3 2 -33.3
R+I 1.031 -7.8 17.7 +13.5 268.3 +27.7 84.2 +39.6 59.3 -73.0 171.6 +60.2 22.9 +5.0 2 -33.3
1/2R+I 1.036 -7.4 11.4 -26.9 331.8 +57.9 47.8 -20.7 54.1 -75.3 145.6 +35.9 18.7 -14.2 1 -66.7
2R+I 1.255 +12.3 20.8 +33.3 223.6 +6.4 96.7 +60.4 233.0 +6.2 107.1 0.0 29.1 +33.5 3 0.0
TTaabbllee ((1166..22)):: EEffffeecctt ooff ddiiffffeerreenntt ttrreeaattmmeennttss oonn tthhee iinntteerrnnaall ssttrruuccttuurree ooff fflloowweerr ppeeddiiccllee ooff mmuunngg bbeeaann ppllaanntt ccuullttiivvaarr KKaawwmmii--11 dduurriinngg tthhee fflloowweerriinngg ssttaaggee,, ((6600
ddaayyss aafftteerr--ssoowwiinngg)) dduurriinngg 22000022 sseeaassoonn..
Diameter of
Pedicle
Thickness of the different tissues in flower pedicle of the mungbean cultivar
Kawmi-1 Diameter of pith Diameter of widest vessel
Mean number of vessels/bundle
Epidermis Cortex Phloem Xylem
Treatment mm ±% ±% ±% ±% ±% ±% ±% ±%
R (control) 1.768 0.0 17.7 0.0 346.3 0.0 138.3 0.0 285.0 0.0 193.4 0.0 35.3 0.0 2 0.0
1/2R 0.828 -53.2 16.6 -6.2 185.1 -46.5 74.9 -45.8 62.4 -78.1 149.8 -22.5 21.8 -38.3 2 0.0
2R 1.179 -33.3 19.8 +11.9 298.5 -13.8 88.4 -36.1 92.6 -67.5 181.0 -6.4 26.0 -26.4 1 -50.0
R+I 0.864 -51.1 29.1 +64.4 200.7 -42.0 59.3 -57.1 78.0 -72.6 130.0 -32.8 29.1 -17.7 2 0.0
1/2R+I 0.748 -57.7 17.7 0.0 187.2 -45.9 63.4 -54.2 56.2 -80.3 98.8 -48.9 12.5 -64.8 2 0.0
2R+I 1.009 -42.9 18.7 +5.6 132.1 -61.9 63.4 -54.2 212.2 -25.5 156.0 -19.3 26.0 -26.4 3 +50.0

132
co = Cortex ep = Epidermis ph = Phloem tissue p = Pith xy = Xylem tissue
Photo (7): Effect of NPK fertilization treatments 2R+I (A), 1/2R (B) and R control (C) on the anatomical
structure of the flower pedicle of the mung bean plant cultivar Giza-1. (100X).

133
co = Cortex ep = Epidermis ph = Phloem tissue pp = Pith xy = Xylem tissue
Photo (8): Effect of NPK fertilization treatments 2R+I (a), 1/2R (b) and R control (c) on the anatomical
structure of the flower pedicle of the mung bean plant cultivar Kawmi-1. (100X).
134
DISCUSSION
I- Effect of NPK fertilization levels on the vegetative and
reproductive growth:
Inoculation of seeds with Rhizobium and/or increasing the
applied level of the N, P and/or K fetilizers led to significant
improvement in growth, yield and yield attributes of mung beans
(Patel et al., (1988); Badole and Umale, 1994 & 1995).
Anbumani et al., (2003) found that, the biological nitrogen fixation
in green gram is considered to be the main source of nitrogen in
pulses, and with the onset of reproductive phase. Tanwar et al.,
(2003) stated that, inoculation with efficient rhizobia culture to
different legumes is a common agronomic practice for enhancing
pulse production.
Khamparia (1995) recorded that the total dry matter
production and seed yields of mung [Vigna radiata] were increased
by P application alone or in combination with microphos
inoculation. The yield and yield components increased also by
increasing N application to ranges between 20 to 50 Kg N /ha
(Basu and Bandyopadhyay 1990; Leelavathi, et al., 1990;
Ardeshna et al., 1993; Singh, et al., 1993; Bachchhav et al.,
1994; Rawankar, et al., 1997; Maldal and Ray, 1999. Tanwar et
al., (2003) stated that, phosphorus application might resulted in root
proliferation and increases density of root nodules of black gram
(Vigna mungo), which in turn resulted in higher microbial activities
in the root and hence better availability of N and P to the plant.

135
Application of phosphorus up to 60 Kg P2O5/ha increased seed and
straw yield by 39.0 and 27.7%, N and P contents in grains by 14.27
and 41.84% and by 13.77 and 29.34% in straw, respectively, more
than the control. This resulted in increased N and P uptake by
grains. Yeman and Skjelvag (2003) stated that, P is needed in
relatively large amounts for growth and nitrogen fixation and has
been reported to promote leaf area, biomass, etc. in a number of
legumes.
The present results proved that the double recommended dose
of NPK fertilizers with or without inoculation (2R+I & 2R treatments,
respectively) and the recommended dose with inoculation (R+I) were
the best treatments for improving the vegetative growth of the two
assigned mung bean cultivars (Giza-1 and Kawmi-1) The superiority
of these treatments varied, in general, at the different plant growth
stages viz. 30, 60 and 90 days after sowing. Most of the vegetative
growth characters viz. plant leaves (number, fresh and dry weight and
leaf area), stem (fresh and dry weight, length and diameter), roots
(fresh and dry weight, length and volume), number of branches and
inflorescences/plant were improved by the above three mentioned
treatments better than R (control). As for yield and yield attributes,
The 2R+I treatment produced the highest pod diameter, number of
fruits, pod weight and weight of seeds/plant during both 2001 & 2002
whereas the 2R treatment produced the highest pod length and number
of seeds/plant. The R+I treatment significantly increased number of
fruits and seeds and weight of seeds/plant in 2001 and weight of

136
fruits/plant in both seasons compared with R (control). The trend of
results tend to be similar in both cultivars i.e. Giza-1 and Kawmi-1.
These results are in agreement with those obtained by several
previous investigations. The highest growth and/or yield parameters of
mung bean (Vigna radiata L.) was obtained by rates of P application
ranged between 30 to 120 Kg P2O5/ha {Ahmed et al., 1986; Basu et
al., 1989, Gupta and Rai, 1989; Chovatia et al., 1993; Asghar et al.,
1996; Mishra et al., 1998 and Teotia et al., 2000}. The suitable P
level might be depended on source of fertilizers, method of
application, plant genotypes, soil fertility and other environmental and
experimental factors (Reddy et al., (1990); Rajput et al., (1992);
Thind et al., (1993); Patro and Sahoo (1994); Battacharya and Ali
(2002) and Kumar and Puri, 2002).
Bali et al., (1991) obtained the highest seed yield of V.
radiata, 1000-seed wt and LAI by using 40 kg N and 60 kg
P2O5/ha. Narayanan, et al., (1991) stated that the high fertility
level (NPK at 50 + 44 + 84 kg/ha) increased dry matter production
and the AGR of green gram [Vigna radiata] (plants aged 45 days),
but did not change the RGR compared with the recommended
(NPK at 25 + 22 + 42 kg/ha) level. Patel and Patel, (1994) found
that seed yield of green gram [Vigna radiata] was high at 20 kg N +
40 kg P2O5/ha (recommended rate) whereas 25 or 50% of the
recommended N + P rate significantly decreased seed yield.
Gajendra and Singh, (1995) reported that yield was the highest
(0.52 t) with 20 kg N + 40 kg P2O5. Asghar et al., (1996) studied

137
effects of basal dose of 20 kg N and 50 kg P2O5/ha combined with
different K levels (0, 25, 50, 75, 100 and 125 kg/ha) on yield and
quality of mung beans. The number of pods/plant and number of
seeds/pod, seed yield/ha were influenced significantly by K
application. The highest seed yield was obtained with application of
75 kg K2O/ha. Saxena et al., (1996) showed that, seed yield of
green gram [Vigna radiata] was the highest with 60 kg P2O5 in
1988, and increased with increasing P levels up to 30 kg P2O5 1989.
In both seasons, seed yield was the highest with 20 kg K2O. In 1988
the application of 60 kg P2O5 + 20 kg K2O gave the highest seed
yield. Seed yield was positively correlated with number of pods,
seed yield/plant, 1000-seed weight and harvest index. Mandal and
Sikder (1999) indicated that, mung beans (Vigna radiata) grown in
saline soil, given 0, 50 or 100 kg N/ha and 0, 75 or 150 kg P/ha.
The growth and yield were significantly increased with N
application, while P significantly increased the setting of pods and
seeds. Root growth was significantly improved by individual and
combined application of the fertilizers. Interactions of the fertilizers
stimulated the formation of pods and seeds together with seed yield.
Kumar and Chandra (2003) showed also that, P
application significantly increased the plant dry matter and seed
yield of mung bean (Vigna radiate) more than that without P
application. The seed yield/ha was increased to 600, 613, 683 and
700 Kg/ha by applying 0, 25, 50 and 75 Kg/ha of P2O5,
respectively. Meena et al., (2003) recorded that, the grain and
138
straw yields and total uptake of N, P and K in chick pea (Cicer
arietinum) plants were significantly increased with the increase of
phosphorus levels from 0 to 60 Kg P2O5/ha. However, the data
particularly of the seeds and straw yields that recorded at 30 and 60
Kg P2O5/ha were significantly equal. Yeman and Skjelvag (2003)
found that, P application increased leaf area of Pisum sativum,
which closely related to the number of branches, which in turn
increased the total number of leaves, but it could be also
attributable to the increase in leaf expansion rate. The increase in P
application accompanied with increases in biomass, which resulted
in enlarged leaf area, which determines the amount of solar
radiation intercepted, and consequently the amount of dry matter
produced. Phosphorus can also improve the rate of assimilate
production per unit of leaf area, as it is involved in photosynthetic
energy transfer process. Hence, the increase in biomass with an
improved P supply could be attributed to both the size and the
efficiency of the assimilatory apparatus.
II- Effect of NPK fertilization levels on the photosynthetic
pigments:
The obtained results indicated that, the R+I treatment in
cultivar Giza-1 and 2R and 2R+I in cultivar Kawmi-1, in general,
caused the highest increase in chlorophylls, carotenoids and total
pigments at 30 days after sowing. Whereas, the 2R+I and R+I
(cultivar Giza-1) and R+I (cultivar Kawmi-1) were the best
treatments for increasing all estimated leaf photosynthetic pigments

139
60 days after sowing compared with R (control). These results are
in agreement with Maiti et al., (1988) who recorded that
application of 50 kg N/ha increased leaf chlorophyll contents in
green gram [Vigna radiata]. Reddy et al., (1989) showed also that,
P. radiatus [Vigna radiata] and P. mungo [V. mungo] given 0 or
21.9 kg P/ha as a basal dressing or split equally between a basal
application and flowering. P application increased the energy
content of the whole plant in both species, especially when applied
in split doses. Split P application also increased photosynthetic
efficiency in the two species compared with the single application.
Ghildiyal (1992) recorded that, the rate of photosynthesis of Vigna
radiata plants was declined after flowering in control plants but
remained constant till 20 days after flowering in urea-treated plants.
Garcia et al., (1994) suggested that fertilizer application to the
mung bean plants could be effective only when applied during the
seedling stage when the infection process is just beginning and
during the seed-filling stage when the nodules are already senescing
and large amounts of N are being mobilized to the developing pod.
It was also demonstrated that the upper leaves were the major
source of photoassimilates for nodule growth and nodule enzyme
activity in mung beans.
III- Effect of NPK fertilization levels on the N, P and K conents
in the different plant organs:
The improvement in the estimated growth and yield
characters seemed to be correlated directly with accumulation of N,

141
P and K contents in different organs of mung bean plants. The
obtained results indicated that, at the young growth stage (30 DAS),
the 1/2/R treatment accumulated the highest N, P, K and the total
crude protein contents in cultivar Giza-1, and N and total crude
protein in cultivar Kawmi-1, compared with R (control). While, the
2R treatment accumulated the highest P and K contents in the later
cultivar. The chemical composition of the different plant parts 30 and
60 days after sowing was considerably varied in the two cultivars. In
cultivar Giza-1, the R+I treatment accumulated the highest N and CP
in stem, P and K in roots (60 DAS) and N, P, K and crude protein
(CP) in all plant parts (90 DAS). In pods of cultivar Giza-1, the
1/2R+I and 2R+I treatments only increased the K content whereas N,
P and CP were decreased by other applied treatments. While in
cultivar Kawmi-1, the 2R treatment accumulated highest N and CP
in leaves and roots (60 DAS), N, P, K and CP (60 DAS) and N and
CP (90 DAS) in leaves, N and CP in stem and K in leaves and stem
(90 DAS) compared with the control. In fruits of cultivar Kawmi-1,
the 1/2R treatment caused the highest increases in N, P, K, and CP
whereas, the 2R, 1/2R+I and 2R+I decreased the P and K contents
compared with the control.
These results holds fairly good with Kamat et al., (1986)
who recorded that application of 50 kg P2O5/ha to mung bean
[Vigna radiata] and urd [V. mungo] increased N, P and K uptake
and seed protein content. Mahadkar and Saraf (1988a) studied
the changes in N and P contents and uptake in leaves and stems of

141
Vigna radiata at different growth stages as affected by N and P
application. N content was higher in the leaves than in stems while
P content was the same in the two organs. N and P contents were
the highest at 45 and 30 days after sowing, resp. Application of N
and P fertilizers increased N and P contents in seeds; 40 kg P2O5/ha
was the most effective. Basu and Bandyopadhyay (1990)
recorded that, Vigna radiata given 0-40 kg N/ha. N uptake was
increased also with increasing N rates up to 30 kg N/ha. N uptake
decreased at the highest N application rate. Narayanan et al.,
(1991) assessed growth and nutrient uptake in plants aged 45 days
of green gram [Vigna radiata] at recommended (N + P + K at 25 +
22 + 42 kg/ha) and high (NPK at 50 + 44 + 84 kg/ha) fertility levels
(RF and HF, respectively). HF increased the N, P and K uptake but
decreased their utilization efficiency (dry matter production/unit
nutrient per week). Sharma et al., (1993) stated that, N, P, K and S
uptake of Vigna radiata cv. Pusa Baisakhee was increased due to
increasing P application rate. Hoshiyar et al., (1994) showed that
seed and straw contents of N and P, crude protein content of seed,
and total N and P uptake, were increased by P fertilizer and
Rhizobium. Asghar et al., (1996) used different K levels (0, 25, 50,
75, 100 and 125 kg/ha) each with basal dose of 20 kg N and 50 kg
P2O5/ha for mungbeans. The seed protein contents were influenced
significantly by K application. Deka and Kakati (1996) recorded
that the V. radiata cv. K-851 plants given 0-60 kg P2O5/ha. Total N
and P uptake at harvest were increased significantly with up to 40
kg P2O5/ha. Bharti et al., (2000) found that green gram responded

142
well to higher doses of N (0, 18.75, 25 kg N/ha) and P (0, 37.50, 50
kg P/ha) fertilizers for nutrient uptake and content. Chowdhury et
al., (2000) mentioned that, dry matter accumulation after flowering
greatly influenced seed yield, as most of the photosynthate
produced at this stage is used for pod and seed development. Seeds
contributed the majority of dry matter content at harvest. Meena et
al., (2003) found that, the seed and straw yields and total uptake of
N, P and K in check pea (Cicer arietinum) plants were significantly
increased with the increase of phosphorus levels from 0 to 60 Kg
P2O5/ha. However, the data particularly seed and straw yields that
recorded at 30 and 60 Kg P2O5/ha were significantly equal.
IV- Effect of NPK fertilization levels on the sugar contents in
the different plant organs:
At the young growth stage (30 DAS), most of the applied
treatments increased the non-reducing sugars while decreased the
reducing and total sugars, the 1/2R treatment, in general, caused the
highest increases in both non-reducing and total sugars in plants of
Giza-1 compared with the control. On contrary, most of the applied
treatments increased the sugar contents in Kawmi-1. The 1/2R+I
and 2R+I and 2R treatments induced the highest increase in
reducing, non-reducing and total sugars, respectively. However, the
1/2R+I and 2R+I treatments decreased the reducing sugars and
non-reducing sugars, respectively compared with the control.
In leaves of cultivar Giza-1, the 1/2R, 2R and 2R+I
treatments respectively induced the highest increase in the reducing
143
and total sugars (60 and 90 DAS). Whereas, the non-reducing
sugars were increased by the application of 1/2R+I and 2R+I (at 60
DAS) and 1/2R and 2R (at 90 DAS). As for leaves of cultivar
Kawmi-1, most treatments increased the non-reducing sugars and
decreased the reducing sugars, the highest increase was induced by
the 1/2R and 2R+I treatments at 60 and 90 DAS, respectively.
Moreover, all treatments particularly the 2R+I (90 DAS) induced
the highest increase in the total sugars.
Most applied treatments increased sugar contents in stems of
cultivar Giza-1 at 60 DAS and decreased it at 90 DAS. The highest
increase was induced by the R+I (reducing and total sugars), the
2R+I (non-reducing sugars) at 60 DAS and the 2R (reducing
sugars) at 90 DAS. On contrary, most tested treatments decreased
sugar contents in stems of cultivar Kawmi-1, at 60 and 90 DAS
compared with the control. The 1/2R and 1/2R+I only increased the
reducing sugars (60 DAS) and the 2R+I treatment only increased
the non-reducing sugars (90 DAS) compared with the control.
All applied treatments increased the reducing, non-reducing
and total sugars in roots of cultivar Giza-1 particularly at 90 DAS,
the highest increase was induced by the 2R+I and R+I at 60 and 90
DAS, respectively compared with R (control). The opposite trend, in
general, was noted in roots of cultivar Kawmi-1, as all treatments
decreased the reducing sugars (60 and 90 DAS) and total sugars (90
DAS), whereas most tested treatments increased the non-reducing
sugars. The R+I and 2R+I showed the highest non-reducing and total
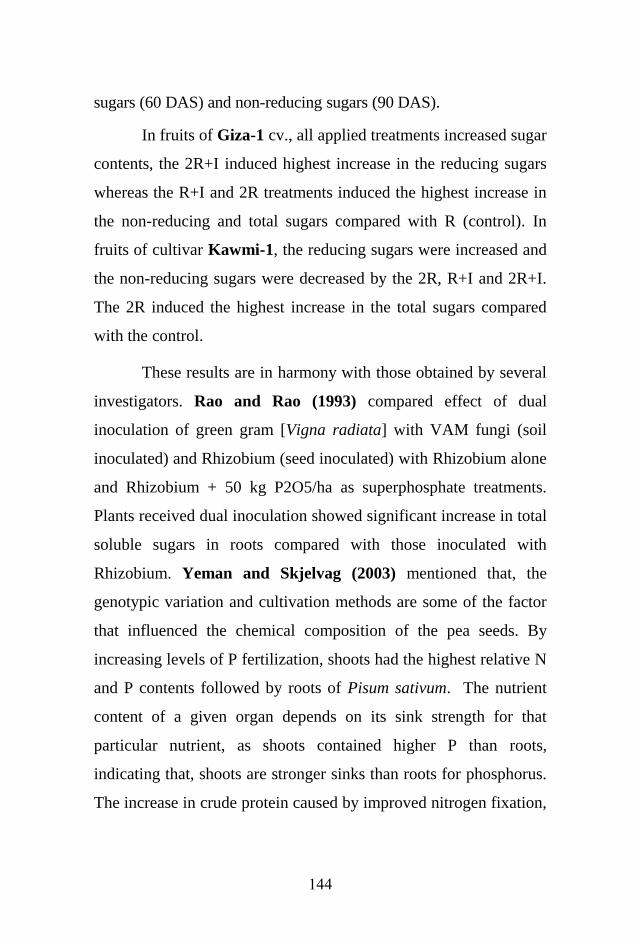
144
sugars (60 DAS) and non-reducing sugars (90 DAS).
In fruits of Giza-1 cv., all applied treatments increased sugar
contents, the 2R+I induced highest increase in the reducing sugars
whereas the R+I and 2R treatments induced the highest increase in
the non-reducing and total sugars compared with R (control). In
fruits of cultivar Kawmi-1, the reducing sugars were increased and
the non-reducing sugars were decreased by the 2R, R+I and 2R+I.
The 2R induced the highest increase in the total sugars compared
with the control.
These results are in harmony with those obtained by several
investigators. Rao and Rao (1993) compared effect of dual
inoculation of green gram [Vigna radiata] with VAM fungi (soil
inoculated) and Rhizobium (seed inoculated) with Rhizobium alone
and Rhizobium + 50 kg P2O5/ha as superphosphate treatments.
Plants received dual inoculation showed significant increase in total
soluble sugars in roots compared with those inoculated with
Rhizobium. Yeman and Skjelvag (2003) mentioned that, the
genotypic variation and cultivation methods are some of the factor
that influenced the chemical composition of the pea seeds. By
increasing levels of P fertilization, shoots had the highest relative N
and P contents followed by roots of Pisum sativum. The nutrient
content of a given organ depends on its sink strength for that
particular nutrient, as shoots contained higher P than roots,
indicating that, shoots are stronger sinks than roots for phosphorus.
The increase in crude protein caused by improved nitrogen fixation,

145
meanwhile, total sugars declined with the increasing of phosphorus
application rate. The change in total sugars contents was
collectively greater than the increase in crude protein, so, it could
attributed to the demand for carbon skeleton and energy for protein
synthesis could be responsible for the decrease in the concentration
of these compounds.
V- Effect of NPK fertilization levels on the internal structure of
the leave, stems and the pedicle:
Inoculation of seeds with Rhizobium and/or increasing level
of N, P and/or K fetilizers led to improvement in growth, yield and
yield attributes of mung beans. Anbumani et al., (2003) found that,
the biological nitrogen fixation in green gram is considered to be
the main source of nitrogen in pulses, and with the onset of
reproductive phase. Tanwar et al., (2003) stated that, inoculation
with efficient rhizobia culture to different legumes is a common
agronomic practice for enhancing pulse production.
It worth to mention here that, the 2R and 2R+I treatments in
cultivar Giza-1 exhibited highest increase in the studied leaf
anatomy features e.x. thickness of blade, the upper epidermis, lower
epidermis, palisade tissue and the mean number of palisade layer.
In this respect, these increases in the studied leaf features were
agreed with those of vegetative leaf character (the fresh and dry
weight of leaves and leaf area/plant), led to the greatest increases in
yield and yield components.
In cultivar Kawmi, the R+I, and 2R+I treatments were the
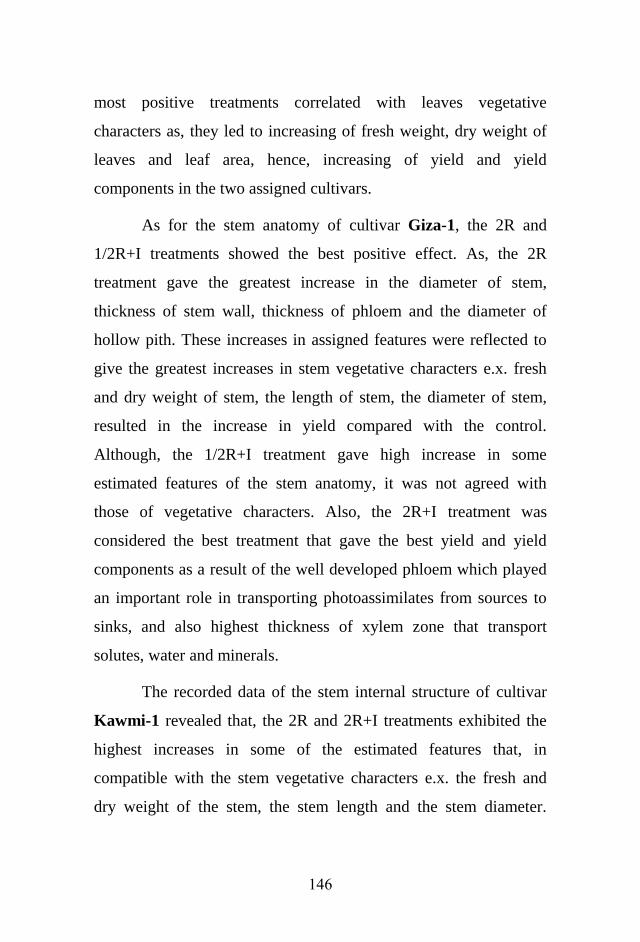
146
most positive treatments correlated with leaves vegetative
characters as, they led to increasing of fresh weight, dry weight of
leaves and leaf area, hence, increasing of yield and yield
components in the two assigned cultivars.
As for the stem anatomy of cultivar Giza-1, the 2R and
1/2R+I treatments showed the best positive effect. As, the 2R
treatment gave the greatest increase in the diameter of stem,
thickness of stem wall, thickness of phloem and the diameter of
hollow pith. These increases in assigned features were reflected to
give the greatest increases in stem vegetative characters e.x. fresh
and dry weight of stem, the length of stem, the diameter of stem,
resulted in the increase in yield compared with the control.
Although, the 1/2R+I treatment gave high increase in some
estimated features of the stem anatomy, it was not agreed with
those of vegetative characters. Also, the 2R+I treatment was
considered the best treatment that gave the best yield and yield
components as a result of the well developed phloem which played
an important role in transporting photoassimilates from sources to
sinks, and also highest thickness of xylem zone that transport
solutes, water and minerals.
The recorded data of the stem internal structure of cultivar
Kawmi-1 revealed that, the 2R and 2R+I treatments exhibited the
highest increases in some of the estimated features that, in
compatible with the stem vegetative characters e.x. the fresh and
dry weight of the stem, the stem length and the stem diameter.

147
Meanwhile, the 1/2R+I treatment caused the greatest reduction in
most of the estimated anatomical features, which agreed with the
opposite vegetative stem characters but, it was not agreed with
yield and yield components.
As for the internal structure of the pedicle, in Giza-1 cv., the
2R and 2R+I treatments exhibited the highest increase in the most
of the estimated anatomical features, which agreed with flower
setting percentage of those treatments resulted in increases in the
opposite yield and yield components. Meanwhile, the 1/2R
treatment exhibited the less reduction in most of the studied
anatomical features, which also in a compatible with flower setting
percentage of this treatment, led to reduction in yield and yield
components.
Results of the internal structure of the pedicle in cultivar
Kawmi-1 were responded negatively and disagreed with those of
belonging flower setting and yield. However, the 1/2R treatment
gave the highest decrease in all studied anatomical features of the
pedicle, which agreed with the highest decrease in flower setting
percentage, led to highest reduction in yield and yield characters. In
this manner, the 2R+I exhibited the lowest decrease in the thickness
of xylem and the diameter of the widest vessel might induce the
highest increase in flower setting percentage, led to increase yield
and yield components.

148
SUMMARY
This work aimed to study the effects of three levels of the
NPK fertilizers (50, 100 or 200% of the recommended level) each
added as split application (10:50:40 at planting, flowering and pod
filling start) combined with or without inoculation of seeds (before
sowing) with nodule bacteria (Rhizobium jabonicum) on seed
germination, plant growth and yield components of mung beans cvs.
Giza-1 and Kawmi-1 grown in pot experiments. The recommended
level of N+P+K fertilizers (equivalent to about 73, 100 and 50
kg/feddan of ammonium sulfate (20.6% N), calcium super phosphate
(15.5% P) and potassium sulfate 48% K) respectively) the treatment
without inoculation was used as control treatment.
Seed germination and emergency rate:
Using the 50% NPK alone (without seed inoculation)
resulted in the highest significant increase of seed germination
in cultivar Giza-1 during the two seasons followed by the
200% NPK level combined with seed inoculation. As for
number of days required for complete germination (SER), an
opposite trend was noticed. As for cultivar Kawmi-1, all
applied treatments (except the 200% NPK level combined
with seed inoculation) reduced seed germination and
significantly increased the SER compared with control.
Growth characters:
In the mung bean cultivar Giza-1, 200% with seed
inoculation produced the highest averages of number of

149
leaves, fresh weight of leaves, leaf area, fresh weight of
stem, plant height, stem diameter and number of
branches/plant in compared with the control. Whereas,
applying 200% without seed inoculation produced the
highest averages of stem dry weight, root length and root
volume compared with control. Regarding the mung bean
cultivar Kawmi-1, the 200% with seed inoculation gave the
highest averages of all vegetative characters that were
estimated followed by the 200% alone and 100% with seed
inoculation, respectively. On contrary, 50% with or without
Rhizobium inoculation decreased averages of most estimated
vegetative characters in both mung bean cultivars Giza-1 and
Kawmi-1. These results indicated that the observed
improvement in the estimated growth characters was
correlated positively not only with elevating the NPK level
but also with inoculating seeds with Rhizobium before
sowing.
Yield characters:
In cultivar Giza-1, the 200% NPK level with seed
inoculation produced the highest significant increases in the
fruit diameter, number of fruits, fruit weight and weight of
seeds/plant during both 2001 & 2002 seasons in comparison
with the control. Whereas, the 200% NPK level without
seed inoculation produced the highest increases in fruit
length and number of seeds/plant compared with control. The
lowest values for most these characters were induced by

151
using the 50% of the recommended NPK level without or
with seed inoculation, respectively. It is of interest to state
that the 100% NPK level with seed inoculation significantly
increased number of fruits and seeds and weight of
seeds/plant in 2001 and weight of fruits/plant in both seasons
compared with the control (same level without inoculation).
Also, the 50% NPK level with seed inoculation significantly
increased number of fruits/plant in 2001 and weight of
fruits/plant in 2002 compared with 50% NPK level without
seed inoculation. Similar trend of these results was noticed
also in the cultivar Kawmi-1.
Photosynthetic pigments:
1. The 100% NPK level combined with seed inoculation in
2001 season and the 200% NPK level alone in 2002 caused the
highest increase in chlorophyll a, b and a+b in plant leaves of
cultivar Giza-1, 30 days after sowing. Whereas, the highest
increase in both carotenoids and total pigments in both seasons
was induced by the 100% NPK level with seed inoculation.
However, 60 days after sowing the 200% or 100% NPK levels
each combined with seed inoculation were the best treatments
for increasing all estimated leaf pigments in 2001 and
carotenoids and total pigments in 2002 compared with the
control.
2. In cultivar Kawmi-1, using the 200% NPK level alone or
combined with seed inoculation considerably increased
production of the photosynthetic leaf pigments while the

151
50% NPK level with seed inoculation showed reduction at
30 DAS particularly in the 2001 season. Sixty days after
sowing, the highest increase in all determined leaf pigments
was induced by using the 100% followed by 50% NPK level
(each combined with seed inoculation) compared with the
control.
Accumulation of NPK and total protein in the different plant
organs:
1. The highest accumulation of N, P, K and the total
crude protein in whole plant of cultivar Giza-1 and N and
total crude protein in cultivar Kawmi-1 at 30 DAS was
induced by using the 50% NPK level without seed
inoculation compared with control. The 200% NPK level
without inoculation caused the highest accumulation of P
and K in Kawmi-1 cultivar. The chemical composition of
the different plant parts as affected by the different
applied treatments was considerably varied in the two
cultivars as :
2. In cultivar Giza-1, the 200% NPK level without
inoculation induced higher N and crude protein in leaves and
roots of cultivar Giza-1 at 60 DAS than control. Whereas, the
100% NPK level with inoculation induced the highest
accumulation of N and crude protein in stem, P and K in roots
(60 DAS) and N, P, K and crude protein in all plant parts (90
DAS). On contrary, the lowest accumulation of these
constituents in all plant parts particularly at 90 DAS was

152
induced, in general, by using the 50% NPK level without seed
inoculation compared with the control.
3. In cultivar Kawmi-1, the 200% NPK level alone caused
the highest accumulation of N, P, K and crude protein in leaves
(60 DAS) and N and crude protein in leaves (90 DAS)
compared with the control. All applied treatments decreased the
N and crude protein (60 DAS) and N, P, K and crude protein in
roots (90 DAS) compared with the control. Whereas, the 200%
NPK level combined with seed inoculation caused the highest N
and crude protein contents in plant stem and K content in plant
leaves and stem (90 DAS). The P and K contents in the roots
(60 DAS) were increased by all applied treatments particularly
the 50 and 200% of NPK level each with seed inoculation.
4. All applied treatments decreased the N, P and crude
protein whereas the 50 and 200% NPK levels (each with seed
inoculation) increased only the K content in fruits of cultivar
Giza-1 compared with the control. The 50% of NPK level alone
caused the highest increases in N, P, K, and crude protein in
fruits of cultivar Kawmi-1 whereas, the 200% (without
inoculation), 50 and 200% NPK level each with seed
inoculation decreased the P and K contents in fruits compared
with control.
Sugar contents in the different plant organs:
1. In cultivar Giza-1, the reducing and total sugars at 30
DAS decreased while the non-reducing sugars increased by
most of the other treatments compared with the control.
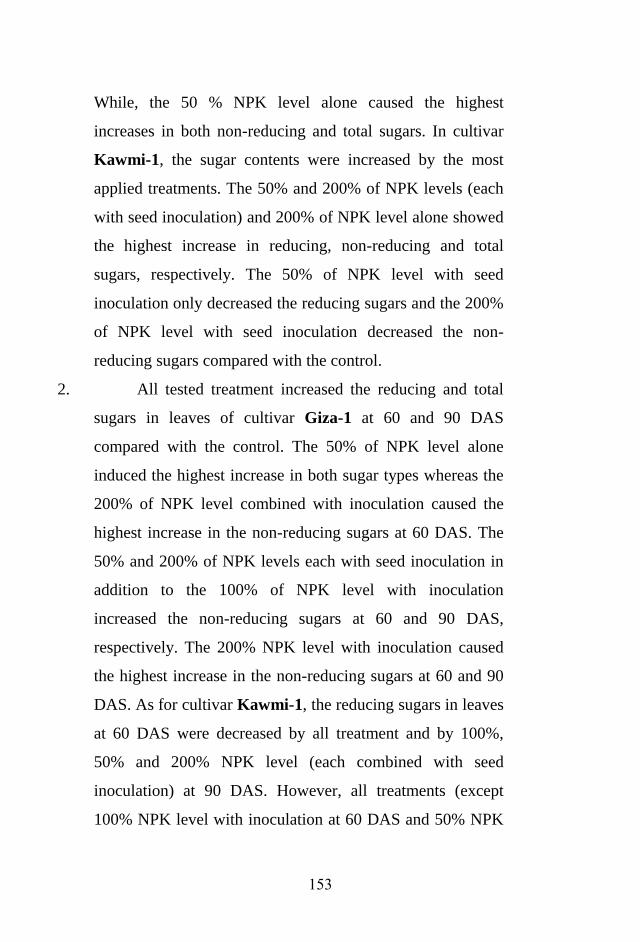
153
While, the 50 % NPK level alone caused the highest
increases in both non-reducing and total sugars. In cultivar
Kawmi-1, the sugar contents were increased by the most
applied treatments. The 50% and 200% of NPK levels (each
with seed inoculation) and 200% of NPK level alone showed
the highest increase in reducing, non-reducing and total
sugars, respectively. The 50% of NPK level with seed
inoculation only decreased the reducing sugars and the 200%
of NPK level with seed inoculation decreased the non-
reducing sugars compared with the control.
2. All tested treatment increased the reducing and total
sugars in leaves of cultivar Giza-1 at 60 and 90 DAS
compared with the control. The 50% of NPK level alone
induced the highest increase in both sugar types whereas the
200% of NPK level combined with inoculation caused the
highest increase in the non-reducing sugars at 60 DAS. The
50% and 200% of NPK levels each with seed inoculation in
addition to the 100% of NPK level with inoculation
increased the non-reducing sugars at 60 and 90 DAS,
respectively. The 200% NPK level with inoculation caused
the highest increase in the non-reducing sugars at 60 and 90
DAS. As for cultivar Kawmi-1, the reducing sugars in leaves
at 60 DAS were decreased by all treatment and by 100%,
50% and 200% NPK level (each combined with seed
inoculation) at 90 DAS. However, all treatments (except
100% NPK level with inoculation at 60 DAS and 50% NPK

154
level alone at 90 DAS) increased the non-reducing sugars.
The highest increase in these sugars was induced by the 50%
NPK level alone and 200% with seed inoculation at 60 and
90 DAS, respectively. Moreover, all treatments particularly
the 200% NPK level with seed inoculation at 90 DAS and
the 50% NPK level alone at 60 DAS induced the highest
increase in the total sugars in leaves of this cultivar.
3. All applied treatments increased sugar fractions (with
few exceptions) in plant stem of cultivar Giza-1, at 60 DAS.
However, the 100% NPK level with seed inoculation induced
the highest increase in both reducing and total sugars. While
the 200% with inoculation caused the highest increase in the
non-reducing sugars at 60 DAS. On contrary, all applied
treatments decreased the non-reducing and total sugars
while, only the 50% and 200% NPK levels combined with
inoculation decreased the reducing sugars in the stem of
cultivar Giza-1 at 90 DAS compared with the control. The
highest increase in the reducing sugars at 90 DAS was
induced by the 200% NPK level alone. As for cultivar
Kawmi-1., all tested treatment decreased the estimated sugar
fractions in plant stem at 60 and 90 DAS (with few
exceptions) compared with the control. Only the 50% NPK
level with or without inoculation increased the reducing
sugars at 60 DAS while the 200% NPK level with seed
inoculation only increased the non-reducing sugars at 90
DAS compared with the control.

155
4. Regarding sugars content in roots, all tested treatments
particularly at 90 DAS increased sugar contents in roots of
cultivar Giza-1. The 200% and 100% NPK levels (each
combined with seed inoculation) induced the highest increase
in the estimated sugars at 60 and 90 DAS, respectively. As
for sugars in roots of cultivar Kawmi-1, all applied
treatments decreased the reducing sugars at 60 and 90 DAS
and total sugars at 90 DAS in comparison with the control.
However, most tested treatments increased the non-reducing
sugars (except 50% NPK level alone) and total sugars
(except 200% NPK level alone). Whatever, the 100% of
NPK level followed by 200% NPK (each was combined with
seed inoculation) caused the highest increase in the non-
reducing and total sugars at 60 DAS and the non-reducing
sugars at 90 DAS.
5. All sugar fractions in fruits of cultivar Giza-1 were
increased by all applied treatments compared with control.
The 200% NPK level with seed inoculation induced the
highest increase in the reducing sugars whereas the 100%
NPK level with inoculation and 200% NPK level alone
caused the highest increase in the non-reducing and total
sugars. As for cultivar Kawmi-1, the reducing sugars were
increased by the 200% NPK level alone, 100% and 200%
NPK levels (each combined with inoculation), and decreased
by the 50% NPK level with or without inoculation. The non-
reducing sugars were increased by the 50% NPK level with
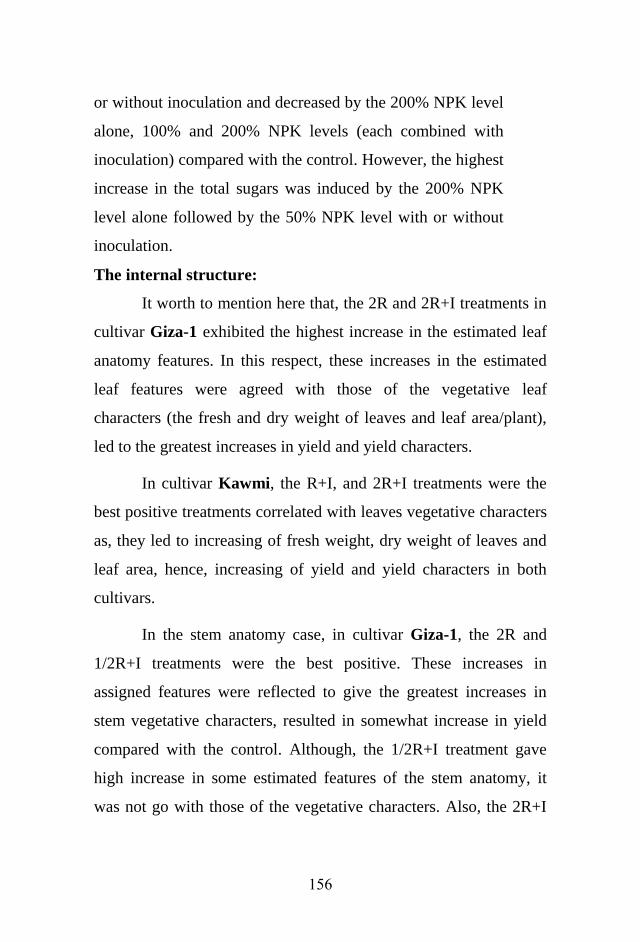
156
or without inoculation and decreased by the 200% NPK level
alone, 100% and 200% NPK levels (each combined with
inoculation) compared with the control. However, the highest
increase in the total sugars was induced by the 200% NPK
level alone followed by the 50% NPK level with or without
inoculation.
The internal structure:
It worth to mention here that, the 2R and 2R+I treatments in
cultivar Giza-1 exhibited the highest increase in the estimated leaf
anatomy features. In this respect, these increases in the estimated
leaf features were agreed with those of the vegetative leaf
characters (the fresh and dry weight of leaves and leaf area/plant),
led to the greatest increases in yield and yield characters.
In cultivar Kawmi, the R+I, and 2R+I treatments were the
best positive treatments correlated with leaves vegetative characters
as, they led to increasing of fresh weight, dry weight of leaves and
leaf area, hence, increasing of yield and yield characters in both
cultivars.
In the stem anatomy case, in cultivar Giza-1, the 2R and
1/2R+I treatments were the best positive. These increases in
assigned features were reflected to give the greatest increases in
stem vegetative characters, resulted in somewhat increase in yield
compared with the control. Although, the 1/2R+I treatment gave
high increase in some estimated features of the stem anatomy, it
was not go with those of the vegetative characters. Also, the 2R+I

157
treatment is consider the best treatment that gave the best yield and
yield characters as a result of the good condensed phloem which
played the important role for transporting photoassimilates from
sources to sinks, and also highest thickness of xylem that transport
water and minerals.
The recorded data regarding the stem internal structure of
cultivar Kawmi-1 revealed that, the 2R and 2R+I treatments
exhibited the highest increases in some of the estimated features, in
compatible with the stem vegetative characters. Meanwhile, the
1/2R+I treatment caused the greatest reduction in the most of the
estimated anatomical features, which agreed with the opposite
vegetative stem characters but also, it was not agreed with yield and
yield characters.
As for the internal structure of the pedicle, of cultivar Giza-
1, the 2R and 2R+I treatments exhibited the highest increases in
most of the estimated anatomical features, which agreed with
flower setting percentage of those treatments resulted in increases
in the opposite yield and yield components. Meanwhile, the 1/2R
treatment exhibited lower reduction in the most of the estimated
anatomical features, which also in a compatible with flower setting
percentage of this treatment, led to decrease yield and yield
components.
Results of the internal structure of the pedicle in cultivar
Kawmi-1 negatively responded and disagreed with those of flower
setting and yield. However, the 1/2R treatment gave the highest

158
decrease in all estimated anatomical features of the pedicle, which
go with the highest reduction in flower setting percentage, led to
highest reduction in yield and yield characters. In this manner, the
2R+I exhibited the lowest decrease in the thickness of xylem and
the diameter of the widest vessel, might inducing highest increase
in the flower setting percentage, led to increase yield and yield
components.

159
REFERENCES
Anbumani, S.; Chandrasekharan, B.; Rajendran P. and
Velayudham, K. (2003): Studies on nitrogen management
in green gram. Legume Res., 26 (1): 51-53.
Ahmed, I. U.; Rahman, S.; Begum, N. and Islam, M. S. (1986): Effect of phosphorus and zinc application on the growth,
yield and P, Zn and protein content of mung bean. Journal of
the Indian Society of Soil Science, 34 (2): 305-308.
Anil, K.; Verma,L. P.; Room, S.; Kumar,A. and Singh, R.
(1994): Evaluation of Mussoorie rock phosphate as source
of P for summer moong. Journal of the Indian Society of
Soil Science, 42 (3): 483-484.
A.O.A.C. (1990): Official Methods of Analysis 14th ed.,
Association of Official Agriculture Chemists, Washington,
D. C.
Ardeshna, R. B.; Modhwadia, M. M.; Khanpara, V. D. and
Patel, J. C. (1993): Response of green gram (Phaseolus
radiatus) to nitrogen, phosphorus and rhizobium
inoculation. Indian Journal of Agronomy, 38 (3): 490-492.
Arnon, D. I. (1949): Copper enzymes in isolated chloroplasts
polyphenoloxidase in Beta vulgaris. Plant physiology, 24
(1): 1-15.
Asghar, A.; Malik, M. A.; Rashid, A. and Atif, T. S. (1996): Response of mung bean (Vigna radiata) to potassium
fertilization. Pakistan Journal of Agricultural Sciences, 33
(4): 44-45.
Bachchhav, S. M.; Jadhav, A. S.; Naidu, T. R. V. and
Bachchhav, M. M. (1994): Effects of irrigation and
nitrogen on leaf area, nodulation and dry matter production
in summer green gram. Journal of Maharashtra Agricultural
Universities, 19 (2): 211-213.
Badole, W. P. and Umale, S. R. (1994): Effect of seed
fortification and graded doses of fertilizers on growth,

161
development and yield of green gram (Phaseolus radiatus).
Indian Journal of Agronomy, 39 (4): 654-656.
Badole, W. P. and Umale, S. R. (1995): Effect of seed treatment
in conjunction with fertilizers on green gram (Phaseolus
radiatus). Indian Journal of Agronomy, 40 (2), 318-320.
Baldev, B. (1988): origin, distribution, taxonomy and
morphology.pp. 3-51. In B. Baldev, S. Ramanujam, and H.
K. Jain (eds.). Pulse Crops (Grain Legumes). Oxford & IBH
Publishing Co. Pvt. Ltd., New Delhi.
Bali, A. S.; Singh, K. N.; Shah, M. H. and Khanday, B. A.
(1991): Effect of nitrogen and phosphorus fertilization on
yield and plant characters of moong bean (Vigna radiata)
under the late sown conditions of Kashmir Valley. Fertiliser
News, 36 (7): 59-61.
Basu, T. K. and Bandyopadhyay, S. (1990): Effects of rhizobium
inoculation and nitrogen application on some yield attributes
of moong. Environment and Ecology, 8 (2): 650-654.
Basu, T. K.; Barui, A. K.; Bandyopadhyay, S. (1989): Nodulation, growth and seed yield of moong in response to
rhizobium inoculation and nitrogen application. Indian
Journal of Mycological Research, 27 (2): 153-157.
Bharti, B.; Matte, D. B.; Badole, W. P.; Anjali, D.; Bhaisare, B.
and Deshmukh, A. (2000): Effect of fly ash on yield,
uptake of nutrients and quality of green gram grown on
Vertisol. Journal of Soils and Crops, 10 (1): 122-124.
Bhattacharya, A.; Ali, M. (2002): Physiological traits and seed
yield in chickpea under high nitrogen input. Legume
Research, 25 (1): 9-14.
Chiera, J.; Thomas, J. and Rufty, T. (2002): Leaf initiation and
development in soybean under phosphorus stress. Journal of
Experimental Botany, 53 (368): 473-481.
Chovatia, P. K.; Ahlawat, R. P. S. and Trivedi, S. J. (1993): Growth and yield of summer green gram (Phaseolus
radiatus) as affected by different dates of sowing, rhizobium
inoculation and levels of phosphorus. Indian Journal of
Agronomy, 38 (3): 492-494.
Chowdhury, M. M. U.; Ullah, M. H. and Mahmmud, Z. U.
161
(2000): Dry matter production in mung bean (Vigna radiata
L. Wilczek) as influenced by bradyrhizobium inoculation
and phosphorus application. Legume Research, 23 (1): 15-
20.
Datta, M. (1994): Response of mung beans (Vigna radiata) to
phosphate application in Ultisols of Tripura. I- P availability
indices. Journal of the Indian Society of Soil Science, 42
(4) : 588-591.
Deka, N. C. and Kakati, N. N. (1996): Effect of rhizobium strains,
methods of inoculation and levels of phosphorus on mung
bean (Vigna radiata (L.) Wilczek). Legume Research, 19
(1): 33-39.
Derieux, M.; Kerrest, R. and Montalant, Y. (1973): Etude de la
sulface foliaire et de l’activite photosynthetique chez
kulkues hybrides de mais. Ann. Amelior Plantes, 23: 95-
107.
Dewangan, M. K.; Pandey, N. and Tripathi, R. S. (1993): Effect
of row spacings, irrigation schedules and phosphorus levels
on nodulation pattern of summer green gram. Current
Research University of Agricultural Sciences-Bangalore, 22
(9-10): 122-123.
Dhillon, N. S.; Brar, B. S. and Vig, A. C. (1994): Effect of
available P, texture and organic carbon contents of soils on
response of green gram to applied phosphate. Journal of The
Indian Society of Soil Science, 42 (4): 579-582.
Doyle, J. J. (1994) : Phenology of the legume family : an approach
to understanding the origin of nodulation. Annual Review of
Ecology and Systematics, 25: 325-349.
Dubois, M; Smith, F.; Gilles, K. A.; Hamilaton, J. K. and
Rebers, P. A. (1956): Colorimetric method for
determination of sugars and related substances. Anal. Chem.
1956, 28 (3): 350-356.
Duke, J. A. (1981): Handbook of Legumes of World Economic
Importance. Plenum Press, New York. pp. 286-298.
Duque, F. F. and Pessanha, G. G. (1990): Behaviour of ten mung
bean varieties during the rainy and dry seasons under field
conditions. Pesquisa Agropecuaria-Brasileira, 25 (7): 963-

162
969.
Edmond, J. B. and W. J. Drapala (1958): The effect of
temperature, sand and soil and acetone on germination of
okarea seeds. Proc. Amer. Soc. Hort. Sci, 71: 428-438.
Fredeen, A. L.; Rao, I. M. and Terry, N. (1989): Influence of
phosphorus nutrition on growth and carbon portioning in
Glycine max. Plant Physiology, 89, 225-230.
Gajendra, S. and Singh, G. (1995): Inter cropping of pigeonpea
with green gram under different fertility levels and planting
system. Annals of Agricultural Research, 16 (4): 505-508.
Garcia, R. N.; Robles, R. P.; Mendoza, E. M. T. and Menancio,
H. D. (1994): Response to ammonium-nitrogen application
and leaf removal of nodule ammonia and carbon
assimilation enzymes and other nitrogen fixation traits in
mung bean (Vigna radiata L. Wilczek). Philippine Journal
of Crop Science, 19 (1): 19-25.
Ghildiyal, M. C. (1992): Effect of urea on photosynthesis and
yield in mung bean. Journal of Agronomy and Crop Science,
168 (2): 91-94.
Gupta, A. K. and Rai, R. K. (1989): Influence of dates of
planting, moisture levels and rate of P application on root
development and phosphorus uptake in summer green gram
(Vigna radiata L. Wilczek). Fertiliser News, 34 (10): 43-45.
Hanson, H. C. and Churchill, E. D. (1968): The plant
community, 3rd printing. Reinhold Pub. Crop., pp. 108-111.
Hoefnagel, M. H.; Van, I. F. and Libbenga, K. R. (1993): In
suspension cultures of Catharanthus roseus the cyanide-
resistant pathway is engaged in respiration by excess sugar
in combination with phosphate or nitrogen starvation.
Physiologia Plantarum, 87, 297-304.
Horneck, D. A. and Hanson, D. (1998): Determination of
potassium and sodium by flame emission
spectrophotometry. In handbook of Reference methods for
plant analysis. Kalra, Y. P. (ed.): 153-155.
Hoshiyar, S.; Rathore, P. S.; Mali, A. L. and Singh, H. (1994): Influence of phosphate and inoculation on nutrient uptake,
recovery and response of applied P on green gram
163
(Phaseolus radiatus). Indian Journal of Agronomy, 39 (2):
316-318.
Imrie, B. C. and Lawn, R. J. (1991): Mung bean: The Australian
Experience, Proc. 1st Australian mung bean Work-Shop,
Bribane, p.53.
Kamat, V. N.; Ingole, G. L.; Puranik, R. B.; Kohadkar, W. S.
and Joshi, R. P. (1986): Effect of P application on yield,
NPK uptake and protein content of mung and urd under
rainfed conditions in vertisol. Seeds and Farms , 12 (3): 49-
51.
Khamparia, N. K. (1995): Effect of microphos culture and
phosphorus and their interactions on growth, yield attributes
and yield of major kharif crops under rainfed condition.
Journal of Soils and Crops, 5 (2): 126-128.
Kothari, S. K. and Saraf, C. S. (1990): Response of mung (Vigna
radiata L. Wilczek) to bacterial seed inoculation and
phosphorus application. Indian Journal of Plant Physiology,
33 (4): 327-332.
Kumar, N. and Chandra R. (2003): Rhizobium and VA
micorhizal inoculation effect on mung bean (Vigna radiata)
with varying phosphorus levels. Legume Res, 26 (4): 284-
287.
Kumar, P. and Puri, U.K. (2002): Response of french bean
(Phaseolus vulgaris) varieties to phosphorus and farmyard
manure application. Indian Journal of Agronomy, 47 (1):
86-88.
Kumbhar-DD; Pharande-KH and Sonar-KR. (1995): Relationship of soil N fractions and yield of green gram in
Vertisols. Journal of Maharashtra Agricultural Universities,
20 (2): 278-280.
Leelavathi, G. S.; Pillai, R. N.; Reddy, D. V. and Reddy, A. T.
(1990): Relationships between In vivo nitrate reductase
(NR) activity and yield of cultivars of green gram. Journal
of Maharashtra Agricultural Universities, 15 (2): 261-262.
Ligon, L. L. (1945): Mung Bean. A Legume for Seed and Forage
Production. Bull. Okla. Agric. Exp. Sta., 284
Mahadkar, U. V. and Saraf, C. S. (1988a): Studies on the effects
164
of various inputs on concentrations and uptake of nitrogen
and phosphorus at various growth stages of summer mung
bean. Journal of Maharashtra Agricultural Universities, 13
(2): 171-174.
Mahadkar, U. V. and Saraf, C. S. (1988c): Input response on
nitrogen uptake and utilization by summer green gram
(Vigna radiata L. Wilczek). Journal of Nuclear Agriculture
and Biology, 17 (2): 95-99.
Mahalle, P. P. and Matte, D. B. (1995): Study on phosphatic
fertilizer of green gram. Journal of Soils and Crops, 5 (1):
67-69.
Maiti, S.; Das, C. C.; Chatterjee, B. N. and Sengupta, K. (1988): Response of green gram and lentil to rhizobium inoculation.
Indian Journal of Agronomy, 33 (1): 92-94.
Maldal, A. B. and Ray, R. (1999): Effect of rhizobium inoculation
and nitrogenous fertilizer on the performance of mung.
Journal of Interacademicia, 3 (3-4): 259-262.
Mandal, K. G. and Sinha, A. C. (1997): Residual effect of levels
of phosphorus and boron on the yield components and grain
yield of succeeding green gram. Environment and Ecology,
15 (3): 688-691.
Mandal, R. and Sikder, B. C. (1999): Effect of nitrogen and
phosphorus on growth and yield of mung bean grown in
saline soil of Khulna, Bangladesh. Journal of Phytological
Research, 12 (1-2): 85-88.
Meena, L. R.; Singh, R. K. and Gautman, R. C. (2003): Yield
and nutrient uptake of chickpea (Cicer arietinum) as
influnce by moisture conservation practices, phosphorus
levels and bacterial inoculation. Legume Res, 26 (2): 109-
112.
Mishra, J. P.; Masood, A. and Ali, M. (1998): Phosphorus and
molybdenum management in summer mung bean. Indian
Journal of Pulses Research, 11 (1): 100-102.
Mitra, S.; Bhattacharya, S. K.; Datta, M. and Banik, S. (1999): Effect of variety, rock phosphate and phosphate solubilizing
bacteria on growth and yield of green gram in acid soils of
Tripura. Environment and Ecology, 17 (4): 926-930.
165
Mohanty, K. C.; Bhoi, S. C.; Pradhan, T.; Dhawan, S. C. and
Kaushal, K. K. (1999): Effect of Rotylenchulus reniformis
on nitrate reductase activity and other biochemical
parameters of mung. Proceedings of national symposium on
rational approaches in nematode management for
sustainable agriculture, Anand, India, 23-25 November,
1998. 1999, 71-75; 6 ref.
Narayanan, A.; Babu, V. B. and Reddy, G. L. (1991): Comparison of food legumes during their early vegetative
phase for growth characteristics and fertilizer response.
Indian Journal of Plant Physiology, 34 (1): 42-47.
NAS/NRC (1979): Tropical legumes: Recources for the future.
Report by an ad hoc advisory panel of the advisory
committee on technology innovation, board on science and
technology for international development, National
Academy of Science and the National Research Council,
Washington, D.C.
Nelson, N. (1944): A Photometric adaptation of the Somogyi
method for the determination of glucose. J. Boil. Chem, 153,
375.
Padhi, A. K. and Samantaray, S. P. (1993): Response of summer
pulses to nitrogen and phosphorus application under rice
fallows. Orissa Journal of Agricultural Research, publ, 6 (1-
2): 1-4.
Patel, F. M. and Patel, L. R. (1991): Response of green gram
varieties to phosphorus and rhizobium inoculation. Indian
Journal of Agronomy, 36 (2): 295-297.
Patel, H. R.; Patel, R. G. and Raman, S. (1988): Response of
summer green gram to moisture regimes and nitrogen
fertilization. Indian Journal of Agronomy, 33 (1): 102-103.
Patel, J. R. and Patel, Z. G. (1994): Effect of foliar fertilization of
nitrogen and phosphorus on growth and yield of summer
green gram (Phaseolus radiatus). Indian Journal of
Agronomy, 39 (4) : 578-580.
Patro, H. and Sahoo, P. N. (1994): Response of mung bean
genotypes to phosphorus. Indian Journal of Pulses Research,
7 (2): 191-192.
166
Prajapati, M. P.; Patel, L. R. and Patel, B. M. (2003): Effect of
integrated weed management and nitrogen levels on weeds
and productivity of french bean (Phaseolus vulgaris) under
north Guajarat conditions. Legume Res, 26 (2): 79-84.
Prasad, M. R.; Singh, A. P. and Singh, B. (2000): Yield, water-
use-efficiency and potassium uptake by summer mung bean
as affected by varying levels of potassium and moisture
stress. Journal of The Indian Society of Soil Science, 48 (4):
827-828.
Pregl, F. (1945): Quantitative organic microanalysis. 4th J. and A.
Churchill Ltd., London.
Radin, J. W. and Boyer, J. S. (1982): Control of leaf expansion
by nitrogen nutrition in sunflower plants. Role of hydraulic
conductivity and turgor. Plant Physiology, 69: 771-775.
Radin, J. W. and Eidenbock, M. P. (1984): Hydraulic
conductance as a factor limiting leaf expansion of
phosphorus-deficient cotton plants. Plant Physiology, 75:
372-377.
Ramesh, P.; Ghosh, P. K. and Ramana, S. (2002): Effects of
nitrogen on dry matter accumulation and productivity of
three cropping systems and residual effects on wheat in deep
vertisols of central India. J. Agron. Crop Sci, 18: 81-85.
Rao, V. and Rao, A. (1993): Dual inoculation of VAM and
Rhizobium in black gram and green gram. Legume
Research, 16 (3-4): 119-126.
Rajput, H. A.; Tahir, M.; Moazzam, J.; Afzal, C. M. ; Masood,
T. and Jamil-M. (1992): Response of mung bean (Vigna
radiata) to NPK fertilizers under irrigated conditions.
Journal of Agricultural Research-Lahore, 30 (4): 485-488.
Ramamoorthy, K. and Raj, A. A. (1997): Studies on phosphorus
economy in rainfed green gram. Current Research
University of Agricultural Sciences-Bangalore, 26 (11):
208-209.
Ram, S. N. and Dixit, R. S. (2000): Effect of dates of sowing and
phosphorus on nodulation, uptake of nutrients and yield of
summer green gram (Vigna radiata (L.) Wilczek). Crop
Research-Hisar, 19 (3): 414-417.
167
Rawankar, H. N.; Padole, V. R.; Nathane, P. A. and Deshmukh,
P. W. (1997): Suitability of legume and its N requirement in
legume-wheat sequence. PKV Research Journal, 21 (2):
245-247.
Reddy, G. S. (1985): Effect of P and K fertilizers on dry matter
and crude protein of mung (Vigna radiata Wilczek). Indian
Botanical Reporter, 4 (2): 191-192.
Reddy, S. N.; Singh, B. G. and Rao, I. V. (1989): Physiological
efficiency of green gram (Phaseolus radiatus) and black
gram (Phaseolus mungo) with phosphate fertilization. Indian
Journal of Agricultural Sciences, 59 (11): 749-751.
Reddy, S. N.; Singh, B. G. and Rao, I. V. (1990): An analysis of
dry matter production, growth and yield in green gram and
black gram with phosphate fertilization. Journal of
Maharashtra Agricultural Universities, 15 (2): 189-191.
Sadasivam, R.; Chandrababu, R.; Natarajaratnam, N. and Sreerangaswamy, S. R. (1990): Effect of potassium
nutrition on growth and yield of green gram. Madras
Agricultural Journal, 77 (7-8) : 347-348.
Sandell, R. (1950): Colorimetric determination of traces of metal
2th Ed. Interscience Puplishers. Inc. New York.
Sangakkara, U. R. (1990): Effect of potassium fertilizer on growth
and yield of mung bean (Vigna radiata L. Wilczek). Journal
of Applied Seed Production, 8: 33-38.
Sano, T.; Kuraya, Y.; Amino, S. and Nagata, T. (1999): Phosphate as a limiting factor for the cell division of
tobacco By-2 cells. Plant Cell Physiol, 40: 1-8.
Sarkar, R. K. and Banik, P. (1991): Response of green gram to
nitrogen, phosphorus and molybdenum. Indian Journal of
Agronomy, 36 (1) : 91-94.
Saxena, K. K.; Verma, H. R. and Saxena, H. K. (1996): Effect of
phosphorus and potassium on green gram (Phaseolus
radiatus). Indian Journal of Agronomy, 41 (1): 84-87.
Sharma, M. P.; Room, S. and Singh, R. (1997): Effect of
phosphorus and sulphur on green gram (Phaseolus
radiatus). Indian Journal of Agronomy, 42 (4): 650-652.
Sharma, Y. M.; Dikshit, P. R.; Turkar, O. R. and Sharma, A.
168
M. (1993): Effect of rhizobium culture with different levels
of starter dose of nitrogen and phosphorus on the yield,
nutrition and nodulation of summer moong (Vigna radiata).
Bhartiya Krishi Anusandhan-Patrika, 8 (2): 106-114.
Shukla, S. K. and Dixit, R. S. (1996a): Nutrient- and plant-
population management in summer green gram (Phaseolus
radiatus). Indian Journal of Agronomy, 41 (1): 78-83.
Shukla, S. K. and Dixit, R. S. (1996b): Effect of rhizobium
inoculation, plant population and phosphorus on growth and
yield of summer green gram (Phaseolus radiatus). Indian
Journal of Agronomy, 41 (4): 611-615.
Singh, B. and Kumari, M. (1990): Potassium, manganese and
rhizobium interactions in mung (Vigna radiata). Legume
Research, 13 (3): 139-145.
Singh, B. G. and Hiremath, S. M. (1990): Effect of phosphate
fertilization on physiological aspects of mung bean. Journal
of Maharashtra Agricultural Universities, 15 (2): 176-178.
Singh, N. B. and Verma, K. (2002): Nitrogen and phosphorus
nutrition of french bean (Phaseolus vulgaris) grown in
eastern Uttar Pradesh under late-sown condition. Ind. J.
Agron, 47 (1): 89-93.
Singh, O. P.; Tripathi, P. N.; Room, S. and Singh, R. (1999):
Effect of phosphorus and sulphur nutrition on summer green
gram (Phaseolus radiatus). Indian Journal of Agricultural
Sciences, 69 (11): 798-799.
Singh, Y. P.; Dahiya, D. J.; Kumar, V.; Mahendra, S. and
Singh, M. (1993): Effect of nitrogen application on yield
and uptake of nitrogen by different legume crops. Crop
Research-Hisar, 6 (3): 394-400.
Snedecor, G. W. and cochran, W. G. (1982): Statistical methods.
The Iowa State University Press. 7th Edit., 2nd Printing. 507
pp.
Somogyi, M. (1952): Notes on sugar determination. J. Biol. Chem,
195, 19.
Summerfield, R. J. and Roberts, E. H. (1985): In halevy, A. H.
(ed.) A Handbook of Flowering. Florida: CRC Press.
Tanwar, S. P. S.; Sharma, G. L. and Chahar, M. S. (2003):
169
Economics of black gram (Vigna mungo (L.) Hepper)
cultivation as influenced by phosphorus levels and
biofertilizers. Legume Res, 26 (2): 149-150.
Teotia, U. S.; Mehta, V. S.; Ghosh, D. and Srivastava, P. C.
(2000): Phosphorus-sulphur interaction in moong bean
(Vigna radiata L. Wilczek): I. Yield, phosphorus and
sulphur contents. Legume Research, 23 (2): 106-109.
Thakuria, K. and Saharia, P. (1990): Response of green gram
genotypes to plant density and phosphorus levels in summer.
Indian Journal of Agronomy, 35 (4): 431-432.
Thakur, V. R.; Giri, D. G. and Deshmukh, J. P. (1996):
Influence of different sources and levels of phosphorus on
yield and uptake of green gram (Vigna radiata L.). Annals of
Plant Physiology, 10 (2): 145-147.
Thimmegowda, S. (1993): Effect of fertilizer levels on yield
potential of pulses grown in quick succession with kharif
rice under low water table conditions. Mysore Journal of
Agricultural Sciences, 27 (2): 118-123.
Thind, S. S.; Hundal, H. S. and Vig, A. C. (1993): Phosphate
utilization by moong and cowpea under differential P
fertility. Journal of Nuclear Agriculture and Biology, 22 (2):
89-93.
Thind, S. S.; Rishi, A. K and Goswami, N. N. (1990): Utilization
of applied phosphorus by green gram (Vigna radiata L.
Wilczek), bengal gram (Cicer arietinum L.) and cowpea
(Vigna unguiculata L. Walp) in soils of Delhi. Journal of
Nuclear Agriculture and Biology, 19 (3): 152-156.
Treeby, M. T.; Vansteveninck, R. F. and Devries, H. M. (1987):
Quantitative estimates of phosphorus concentrations within
Lupinus luteus leaflets by means of electron probe x-ray
microanalysis. Plant Physiology, 85: 331-334.
Upadhyay, R. G.; Sharma, S. and Daramwal, N. S. (1999): Effect of rhizobium inoculation and graded levels of
phosphorus on the growth and yield of summer green gram
(Phaseolus radiatus L.). Legume Research, 22 (4): 277-279.
Willey, R. L. (1971): microtechniques: A Laboratory Guide.
Macmillan Publishing Co., Inc., New York. 99 pp.

171
Yadav, D. S. (1990): Studies of nitrogen economy through mung
bean and urd bean legumes in legume-cereal (wheat)
cropping system. Legume-Research, 13 (2): 65-68.
Yeman, A. and Skjelvag, A. O. (2003): Effects of fertilizer
phosphorus on yield traits of Dekoko (Pisum sativum var.
Abyssinicum) under field conditions. J. Agron. Crop Sci,
189: 14-20.

1
امللخص العربى
% ، 155% ، 05يستتتتتتذا ا عتتتتتتسة ةأثيتتتتتت تةستتتتتت ذتتتتتت يت تتتتتت يستتتتتتذ ي
% يتتتتم ةأيستتتتذ ةأي نتتتتم دتتتترك يتتتتم ةأستتتتي ةأيت تتتت ةأي ذتتتت تتتتم نتتتتت 055% ت ةأرتة ت 15ةأ يذت جيم ةأف سف ت ةأد ذ ستي ةأذتم ذت فتت ذا تم ثت
ت مك يتتتو ب دتتت م ذ تتتي ةأدتتتس ت % تتت د ةيتتت ةيتتتذ ةأ تتت05% تت ةأذرعيتتتت ، 05، قدت ةأرتة ت ك دد ذيتيت ةأث ت ةأجستيت تير ديت جت د ي ك تم يثت ستت ف دت ةأدتتتس ت قي ستتت ةأ يتتت ةأي نتتت دثتتتم ةأي تتت ةأ يي يتتت ةأنتتتد ةأ د ذيتتت
ك سأتتت ذ تت تتت ا ةلنتت يتت 1-، قتت يم 1-أنتت فيم يتتم تت ةأيتت جيتتر تم دتر يتم ةأستي ةأيستذل أ ت د م يث ي ةأي ت ةأ ذت ك ذي ةأيستذ ةأي نى
155% بر ك ، 0502 ج بر م نت ت دتيذت بي يت 37 ةم يذت يم % ستتتتف تك ، دتيذتتتت 1000 جتتتت ستتتتف ت تتتتم نتتتت ت ستتتت دت ستتتتف ةأ أستتتتي
ي تتتتم بعتتتت ةأ ذتتتت ةأذتتتتم % د ذ ستتتتي ك دتتتت م ذ تتتتي د أد ذيتيتتتت ييتتتت 04ةأد ذ ستتتتي ذ ن فأيا عسه ةأ تةس :
نسبة إنبات البذور ومعدل سرعة ظهور البادرات: –أوال
ب ةستتذثي نتتا ةأيستتذ ةأي نتتم دتتر يتتم ةلستتي ةأيستتذل ي دتت م لت ي ستيم 1-ذ ي ةأدس تك فأم ري يث ي تم ستد ف دت دتس ت ةأنت ا جيتر
% يتتتتم ةأي نتتتتم دتتتترك 055ثي ةأيستتتتذ ةأيتتتتت ا ةأ تةستتتت ي يتتتتر تتتتم سأتتتتت ةستتتتذةأين دذ تي ةأدتس ت قت أت ت عتسة ةبذجت ه د أ ستد أثت ةليت ةأي دت
تتتت ب اتتتتت جييتتتتو ةأيثتتتت ي 1-أ ستتتتذ د ةأ يتتتت بيتتتت د أ ستتتتد أ نتتتت ا قتتتت يم دتت ةأيلذدتت ي تت ة ةأيستتذ ةأيتتت ا يتتو ذ تتي ةأدتتس تك نتت يث يتت تتم ستتد ف
ةأدتتتتس ت يتتتتو ريتتتت يث يتتتت تتتتم ةليتتتت ةأي دتتتت أ ستتتتذ د ةأ يتتتت ي ت تتتت ديث ي تتتت ةأ ذت
0
صفات النمو الخضري: -ثانيا سد ةأيسذ ةأيت ا يتو ذ تي ةأدتس ت بقنتم قييت 1- م ةأن ا جير
أيذ ستتت تتت ةل تةو ، ةأتتت رم ةأ تتت رم أتتتا تةو ، يستتت ةل تةو ، ةأتتت رم ةأ تتت رم س و ، ةتذف ع ةأ د ، ق ت ةأس و ت ةأفت عن دت لت ي ستيم ةأ تةست ي ت ت أ
يتتتتتو ةأ ذتتتتتت دي يتتتتت ستتتتتد ةأيستتتتتذ ةأيتتتتتت ا دتتتتت م ذ تتتتتي ةأدتتتتتس ت ب تتتتتم ةأ تتتتتي أيذ ستت ةأتت رم ةأجتت ا أ ستت و ، تت جتت ةأجتتست ي ت تت دتت أ ذت دلنتت
ي ةأدتتس ت ةأيثتت أل ةل تتم تت ب اتتت ةأيستتذ ةأيتتت ا يتتو ذ تت 1-ةأنتت ا قتت يمأجييتتو ةأنتتتف ةألتتتتتي ةأذتتتم ذتتت قي ستتتا ي يتتتر تتتم سأتتتت ةأيستتتذ ةأيتتتت ا دتتت م ذ تتي ةأدتتس ت تت ةأيستتذ ةأي نتتم دتتر يتتو ذ تتي ةأدتتس ت تتم ةأذتت ةأ دتت أث يتتم سأتت ب ةستذثي ةأيستتذ نتا ةأي نتم دتتر يتو ب دت م ذ تتي ةأدتس ت فأتم تت
1- يث ةأنف ةألتتي ةأي ت تم ت ةأنت فيم جيتر ةت م قي يذ س ك ذشتتتيت ذ تتتت ةأ ذتتت فأتتتم بم ةأذ ستتتم ةأي تتت تتت نتتتف ةأ يتتت ذ تتت 1-، قتتت يم
ةأللذدتت ت يتتتذد فيج ديتت أتتي تت دريتت ةأيستتذ ةأيستتذل يتتم ةلستتي ةأيستتتذثي أ م بيت دذ ي ةأدس ت دد ذيتي تير دي قد ةأرتة
صفات المحصول: -لثا ثاب ةستتتذثي ةأيستتتذ ةأيتتتت ا يتتتو ذ تتتي ةأدتتتس ت 1- تتت ةأنتتت ا جيتتتر
د أد ذيتيتت فأتتم بقنتتم ريتت يث يتت تت ق تتت ةأ يتت ت ، تت ةأ ىيتت ت ، رم ةأ يتتت رم ةأدتتتس تن د لتتت ي ستتتيم ةأ تةستتت د أي ت تتت يتتتو ةأ ذتتتت بيتتت ةستتتذثي ةأيستتتذ
ت تتت ب اتتتت ب تتتم ريتتت يث يتتت تتت تتت ةأ ىيتتتت تتت ةأيتتتت ا م ذ تتتي ةأدتتتس ةأدتتتتس تن د ي ت تتتت دتتتت أ ذت تتتتم ةأث تتتت يتتتتم سأتتتتت ذ قنتتتت قتتتتي يث تتتت ذ تتتتت ةأنتف د تجت ديتت ت ةستذثي ةأيستتذ نتا ةأي نتم دتر دت م ذ تي ةأدتتس ت
ثي تتت فتتت ةأيستتتذ يتتتو ذ تتتي ةأدتتتس ت تتتم ةأذتتت ةأ يتتتم ةأجتتت يت د أتتتس ت بم ةستتتذةأيستتتذ ةأي نتتتم دتتتر يتتتو ذ تتتي ةأدتتتس ت قتتت ب اتتتت ريتتت ة يث يتتت تتتم تتت ةأ ىيتتت ت
رم ةأ ىي تن دتتت تتت تتت ةأي ستتتييم 0551 ةأدتتتس ت رم ةأدتتتس تن د تتت ي ستتت د أي ت تتت يتتتو ةأ ذتتتت ةأيستتتذ ةأي نتتتم دتتتر دتتت م ذ تتتي ةأدتتتس تك بيتتتت ، ب اتتتت

7
ي ةأدتتتتس ت ريتتتت يث يتتتت تتتتم تتتت ةستتتتذثي ةأيستتتتذ نتتتتا ةأي نتتتتم دتتتتر يتتتتو ذ تتتتي ت تتتت دتتتت ف 0550 رم ةأ ىي تن دتتتت تتتت ي ستتتت 0551ةأ ىي تن دتتتت تتتت ي ستتتت
ةأيسذ م ذ ي ةأدس ت عسة ق أ ةذج ه يش در أذ ت ةأ َّذ بيت ت ةأنت ا 1-ق يم صبغات البناء الضوئى: –رابعا
0551ةأدتتتتست تتتتم ةأي ستتتت ب ةستتتتذثي ةأيستتتتذ ةأي نتتتتم دتتتتر يتتتتو ذ تتتتي فأتتتم ب تتتم ريتتت تتت 0550 ةأيستتتذ ةأيتتتت ا م ذ تتتي ةأدتتتس تك تتتم ةأي ستتت
75دثتتت 1-نتتتد ةأ تتت ت ي ب ، ، ب ك تتت ب تةو ةأ دتتت أ نتتت ا جيتتتر ي يتت يتتم ةأرتة تت يتت ستتدد فتت ذ تتت ةأيث ي تت ب تتم ريتت تت نتتد ةأ تت ت ذيم
ي يت يتم ةأرتة ت ت ت م ةأيستذ 25ةأي ستييم بيت دثت ةأند ةأ يى ت ةأيت ا سأت ةأيسذ ةأي نتم دتر ةأينت ديم دذ تي ةأدتس ت ةل تت تم ريت
تسأت نتي ةأ ت ت ذيم ةأنتد ةأ يىت ت 0551ةأند ةأي ت ت ت ةأي ست ي ت د أ ذت 0550ةأي س
أيستتتتذ ةأيتتتتت ا م ذ تتتتي تتتت ستتتتد ة 1-دلنتتتت ةأنتتتت ا قتتتت يمةأدتتتتس تك ريتتتت تتتتتلي تتتتم نتتتتد ةأد تتتت ةأتتتتت م دتتتت ل تةو دي يتتتت ب ةستتتتذثي
ي يت 75ةأيسذ نا ةأي نم در يو ذ ي ةأدس ت فأم ذ ق عسه ةأنتد دثت ي يتتت يتتتم ةأرتة تتت تتت ب اتتتت 25 بيتتت دثتتت 0551يتتتم ةأرتة تتت ل نتتت تتتم ةأي ستتت
ةأ نا ي نم در ةأين ديم دذ ي ةأدس ت ب تم ريت ت ةأيسذ ةأي نم در ةأند ةأي ت ي ت د أ ذت
محتااوا النيتااروويل والفوساافور والبوتاساايوت والبااروتيل ال ااى -خامسااا في األوزاء المخت فة ل نبات:
ستتتتتد ةستتتتتذثي ةأيستتتتتذ نتتتتتا ةأي نتتتتتم دتتتتتر دتتتتت م ذ تتتتتي ةأدتتتتتست ب تتتتتم 1-يم ةأف سف ت ةأد ذ سي ةأدت ذيم ةأ م م ةأنت ا جيتر يسذ ي ذتة ةأ يذت ج
دي يتتت ستتتد ةستتتذثي ةأيستتتذ 1- ةأ يذتتتت جيم ةأدتتتت ذيم ةأ تتتم تتتم ةأنتتت ا قتتت يمةأيتتتت ا ب تتتم ذتة يتتت أ ف ستتتف ت ةأد ذ ستتتي تتتم عتتتس ةأنتتت ا سأتتتت تتتم ةأ دتتت
0
ب اتتتت ةأ ذتتت ي يتتت يتتتم ةأرتة تتت د أي ت تتت يتتتو ةأ ذتتتت عتتتسة قتتت 75ةأ يتتت دثتتت ذف ذ ديتة م ذتة ذ تت ةأي ت ةأ يي يت تم بجترة ةأ دت ةأيلذ فت ذدثت أ نت ا
يت ةأ د ي يذت يي ي م ب ةستتذثي ةأيستتذ ةأيتتت ا دتت م ذ تتي ةأدتتس ت 1- تتم ةأنتت ا جيتتر
د ةستذثي فأم ب م ذتة أ يذتت جيم ةأدتت ذيم ةأ تم تم ةأجتس ت ةل تةو دي يت ستةأيستتذ ةأي نتتم دتتر يتتو ذ تتي ةأدتتس ت ب تتم ذتتتة أ يذتتت جيم ةأدتتت ذيم ةأ تتم تتم
ي يتتتت يتتتتم ةأرتة تتتت ةأ يذتتتتت جيم 25ةأستتتت و ةأف ستتتتف ت ةأد ذ ستتتتي تتتتم ةأجتتتتس ت دثتتتت ي يتتت يتتتم 55 ةأف ستتتف ت ةأد ذ ستتتي ةأدتتتت ذيم ةأ تتتم تتتم جييتتتو بجتتترة ةأ دتتت دثتتت
ةستذثي ةأيستذ نتا ةأي نتم دتر دت م ذ تي ةأدتس ت ةأرتة دش ب اتت 55بقتت يثتت أل ةأذتتتة أجييتتو ذ تتت ةأي تت ةأ يي يتت تتم جييتتو بجتترة ةأ دتت دثتت
ي ي يم ةأرتة في ت د أ ذت تتت ب اتتتت ةستتتذثي ةأيستتتذ ةأيتتتت ا دتتت م 1-بيتتت تتتم ةأنتتت ا قتتت يم
ت جيم ةأف ستتف ت ةأد ذ ستي ةأدتت ذيم ةأ تتم ذ تي ةأدتس ت ب تم يثتت أل ةأذتتة أ يذتي يتت يتتم ةأرتة تت ك 55ي يتت يتتم ةأرتة ت ك ةأ يذتتت جيم ةأدتتت ذيم ةأ تتم دثت 25 دثت
تتتم ةل تةو دي يتتت ب جييتتتو ةأيثتتت ي ةأيلذدتتتت فأتتتم ذ تتت ق ي ذتتت ةأجتتتس ت يتتتم ةأف ستتتتتف ت ي يتتتتت يتتتتم ةأرتة تتتت ك ةأ يذتتتتت جيم 25ةأ يذتتتتت جيم ةأدتتتتت ذيم ةأ تتتتم دثتتتت ي ي يم ةأرتة ت ك ي ت ت دت أ ذت يتم يت 55 ةأد ذ سي ةأدت ذيم ةأ م دث
بلتتتتت ب اتتتتت جييتتتتو ةأيثتتتت ي ةأيلذدتتتتت ل نتتتت ةأيستتتتذ نتتتتا ةأي نتتتتم دتتتتر ةأيسذ ةأيتت ا ةأينت ديم دذ تي ةأدتس ت فأتم ريت ذتتة ةأف ستف ت ةأد ذ ستي
م ةأرتة تتت ك يتتت ب اتتتت ةأيستتتذ ةأيتتتت ا يتتتو ذ تتتي ي يتتت يتتت 25 تتتم ةأجتتتس ت دثتتت ةأدتتتس ت ب تتتم يثتتت أل ذتتتتة ةأ يذتتتت جيم ةأدتتتت ذيم ةأ تتتم تتتم ةأستتت و ةأد ذ ستتتي تتتم
ي ي يم ةأرتة 55ةأس و ةل تةو دث ب جييتتو ةأيثتت ي ةأيلذدتتت فأتتم ذ تت ق ةأ يذتتت جيم ةأف ستتف ت ةأدتتت ذيم
دي يتت ب ةأيستتذ نتتا ةأي نتتم دتتر ةأيستتذ 1-ةأ تتم تتم يتت ت ةأنتت ا جيتتر ةأيت ا ةأين ديم دذ ي ةأدس ت فأم ري ذتة ةأد ذ سي دا ي ت ت دت أ ذت
ت ب اتت ةأيستتذ نتا ةأي نتم دتتر دت م ذ تي ةأدتتس ت 1-بيت تم ةأنت ا قتت يم
0
م تم ةأ يت ت دي يت ب يث أل ذتة ةأ يذت جيم ةأف سف ت ةأد ذ سي ةأدت ذيم ةأ تسد ةسذثي ةأيسذ ةأيتت ا يتو ب دت م ذ تي ةأدتس ت تسأت ةأيستذ نتا ةأي نتتتم دتتتر يتتتو ذ تتتي ةأدتتتس ت ذ تتت ق ي ذ يتتت يتتت ت عتتتسة ةأنتتت ا يتتتم ةأف ستتتف ت
ةأد ذ سي ي ت د أ ذت محتوا األوزاء النباتية المخت فة مل الس ريات: -سادسا
دد يث تتت ةأيثتتت ي ةأيلذدتتتت ذ تتت ق ةأستتت تي ستتت 1- تتتم ةأنتتت ا جيتتتر ةأيلذرأتتت ةأ يتتت يتتتو ريتتت ةأستتت تي نيتتتت ةأيلذرأتتت دي يتتت ستتتد ةستتتذثي ةأيستتتذ نتتتا ةأي نتتتم دتتتر دتتت م ذ تتتي ةأدتتتس ت ب تتتم ريتتت تتتم تتت يتتتم ةأستتت تي نيتتتتت
1-مي ي يم ةأرتة ي ت د أ ذت بي م ةأنت ا قت ي 75ةأيلذرأ ةأ ي دث تتت ب يث تتت ةأيثتتت ي ةأيلذدتتتت فأتتتم ريتتت ي ذتتت ةأستتت تي ستتتد ةستتتذثي ةأيسذ ي نا ةأي نم در يو ذ ي ةأدس ت ةأيتت ا يتو ب دت م ذ تي ةأدتس ت فأم ب م ري م ةأس تي ةأيلذرأ نيت ةأيلذرأ ةأ يت تم ةأذت ةأم عتسة قت
ةأيلذرأ ةستذثي ةأيستذ نتا ةأي نتم دتر ب ات ةأ ذ ذ ق ةأس تي يو ذ ي ةأدس ت ةأس تي نيت ةأيلذرأ ةسذثي ةأيسذ ةأيت ا يتو ذ تي
ةأدس ت ي ت د أ ذت د أ ستتتد أتتتا تةو ب جييتتتو ةأيثتتت ي ةأيلذدتتتت فأتتتم ريتتت ةأستتت تي ةأيلذرأتتت
يتتم ةأرتة تت ي ت تت دتت أ ذت دي يتت ي يتت 55، 25دثتت 1- ةأ يتت تتم ةأنتت ا جيتتر سد ةستذثي ةأيستذ نتا ةأي نتم دتر دت م ذ تي ةأدتس ت ب تم ريت تم ةأست تي ةأيلذرأتتت ةأ يتتت تتتىم ةأيستتتذ ةأيتتتت ا يتتتو ذ تتتي ةأدتتتس ت قتتت ستتتد ب تتتم ريتتت تتتم
يتتتت ي يتتتت يتتتتم ةأرتة تتتت عتتتتسة قتتتت ب اتتتتت ةأ ذتتتت ر 25ةأستتتت تي نيتتتتت ةأيلذرأتتتت دثتتتت ي يتتتت يتتتتم ةأرتة تتتت تتتت ةستتتتذثي ةأيستتتتذ ييم نتتتتا 25ةأستتتت تي نيتتتتت ةأيلذرأتتتت دثتتتت
ي يتتتت يتتتتم ةأرتة تتتت تتتت 55ةأي نتتتتم دتتتتر ةأيتتتتت ا ةأينتتتت ديم دذ تتتتي ةأدتتتتس ت دثتتتت تتت ب 1-ةستتتذثي ةأيستتتذ ةأي نتتتم دتتتر يتتتو ذ تتتي ةأدتتتس ت بيتتت تتتم ةأنتتت ا قتتت يم
يتتتم ةأرتة تتت ك ةأيستتتذ ةأي نتتتم دتتتر نتتتا ي يتتت 25جييتتتو ةأيثتتت ي ةأيلذدتتتت دثتتت ي يت يتم ةأرتة ت ك فأتم 55ةأي نم در ةأيتت ا ةأينت د جييثت دذ تي ةأدتس ت دثت
ذ ق ةأس تي ةأيلذرأ د ل تةو ي ت د أ ذت يي ت ة ةأيستذ ةأي نتم دتر يتو
2
دت م ذ تي ةأدتس ت ي يت يتم ةأرتة ت ك ةأيستذ نتا ةأي نتم دتر 25ذ ي ةأدس ت دث ي يتت يتتم ةأرتة تت ك تت ب دتت قم ةأيثتت ي ةأيلذدتتت فأتتم ريتت ةأستت تي نيتتت 55 دثتت
ةأيلذرأتتت دتتت تةو عتتتسة ةأنتتت ا عتتتسة قتتت ب اتتتت ةأيستتتذ نتتتا ةأي نتتتم دتتتر دتتت م ذ تتتي 55، 25ةأدس ت ةأيسذ ةأيتت ا يتو ذ تي ةأدتس ت ب تم يستذ أاتسه ةأست تي دثت
أرتة تت تتم ةأذتت ةأم يتت ب جييتتو ةأيثتت ي ةأيلذدتتت فأتتم ريتت ةأستت تي ي يتت يتتم ةةأ يتتت دتتت ل تةو تتتم عتتتسة ةألنتتت ب اتتتت ةأيستتتذ نتتتا ةأي نتتتم دتتتر دتتت م ذ تتتي
، 25ةأدتتس ت ةأيستتذ ةأيتتت ا يتتو ذ تتي ةأدتتس ت ب تتم ريتت تتم عتتسه ةأستت تي دثتت ي ي يم ةأرتة م ةأذتذي 55
سد أ ست و ت ستدد جييتو ةأيثت ي ةأيلذدتت ريت ةتت تم جييتو بي د أ عتتتتسة قتتتت ستتتتد ةأيستتتتذ 1-ةأستتتت تي ةأي تتتت ت تتتت ة تتتت أل ق ي تتتت ك تتتتم ةأنتتتت ا جيتتتتر
ةأي نتتم دتتر يتتو ذ تتي ةأدتتس ت ب تتم ريتت تتم تت يتتم ةأستت تي ةأيلذرأتت ةأ يتت دي يتت تتم ةأستت تي نيتتت ةأيلذرأتت دثتت ستتد ةأيستتذ ةأيتتت ا يتتو ذ تتي ةأدتتس ت ب تتم ريتت
ي يتتت يتتتم ةأرتة تتت تتت ب تتتت ةأ ذتتت بم جييتتتو 55ي يتتت يتتتم ةأرتة تتت بيتتت دثتتت 25ةأيثتتتت ي ةأيلذدتتتتت قتتتت ستتتتدد ذ تتتت ق ةأستتتت تي نيتتتتت ةأيلذرأتتتت ةأ يتتتت دي يتتتت ستتتتد ةستتذثي ةأيستتذ ةأيتتت ا دتت م ذ تتي ةأدتتس ت ب تتم ريتت تتم ةأستت تي ةأيلذرأتت تتىمةستتذثي ةأيستتذ ييم ينتتا ةأي نتتم دتتر ةأيتتت ا ةأينتت ديم دذ تتي ةأدتتس ت قتت ستتدد
تتت ستتتد 1-ذ قنتتت تتتم عتتتسه ةأستتت تي ي ت تتت دتتت أ ذت دلنتتت ةأنتتت ا قتتت يمي يتت يتتم 55، 25يث تت ةأيثتت ي ةأيلذدتتت ذ تت ق ةأستت تي ةأي تت ت تتم ةأستت و دثتت
م دتر يتو ب دت م ذ تي ةأدتس ت ت فأتم ريت ةأرتة دي ي ب ةأيسذ نا ةأي ني يتت يتتم ةأرتة تت تتىم ةأيستتذ ةأيتتت ا يتتو ذ تتي ةأدتتس ت 25ةأستت تي ةأيلذرأتت دثتت
ي يت يتم ةأرتة ت ي ت ت 55 ق ب فأم ري ةأس تي نيت ةأيلذرأ م ةأس و دثت د أ ذت
بم جييتتو ةأيثتت ي دلنتت ي ذتت ةأستت ت تت ةأجتتس ت ب اتتت ةأ ذتت 55ل نت دثت 1-ةأيلذدت ق ستد ريت ةأي ذت ةأست ت تم جتس ت ةأنت ا جيتر
ي ي يم ةأرتة بم ةسذثي ةأيسذ ييم ةأيت ا ةأي نتم دتر ةأينت ديم دذ تي ي يت يتم ةأرتة ت تم 55، 25ةأدس ت ق سدد ب م ري م ةأس تي ةأي ت دث

3
ب جييو ةأيث ي ةأيلذدت فأتم ذ ت ق 1- سد أ ن ا ق يمةأذتذي بي د أي يتت 55ي يتت يتتم ةأرتة تت ةأستت تي ةأ يتت دثتت 55، 25ةأستت تي ةأيلذرأتت دثتت
يتتتتم ةأرتة تتتت تتتتم بيتتتت تتتت تتتت ب اتتتتت جييتتتتو ةأيثتتتت ي ةأيلذدتتتتت ريتتتت تتتتم م ذ تتي ةأدتتس تك ةأستت تي نيتتت ةأيلذرأتت يتت تت ة ةأيستتذ نتتا ةأي نتتم دتتر دتت
ةأستت تي ةأ يتت ي تت ة ةأيستتذ ةأيتتت ا دتت م ذ تتي ةأدتتس تك ي ت تت دتت أ ذت ي يتتت تتتىم ةستتتذثي ةأيستتتذ ةأي نتتتم دتتتر ي يتتتر ةأيستتتذ ةأيتتتت ا ةأينتتت
25 ياي دذ ي ةأدس ت ق سدد ب تم ريت تم ةأست تي نيتت ةأيلذرأت ةأ يت دثت ي ي يم ةأرتة 55 سأت ةأس تي نيت ةأيلذرأ دث ي ي يم ةأرتة
ب جييو ةأيث ي ةأيلذدت فأم ري ةأس تي ةأي ت تم يت ت ةأنت ا ي ت تتت دتتت أ ذت عتتتسة قتتت ستتتد ةستتتذثي ةأيستتتذ ةأيتتتت ا يتتتو ذ تتتي 1-جيتتتر
ي نتتم دتتر يتتو ةأدتتس ت ةأريتت ةل تتم تتم ةأستت تي ةأيلذرأتت دي يتت ستتد ةأيستتذ ةأذ تي ةأدتس ت ةأيستذ ةأيتت ا دت م ذ تي ةأدتس ت ب تم ريت تم ةأست تي نيتتت
تتتتت ب ةستتتتتذثي ةأيستتتتتذ 1-ةأيلذرأتتتتت ةأ يتتتتت بيتتتتت دلنتتتتت ةأنتتتتت ا قتتتتت يمةأيتتت ا دتت م ذ تتي ةأدتتس ت ةأيستتذ ييم ةأيتتت ا ةأي نتتم دتتر يتتو ذ تتي ةأدتتس ت
يتت ت دي يتت نتت ذ تتت ةأستت تي تت ةستتذثي فأتتم ريتت ةأستت تي ةأيلذرأتت تتم ةأةأيستذ نتتا ةأي نتم دتتر يتو ب دتت م ذ تتي ةأدتس ت أتت بيتت ريتت ةأستت تي نيتتت ةأيلذرأتت تت ةستتذثي ةأيستتذ نتتا ةأي نتتم دتتر يتتو ب دتت م ذ تتي ةأدتتس ت دي ي ذ قن ذ ت ةأس تي م ي ت عسة ةأن ا ةستذثي ةأيستذ ةأيتت ا يم ةأسي د م ذ ي ةأدس ت ةأيسذ ييم ةأي نم دتر ةأيتت ا ةأينت ديم دذ تي ةأدس ت ي ت د أ ذت م بي سد ةستذثي ةأيستذ ةأيتت ا دت م ذ ي ةأدتس ت ب تم ريت تم ةأست تي ةأ يت ي يتر تم سأتت ةأيستذ نتا ةأي نتم
در د م ب يو ذ ي ةأدس ت
التر يب الداخ ى لألوراق و الساق و أعناق األزهار: -عا ساب

4
-ب يث ي ذم تثا ةأي نم تثا ةأي نم ةأي م ةأنت ا جيتر ةأتتم ب تتم ريتت تتم نتتف ةأ تقتت ذشتتتي ي س، ةأتتس ة ث تت دتت ته تتم نتتف 1
ةأ تقتتتت ةألتتتتتتي ةأذتتتتم ب تتتتم ةأ ا يتتتت ةأتتتتم ريتتتت ةأي نتتتت بيتتتت تتتتم ةأنتتتت ا ب ات يث ي ذم ةأي نم ةأي ت تتثا ةأي نتم ةأي ت ةأتم ب تت 1-ق يم
ذ يت فيج دم أ يث ي قت ة ث ت سأتت بيتت س تم ةأنتف ةألتتتي أتا تةو سأت ةأي ن
يثتت ي ذم تتتثا ةأي نتتم نتتا ةأي نتتم ةأي تت ذتت ب تتت ةيج ديتت تتم ، ةأذتتتم تتت بيتتتت س 1-جيتتتر ذ يتعيتتت تتتم ةأذت يتتت ةأتتت ةل م أ ستتت و تتتم ةأنتتت ا
يتذد تت دتتدثم ةأنتتف ةألتتتتتي أ ستت و دثتتم نتتتف ةأي نتت دي يتت تتت يثتت ي ذم تتتثا ةأي نتتم تتتثا ةأي نتتم ةأي تت ب اتذتت ب تتم ريتت تتم يث تت ةأنف ةأذشتي ي أ س و، دي ي بقنتم ة لفت م تم ةأنتف ةأذشتتي ي ت
1- سأت م ةأن ا ق يم م يث ي نا ةأي نم ةأي ذ يث ي ذم تثا ةأي نم تتثا ةأي نتم ةأي ت أايت ذت يتةس ةيج ديت س
قت ب عتسه ةأنتف 1- م ةأنف ةأذشتي ي ل ت و ةلرعت ت تم نت ا جيتر ةأتتم ة لفتت م ستتد ةأذستت ق تتم ذ تتت ةأيثتت ي ، دي يتت ب يث ي تت نتتا ةأي نتتم
ست ةأذشتتي ي ل ت و ةلرعت ت ةأتس ت م يذ ة ت س يتو ةأم ة لف م تم يث ت ةأ ي ريتت ستتد ةأذستت ق د أذتت أم ة لفتت م ةأي نتت أذ تتت ةأيث ي تت دي يتت تتم ةأنتت ا
يث ي نا ةأي نم ق ذستدد تم ت ع ب تم ة لفت م تم ت 1-ق يم ستد ذست ق ةأنف ةأذشتي ي ل و ةلرع ت سأت ت م يذ ة ت س يتو ت ع ب دتت
أارع ت أذ ت ةأيث ي د أذ أم ة لف م ةأي ن


الزراعى النبات قسن -الزراعية العلوم بكالوريوس
8991( بنها فرع) السقازيق جامعة-بمشتهر السراعة كلية
2004
Copyright © 2022 FDOKUMEN