Diversification and Population Structure in Common Beans (Phaseolus vulgaris L.)
Upload
khangminh22Category
view
3download
0
AN ABSTRACT OF THE THESIS OF
GEORGE JOJI .IKEDA for the DOCTOR OF PHILOSOPHY (Name) (Degree)
in CHEMISTRY presented on May 10, 1967 (Major) (Date)
Title: GLUCOSE CATABOLISM IN MUNG BEAN (PHASEOLUS
AUREUS) SEEDLINGS
Abstract approved: Redacted for Privacy
Dr. C. H. Wang
Little is known regarding the catabolic mechanisms involved
in the breakdown of glucose in mung bean (Phaseolus aureus)
seedlings. Studies in other laboratories have shown that the TCA
cycle pathway is operative in mung bean leaves, and have demon-
strated the presence of enzymes for the oxidation of glucose to
glucuronic acid in mung bean seedlings. In the present study, the
primary pathways responsible for the catabolism of glucose in
detached 10 -13 day old mung bean shoots were identified and the
relative participation of each of these pathways was estimated.
The radiorespirometric method was employed for these experi-
ments, using an ion chamber - electrometer system to monitor the
respiratory 14CO2 evolved from detached mung bean shoots
catabolizing 14C- labeled glucose substrates in the dark. Substrates
were administered in two different ways, i.e., by means of a one-
dose method and a continuous feeding method. The one -dose

experiments gave rise to respiratory 14CO2 yield data which were
used to estimate the relative pathway contributions. With the con-
tinuous feeding experiments, a metabolic steady state with regard
to glucose utilization was realized, and the data on 14CO2 production
enabled one to calculate the catabolic rates of the individual glucose
pathways. Comparison of the relative rates also provided one with
information on the relative participation of glucose pathways.
By use of both the yield method and the catabolic rate method,
it was concluded that in mung bean (Phaseolus aureus) seedlings,
glucose is catabolized mainly by way of the Embden- Meyerhof-
Parnas pathway, and that the pentose phosphate pathway and the
glucuronic acid pathway played minor roles in the overall catabolism
of glucose.

Glucose Catabolism in Mung Bean (Phaseolus aureus) Seedlings
by
George Joji Ikeda
A THESIS
submitted to
Oregon State University
in partial fulfillment of the requirements for the
degree of
Doctor of Philosophy
June 1967

APPROVED:
Redacted for Privacy Professor of Chemistry
in charge of major
Redacted for Privacy
Chairman of Department of Chemistry
Redacted for Privacy
Dean of Graduate School
Date thesis is presented May 10, 1967
Typed by Gwendolyn Hansen for George Joji Ikeda

ACKNOWLEDGMENTS
My heartfelt thanks go to my major professor and friend,
Dr. Chih H. Wang, without whose advice and help this work would
never have been attempted nor completed.
My thanks also go to Dr. Harold Evans for advice regarding
botanical aspects of this work.
I wish to express my appreciation to the U.S. Atomic Energy
Commission for support in the form of research grants.
Special thanks go to my wife for her devotion, encouragement
and support, without which this work would still be undone.

TABLE OF CONTENTS
INTRODUCTION
Page
1
MATERIALS AND METHODS 6
Plant Material 6
Administration of Substrate 7
Transpiration Rate in Detached Shoots 10 Determination of Respired 14COz 10 Procedure for Typical Experiment 13 Procedure for Substrate Inventory 13 Substrates 15 Liquid Scintillation Counting of Radioactivity 16 Calibration of the Electrometer System 17
RESULTS AND DISCUSSION 18
SUMMARY 44
BIBLIOGRAPHY 45

LIST OF FIGURES
Figure 1. Respiration chamber for radiorespirometric
experiments using plants.
2. Block Diagram of Radiorespirometer with Printout System.
3. The Radiorespirometric Pattern for the Utilization of 14C Specifically -Labeled Glucose by Ten (3.0 g fresh weight) Detached Mung Bean Shoots.
4. The Radiorespirometric Pattern for the Utilization of 14C Specifically - Labeled Gluconate and Glucuronate by Ten (3.0 g fresh weight) Detached Mung Bean Shoots.
5. The Radiorespirometric Pattern for the Utilization of 14C Specifically- Labeled Glucose by Ten (3.0 g fresh weight) Detached Mung Bean Shoots.
6. The Radiorespirometric Pattern for the Utilization of 14C Specifically- Labeled Glucose by Ten (3.0 g fresh weight) Detached Mung Bean Shoots, Showing the Extrapolation Technique used to Determine the Contribution of the Glucuronic Acid Pathway to Glucose Catabolism.
7. The Radiorespirometric Pattern for the Utilization of 14C Specifically- Labeled Glucose by Ten (3.0 g fresh weight) Detached Mung Bean Shoots.
Page
8
11
19
23
30
33
41

GLUCOSE CATABOLISM IN MUNG BEAN (PHASEOLUS AUREUS) SEEDLINGS
INTRODUCTION
The catabolic mechanisms involved in the breakdown of glucose
in plant tissues have been studied in many laboratories. They have,
in the main, centered on demonstrating the operation and estimating
the relative participation of the Embden -Meyerhof - Parnas (EMP) and
the pentose phosphate (PP) pathways and their interrelationships. In
1958, Loewus and coworkers suggested that glucose may also be
catabolized in plant tissues by way of the glucuronic acid pathway (46),
a metabolic route demonstrated by Eisenberg et al. to be operative in
rats (20). The occurrence of the tricarboxylic acid cycle (TCA
cycle) in higher plants for the catabolism of glucose intermediates
has been well established; the state of knowledge of this has been
reviewed by Hackett (29). However, more precise information on the
relative participation and interplay among the primary catabolic
mechanisms for glucose catabolism including the role of the TCA
cycle pathway in the catabolism of glucose intermediates would be
important if one desires to understand the overall metabolism of
glucose in plant systems.
One of the primary functions of these glucose pathways is the
production of energy through the oxidation of glucose carbon atoms to

z
CO2, giving rise to reduced pyridine nucleotides and adenosine
triphosphate. The primary catabolic mechanisms for the breakdown
of glucose, i.e. , the EMP, PP, and glucuronic acid pathways,
result in the formation of pyruvate which is in turn catabolized by the
TCA cycle pathway and the electron transport chain, resulting in
the formation of energy.
Metabolic intermediates formed by the operation of any of the
three primary pathways or the TCA cycle pathway may be used as
a source of carbon skeletons for biosynthetic purposes. Glucose
carbon atoms, while undergoing degradation via the EMP -TCA
scheme, may be drained off as carbon skeletons for lipids and amino
acids. The pentose units arising by way of the PP reactions may be
incorporated into nucleic acids, arabans and xylans; the C3 and C4
fragments may be used for the synthesis of aromatic compounds via
the intermediate, shikimic acid (50). In addition, the glucuronic acid
pathway serves in the synthesis of ascorbic acid, pectin and
hemicelluloses, as well as another source of non -cellulosic
polysaccharides as pentosans (45, 47).
Numerous plant tissues have been used for the study of glucose
metabolism: wheat shoots (51), wheat leaves (57), Avena coleoptile
(25), corn coleopile (59), plum leaves (1, 2), strawberry leaves (10),
Kalanchoe leaves (12, 13), tobacco leaf discs (49), tobacco tissue
culture (22), leaf tissue from castor bean, coffee, pea, and

3
sunflower (25), stem tissue of Bryophyllum, Coleus, pea, sunflower,
tomato (25), roots of castor bean (25), roots of corn (14, 25, 37).
Glucose metabolism in storage tissues of various types has been
investigated: carrots (3, 4, 5, 6, 48), turnips (5, 6), pumpkin
mesocarp (6), potatoes (4, 36, 43, 44, 56), and beets (9, 42, 55,
65). Various types of fruit have been used for this purpose: tomato
(18, 66), pepper (17), orange, lime and cucumber (8), parenchyma
of pear (30).
Glucose metabolism has been studied in various intact algae.
Syrett and coworkers have studied glucose catabolism in Chlorella
(15, 60, 61) as has Devlin (16). Bidwell and Ghosh have studied
glucose catabolism in brown algae (11), and Wildon and ap Rees have
investigated glucose catabolism in Anabaena cylindrica (69). In
addition, glucose metabolism in various intact plants has been
studied: wheat seedlings (19), barley seedlings (58), etiolated
sorghum seedlings (54), pea seeds (63, 70).
The present state of knowledge in this regard may be sum-
marized as follows: Glucose is thought to be catabolized mainly by
EMP -TCA cycle pathways and to a lesser extent (up to 30%) by the
PP pathway, as estimated by use of C -1 /C -6 ratios (6). Certain
workers have used intermediates such as fructose, gluconate,
pentoses, pyruvate and acetate as substrates in plants to confirm the
operation of the two primary catabolic pathways and the secondary

4
TCA cycle pathway.
Work with plant tissues and slices do serve a purpose in that
they reveal the presence of certain enzymes and metabolic schemes
operative in the region being investigated, but such approaches do
have disadvantages. First, these systems are usually decaying
systems, that is, the systems are not capable of rejuvenation.
Secondly, the systems are quite susceptible to attack by bacteria
and molds, which could give erroneous results on catabolic pathways
operative in the tissue.
For studying glucose catabolism in plants under physiological
conditions, it would be highly desirable to use an intact plant as the
test system inasmuch as it would reflect more accurately the
mechanisms of glucose catabolism which operate in the undisturbed
state in nature. However, the use of intact plants for study of
glucose catabolism is difficult because of the limited permeability of
the roots to substrate solutions. The limited permeability of sub-
strate into the plant via the root system would make it nearly
impossible to have a meaningful study of glucose catabolism by the
addition of exogenous glucose. It is therefore more desirable to
carry out experiments by removing the roots to facilitate transport
of substrate to the stem and leaves. This is justifiable since the
functions of the roots are to absorb water and minerals, to anchor
the plant, to store food, and to conduct dissolved substances and food.

5
The roots do not generally take an active part in the catabolism of
carbohydrates or respiration; most of the respiratory reactions are
known to take place in the leaves and to a limited extent, in the
stems of the plant.
The relative participation of pathways of glucose catabolism
in mung bean seedlings is not known. Work with plant organs and
tissues have shown that the EMP and PP pathways as well as the TCA
cycle pathway are operative in plant systems. In addition, mung
bean seedlings are known to contain enzyme systems for the oxida-
tion of glucose to glucuronic acid (23), and glucuronic and
galacturonic acid metabolism has been studied by Hassid's group in
very young mung bean seedlings (41). Graham and Walker have
shown that the TCA cycle pathway is operative in mung bean leaves
by the use of 14C- labeled TCA cycle intermediates (28).
The present study is designed, using detached Phaseolus
aureus shoots, to detect the operation of individual pathways for the
catabolism of glucose, and then to estimate more precisely the
relative participation of each of these pathways.

MATERIALS AND METHODS
Plant Material
6
Mung bean (Phaseolus aureus) seeds were obtained from a
local seed store. For germination, they were soaked for one day in
water, then planted in a tray of moist vermiculite. The vermiculite
was kept moist for the first five days covered with an inverted tray.
During this period the plant developed a substantial root system and
small leaves appeared. The cover was removed on the fifth day and
the plants were allowed to grow in the greenhouse under long -day
(15 hours) conditions for another five to seven days. Hoagland's
nutrient solution #1 (33, p. 31), diluted 1:1 with water, was given
on the seventh and ninth days, counting from the day the seeds had
been planted; water was supplied once daily on the other days. On
the tenth or eleventh day after planting, the cotyledons dropped off,
and the plants were then ready for use. Experiments were per-
formed with plants which were ten to thirteen days old, counting
from the date of planting. Plants generally had at this stage of
growth a stem length of about 14 centimeters and a total leaf area of
about 7 (6 to 8) square centimeters; they weighed on the average,
0.4 gram each.
The 'plants were selected on a basis of comparable size, with

7
regard to both stem length and leaf area. After removal of the
individual plants, the roots were cut off immediately above the upper-
most secondary root. The detached shoots were divided into groups
of ten, each group weighing 3 ± 0.1 grams. The cut ends of the
detached shoots were then put into distilled water for about 45
minutes.
Administration of Substrate
For experiments involving one -dose substrate administration,
each group of shoots was placed in a two -dram shell vial into which
had been placed 0.2 ml of substrate solution. The cut ends of the
stems were carefully arranged so as to be in contact with the solution
at the bottom of the vial, the assembly placed in a vacuum desiccator,
and a slight vacuum (to give 550 mm Hg) was pulled for a few seconds.
The vacuum of the system was slowly removed. As the system
approached atmospheric pressure, the substrate solution was drawn
up into the stems of the plants. A "rinse" of 0.2 ml distilled water
was quickly put into the vial, and the vacuum infiltration process
was repeated, this time using only a very slight negative pressure to
prevent drawing out the substrate solution. The whole process of
infiltration was performed in less than three minutes. Two hours
after placing in the plant chamber of the respirometer (Figure 1),
the shoots were supplied with 2 1/2 ml of water which were placed

air Inlet ---
feed tube
I
a--3 I/
Í
air outlet to: drying tower and ionization chamber
.-- no. 14 rubber stopper T
14"
no.16 needle 3 1/2"
-14" rubber stopper
- substrato tube
Figure 1. Respiration chamber for radiorespirometric experiments using plants.
8
JI 11
le
I
E,11
I ------- C :i
s!
1 -+
9
in the vial via the feed tube.
For the experiments involving continuous feeding of substrate,
the plants were prepared as described earlier, and the vial was
loaded with 2.0 ml of substrate solution, ten times the amount used
for the one -dose experiments. The vial and shoot assembly was
placed in a vacuum desiccator as above, and the vacuum infiltration
procedure was applied only once. The shoots were then placed in
the respirometer chamber as before, and readings were taken at
set intervals. Flow rate of sweeping air was 500 ml per minute;
the plants were allowed to respire in the dark as before. It took
12 1/2 hours for 2.0 ml of substrate solution to be absorbed by the
shoots.
That the vacuum infiltration method for substrate administra-
tion results in a rapid, homogeneous distribution of substrate in the
leaves was shown by radioautography of pressed plants after sub-
strate administration. For such an experiment, plants were
derooted and put into shell vials with 0.2 ml of substrate solution as
for the one -dose experiments, the assemblies were placed in the
desiccator, and vacuum was pulled and slowly removed. Timing
was started from the moment the substrate was drawn into the stem.
After a fifteen minute period, the detached shoots were put between
two sheets of Schleicher and Schuell 470 -A filter paper and were
"steam pressed" by placing the papers between two hotplates heated

10
to approximately 300oC, upon which surfaces were placed an
asbestos sheet and a piece of wet Schleicher and Schuell 470 -A
filter paper. The plants were sandwiched between the two hotplates
for one minute, and this resulted in a pressed plant which had been
instantly killed. The wet paper served to prevent scorching of the
plants. The pressed plants were allowed to dry, then placed on
Eastman blue- sensitive x -ray film for ten days. It was found that
fifteen minutes after substrate administration, the substrate was
distributed homogeneously throughout the leaves.
Transpiration Rate in Detached Shoots
The transpiration rate was determined for mung bean seedlings
under experimental conditions. Plants which were of suitable size
for experimentation were derooted and put in a measured volume of
water, then placed in the plant chambers. Air was drawn over the
plants at a rate of 500 ml per minute. After a ten -hour period, the
volume of water absorbed by the plants was noted. The average rate
observed with several determinations was 0. 16 ml per hour.
Determination of Respired 14CO2
For the determination of respired 14CO2, the plants were
placed in a plant chamber of the respirometer described by Wang
(64). A block diagram of this system is shown in Figure 2.

Plant Chamber
Electrometer Ion Chamber
Applied Physics Electrometer
DYMEC
V - F
Converter
RIDL
Scaler
Electrometer Applied DYMEC Plant Ion Physics V - F RIDL
Chamber Chamber Electrometer Converter Scaler
Electrometer Applied DYMEC
Plant Ion Physics V - F RIDL
Chamber Chamber Electrometer Converter Scaler
RIDL Electronic Timer
RIDL Programmer
Plant Chamber
Electrometer Ion Chamber
Applied Physics Electrometer
DYMEC
V - F
Converter
RIDL
Scaler
Figure 2,. Mock Diagram of Radiorespirometer with Printout System
HEWLETT
PACKARD PRINTER
-

12
Respiratory 14CO2 from four concurrent experiments was measured
continuously by means of an ion -chamber and vibrating reed
electrometer; readout of data was accomplished in digital form.
Flow rate of air sweeping through the plant chamber was adjusted
to a defined rate. The air from the plant chamber was then passed
through a Drierite gas drying unit to remove moisture from the air
stream; this dried air was then passed through the ion- chamber and
exhausted via a Gast pump.
The beta radiation from the 14CO which flows through the
ion -chamber produces electrons which are collected on the anode of
the ion -chamber. A current is produced by these electrons; this
current is directly proportional to the radioactivity present in the
chamber. This d -c signal is converted to an a -c signal in the pre-
amplifier unit of the electrometer; this a -c signal is then amplified
by the amplifier of the electrometer, is demodulated, and used as
the input to a voltage -to- frequency converter (VFC). The VFC
produces an output frequency that is proportional to the input voltage;
it serves to convert the analog information provided by the electrom-
eter to the digital form. The digital output of the VFC is displayed
by a six decade transistorized scaler. The scaler of each experi-
ment, a timer, and printer are connected to a programmer. When
the preset time is reached on the timer, the information from each
scaler is printed on tape by the printer.

13
Procedure for Typical Experiment
In a typical experiment, after administration of substrate, the
plants and their container were placed in the plant chamber of the
respirometer. Air was swept through the chamber at a rate of 500
ml per minute, and the respiratory 14CO2 was measured by the
system described above. The chambers containing the plants were
covered with a layer of black taffeta, and the room was kept dark to
permit the plants to respire in the dark. The plants were left in the
dark until the respiratory 14CO2 dropped to a negligible level,
usually 16 to 20 hours.
At the end of this period, the plants were removed from the
chambers and killed by immersing in 50 ml of boiling 80% ethanol.
Procedure for Substrate :Inventory
For the experiments requiring complete substrate inventories,
the plants were homogenized in a Waring blendor, using a 360 ml
Eberbach monel vessel, and the homogenate was filtered through
Whatman No. 41 filter paper. The residue was then extracted with
80% ethanol in a Soxhlet extractor for ] 6 hours. The extracts and
filtrate were combined, an aliquot removed for liquid scintillation
counting, and the remaining ethanol extract was evaporated to near
dryness in a rotary evaporator. A small amount of water was added

14
to the flask, and the evaporation process was repeated. This was
done several times to ensure complete removal of ethanol. The
ethanol extract was dissolved in water and subjected to liquid - liquid
extraction with petroleum ether for 24 hours to remove any fatty
substances. The petroleum ether and aqueous fractions were
separated and assayed for radioactivity.
Isolation of Amino Acids: The aqueous fraction obtained by the
above procedure was passed through a 1 x 15 cm column of Dowex
50 W x 8, 100 -200 mesh (in H form), to remove amino acids. The
column was rinsed with water to remove all the acidic and neutral
substances; the retained amino acids were then eluted from the
column with 4 N HC1. The HC1 was removed by rotary evaporation;
the residue was dissolved in water and assayed for radioactivity;
this was designated as the "amino acid fraction."
Isolation of Organic Acids: The effluent from the Dowex 50
column, which contained neutral and acidic substances, was passed
through a 1 x 15 cm column of Dowex 1 x 8, 100 -200 mesh (in
formate form), to remove the organic acids. The column was rinsed
with water to wash through the neutral substances, and the organic
acids retained by the resin were eluted with 4 N formic acid. The
effluents were assayed for radioactivity by liquid scintillation
counting. The fraction which was washed through the formate
column with water was designated as "simple carbohydrates," and

15
the effluent with formic acid was designated as "organic acids."
Determination of Starch: The residue from the Soxhlet
extraction was treated with perchloric acid for extraction of starch
according to the method of Hassid (31). After extraction with
perchloric acid, an aliquot of the starch extract was taken and
precipitated with iodine -potassium iodide reagent. The use of 25 mg
of soluble starch as a carrier improved the recovery of starch,
since mung bean seedlings contain little starch. The precipitated
starch- iodine complex was centrifuged, washed twice with "ethanolic
sodium chloride" (31), and the complex was dissociated with 0.25 N
ethanolic sodium hydroxide. After centrifugation of the liberated
starch, the starch was hydrolyzed according to the method of
Pucher (53), and the solution of the liberated glucose was assayed
for radioactivity by liquid scintillation counting.
Substrates
Glucose- 1 -14C, glucose- 2 -14C, glucose- 3,4 -14C, and
glucose -6 -14C were purchased from New England Nuclear Corpora-
tion, Boston, Massachusetts; Na gluconate -l- C 14 was obtained from.
Nuclear Chicago Corporation, Des Plaines, Illinois. Na glucuronate-
1 -14C and Na glucuronate -6 -14C were obtained from Nuclear
Research Chemicals, Inc., Orlando, Florida, and glucose -U- C 14
from Calbiochem, Los Angeles, California. Glucuronic -2 -14C was

16
prepared in the laboratory from glucose -2 -14C according to the
method of Finkle (21). Substrates were calibrated for radioactivity
by liquid scintillation counting of an aliquot of a diluted sample in a
Packard Tri -Carb 314 -EX2 liquid scintillation spectrometer.
Liquid Scintillation Counting of Radioactivity
Liquid scintillation counting was used to assay for radioactivity
of water -soluble biological compounds. For the calibration of sub-
strate solutions, 0.1 ml of a diluted (1 :100) sample was put into
5 ml of 1 :1 ethanolamine- absolute ethanol solution, and to this was
added 10 ml of a toluene scintillator solution containing O. 3 percent
p- terphenyl and 0.003 percent POPOP as primary and secondary
scintillators, respectively. The samples were then counted in a
Packard Tri -Carb 314 -EX2 liquid scintillation spectrometer at a
high voltage setting of 1020 v for the photomultiplier and a
discriminator setting of 100 -1000 divisions. For assay of radio-
activity of the various plant extracts and column effluents, a 0.5 ml
sample was dissolved in 15 ml of "diotol" scintillator (toluene -
dioxane- methanol 350:350:210 by volume, containing 73 g naphthalene,
4.6 g 2,5 diphenyl oxazole, and 0.08 g POPOP per liter) (32). The
absolute counting efficiency for each sample was determined by
recounting following addition of an internal standard of toluene -14 C
(New England Nuclear Corporation).

17
Calibration of the Electrometer System
Each ion- chamber electrometer system was calibrated, using
a tank of compressed gas, 0.51% CO2 in air containing 1.96 ± 0.01
x 104 dpm of 14C per liter. The 14C radioactivity in the gas was
determined beforehand by trapping the 14CO2 in ethanolamine-
ethanol (1:1) and counting the resulting ethanolamine carbonate in a
liquid scintillation counter. By calibration of the system, the total
number of digits accumulated by the scaler in a given period of
time can be converted to the amount of radioactivity passing through
the ion -chamber during that same period of time.

18
RESULTS AND DISCUSSION
The objective of the present study is to identify and estimate
the relative participation of the various pathways responsible for the
catabolism of glucose in mung bean seedlings. A method for the
estimation of three concurrent pathways of glucose catabolism i.e.,
the EMP, PP, and glucuronic acid pathways, has not yet been
developed. Even the estimation of two concurrent pathways presents
problems in that the "specific yields," i. e. , yields expressed in
terms of the net amount of utilized glucose (8, 40, 66), are difficult
to determine, since the amount of substrate which is engaged in
anabolic processes cannot be readily determined with certainty.
For the identification of pathways, information from a one -
dose substrate administration experiment is most useful. By the use
of specifically 14C- labeled glucose substrates, the interval yields
of respiratory 14CO2 may be plotted versus time and the curves so
obtained (i. e. radiorespirometric patterns) reflect the mechanisms
and associated kinetics by which glucose was catabolized to CO2 in
the system. The cumulative yields of 14CO2 at the end of the time
course serve as a basis for the estimation of the relative participa-
tion of pathways of glucose catabolism by employing equations
devised by Wang (8, 66, 68).
In Figure 3 are shown the radiorespirometric patterns obtained

HA
LF -
HO
UR
IN
TE
RV
ALS
RA
DIO
AC
TIV
ITY
YIE
LDS
O
F
RE
SP
IRA
TO
RY
4.0
3.5
3.0
2.5
2.0
1.5
1.0
0.5
8 10 12
TIME (HOURS)
14 16 18 20
19
Figure 3. The Radiorespirometric Pattern for the Utilization of 14C Specifically - Labeled Glucose by Ten (3.0 g fresh weight) Detached Mung Bean Shoots.
Glucose -1 -14C
Glucose -3, 4 -14C
Glucose -2 -14C
Glucose -6 -14C
Substrate Level: 300 µg in 0.2 ml administered by means of one -dose feeding.
Average of results from three experiments.
. . . .

20
by the catabolism of glucose labeled with 14C in various positions.
The substrate level for these experiments was 300 µg. As stated by
Wang (64), the slopes of the curves in this type of experiment pro-
vide the following information: 1) The ascending slope of each curve
is thought to represent the following processes: a) the uptake of the
substrate, which involves transport and absorption processes,
b) rates and relative participation of sequential reactions for the
production of respiratory CO2 from the substrate. 2) The descending
slope of the curve is thought to represent the following events:
a) exhaustion of the labeled substrate in the system, b) dilution of
the labeled substrate by endogenous compounds.
The extensive and rapid recovery of C -3 and C -4 of glucose as
14CO2, shown in data given in Figure 3, is indicative of the operation
of the EMP -TCA cycle pathways. The higher recovery of 14CO2
from C -1 than those from C -6 or C -2 indicates that the PP pathway
is operative. The operation of the EMP -TCA cycle pathways alone
would result in the conversion of C -2 of glucose to CO2 being more
extensive and rapid than that from C -1 or C -6 of glucose, since C -2
and C -5 of glucose correspond to the carboxyl group of acetyl CoA,
and C -1 and C -6 to the methyl group of acetyl CoA derived from
glucose. The fact that conversion of C -6 of glucose to CO2 is rapid
and occurs in higher yield than conversion. of C -2 of glucose to CO2
in the early phase of the experiment indicates that C -6 is oxidatively

21
decarboxylated via the glucuronic acid pathway at a rather rapid
pace. The appearance of a very early peak in the 14CO2 yield data
with glucose- 6 -14C, presumably via the glucuronic acid pathway,
is understandable since the decarboxylation of C -6 of glucose via
this pathway requires only a few enzymatic steps, whereas via the
EMP -TCA cycle pathway, the oxidation of C -6 of glucose to 14CO2
occurs through extensive metabolism of acetyl CoA, derived from
the substrate glucose, via the TCA cycle pathway.
The 14CO2 yield curve obtained in the experiment using
glucose-1-14C is consistent with the operation of the PP pathway;
here again, the preferential oxidative decarboxylation of C -1 of
glucose requires only a few enzymatic steps. Carbon atom 2 of
glucose is thought to be metabolized to 14CO2 via two possible routes:
via the EMP -TCA cycle pathways, where C -2 of glucose corresponds
to the carboxyl group of acetyl CoA, and via the PP pathway, which
results in re- formed fructose -6 -P. The re- formed hexose is then
mainly catabolized by the EMP -TCA cycle pathways; only a very few
percent of the re- formed hexose appears to be catabolized via the
pentose cycle (PC) pathway.
14 Data on CO2 yields obtained from the experiments with Na
gluconate -1 -14C at 200 4g level and Na glucuronate -6 -14C at 100 µg
level (Figure 4) show that both of these substances were rapidly and
extensively catabolized by mung bean seedlings; the cumulative

Figure 4. The Radiorespirometric Pattern for the Utilization of 14C Specifically- Labeled Gluconate and Glucuronate by Ten (3.0 g fresh weight) Detached Mung Bean Shoots.
Gluconate-1-14C Glucuronate- 6 14C e . . . .
Substrate Level: Gluconate at 200 µg in 0. 2 ml Glucuronate at 100 µg in 0.2 ml Both administered by means of one -
dose feeding.
Average of results from three experiments.

YIE
LDS
O
F
RE
SP
IRA
TO
RY
14
CO
2 IN
H
ALF
- H
OU
R
INT
ER
VA
LS
%
OF
S
UB
ST
RA
TE
R
AD
IOA
CT
IVIT
Y
w
b A
Ó
at
b
rn ó
(Sä(1011) 1111

24
14CO2 yields at 20 hours were 92 and 56 percent, respectively,
These experiments confirm the operation of both the PP pathway and
glucuronic acid pathway in this plant. In separate experiments using
Na glucuronate -1 -14C and -2 -14C as substrates, at a substrate level
of 100 µg per 3 grams fresh weight of detached mung bean shoots,
it was found that the labeled carbon atoms were converted to
respiratory CO2 at a very slow pace and gives rise to cumulative
14 CO2 yields of only 11% and 8%, respectively, at the end of the
utilization time course. These findings indicate that the primary
degradation products of the glucuronic acid pathway, i. e. , pentoses
(20) derived from glucose via the glucuronic acid pathway, are not
further catabolized to any great extent.
The present state of knowledge indicates that there are three
possible routes of glucose catabolism in plants. These routes are
namely, the EMP pathway, the PP pathway, and the glucuronic acid
pathway. The pentose phosphate derived from either the PP path-
way or the glucuronic acid pathway can be further catabolized via
the oxidative pentose cycle pathway. Despite the fact that the
reductive pentose cycle is the mechanism for photosynthesis in
plants, information so far in the literature leads one to believe that
the pentose cycle pathway does not play an important role for glucose
catabolism in plants in the dark (66). In fact, Gibson and Wang
reported that in the photosynthetic organism Rhodospirillum rubrum,

25
glucose cannot be utilized at all by the organism (27).
The catabolic rate of each of these routes is controlled by the
concentration of enzyme systems involved and kinetics of the
enzymatic reactions. Hence, when substrate glucose is administered
to the plant, it is subjected to competition from each of these
metabolic routes, and if the quantity of substrate is limited, the
catabolic rates of the individual pathways would then be the deter-
mining factor for the fate of the substrate. Thus in a typical
radiorespirometric experiment, when the level of substrate glucose
is low, the administered glucose would be routed preferentially to
the pathway that is equipped with enzyme systems capable of a rapid
turnover of substrate glucose. The radiorespirometric pattern so
obtained would then represent only a distorted picture, not the nor-
mal catabolic mechanisms, for glucose utilization in the plant.
Consequently, use cannot be made of the results of this type of
experiment for the estimation of relative pathway participations.
As indicated previously, the conversion of C -6 of glucose to CO2
via the glucuronic acid pathway and the conversion of C -1 of glucose
to CO2 via the PP pathway involve only a few steps of enzymatic
reactions. The respective decarboxylation processes are rapid,
as evidenced by the data given in Figure 3. It is therefore necessary
to maintain a sizable reservoir of substrate glucose so that the
effect, in the nature of an artifact, derived from the variation in

26
catabolic rates of pathways, can be minimized or eliminated.
It is therefore evident that, for the purpose of estimating
the relative participation of different catabolic pathways of glucose,
it is of paramount importance that an optimal substrate level be used
in the radiorespirometric experiments. The substrate must be
administered at a level which will not constitute an overdose, i.e.,
at a level such that the available enzyme systems will be taxed or
unable to handle such a quantity of substrate. In fact, with glucose
catabolism, the Crabtree effect (34, 35, 38, 62) has been observed
to be called into play when a massive dose of glucose is administered
to biological systems such as mammalian tissues, tumors, and
yeasts. Such an effect will give a distorted picture of glucose
catabolism in the normal state of the system. On the other hand,
a substrate level too low in magnitude is equally undesirable as
discussed in the preceding section. An additional criterion for the
selection of an optimal substrate level is that the administered
substrate be utilized by the test plants within a period of 10 -12
hours, generally considered to be the length of the normal dark
period for plants.
According to Onslow (52, p. 57), it is calculated that 4.0
grams fresh weight of intact plants such as Phaseolus vulgaris
(equivalent to 3.0 grams of detached shoots), contain 3. 7 mg
hexoses. Assuming that Phaseolus aureus seedlings are similar to
27
Phaseolus vulgaris plants in content of constituents, it can be
inferred that total free glucose content is about 3 mg in 10 intact
mung bean seedlings (4.0 g fresh weight). Of this, perhaps half
would be found in the roots (7), leaving 1.5 mg contained in the
detached shoot. Consequently the level of substrate glucose would
have to be approximately equal in magnitude to this amount.
From results given in Table 1, it is seen that small amounts
of glucose (50 -400 µg) are rapidly utilized by detached mung bean
shoots, as reflected by the observed short time course of utilization.
As the level of substrate is increased, a more defined pattern
depicting the participation of various glucose pathways is observed.
This fact implies that the distortion of catabolic patterns, which
resulted from variations in catabolic rates via different pathways,
has been either minimized or eliminated. It is noted that when the
substrate levels were within the range of 800 µg to 2, 000 µg, the
cumulative yield of 14CO2 from the administered glucose -U -14C was
maximal and constant. At a higher substrate level, the yield of
14CO2 declined, presumably as a result of overloading of the plants
with external glucose. It can therefore be concluded that the optimal
substrate level for the radiorespirometric experiments should be
set at between 1,000 to 1,500 µg of glucose. The experiments
designed for the estimation of glucose pathways were those using a
substrate level of 1, 000 µg.

Table 1. Cumulative Yields of Respiratory 14002 from Detached Mung Bean Shoots Metabolizing Glucose -U -14C at Various Substrate Levels
Substrate Time Elapsed After One -dose Substrate Administration, in Hours
Level, µg 1 2 3 4 5 6 8 10 20
50 2.4 8.4 12 15 17 18 21 24 32
100 1.7 5.4 8.5 11 13 15 19 22 31
300 1.1 4.5 8.4 11 13 16 19 22 31
400 1.5 5.0 8.3 11 13 15 18 22 32
800 0.7 3.2 6.3 8.5 11 14 18 22 33
1,000 0.7 3.1 6.1 8.3 11 13 18 22 33
1,500 0.5 2.5 5.1 7.0 9.3 12 16 20 33
2,000 1.1 3.6 6.4 8.7 11 13 16 20 34
5,000 0.5 1.9 3.6 5.6 7.7 9.8 14 17 30
10,000 0.6 2.1 3.9 6.1 8.3 10 14 18 31
20,000 0.3 1.2 2.3 3.8 5.5 7.3 11 15 28
50,000 0.2 0.5 1.0 1.5 2.1 2.8 4.5 6.5 20
29
As shown in results (given in Figure 5) obtained in experiments
using 14C specifically- labeled glucose samples as substrate, the
rapid and abundant yield of 14CO from C -3 and C -4 of glucose
indicates the important role played by the EMP -TCA cycle pathways.
The fact that the interval 14CO2 yields from C -1 of glucose is
greater than those from C -2 or C -6 of glucose is indicative of the
operation of the PP pathway. The small but significant maximum
observed in the early phase of the radiorespirometric data of
glucose -2 -14C experiments presumably reflects the limited con-
version of C -2 of glucose via the pentose cycle pathway. The
second maximum appears to reflect the conversion of C -2 of glucose
to CO2 via the EMP -TCA cycle pathway. Similarly, a small but
noticeable maximum observed in the radiorespirometric experiment
with glucose -6 -14C as substrate provides evidence that the glucuronic
acid pathway is operative but does not contribute much to the overall
catabolism of glucose. This is in sharp contrast to the radio -
respirometric findings in the experiments with 300 µg of substrate
glucose (Figure 3), showing that the glucuronic acid pathway was an
important pathway in the total catabolism of glucose. Evidently,
the experiments with the low substrate level presented a distorted
picture due to reasons that have been explained previously. The
second maximum observed in the radiorespirometric pattern on the
utilization of glucose -6 -14C at 1 mg substrate level can be explained

HA
LF -
HO
UR
IN
TE
RV
ALS
Y
IELD
S
OF
R
ES
PIR
AT
OR
Y
SU
BS
TR
AT
E
z
3.5
3.0
30
u_ o K
1.5
1.0
0.5
2 4 6 8 10 12
TIME (HOURS)
14 16 18 20
Figure 5. The Radiorespirometric Pattern for the Utilization of 14C Specifically -Labeled Glucose by Ten (3.0 g fresh weight) Detached Mung Bean Shoots. Glucose-1-14C Glucose-2-14C Glucose -3, 4 -14C Glucose -6 -14C Substrate Level: i mg in 0.2 ml administered by
means of one -dose feeding. Average of results from three experiments.
N o U

31
on the basis of the conversion of C -6 of glucose to CO2 via primarily
the EMP -TCA cycle pathways.
One finds in the literature that there exists no method for the
estimation of relative participation of three concurrent glucose
pathways (the EMP, PP, and glucuronic acid pathways) in biological
systems. This is due to the fact that the present methods for the
estimation of glucose pathways relies on the estimation of the con-
tribution of the PP pathway by direct measurement of the preferen-
tial conversion of C -1 of glucose to CO2. The contribution of the EMP -
TCA cycle pathways is estimated by difference (66, 68). The con-
version of C -6 of glucose to CO2 via the glucuronic acid pathway
prevents one, first, to determine the exact extent of the preferential
conversion of C -1 of glucose to CO2, since the latter determination
relies on the assumption that complete metabolic equivalence is
realized between C -1 and C -6 of glucose in pathways other than the
PP pathway. Such metabolic equivalence is indeed the case with
the EMP -TCA sequence. However, the glucuronic acid pathway
involves a preferential conversion of C -6 of glucose to CO2.
Secondly, the occurrence of three concurrent pathways prevents
one from estimating the contribution of the EMP -TCA cycle pathways
by difference unless the contribution of the glucuronic acid pathway
in the overall glucose catabolism can be determined directly,
In the present study, the radiorespirometric findings do not

32
provide direct quantitative information on the participation of the
glucuronic acid pathway in the overall catabolism of glucose. How-
ever, the kinetic information observed in these experiments does
present one with a means to estimate, crudely, the extent of
operation of the glucuronic acid pathway. If one visualizes that the
descending slope of the first maximum of the radiorespirometric
pattern observed in the glucose -6 -14C experiment represents the
decline of the contribution of the glucuronic acid pathway in overall
glucose catabolism, extrapolation of the slope downward to the
abscissa would then provide one with information on the conversion
of C -6 of glucose to CO2 via the glucuronic acid pathway (Figure 6).
If one subtracts the interval yield data of the extrapolated curve from
the overall yield data observed in the glucose -6 -14C experiment
during the entire time course, one would obtain the corrected yield
curve, designated as "6', " for the conversion of C -6 of glucose via
exclusively EMP -TCA cycle pathway (Figure 6). Thus the shaded
area "A" represents the contribution of the glucuronic acid pathway
to the overall conversion of C -6 of glucose to CO2.
Such an analysis of the radiorespirometric data leads to
information on the net contribution of the glucuronic acid pathway
to the overall catabolism of the administered glucose. This is
represented by the cumulative yield of respiratory 14CO2 from C -6
of glucose under the shaded area shown in Figure 6. This is true

HA
LF -
HO
UR
IN
TE
RV
ALS
Y
IELD
S
OF
R
ES
PIR
AT
OR
Y
SU
BS
TR
AT
E
33
3.5
3.0
> 2.5 r > - U
o 2 Q 2.0
cc
N O Q
LL
o
1.5
1.0
0.5
ss 1 `st \ \ ` \' "*....-.1% '1. 1
-"..-1-.... -i_ . ~- 1=7-y.......,_...., .1,---.1,.r .-- {".,.v .i_-- -.'-. --.4{
r \_ 1
12
1
14
1
16
1
20 2 4 6 8 10 IB
TIME (HOURS)
Figure 6. The Radiorespirometric Pattern for the Utilization of 14C Specifically -Labeled Glucose by Ten (3.0 g fresh weight) Detached Mung Bean Shoots, Showing the Extrapolation Technique used to Determine the Contribution of the Glucuronic Acid Pathway to Glucose Catabolism. Glucose -1 -14C Glucose -2 -14C Glucose -3, 4 -14C - - -- Glucose -6 -14C Shaded Area represents the Approximate Contribution to Glucose Catabolism by the Glucuronic Acid Pathway. Substrate Level: 1 n1c in 0.2 ml administered by
means of one -dose feeding. ,
34
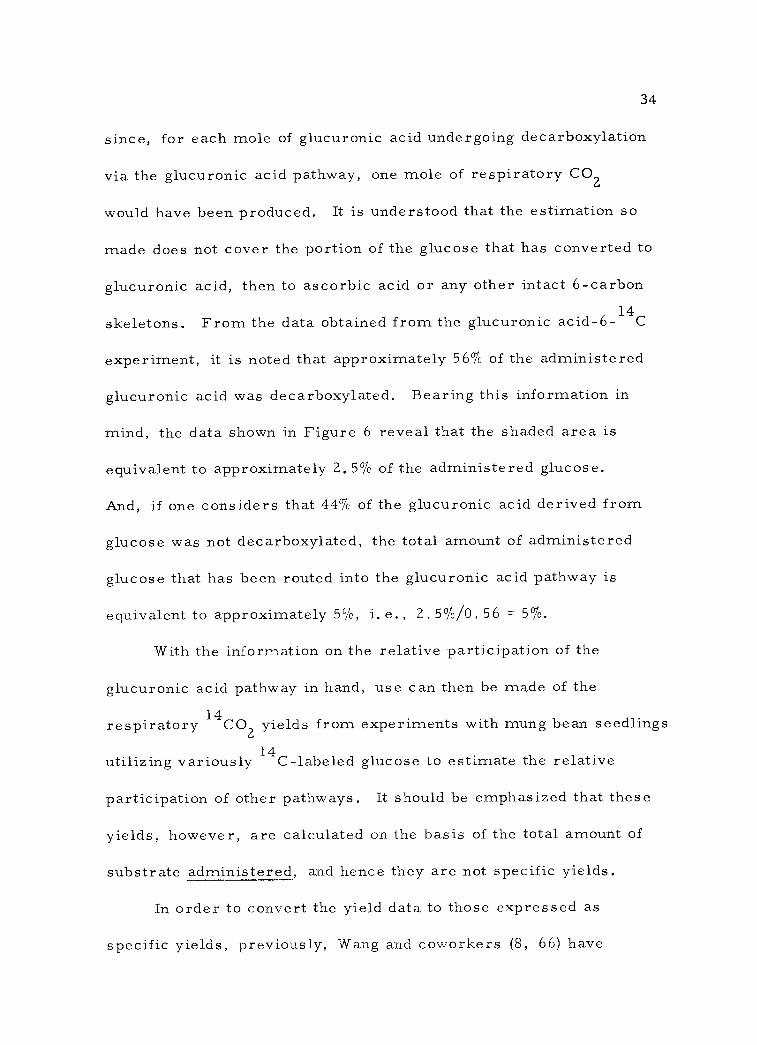
since, for each mole of glucuronic acid undergoing decarboxylation
via the glucuronic acid pathway, one mole of respiratory CO2
would have been produced. It is understood that the estimation so
made does not cover the portion of the glucose that has converted to
glucuronic acid, then to ascorbic acid or any other intact 6- carbon
skeletons. From the data obtained from the glucuronic acid -6 -14C
experiment, it is noted that approximately 56% of the administered
glucuronic acid was decarboxylated. Bearing this information in
mind, the data shown in Figure 6 reveal that the shaded area is
equivalent to approximately 2. 5% of the administered glucose.
And, if one considers that 44% of the glucuronic acid derived from
glucose was not decarboxylated, the total amount of administered
glucose that has been routed into the glucuronic acid pathway is
equivalent to approximately 5 %, i.e. , 2. 5 %/0. 56 = 5 %.
With the information on the relative participation of the
glucuronic acid pathway in hand, use can then be made of the
respiratory 14CO2 yields from experiments with mung bean seedlings
utilizing variously 14C- labeled glucose to estimate the relative
participation of other pathways. It should be emphasized that these
yields, however, are calculated on the basis of the total amount of
substrate administered, and hence they are not specific yields.
In order to convert the yield data to those expressed as
specific yields, previously, Wang and coworkers (8, 66) have

35
devised equations for such a conversion. However, the validity of
the equations devised by these authors was subject to a number of
assumptions, of which several cannot be readily verified. In the
present work, the amount of administered glucose engaged in
anabolic processes have been estimated directly by determining the
amount of substrate radioactivity in the carbohydrate fractions.
Thus, the results given in Table 2 indicate that labeled glucose sub-
strates were incorporated into the starch fraction to the extent of
0.4 to 0.6 percent and into the simple carbohydrates fraction to the
extent of 5 to 16 percent. Inasmuch as C -1, C -2, and C -6 of glucose
can be incorporated into the simple carbohydrates fraction via path-
ways involving degradation products of substrate glucose, it deems
to be desired to rely on the data in this regard observed in the
glucose-3,4-14C experiments.
The amount of substrate glucose that has engaged in catabolic
processes can be calculated as follows:
where
Gt = G,1, - GT' (1)
Gt = the fraction of administered glucose engaged in
catabolic functions;
GT = the fraction of substrate glucose administered, which
is by definition, unity;

Table 2. Distribution of 14C Activity From Administered Glucose in Constituents Isolated From Mung Bean Shoots
Constituent
Percent of Administered Radioactivity
Glucose-114C Glucose -2 -14C Glucose- 3,4 -14C Glucose Glucose -6 -14C
Amino Acids 7.0 4.0 2,2 9.0
Organic Acids 8.4 8.0 3.4 15
Simple 14 11 5.3 16 Carbohydrates Starch 0.6 0.4 0.5 0.5
Fat 0.6 0.2 0.2 2.4
14C 25 24 44 18
Experimental Conditions: Substrate Level: 1 mg by one -dose substrate administration Plants: 3.0 grams (fresh weight) of detached mung bean shoots Experimental environment: Dark Experimental duration: 20 hours
O9

37
GT, = the fraction of the labeled glucose administered
which was engaged in anabolic processes.
From the results given in Table 2 for the glucose -3, 4 -14C experi-
ment, one finds that the fraction GT = 0.053 (simple carbohydrates)
+ 0.005 (starch) = 0.06. Hence, the fraction Gt = 1.00 - 0.06 =
0. 94, that is, 94% of the administered glucose has been engaged
in catabolic processes.
Once the fraction of administered glucose that has engaged in
catabolic processes is known, the observed cumulative yield of
respiratory 14CO2 derived from the individual 14C specifically -
labeled glucose substrates can be used directly as basic data for the
estimation of glucose pathways.
The basic equation for the estimation of three concurrent
pathways by means of the yield method can be readily derived as
follows: The concept as well as the necessary assumptions under-
lying the derivation of the equation is much the same as that
described previously by Wang (66, 68), except in the present case,
consideration is given to the contribution of the glucuronic acid
pathway to the overall glucose catabolism. Hence,
where
1 = G + G + G p e gu (2)
G = fraction of glucose catabolized by the PP pathway;
G = fraction of glucose catabolized by the EMP pathway; e

Ggu = fraction of glucose catabolized by the glucuronic
acid pathway.
G = Gt p
G1 - (G6 - (GpG6 + Ggu) )
(3)
38
where G1, G6 = cumulative yield of respiratory 14CO2 derived
from mung bean shoots metabolizing equal amounts
of the respectively 14C- labeled glucose.
Expressed as a fraction of the administered
radioactivity.
Upon simplification of equation (3) and solving for G ,
G1-(G6-Gu) G =
g
P Gt-G6
one obtains
(4)
In the foregoing equations, the fate of C -6 of glucose in the PP path-
way is represented by the term GpG6 instead of GpA6, where
A6 designates the yield (in fractions) of C -6 of gluconate in
respiratory CO2. This is justifiable since previously it has been
observed that there exists little difference between the yield of C -6
of glucose in respiratory CO2 as compared to that of C -6 of
gluconate (66).
Using the yields of 14CO2 given in Table 2 and substituting
Ggu = 0.045 and Gt = 0.94, equation (4) becomes
t
P
gu

39
0.25 -(.18-.045) 0.16 or 16%; G =1 - G -G 0.94-.18 e p Ggu
= 1 - 0.16 - 0.05 = 0.79 or 79%
In other words, of the glucose administered to mung bean shoots,
6% was routed into anabolic pathways. For the portion of glucose
engaged in catabolic processes, 79% was catabolized via the EMP
pathway; 16% was catabolized via the PP pathway; and 5% via the
glucuronic acid pathway.
The estimation of relative participation of pathways can also
be made by a new method devised by Wang (39, 67). With this
method, the catabolic rate of an individual glucose pathway is
determined while the biological system is metabolizing substrate
glucose under metabolic steady state conditions. Such a condition,
using mung bean shoots as a test system, can be realized when
substrate glucose is administered by means of the continuous feeding
technique. Comparisons of the relative catabolic rates via various
glucose pathways provide one directly with information on the
relative participations of pathways in the overall glucose catabolism.
Catabolic rate of the EMP -pyruvate decarboxylation sequence is
revealed by the rate of production of respiratory 14CO2 from
glucose-3,4-14C. The rate of the PP pathway is revealed by
examining the rate of preferential conversion of C -1 of glucose to
respiratory CO ?.
G p
=
40
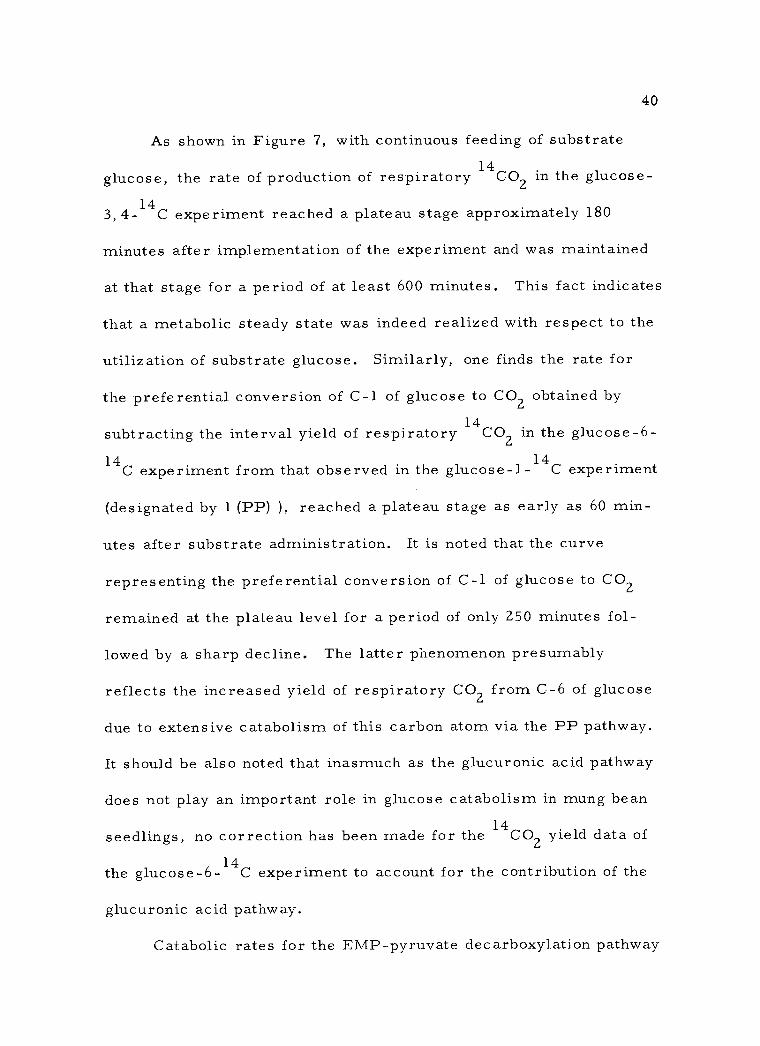
As shown in Figure 7, with continuous feeding of substrate
glucose, the rate of production of respiratory 14CO2 in the glucose-
3,4-14C experiment reached a plateau stage approximately 180
minutes after implementation of the experiment and was maintained
at that stage for a period of at least 600 minutes. This fact indicates
that a metabolic steady state was indeed realized with respect to the
utilization of substrate glucose. Similarly, one finds the rate for
the preferential conversion of C -1 of glucose to CO2 obtained by
subtracting the interval yield of respiratory 14CO2 in the glucose -6-
14C experiment from that observed in the glucose -1 -14C experiment
(designated by 1 (PP) ), reached a plateau stage as early as 60 min-
utes after substrate administration. It is noted that the curve
representing the preferential conversion of C -1 of glucose to CO2
remained at the plateau level for a period of only 250 minutes fol-
lowed by a sharp decline. The latter phenomenon presumably
reflects the increased yield of respiratory CO2 from C -6 of glucose
due to extensive catabolism of this carbon atom via the PP pathway.
It should be also noted that inasmuch as the glucuronic acid pathway
does not play an important role in glucose catabolism in mung bean
seedlings, no correction has been made for the 14CO2 yield data of
the glucose -6 -14C experiment to account for the contribution of the
glucuronic acid pathway.
Catabolic rates for the EMP- pyruvate decarboxylation pathway

MIN
UT
E
INT
ER
VA
LS
RE
SP
IRA
TO
RY
SU
BS
TR
AT
E
RA
DIO
AC
TIV
ITY
20
YIE
LDS
O
F
o
z
ó á
08
07
06 t-
05
04
ó 03
3 (4) __rl--¡--1---- 1- - --- .- + Ì._ 4
/ !
f , ...-i..-_.r.
, / .. ' ,r .^`t..r
I / /-'..- , r
/ 6 - 1
/ r i :. "- I (PP)
01 1 r - J
I1/ 0 06 18 30 42 54 66 78 9.0
TIME (MINUTES) x 10-2
Figure 7. The Radiorespirometric Pattern for the Utilization Glucose by Ten (3.0 g fresh weight) Detached Mung Bean Shoots. Glucose -1 -14C Glucose -2 -14C Glucose -3, -14C 4 Glucose -6 -14C Substrate Level: 10 mg in 2 ml, administered by means of continuous feeding. Average of results from two experiments.
14C of C Specifically - Labeled
a-
>
V o 0 a cr
C F N m N
02
'-. .
..w
I
. . .

42
and the PP pathway were calculated, making use of data observed
between 240 and 260 minutes (Figure 7). It is noted that during this
time period, metabolic steady states were realized with regard to
both of these pathways.
The determination of catabolic rates of glucose utilization via
the EMP -pyruvate decarboxylation pathway relies on the understand-
ing that for each mole of glucose catabolized by this sequence, 1
mole of CO2 will be produced from either C -3 or C -4 of glucose.
Similarly, for the catabolism of glucose via the PP pathway, 1 mole
of respiratory CO2 will be derived from C -1 of 1 mole of glucose.
From the results given in Figure 7, one notes that the yield of
respiratory 14 CO2 derived from glucose-3,4-14C is 0. 724% during
the period of 20 minutes, which is equivalent to 0.0362% per minute.
During the same period, the yield of 14CO2 derived from C -1 of
glucose produced via the PP pathway is 0. 118 %, or 0.0059% per
minute. It follows that during this defined period of one minute that
the fraction of substrate glucose catabolized via EMP -pyruvate
decarboxylation pathway and PP pathway is equivalent to
0.000362 + 0.000059 = 0.000421, or 0.0421 %. One can then calculate
that relative participation of the EMP -pyruvate decarboxylation
pathway for the catabolism of said fraction of glucose is:
0.000362 Ge 0.000362 + 0.000059 x 100 = 86 %. Similarly,

43
O. 000059 G - 0,000362+0,000059 x 100 = 14 %. The relative participation
P
of EMP - pyruvate decarboxylation pathway and the PP pathways as
calculated by the method of catabolic rates are very close to that
calculated by the yield method. It should be emphasized, however,
that with the catabolic rate method, the values for G and G p e
were determined directly, whereas with the yield method, the value
of Ge is obtained by difference. However, in the present case the
catabolic rate method does not take into consideration the operation
of the glucuronic acid pathway, since the latter pathway is operative
only to a limited extent in mung bean seedlings.
The close proximity of the values obtained for the relative
participation of glucose pathways by the yield method and the
catabolic rate method leads one to believe that the findings represent
a reliable assessment of the contribution of each of the pathways to
the overall glucose catabolism in mung bean seedlings. It can be
therefore stated with reasonable certainty that in mung bean
seedlings, glucose is catabolized predominantly by the EMP path-
way, with the PP pathway and the glucuronic acid pathway playing
relatively minor roles in overall glucose metabolism.
e

44
SUMMARY
The operation of the various pathways of glucose catabolism in
detached mung bean (Phaseolus aureus) shoots was investigated by
the radiorespirometric method using an ion chamber -electrometer
system. It was found that glucose is catabolized by way of the
Embden -Meyerhof - Parnas (EMP), pentose phosphate (PP), and
glucuronic acid pathways. Discussion was given regarding the use
of an optimum substrate level in glucose catabolism studies.
Using this optimum substrate level, the contributions of the three
primary pathways to the total glucose catabolism in mung bean
shoots were estimated by use of respiratory 14CO2 yield data and
substrate inventory data.
The catabolic rate method was employed in the study of
glucose catabolism by detached mung bean shoots in order to
determine the contributions of the EMP and PP pathways to glucose
catabolism. Reasonably close agreement was obtained between this
method and the 14CO2 yield method.
It was concluded that in detached shoots of Phaseolus aureus,
glucose is catabolized predominantly by way of the EMP pathway,
with the PP pathway and the glucuronic acid pathway playing
relatively minor roles in the overall catabolism of glucose.

45
BIBLIOGRAPHY
1. Anderson, J. D., P. Andrews and L. Hough. Biosynthesis and metabolism of polyols. 2. The metabolism of 14C- labelled D- glucose, D- glucuronic acid, and D- glucitol (sorbitol) by plum leaves. The Biochemical Journal 84:140 -146. 1962.
2. Andrews, P., L. Hough and J. M. Picken. The biosynthesis of polysaccharides. Incorporation of D(1- 14C)glucose and D(6- 14C)glucose into plum leaf polysaccharides. The Biochemical Journal 94:75-80. 1965.
3. ap Rees, T. and Harry Beevers. Pathways of glucose dissimila- tion in carrot slices. Plant Physiology 35:830 -838. 1960.
4. . Pentose phosphate pathway as a major component of induced respiration of carrot and potato slices. Plant Physiology 35:839 -847. 1960.
5. ap Rees, T. , E. Blanch and D. D. Davies. Effect of glucose concentration upon the production of 14CO2 from glucose-1- 14C and glucose- 6 -14C. Plant Physiology 40:748 -751. 1965.
6. ap Rees, T. , E. Blanch, D. Graham and D. D. Davies. Recycling in pentose phosphate pathway: comparison of C6 /C1 ratios measured with glucose - C and fructose Plant Physiology 40:910 -914. 1965. . .
7. Bailey, R. W. , S. Haq and W. Z. Hassid. Carbohydrate composition of particulate preparations from mung bean (Phaseolus aureus) shoots. Phytochemistry 6:293 -301. 1967.
8. Barbour, R. D. , D. R. Buhler and C. H. Wang. Identification and estimation of catabolic pathways of glucose in fruits. Plant Physiology 33:396 -400. 1958. . .
9. Barbour, Royal D. and C. H. Wang. Carbohydrate metabolism in sugar beets. 1. Respiratory catabolism of mono- and disaccharides. Journal of the American Society of Sugar Beet Technologists .1.1:436 -442. 1961.

46
10. Barker, J. and M. E. Younis. Studies in the respiratory and
carbohydrate metabolism of plant tissues. XVII. The effect of iodoacetate on the CO2 output, pathways of glucose respiration and contents of phosphate esters in strawberry leaves. Journal of Experimental Botany 16:74 -85. 1965.
11. Bidwell, R. G. S. and N. R. Ghosh. Photosynthesis and
metabolism of marine algae. V. Respiration and metabolism of C14- labelled glucose and organic acids supplied to Fucus vesiculosus. Canadian Journal of Botany 41 :155 -163. 1963.
12. Bradbeer, J. W. Physiological studies on acid metabolism in
green plants. IX. The distribution of 14C in malate of darkened Kalanchoë leaf fragments after infiltration with labelled pyruvate. Proceedings of the Royal Society of London, Ser. B, 157 :279 -289. 1963.
13. Bradbeer, J. W. and S. L. Ranson. Physiological studies on
acid metabolism in green plants. VIII. The utilization of labelled pyruvate, fumarate, and glucose in Kalanchoë leaves in the dark. Proceedings of the Royal Society of London, Ser. B, 157 :258 -278. 1963.
14. Butt, V. S. and H. Beevers. The regulation of pathways of
glucose catabolism in maize roots. The Biochemical Journal 80:21 -27. 1961.
15. Casselton, P. J. and P. J. Syrett. The oxidation of 14 -C-
labelled glucose by Chlorella vulgaris. I. The time -course of 14c oz production. Annals of Botany 26:71 -82. 1962,
16. Devlin, Robert Martin. Oxidative enzymes and pathways of glucose metabolism in Chlorella pyrenoidosa (van Niel's strain). Doctoral Dissertation. College Park, University of
Maryland, 1963. 61 numb. leaves. (Abstracted in Disserta- tion Abstracts 24: no. 4938. 1964)
17. Doyle, W. P. and C. H. Wang. Glucose catabolism in pepper fruit (Capsicum frutescens longurn). Canadian Journal of
Botany 36:483 -490. 1958.
18. Doyle, W. P. and Chih H. Wang. Radiorespirometric studies of glucose catabolism in tomato fruit. Plant Physiology 35:
751 -756. 1960.

47
19. Edelman, J., V. Ginsburg and W. Z. Hassid. Conversion of monosaccharide to sucrose and cellulose in wheat seedlings. Journal of Biological Chemistry 213:843 -854. 1955.
20. Eisenberg, Frank, Jr., Peter G. Dayton and J. J. Burns. Studies on the glucuronic acid pathway of glucose metabolism. Journal of Biological Chemistry 234 :250 -253. 1959.
21. Finkle, Bernard. Western Regional Research Laboratory, U. S. Dept. of Agriculture. Personal communication. Albany, California. August, 1965.
22. Fox, J. Eugene, Chong -maw Chen and Ian Gillam. Glucose catabolism in normal and autonomous tobacco tissue cultures. Plant Physiology 40:529 -534. 1965.
23. Ganguli, N. C. and Sankar Adhya. Enzymes involved in the oxidation of glucose to glucuronic acid by mung -bean seedling extract. Enzymologia 23:143 -155. 1961.
24. Gibbs, Martin. Metabolism of carbon compounds. Annual Review of Plant Physiology 10:329 -378. 1959.
25. Gibbs, Martin and Harry Beevers. Glucose dissimilation in the higher plant. Effect of age of tissue. Plant Physiology 30: 343 -347. 1955.
26. Gibbs, Martin, Joan M. Earl and Jean L. Ritchie. Respiration of the pea plant. Metabolism of hexose phosphate and triose phosphate by cell -free extracts of pea roots. Plant Physiology 30:463 -467. 1955.
27. Gibson, Margaret S. and Chih H. Wang. Carbohydrate catabolism in Rhodospirillum rubrum. (Abstract) Plant Physiology 40(suppl. ):xxxvii. 1965.
28. Graham, D. and D. A. Walker. Some effects of light on the interconversion of metabolites in green leaves. The Bio- chemical Journal 82 :554- 560. 1962.
29, Hackett, David P. Respiratory mechanisms in higher plants. Annual Review of Plant Physiology 10:113 -146. 1959.

48
30. Hartmann, Claude. Sur l'utilisation, par le parenchyme de poire, de glucose marque selectivement en C1 ou en C6. Comptes Rendus des Séances de L'Académie des Sciences, Ser. D, 265:1718-1720. 1966.
31. Hassid, W. Z. and Elizabeth F. Neufeld. Quantitative deter- mination of starch in plant tissues. In: Methods in carbohydrate chemistry, Vol. 4, ed. by Roy L. Whistler. New York, Academic Press, 1964. p. 33 -36.
32. Herberg, R. J. Determination of carbon -14 and tritium in blood and other whole tissues. Analytical Chemistry 32 :42 -46. 1960.
33. Hoagland, D. R. and D. I. Arnon. Water culture method for growing plants without soil. Berkeley, 1950. 32 p. (California. Agricultural Experiment Station. Circular 347)
34. Hommes, F. A. Mechanism of the Crabtree effect in yeast grown with different glucose concentrations. Archives of Biochemistry and Biophysics 113 :324 -330. 1966.
35. . Metabolic control mechanisms in yeast grown with different glucose concentrations. Archives of Biochemistry and Biophysics 109:168 -172. 1965.
36. Honda, Koichiro and Yoshiaki Oda. Respiration and carbohydrate metabolism of potato tuber. Agricultural and Biological Chemistry 25:24 -29. 1961.
37. Humphreys, T. E. and W. M. Dugger, Jr. Use of specifically labeled glucose and gluconate in the evaluation of catabolic pathways for glucose in corn roots. Plant Physiology 34:580- 582. 1959.
38. Ibsen, Kenneth H. The Crabtree effect: a review. Cancer Research 21:829 -841. 1961.
39. Jacobsen, D. W. and C. H. Wang. Catabolic rates of individual glucose pathways in bakers' yeast. Federation Proceedings 26:855. 1967.
40. Katz, Joseph and Harland G. Wood. The use of C14O2 yields from glucose-1- and -6 -C14 for the evaluation of the pathways of glucose metabolism. Journal of Biological Chemistry 238: 517 -523. 1963.

49
41. Kessler, Gian. et al. Metabolism of D- glucuronic acid and D- galacturonic acid by Phaseolus aureus seedlings. Journal of Biological Chemistry 236:308 -312. 1961.
42. Kolattukudy, P. E. and D. J. Reed. Metabolism of red beet slices. II. Effects of aging. Plant Physiology 41 :661 -669. 1966.
43. Laties, George G. Relation of glucose absorption to respiration in potato slices. Plant Physiology 39:391 -397. 1964.
44. . The onset of tricarboxylic acid cycle activity with aging in potato slices. Plant Physiology 39:654 -663. 1964.
45. Loewus, Frank A. Tracer studies on ascorbic acid formation in plants. Phytochemistry 2:109 -128. 1963.
46. Loewus, Frank A., Bernard J. Finkle and Rosie Jang. L- Ascorbic acid: a possible intermediate in carbohydrate metabolism in plants. Biochimica et Biophysica Acta 30: 629 -635. 1958.
47. Loewus, Frank A. , Stanley Kelly and Elizabeth F. Neufeld. Metabolism of myo- inositol in plants; conversion to pectin, hemicellulose, D- xylose, and sugar acids. Proceedings of the National Academy of Sciences of the United States of America 48:421 -425. 1962.
48. Lustinec, Jiri et al. Randomization of carbon atoms in the glucose molecule and changes of specific radioactivity of C14O2 liberated by callus tissue of Daucus carota (carrot) from glucose -6 -C14 and -1 -C14. Biologia Plantarum, Academia Scientiarum Bohemoslovenica 6 :209 -218. 1964. (Abstracted in Chemical Abstracts 61:13637f. 1964)
49. MacLachlan, G. A. and H. K. Porter. Metabolism of glucose carbon atoms by tobacco leaf disks. Biochimica et Biophysica Acta 46 :244 -258, 1961.
50. Nandy, Minati and N. C. Ganguli. Synthesis of 5- dehydro- shikimic acid from carbohydrates by mung bean (Phaseolus aureus) seedling extract. Journal of Scientific and Industrial Research 21:34 -38. 1962.
50
51. Neish, A. C. The biosynthesis of cell wall carbohydrates. IV. Further studies on cellulose and xylan in wheat. Canadian Journal of Biochemistry and Physiology 36:187 -193. 1958.
52. Onslow, Muriel Wheldale. The principles of plant biochemistry. Part I. Cambridge, University Press, 1931. 326 p.
53. Pucher, George W., Charles S. Leavenworth and Hubert Bradford Vickery. Determination of starch in plant tissues. Analytical Chemistry 20:850 -853. 1948.
54. Reed, Donald J. Glucose metabolism of etiolated sorghum seedlings. (Abstract) Plant Physiology 36(suppl. ):xxxii. 1961.
55. Reed, D. J. and P. E. Kolattukudy. Metabolism of red beet slices, I. Effects of washing. Plant Physiology 41 :653 -660. 1966.
56. Romberger, John A. and Glenville Norton. Changing respiratory pathways in potato tuber slices. Plant Physiology 36 :20 -29. 1961.
57. Shaw, Michael and D. J. Samborski. The physiology of host - parasite relations. III. The pattern of respiration in rusted and mildewed cereal leaves. Canadian Journal of Botany 35: 389-407. 1957.
58. Shibko, S. and J. Edelman. Randomization of the carbon atoms in glucose and fructose during their metabolism in barley seedlings. Biochimica et Biophysica Acta 25 :642 -644. 1957.
59. Slater, W. G. and H. Beevers. Utilization of D- glucuronate by corn coleoptiles. Plant Physiology 33:146 -151. 1958.
60. Syrett, P. J. Fermentation of glucose by Chlorella vulgaris. Nature 182 :1734 -1735. 1958.
61. Syrett, P. J. and Hee -Aik Wong. The fermentation of glucose by Chlorella vulgaris. The Biochemical Journal 89:308 -315. 1963.
62. Van Eys, Jan. Regulatory mechanisms in energy metabolism. Annual Symposium, Society of General Physiologists 7:141- 166. 1960.

51
63. Wager, Harold G. Pathways of utilization of glucose -1 -C14 and glucose -6 -C14 in slices of peas. Journal of Experimental Botany 14:62-81. 1963.
64. Wang, C. H. Radiorespirometry. In: Methods of biochemical analysis Vol. 15. p. 1 -941 . (Pre -publication form)
65. Wang, C. H. and Royal D. Barbour. Carbohydrate metabolism of sugar beets II. Catabolic pathways for acetate, glyoxylate, pyruvate, glucose, and gluconate. Journal of the American Society of Sugar Beet Technologists 11 :443 -454. 1961.
66. Wang, C. H., W. P. Doyle and J. C. Ramsey. Role of hexose monophosphate pathway in tomato catabolism. Plant Physiology 37 :1 -7. 1962.
67. Wang, C. H., D. W. Jacobsen, and G. Ikeda. Estimation of glucose pathways by a method based on comparative catabolic rates. Paper to be presented at Seventh International Congress of Biochemistry, Tokyo, August 19 -25, 1967.
68. Wang, Chih H. and Julia K. Krackov. The catabolic fate of glucose in Bacillus subtilis. Journal of Biological Chemistry 237 :3614 -3622. 1962.
69. Wildon, D. C. and T. ap Rees. Metabolism of Glucose -C14 by Anabaena cylindrica. Plant Physiology 40:332 -335. 1965.
70, Winkle, Lyman William. Carbohydrate catabolism in pea seeds (Pisum sativum) and the effects of gibberellic acid. Master's thesis. Corvallis, Oregon State University, 1962. 50 numb. leaves.
Copyright © 2022 FDOKUMEN