Cofradías en el Guanajuato virreinal. Un panorama general en dos momentos históricos, 1680 y 1791.

Genetic Resources and Crop Evolution (2005) 52: 589–599 � Springer 2005
DOI 10.1007/s10722-004-6125-x
Spatial distribution of genetic diversity in wild populations of Phaseolusvulgaris L. from Guanajuato and Michoacan, M�exico
Emeterio Payro de la Cruz, Paul Gepts1, Patricia Colunga GarciaMarın2 andDaniel Zizumbo Villareal2,*Facultad de Ciencias Biologicas y Agropecuarias, Universidad de Colima; 1Department of Agronomy andRange Science, University of California, Davis; 2Unidad de Recursos Naturales, Centro de InvestigacionCientıfica de Yucatan; *Author for correspondence (e-mail: [email protected]; fax: 9 81 39 00)
Received 7 August 2003; accepted in revised form 13 February 2004
Key words: Diversity, Genetic structure, Germplasm, In situ conservation, ISSR molecular markers,Mesoamerica, Phaseolus vulgaris L., Transgenes
Abstract
The diversity, genetic structure, and genetic flow of wild populations of Phaseolus vulgaris L. within itsMesoamerican area of domestication, were analyzed by means of morphological and inter-simple sequencerepeat molecular markers. Overall, 89% of the loci studied were polymorphic, 35% in the least diversepopulation and 65% in the most diverse. Genetic diversity in the populations was high, between h¼ 0.14 and0.29, as was the maximum distance between populations (D ¼ 0.3). Between 40% and 45% of the diversitywas explained by the differences among populations, indicating that a large number of populations isnecessary to represent the wild gene pool in the germplasm collections. We found uniformity in allelefrequencies among the populations, suggesting presence of outcrossing. We did not find correlation betweengenetic and geographic distances, but the dendrogram topology suggests geographical isolation due to themountainous topography. Negative correlations were observed between the coefficient of variation of seedsize and the distance between wild populations and fields .We obtained a highly negative correlation betweenpercentage of polymorphic loci and distance to the nearest crop field, which also suggests gene flow from thedomesticated populations. These observations suggest that genetic flow is taking place from domesticatedtoward wild populations and that the farmer, through his agricultural activities, could be influencing themagnitude and the characteristics of the gene flow, and along with this, the differentiation of wild popula-tions. New approaches should be established for conservation in situ and maintaining bio-safety, given therisk of introducing genotypes from the Andes and transgenic varieties and causing genetic assimilation.
Introduction
The common bean (Phaseolus vulgaris L.) is one ofthe 10 most important crops in the world, with aproduction of almost 8 million tons per year on 13million hectares. It is calculated that more than60% of world production derives from domesti-cates of Mesoamerican origin (Tohme et al. 1996;Beebe et al. 2000). In M�exico, the common bean isthemain source of protein for the humanpopulation.
Current yield is estimated at around 650 kg/ha/harvest, while its potential yield is estimatedbetween 4000 and 5000 kg/ha/harvest (Gepts1993). The low yields at present are partly a resultof a lack of knowledge and poor exploitation of thegenetic diversity of the wild gene pool of the species(Gepts and Debouck 1991).
Wild and domesticated populations constitutethe primary gene pool of the species, within whichgenetic compatibility has been reported (Debouck

and Smart 1995). Comparisons of wild and domes-ticated populations indicate two main gene poolsfrom which domestication took place in theAmericas (Koenig and Gepts 1989; Debouckand Smart 1995). One center of domestication islocated in Mesoamerica, in mesic habitats, between700 and 2000 m above sea level, where some wildpopulations present small seeds with type ‘‘S’’ pha-seolin and large bracteoles. These populations gaverise through domestication to plants with increasedseed size and with the same type of phaseolin andlarge bracteoles. The other center of domesticationis located in the Andes, where the wild populationspresent larger seeds, with predominantly type ‘‘T’’phaseolin and small bracteoles. Through domesti-cation, these populations gave rise to plants withlarge seeds and with the same type of phaseolin(Koenig and Gepts 1989; Gepts and Debouck1991). The existence of these two gene poolswas further confirmed with isozyme, RFLP, andAFLP markers (Koenig and Gepts 1989; Becerra-Velasquez and Gepts 1994; Tohme et al. 1996).
Domestication in the Mesoamerican area couldhave been carried out in the area to the west of thecenter of M�exico, in the states of Guanajuato,Jalisco and Michoacan, where wild populationscan be found at present with the ancestral ‘‘S’’type of phaseolin (Gepts 1988; Gepts andDebouck 1991). It has been suggested that primi-tive domesticates with ‘‘S’’ phaseolin were dispersedto other regions, becoming the dominant type ofphaseolin in all the Mesoamerican domesticatedpopulations. The dispersal of the ‘‘S’’ phaseolintype may have been favored because phenotypiccharacters such as seed size and color genes arelinked to the phaseolin locus (Motto et al. 1978;Johnson et al. 1996; Koinange et al. 1996). Thus,the genome of most of present-day Mesoamericanlandraces is derived from a single region withinM�exico (Beebe et al. 2000).
It has been argued that wild populations presentgreater genetic variability than domesticated beans,since the arcelin seed protein and some typesof phaseolin are only found in wild populations(Romero and Bliss 1985; Gepts et al. 1986;Romero et al. 1986; Debouck and Tohme 1989;Koenig et al. 1990; Acosta-Gallegos et al. 1998).This suggests that, during the domestication pro-cess, a founder effect could have taken place, whichmay have excluded valuable genetic variability
from the domesticates, in relation to adaptive char-acteristics, such as resistance to insects during sto-rage and Rhizobium strain specificity (Kipe-Noltet al. 1992; Tohme et al. 1996; Acosta-Gallegoset al. 1998).
Various reasons justify the study of geneticdiversity present in wild populations, includingtheir contribution to the genetic diversity of land-races and a better definition of the founder effectassociated with domestication or, conversely, theirpossible genetic assimilation by landraces. Forexample, analysis of gene flow from domesticatedto wild populations may allow us to clarify thesignificance that the incorporation of genes fromdomesticated populations has had on the wildpopulations during the process of domesticationand the expansion of agriculture. For example,Papa and Gepts (2003) have documented thatgene flow from domesticated to wild beans isthree-fold higher than gene flow in the oppositedirection. In addition, a better understanding ofthe wild gene pool could lead to the establishmentof improvement programs that would increase theyield of domesticates, improve their tolerance topathogens, diseases and environmental stress, andexploit the role of beneficial micro-organisms,thereby facilitating the establishment of sustainableproductive systems through methods of conserva-tion in situ and ex situ (Gepts et al. 1999).
The aim of this study was to analyze the levels ofdiversity and genetic structure of wild popula-tions of P. vulgaris L. from a region borderingGuanajuato, Jalisco and Michoacan (M�exico) inthe Mesoamerican area of domestication, and toindirectly detect possible gene flow from domesti-cated toward wild populations, using bothmorphological and molecular inter-simplesequence repeat (ISSR) molecular markers.
Materials and methods
Study region
The area where the domestication of common beanis proposed to have taken place (Gepts 1988) cor-responds to the old frontier between Mesoamericaand Aridoamerica, on the borders of the presentday states of Guanajuato, Jalisco and Michoacan.This area borders the southern portion of an
590

ancient lagoon system in the center of M�exicoformed by the river Lerma. Some of the lakes com-prising the system were drained by the Europeansduring the first hydraulic works of drainageand irrigation carried out in America around1548, allowing the establishment of one of themost important commercial agricultural regionsin M�exico, called ‘‘El Bajıo’’ (Zizumbo-Villarreal1985). The physiography of the area includes val-leys and mountains. The climate presents a transi-tion between sub-humid, semi-arid and temperateenvironments. The soil is volcanic in origin, of thepelic vertisol type ranging from deep to thin andfrom stony to extremely stony, with a tropicaldeciduous forest vegetation, forest of Prosopislaevigata and forests of Quercus spp. (Rzedowski1978). The average annual rainfall is around 700mm, with a high coefficient of variation (closeto 25%) between years, with high variation inthe initiation and establishment of the rains, andwith a summer dry season which is variable inintensity, amplitude and date of initiation(Wallen 1955). The conditions of precipitation,
therefore, make agriculture possible, but with ahigh risk factor. Thus, the production rationaleof the farmer is centered on securing the harvestsand making good use of natural resources avail-able given the uncertainty regarding the quantityand distribution of the rains (Zizumbo-Villarrealet al. 1988). There is evidence in this area of agri-cultural villages along the shore of Lake Cuitzeosince the pre-classic period (800–100 BC) (Branniff1975; Oliveros 1975).
Plant materials
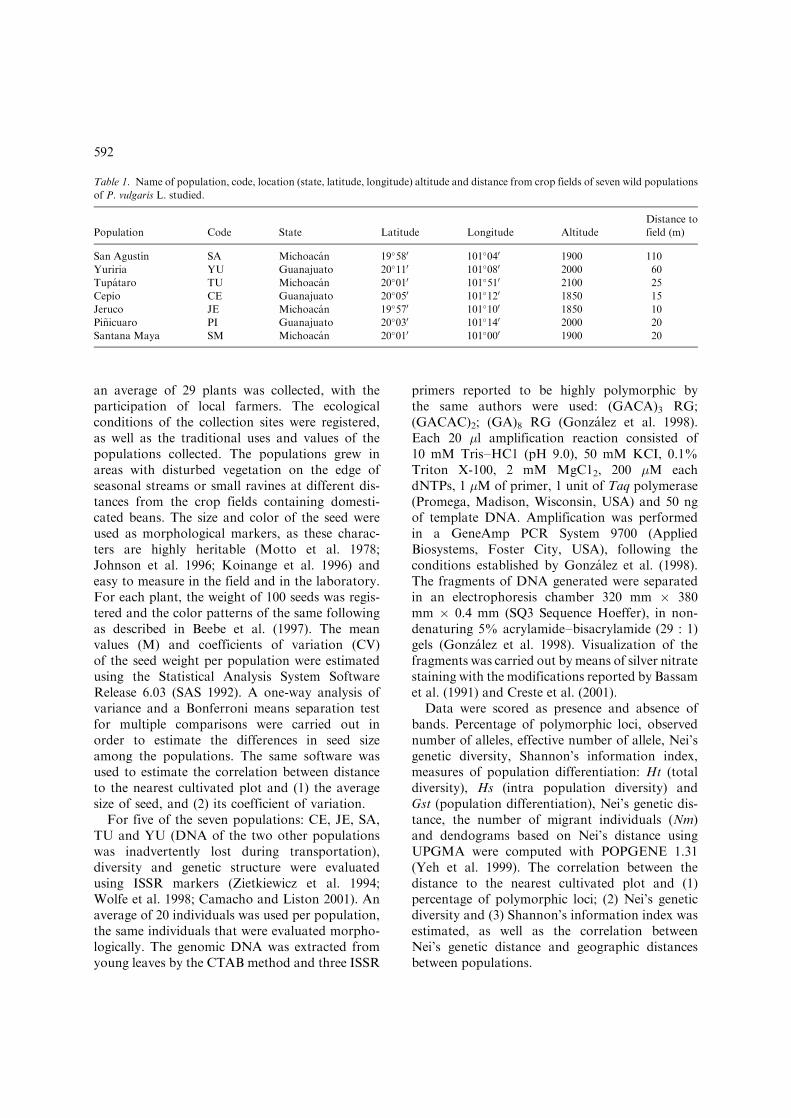
Seven wild populations of common bean wereselected: Cepio (CE); Jeruco (JE), Pi~nıcuaro (PI),San Agustın (SA), Santana Maya (SM), Tupataro(TU) and Yuriria (YU), located in different val-leys of the old Mesoamerican frontier in the statesof Guanajuato and Michoacan, on the southernborder of ‘‘El Bajıo’’ (Figure 1, Table 1). In thisarea, the traditional ‘‘milpa’’ agriculture (maize,beans and squash) in which landraces of beansare involved is still practiced. In each population,
Figure 1. Locations of the seven wild bean populations studied.
591
an average of 29 plants was collected, with theparticipation of local farmers. The ecologicalconditions of the collection sites were registered,as well as the traditional uses and values of thepopulations collected. The populations grew inareas with disturbed vegetation on the edge ofseasonal streams or small ravines at different dis-tances from the crop fields containing domesti-cated beans. The size and color of the seed wereused as morphological markers, as these charac-ters are highly heritable (Motto et al. 1978;Johnson et al. 1996; Koinange et al. 1996) andeasy to measure in the field and in the laboratory.For each plant, the weight of 100 seeds was regis-tered and the color patterns of the same followingas described in Beebe et al. (1997). The meanvalues (M) and coefficients of variation (CV)of the seed weight per population were estimatedusing the Statistical Analysis System SoftwareRelease 6.03 (SAS 1992). A one-way analysis ofvariance and a Bonferroni means separation testfor multiple comparisons were carried out inorder to estimate the differences in seed sizeamong the populations. The same software wasused to estimate the correlation between distanceto the nearest cultivated plot and (1) the averagesize of seed, and (2) its coefficient of variation.
For five of the seven populations: CE, JE, SA,TU and YU (DNA of the two other populationswas inadvertently lost during transportation),diversity and genetic structure were evaluatedusing ISSR markers (Zietkiewicz et al. 1994;Wolfe et al. 1998; Camacho and Liston 2001). Anaverage of 20 individuals was used per population,the same individuals that were evaluated morpho-logically. The genomic DNA was extracted fromyoung leaves by the CTAB method and three ISSR
primers reported to be highly polymorphic bythe same authors were used: (GACA)3 RG;(GACAC)2; (GA)8 RG (Gonzalez et al. 1998).Each 20 �l amplification reaction consisted of10 mM Tris–HC1 (pH 9.0), 50 mM KCI, 0.1%Triton X-100, 2 mM MgC12, 200 �M eachdNTPs, 1 �M of primer, 1 unit of Taq polymerase(Promega, Madison, Wisconsin, USA) and 50 ngof template DNA. Amplification was performedin a GeneAmp PCR System 9700 (AppliedBiosystems, Foster City, USA), following theconditions established by Gonzalez et al. (1998).The fragments of DNA generated were separatedin an electrophoresis chamber 320 mm � 380mm � 0.4 mm (SQ3 Sequence Hoeffer), in non-denaturing 5% acrylamide–bisacrylamide (29 : 1)gels (Gonzalez et al. 1998). Visualization of thefragments was carried out by means of silver nitratestaining with the modifications reported by Bassamet al. (1991) and Creste et al. (2001).
Data were scored as presence and absence ofbands. Percentage of polymorphic loci, observednumber of alleles, effective number of allele, Nei’sgenetic diversity, Shannon’s information index,measures of population differentiation: Ht (totaldiversity), Hs (intra population diversity) andGst (population differentiation), Nei’s genetic dis-tance, the number of migrant individuals (Nm)and dendograms based on Nei’s distance usingUPGMA were computed with POPGENE 1.31(Yeh et al. 1999). The correlation between thedistance to the nearest cultivated plot and (1)percentage of polymorphic loci; (2) Nei’s geneticdiversity and (3) Shannon’s information index wasestimated, as well as the correlation betweenNei’s genetic distance and geographic distancesbetween populations.
Table 1. Name of population, code, location (state, latitude, longitude) altitude and distance from crop fields of seven wild populations
of P. vulgaris L. studied.
Population Code State Latitude Longitude Altitude
Distance to
field (m)
San Agustın SA Michoacan 19�580 101�040 1900 110
Yuriria YU Guanajuato 20�110 101�080 2000 60
Tupataro TU Michoacan 20�010 101�510 2100 25
Cepio CE Guanajuato 20�050 101�120 1850 15
Jeruco JE Michoacan 19�570 101�100 1850 10
Pi~nicuaro PI Guanajuato 20�030 101�140 2000 20
Santana Maya SM Michoacan 20�010 101�000 1900 20
592

Results
The wild populations were found to be distributedonly in areas of disturbed natural vegetation(deforestation, overgrazing by goats and tramplingby humans) with high levels of incident light,in non-arable land near temporary streams andsmall ravines with extremely stony and rocky soil,on shrubs and trees of the mesquite, tropical decid-uous or oak forest, where they can escape goats,sheep and horses, both in land close to and distantfrom cultivated areas. The wild plants showed anindeterminate, climbing growth habit, with purpleflowers and short, dehiscent pods. Seeds showeddifferent color patterns (speckled, striped, mottled,pinto and uniform) and colors (including black,brown, cream, grey, olive, purple pink, red, etc.)(Table 2). Wild beans are commonly called ‘‘frijolcoyote’’ or ‘‘frijol cimarron’’ by the producers andare sometimes harvested. When the pods do notmature, they are consumed fresh in situ because oftheir sweet taste and are considered survival orpoor people’s food.
Data on morphological variation are shown inTable 2. The populations showed a range in seedsize from 3.9 to 6.6 g/100 seeds, similar to theresults obtained by Delgado-Salinas et al. (1988),who reported a range between 3.6 and 5.8 g/100
seeds for populations in the states of Morelos andPuebla. Tohme et al. (1996) reported valuesbetween 3.4 and 5.2 g/100 seeds in populationsin the states of Guanajuato and Michoacan.Significant differences were found between popula-tions in relation to seed size. Seeds of the SA popu-lation were significantly smaller than those of thePI, YU, SM and JE populations (Table 2). The CEand TU populations had medium-sized seeds.These differences were associated with differentcolor patterns in the seeds. The SA populationpresented only a speckled color pattern, whereasthe others presented different patterns (Table 2).Domesticated seeds generally have a seed sizeabove 20 g/100 seeds (Koinange et al. 1996).
CVs for seed weight ranged between 11.6% and51.7%. The SA population showed the lowestvalues, while the PI, JE and SM populationsshowed values almost five times higher, suggestingthe presence of greater genetic variability in thesepopulations. We did not observe a statistically sig-nificant correlation between average seed size andthe distance to the nearest crop field (Figure 2,r ¼ �0.68; P ¼ 0.10) but we found a significantnegative correlation between the coefficient of var-iation of seed size and the distance from the nearestcrop field (Figure 2: r ¼ �0.76; P ¼ 0.045). Thisobservation suggest the existence of gene flowfrom the domesticated plants to the wild popula-tions as the increase in the variability is correlatedwith the proximity of domesticated populations.This phenomenon was also suggested by a greaternumber of color patterns among the wild popula-tions in proximity to crop fields (Table 2).
For the molecular analysis, we studied 37 bands(putative loci), which were obtained with threeISSR primers, 7 with the primer (GACA)3 RG, 21with the primer (GACAC)2 and 9 with the primer(GA)8 RG (Figure 3, Table 3). In the five popula-tions, 89% of the loci were polymorphic, with arange from 35% to 64% (Table 4). Because studiesof P. vulgaris demonstrated high degrees ofinbreeding but also some instances of outcrossing(Brunner and Beaver 1989; Triana et al. 1994), thediversity statistics were calculated twice. Once withthe assumption of Hardy–Weinberg equilibrium(Fis ¼ 0) and once with the assumption that thepopulations are mostly selfing (Fis ¼ 0.95). Thegenetic diversity statistics were similar under bothof these assumptions except for the YU population
Table 2. Population name, number of plants (n), mean seed
mass (mass of 100 seeds in gram) (M), coefficient of variation
of seed mass (CV), level of significance of differences among
mean seed mass (s) and colors of seeds in seven wild populations
of P. vulgaris L.
Population n M CV s* Seed colors
San
Agustın
33 3.9 11.6 A Speckled
Yuriria 24 6 27.3 BC Black, brown, cream,
grey, olive and speckled
Tupataro 33 4.9 24.2 AB Black, brown, cream,
olive, pink and speckled
Cepio 39 5.1 30.2 AB Black, brown, cream,
olive and speckled
Jeruco 24 7.4 50.4 C Black, brown, cream,
olive, pink, purple and
red
Pi~nicuaro 25 6.6 51.7 BC Black, brown, cream,
olive, pink, red speckled
Santana
Maya
24 6.3 50.8 BC Black, brown, cream,
olive and speckled
* Different letter means significant difference (P < 0.05).
593

Figure 2. Relationship between distance to a cultivated field (independent variable) and seed weight, seed weight coefficient of variation
(CV), polymorphic loci frequency, Nei’s genetic diversity, and Shannon’s information index.
Figure 3. Sample of ISSR profiles for the (GACAC)2 primer of the Yuriria wild P. vulgaris population. Arrows on the right indicate
bands scored with size in bp.
594

(Table 4). The difference between the number ofobserved and effective alleles was low. There wereno differences between populations regarding thenumber of effective alleles, but there were differ-ences in relation to Nei’s diversity index (h) andShannon’s information index (I ). The SA, YU andJE populations were the least diverse (h ¼ 0.13–0.14) (I ¼ 0.20–0.22), while the CE and TU popu-lations were the most diverse (h ¼ 0.18–0.20 andI ¼ 0.28–0.29).
The population differentiation estimates,Ht,Hs,Gst and Nm, were similar under Fis ¼ 0 and 0.95assumptions. The total diversity (Ht) and the diver-sity within populations were high under bothassumptions: Ht ¼ 0.28–0.29, and Hs ¼ 0.16–0.18. Diversity between populations was high,
between Gst ¼ 0.40 and 0.45, indicating thatbetween 40% and 45% of the variation is explainedby differences among the sub-populations. Geneflow between populations was low, betweenNm ¼ 0.6 and 0.7.
The UPGMA clustering, using the genetic dis-tances (Table 5; Figure 4) did in fact indicate a highdifferentiation between populations. Three groupsof populations were identified: the CE population,which was the most differentiated from the rest ofthe populations, a group comprising JE and TU
Table 3. Primers used in ISSR analyses of five wild populations of P. vulgaris L. and size of the bands they produced.
Primer Primer sequence ISSR band sizes in base pairs
15 (GACA)3 RG* 146, 183, 232, 257, 369, 480, 502
17 (GACAC)2 202, 219, 241, 263, 363, 369, 379, 384, 462, 482, 492, 570,
648, 722, 738, 767, 795, 861, 1066, 1130, 1438
21 (GA)8 RG* 289, 409, 466, 492, 547, 608, 615, 738, 779
* R ¼ A,G; Y ¼ C,T.
Table 4. Genetic diversity of five wild populations of P. vulgaris L.
na ne h I
Population n % (Fis ¼ 0) (Fis ¼ 0.95) (Fis ¼ 0) (Fis ¼ 0.95) (Fis ¼ 0) (Fis ¼ 0.95) (Fis ¼ 0) (Fis ¼ 0.95)
San
Agustın
21 35.1 1.35 1.35 1.25 1.25 0.14 0.13 0.21 0.20
Yuriria 22 56.8 1.58 1.57 1.38 1.21 0.21 0.14 0.31 0.22
Tupataro 22 64.9 1.65 1.64 1.31 1.29 0.19 0.18 0.29 0.28
Jeruco 20 59.5 1.6 1.59 1.2 1.19 0.13 0.13 0.22 0.22
Cepio 21 56.8 1.55 1.56 1.34 1.33 0.20 0.20 0.30 0.29
Number of plants (n) Percentage of polymorphic loci (%), observed number of alleles (na), effective number of alleles (ne); Nei’s gene
diversity (h), Shannon’s information index ( I ). Assuming Hardy–Weinberg equilibrium (Fis ¼ 0) or assuming mostly selfing (Fis ¼0.95).
Table 5. Geographic (km; above diagonal) and genetic (below
diagonal) distance between five wild populations of P. vulgaris
L. studied.
Population Jeruco Tupataro Yuriria San Agustın Cepio
Jeruco **** 2 4.7 1.6 2.3
Tupataro 0.14 **** 4.1 3.2 1.3
Yuriria 0.19 0.16 **** 4.5 2.9
San Agustın 0.2 0.13 0.1 **** 3.7
Cepio 0.23 0.28 0.21 0.3 ****
Figure 4. UPGMA dendrogram based on Nei’s distances
derived from 37 ISSR bands among five wild bean populations
studied.
595

populations, and finally YU and SA populations.Thus, the greatest genetic distance was observedbetween CE population, the most diverse, and SApopulation, the least diverse (D ¼ 0.3).
We found a significant highly negative correla-tion between the percentage of polymorphic lociand the distance of the populations from the near-est crop field (Figure 2, r ¼ �0.88; P ¼ 0.046),suggesting gene flow from the domesticated to thewild populations. We did not find correlationbetween the distance from crop field and Nei’sdiversity (Figure 2, r ¼ �0.53; P ¼ �0.67) andShannon’s index (Figure 2, r ¼ �0.67; P ¼ 0.32).The SA population, which was isolated from thedomesticated plants, showed the lowest values inthe estimates of diversity. We did not find correla-tion between the genetic and geographic distance(r ¼ �0.37; P ¼ 0.32).
Discussion
The populations of wild beans in the area understudy grow in places where agricultural develop-ment is not possible, due to the high concentra-tion of stones in the soil, rugged topography orthe distance from urban centers and lack of roads.The populations survive on trees, thorny shrubsor cacti, where they can escape grazing by sheep,horses or goats. This would indicate the possibi-lity that the size of these populations has beendecreasing as a result of the expansion of agricul-ture, cattle raising and deforestation in the region.Another factor which may have had a negativeinfluence is the introduction of agricultural imple-ments such as the plough with animal traction 500years ago and the introduction of agriculturalmachinery in the last 50 years. Traditional farm-ing knowledge of the wild populations is poor andconsumption by humans is occasional. Noagricultural practices have been observed thatprotect or favor these plants. It is safe to say,therefore, that mankind has had a negative effecton the distribution and abundance of thesepopulations.
The values of polymorphism and genetic diver-sity in the five populations studied were greaterthan those reported by Koenig and Gepts (1989).They observed values ofHt¼ 0.13 andHs ¼ 0.006,when they used 9 isoenzymatic loci and included 83
accessions of wild bean covering a wide geographicrange in Mesoamerica and the Andes. These differ-ences can be explained by the greater sensitivityof the molecular markers in the detection ofpolymorphism, as was pointed out by Becerra-Velasquez and Gepts (1994) and Tohme et al.(1996). The percentage of polymorphic loci found(89%) was also higher than that reported byBecerra-Velasquez and Gepts (1994) (76%), whenthey used RFLP markers in a group of 85 acces-sions of wild and domesticated populations fromboth centers of domestication, but the total geneticdiversity in our study was lower (Ht ¼ 0.28) incomparison with their report (Ht ¼ 0.38). Thisdifference could be attributed to the fact that weonly included five wild populations from theMesoamerican center and did not include domes-ticated populations.
The maximum differentiation distance betweenthe wild populations studied was 0.30, similar tothe value of 0.31 reported by Tohme et al. (1996),using AFLP polymorphisms in 975 accessions ofgene pools of wild beans from both centers ofdomestication. The value obtained is within therange of 0.3–0.4 reported for the maximumdistance observed in studies that utilized RFLPs,RAPDs or AFLPs markers to characterize geneticdiversity of wild and weedy accessions, landracesand breeding lines (Beebe et al. 1995; Tohme et al.1996; Skroch et al. 1998). Diversity within thepopulations was high and no differences werefound between the number of effective andobserved alleles, suggesting high levels of homo-zygosity and limited gene flow between popula-tions, consistent with the predominantly selfingsystem of reproduction in common bean. Between40% and 45% of the diversity found was explainedby the differences among the populations, indicat-ing high local differentiation and confirming thelimited genetic flow between populations asshown the Nm values around 0.6.
The topology of the dendrogram suggestsgeographical isolation. This isolation could be dueto the presence of hills or mountains as geographi-cal barriers between the valleys of the area. Thiscould be the case in the CE population, which isgeographically close but genetically distant fromthe TU and YU populations. This phenomenonwas not observed in the SA and YU populations.In spite of being geographically distant and
596

separated by Lake Cuitzeo, they were geneticallyclose and were grouped in the same clade. Thesetwo populations were the most distant from culti-vated plots and showed little influence of hybridi-zation with domesticated plants (lowmorphological and genetic variability), suggestingthat isolation from domesticated populations hasallowed them to remain similar to each other anddistinct from the other wild populations. Thisresult suggests the existence of another factorfavoring genetic differentiation among wild popu-lations, which could be gene flow from domesti-cated populations. The high values in thecoefficients of variation and the greater numberof patterns and colors of the seeds in some popula-tions studied suggest a high level of morphologicalgenetic diversity. The high negative correlationbetween the coefficient of variation of averageseed size with the distance to the nearest crop fieldsuggests the existence of gene flow from the domes-ticated to the wild populations, as has been sug-gested by different authors (Delgado-Salinas et al.1988; Debouck and Smart 1995; Beebe et al. 1997;Gepts et al. 1999). The highly negative correlationfound between the percentage of polymorphic lociand the distance to the nearest crop field supportsthis hypothesis. Although the correlation coeffi-cients between Nei’s diversity and Shannon’s infor-mation indices and the distance to the nearestcultivated field were not statistically significant,they were highly negative as well and consistentwith correlations observed for seed size coefficientof variation and the number of polymorphic loci.Furthermore, Papa and Gepts (2003) have shownthat gene flow between wild and domesticatedbeans is three-fold more important in the domes-ticated to wild than in the opposite direction.Overall, the spatial approach to studying geneflow appears to be quite useful to identify the pre-sence of gene flow, even in predominantly selfingspecies such as common bean.
Given the previously mentioned circumstances,the farmer, with his or her agricultural activity,could be affecting the magnitude and the charac-teristics of gene flow between domesticated andwild populations, through the distance of thedomesticated plots from wild populations and thegenetic diversity included in cultivated fields,thereby influencing the process of differentiationamong wild populations. An example illustrating
this fact can be observed in the JE population,which is located close to domesticated populationsand showed morphological effects of genetic infil-tration (large seeds with a high coefficient of varia-tion). This population did not group with the SApopulation, the closest geographically speaking,but with the TU population, another populationclose to domesticated plants. The JE population,however, showed low levels of genetic diversity,suggesting also that the diversity of the beangrown in the nearest domesticated plot was low.
Our study suggests that programs of ex situconservation, collection strategies should be imple-mented that include a large number of populationsboth isolated from domesticated plants and inproximity to them, in order to represent the geneticdiversity of the wild gene pool. Information as tothe proximity of cultivated fields should be addedto the passport date of individual wild accessions.As for conservation in situ, there is a need to estab-lish strategies for maintaining wild populations iso-lated from domesticated plants in order tominimize gene flow. This would be difficult toachieve with strips of natural vegetation function-ing as barriers, as this is precisely where wild popu-lations grow. The evidence obtained in this studyregarding gene flow from domesticated to wildpopulations suggests that the possible introductionto the Mesoamerican area of bean varieties fromthe Andean domestication center with the intentionof increasing production, could affect the local wildpopulations through gene flow, as was suggestedby Tohme et al. (1996). The introduction of trans-genic plants could lead to the incorporation oftransgenes into wild populations conferring themwith greater adaptive capacity, thus allowing themto thrive under natural conditions, conditions suchas the edges of cultivated areas or within the culti-vated plots, and complicating both in situ conser-vation and the control of weeds as has been pointedout by Gepts et al. (1999). Additional studies arenecessary that would permit us to better estimatepotential risks associated with the introduction oftransgenic plants. These studies include observa-tions on the diversity, abundance and distributionof populations of pollinating insects of Phaseolus,estimates of the rates of cross-breeding in wildpopulations under different conditions associatedwith the presence or absence of pollinators, a betterdefinition of the role of the floral characteristics of
597

wild and domesticated populations, the evolution-ary dynamics of wild-weed–domesticated com-plexes in traditional agricultural systems and thesurrounding vegetation, and the role and impact offarmers on these evolutionary processes. Thisanalysis must consider the production rationale ofthe producers themselves, which involves techno-logical and organizational aspects as well as formsof selection, utilization and consumption.
Acknowledgements
This article is part of the doctoral thesis of the firstauthor under the direction of the last, within theprogram of Doctorate in Science in Biotechnologyof the Faculty of Biological and AgriculturalSciences of the University of Colima. Our thanksto the CICY for the facilities granted, toCONACYT and DGETA-SEP for the scholarshipgranted to the first author. Thanks to Dr. PatriciaDelgado and Technician Julian Coello for theirassistance in the laboratory, also to Ing.Francisco Campos, Pedro Melo (Yuriria,Guanajuato), Nicolas Rico and Roberto Zizumbo(Jeruco, Michoacan), and Ignacio Fernandez(Tupataro, Michoacan) for their assistance andfor the information provided that allowed thiswork to be carried out.
References
Acosta-Gallegos J.A., Quintero C., Vargas J., ToroO., Thome J.
and Cardona C. 1998. A new variant of arcelin in wild
common bean, Phaseolus vulgaris L., from southern Mexico.
Genet. Resour. Crop Evol. 45: 235–242.
Bassam B., Caetano-Anolles G. and Gresshoff P. 1991. Fast and
sensitive silver staining of DNA in polyacrylamide gels. Anal.
Biochem. 196: 80–83.
Becerra-Velasquez L. and Gepts P. 1994. RFLP diversity of
common bean (Phaseolus vulgaris L.) in its centres of origin.
Genome 37: 256–263.
Beebe S., Ochoa I., Skroch P., Nienhuis J. and Tivang J. 1995.
Genetic diversity among common bean breeding lines devel-
oped for Central America. Crop Sci. 35: 1178–1183.
Beebe S., Toro O.Ch., Gonzalez A.V., Chacon M.I. and
Debouck D.G. 1997. Wild-weed–crop complexes of common
bean (Phaseolus vulgaris L. Fabaceae) in the Andes of Peru
and Colombia, and their implications for conservation and
breeding. Genet. Resour. Crop Evol. 44: 73–91.
Beebe S., Skroch P.W., Tohme J., Duque M.C., Pedraza F. and
Nienhuis J. 2000. Structure of genetic diversity among
common bean landraces of Middle American origin
based on correspondence analysis of RAPD. Crop Sci. 40:
264–273.
Branniff B. 1975. Arqueologıa del norte de M�exico. En: Pueblos
y se~norıos teocraticos: el periodo de las ciudades urbanas.
SEP-INAH, M�exico, pp. 217–278.Brunner B.R. and Beaver J.S. 1989. Estimation of outcrossing of
common bean in Puerto Rico. HortScience 24: 669–671.
Camacho F.J. and Liston A. 2001. Population structure and
genetic diversity of Botrychium pumicola (Ophioglossaceae)
based on inter simple sequence repeats (ISSR). Amer. J. Bot.
88: 1065–1070.
Creste S., Tulmann N.A. and Figueira A. 2001. Detection of
single sequence repeat polymorphism in denaturing poly-
acrylamide sequencing gel by silver staining. Plant Mol.
Biol. Rep. 19: 299–306.
Debouck D.G. and Tohme J. 1989. Implications for bean bree-
ders of studies on the origins of common beans, Phaseolus
vulgaris L. In: Beebe S. (ed.), Current Topics in Breeding of
Common Bean. vol. 47. Bean program, Centro Internacional
de Agricultura Tropical, Cali, Colombia, pp. 3–42.
Debouck D.G. and Smart J. 1995. Beans. In: Smartt J. and
Simmonds N.W. (eds), Evolution of Crop Plants, 2nd edn.,
Longman, Harlow, England. pp. 287–294.
Delgado-Salinas A., Bonet A. and Gepts P. 1988. The wild
relative of Phaseolus vulgaris in Middle America. In: Gepts P.
(ed.), Genetic Resources of Phaseolus Beans, Kluwer
Academic Publishers, Dordrecht, the Netherlands,
pp. 163–184.
Gepts P. 1988. Phaseolin as an evolutionarymarker. In: Gepts P.
(ed.), Genetic Resources of Phaseolus Beans, Kluwer
Academic Publishers, Dordrecht, the Netherlands,
pp. 215–241.
Gepts P. 1993. The use of molecular and biochemical markers in
crop evolution studies. Evol. Biol. 27: 51–94.
Gepts P., Osborn T.C., RashkaK. and Blis F.A. 1986. Phaseolin
protein variability in wild forms and landraces of the common
bean (Phaseolus vulgaris L): evidence for multiple centers of
domestication. Econ. Bot. 40: 451–468.
Gepts P. and Debouck D.G. 1991. Origin, domestication and
evolution of the common bean (Phaseolus vulgaris L). In:
Van Schoonhoven A. and Voysest O. (eds), Common Beans:
Research for Crop Improvement. CAB, Wallingford, Oxon,
UK, pp. 7–53.
GeptsP., PapaR.,GonzalezA.,Acosta J. andDelgado-SalinasA.
1999. Human effects on Phaseolus vulgaris adaptation during
and after domestication. In: Van Raamsdonk L.W.D. and
den Nijs J.C.M. (eds), Plant Evolution in Man-Made
Habitats. Hugo de Vries Laboratory, Amsterdam, the
Netherlands, pp. 161–181.
Gonzalez A., Wong L.J.A., Delgado S.A. and Gepts P. 1998.
Determination of genetic diversity among wild and domesti-
cated beans using Inter Simple Sequence Repeats (ISSR’s).
Ann. Rep. Bean Improv. Copp. 41: 99–100.
Johnson W., Men�endez C., Nodari R., Koinange E., Singh S.
and Gepts P. 1996. Association of a seed weight factor with
the phaseolin seed storage protein locus across genotypes,
environments, and genomes in Phaseolus – Vigna spp.: Sax
(1923) revisited. J. Quant. Trait Loci 2: Article 5, http://
www.ncgr.org/jag/papers96/paper596/indexp596.html.
598

Kipe-Nolt J.A., Montealegre C.M. and Tohme J. 1992.
Restriction of nodulation by the broad host range
Rhizobium tropici strain CIAT899 in wild accessions of
Phaseolus vulgaris L. New Phytol. 120: 489–494.
Koenig R. and Gepts P. 1989. Allozyme diversity in wild
Phaseolus vulgaris: further evidence for two major centers of
genetic diversity. Theor. Appl. Genet. 78: 809–817.
Koenig R.L., Singh S.P. and Gepts P. 1990. Novel phaseolin
types in wild and cultivated common bean (Phaseolus vulgaris
Fabaceae). Econ. Bot. 44: 50–60.
Koinange E.M.K., Singh S.P. and Gepts P. 1996. Genetic con-
trol of the domestication syndrome in common bean. Crop
Sci. 36: 1037–1045.
Motto M., Soressi G.P. and Salamini F. 1978. Seed size inheri-
tance in a cross between wild and cultivated common beans
(Phaseolus vulgaris L.). Genetica 49: 31–36.
Oliveros J.A. 1975. Arqueologıa del estado de Michoacan.In:
Pueblos y se~norıos teocraticos: el periodo de las ciudades
urbanas, SEP-INAH, M�exico, pp. 207–216.
Papa R. and Gepts P. 2003. Asymmetry of gene flow and
differential geographical structure of molecular diversity
in wild and domesticated common bean (Phaseolus
vulgaris L.) from Mesoamerica. Theor. Appl. Genet. 106:
239–250.
Romero A. J. and Bliss F.A. 1985. Heritable variation in the
phaseolin protein of nondomesticated common bean,
Phaseolus vulgaris L. Theor. Appl. Genet. 71: 478–480.
Romero A.J., Yandel B.S. and Bliss F.A. 1986. Bean arcelin. 1.
Inheritance of a novel seed protein of Phaseolus vulgaris L
and its effect on seed composition. Theor. Appl. Genet. 72:
123–128.
Rzedowski J. 1978. La vegetacion de M�exico. Limusa,
M�exico D.F.
SAS, 1992. SAS/STAT user’s guide, release 6.03 edn. SAS
Institute, Cary, NC.
Skroch P.W., Nienhuis J., Beebe S., Tohme J. and Pedraza F.
1998. Comparison of Mexican common bean (Phaseolus
vulgaris L.) core and reserve germplasm collections. Crop Sci.
38: 488–496.
Tohme J., Gonzalez O.D., Beebe S. and Duque C. 1996. AFLP
analysis of gene pools of a wild bean core collection. Crop Sci.
36: 1375–1384.
Triana B., Iwanaga M., Rubiano H. and Andrade M. 1994. A
study of allogamy in wild Phaseolus vulgaris. In: Roca W.R.
(ed.), Proceeding of the Second International Scientific
Meeting, Phaseolus beans advanced biotechnology research
network, Centro Internacional de Agricultura Tropical, Cali,
Colombia, pp. 97–103.
Wallen C.C. 1955. Some characteristics of precipitation in
Mexico. Geogr. Ann. 37: 51–85.
Wolfe A.D., Xiang Q. and Kephart S.R. 1998. Assessing
hybridization in natural populations of Penstemon
(Scrophulariaceae) using hypervariable inter-simple sequence
repeat (ISSR) bands. Mol. Ecol. 7: 1107–1126.
Yeh F., Yang R.C. and Boyle T.J. 1999. Popgene version 1.31.
Microsoft window-based freeware for population genetic
analysis. University of Alberta and Centre for International
Forestry Research, Edmonton, Canada.
Zietkiewicz E., Rafalski A. and Labuda D. 1994. Genome
fingerprinting by simple sequence repeats (SSR)-anchored
polymerase chain reaction amplification. Genomic 20:
176–183.
Zizumbo-Villarreal D. 1985. Estrategias agrıcolas tradicionales
para el aprovechamiento del agua de lluvia durante el tem-
poral: El caso de Yuriria Guanajuato, M�exico. MS thesis,
Colegio de Postgraduados, Chapingo, M�exico.
Zizumbo-Villarreal D., Hernandez X.E. and Cuanalo de la
Cerda H. 1988. Estrategias agrıcolas tradicionales para el
aprovechamiento del agua de lluvia durante el temporal.
Agrociencia 71: 315–340.
599
Copyright © 2022 FDOKUMEN