Diversification and Population Structure in Common Beans (Phaseolus vulgaris L.)
12
Diversification and Population Structure in Common Beans (Phaseolus vulgaris L.) Matthew W. Blair 1,2 *, Alvaro Soler 1 , Andre ´s J. Corte ´s 3 * 1 Departamento de Ciencias Agrı ´colas, Universidad Nacional de Colombia, Palmira, Colombia, 2 Department of Plant Breeding, Cornell University, Ithaca, New York, United States of America, 3 Evolutionary Biology Center, Uppsala University, Uppsala, Sweden Abstract Wild accessions of crops and landraces are valuable genetic resources for plant breeding and for conserving alleles and gene combinations in planta. The primary genepool of cultivated common beans includes wild accessions of Phaseolus vulgaris. These are of the same species as the domesticates and therefore are easily crossable with cultivated accessions. Molecular marker assessment of wild beans and landraces is important for the proper utilization and conservation of these important genetic resources. The goal of this research was to evaluate a collection of wild beans with fluorescent microsatellite or simple sequence repeat markers and to determine the population structure in combination with cultivated beans of all known races. Marker diversity in terms of average number of alleles per marker was high (13) for the combination of 36 markers and 104 wild genotypes that was similar to the average of 14 alleles per marker found for the 606 cultivated genotypes. Diversity in wild beans appears to be somewhat higher than in cultivated beans on a per genotype basis. Five populations or genepools were identified in structure analysis of the wild beans corresponding to segments of the geographical range, including Mesoamerican (Mexican), Guatemalan, Colombian, Ecuadorian-northern Peruvian and Andean (Argentina, Bolivia and Southern Peru). The combined analysis of wild and cultivated accessions showed that the first and last of these genepools were related to the cultivated genepools of the same names and the penultimate was found to be distinct but not ancestral to the others. The Guatemalan genepool was very novel and perhaps related to cultivars of race Guatemala, while the Colombian population was also distinct. Results suggest geographic isolation, founder effects or natural selection could have created the different semi-discrete populations of wild beans and that multiple domestications and introgression were involved in creating the diversity of cultivated beans. Citation: Blair MW, Soler A, Corte ´s AJ (2012) Diversification and Population Structure in Common Beans (Phaseolus vulgaris L.). PLoS ONE 7(11): e49488. doi:10.1371/journal.pone.0049488 Editor: John P. Hart, New York State Museum, United States of America Received May 21, 2012; Accepted October 10, 2012; Published November 7, 2012 Copyright: ß 2012 Blair et al. This is an open-access article distributed under the terms of the Creative Commons Attribution License, which permits unrestricted use, distribution, and reproduction in any medium, provided the original author and source are credited. Funding: This project was supported by the ADOC and Genotyping initiatives of the Generation Challenge Program and by USAID funds. The funders had no role in study design, data collection and analysis, decision to publish, or preparation of the manuscript. Competing Interests: The authors have declared that no competing interests exist. * E-mail: [email protected] (MWB); [email protected] (AJC) Introduction Common bean (Phaseolus vulgaris L.) is a diverse New World legume species that originated in a long arc between present day northern Mexico (Chihuahua), through Central America and the Andes mountains to northwest Argentina (San Luis) [1]. The diversity in wild accessions of the species can be divided into various sub-populations from specific geographical regions for the species [2,3]. The number of sub-populations has been a matter of discussion since the division of wild P. vulgaris is not as simple as for the domesticated beans which are easily separated into Andean and Mesoamerican genepools. In addition, the morphological and molecular differences among groups of wild accessions are not as clear as among races in the cultivated types and rely on differences in seed size, flower coloration, bracteoles size, seed protein (phaseolin) type and in large part on molecular marker evaluations [2,4,5,6,7,8]. It is uncertain when the full transition from wild beans to cultivated beans occurred due to gaps in the archaeo- logical record but this event is thought to have occurred 7,000 to 5,000 years ago [1]. Based on DNA fingerprinting with amplified fragment length polymorphism (AFLP) markers, wild common bean accessions have been divided into four groups or genepools [9]. These include Mesoamerican, Andean, Colombian and Ecuadorian- northern Peruvian genepools. Some studies with Andean wild and cultivated common beans with the same marker system found no grouping of wild accessions within the Andean genepool [10]. However, northern Argentinean and southern wild Bolivian accessions have been suggested to be most similar to cultivated Andean beans. Rossi et al. [5] also found geographic separation of wild bean populations with AFLP markers suggesting that Colombian wild beans were closely related to Mesoamerican wild beans which could be separated into accessions from Mexico and Central America. They also suggested a reduction in diversity in the Andean genepool. Kwak et al. [11] found that wild beans from Mexico varied in their simple sequence repeat (SSR) fingerprint and that domestication of the cultivated Mesoamerican genepool was likely to have occurred in the Lerma valley. Introgression of wild-derived genes from other subgroups of wild beans has been postulated to explain current SSR-based race structure in cultivated common beans [12,13,14]. Finally based on sequence information for five gene fragments, Bitocchi et al. [15] proposed a Mesoamerican origin rather than a South American origin for wild populations of P. vulgaris based on the detection of a strong bottleneck in the actual Andean genepool of wild beans. PLOS ONE | www.plosone.org 1 November 2012 | Volume 7 | Issue 11 | e49488
-
Upload
independent -
Category
Documents
-
view
0 -
download
0
Transcript of Diversification and Population Structure in Common Beans (Phaseolus vulgaris L.)
Diversification and Population Structure in CommonBeans (Phaseolus vulgaris L.)Matthew W. Blair1,2*, Alvaro Soler1, Andres J. Cortes3*
1Departamento de Ciencias Agrıcolas, Universidad Nacional de Colombia, Palmira, Colombia, 2Department of Plant Breeding, Cornell University, Ithaca, New York, United
States of America, 3 Evolutionary Biology Center, Uppsala University, Uppsala, Sweden
Abstract
Wild accessions of crops and landraces are valuable genetic resources for plant breeding and for conserving alleles andgene combinations in planta. The primary genepool of cultivated common beans includes wild accessions of Phaseolusvulgaris. These are of the same species as the domesticates and therefore are easily crossable with cultivated accessions.Molecular marker assessment of wild beans and landraces is important for the proper utilization and conservation of theseimportant genetic resources. The goal of this research was to evaluate a collection of wild beans with fluorescentmicrosatellite or simple sequence repeat markers and to determine the population structure in combination with cultivatedbeans of all known races. Marker diversity in terms of average number of alleles per marker was high (13) for thecombination of 36 markers and 104 wild genotypes that was similar to the average of 14 alleles per marker found for the606 cultivated genotypes. Diversity in wild beans appears to be somewhat higher than in cultivated beans on a pergenotype basis. Five populations or genepools were identified in structure analysis of the wild beans corresponding tosegments of the geographical range, including Mesoamerican (Mexican), Guatemalan, Colombian, Ecuadorian-northernPeruvian and Andean (Argentina, Bolivia and Southern Peru). The combined analysis of wild and cultivated accessionsshowed that the first and last of these genepools were related to the cultivated genepools of the same names and thepenultimate was found to be distinct but not ancestral to the others. The Guatemalan genepool was very novel and perhapsrelated to cultivars of race Guatemala, while the Colombian population was also distinct. Results suggest geographicisolation, founder effects or natural selection could have created the different semi-discrete populations of wild beans andthat multiple domestications and introgression were involved in creating the diversity of cultivated beans.
Citation: Blair MW, Soler A, Cortes AJ (2012) Diversification and Population Structure in Common Beans (Phaseolus vulgaris L.). PLoS ONE 7(11): e49488.doi:10.1371/journal.pone.0049488
Editor: John P. Hart, New York State Museum, United States of America
Received May 21, 2012; Accepted October 10, 2012; Published November 7, 2012
Copyright: � 2012 Blair et al. This is an open-access article distributed under the terms of the Creative Commons Attribution License, which permits unrestricteduse, distribution, and reproduction in any medium, provided the original author and source are credited.
Funding: This project was supported by the ADOC and Genotyping initiatives of the Generation Challenge Program and by USAID funds. The funders had no rolein study design, data collection and analysis, decision to publish, or preparation of the manuscript.
Competing Interests: The authors have declared that no competing interests exist.
* E-mail: [email protected] (MWB); [email protected] (AJC)
Introduction
Common bean (Phaseolus vulgaris L.) is a diverse New World
legume species that originated in a long arc between present day
northern Mexico (Chihuahua), through Central America and the
Andes mountains to northwest Argentina (San Luis) [1]. The
diversity in wild accessions of the species can be divided into
various sub-populations from specific geographical regions for the
species [2,3]. The number of sub-populations has been a matter of
discussion since the division of wild P. vulgaris is not as simple as for
the domesticated beans which are easily separated into Andean
and Mesoamerican genepools. In addition, the morphological and
molecular differences among groups of wild accessions are not as
clear as among races in the cultivated types and rely on differences
in seed size, flower coloration, bracteoles size, seed protein
(phaseolin) type and in large part on molecular marker evaluations
[2,4,5,6,7,8]. It is uncertain when the full transition from wild
beans to cultivated beans occurred due to gaps in the archaeo-
logical record but this event is thought to have occurred 7,000 to
5,000 years ago [1].
Based on DNA fingerprinting with amplified fragment length
polymorphism (AFLP) markers, wild common bean accessions
have been divided into four groups or genepools [9]. These
include Mesoamerican, Andean, Colombian and Ecuadorian-
northern Peruvian genepools. Some studies with Andean wild and
cultivated common beans with the same marker system found no
grouping of wild accessions within the Andean genepool [10].
However, northern Argentinean and southern wild Bolivian
accessions have been suggested to be most similar to cultivated
Andean beans. Rossi et al. [5] also found geographic separation of
wild bean populations with AFLP markers suggesting that
Colombian wild beans were closely related to Mesoamerican wild
beans which could be separated into accessions from Mexico and
Central America. They also suggested a reduction in diversity in
the Andean genepool. Kwak et al. [11] found that wild beans from
Mexico varied in their simple sequence repeat (SSR) fingerprint
and that domestication of the cultivated Mesoamerican genepool
was likely to have occurred in the Lerma valley. Introgression of
wild-derived genes from other subgroups of wild beans has been
postulated to explain current SSR-based race structure in
cultivated common beans [12,13,14]. Finally based on sequence
information for five gene fragments, Bitocchi et al. [15] proposed
a Mesoamerican origin rather than a South American origin for
wild populations of P. vulgaris based on the detection of a strong
bottleneck in the actual Andean genepool of wild beans.
PLOS ONE | www.plosone.org 1 November 2012 | Volume 7 | Issue 11 | e49488
Microsatellite or SSR markers are useful tools for studying
genetic diversity in multiple crops and their wild relatives [16].
This type of marker, based generally on di- or tri-nucleotide
repeats, is highly polymorphic and multi-allelic, with up to 25
alleles common at an individual locus. Microsatellite loci are
abundant and well distributed throughout the genomes of higher
plants, being found in both gene-coding and non-coding
sequences. SSR markers are easily evaluated through fluorescent
marker technology [14]. In addition, data from microsatellite
analysis can be reproducible from laboratory to laboratory and
robust for comparisons between studies and germplasm sets. The
application of microsatellite markers to study diversity within
common beans began when Gaitan et al. [17] developed a set of
genomic microsatellites and evaluated their diversity in cultivated
and wild accessions of common beans and related species. Metais
et al. [18] also evaluated diversity for other genomic microsatellites
and fluorescently labeled SSR markers. A more comprehensive
analysis of the diversity of cultivated accessions was then carried
out by Blair et al. [19] to evaluate which microsatellites best
detected diversity within the species. Subsequently race structure
was analyzed in cultivated Andean and Mesoamerican beans
[12,13] with some of the most reliable markers from the previous
study. Later, Kwak and Gepts [4] evaluated 349 cultivated and
wild accessions with 26 markers to make inferences about
population structure in the species. For the most part, their results
for cultivated beans agreed with a simultaneous analysis from Blair
et al. [14] where 604 cultivated genotypes from a core collection
were evaluated with a standardized set of 36 microsatellite
markers.
The main objective of this research was to evaluate the number
of sub-populations in wild common beans and to relate these to
races of cultivated common beans. The specific goals of this study
were 1) to evaluate a large set of over one hundred wild common
bean accessions with the same large panel of microsatellite markers
as in Blair et al. [14], 2) to combine the analysis of wild accessions
described here with that previous analysis of cultivated landraces,
and 3) to determine the population structure and the ongoing
processes of differentiation for wild versus cultivated beans. The
wild accessions were from a wild bean core collection represen-
tative of the geographic range of the species and were
morphologically and genetically diverse. The markers used were
the same set of fluorescent microsatellites evaluated by Blair et al.
[14] allowing the combined analysis of results from wild common
beans used in this study and cultivars used in the previous study.
This is the largest number of wild and cultivated accessions of
common bean to have been analyzed with a standard genotyping
protocol.
Materials and Methods
Plant MaterialsA total of 108 genotypes were used in the fingerprinting analysis
of this study. Of these 108, 88 were wild, 16 were weedy and four
were cultivated check genotypes used in previous studies from our
laboratory [14,19]. All the genotypes were from the Genetic
Resources Unit at the International Center for Tropical Agricul-
ture and are preserved under the treaty for genetic resources from
the Food and Agriculture Organization, hereafter abbreviated as
the FAO collection. The set of accessions conform a core
collection for wild P. vulgaris as described in Tohme et al. [9].
This core collection was based on ecological classification of the
geographical origin of each accession which is found at http://isa.
ciat.cgiar.org/urg/main.do.
The wild and weedy genotypes were from the following
countries arranged from north to south: Mexico (45), El Salvador
(1), Guatemala (11), Costa Rica (1), Colombia (11), Ecuador (5),
Peru (17), Bolivia (3) and Argentina (10). Meanwhile, the four
check genotypes represented the Mesoamerican (Dorado and ICA
Pijao) and Andean genepools (Calima and Chaucha Chuga), with
germplasm entries DOR364, G5773, G19833 and G4494 also
from the FAO collection. For each wild accession three seeds were
scarified by hand by cutting through the seed coat opposite the
micropyle with a razor blade prior to planting in sterilized soil in
a 10 inch diameter pot in a screen-house. Multiple plants were
used to determine if the accessions were heterozygous and to
obtain sufficient leaf tissue for DNA extraction since wild beans
have small leaves. The accessions had been previously selected for
homogenous seed shape, color and size.
DNA Extraction and Microsatellite AnalysisLeaf tissue weighing approximately 20 mg was harvested at 35
days after plant germination and freeze dried in a MODULYoD-
115-ThermoH liophylizer for two days after which it was ground to
a fine powder with a ceramic mortar and pestle. Freeze drying was
found to be more appropriate than grinding in liquid N2 for wild
bean leaf tissue which is rich in carbohydrates and tannins
compared to cultivated bean leaf tissues. The ground tissue was
then used for DNA extraction in a 2 mL eppendorf tube with the
ingredients from a Viogene DNA kit. DNA was quantified in 1%
agarose gels using Ethidium bromide staining and Quantity OneHv 4.0.3 evaluation of the resulting GelDoc 2000 (Bio-RadH) images
comparing lanes for each DNA extraction with lanes representing
25, 50, 100, 200 and 400 ng/ul concentrations of l phage DNA.
Uniform DNA concentrations of 5 ng/ul were then used for PCR
reactions.
A total of 36 fluorescently-labeled microsatellites as listed in
Blair et al. (2009) were employed to evaluate the wild accessions
and cultivated checks. These included 17 gene-based markers and
19 genomic markers distributed in nine panels of four markers
each. For each marker within each panel, the forward primers
were 59 end labeled with one of the following fluorochromes: 6-
FAM, NED, PET or TET. Microsatellites were amplified on
PTC-200 thermocyclers (MJ-Research) in 15 uL reaction volumes
using 20 ng of template DNA, 3 pmole of each primer, 1.5 mM of
MgCl2[c5], 0.6 mM of dNTP and 1 U of Taq polymerase in 1 X
PCR buffer (10 mM of Tris–HCl pH 8.8, 50 mM of KCl, 0.1% of
TritonX-100).
The thermocyling profile was the following: 95uC hot start for
3 min, followed by 28 cycles of 95uC denaturation for 40 s, 55uCannealing for 40 s and 72uC extension for 1 min with a 1-h
extension at 72uC was used post-thermocycling. The resulting
PCR products were evaluated for thermocyling reaction efficiency
on 1.5% agarose gels and then diluted and combined into panels
as per Blair et al. [14]. The LIZ500 size standard was diluted into
formamide and was then added to the mixed PCR products and
these were denatured at 94uC for three minutes. The denatured
sample was then loaded onto an ABI 3730xl automated sequencer
(Applied Biosystem, Foster City, CA) at the Institute for Genomic
Diversity of Cornell University.
Data Analysis for Wild BeansBand or alleles sizes were estimated in base-pairs with
GeneMapper v. 3.7 software (Applied Biosystems). Allele binning
was conducted with AlleloBin software (http://www.icrisat.org/gt-
bt/biometrics.htm) which groups band sizes based on the
algorithm of Idury and Cardon [20]. Whole-integer, binned allelic
data was used to calculate genetic dissimilarity based on the
Diversity Common Bean
PLOS ONE | www.plosone.org 2 November 2012 | Volume 7 | Issue 11 | e49488
proportion of shared alleles in Darwin v.5 software (Perrier et al.
2003).
Meanwhile the software PowerMarker [21], was used to
determine the number of polymorphic alleles (Na), the genetic
diversity index of Nei [22] and the expected heterozygosity and
polymorphic information content (PIC) for each marker [23]. In
addition, the genetic distance matrix was used to construct
a dendogram in Darwin v.5 software using the neighbor-joining
algorithm [22].
Population structure was first examined with STRUCTURE
software [24], which determines a Q matrix of population
relatedness and tests the K value of possible sub-populations
found in a sample of genetic diversity. A total of 15 independent
runs were used for each K value from K = 2 to K = 10 using an
admixture model and 100,000 replicates both in the burn-in and
MCMC analysis. A bar graph of the population structure results
was generated for each K value using Distruct software [25] that
was labeled with the drawing software PowerPointTM 2010
(Microsoft Office).
Following this method, a second population structure analysis
was performed using InStruct software [26]. A correlation model
for allele frequency was performed using 100,000 burn-ins and
200,000 iterations in InStruct. Permutations of the output of
STRUCTURE and Instruct analysis were performed with
CLUMPP software [27] using independent runs to obtain
a consensus matrix based on 15 simulations. The final structure
of the population was determined based on the germplasm
information, cross-run cluster stability, and likelihood of the graph
model from Evano et al. [28].
In addition to analyzing population structure, the genetic
relationship among all accessions was analyzed in three dimen-
sions by principal coordinates analysis using the program Genalex
[29] and plotted through XLSTAT-3D TM program (http://www.
xlstat.com/es/home/) using MicrosoftTM Office Excel 2010. The
geographical distribution of wild accessions was visualized with the
program DIVA-GIS [30]. Genalex [29] was used to perform
a Mantel’s test to estimate the correlation between the matrices of
genetic distance and geographic distance, the latter drawn from
latitude and longitude.
In the Mantel’s test the genetic distance matrix was based on the
proportion of shared alleles as calculated with Darwin software
and the geographic distance matrix was calculated with DIVA-
GIS. Finally, an analysis of molecular variance (AMOVA) was
performed to assess the differentiation among subpopulations
using Arlequin v. 3.11 [31].
Data Analysis for Global Diversity SetThe analysis of the wild accessions described above was
combined with a previous analysis of cultivated landraces by
merging the present dataset with the dataset of Blair et al. (2009)
(Supplemental Table S1). The correspondence between alleles
from different sets was carefully checked and several inconsistent
markers (BMd01, BM205) were excluded. The analyses described
for the wild accessions in the previous paragraphs were repeated
using the integrated matrix. The number of chains for the burn-in
and for the estimation of the posterior distribution in the
STRUCTURE analysis was triplicated, though. This guaranteed
convergence and consistency across all independent runs from
K = 2 to K = 16 so that we could determine the most a parsimo-
nious scenario to understand how diversity was structured across
wild and cultivated common beans. K-level divisions were based
on assignments of genotypes to wild bean sub-populations as
described above or to cultivated races as described in [14]. The
naming convention of the wild sub-populations was based on the
STRUCTURE and PCoA analysis results and the previously
recognized genepools for wild beans in Broughton et al. (2003),
while the naming convention for cultivated races was based on
those proposed by Blair et al. (2009).
Results
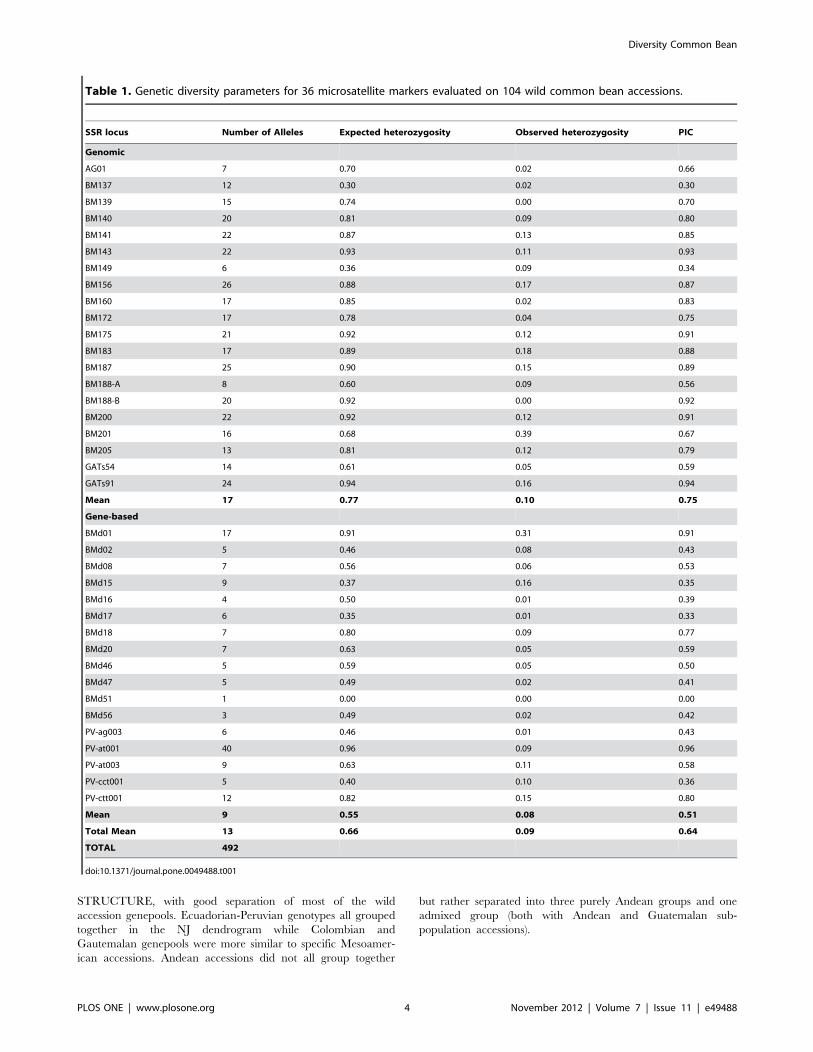
Allelic Diversity of the Wild AccessionsA total of 492 alleles were detected in the wild bean core
collection using the 36 fluorescent markers. This resulted in an
average of 13 alleles per marker. All the markers except for
BMd51 detected polymorphism (Table 1). The average PIC value
was 0.64 and the average expected heterozygosity was 0.66. PV-
at001 was the marker with the highest expected heterozygosity
(0.96) which was to be predicted since this gene-based marker
presented a total of 40 different alleles. The genomic markers
GATs91 and BM143 also had high expected heterozygosities
(above 0.93). On average the genomic microsatellites had a higher
number of alleles (17), higher expected heterozygosity (0.77) and
PIC values (0.75) compared to gene-based microsatellites (with
values of 9 alleles, 0.55 He and 0.51 PIC, respectively). Non-
amplification (null alleles) was only a problem for BM140 and
BM187 with all other markers having from 85 to 100% of the
expected data points. On average marker amplifications provided
96% of the expected data points.
Observed heterozygosity for the markers was 0.09 on average
but was highest for the markers BMd01 and BM201 which were
multiple banding and difficult for allele calling compared to the
other markers. Some other markers had observed heterozygosity
values between 0.13 and 0.18 even though they were easily read as
single-copy bands. These included BM141, BM183, BM187 and
GATs91 among the genomic markers or BMd15 and PV-ctt001
among the gene-based markers. Differences between the genomic
and gene-based microsatellites for observed heterozygosity were
not significant as these had similar averages of 0.10 and 0.08,
respectively.
Population Structure and Dendogram of the WildAccessions
Evaluation of population structure in the wild beans using K = 2
to K = 10 sub-populations resulted in similar separations for the
two software programs used (STRUCTURE and Instruct) and
therefore the first of these softwares is presented. The ideal K-
value was selected based on the increases in likelihood ratios
between runs using Evano’s delta K statistic [28]. Points of
inflection were not observed for the log-likelihood curve but
a smaller increase of the likelihood was found when comparing
K = 5 to previous K-values (Supplemental Figure S1).
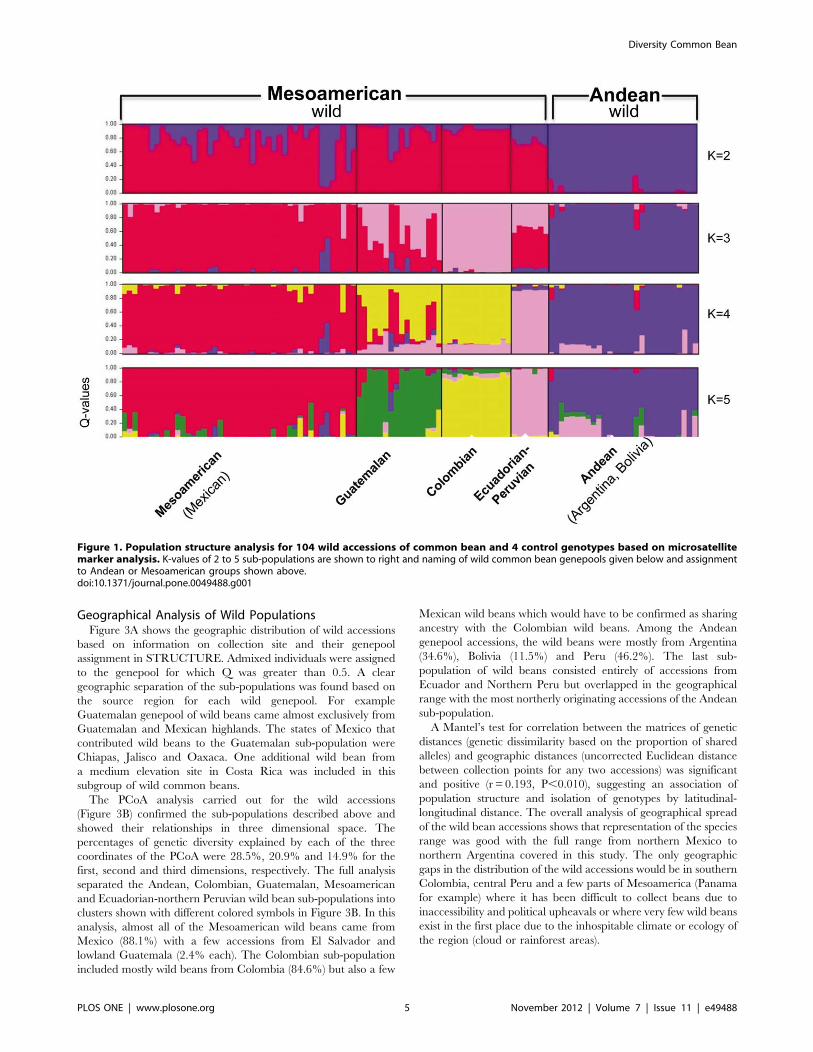
Separation of the sub-populations at each K-value in STRUC-
TURE was instructive and is presented in Figure 1. At the first
level of sub-population separation, K = 2, the wild genotypes
divided into two genepools roughly of Andean and Mesoamerican
types. At K = 3 the Colombian genotypes separated from the other
two genepools. At K = 5 the sub-population separation agreed
with geographical distribution along latitudinal demes of Mesoa-
merican (Mexican), Guatemalan, Colombian, Ecuadorian-north-
ern Peruvian and Andean (Argentinean, Bolivian and Southern
Peru) populations. We favored K = 5 because a second peak was
found for Evano test values at this K-value (Supplemental Figure
S1). The first K value was for K = 2 which represented the Andean
– Mesoamerican split.
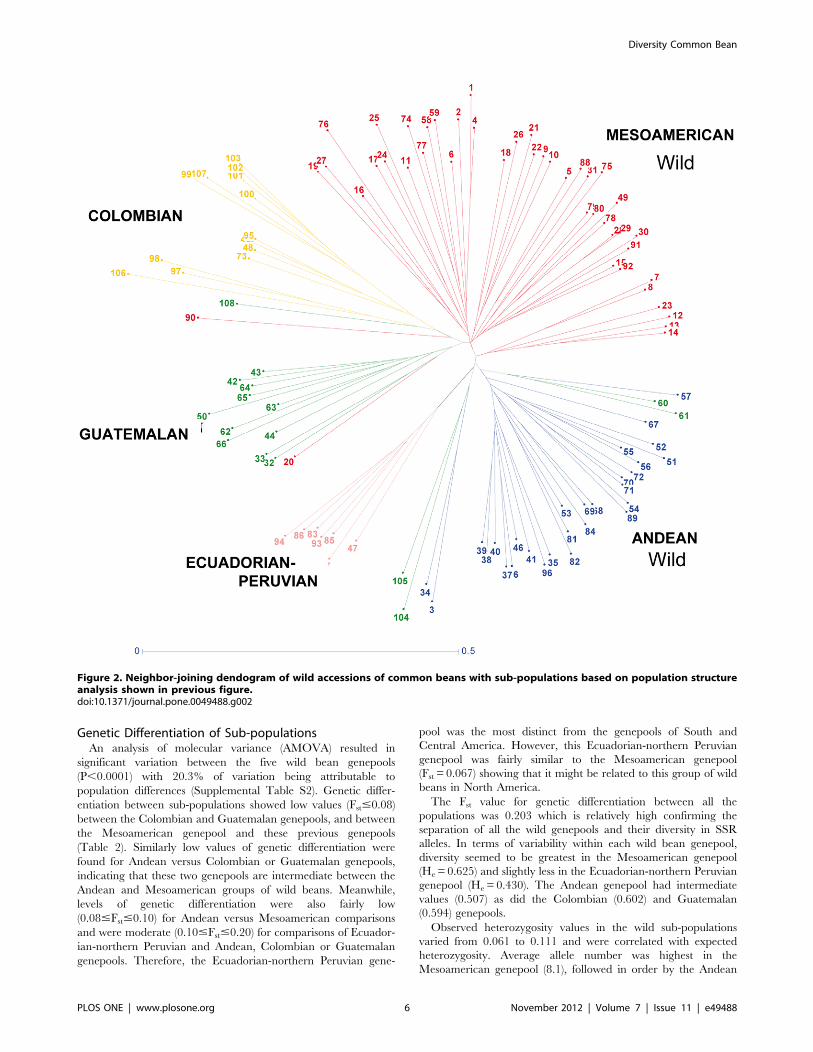
The Neighbor Joining dendogram constructed with the
dissimilarity matrix for the wild genotypes (Figure 2) corrobo-
rated the assignment of genotypes to sub-populations in
Diversity Common Bean
PLOS ONE | www.plosone.org 3 November 2012 | Volume 7 | Issue 11 | e49488
STRUCTURE, with good separation of most of the wild
accession genepools. Ecuadorian-Peruvian genotypes all grouped
together in the NJ dendrogram while Colombian and
Gautemalan genepools were more similar to specific Mesoamer-
ican accessions. Andean accessions did not all group together
but rather separated into three purely Andean groups and one
admixed group (both with Andean and Guatemalan sub-
population accessions).
Table 1. Genetic diversity parameters for 36 microsatellite markers evaluated on 104 wild common bean accessions.
SSR locus Number of Alleles Expected heterozygosity Observed heterozygosity PIC
Genomic
AG01 7 0.70 0.02 0.66
BM137 12 0.30 0.02 0.30
BM139 15 0.74 0.00 0.70
BM140 20 0.81 0.09 0.80
BM141 22 0.87 0.13 0.85
BM143 22 0.93 0.11 0.93
BM149 6 0.36 0.09 0.34
BM156 26 0.88 0.17 0.87
BM160 17 0.85 0.02 0.83
BM172 17 0.78 0.04 0.75
BM175 21 0.92 0.12 0.91
BM183 17 0.89 0.18 0.88
BM187 25 0.90 0.15 0.89
BM188-A 8 0.60 0.09 0.56
BM188-B 20 0.92 0.00 0.92
BM200 22 0.92 0.12 0.91
BM201 16 0.68 0.39 0.67
BM205 13 0.81 0.12 0.79
GATs54 14 0.61 0.05 0.59
GATs91 24 0.94 0.16 0.94
Mean 17 0.77 0.10 0.75
Gene-based
BMd01 17 0.91 0.31 0.91
BMd02 5 0.46 0.08 0.43
BMd08 7 0.56 0.06 0.53
BMd15 9 0.37 0.16 0.35
BMd16 4 0.50 0.01 0.39
BMd17 6 0.35 0.01 0.33
BMd18 7 0.80 0.09 0.77
BMd20 7 0.63 0.05 0.59
BMd46 5 0.59 0.05 0.50
BMd47 5 0.49 0.02 0.41
BMd51 1 0.00 0.00 0.00
BMd56 3 0.49 0.02 0.42
PV-ag003 6 0.46 0.01 0.43
PV-at001 40 0.96 0.09 0.96
PV-at003 9 0.63 0.11 0.58
PV-cct001 5 0.40 0.10 0.36
PV-ctt001 12 0.82 0.15 0.80
Mean 9 0.55 0.08 0.51
Total Mean 13 0.66 0.09 0.64
TOTAL 492
doi:10.1371/journal.pone.0049488.t001
Diversity Common Bean
PLOS ONE | www.plosone.org 4 November 2012 | Volume 7 | Issue 11 | e49488
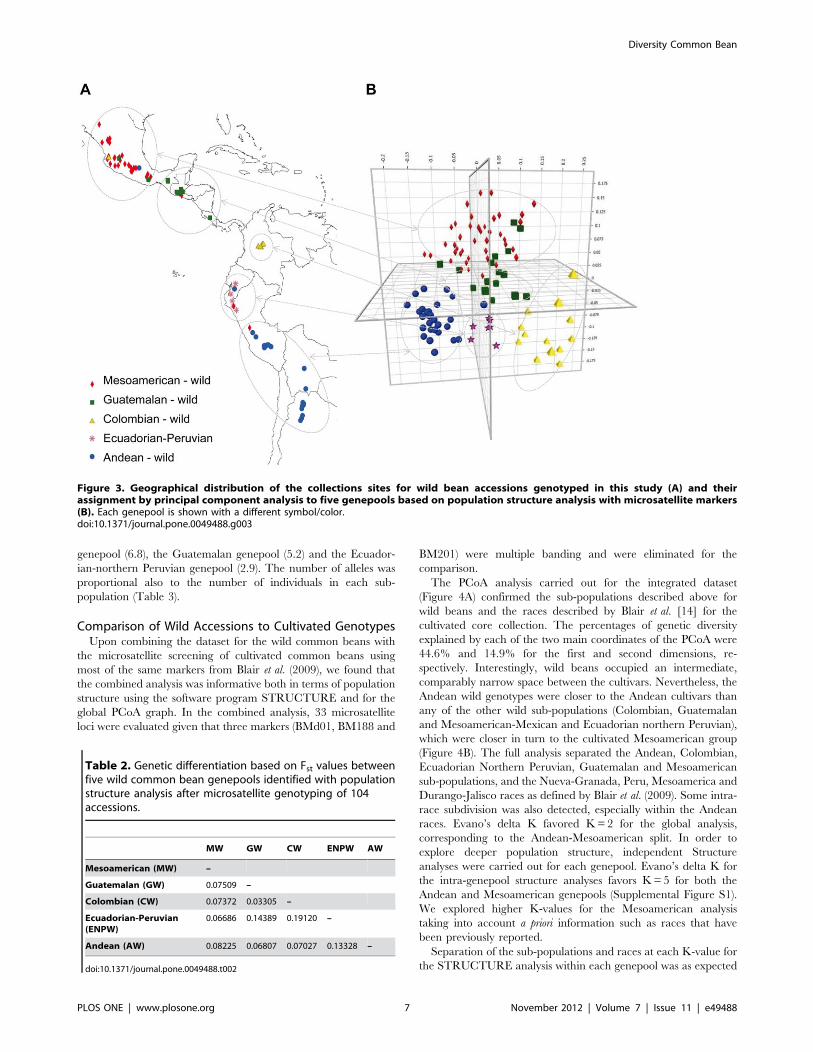
Geographical Analysis of Wild PopulationsFigure 3A shows the geographic distribution of wild accessions
based on information on collection site and their genepool
assignment in STRUCTURE. Admixed individuals were assigned
to the genepool for which Q was greater than 0.5. A clear
geographic separation of the sub-populations was found based on
the source region for each wild genepool. For example
Guatemalan genepool of wild beans came almost exclusively from
Guatemalan and Mexican highlands. The states of Mexico that
contributed wild beans to the Guatemalan sub-population were
Chiapas, Jalisco and Oaxaca. One additional wild bean from
a medium elevation site in Costa Rica was included in this
subgroup of wild common beans.
The PCoA analysis carried out for the wild accessions
(Figure 3B) confirmed the sub-populations described above and
showed their relationships in three dimensional space. The
percentages of genetic diversity explained by each of the three
coordinates of the PCoA were 28.5%, 20.9% and 14.9% for the
first, second and third dimensions, respectively. The full analysis
separated the Andean, Colombian, Guatemalan, Mesoamerican
and Ecuadorian-northern Peruvian wild bean sub-populations into
clusters shown with different colored symbols in Figure 3B. In this
analysis, almost all of the Mesoamerican wild beans came from
Mexico (88.1%) with a few accessions from El Salvador and
lowland Guatemala (2.4% each). The Colombian sub-population
included mostly wild beans from Colombia (84.6%) but also a few
Mexican wild beans which would have to be confirmed as sharing
ancestry with the Colombian wild beans. Among the Andean
genepool accessions, the wild beans were mostly from Argentina
(34.6%), Bolivia (11.5%) and Peru (46.2%). The last sub-
population of wild beans consisted entirely of accessions from
Ecuador and Northern Peru but overlapped in the geographical
range with the most northerly originating accessions of the Andean
sub-population.
A Mantel’s test for correlation between the matrices of genetic
distances (genetic dissimilarity based on the proportion of shared
alleles) and geographic distances (uncorrected Euclidean distance
between collection points for any two accessions) was significant
and positive (r = 0.193, P,0.010), suggesting an association of
population structure and isolation of genotypes by latitudinal-
longitudinal distance. The overall analysis of geographical spread
of the wild bean accessions shows that representation of the species
range was good with the full range from northern Mexico to
northern Argentina covered in this study. The only geographic
gaps in the distribution of the wild accessions would be in southern
Colombia, central Peru and a few parts of Mesoamerica (Panama
for example) where it has been difficult to collect beans due to
inaccessibility and political upheavals or where very few wild beans
exist in the first place due to the inhospitable climate or ecology of
the region (cloud or rainforest areas).
Figure 1. Population structure analysis for 104 wild accessions of common bean and 4 control genotypes based on microsatellitemarker analysis. K-values of 2 to 5 sub-populations are shown to right and naming of wild common bean genepools given below and assignmentto Andean or Mesoamerican groups shown above.doi:10.1371/journal.pone.0049488.g001
Diversity Common Bean
PLOS ONE | www.plosone.org 5 November 2012 | Volume 7 | Issue 11 | e49488
Genetic Differentiation of Sub-populationsAn analysis of molecular variance (AMOVA) resulted in
significant variation between the five wild bean genepools
(P,0.0001) with 20.3% of variation being attributable to
population differences (Supplemental Table S2). Genetic differ-
entiation between sub-populations showed low values (Fst#0.08)
between the Colombian and Guatemalan genepools, and between
the Mesoamerican genepool and these previous genepools
(Table 2). Similarly low values of genetic differentiation were
found for Andean versus Colombian or Guatemalan genepools,
indicating that these two genepools are intermediate between the
Andean and Mesoamerican groups of wild beans. Meanwhile,
levels of genetic differentiation were also fairly low
(0.08#Fst#0.10) for Andean versus Mesoamerican comparisons
and were moderate (0.10#Fst#0.20) for comparisons of Ecuador-
ian-northern Peruvian and Andean, Colombian or Guatemalan
genepools. Therefore, the Ecuadorian-northern Peruvian gene-
pool was the most distinct from the genepools of South and
Central America. However, this Ecuadorian-northern Peruvian
genepool was fairly similar to the Mesoamerican genepool
(Fst = 0.067) showing that it might be related to this group of wild
beans in North America.
The Fst value for genetic differentiation between all the
populations was 0.203 which is relatively high confirming the
separation of all the wild genepools and their diversity in SSR
alleles. In terms of variability within each wild bean genepool,
diversity seemed to be greatest in the Mesoamerican genepool
(He = 0.625) and slightly less in the Ecuadorian-northern Peruvian
genepool (He = 0.430). The Andean genepool had intermediate
values (0.507) as did the Colombian (0.602) and Guatemalan
(0.594) genepools.
Observed heterozygosity values in the wild sub-populations
varied from 0.061 to 0.111 and were correlated with expected
heterozygosity. Average allele number was highest in the
Mesoamerican genepool (8.1), followed in order by the Andean
Figure 2. Neighbor-joining dendogram of wild accessions of common beans with sub-populations based on population structureanalysis shown in previous figure.doi:10.1371/journal.pone.0049488.g002
Diversity Common Bean
PLOS ONE | www.plosone.org 6 November 2012 | Volume 7 | Issue 11 | e49488
genepool (6.8), the Guatemalan genepool (5.2) and the Ecuador-
ian-northern Peruvian genepool (2.9). The number of alleles was
proportional also to the number of individuals in each sub-
population (Table 3).
Comparison of Wild Accessions to Cultivated GenotypesUpon combining the dataset for the wild common beans with
the microsatellite screening of cultivated common beans using
most of the same markers from Blair et al. (2009), we found that
the combined analysis was informative both in terms of population
structure using the software program STRUCTURE and for the
global PCoA graph. In the combined analysis, 33 microsatellite
loci were evaluated given that three markers (BMd01, BM188 and
BM201) were multiple banding and were eliminated for the
comparison.
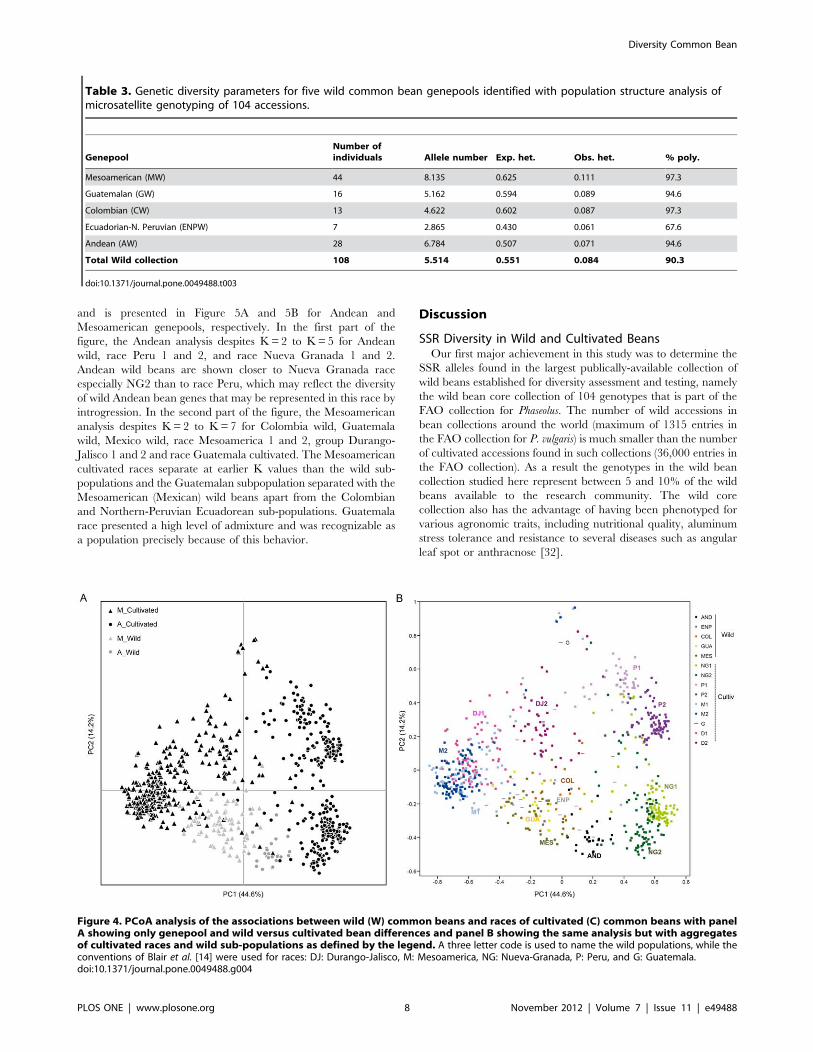
The PCoA analysis carried out for the integrated dataset
(Figure 4A) confirmed the sub-populations described above for
wild beans and the races described by Blair et al. [14] for the
cultivated core collection. The percentages of genetic diversity
explained by each of the two main coordinates of the PCoA were
44.6% and 14.9% for the first and second dimensions, re-
spectively. Interestingly, wild beans occupied an intermediate,
comparably narrow space between the cultivars. Nevertheless, the
Andean wild genotypes were closer to the Andean cultivars than
any of the other wild sub-populations (Colombian, Guatemalan
and Mesoamerican-Mexican and Ecuadorian northern Peruvian),
which were closer in turn to the cultivated Mesoamerican group
(Figure 4B). The full analysis separated the Andean, Colombian,
Ecuadorian Northern Peruvian, Guatemalan and Mesoamerican
sub-populations, and the Nueva-Granada, Peru, Mesoamerica and
Durango-Jalisco races as defined by Blair et al. (2009). Some intra-
race subdivision was also detected, especially within the Andean
races. Evano’s delta K favored K = 2 for the global analysis,
corresponding to the Andean-Mesoamerican split. In order to
explore deeper population structure, independent Structure
analyses were carried out for each genepool. Evano’s delta K for
the intra-genepool structure analyses favors K = 5 for both the
Andean and Mesoamerican genepools (Supplemental Figure S1).
We explored higher K-values for the Mesoamerican analysis
taking into account a priori information such as races that have
been previously reported.
Separation of the sub-populations and races at each K-value for
the STRUCTURE analysis within each genepool was as expected
Figure 3. Geographical distribution of the collections sites for wild bean accessions genotyped in this study (A) and theirassignment by principal component analysis to five genepools based on population structure analysis with microsatellite markers(B). Each genepool is shown with a different symbol/color.doi:10.1371/journal.pone.0049488.g003
Table 2. Genetic differentiation based on Fst values betweenfive wild common bean genepools identified with populationstructure analysis after microsatellite genotyping of 104accessions.
MW GW CW ENPW AW
Mesoamerican (MW) –
Guatemalan (GW) 0.07509 –
Colombian (CW) 0.07372 0.03305 –
Ecuadorian-Peruvian(ENPW)
0.06686 0.14389 0.19120 –
Andean (AW) 0.08225 0.06807 0.07027 0.13328 –
doi:10.1371/journal.pone.0049488.t002
Diversity Common Bean
PLOS ONE | www.plosone.org 7 November 2012 | Volume 7 | Issue 11 | e49488
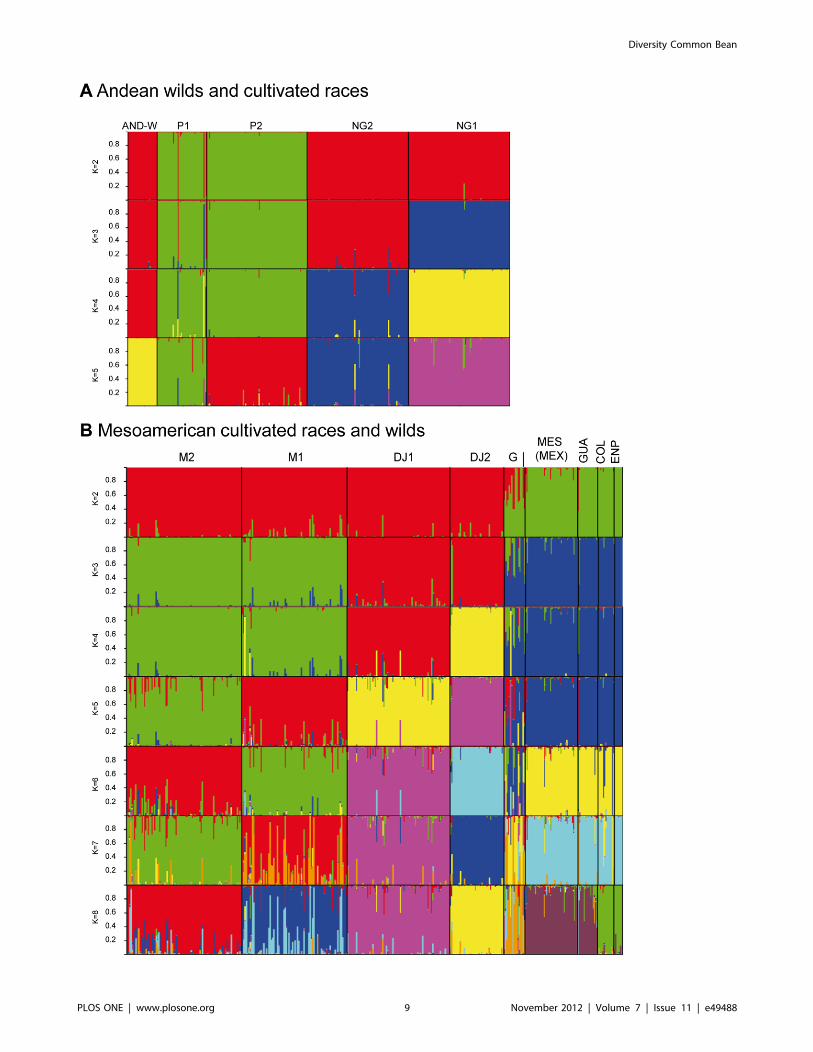
and is presented in Figure 5A and 5B for Andean and
Mesoamerican genepools, respectively. In the first part of the
figure, the Andean analysis despites K = 2 to K = 5 for Andean
wild, race Peru 1 and 2, and race Nueva Granada 1 and 2.
Andean wild beans are shown closer to Nueva Granada race
especially NG2 than to race Peru, which may reflect the diversity
of wild Andean bean genes that may be represented in this race by
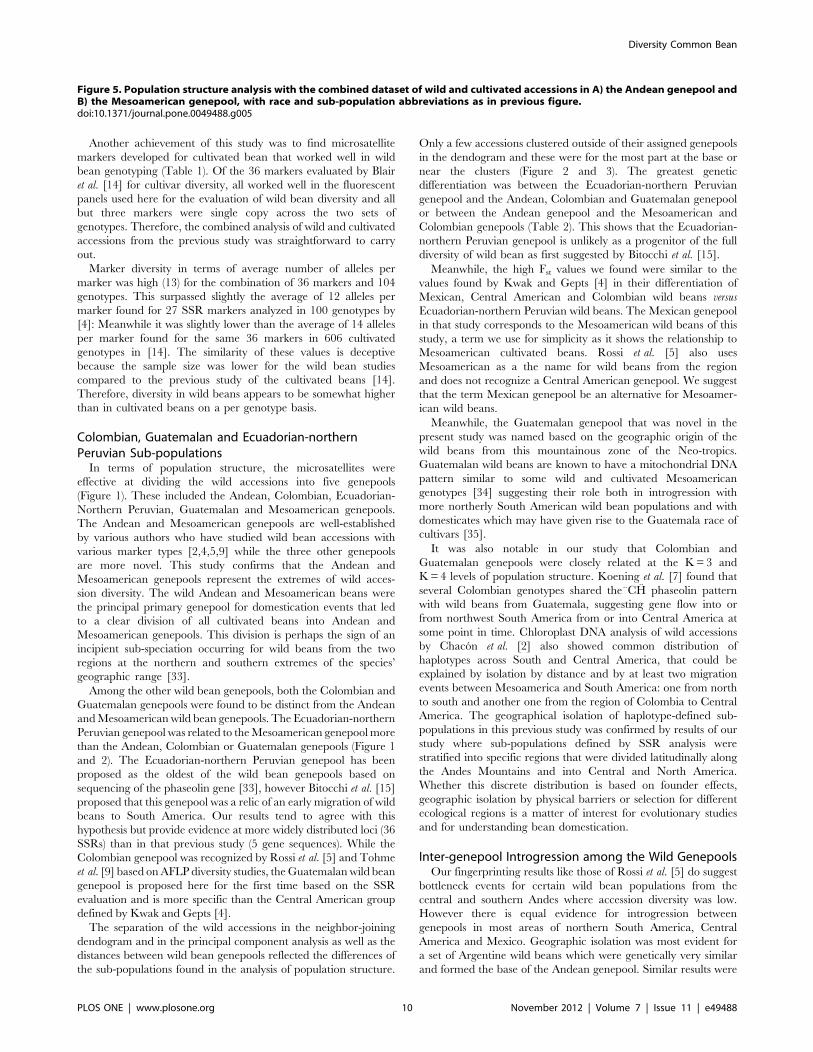
introgression. In the second part of the figure, the Mesoamerican
analysis despites K = 2 to K = 7 for Colombia wild, Guatemala
wild, Mexico wild, race Mesoamerica 1 and 2, group Durango-
Jalisco 1 and 2 and race Guatemala cultivated. The Mesoamerican
cultivated races separate at earlier K values than the wild sub-
populations and the Guatemalan subpopulation separated with the
Mesoamerican (Mexican) wild beans apart from the Colombian
and Northern-Peruvian Ecuadorean sub-populations. Guatemala
race presented a high level of admixture and was recognizable as
a population precisely because of this behavior.
Discussion
SSR Diversity in Wild and Cultivated BeansOur first major achievement in this study was to determine the
SSR alleles found in the largest publically-available collection of
wild beans established for diversity assessment and testing, namely
the wild bean core collection of 104 genotypes that is part of the
FAO collection for Phaseolus. The number of wild accessions in
bean collections around the world (maximum of 1315 entries in
the FAO collection for P. vulgaris) is much smaller than the number
of cultivated accessions found in such collections (36,000 entries in
the FAO collection). As a result the genotypes in the wild bean
collection studied here represent between 5 and 10% of the wild
beans available to the research community. The wild core
collection also has the advantage of having been phenotyped for
various agronomic traits, including nutritional quality, aluminum
stress tolerance and resistance to several diseases such as angular
leaf spot or anthracnose [32].
Table 3. Genetic diversity parameters for five wild common bean genepools identified with population structure analysis ofmicrosatellite genotyping of 104 accessions.
GenepoolNumber ofindividuals Allele number Exp. het. Obs. het. % poly.
Mesoamerican (MW) 44 8.135 0.625 0.111 97.3
Guatemalan (GW) 16 5.162 0.594 0.089 94.6
Colombian (CW) 13 4.622 0.602 0.087 97.3
Ecuadorian-N. Peruvian (ENPW) 7 2.865 0.430 0.061 67.6
Andean (AW) 28 6.784 0.507 0.071 94.6
Total Wild collection 108 5.514 0.551 0.084 90.3
doi:10.1371/journal.pone.0049488.t003
Figure 4. PCoA analysis of the associations between wild (W) common beans and races of cultivated (C) common beans with panelA showing only genepool and wild versus cultivated bean differences and panel B showing the same analysis but with aggregatesof cultivated races and wild sub-populations as defined by the legend. A three letter code is used to name the wild populations, while theconventions of Blair et al. [14] were used for races: DJ: Durango-Jalisco, M: Mesoamerica, NG: Nueva-Granada, P: Peru, and G: Guatemala.doi:10.1371/journal.pone.0049488.g004
Diversity Common Bean
PLOS ONE | www.plosone.org 8 November 2012 | Volume 7 | Issue 11 | e49488
Diversity Common Bean
PLOS ONE | www.plosone.org 9 November 2012 | Volume 7 | Issue 11 | e49488
Another achievement of this study was to find microsatellite
markers developed for cultivated bean that worked well in wild
bean genotyping (Table 1). Of the 36 markers evaluated by Blair
et al. [14] for cultivar diversity, all worked well in the fluorescent
panels used here for the evaluation of wild bean diversity and all
but three markers were single copy across the two sets of
genotypes. Therefore, the combined analysis of wild and cultivated
accessions from the previous study was straightforward to carry
out.
Marker diversity in terms of average number of alleles per
marker was high (13) for the combination of 36 markers and 104
genotypes. This surpassed slightly the average of 12 alleles per
marker found for 27 SSR markers analyzed in 100 genotypes by
[4]: Meanwhile it was slightly lower than the average of 14 alleles
per marker found for the same 36 markers in 606 cultivated
genotypes in [14]. The similarity of these values is deceptive
because the sample size was lower for the wild bean studies
compared to the previous study of the cultivated beans [14].
Therefore, diversity in wild beans appears to be somewhat higher
than in cultivated beans on a per genotype basis.
Colombian, Guatemalan and Ecuadorian-northernPeruvian Sub-populations
In terms of population structure, the microsatellites were
effective at dividing the wild accessions into five genepools
(Figure 1). These included the Andean, Colombian, Ecuadorian-
Northern Peruvian, Guatemalan and Mesoamerican genepools.
The Andean and Mesoamerican genepools are well-established
by various authors who have studied wild bean accessions with
various marker types [2,4,5,9] while the three other genepools
are more novel. This study confirms that the Andean and
Mesoamerican genepools represent the extremes of wild acces-
sion diversity. The wild Andean and Mesoamerican beans were
the principal primary genepool for domestication events that led
to a clear division of all cultivated beans into Andean and
Mesoamerican genepools. This division is perhaps the sign of an
incipient sub-speciation occurring for wild beans from the two
regions at the northern and southern extremes of the species’
geographic range [33].
Among the other wild bean genepools, both the Colombian and
Guatemalan genepools were found to be distinct from the Andean
and Mesoamerican wild bean genepools. The Ecuadorian-northern
Peruvian genepool was related to the Mesoamerican genepool more
than the Andean, Colombian or Guatemalan genepools (Figure 1
and 2). The Ecuadorian-northern Peruvian genepool has been
proposed as the oldest of the wild bean genepools based on
sequencing of the phaseolin gene [33], however Bitocchi et al. [15]
proposed that this genepool was a relic of an early migration of wild
beans to South America. Our results tend to agree with this
hypothesis but provide evidence at more widely distributed loci (36
SSRs) than in that previous study (5 gene sequences). While the
Colombian genepool was recognized by Rossi et al. [5] and Tohme
et al. [9] based on AFLP diversity studies, the Guatemalan wild bean
genepool is proposed here for the first time based on the SSR
evaluation and is more specific than the Central American group
defined by Kwak and Gepts [4].
The separation of the wild accessions in the neighbor-joining
dendogram and in the principal component analysis as well as the
distances between wild bean genepools reflected the differences of
the sub-populations found in the analysis of population structure.
Only a few accessions clustered outside of their assigned genepools
in the dendogram and these were for the most part at the base or
near the clusters (Figure 2 and 3). The greatest genetic
differentiation was between the Ecuadorian-northern Peruvian
genepool and the Andean, Colombian and Guatemalan genepool
or between the Andean genepool and the Mesoamerican and
Colombian genepools (Table 2). This shows that the Ecuadorian-
northern Peruvian genepool is unlikely as a progenitor of the full
diversity of wild bean as first suggested by Bitocchi et al. [15].
Meanwhile, the high Fst values we found were similar to the
values found by Kwak and Gepts [4] in their differentiation of
Mexican, Central American and Colombian wild beans versus
Ecuadorian-northern Peruvian wild beans. The Mexican genepool
in that study corresponds to the Mesoamerican wild beans of this
study, a term we use for simplicity as it shows the relationship to
Mesoamerican cultivated beans. Rossi et al. [5] also uses
Mesoamerican as a the name for wild beans from the region
and does not recognize a Central American genepool. We suggest
that the term Mexican genepool be an alternative for Mesoamer-
ican wild beans.
Meanwhile, the Guatemalan genepool that was novel in the
present study was named based on the geographic origin of the
wild beans from this mountainous zone of the Neo-tropics.
Guatemalan wild beans are known to have a mitochondrial DNA
pattern similar to some wild and cultivated Mesoamerican
genotypes [34] suggesting their role both in introgression with
more northerly South American wild bean populations and with
domesticates which may have given rise to the Guatemala race of
cultivars [35].
It was also notable in our study that Colombian and
Guatemalan genepools were closely related at the K = 3 and
K = 4 levels of population structure. Koening et al. [7] found that
several Colombian genotypes shared the¨CH phaseolin pattern
with wild beans from Guatemala, suggesting gene flow into or
from northwest South America from or into Central America at
some point in time. Chloroplast DNA analysis of wild accessions
by Chacon et al. [2] also showed common distribution of
haplotypes across South and Central America, that could be
explained by isolation by distance and by at least two migration
events between Mesoamerica and South America: one from north
to south and another one from the region of Colombia to Central
America. The geographical isolation of haplotype-defined sub-
populations in this previous study was confirmed by results of our
study where sub-populations defined by SSR analysis were
stratified into specific regions that were divided latitudinally along
the Andes Mountains and into Central and North America.
Whether this discrete distribution is based on founder effects,
geographic isolation by physical barriers or selection for different
ecological regions is a matter of interest for evolutionary studies
and for understanding bean domestication.
Inter-genepool Introgression among the Wild GenepoolsOur fingerprinting results like those of Rossi et al. [5] do suggest
bottleneck events for certain wild bean populations from the
central and southern Andes where accession diversity was low.
However there is equal evidence for introgression between
genepools in most areas of northern South America, Central
America and Mexico. Geographic isolation was most evident for
a set of Argentine wild beans which were genetically very similar
and formed the base of the Andean genepool. Similar results were
Figure 5. Population structure analysis with the combined dataset of wild and cultivated accessions in A) the Andean genepool andB) the Mesoamerican genepool, with race and sub-population abbreviations as in previous figure.doi:10.1371/journal.pone.0049488.g005
Diversity Common Bean
PLOS ONE | www.plosone.org 10 November 2012 | Volume 7 | Issue 11 | e49488
predicted for southern Andean wild beans [36] and for another set
of Argentine accessions [37]. Introgression between other groups
of wild beans was observed by Tohme et al. [9] given that
genotypes defined by AFLP markers from these groups had
phaseolin alleles from the Mesoamerican genepool. It was also
remarkable how divergent the clusters within wild and cultivated
common beans were once the main genepool subdivision was
considered indicating a large amount of population structure in
common beans as a species which agrees with results from other
marker studies [4,14,15].
A discrete population scenario is useful to understand the
structure across multiple cultivated races and nested sub-races,
while isolation by distance or a discrete population model with
somewhat permeable boundaries is more adequate to characterize
the neutral genetic variation of wild common beans. For instance,
molecular differences among groups of wild accessions was not as
clear as among races in the cultivated types, even though diversity
in wild beans appears to be somewhat higher than in cultivated
beans.
These contrasting scenarios of population structure in cultivated
and wild beans reveal the impact of multiple domestications and
divergent human selection on shaping the diversity within
cultivars. Therefore, in common bean somewhat like rice [2],
several domestications and strong selection processes have given
rise to highly differentiated and diverse cultivated genepools and
races (Figure 4 and 5). On the other hand, a combination of
geographic expansion and contraction of the species and natural
selection, may explain variation within wild common beans. In
short, distinct demographic and diversification processes may
explain why a discrete population scenario is more applicable to
describe population structure across cultivars, while a discrete
population model with somewhat permeable boundaries is more
adequate to understand variation of wild common beans.
Additional Questions and ConclusionsOther interesting questions remain. The intermediate position
of the cultivated Guatemala race (Figure 5) may suggest it as an
introgression bridge between Mesoamerican wild sub-populations
and cultivated races with Northern South American populations.
However, it also may be regarded as a third independent
domestication event. Further study is needed on whether in-
trogression was symmetric or asymmetric between genepools and
races, or whether it was actually an artifact of extensive ancestral
polymorphism. Finally, we were unable to pin-point where the
multiple and independent domestications occurred. The answer
may be that there were more domestications and introgression
events than initially thought, and that they were carried out in
a stepwise manner at different times and locations in various
societies of the Americas rather than as unique events in single
locations.
We can conclude that the wild Andean and Mesoamerican
genepools were the principal sources of domesticates which were
probably enhanced by introgression from some of the other three
wild genepools (Colombian, Ecuadorian-northern Peruvian and
Guatemalan). This introgression would have helped to create the
race structure observable today in cultivated common beans,
especially for race Nueva Granada in the Andean genepool and
race Guatemala in the Mesoamerican genepool. Finally, finger-
printing with fluorescently-labeled microsatellites was an excellent
technique for the evaluation of wild bean populations, for studying
population structure and dynamics, as well as for linking wild sub-
populations to cultivar races. Some evidence was found for
a bottlenecks that might have occurred in the derivation of the
Andean genepool from Mesoamerican ancestors but less upon
domestication of the crop by New World farmers when enhanced
diversity was selected along the road to the creation of bean races.
The wild bean core collection will be valuable for further
phenotyping, diversity assessment or association mapping and is
proposed as a starting point for studies of wild accessions of this
species [38,39]. Therefore, this constitutes an ideal system to study
diversification, domestication and adaptive processes across two of
the most diverse hotspots for genetic resources in the world: the
Andes and Mesoamerica.
Supporting Information
Figure S1 Natural logarithm of the likelihood and Evano’s delta
K for the structure analysis conducted for wild accessions, for
Andean cultivated and wild accessions, for Mesoamerican
cultivated and wild accessions, and for all cultivated and wild
accessions.
(PSD)
Table S1 Wild and cultivated accessions used in this study
depicting the region/country where they were collected and the
genepool to which they were assigned.
(XLSX)
Table S2 AMOVA details for the wild analysis.
(XLSX)
Acknowledgments
We are grateful to Lucy M. Dıaz for technical help and training in the use
of software and to Daniel G. Debouck and Orlando Toro for the supply of
germplasm. Thanks also go to Agobardo Hoyos and Alcides Hincapie for
seed and greenhouse maintenance in Colombia and to Natalia Moreno,
Charlotte Acharaya and Sharon E. Mitchell for help at the Institute for
Genomic Diversity in Cornell.
Author Contributions
Conceived and designed the experiments: MWB. Performed the experi-
ments: AS. Analyzed the data: AS AJC. Contributed reagents/materials/
analysis tools: MWB AJC. Wrote the paper: MWB AS AJC.
References
1. Broughton WJ, Hernandez G, Blair M, Beebe S, Gepts P, et al. (2003) Beans
(Phaseolus spp.) - model food legumes. Plant and Soil 252: 55–128.
2. Chacon MI, Pickersgill B, Debouck DG, Arias JS (2007) Phylogeographic
analysis of the chloroplast DNA variation in wild common bean (Phaseolus vulgaris
L.) in the Americas. Plant Systematics and Evolution 266: 175–195.
3. Miklas PN, Singh SP (2007) Common bean. In: Kole C, editor. Genome
mapping and molecular breeding in plants Vol 3. Berlin: Pulses, sugar and tuber
crops. Springer Verlag. 1–31.
4. Kwak M, Gepts P (2009) Structure of genetic diversity in the two major gene
pools of common bean (Phaseolus vulgaris L., Fabaceae). Theoretical and Applied
Genetics 118: 979–992.
5. Rossi M, Bitocchi E, Bellucci E, Nanni L, Rau D, et al. (2009) Linkage
disequilibrium and population structure in wild and domesticated populations of
Phaseolus vulgaris L. Evolutionary Applications 2: 504–522.
6. Gepts P, Osborn TC, Rashka K, Bliss FA (1986) Phaseolin-protein Variability in
Wild Forms and Landraces of the Common Bean (Phaseolus vulgaris): Evidence for
Multiple Centers of Domestication. Economic botany 40: 451–468.
7. Koenig R, Gepts P (1989) Allozyme diversity in wild Phaseolus vulgaris: futher
evidence for two mayor centers of genetic diversity. Theoretical and Applied
Genetics 78: 809–817.
8. Gepts P, Debouck D (1991) Origin, domestication and evolution of the common
bean (Phaseolus vulgaris L.). In: Common beans: Research for crop improvement.
Diversity Common Bean
PLOS ONE | www.plosone.org 11 November 2012 | Volume 7 | Issue 11 | e49488
In: Van Shoonhoven A, Voysest O, editors: Wallingford, Commonwealth
Agricultural Bureau. 7–53.9. Tohme J, Gonzalez O, Beebe S, Duque MC (1996) AFLP Analysis of Gene
Pools of a Wild Bean Core Collection. Crop Science 36: 1375–1384.
10. Beebe S, Rengifo J, Gaitan E, Duque MC, Tohme J (2001) Diversity and originof Andean landraces of common bean. Crop Science 41: 854–862.
11. Kwak M, Kami JA, Gepts P (2009) The Putative Mesoamerican DomesticationCenter of Phaseolus vulgaris Is Located in the Lerma-Santiago Basin of Mexico.
Crop Science 49: 554–563.
12. Dıaz LM, Blair MW (2006) Race structure within the Mesoamerican gene poolof common bean (Phaseolus vulgaris L.) as determined by microsatellite markers.
Theoretical and Applied Genetics 114.13. Blair MW, Diaz JM, Hidalgo R, Diaz LM, Duque MC (2007) Microsatellite
characterization of Andean races of common bean (Phaseolus vulgaris L.).Theoretical and Applied Genetics 116: 29–43.
14. Blair M, Diaz LM, Buendia HF, Duque MC (2009) Genetic diversity, seed size
associations and population structure of a core collection of common beans(Phaseolus vulgaris L.). Theoretical and Applied Genetics 119: 955–972.
15. Bitocchi E, Nanni L, Bellucci E, Rossi M, Giardini A, et al. (2012)Mesoamerican origin of the common bean (Phaseolus vulgaris L.) is revealed by
sequence data. Proceedings of the National Academy of Sciences 109: E788–
E796.16. Cortes AJ, Chavarro MC, Blair MW (2011) SNP marker diversity in common
bean (Phaseolus vulgaris L.). Theoretical and Applied Genetics 123: 827–845.17. Gaitan E, Duque MC, Edwards K, Tohme J (2002) Microsatellite repeats in
common bean (Phaseolus vulgaris L.): isolation, characterization, and cross-speciesamplification in Phaseolus spp. Crop Science 42: 2128–2136.
18. Metais I, Hamon B, Jalouzot R, Peltier D (2002) Structure and level of genetic
diversity in various bean types evidenced with microsatellite markers isolatedfrom a genomic enriched library. Theoretical and Applied Genetics 104: 1346–
1352.19. Blair MW, Giraldo MC, Buendia HF, Tovar E, Duque MC, et al. (2006)
Microsatellite marker diversity in common bean (Phaseolus vulgaris L.).
Theoretical and Applied Genetics 113: 100–109.20. Idury RM, Cardon LR (1997) A simple method for automated allele binning in
microsatellite markers. Genome Research 11: 1104–1109.21. Liu K, Muse S (2005) PowerMarker: integrated analysis environment for genetic
marker data. Bioinformatics 21: 2128–2129.22. Nei M (1987) Molecular evolutionary genetics. New York.
23. Anderson JA, Churchill GA, Autrique JE, Tanksley SD, Sorrells ME (1993)
Optimizing parental selection for genetic linkage maps. Genome 36: 181–186.24. Pritchard JK, Stephens M, Donnelly P (2000) Inference of population structure
using multilocus genotype data. Genetics 155: 945–959.25. Rosenberg NA (2002) Distruct: a program for the graphical display of structure
results. http://www.cmb.usc.edu/»noahr/distruct.
26. Gao H, Williamson S, Bustamante CD (2007) An MCMC Approach for Joint
Inference of Population Structure and Inbreeding Rates from Multi-LocusGenotype Data. Genetics 176: 1635–1651.
27. Jakobsson M, Rosenberg NA (2007) CLUMPP: a cluster matching and
permutation program for dealing with label switching and multimodality inanalysis of population structure. Bioinformatics 23: 1801–1806.
28. Evanno G, Regnaut S, Goudet J (2005) Detecting the number of clusters ofindividuals using the software STRUCTURE: a simulation study. Molecular
Ecology 14: 2611–2620.
29. Peakall R, Smouse PE (2006) GENALEX 6: genetic analysis in Excel.Population genetic software for teaching and research. Molecular Ecology
Notes 6: 288–295.30. Hijmans RJ, Guarino L, Cruz M, Rojas E (2001) Computer tools for spatial
analysis of plant genetic resources data: 1. DIVA-GIS. Plant Genetic ResourcesNewsletter 127: 15–19.
31. Excoffier L, Laval G, Schneider S (2005) Arlequin (version 3.0): An integrated
software package for population genetics data analysis. Evolutionary Bioinfor-matics Online 1: 47–50.
32. Mahuku GS, Jara C, Cajiao C, Beebe SE (2003) Sources of resistance to angularleaf spot (Phaeoisariopsis griseola) in common bean core collection, wild Phaseolus
vulgaris and secondary gene pool. Euphytica 130: 303–313.
33. Kami J, Becerra V, Debouck DG, Gepts P (1995) Identification of presumedancestral DNA sequences of phaseolin in Phaseolus vulgaris. Proceedings of the
National Academy of Sciences 92: 1101–1104.34. Khairallah M, Sears B, Adams M (1992) Mitochondrial restriction fragment
length polymorphisms in wild Phaseolus vulgaris L.: insights on thedomestication of the common bean. Theoretical and Applied Genetics 84:
915–922.
35. Beebe S, Skroch PW, Tohme J, Duque MC, Pedraza F, et al. (2000) Structure ofgenetic diversity among common bean landraces of Mesoamerican origin based
on Correspondence Analysis of RAPD. Crop Science 40: 264–227.36. Debouck DG, Toro O, Paredes OM, Johnson WC, Gepts P (1993) Genetic
diversity and ecological distribution of Phaseolus vulgaris (Fabaceae) in northwest-
ern South America. Economic botany 47: 408–423.37. Galvan MZ, Menendez-Sevillano MC, De Ron AM, Santalla M, Balatti PA
(2006) Genetic diversity among wild common beans from northwesternargentina based on morpho-agronomic and RAPD data. Genetic Resources
and Crop Evolution 53: 891–900.38. Cortes AJ, Chavarro MC, Madrinan S, This D, Blair MW (2012) Molecular
ecology and selection in the drought-related Asr gene polymorphisms in wild and
cultivated common bean (Phaseolus vulgaris L.). BMC Genetics 13: 58.39. Cortes AJ, This D, Chavarro C, Madrinan S, Blair MW (2012) Nucleotide
diversity patterns at the drought-related DREB2 encoding genes in wild andcultivated common bean (Phaseolus vulgaris L.). Theoretical and Applied Genetics
125: 1069–1085.
Diversity Common Bean
PLOS ONE | www.plosone.org 12 November 2012 | Volume 7 | Issue 11 | e49488