Genetic diversity, seed size associations and population structure of a core collection of common...
18
Theor Appl Genet (2009) 119:955–972 DOI 10.1007/s00122-009-1064-8 123 ORIGINAL PAPER Genetic diversity, seed size associations and population structure of a core collection of common beans (Phaseolus vulgaris L.) Matthew W. Blair · Lucy M. Díaz · Hector F. Buendía · Myriam C. Duque Received: 18 October 2008 / Accepted: 11 May 2009 / Published online: 18 August 2009 © Springer-Verlag 2009 Abstract Cultivated common bean germplasm is espe- cially diverse due to the parallel domestication of two gene- pools in the Mesoamerican and Andean centers of diversity and introgression between these gene pools. ClassiWcation into morphological races has helped to provide a frame- work for utilization of this cultivated germplasm. Mean- while, core collections along with molecular markers are useful tools for organizing and analyzing representative sets of these genotypes. In this study, we evaluated 604 accessions from the CIAT core germplasm collection repre- senting wide genetic variability from both primary and sec- ondary centers of diversity with a newly developed, Xuorescent microsatellite marker set of 36 genomic and gene-based SSRs to determine molecular diversity and with seed protein analysis to determine phaseolin alleles. The entire collection could be divided into two genepools and Wve predominant races with the division between the Meso- america race and the Durango–Jalisco group showing strong support within the Mesoamerican genepool and the Nueva Granada and Peru races showing less diversity over- all and some between-group admixture within the Andean genepool. The Chile race could not be distinguished within the Andean genepool but there was support for the Guate- mala race within the Mesoamerican genepool and this race was unique in its high level of diversity and distance from other Mesoamerican races. Based on this population struc- ture, signiWcant associations were found between SSR loci and seed size characteristics, some on the same linkage group as the phaseolin locus, which previously had been associated with seed size, or in other regions of the genome. In conclusion, this study has shown that common bean has very signiWcant population structure that can help guide the construction of genetic crosses that maximize diversity as well as serving as a basis for additional association studies. Introduction Common bean (Phaseolus vulgaris) is the third most important grain legume in the world and is the most impor- tant food crop among these, produced over an area of 18 million hectares with large regions of production in Latin America and Eastern and Southern Africa, where the crop is critical to nutritional security and income generation (Broughton et al. 2003). Cultivated common beans origi- nated in two centers of diversity giving rise to two gene- pools: the Mesoamerican genepool from Central America and Mexico and the Andean genepool from the Andes mountains of South America (Singh et al. 1991a). The diVerences between Mesoamerican and Andean gene pools include seed size, plant morphology (Singh et al. 1991b), phaseolin (seed storage protein) patterns (Gepts et al. 1986) and alleles of various types of molecular markers including microsatellites (Blair et al. 2006a, 2007; Díaz and Blair 2006). Cultivated bean gene pools have further been divided into races according to morphological criteria and Communicated by D. Hoisington. Electronic supplementary material The online version of this article (doi:10.1007/s00122-009-1064-8) contains supplementary material, which is available to authorized users. M. W. Blair · L. M. Díaz · H. F. Buendía · M. C. Duque Centro Internacional de Agricultura Tropical (CIAT), Apartado Aéreo 6713, Cali, Colombia, South America M. W. Blair (&) International Center for Tropical Agriculture (CIAT), 1380 N.W. 78th Ave, Miami, FL 33126, USA e-mail: [email protected]
-
Upload
independent -
Category
Documents
-
view
3 -
download
0
Transcript of Genetic diversity, seed size associations and population structure of a core collection of common...
Theor Appl Genet (2009) 119:955–972
DOI 10.1007/s00122-009-1064-8ORIGINAL PAPER
Genetic diversity, seed size associations and population structure of a core collection of common beans (Phaseolus vulgaris L.)
Matthew W. Blair · Lucy M. Díaz · Hector F. Buendía · Myriam C. Duque
Received: 18 October 2008 / Accepted: 11 May 2009 / Published online: 18 August 2009© Springer-Verlag 2009
Abstract Cultivated common bean germplasm is espe-cially diverse due to the parallel domestication of two gene-pools in the Mesoamerican and Andean centers of diversityand introgression between these gene pools. ClassiWcationinto morphological races has helped to provide a frame-work for utilization of this cultivated germplasm. Mean-while, core collections along with molecular markers areuseful tools for organizing and analyzing representativesets of these genotypes. In this study, we evaluated 604accessions from the CIAT core germplasm collection repre-senting wide genetic variability from both primary and sec-ondary centers of diversity with a newly developed,Xuorescent microsatellite marker set of 36 genomic andgene-based SSRs to determine molecular diversity and withseed protein analysis to determine phaseolin alleles. Theentire collection could be divided into two genepools andWve predominant races with the division between the Meso-america race and the Durango–Jalisco group showingstrong support within the Mesoamerican genepool and theNueva Granada and Peru races showing less diversity over-all and some between-group admixture within the Andean
genepool. The Chile race could not be distinguished withinthe Andean genepool but there was support for the Guate-mala race within the Mesoamerican genepool and this racewas unique in its high level of diversity and distance fromother Mesoamerican races. Based on this population struc-ture, signiWcant associations were found between SSR lociand seed size characteristics, some on the same linkagegroup as the phaseolin locus, which previously had beenassociated with seed size, or in other regions of the genome.In conclusion, this study has shown that common bean hasvery signiWcant population structure that can help guide theconstruction of genetic crosses that maximize diversity aswell as serving as a basis for additional association studies.
Introduction
Common bean (Phaseolus vulgaris) is the third mostimportant grain legume in the world and is the most impor-tant food crop among these, produced over an area of 18million hectares with large regions of production in LatinAmerica and Eastern and Southern Africa, where the cropis critical to nutritional security and income generation(Broughton et al. 2003). Cultivated common beans origi-nated in two centers of diversity giving rise to two gene-pools: the Mesoamerican genepool from Central Americaand Mexico and the Andean genepool from the Andesmountains of South America (Singh et al. 1991a). ThediVerences between Mesoamerican and Andean gene poolsinclude seed size, plant morphology (Singh et al. 1991b),phaseolin (seed storage protein) patterns (Gepts et al. 1986)and alleles of various types of molecular markers includingmicrosatellites (Blair et al. 2006a, 2007; Díaz and Blair2006). Cultivated bean gene pools have further beendivided into races according to morphological criteria and
Communicated by D. Hoisington.
Electronic supplementary material The online version of this article (doi:10.1007/s00122-009-1064-8) contains supplementary material, which is available to authorized users.
M. W. Blair · L. M. Díaz · H. F. Buendía · M. C. DuqueCentro Internacional de Agricultura Tropical (CIAT), Apartado Aéreo 6713, Cali, Colombia, South America
M. W. Blair (&)International Center for Tropical Agriculture (CIAT), 1380 N.W. 78th Ave, Miami, FL 33126, USAe-mail: [email protected]
123

956 Theor Appl Genet (2009) 119:955–972
agro-ecological adaptation (Singh et al. 1991a, b) where theterm ‘race’ is used to denote a group of related genotypesand where members of each race have distinctive and spe-ciWc physiological, agronomic, biochemical and molecularcharacteristics and diVer from other races in the allelic fre-quencies at speciWc isozyme or microsatellite loci (Singhet al. 1991c; Blair et al. 2007; Díaz and Blair 2006). Theoriginal six races identiWed by Singh et al. (1991a) wereDurango, Jalisco and Mesoamerica in the Mesoamericangenepool; and Chile, Nueva Granada and Peru in theAndean genepool. The race concept for Mesoamericancommon beans was further reWned by Beebe et al. (2001)who provided molecular evidence for a seventh race,termed Guatemala and by Díaz and Blair (2006) and Blairet al. (2006a) who found the Durango and Jalisco races tobe grouped together rather than as separate races.
Microsatellite markers based on simple sequence repeatloci have been particularly useful in studying populationstructure given their higher polymorphism level compared toother markers and better resolution in diversity studies(Akkaya et al. 1992; Pejic et al. 1998; Cho et al. 2000; Díazand Blair 2006; Blair et al. 2007). Large-scale studies, withmore than 200 genotypes at a time, initially were conductedprincipally in US or European institutions for cereal cropssuch as barley, Hordeum vulgare L. (Malysheva-Otto et al.2006), maize, Zea mays L. (Liu et al. 2003), pearl millet,Pennisetum glaucum (L.) R. Br. (Oumar et al. 2008) and rice,Oryza sativa L. (Garris et al. 2005). More recently, the germ-plasm collections held in the CG centers for internationalagricultural research have been analyzed, mainly as part ofthe Generation challenge program on “Unlocking geneticdiversity” (http://www.generationcp.org) and these large-scale studies are shedding light on population structure of themost important germplasm for the developing world (Thom-son et al. 2007; Warburton et al. 2008). Microsatellite meth-ods based on Xuorescent labeling and automated band callingwith precise, software-based allele detection are consideredthe most accurate way of genotyping with this type of marker(Diwan and Cregan 1997; Blair et al. 2002; McCouch et al.1997). In addition, Xuorescent labeling of microsatellites andorganization of these into various dye color panels hasadvantages in allowing multiplexing during band separation,with advantages for high throughput genotyping and simulta-neous analysis of multiple loci (Reed et al. 1994; Schwengelet al. 1994; Coburn et al. 2002; Tommasini et al. 2003). Mul-tiplexing can also be carried out in the PCR ampliWcationstep with mixtures of the appropriate primers (Hayden et al.2008). Current technology allows for capillary-based separa-tion of microsatellite bands with four color panels of fourindividual markers labeled with diVerent dyes evaluatedthrough a single capillary with a separate size standard, occu-pying a Wfth detection wavelength range, allowing for preciseband size estimates (Coburn et al. 2002).
Association of phenotypic traits with microsatellite alle-les has been found to be practical in several crop species,although SNP markers, sequence haplotypes or highdensity marker sets such as DART or AFLPs are usuallypreferred for association mapping (Flint-Garcia et al. 2005;Rostoks et al. 2006; Stick et al. 2006; Crossa et al. 2007).The number of markers used for association genetics variesalthough there is general agreement that more are requiredin out-crossing species or widely diverse germplasm sam-ples where linkage disequilibrium is low when comparedwith the number of markers required for less diverse germ-plasm sets in inbreeding species where linkage disequilib-rium is high (Buckler and Thornsberry 2002). Estimates oflinkage disequilibrium are usually precursors to actualassociation analysis, which requires phenotypic trait evalu-ation in addition to a large genotypic data set. However, theusual process of constituting a germplasm panel for geno-typing that is later phenotyped is ineYcient. An alternativestrategy is to genotype previously phenotyped collectionssuch as those held in germplasm banks or assembled intocore collections (Brown 1989). In any case, the phenotypictraits evaluated should be of high heritability to Wnd associ-ations that are not inXuenced by environmental variability(Flint-Garcia et al. 2005).
In common bean, the evaluation of microsatellite markerdiversity has been useful for analysis of race structure asdescribed in Blair et al. (2006a, 2007) and Díaz and Blair(2006); however, in these cases gel-based assays were usedand this limited the number of genotypes that could be eval-uated. Therefore, there has been a need for the analysis oflarger and more comprehensive sets of germplasm such ascore collections. In the case of common beans, two corecollections exist one for 1,441 individuals at CIAT that hasbeen extensively phenotyped (Beebe et al. 1997; Islamet al. 2002, 2004) and another prepared by the USDA,which has been partially phenotyped (Miklas et al. 1999).Correspondingly, there has been the need for the develop-ment of a high-throughput method for microsatellite diver-sity assessments using Xuorescently labeled markers incommon bean. To date, only a single study has been con-ducted with this type of marker in this crop species, evalu-ating only a limited number of genotypes with a small set ofcDNA-based microsatellites (Masi et al. 2003). Meanwhile,no attempts have been made to perform association studieswith microsatellites, although one study did attempt toassociate speciWc RAPD markers with various traits in partof the CIAT core collection (Islam et al. 2004).
In this study, our overall goal was to determine popula-tion structure in a large-scale international collection ofcommon bean accessions from the CIAT core collectionusing Xuorescent microsatellites and conduct associationanalysis with seed phenotypic characteristics. Our speciWcobjectives were (1) to assess genetic diversity in a group of
123
Theor Appl Genet (2009) 119:955–972 957
604 genotypes from the CIAT germplasm and core collec-tions with microsatellite markers and phaseolin evaluation;(2) to test a set of Xuorescent microsatellite markers forcapillary-based genotyping based on previous polymor-phism evaluation of a large set of cDNA (gene-based orcoding) microsatellites and genomic (non-coding) micro-satellites, (3) to determine if race structure was well deWnedin this core collection when compared with our previousstudies and if diversity was similar in primary and second-ary centers of diversity and (4) to conduct a test for associa-tion of seed size, length, width and height with the markersevaluated, comparing associations with phaseolin and withindividual microsatellite loci in each subpopulation.
Materials and methods
Plant material
A total of 604 genotypes were evaluated in this study,including totals of 304 Mesoamerican genepool acces-sions and 300 Andean genepool accessions, all selectedfrom the CIAT germplasm collection. Of these, all theAndean genotypes were from the core collection while theMesoamerican genotypes included 23 genotypes fromthe general collection that had been previously evaluatedby Díaz and Blair (2006). The majority of the accessionswere from the primary center of diversity especially thecountries of Mexico (179 genotypes) and Peru (180 geno-types), while the remainder were from Argentina (10),Brazil (26), Bolivia (11), Chile (8), Colombia (32), CostaRica (16), Cuba (2), Dominican Republic (2), Ecuador(36), El Salvador (6), Germany (2), Guatemala (60), Haiti(9), Honduras (9), Nicaragua (6) and the United States(3). One accession each was from Australia, Burundi,France, Jamaica, Malawi, Rwanda and Uganda. Theaccessions had the following phaseolin alleles: S, Sb, Sd,B and M for the Mesoamerican genotypes; T, C, H and Afor the Andean genotypes. Control genotypes included theAndean genotypes, Calima/G4494 and Chaucha Chuga/G19833, as well as the Mesoamerican genotypes, ICAPijao/G5773 and Dorado/DOR364 (with common nameand germplasm entry or advanced line name listed in eachcase). Seed samples for the core collection are maintainedby the bean project at CIAT and were originally from theGenetic Resource Unit (http://isa.ciat.cgiar.org/urg/main.do). Selection from the CIAT core collection wasbased on the random sampling of genotypes evaluated byBeebe et al. (2000, 2001) while the core collection itselfwas carefully chosen to represent the broadest possiblediversity including modern varieties, landraces and a fewbreeding lines which represent all agro-ecological zoneswhere the crop is grown (Tohme et al. 1995; Beebe et al.
1997). Of the 1,441 genotypes in the core collection, 41%were evaluated in our study.
DNA extraction and phaseolin evaluation
DNA extraction involved germinating 10 seeds selected atrandom from each accession. The seed was scariWed toensure uniform germination in the laboratory and pre-ger-minated in darkness on germination paper. The Wrst trifoli-ate leaves of 8-day old seedlings were collected and groundin liquid nitrogen for DNA extraction with the method ofAfanador et al. (1993). DNA was re-suspended in TE buVerand DNA quality was evaluated on 0.8% agarose gelsfollowed by quantiWcation with Hoescht H 33258 dye on aHoefer DyNA Xuorometer (DNA Quant™ 200). DNA wasdiluted to 10 ng/ml for further experiments. Common beanis a predominantly self-pollinating species and the geno-types in the core collection are maintained as single seedtypes; therefore, this project did not expect to Wnd highlevels of observable heterozygosity. Phaseolin evaluationswere as performed by Durán et al. (2005) with a methoddeveloped by the Genetic Resource Unit of CIAT for totalseed protein.
Fluorescent microsatellite analysis
Microsatellite ampliWcation used a Xuorescent marker kitthat we developed as part of this project and includedmicrosatellites selected from those of Yu et al. (2000),Gaitán et al. (2002) and Blair et al. (2003). The selection ofmarkers was based on the evaluation of 150 microsatellitespreviously tested for polymorphism and PCR conditions(Blair et al. 2006a, b). The kit included a total of nine-four-color marker panels for the analysis of a total of 36individual microsatellite markers. These microsatelliteswere distributed across the genome and covered 9 of the 11chromosomes of common bean genome according to mappositions from Blair et al. (2003). One of the markers,BM188 detected two loci in separate size ranges. To sam-ple both fast-evolving genomic sequences and slowerevolving gene sequences, microsatellites were selected thathad been designed and tested from non-gene coding as wellas gene coding regions of the genome, termed genomic andgene-based microsatellites, respectively. The 20 genomicmarkers included AG, BM or GATS series markers devel-oped by Gaitán et al. (2002) plus BMd56 from Blair et al.(2003). The 16 gene-based microsatellites used weremostly BMd series markers from Blair et al. (2003) or PVseries markers from Yu et al. (2000). Forward primers foreach of the microsatellites were 5�-end labeled with6-FAM, NED, PET or TET Xuorescent labels as indicatedin the supplementary table and used with unlabeled reverseprimers in PCR ampliWcation. AmpliWcation conditions
123
958 Theor Appl Genet (2009) 119:955–972
were as recommended in Blair et al. (2006a) using a stan-dard thermocycle of 95°C hot start for 3 min, followed by28 cycles of 95°C denaturation for 40 s, 55°C annealing for40 s and 72°C extension for 1 min. A 1-h extension at 72°Cwas used post-thermocycling. PCR reactions included1£ PCR buVer (10 mM of Tris–HCl pH 8.8, 50 mM ofKCl, 0.1% of TritonX-100), 1.5 mM MgCl2, 0.2 mMdNTPs, 0.3 nM of each primer and 1 U of Taq polymerase(Promega). A total of 2 �l from each of the Xuorescent PCRproducts corresponding to the appropriate markers weremixed into multiplex panels as listed. This mixture wasdiluted 1:1 with dH2O and 0.5 �l of the solution was thenprepared in 9 �l of formamide with 0.06 �l of GenescanLIZ500 size standard and 0.44 �l of dH2O, which was thenrun on an ABI PRISM 3730 fragment analysis system(Applied Biosystems) at the Cornell University Biotechnol-ogy Resource Center.
Data analysis
Allele sizes (in base pairs) were estimated by comparingthe fragment peaks with the internal size standard calcu-lated with GeneMapper v. 3.7 software using the defaultmethod for band calling with microsatellites (cut-oV value,plus A ratio/distance, stutter ratio/distance, signal level,heterozygote balance, peak morphology and pull up/crosstalk peaks), the second order least squares size callingmethod and the expected repeat size. Electropherogramswere also reviewed visually in Genemapper software toensure that clear peaks were found for the expected markersizes, that stutter peaks were not called and to assess that aproper selection of multiplex markers had been made.
Raw allele size calls were then binned to assign a wholeinteger allele value using the software program AlleloBin(http://www.icrisat.org/gt-bt/biometrics.htm) based on aleast-square minimization algorithm of Idury and Cardon(1997), which transforms fragment sizes based on migra-tion into a binned values with sizes in base pairs. Binnedallele information was databased at http://gcpcr.grinfo.net/index.php and used for a principal coordinate analysis(PCoA) with the goal of determining sub-populations. Thiswas based on the proportion of shared alleles estimatedwith the IML module of the software program StatisticalAnalysis Systems v. 9.1.3 (SAS Institute 1996) and on theformula PS = �PSi/n, where i each locus, n total number ofloci and PSi proportion of shared alleles at locus i. Power-Marker v. 3.25 (Liu and Muse 2005) was then used to eval-uate allele frequency, number of alleles, percentage ofpolymorphic alleles, expected heterozygosity (He/Nei 87),observed heterozygosity (Ho) and polymorphism informa-tion content (PIC). Relationships between sub-populationswere graphed in three dimensions using software programNTSYSpc 2.1 (Rohlf 2002).
In addition, Wright statistics and molecular analysis ofvariance (AMOVA) were determined with Arlequin v. 3.11(ExcoYer 2007) and clusters were analyzed for phyloge-netic relationships with PowerMarker using Nei‘s (1973)coeYcient. A consensus tree was drawn based on 1,000bootstraps with the subprogram CONSENSE in Phylip(Felsenstein 1993). Finally, the number of populations (K)was evaluated with both STRUCTURE (Pritchard et al.2000), which determines a Q matrix of population related-ness and with the similar program InStruct (Gao et al.2007), which is thought to provide a better estimate of pop-ulation number in an inbreeding species such as commonbean. Population structure was determined assuming anadmixture model with K = 2 to K = 15 for the Wrst of theseprograms, which was run locally and from K = 2 to K = 10for the second program, which was run remotely at http://cbsuapps.tc.cornell.edu/InStruct.aspx. A correlation modelfor allele frequency and 100,000 burn-ins with 200,000iterations was used for InStruct. The results of both pro-grams were visualized with the software DISTRUCT(Rosenberg 2002.
Phenotypic data and association analysis
The following seed characteristics were measured on tenseeds of each genotype with a caliper with millimeter (mm)adjustment: seed length from end to end, and seed widthand height from side to side at the hilum when the seed laysXat on a horizontal surface. In addition the one-hundredseed weight (100 SW) was measured in grams with an ana-lytical balance. Seed color had already been scored on allaccessions according to a CIAT developed scale based oncommercial class color classiWcations (CIAT 1987) andphotographs of the genotypes are available at http://isa.ciat.cgiar.org/urg/main.do. Phenotypic data was used ina structured association analysis with a mixed linear model,taking into account population substructure and races asdetermined by this study, with the software program Tasselv. 2.0 (http://www.maizegenetics.net/; Buckler et al. 2007).SigniWcance of probability (P) values for association testswere determined with 10,000 permutations using the samesoftware program.
Results
Allele number and genetic diversity
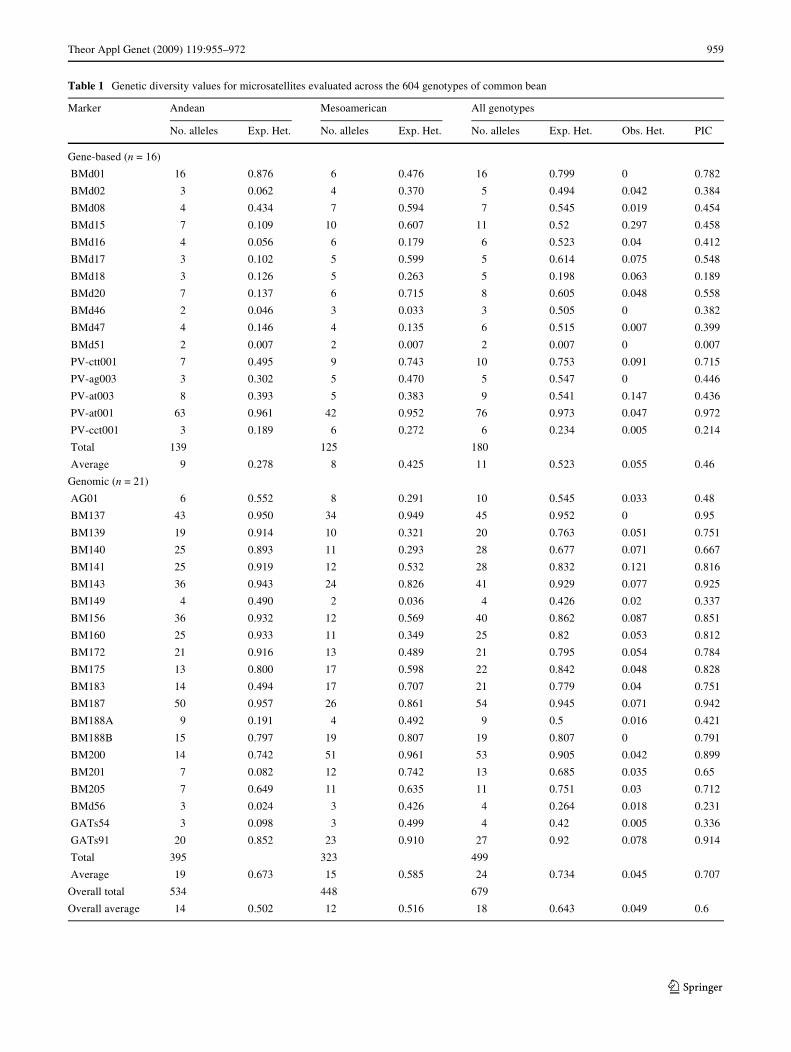
The total number of alleles identiWed in the entire study was679 with an average of 18.4 alleles per locus with all the mark-ers analyzed being polymorphic having from 2 to 76 alleleseach (Table 1). The marker PV-at001 (conWrmed throughre-evaluation and visual inspection of electropherograms)
123
Theor Appl Genet (2009) 119:955–972 959
Table 1 Genetic diversity values for microsatellites evaluated across the 604 genotypes of common bean
Marker Andean Mesoamerican All genotypes
No. alleles Exp. Het. No. alleles Exp. Het. No. alleles Exp. Het. Obs. Het. PIC
Gene-based (n = 16)
BMd01 16 0.876 6 0.476 16 0.799 0 0.782
BMd02 3 0.062 4 0.370 5 0.494 0.042 0.384
BMd08 4 0.434 7 0.594 7 0.545 0.019 0.454
BMd15 7 0.109 10 0.607 11 0.52 0.297 0.458
BMd16 4 0.056 6 0.179 6 0.523 0.04 0.412
BMd17 3 0.102 5 0.599 5 0.614 0.075 0.548
BMd18 3 0.126 5 0.263 5 0.198 0.063 0.189
BMd20 7 0.137 6 0.715 8 0.605 0.048 0.558
BMd46 2 0.046 3 0.033 3 0.505 0 0.382
BMd47 4 0.146 4 0.135 6 0.515 0.007 0.399
BMd51 2 0.007 2 0.007 2 0.007 0 0.007
PV-ctt001 7 0.495 9 0.743 10 0.753 0.091 0.715
PV-ag003 3 0.302 5 0.470 5 0.547 0 0.446
PV-at003 8 0.393 5 0.383 9 0.541 0.147 0.436
PV-at001 63 0.961 42 0.952 76 0.973 0.047 0.972
PV-cct001 3 0.189 6 0.272 6 0.234 0.005 0.214
Total 139 125 180
Average 9 0.278 8 0.425 11 0.523 0.055 0.46
Genomic (n = 21)
AG01 6 0.552 8 0.291 10 0.545 0.033 0.48
BM137 43 0.950 34 0.949 45 0.952 0 0.95
BM139 19 0.914 10 0.321 20 0.763 0.051 0.751
BM140 25 0.893 11 0.293 28 0.677 0.071 0.667
BM141 25 0.919 12 0.532 28 0.832 0.121 0.816
BM143 36 0.943 24 0.826 41 0.929 0.077 0.925
BM149 4 0.490 2 0.036 4 0.426 0.02 0.337
BM156 36 0.932 12 0.569 40 0.862 0.087 0.851
BM160 25 0.933 11 0.349 25 0.82 0.053 0.812
BM172 21 0.916 13 0.489 21 0.795 0.054 0.784
BM175 13 0.800 17 0.598 22 0.842 0.048 0.828
BM183 14 0.494 17 0.707 21 0.779 0.04 0.751
BM187 50 0.957 26 0.861 54 0.945 0.071 0.942
BM188A 9 0.191 4 0.492 9 0.5 0.016 0.421
BM188B 15 0.797 19 0.807 19 0.807 0 0.791
BM200 14 0.742 51 0.961 53 0.905 0.042 0.899
BM201 7 0.082 12 0.742 13 0.685 0.035 0.65
BM205 7 0.649 11 0.635 11 0.751 0.03 0.712
BMd56 3 0.024 3 0.426 4 0.264 0.018 0.231
GATs54 3 0.098 3 0.499 4 0.42 0.005 0.336
GATs91 20 0.852 23 0.910 27 0.92 0.078 0.914
Total 395 323 499
Average 19 0.673 15 0.585 24 0.734 0.045 0.707
Overall total 534 448 679
Overall average 14 0.502 12 0.516 18 0.643 0.049 0.6
123

960 Theor Appl Genet (2009) 119:955–972
showed the highest number of alleles while the next highestallele numbers were found for BM187 and BM200 with 54and 53 alleles, respectively. Meanwhile, the next mostpolymorphic markers were BM137, BM143 and GATs91,and all of the above were genomic microsatellites. In con-trast, the gene-based microsatellites were correspondinglyless polymorphic, especially BMd51 (bi-allelic), BMd46(tri-allelic) and BMd02, BMd17, BMd18 and PV-ag003(each with 5 alleles). Among the least polymorphic geno-mic markers were GATs54 (bi-allelic), BM149 (tri-allelic)and BMd56 (4 alleles), followed by BM188A (9 alleles),AG01 (10 alleles) and BM205 (11 alleles). A total of 12markers produced under ten alleles in the case of thegene-based markers while only 4 did so in the case of thegenomic markers. Correspondingly, the average number ofalleles per marker was higher for the genomic microsatel-lites (23.8) when compared with the gene-based microsatel-lites (11.3). It was notable that 12 microsatellites producedover 20 alleles each in the case of the genomic microsatel-lites while in the case of the gene-based microsatellites onlyone did. All the markers detected single loci except for onemarker (BM188), which detected two loci distinguished bythe pattern of stutter band ampliWcation and size range withBM188A having alleles between 130 and 153 bp andBM188B having alleles between 160 and 200 bp. Geneticmapping has conWrmed that the two loci are independentand on separate linkage groups (CIAT, unpublishedresults).
Individual markers detected from 0.264 to 0.952expected heterozygosity for genomic microsatellites and0.007 to 0.973 for gene-based microsatellites. Observedheterozygosity was low, ranging from 0.000 to 0.297 andaveraging 0.049 across all markers (0.055 for gene basedand 0.045 for genomic markers). The markers with moreobserved heterozygosity were BMd15, PV-at003 (gene-based) and BM141 and BM156 (genomic) and observedheterozygosity could be explained by out-crossing andheterozygous individuals, by residual heterozygosity inbreeding lines or by heterogeneity in the genebank acces-sion, although most accessions were selected to be of asingle seed type.
PCoA and race structure
The PCoA for the core collection genotypes is shown inFig. 1 based on genetic similarity values from the propor-tion of shared alleles. The three-dimensional graphicalrepresentation allows the evaluation of population structureand geometric distances between all the genotypes in thestudy. The most evident subdivision was that of the twomajor gene pools of common bean, the Andean and theMesoamerican, which are clearly distinguished as two sep-arate clusters (Fig. 1a). Within each genepool, various
subgroups were found, some of them corresponding to mor-phological races as described by Singh et al. (1991a). Fiveof the subgroups corresponded to divisions within theMesoamerican genepool while four of the subgroups werefound in the Andean genepool. The PCoA explained 85.7%of the variability for the germplasm set, with separation ofthe genepools in the Wrst axis (64.3% of variabilityexplained), separation of Mesoamerican races in the secondaxis (11.6%) and separation of the Andean races in both thethird axis (8.3%) as well as the second axis. One advantageof the PCoA was that the relationships between each of thegenotypes could be evaluated and this helps to visualizepossible introgression between subgroups, races or gene-pools. The subgroups within each genepool and their rela-tionship to morphological races are discussed separatelybelow.
Subgroups or clusters from the 3D graph within theMesoamerican genepool (Fig. 1b) represented the Meso-america race (subgroups M1 and M2), the Durango–Jaliscocomplex (subgroups D–J1 and D–J2) and a third group rep-resenting the Guatemala race (subgroup G). These resultsagree with those of Díaz and Blair (2006) where theDurango and Jalisco races are not substantially distinctfrom each other but do cluster together separately from theMesoamerica race. As in this previous study, the Meso-america race was made up of small-seeded genotypes oftype II, III and IV growth habits, while the Durango–Jaliscocomplex was made up of medium-seeded genotypes mostlywith type III or IV growth habits (Table 2). Similar phaseo-lin alleles were found distributed among both races (S, Sb,Sd and B) and it was notable that while members of theMesoamerica race were from many countries in the primaryand secondary centers of diversity, the Durango–Jaliscogenotypes were predominantly from Mexico with a fewadditional genotypes from Guatemala.
Within race Mesoamerica, the subgroups M1 and M2were closely related. Subgroup M1 was a compact grouppredominantly of small-seeded, black beans and somecream and red beans mostly from Central America (CostaRica, Guatemala, Honduras, Nicaragua, El Salvador) butalso Mexico and Brazil. Growth habits ranged from type IIto a few type IV and the representative genotypes in thissubrace were Rio Tibagi, Mulatillo and the control geno-types DOR364 and ICA Pijao. Subgroup M2 was similar toM1 in geographic origin and in having small seed size butmost of its genotypes had type III growth habit and agreater proportion were red seeded when compared withM1. One genotype in this group had a wild form of phaseo-lin (M) while all others within race Mesoamerica were cul-tivated forms (S, Sd and Sb).
The two groups identiWed within the Durango–Jaliscocomplex were similar in being predominantly type III or IVgrowth habit, although D–J2 had slightly more type III
123

Theor Appl Genet (2009) 119:955–972 961
genotypes than D–J1, which had more type II genotypes.The largest diVerence between the two groups was in seedsize with D–J1 having more medium and large-seededgenotypes than D–J2. Seed colors were similar in both sub-groups with a predominance of lighter shades (creams andyellows) in D–J1. As expected, the majority of the geno-types in both groups were from Mexico, however, in thecase of D–J2 some were found outside of Mexico and in thecase of D–J1, one genotype was from Africa. In addition to
S type phaseolins, both subgroups contained wild typephaseolins M, M1 and M15.
The Wnal subgroup within the Mesoamerican genepoolconsisted of 61 genotypes representing race Guatemala thatwere predominantly type IV climbing or type III semi-climbing beans and mostly from Guatemala or the Mexicanstate of Chiapas, which are the two places where the racewas predicted to originate according to Beebe et al. (2000).It was notable that while members of the Mesoamerica race
Fig. 1 Three-dimensional principal coordinate analysis based on theanalysis of: a 604 genotypes of common bean from the core germplasmcollection explaining 83.89% of the variation and showing the positionof control genotypes for each genepool, b Andean genepool genotypesdivided into subgroups NG1 and NG2 (race Nueva Granada) and sub-
groups P1 and P2 (race Peru) and c Mesoamerican genepool genotypesdivided into subgroups D–J1 and D and N-J2 (Durango–Jalisco com-plex), subgroup G (race Guatemala) and subgroups M1a, M1b and M2(race Mesoamerica)
CAndeanGenepool
P1
NG1
NG2
P2
BMesoamericanGenepool
G
D-J2
M1a
M2
D-J1
M1b
AndeanControl
Meso Control
A
123
962 Theor Appl Genet (2009) 119:955–972
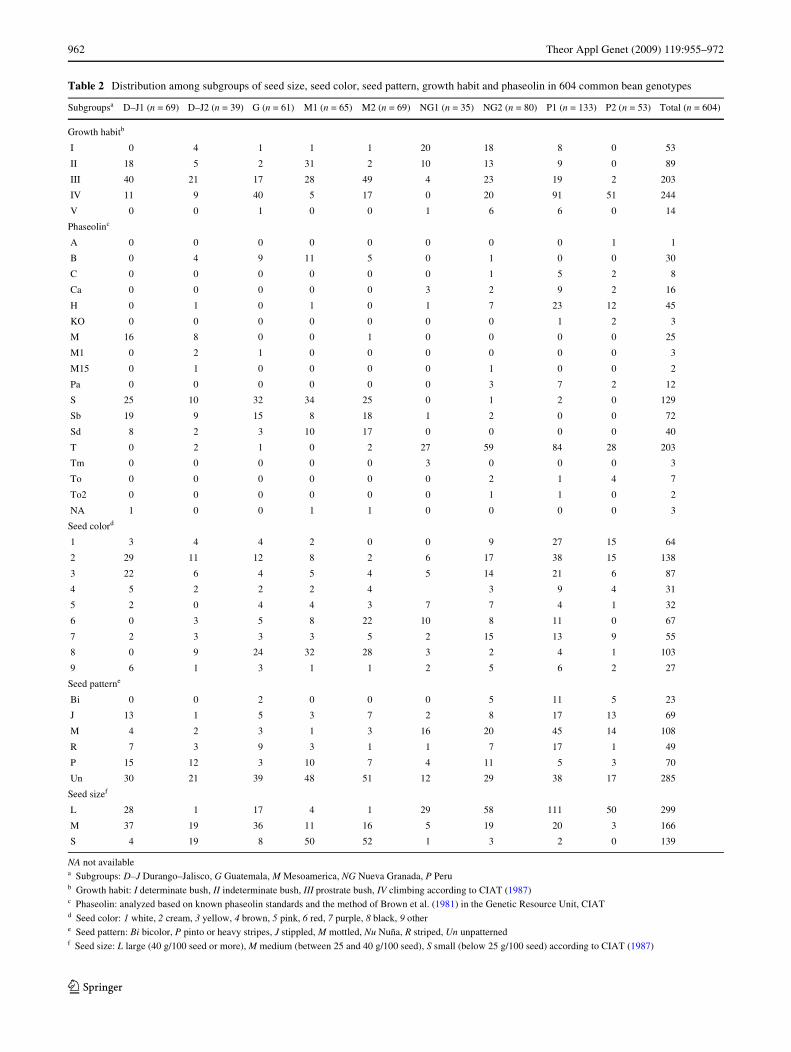
Table 2 Distribution among subgroups of seed size, seed color, seed pattern, growth habit and phaseolin in 604 common bean genotypes
NA not availablea Subgroups: D–J Durango–Jalisco, G Guatemala, M Mesoamerica, NG Nueva Granada, P Perub Growth habit: I determinate bush, II indeterminate bush, III prostrate bush, IV climbing according to CIAT (1987)c Phaseolin: analyzed based on known phaseolin standards and the method of Brown et al. (1981) in the Genetic Resource Unit, CIATd Seed color: 1 white, 2 cream, 3 yellow, 4 brown, 5 pink, 6 red, 7 purple, 8 black, 9 othere Seed pattern: Bi bicolor, P pinto or heavy stripes, J stippled, M mottled, Nu Nuña, R striped, Un unpatternedf Seed size: L large (40 g/100 seed or more), M medium (between 25 and 40 g/100 seed), S small (below 25 g/100 seed) according to CIAT (1987)
Subgroupsa D–J1 (n = 69) D–J2 (n = 39) G (n = 61) M1 (n = 65) M2 (n = 69) NG1 (n = 35) NG2 (n = 80) P1 (n = 133) P2 (n = 53) Total (n = 604)
Growth habitb
I 0 4 1 1 1 20 18 8 0 53
II 18 5 2 31 2 10 13 9 0 89
III 40 21 17 28 49 4 23 19 2 203
IV 11 9 40 5 17 0 20 91 51 244
V 0 0 1 0 0 1 6 6 0 14
Phaseolinc
A 0 0 0 0 0 0 0 0 1 1
B 0 4 9 11 5 0 1 0 0 30
C 0 0 0 0 0 0 1 5 2 8
Ca 0 0 0 0 0 3 2 9 2 16
H 0 1 0 1 0 1 7 23 12 45
KO 0 0 0 0 0 0 0 1 2 3
M 16 8 0 0 1 0 0 0 0 25
M1 0 2 1 0 0 0 0 0 0 3
M15 0 1 0 0 0 0 1 0 0 2
Pa 0 0 0 0 0 0 3 7 2 12
S 25 10 32 34 25 0 1 2 0 129
Sb 19 9 15 8 18 1 2 0 0 72
Sd 8 2 3 10 17 0 0 0 0 40
T 0 2 1 0 2 27 59 84 28 203
Tm 0 0 0 0 0 3 0 0 0 3
To 0 0 0 0 0 0 2 1 4 7
To2 0 0 0 0 0 0 1 1 0 2
NA 1 0 0 1 1 0 0 0 0 3
Seed colord
1 3 4 4 2 0 0 9 27 15 64
2 29 11 12 8 2 6 17 38 15 138
3 22 6 4 5 4 5 14 21 6 87
4 5 2 2 2 4 3 9 4 31
5 2 0 4 4 3 7 7 4 1 32
6 0 3 5 8 22 10 8 11 0 67
7 2 3 3 3 5 2 15 13 9 55
8 0 9 24 32 28 3 2 4 1 103
9 6 1 3 1 1 2 5 6 2 27
Seed patterne
Bi 0 0 2 0 0 0 5 11 5 23
J 13 1 5 3 7 2 8 17 13 69
M 4 2 3 1 3 16 20 45 14 108
R 7 3 9 3 1 1 7 17 1 49
P 15 12 3 10 7 4 11 5 3 70
Un 30 21 39 48 51 12 29 38 17 285
Seed sizef
L 28 1 17 4 1 29 58 111 50 299
M 37 19 36 11 16 5 19 20 3 166
S 4 19 8 50 52 1 3 2 0 139
123

Theor Appl Genet (2009) 119:955–972 963
were from many countries in the primary and secondarycenters of diversity and the Durango–Jalisco genotypeswere predominantly from central Mexico, the Guatemalarace genotypes were predominantly from this speciWcregion. Seed types for this cluster were variable with mostbeing medium-sized seed with black or cream seed colors.Phaseolin types included S, Sb and Wnally B, which is anallele that is associated with northern South Americangenotypes.
The Andean genepool showed four subgroups in theprincipal correspondence analysis corresponding to twosubgroups in race Nueva Granada (NG1 and NG2) and twosubgroups in race Peru (P1 and P2). The races and sub-groups were distinguished by the third axis of the PCoA(Fig. 1c) with NG2 and P1 intermediate between NG1 andP2 with these two subgroups at the extremes of the distribu-tion of Andean beans and representing the most uniquegenotypes of each race. In addition, for NG1, NG2 and P1 acertain amount of between-genepool introgression was evi-dent with genotypes that were intermediate between theseAndean subgroups and the Mesoamerican genepool.Among the Nueva Granada subgroups, both clusters hadmedium to large-seeded genotypes of diverse color classes,however, NG1 was predominantly red or pink and mottled,while in the NG2 group cream mottled, yellow and largered or purple beans were more common. The NG1 sub-group was mostly bush beans with the majority havingdeterminate type I growth habit and smaller numbers oftype II or type III beans with few type IV climbing beans.The NG2 subgroup meanwhile had more type III and IVgrowth habit climbing or semi-climbing beans. In terms ofgeographic origin, subgroup NG1 individuals were from arange of countries from the primary center of diversity(Argentina, Colombia, Ecuador and Peru) and from second-ary centers of diversity (Brazil, Mexico and the Caribbeancountries of Dominican Republic and Haiti); while sub-group NG2 individuals were mostly from the Andeanregion.
Meanwhile, among the race Peru subgroups, P1 con-tained a mix of climbing beans and bush beans of type I, IIand III growth habit that were from Colombia, Ecuador andPeru including the Andean control genotype ChauchaChuga (G19833), while P2 was almost exclusively made upof climbing beans from Peru alone. Seed size and color inrace Peru was variable with more white, cream and yellowbeans in this race when compared with Nueva Granada.The race also included all of the popping beans from ourstudy (a.k.a ñuñas as they are referred to in the Andes),most of which were clustered with subgroup P2. Inter-gene-pool introgression was higher for the NG2 subgroup as evi-denced by more Mesoamerican phaseolin alleles thanamong the NG1 or the Peru race individuals. Genotypesshowing introgression between the genepools tended to
have smaller seed than the other Andean genotypes and inthe PCoA were located between the major genepool clus-ters. Given our interest in classifying the genotypes intoraces and subgroups we did not analyze the genotypesshowing introgression separately.
Population structure and analyses of molecular variance
Population structure analysis using InStruct (Gao et al.2007) conWrmed the basic divisions found in the PCoA.Figure 2 shows subWgures for various K values up to thenumber of populations detected in PCoA since each levelof subdivision was instructive. For example, K = 2showed the basic division between Andean and Meso-american genepool with some Andean admixture in all theMesoamerican subgroups and some Mesoamericanadmixture in all the Andean subgroups except for P2.K = 3 showed an additional division within the Meso-american genepool for the Durango–Jalisco group and theMesoamerica race but with admixture occurring in sub-group D–J2. K = 4 showed the separation of NuevaGranada and Peru race genotypes but with admixture inthe NG2 and P1 subgroups. At K = 5, race Guatemalaappears as a separate subpopulation but with substantialadmixture from race Mesoamerica and the Durango–Jaliscocomplex; while subgroup D–J2 has admixture from raceG and race M. The evaluation at K = 9 showed some sepa-ration of subgroups although admixture was prevalentbetween subgroups within each individual race especiallywithin the Andean genepool. It was notable that subgroupNG2 separated from NG1 but was associated with the Wrstpart of subgroup P1.
AMOVAs were conducted to determine the variationexplained by genepools, races and subgroups as well as tocompare variability in the primary versus secondary cen-ters of diversity. Table 3 shows that more variabilitycould be assigned to genepools and races when comparedwith subgroups but that substantial variability remainedwithin each subpopulation. The comparison betweenraces within genepools were signiWcant in all cases (datanot shown), however, more variability was explained bythe contrast of races Guatemala, Mesoamerica and theDurango–Jalisco complex (17.2%) than by the contrast ofraces Nueva Granada and Peru (8.9%). In addition, thecomparison between the primary and secondary centers ofdiversity was also signiWcant (P < 0.001) but onlyexplained 6.6% of variability (equivalent to FST of 0.066)with 87.6% of variability remaining among individualswithin the primary and secondary centers and 5.7% withinindividuals. As expected for an inbreeding species such ascommon bean, the subpopulations showed a deWcit in het-erozygotes and were therefore in Hardy–Weinberg dis-equilibrium. The within population Wxation indices (FIS)
123

964 Theor Appl Genet (2009) 119:955–972
were 0.915 to 0.939 across subpopulations but werehigher in the Andean genepool (0.946) than in the Meso-american genepool (0.839).
Genetic diVerentiation and diversity parameters for subgroups
Genetic diVerentiation (FST) values between subgroupswithin genepools were generally low ranging from 0.028 to0.241 among the Andean subgroup comparisons and from0.044 to 0.268 among the Mesoamerican subgroup compar-isons (Table 4). Meanwhile, genetic diVerentiation washigh when comparing subgroups between genepools. Thelower genetic diVerentiation between the Guatemala raceand D–J2 may indicate shared ancestry for these twogroups; however, this subgroup also was closely related tothe two Mesoamerica race subgroups. In the Andean gene-pool, subgroup NG2 was closely related to both Peru racesubgroups. The software program PowerMarker was usedto carry out a phylogenetic analysis with the neighbor-join-ing tree represented as part of Table 4 and showing place-ment of the Guatemala race relative to the other
Mesoamerican and Andean races. In this dendogram, raceGuatemala is very distinct while the subgroups within eachrace cluster together (e.g. M1 with M2, NG1 with NG2 andP1 with P2).
Genetic diversity parameters for the subgroups foundwithin the principal correspondence analysis are shown inTable 5. The gene diversity values (He) were slightlyhigher for the Mesoamerican genepool subgroups com-pared to the Andean genepool subgroups; while within theAndean subgroups, NG2 and P1 were the most diverse andwithin the Mesoamerican group, subgroups D–J2 and raceG were the most diverse. Diversity values were not corre-lated with the number of genotypes in the subgroup withD–J2 having fewer genotypes but the highest diversityvalues. Observed heterozygosity within the subgroups aver-aged 0.049 being very low for M1, M2, NG1, NG2, P1 andP2 (all below 0.050) and slightly higher for race D–J1(0.058), D–J2 (0.0102) and race G (0.096), which mayresult from the climbing beans prevalent in these last threesubgroups as climbing beans often have higher out-crossingrates (this laboratory, unpublished data). Upon comparingthe allele number and expected heterozygosity values for
Fig. 2 Structure analysis with K = 2 to K = 5 and at K = 9 populationsfor the core collection of common bean showing the sub-divisionswithin each race. Sub-group abbreviations are D–J1 and D–J2(Durango–Jalisco complex), G (race Guatemala) and M1 and M2 (race
Mesoamerica) within the Mesoamerican genepool; and subgroupsNG1 and NG2 (race Nueva Granada), and P1 and P2 (race Peru) withinthe Andean genepool
123

Theor Appl Genet (2009) 119:955–972 965
each microsatellite in each subgroup and genepool, wefound that genomic microsatellites tended to be more vari-able in Andean subgroups while gene-based microsatelliteswere more variable in Mesoamerican subgroups, althoughthis was partly related to the number of genotypes in eachsubgroup. For example, the subgroup NG1 was low innumber of genotypes and in allele number. Among thegenomic microsatellites, some markers were more powerfulthan others in deWned subgroups (e.g. BM141, BM156 andBM187 for Andean beans and BM175 and BM200 forMesoamerican beans) while other markers functioned
equally across all subgroups and both genepools (e.g.BM137 and BM143). The same can be said for speciWcgene-based markers, so for example BMd01 was more use-ful in the Andean genepool than in the Mesoamerican gene-pool and PV-at001 was more useful across all subgroups.Another interesting observation was that phaseolin wasapproximately as diverse in number of alleles/patterns asthe average for all of the microsatellites considering bothgenomic and gene-based markers for each of the subgroups,the one exception being higher average number of phaseo-lin alleles than microsatellite alleles in the D–J2 group.
Table 3 Molecular analyses of variance (AMOVA) for the comparison of primary versus secondary centers of diversity and for separation ofgenepools, races and subgroups
a Based on country identiWcation and regions in which the wild common bean exists and domestication could have occurred constituting primarycenters, while the regions of introduction in the post-Columbian age, such as Africa, Asia or Europe are secondary centers (Islam et al. 2002)b Mesoamerican genepool included races Guatemala, Mesoamerica and Durango–Jalisco; while Andean genepool included races Nueva Granadaand Peru. Subgroups were identiWed as described in the text
Source of variation df Sum of squares
Components of variance
Percentage variation
P value
Primary versus secondary centersa
Among centers 1 84.9 0.39765 6.64 <0.001
Among individuals within centers 602 6,423.2 5.16684 87.56 <0.001
Genepoolsb
Among genepools 1 1,522.069 2.5063 36.77 <0.001
Among individuals within genepools 602 4,986.069 3.9732 58.3 <0.001
Racesb
Among races 4 1,865.356 1.9530 32.57 <0.001
Among individuals within races 599 4,642.782 3.7074 61.83 <0.001
Subgroupsb
Among subgroups 8 2,018.9 1.86179 32.09 <0.001
Among individuals within subgroups 595 4,489.2 3.60437 62.12 <0.001
Within individuals 604 203.0 0.33609 5.79 <0.001
Total 1,207 6,711.1 5.80225
Table 4 Genetic diVerentiation based on FST values and phylogenetic analysis for subgroups identiWed among 604 genotypes of common bean
Phylogenetic analysis represented by Neighbor-joining with Nei73 coeYcient and subgroup abbreviations: D–J Durango–Jalisco, G Guatemala,M Mesoamerica, NG Nueva Granada, P Peru
D–J1 D–J2 G M1 M2 NG1 NG2 P1 P2
D–J1 –
D–J2 0.133 –
G 0.138 0.044 –
M1 0.238 0.077 0.17 –
M2 0.268 0.079 0.167 0.037 –
NG1 0.563 0.474 0.453 0.536 0.514 –
NG2 0.469 0.381 0.365 0.447 0.429 0.063 –
P1 0.44 0.364 0.349 0.424 0.412 0.129 0.028 –
P2 0.446 0.364 0.345 0.432 0.433 0.241 0.118 0.058 –
GNG2
NG1
P2
P1
D1
D2
M2
M1
123

966 Theor Appl Genet (2009) 119:955–972
Expected heterozygosity was also higher for the phaseolinlocus than for the average of the microsatellite loci in eachsubgroup.
Association of seed phenotypes and marker alleles
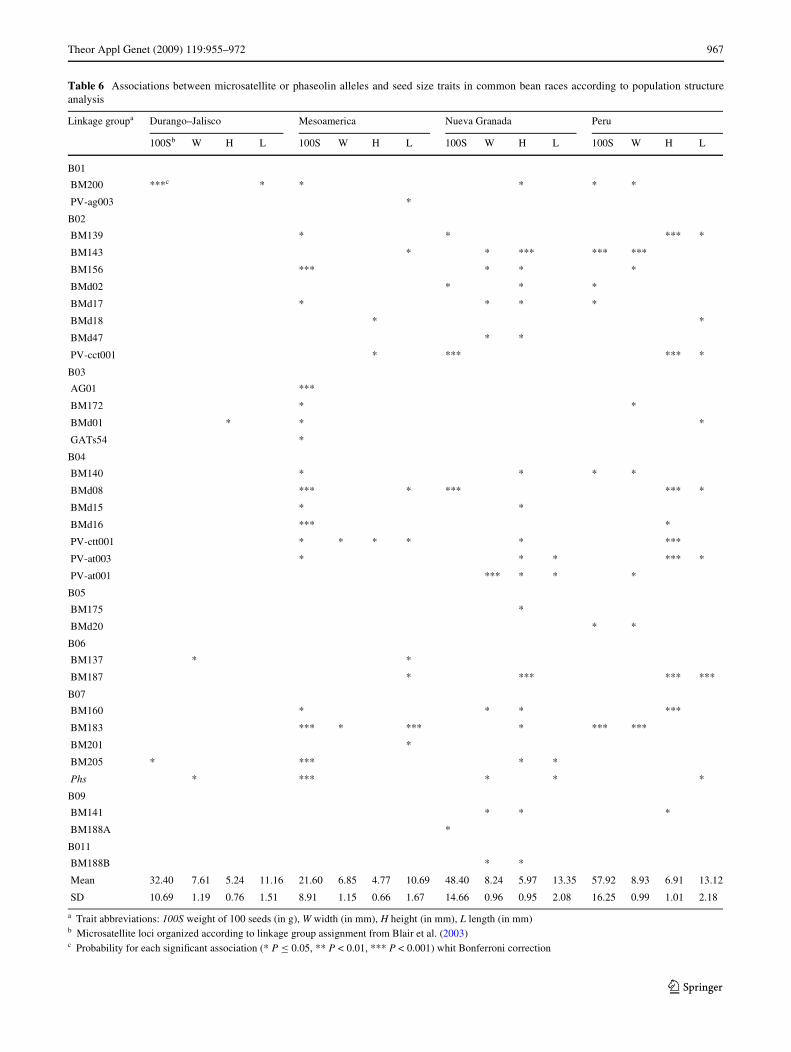
Association of marker loci with seed characteristics wasevaluated across the genome with the justiWcation thatphaseolin and other regions of the genomes have been asso-ciated with seed size in several previous quantitative traitloci (QTL) studies. Our interest was in testing associationsof both the phaseolin locus (Phs) and microsatellite lociwith seed characteristics to test whether markers on linkagegroup b07, where Phs is located, were more likely to beassociated than markers on other linkage groups and to con-Wrm associations identiWed in previous studies of QTL forthese characteristics. To control for population structure,we performed association analyses independently for eachrace. As seen in Table 6, the most highly signiWcant(P < 0.001) associations found were BMd8 (linkage groupb04) for seed weight in races of both genepools (Meso-america, Nueva Granada and Peru; BM183 (b07) for seedweight, width and length also in both genepools; BM200(b01) for seed weight in the Durango–Jalisco race; BM156(linkage group b02), AG01 (b03), BMd16 (b04), Phs andBM205 (b07) for seed characteristics in races of theMesoamerican genepool and BM143 and PV-cct001 (b02),PV-at001 (b04) and BM187 (b06) for seed characteristicsin races of the Andean genepool. It was notable thatDurango–Jalisco presented only one highly signiWcantassociation while race Guatemala had associations only atP < 0.05, but not at the more signiWcant level.
The average seed weight and size were smallest in theMesoamerica race, intermediate in the Durango–Jaliscocomplex, and highest in the Andean races as shown at thebottom of Table 6. Interestingly, while accessions fromrace Peru had heavier seeds on average, these seeds wereshorter on average than race Nueva Granada accessions.The diVerence in weight, therefore, was due to the widerand higher seed dimensions that are found in the race Peruaccessions, which typically were rounded while NuevaGranada races were elongated or kidney shaped. To statis-tically evaluate the diVerences in variability for seed char-acteristics in each of the races a Levene’s test was used todetermine if variances were equal or not in these diVerentsubpopulations. Variances were unequal (P < 0.0001) forseed weight, length and height but were equal for seedwidth (P < 0.05). The most diversity for seed length wasfound in races Nueva Granada and Peru, while seedweight was very diverse for race Peru. Mesoamericanraces had less diversity for seed weight, height and lengththan Andean races as reXected in the lower standarddeviations.T
able
5O
vera
ll o
bser
ved
hete
rozy
gosi
ty p
er s
ubgr
oup
and
num
ber
of a
llele
s an
d ex
pect
ed h
eter
ozyg
osit
y fo
und
for
geno
mic
and
gen
e-ba
sed
mic
rosa
tell
ite
mar
kers
and
for
pha
seol
in p
atte
rns
acro
ss e
ach
subg
roup
fou
nd w
ithin
the
coll
ectio
n of
604
com
mon
bea
n ge
noty
pes
aS
ubgr
oups
: D–J
Dur
ango
–Jal
isco
, G G
uate
mal
a, M
Mes
oam
eric
a, N
G N
ueva
Gra
nada
, P P
eru
bN
umbe
r of
indi
vidu
als
per
subg
roup
indi
cate
d as
n=
tota
l gen
otyp
es in
that
sub
grou
p
Sub
grou
psa
D–J
1 (n
=69
)bD
–J2
(n=
39)
G (
n=
61)
M1
(n=
65)
M2
(n=
69)
NG
1 (n
=35
)N
G2
(n=
80)
P1
(n=
133)
P2 (
n=
53)
Ove
rall
Obs
. Het
.0.
058
0.10
20.
096
0.05
00.
035
0.02
40.
044
0.02
80.
034
Mar
ker
All
ele
No
Exp
. Het
.A
llele
No
Exp
. Het
.A
llel
e N
oE
xp. H
et.
Alle
le N
oE
xp. H
et.
All
ele
No
Exp
. Het
.A
llel
e N
oE
xp. H
et.
All
ele
No
Exp
. Het
.A
llel
e N
oE
xp. H
et.
Alle
le N
oE
xp. H
et.
Mea
n fo
r ge
nom
ic7.
20.
440
8.5
0.57
58.
00.
581
9.0
0.49
08.
20.
473
5.8
0.50
213
.00.
652
15.5
0.66
49.
60.
587
Mea
n fo
r ge
ne-b
ased
4.9
0.37
14.
90.
429
5.4
0.37
04.
80.
366
4.5
0.30
93.
10.
173
5.8
0.27
97.
10.
269
4.3
0.20
7
Mea
n fo
r al
l SS
R m
arke
rs6.
20.
411
6.9
0.51
26.
90.
490
7.1
0.43
66.
60.
402
4.6
0.36
09.
80.
491
11.9
0.49
37.
30.
423
Pha
seol
in4
0.71
89
0.81
96
0.63
95
0.64
86
0.98
65
0.38
811
0.44
49
0.56
28
0.65
8
123
Theor Appl Genet (2009) 119:955–972 967
Table 6 Associations between microsatellite or phaseolin alleles and seed size traits in common bean races according to population structureanalysis
a Trait abbreviations: 100S weight of 100 seeds (in g), W width (in mm), H height (in mm), L length (in mm)b Microsatellite loci organized according to linkage group assignment from Blair et al. (2003)c Probability for each signiWcant association (* P · 0.05, ** P < 0.01, *** P < 0.001) whit Bonferroni correction
Linkage groupa Durango–Jalisco Mesoamerica Nueva Granada Peru
100Sb W H L 100S W H L 100S W H L 100S W H L
B01
BM200 ***c * * * * *
PV-ag003 *
B02
BM139 * * *** *
BM143 * * *** *** ***
BM156 *** * * *
BMd02 * * *
BMd17 * * * *
BMd18 * *
BMd47 * *
PV-cct001 * *** *** *
B03
AG01 ***
BM172 * *
BMd01 * * *
GATs54 *
B04
BM140 * * * *
BMd08 *** * *** *** *
BMd15 * *
BMd16 *** *
PV-ctt001 * * * * * ***
PV-at003 * * * *** *
PV-at001 *** * * *
B05
BM175 *
BMd20 * *
B06
BM137 * *
BM187 * *** *** ***
B07
BM160 * * * ***
BM183 *** * *** * *** ***
BM201 *
BM205 * *** * *
Phs * *** * * *
B09
BM141 * * *
BM188A *
B011
BM188B * *
Mean 32.40 7.61 5.24 11.16 21.60 6.85 4.77 10.69 48.40 8.24 5.97 13.35 57.92 8.93 6.91 13.12
SD 10.69 1.19 0.76 1.51 8.91 1.15 0.66 1.67 14.66 0.96 0.95 2.08 16.25 0.99 1.01 2.18
123

968 Theor Appl Genet (2009) 119:955–972
Discussion
This study describes one of the Wrst large-scale genotypingexercises for common bean using a core collection andXuorescent microsatellite marker technology. Core collec-tions are considered valuable ways of analyzing phenotypicdiversity (Brown 1989) but generally have not been geno-typed before due to a lack of high throughput marker tech-nologies. Therefore, in this project our initial step was todevelop the Xuorescent marker set needed for large-scalegenotyping. Before starting this project, Xuorescent micro-satellites had not been widely used for common bean asonly one publication had attempted this technology for thiscrop (Masi et al. 2002). We decided to use Xuorescentmicrosatellites and automated detection on a capillary sys-tem since this technology allows many samples to be evalu-ated in a uniform manner and gives more accurate allelecalls than gel-based readings of microsatellites.
Fluorescent microsatellite evaluation uncovered a largernumber or alleles than in our previous studies of commonbean genetic diversity with microsatellites (Gomez et al.2004; Blair et al. 2007; Díaz and Blair 2006; Zhang et al.2008), however, a direct comparison is diYcult due to thediVerent number and source of genotypes included in eachstudy. Allele richness was also higher than in the previousstudies, with a Nei’s index for the entire set of genotypes of0.643, which may reXect the large number of unique alleles.These values were even higher for the genomic (non-cod-ing) microsatellites analyzed alone (0.734) when comparedwith the gene-based microsatellites analyzed alone (0.523),which agrees with our previous study comparing a largenumber of silver-stained markers from both of these cate-gories (Blair et al. 2006a). It was notable that the ATmotif-based marker was more polymorphic than GA- andGAT-based microsatellites and that overall Xuorescentmarker technology was highly accurate in calling alleleswith small size diVerences (Diwan and Cregan 1997).
For the diversity assessment carried out in the PCoA, theresults from Xuorescent microsatellite evaluation agreedwell with previous evaluations of common bean diversitywith smaller sets of germplasm and non-Xuorescent mark-ers (Blair et al. 2006a, 2007; Díaz and Blair 2006). In turn,these results augment the analysis done by Beebe et al.(2001, 2002) with anonymous, dominant RAPD markersused to characterize the Mesoamerican section of this samecore collection. We found the proportion of shared allelesto be a useful measure of genetic similarity, which waspreferable to Dice similarity coeYcient for a large datasetsuch as ours where non-ampliWcation occurred for 4.1% ofthe total genotype £ marker combinations. The reproduc-ibility of Xuorescent microsatellites as precisely read, singlecopy, co-dominant markers is advantageous over othertypes of markers, but some non-ampliWcation occurred,
perhaps, due to the small reaction volumes used in PCR orto the threshold sensitivity of the detection system.
As in our previous studies, using gel-based assays ofmicrosatellites (Blair et al. 2007; Díaz and Blair 2006), racestructure of common bean was doubly dichotomous withtwo large groups in each of two genepools, namely theDurango–Jalisco complex and the Mesoamerica race in theMesoamerican genepool and the Nueva Granada and Peruraces in the Andean genepool. However, in addition,approximately 10% of the genotypes clustered into a verydistinct group of climbing beans all from Guatemala orsouthern Mexico that we deWned as race Guatemala. Theseresults conWrm the existence of race Guatemala as an addi-tional race within the Mesoamerican genepool validatingthe results with RAPD markers from Beebe et al. (2000)and expanding on the microsatellite analysis from Díaz andBlair (2006). Furthermore, these results are useful in betterdeWning race Guatemala, since the initial diVerentiation ofthe race by Beebe et al. (2000) was based on a smallnumber of genotypes (12) while here we identiWed 61 raceGuatemala genotypes. Meanwhile, race Guatemala mayhave been diYcult to detect in RFLP or RAPD analysessuch as those by Becerra-Velazquez and Gepts (1994) orJohns et al. (1997) because it is less frequent in randomgermplasm collections and therefore may not have beensampled in these previous studies. Within the Andean gene-pool, the Chile race could not be identiWed here, perhaps,due to reduced sampling of germplasm from the southernAndes of South America or due to the fact that this race isnot highly distinct from race Peru as was found in ourprevious study of a smaller group of genotypes (Blair et al.2007). SpeciWc studies with Chilean genotypes are neededto deWne this race further.
Another observation was that secondary center germ-plasm was found to represent part of the diversity found inthe primary centers. As a result, genetic diversity in thisstudy was higher in the primary centers than in the second-ary centers of diversity. This could be explained, perhaps,due to the limited gene Xow out of the primary center forsome of the races or due to more limited sampling of sec-ondary center diversity. The races that appear to be mostextensive outside the center of diversity are races Meso-america and Nueva Granada, which agrees with observa-tions made by Singh et al. (1991b). Further analysis andintegration of SSR datasets from this study and from previ-ous evaluations of dry beans with primary center germ-plasm or race standards Díaz and Blair 2006; Blair et al.2007) or with secondary center germplasm from CentralAmerica (Gomez et al. 2004), China (Zhang et al. 2008) orSouthern Europe (Lioi et al. 2005; Maras et al. 2006; Sicardet al. 2005) will be useful for an even better understandingof common bean race structure and genetic diversity.Another observation from our study was that the genepools
123
Theor Appl Genet (2009) 119:955–972 969
had equivalent amounts of SSR diversity, while in a previ-ous study we predicted more diversity in the Andean gene-pool than in the Mesoamerican genepool (Blair et al.2006a).
This study also helped validate subgrouping within eachof the races, which can be considered as subraces. Forexample, the subgroups within the Mesoamerica racelargely corresponded to the subraces observed by Beebeet al. (2000) who predicted the existence of groups M1 andM2; however, the subdivisions of the Durango–Jaliscogroup did not correspond directly to the subgroups identi-Wed by Beebe et al. (2000) but did correspond well to thoseof Díaz and Blair (2006). Meanwhile, we did not identifyany subdivisions within race Guatemala in contrast to theresults of Beebe et al. (2000) even though we included fourof the same genotypes as this previous study with two fromeach of the subdivisions identiWed by them. Subgroupingwithin the Andean genepool agreed with those of Blairet al. (2007) but much greater admixture was found amongthe groups form races Nueva Granada and Peru. Growthhabit was found to not be a deWning characteristic of eachof the races or subraces. As was found in Blair et al. (2007),genotypes with climbing growth habit were found withinthe Nueva Granada subgroups and genotypes with bushbean growth habit were found within the Peru race sub-groups, contrasting with the original race morphologicaldescription from Singh et al. (1991b).
Meanwhile, phaseolin pattern that was useful for gene-pool identiWcation was found to be only partially predictiveof race and subrace/subgroup divisions and mostly in theAndean genepool, where a diverse set of phaseolin patternswas observed, although phaseolin ‘T’ and then to lesserextent ‘H’ were most common. Interestingly, the proportionof these two patterns varied in each of the races, withphaseolin ‘T’ more prevalent in race Nueva Granada(74.8%) than in race Peru (60.2%) and ‘H’ higher in racePeru (18.8%) than in race Nueva Granada (6.9%). Mean-while in the Mesoamerican geneopool, all the races andsubgroups had the same phaseolin alleles (S, Sb, Sd and B)so microsatellite allele frequency would be a better methodof separating races within this genepool.
The Wnding of similar levels of diversity in both gene-pools but varying diversity within subgroups contrast withour previous studies with non-Xuorescently labeled micro-satellite markers (Blair et al. 2006a, 2007; Díaz and Blair2006) where Andean diversity was higher than Mesoameri-can diversity and where diversity was equivalent in mostsubgroups. This may have been due to the evaluation ofmore diverse genotypes from race Guatemala and theDurango–Jalisco complex than in these previous studies.The similarity in genetic diversity between genepoolscould also be explained by the discovery of higher diver-sity for genomic microsatellites in Andean subgroups and
contrastingly the higher diversity of cDNA-based microsat-ellites in Mesoamerican subgroups. In our previous analysiswith microsatellite markers, we used fewer gene-basedmarkers when compared with genomic markers (Blair et al.2006a) so this may also explain the diVerence betweenstudies. Higher diversity within the Andean genepool forgenomic microsatellites may also be due to ascertainmentbias since an Andean genotypes was used to develop thegenomic markers (Gaitán et al. 2002). However, overall theresults indicate the value of using microsatellites fromseveral sources to evaluate genetic diversity in the crop andby extension the utility of both types of markers for associ-ation analysis, as discussed below.
Association analysis for microsatellite and phaseolinalleles with seed size or shape was performed to comparethe eVectiveness of association mapping with previousreports of linkage mapping and QTL analysis for thesetraits in bi-parental populations. Some of the most highlysigniWcant marker £ seed weight associations (P < 0.0001)agreed with previously reported QTL on linkage groupsb02, b03, b07 and b11 in wild £ cultivated backcross andrecombinant inbred line (RIL) populations (Blair et al.2006b; Koinange et al. 1996) as well as in inter and intra-genepoool RIL populations (Park et al. 2000; Tar’an et al.2002). The phaseolin locus, Phs, was found to be associ-ated with seed weight in the Mesoamerica race agreeingwith results from the Wrst of these studies and appears to beespecially important when considering wild bean introgres-sion. Additional associations at P < 0.01 were found forphaseolin alleles and seed width in race Durango, for seedwidth or length in race Nueva Granada and for seed lengthin race Peru but none were found for race Guatemala. Theassociation of BM143 and several other markers on linkagegroup b02 with seed weight agrees with results for a seedsize QTL from Blair et al. (2006b) and may highlight thisregion of the genome as important in determining this char-acteristic. We decided to evaluate seed size characteristicsbecause these are among the most important traits of com-mon bean and a major determinant of commercial accept-ability of traditional or improved varieties (Park et al.2000; Voysest et al. 1994) as well as being highly heritable(Motto et al. 1978). Furthermore, bean seed weight has alsobeen correlated with yield potential and with various yieldcomponents (Terán and Singh 2002) and varieties of drybeans that do not meet minimum seed weight criteria canbe rejected by the marketplace while in snap beans,varieties with elongated seed shape or smaller seed size arepreferred as they are correlated with pod quality (Blairet al. 2006b).
This study found that within each molecularly deWnedrace of dry bean, there was variability for seed size andshape and that the range between the smallest and largestcultivated varieties for seed weight within the Mesoamerica
123

970 Theor Appl Genet (2009) 119:955–972
race represented part of the sixfold diVerence found for allcultivated beans. When comparing wild and cultivatedbeans this diVerence is ampliWed to over 20–25-fold diVer-ence in seed weight (Acosta-Gallegos et al. 2007). Further-more, seed size can inXuence and be inXuenced by theconcentration of macronutrients such as protein, phytateand starch levels; and the proportion of seed coat to endo-sperm is directly proportional in most cases to seed size andshape with resulting inXuences on tannin levels and mineralconcentration, since these are diVerentially found in seedcoat tissues (Ariza-Nieto et al. 2007). Therefore, the mark-ers we identiWed as being associated with seed weight,length, width and height can be important for the under-standing or marker-assisted selection of this trait, especiallyin validating results from QTL studies, which only use afew genotypes as parents. In addition, the comprehensivegermplasm set that was evaluated here and that included allraces of the crop could be useful for discovering signaturesof domestication bottlenecks for seed size traits where seedweight was a major characteristic emphasized by humanselection (Papa and Gepts 2003).
In conclusion, the results of this large scale genotyping ofcommon bean using Xuorescent microsatellite markers willbe useful as a baseline for further genotypic characterizationof this and other collections, especially since this is the Wrstintegrated analysis of genotypes from primary and second-ary centers of diversity and from both major gene pools ofcommon bean using SSR markers. Overall, race structurewas similar to previous studies but the current analysis wasmore deWnitive due to the larger number of genotypesanalyzed and highlighted the importance of races NuevaGranada and Peru in the Andean genepool and Mesoamer-ica, Durango–Jalisco and Guatemala in the Mesoamericangenepool. The core collection analyzed here is unique inrepresenting all major agro-ecologies where common beanis grown based on a geographic information system analysisthat took into account climatic parameters and origin and themicrosatellites we used cover most of the genome. As such,these results can be used to complement diversity assess-ments of national collections by providing the global popu-lation structure and whole-genome genotype in which tointegrate speciWc collections and markers. In addition, aselection of the genotypes from the core collection withadaptation to tropical environments and lack of photoperiodsensitivity has been constituted into a reference collectionthat will be used to assay diversity at individual loci and forfurther phenotyping and association mapping.
Acknowledgments The authors wish to thank A. V. Gonzales,M. Muñoz and F. Pedraza for DNA extractions and the personnel ofthe CIAT Genetic Resource Units and CIAT bean program for seedcharacterization and multiplication. We also acknowledge S. Kresovich,S. Mitchell and T. Fulton at the Institute for Genomic Diversity as wellas the Cornell Biotechnology Center for support in genotyping. We are
also grateful to D. Debouck and S. Beebe from CIAT for germplasmadvice. This research was supported by the Generation ChallengeProgram and CIAT.
References
Acosta-Gallegos JA, Kelly JD, Gepts P (2007) Prebreeding in commonbean and use of genetic diversity from wild germplasm. Crop Sci47:44–59
Afanador L, Hadley S, Kelly JD (1993) Adoption of a mini-prep DNAextraction method for RAPD marker analysis in common bean(Phaseolus vulgaris L.). Bean Improv Coop 36:10–11
Akkaya MS, Bhagwat AA, Cregan PB (1992) Length polymorphismof simple sequence repeat DNA in soybean. Genetics 132:1131–1139
Ariza-Nieto M, Blair MW, Welch RM, Glahn RP (2007) Screening ofbioavailability patterns in eight bean (Phaseolus vulgaris L.)genotypes using the Caco-2 cell in vitro model. J Agr Food Sci55:7950–7956
Becerra-Velazquez L, Gepts P (1994) RFLP diversity of common bean(Phaseolus vulgaris L.) in its centres of origin. Genome 37:256–263
Beebe S, Lynch J, Galwey N, Tohme J, Ochoa I (1997) A geographicalapproach to identify phosphorus-eYcient genotypes among land-races and wild ancestors of common bean. Euphytica 95:325–336
Beebe S, Skroch P, Tohme J, Duque MC, Pedraza F, Nienhhuis J(2000) Structure of genetic diversity among common bean land-races of middle American origin based on correspondence analy-sis of RAPD. Crop Sci 40:264–273
Beebe S, Renjifo J, Gaitán-Solís E, Duque MC, Tohme J (2001) Diver-sity and origin of Andean landraces of common bean. Crop Sci41:854–862
Blair MW, Hedetale V, McCouch SR (2002) Fluorescent-labeledmicrosatellite panels useful for detecting allelic diversity in culti-vated rice (Oryza sativa L.). Theor Appl Genet 105:449–457
Blair MW, Pedraza F, Buendia H, Gaitán-Solis E, Beebe S, Gepts P,Tohme J (2003) Development of a genome-wide anchored micro-satellite map for common bean (Phaseolus vulgaris L.). TheorAppl Genet 107:1362–1374
Blair MW, Giraldo MC, Buendia HF, Tovar E, Duque MC, Beebe S(2006a) Microsatellite marker diversity in common bean (Phase-olus vulgaris L.). Theor Appl Genet 113:100–109
Blair MW, Iriarte G, Beebe S (2006b) QTL analysis of yield traits inan advanced backcross population derived from a cultivatedAndean x wild common bean (Phaseolus vulgaris L.) cross. TheorAppl Genet 112:1149–1163
Blair MW, Diaz JM, Hidalgo R, Diaz LM, Duque MC (2007) Micro-satellite characterization of Andean races of common bean(Phaseolus vulgaris L.). Theor Appl Genet 116:29–43
Broughton WJ, Hernandez G, Blair MW, Beebe SE, Gepts P, Vander-leyden J (2003) Beans (Phaseolus spp.)—model food legumes.Plant Soil 252:55–128
Brown AHD (1989) Core collections: a practical approach to geneticresources management. Genome 31:818–824
Brown JWS, Ma Y, Bliss FA, Hall TC (1981) Genetic variation in thesubunits of Globulin-1 storage protein of French bean. TheorAppl Genet 59:83–88
Buckler ES, Thornsberry JM (2002) Plant molecular diversity andapplications to genomics. Curr Opin Plant Biol 5:107–111
Buckler E, Bradbury P, Kroon D, Ramdoss Y, Casstevens T, Zhang Z(2007) TASSEL v. 2 (Trait analysis by association, evolution andlinkage). http://www.maizegenetics.net/tassel
Cho YG, Ishii T, Temnykh S, Chen X, Lipovich L, McCouch SR, ParkWD, Ayres N, Cartinhour S (2000) Diversity of microsatellites
123

Theor Appl Genet (2009) 119:955–972 971
derived from genomic libraries and GenBank sequences in rice(Oryza sativa L.). Theor Appl Genet 100:713–722
Coburn JR, Temnykh SV, Paul EM, McCouch SR (2002) Design andapplication of microsatellite marker panels for semiautomatedgenotyping of rice (Oryza sativa L.). Crop Sci 42:2092–2099
Crossa J, Burgueño J, Dreisigacker S, Vargas M, Herrera-Foessel SA,Morten L, Singh RP, Trethowan R, Warburton M, Franco J,Reynolds M, Crouch JH, Ortiz R (2007) Association analysis ofhistorical bread wheat germplasm using additive genetic covarianceof relatives and population structure. Genetics 177:1889–1913
Díaz LM, Blair MW (2006) Race structure within the Mesoamericangene pool of common bean (Phaseolus vulgaris L.) as determinedby microsatellite markers. Theor Appl Genet 114:143–154
Diwan N, Cregan PB (1997) Automated sizing of Xuorescent-labeledsimple sequence repeat (SSR) markers to assay genetic variationin soybean. Theor Appl Genet 95:723–733
Durán LA, Blair MW, Giraldo MC, Machiavelli R, Prophete E, Nin JC,Beaver JS (2005) Morphological and molecular characterizationof common bean (Phaseolus vulgaris L.) landraces from theCaribbean. Crop Sci 45:1320–1328
ExcoYer L (2007) Arlequin ver 3.11 Computational and molecularpopulation genetics lab CMPG. Zoological Institute, Universityof Berne. http://cmpg.unibe.ch/software/arlequin3/
Felsenstein J (1993) PHYLIP—phylogeny inference package, Version3.67. Department of Genome Sciences and Department of Biol-ogy, University of Washington, Seattle, WA, USA. http://cmgm.stanford.edu/phylip/
Flint-Garcia SA, Thuille A-C, Yu J, Pressoir G, Romero SM, MitchelSE, Doebley J, Kresovich S, Goodman MM, Buckler ES (2005)Maize association population: a high-resolution platform forquantitative trait locus dissection. Plant J 44:1054–1064
Gaitán E, Duque MC, Edwards K, Tohme J (2002) Microsatellite re-peats in common bean (Phaseolus vulgaris L.): isolation, charac-terization, and cross-species ampliWcation in Phaseolus spp. CropSci 42:2128–2136
Gao H, Williamson S, Bustamante CD (2007) An MCMC approach forjoint inference of population structure and inbreeding rates frommulti-locus genotype data. Genetics (online). Cornell Computa-tional Biology Service Unit (CBSU). http://cbsuapps.tc.cor-nell.edu/InStruct.aspx
Garris AJ, Tai TH, Coburn J, Kresovich S, McCouch S (2005) Geneticstructure and diversity in Oryza sativa L. Genetics 169:1631–1638
Gepts P, Osborn T, Rashka K, Bliss F (1986) Phaseolin–protein vari-ability in wild forms and landraces of the common bean (Phaseo-lus vulgaris L.): evidence for multiple centers of domestication.Econ Bot 40:451–468
Gomez O, Blair MW, Frankow-Lindberg B, Gullberg U (2004) Molec-ular and phenotypic diversity of common bean landraces fromNicaragua. Crop Sci 4:1412–1418
Hayden MJ, Nguyen TM, Waterman A, McMichael GL, Chalmers KJ(2008) Application of multiplex-ready PCR for Xuorescence-based SSR genotyping in barley and wheat. Mol Breeding21:271–281
Idury RM, Cardon LR (1997) A simple method for automated allelebinning in microsatellite markers. Genome Res 11:1104–1109
Islam FM, Basford KE, Redden RJ, Gonzalez AV, Kroonenberg PM,Beebe SE (2002) Genetic variability in cultivated common beanbeyond the two major gene pools. Genet Resour Crop Evol49:271–283
Islam FM, Beebe S, Muñoz M, Tohme J, Redden RJ, Basford KE(2004) Using molecular markers to assess the eVect of introgres-sion on quantitative attributes of common bean in the Andeangene pool. Theor Appl Genet 108:243–252
Johns MA, Skroch PW, Nienhuis J, Hinrichsen P, Bascur G, Muñoz-Schick C (1997) Gene pool classiWcation of common bean
landraces from Chile based on RAPD and morphological data.Crop Sci 37:605–613
Koinange EMK, Singh SP, Gepts P (1996) Genetic control of thedomestication syndrome in common-bean. Crop Sci 36:1037–1145
Lioi L, Piergiovanni AR, Pignone D, Puglisi S, Santantonio M, Sonn-ante G (2005) Genetic diversity of some surviving on-farm Italiancommon bean (Phaseolus vulgaris L.) landraces. Plant Breed124:576–581
Liu K, Muse S (2005) PowerMarker: integrated analysis environmentfor genetic marker data. Bioinformatics 21:2128–2129. http://www.powerMarker.net
Liu K, Goodman M, Muse S, Smith JS, Buckler E, Doebley J (2003)Genetic structure and diversity among maize inbred lines asinferred from DNA microsatellites. Genetics 165:2117–2128
Malysheva-Otto LV, Ganal MW, Röder Marion S (2006) Analysis ofmolecular diversity, population structure and linkage disequilib-rium in a worldwide survey of cultivated barley germplasm(Hordeum vulgare L.). BMC Genetics 7:6
Maras M, Susnik S, Sustar-Vozlic J, Meglic V (2006) Temporal chang-es in genetic diversity of common bean (Phaseolus vulgaris L.)accessions cultivated between 1800 and 2000. Russ J Genet42:775–782
Masi P, Spagnoletti ZP, Donini P (2003) Development and analysis ofmultiplex microsatellite markers sets in common bean (Phaseolusvulgaris L.). Mol Breed 11:303–313
McCouch SR, Chen X, Panaud O, Temnykh S, Xu Y, Gu Cho Y,Huang N, Ishii T, Blair M (1997) Microsatellite marker develop-ment, mapping and applications in rice genetics and breeding.Plant Mol Biol 35:89–99
Miklas PN, Delorme R, Hannan R, Dickson MH (1999) Using a sub-sample of the core collection to identify new sources of resistanceto white mold in common bean. Crop Sci 39:569–573
Motto M, Soressi GP, Salamini F (1978) Seed size inheritance in across between wild and cultivated common bean (Phaseolus vul-garis L.). Genetica (The Hague) 49:31–36
Oumar I, Mariac C, Pham JL, Vigouroux Y (2008) Phylogeny and ori-gin of pearl millet (Pennisetum glaucum [L.] R. Br) as revealed bymicrosatellite loci. Theor Appl Genet 117:489–497
Papa R, Gepts P (2003) Asymmetry of gene Xow and diVerential geo-graphical structure of molecular diversity in wild and domesti-cated common bean (Phaseolus vulgaris L.) from Mesoamerica.Theor Appl Genet 106:239–250
Park SO, Coyne DP, Jung G, Skroch PW, Arnaud-Santana E, Stead-man JR, Ariyarathne HM, Nienhuis J (2000) Mapping of QTL forseed size and shape traits in common bean. J Am Soc Hort Sci125:466–475
Pejic I, Ajmore-Marsan P, Morgante M, Kozumplick V, Castiglioni P,Taramino G, Motto M (1998) Comparative analysis of geneticsimilarity among maize inbred lines detected by RFLPs, RAPDs,SSRs, and AFLPs. Theor Appl Genet 97:1248–1255
Pritchard JK, Stehens M, Donnelly P (2000) Inference of populationstructure using multilocus genotype data. Genetics 155:945–959
Reed PW, Davies JL, Copeman JB, Benett ST, Palmer SM, PritchardLE, Gough SCL, Kawaguchi Y, Cordell HJ, Balfour KM, JenkinsSC, Powell EE, Vignal A, Todd JA (1994) Chromosome speciWcmicrosatellite sets for Xuorescence-based, semi-automatedgenome mapping. Nature Genet 7:390–395
Rohlf F (2002) NTSYS pc. Numerical taxonomy system. Exeter pub-lishing, Setauket
Rosenberg NA (2002) Distruct: a program for the graphical display ofstructure results. http://www.cmb.usc.edu/»noahr/distruct
Rostoks N, Ramsay L, MacKenzie K, Cardle L, Bhat PR, Roose ML,Svensson JT, Stein N, Varshney RK, Marshall DF, Graner A,Close TJ, Waugh R (2006) Recent history of artiWcial outcrossing
123

972 Theor Appl Genet (2009) 119:955–972
facilitates whole-genome association mapping in elite inbred cropvarieties. Proc Natl Acad Sci USA 103:18656–18661
SAS-Institute (1996) SAS/STAT Users guide 6.11. SAS Inst, CarySchwengel DA, Jedlicka AE, Nanthakumar EJ, Weber JL, Levitt RC
(1994) Comparison of Fluorescence-based semi-automated geno-typing of multiple microsatellite loci with autoradiographic tech-niques. Genomics 22:46–54
Sicard D, Nanni L, PorWri O, Bulfon D, Papa R (2005) Genetic diver-sity of Phaseolus vulgaris L. and P. coccineus L. landraces in cen-tral Italy. Plant Breed 124:464–472
Singh S, Gepts P, Debouck D (1991a) Races of common bean (Phase-olus vulgaris, Fabaceae). Econ Bot 45:379–396
Singh S, Gutierrez A, Molina A, Urrea C, Gepts P (1991b) Geneticdiversity in cultivated common bean. II. Marker-based analysison morphological and agronomic traits. Crop Sci 31:23–29
Singh S, Nodari R, Gepts P (1991c) Genetic diversity in cultivatedcommon bean. I. Allozymes. Crop Sci 31:19–23
Tar’an B, Michaels TE, Pauls KP (2002) Genetic mapping of agro-nomic traits in common bean (Phaseolus vulgaris L.). Crop Sci42:544–556
Terán H, Singh SP (2002) Comparison of sources and lines selected fordrought resistance in common bean. Crop Sci 42:64–70
Thomson MJ, Septiningsih EM, Suwardjo F, Santoso TJ, Silitonga TS,McCouch SR (2007) Genetic diversity analysis of traditional andimproved Indonesian rice (Oryza sativa L.) germplasm usingmicrosatellite markers. Theor Appl Genet 114:559–568
Tohme J, Jones P, Beebe SE, Iwanaga M (1995) The combined use ofagroecological and characterisation data to establish the CIAT
Phaseolus vulgaris core collection. In: Hodgkin T, Brown AHD,van Hintum ThJL, Morales EAV (eds) Core collections of plantgenetic resources. International Plant Genetic Resources Institute(IPGRI). Wiley-Sayce Publication, London, pp 95–107
Tommasini L, Batley J, Arnold GM, Cooke RJ, Donini P, Lee D, LawJR, Lowe C, Moule C, Trick M, Edwards KJ (2003) The develop-ment of multiplex simple sequence repeat (SSR) markers to com-plement distinctness, uniformity and stability testing of rape(Brassica napus L.) varieties. Theor Appl Genet 106:1091–1101
CIAT (Centro Internacional de Agricultura Tropical) (1987) Standardsystem for the evaluation of bean germplasm. In: SchoonhovenAV, Pastor–Corrales MA (eds) Cali, Colombia
Voysest O, Valencia M, Amezquita M (1994) Genetic diversity amongLatin American Andean and Mesoamerican common bean culti-vars. Crop Sci 34:1100–1110
Warburton ML, Reif JC, Frisch M, Bohn M, Bedoya C, Xia XC, Cros-sa J, Franco J, Hoisington D, Pixley K, Taba S, Melchinger AE(2008) Genetic diversity in CIMMYT nontemperate maize germ-plasm: landraces, open pollinated varieties and inbred lines. CropSci 48:617–624
Yu K, Park J, Poysa V, Gepts P (2000) Integration of simple sequencerepeat (SSR) markers into a molecular linkage map of commonbean (Phaseolus vulgaris L.). J Hered 91:429–434
Zhang X, Blair MW, Wang S (2008) Genetic diversity of Chinese com-mon bean (Phaseolus vulgaris L.) landraces assessed with simplesequence repeat markers. Theor Appl Genet 117:629–640
123