Transcriptional profiling of root-knot nematode induced feeding sites in cowpea (Vigna unguiculata...
16
RESEARCH ARTICLE Open Access Transcriptional profiling of root-knot nematode induced feeding sites in cowpea (Vigna unguiculata L. Walp.) using a soybean genome array Sayan Das 1,2 , Jeffrey D Ehlers 1 , Timothy J Close 1 , Philip A Roberts 2* Abstract Background: The locus Rk confers resistance against several species of root-knot nematodes (Meloidogyne spp., RKN) in cowpea (Vigna unguiculata). Based on histological and reactive oxygen species (ROS) profiles, Rk confers a delayed but strong resistance mechanism without a hypersensitive reaction-mediated cell death process, which allows nematode development but blocks reproduction. Results: Responses to M. incognita infection in roots of resistant genotype CB46 and a susceptible near-isogenic line (null-Rk) were investigated using a soybean Affymetrix GeneChip expression array at 3 and 9 days post- inoculation (dpi). At 9 dpi 552 genes were differentially expressed in incompatible interactions (infected resistant tissue compared with non-infected resistant tissue) and 1,060 genes were differentially expressed in compatible interactions (infected susceptible tissue compared with non-infected susceptible tissue). At 3 dpi the differentially expressed genes were 746 for the incompatible and 623 for the compatible interactions. When expression between infected resistant and susceptible genotypes was compared, 638 and 197 genes were differentially expressed at 9 and 3 dpi, respectively. Conclusions: In comparing the differentially expressed genes in response to nematode infection, a greater number and proportion of genes were down-regulated in the resistant than in the susceptible genotype, whereas more genes were up-regulated in the susceptible than in the resistant genotype. Gene ontology based functional categorization revealed that the typical defense response was partially suppressed in resistant roots, even at 9 dpi, allowing nematode juvenile development. Differences in ROS concentrations, induction of toxins and other defense related genes seem to play a role in this unique resistance mechanism. Background Cowpea (Vigna unguiculata L. Walp) is grown exten- sively as a food and fodder crop in West Africa, lower elevation areas of eastern and southern Africa, north- eastern Brazil, parts of the Middle East, India, and the south-eastern and south-western regions of North America [1]. In West Africa cowpea is mainly cultivated as a rainfed crop from April to November depending on the location. Cowpea (2N = 2X = 22) has a genome size of ~600 Mbp [2]. Root-knot nematodes (RKN, Meloidogyne spp.) are sedentary endoparasites with a wide host range and one of the world’s most damaging crop pests [3]. RKN feed- ing in plant roots leads to development of specialized feeding structures in the vascular parenchyma called “giant cells”. The infective stage of this nematode is the second stage-juvenile (J2). J2 penetrate the roots and go through three successive molts to become adult females. Some economically important RKN species, including M. incognita, reproduce by obligate mitotic partheno- genesis, while many other RKN species reproduce sexu- ally [4]. In cowpea RKN is an important pest worldwide and host plant resistance has been a preferred strategy along * Correspondence: [email protected] 2 Department of Nematology, University of California, Riverside, CA 92521, USA Full list of author information is available at the end of the article Das et al. BMC Genomics 2010, 11:480 http://www.biomedcentral.com/1471-2164/11/480 © 2010 Das et al; licensee BioMed Central Ltd. This is an Open Access article distributed under the terms of the Creative Commons Attribution License (http://creativecommons.org/licenses/by/2.0), which permits unrestricted use, distribution, and reproduction in any medium, provided the original work is properly cited.
Transcript of Transcriptional profiling of root-knot nematode induced feeding sites in cowpea (Vigna unguiculata...

RESEARCH ARTICLE Open Access
Transcriptional profiling of root-knot nematodeinduced feeding sites in cowpea(Vigna unguiculata L. Walp.) using asoybean genome arraySayan Das1,2, Jeffrey D Ehlers1, Timothy J Close1, Philip A Roberts2*
Abstract
Background: The locus Rk confers resistance against several species of root-knot nematodes (Meloidogyne spp.,RKN) in cowpea (Vigna unguiculata). Based on histological and reactive oxygen species (ROS) profiles, Rk confers adelayed but strong resistance mechanism without a hypersensitive reaction-mediated cell death process, whichallows nematode development but blocks reproduction.
Results: Responses to M. incognita infection in roots of resistant genotype CB46 and a susceptible near-isogenicline (null-Rk) were investigated using a soybean Affymetrix GeneChip expression array at 3 and 9 days post-inoculation (dpi). At 9 dpi 552 genes were differentially expressed in incompatible interactions (infected resistanttissue compared with non-infected resistant tissue) and 1,060 genes were differentially expressed in compatibleinteractions (infected susceptible tissue compared with non-infected susceptible tissue). At 3 dpi the differentiallyexpressed genes were 746 for the incompatible and 623 for the compatible interactions. When expressionbetween infected resistant and susceptible genotypes was compared, 638 and 197 genes were differentiallyexpressed at 9 and 3 dpi, respectively.
Conclusions: In comparing the differentially expressed genes in response to nematode infection, a greater numberand proportion of genes were down-regulated in the resistant than in the susceptible genotype, whereas moregenes were up-regulated in the susceptible than in the resistant genotype. Gene ontology based functionalcategorization revealed that the typical defense response was partially suppressed in resistant roots, even at 9 dpi,allowing nematode juvenile development. Differences in ROS concentrations, induction of toxins and other defenserelated genes seem to play a role in this unique resistance mechanism.
BackgroundCowpea (Vigna unguiculata L. Walp) is grown exten-sively as a food and fodder crop in West Africa, lowerelevation areas of eastern and southern Africa, north-eastern Brazil, parts of the Middle East, India, and thesouth-eastern and south-western regions of NorthAmerica [1]. In West Africa cowpea is mainly cultivatedas a rainfed crop from April to November depending onthe location. Cowpea (2N = 2X = 22) has a genome sizeof ~600 Mbp [2].
Root-knot nematodes (RKN, Meloidogyne spp.) aresedentary endoparasites with a wide host range and oneof the world’s most damaging crop pests [3]. RKN feed-ing in plant roots leads to development of specializedfeeding structures in the vascular parenchyma called“giant cells”. The infective stage of this nematode is thesecond stage-juvenile (J2). J2 penetrate the roots and gothrough three successive molts to become adult females.Some economically important RKN species, includingM. incognita, reproduce by obligate mitotic partheno-genesis, while many other RKN species reproduce sexu-ally [4].In cowpea RKN is an important pest worldwide and
host plant resistance has been a preferred strategy along
* Correspondence: [email protected] of Nematology, University of California, Riverside, CA 92521,USAFull list of author information is available at the end of the article
Das et al. BMC Genomics 2010, 11:480http://www.biomedcentral.com/1471-2164/11/480
© 2010 Das et al; licensee BioMed Central Ltd. This is an Open Access article distributed under the terms of the Creative CommonsAttribution License (http://creativecommons.org/licenses/by/2.0), which permits unrestricted use, distribution, and reproduction inany medium, provided the original work is properly cited.

with cultural practices to control the nematode popula-tion in infested cowpea fields [5,6]. The Rk locus incowpea has been used extensively to breed root-knotnematode resistant varieties in the USA and other coun-tries. This locus was first designated as Rk by Fery andDukes [7] and it confers resistance to many populationsof M. incognita, M. arenaria, M. hapla and M. javanica.The Rk-mediated resistance in cowpea has been char-
acterized histologically by Das et al. [8]. An importantfinding from that study was that the resistance responsewas much delayed during the incompatible interactionand there was an absence of typical hypersensitive reac-tion (HR) mediated cell death in the resistant rootsupon nematode infection. This is in contrast to severalother plant-RKN systems studied so far which do have atypical HR. For example, Mi-1 mediated resistance intomato triggers a rapid HR as early as 24 hours post-infection [9], and both Me3-mediated resistance in pep-per [10] and incompatible interactions in soybean [11]show strong early HR.Whole genome microarrays provide a means to scan
for genes involved in particular biological processes on aglobal scale. Unfortunately cowpea does not yet have acommercially available microarray platform. It wasshown previously that the commercially available soy-bean GeneChip from Affymetrix can be used effectivelyin cowpea to identify single feature polymorphisms(SFPs) [12]. In that study, cowpea RNA was used as asurrogate for DNA to identify SFPs, which establishedthe utility of the soybean genome array as a satisfactoryplatform for use in examining cowpea transcripts. In thecurrent study the same soybean platform was used tostudy the global resistant and susceptible cowpearesponses to nematode infection of roots.There have been several microarray studies of the
nematode infection process in plants in last few years.The RKN-plant compatible interactions have been stu-died using microarrays by several groups in Arabidopsis[13,14] and tomato [15,16]. Global gene expressionlevels also have been studied during the infection pro-cess of another important plant parasitic nematode, soy-bean cyst nematode (Heterodera glycines) [17-22].However, few studies have examined incompatibleplant-nematode interactions in resistant plants[16,23,24].In this study the transcriptome profile of both incom-
patible and compatible cowpea-RKN interactions fortwo time points was investigated using the Affymetrixsoybean GeneChip. This is the first study of this kind inthe cowpea-RKN interaction. It provides a broad insightinto the Rk-mediated resistance in cowpea and createsan excellent dataset of potential candidate genesinvolved in both nematode resistance and parasitism,
which can be tested further for their role in this biologi-cal process using functional genomics approaches.
ResultsHeterologous microarray platformIn order to elucidate the plant response to root-knotnematodes, infected resistant CB46 (incompatible inter-action) was compared with non-infected CB46, andinfected susceptible null-Rk (compatible interaction) wascompared with non-infected null-Rk. Two time pointswere chosen for this analysis i.e., 3 and 9 dpi. Nine dpiwas selected as a critical time point because sequentiallyassayed histological sections during 21 days of infectionrevealed that at 9 dpi the first subtle differencesappeared between incompatible and compatible interac-tions [8]. The 3-dpi samples provided a time point priorto visible differences histologically, between incompati-ble and compatible interactions.The average number of soybean probe sets which had
“present” call in 9-dpi samples was 10,521, which com-prised 28% of the total number of soybean probe setson the soybean GeneChip. Similarly, the average numberof “present” calls in 3-dpi samples was 10,685 (~28.5%of all soybean probe sets). When soybean RNA wasused to hybridize the soybean GeneChip, the “present”call percentage ranged from 70-75% [25]. Thereforeabout 40% (28/70) of the content of the soybean Gene-Chip is informative for cowpea.
Data qualityPrincipal component analysis (PCA) was done on tripli-cate data for each treatment at 9 dpi in order to visua-lize the overall genome response to nematode infectionin resistant and susceptible cowpea genotypes. PCA onconditions (treatments) for the 9-dpi sample are shownin Fig. 1. PCA component 1 (40.32% of total variance)and PCA component 2 (33.62% of total variance) com-prised the majority of the described variance (73.94%).The PCA showed a clear separation between the twogenotypes when infected with nematodes whereas thetwo genotypes clustered together when there was noexternal stimulus (non-infected control). Because weused cowpea near-isogenic lines for this analysis, clus-tering of the non-infected control samples was expected.This confirmed the robustness of the experimentaldesign. The PCA plot for 3-dpi samples is presented inadditional file 1.Because there were only two biological replicates for
the 3-dpi samples, a correlation analysis was performedbetween the two replicates of each treatment. A repre-sentative MA-scatter plot is shown in Fig. 2. Correlationcoefficients between replicates ranged from 0.932 to0.973 at a p value cut-off of 0.05, showing the
Das et al. BMC Genomics 2010, 11:480http://www.biomedcentral.com/1471-2164/11/480
Page 2 of 16

robustness of the data (correlation coefficients greaterthan 0.9 are considered to be high [25]).
Gene expression in incompatible and compatibleinteractions in 9-dpi root samplesAt 9 dpi three different comparisons were made. In thefirst comparison gene expression in the resistant CB46roots infected with root-knot nematodes (incompatibleinteraction) was compared with non-infected CB46. Sec-ondly, a comparison in gene expression was madebetween the infected null-Rk (compatible interaction)and non-infected null-Rk. Finally, a comparison of geneexpression was made between the infected Rk andinfected null-Rk near-isogenic lines. The final compari-son was important because the near-isogenic lines werepredicted to show differential gene expression for thegenes which are critical for nematode resistance ornematode parasitism.In the incompatible interaction 552 (~5.3% of total
expressed probe sets) genes were significantly
differentially expressed between the Rk-infected andnon-infected treatments based on the statistical test (seematerials and methods). These genes were then passedthrough a 1.5 fold-change filter. The geometric mean ofthe normalized expression intensities of all samplesunder one condition were used to calculate the fold-change ratios. If the ratio of geometric means of theinfected sample and the non-infected control for aprobe set was ≥ 1.5, then that particular probe set wascategorized as 1.5-fold or more up-regulated and if theratio was ≤ 0.67 then the probe set was categorized asdown-regulated by 1.5-fold or more. 141 genes showed1.5-fold or more up-regulation and 59 genes weredown-regulated by 1.5-fold or more in the Rk-infectedcompared with the Rk-non-infected treatment (Fig. 3aand 3b). In the compatible interaction 1,060 genespassed the statistical filter (~10% of total expressedprobe sets). Among these 1,060 genes 218 were 1.5-foldor more up-regulated and 41 genes were 1.5-fold ormore down-regulated in the infected null-Rk compared
Figure 1 Principal component analysis (PCA) plot of cowpea genome response to nematode infection. Each dot represents the mean ofa particular condition (treatment).
Das et al. BMC Genomics 2010, 11:480http://www.biomedcentral.com/1471-2164/11/480
Page 3 of 16

to the non-infected null-Rk treatment (Fig. 3a and 3b).In this context it can be noted that in the current studythe number of differentially expressed genes is lowerthan some of the other microarray studies previouslypublished in the field of plant-microbe interactions. Oneof the reasons may be due to the use of a heterologousGeneChip. Nevertheless, the information generated will
be very valuable as this is the first report on the cowpearoot-knot nematode interaction. In the final comparisonbetween the two near-isogenic lines infected with Rk-avirulent root-knot nematodes, 638 genes (~6% of totalexpressed probe sets) passed the statistical filter. Amongthe differentially expressed genes only 20 genes were1.5-fold or more up-regulated in the infected Rk than in
Figure 2 MA-scatter plot of all probe sets of two replicates of nematode infected resistant CB46 treatment at 3 dpi. The correlation wascalculated on normalized expression values. Top panel represents the invariant probe sets to calculate the median. In the bottom panel all theprobe sets were plotted around the median line.
Das et al. BMC Genomics 2010, 11:480http://www.biomedcentral.com/1471-2164/11/480
Page 4 of 16

the infected null-Rk treatment and 100 genes were 1.5-fold or more down-regulated in the infected Rk than inthe infected null-Rk treatment.Selected genes from all three above comparisons are
presented in Tables 1, 2 and 3 with their fold-changeratios and Medicago truncatula annotations. The geneswere selected based on their fold-change level assumingthat the genes with highest fold-change ratio will belikely to have a biological role in the plant-nematodeinteraction. Lists of all genes passing the 1.5-fold filterare provided in additional files 2, 3 and 4.A gene ontology based analysis was carried out to cate-gorize the differentially expressed genes into differentfunctional classes. In the incompatible interaction themost abundant functional class observed for the up-regulated probe sets (Fig. 4a) was genes involved inmetabolism (32.8%), followed by proteins with bindingfunction (28.8%) and genes involved in cell rescue anddefense (13.7%). In the compatible interaction the mostabundant functional classes in up-regulated probe sets(Fig. 4a) were metabolism (30.6%), proteins with bindingfunction (26.9%), and genes involved in protein fate(13.2%). For down-regulated probe sets the most abun-dant functional classes in the incompatible interaction(Fig. 4b) were proteins with binding function (39.2%),metabolism (21.5%), and interaction with the environ-ment (15.6%), whereas in the compatible interaction themost abundant classes (Fig. 4b) were proteins with bind-ing function (23.6%), cellular transport (18.4%), and sys-temic interaction with the environment (13.1%). Asignificant number of probe sets were also categorized
under unclassified or unknown proteins in all the abovecomparisons.Genes differentially expressed between the two
infected NILs were also functionally classified (Fig. 5). Inthe probe sets up-regulated in infected resistant CB46over infected susceptible null-Rk, the most abundantclasses were cellular transport (36.8%), proteins withbinding function (21%), and proteins involved in tran-scription (15.7%). Among the probe sets which weredown-regulated in the resistant genotype over the sus-ceptible genotype, the most abundant functional classeswere metabolism (35.1%), proteins with binding function(24.1%), and systemic interaction with the environment(10.9%).
Gene expression in incompatible and compatibleinteractions in 3-dpi root samplesSimilar to the 9-dpi samples, three different compari-sons were made for 3-dpi root samples. In the first com-parison gene expression in the resistant Rk plants(incompatible interaction) infected with root-knot nema-todes was compared with non-infected Rk plants. Acomparison in gene expression also was made betweenthe infected null-Rk (compatible interaction) and non-infected null-Rk. Finally, a comparison of gene expres-sion was made between the infected Rk and infectednull-Rk near-isogenic lines.In the incompatible interaction 746 (~6.9% of total
expressed probe sets) genes were significantly differen-tially expressed based on the statistical test. These geneswere then passed through a fold-change filter based on
110 18731
Incompa�ble Compa�ble
Up-regulated
54 36down-regulated
5
(i) (ii)(iii)
(i) (ii)(iii)
Incompa�bleCompa�ble
(a)
(b)
Figure 3 Venn diagram of differentially expressed genes in incompatible (resistant CB46) and compatible (susceptible null-Rk)interactions at 9 dpi. (a) Genes 1.5-fold or more up-regulated in incompatible (i) and compatible (ii) interactions and genes overlappingbetween both interactions (iii). (b) Genes 1.5-fold or more down-regulated in incompatible (i) and compatible (ii) interactions and genesoverlapping between both interactions (iii).
Das et al. BMC Genomics 2010, 11:480http://www.biomedcentral.com/1471-2164/11/480
Page 5 of 16
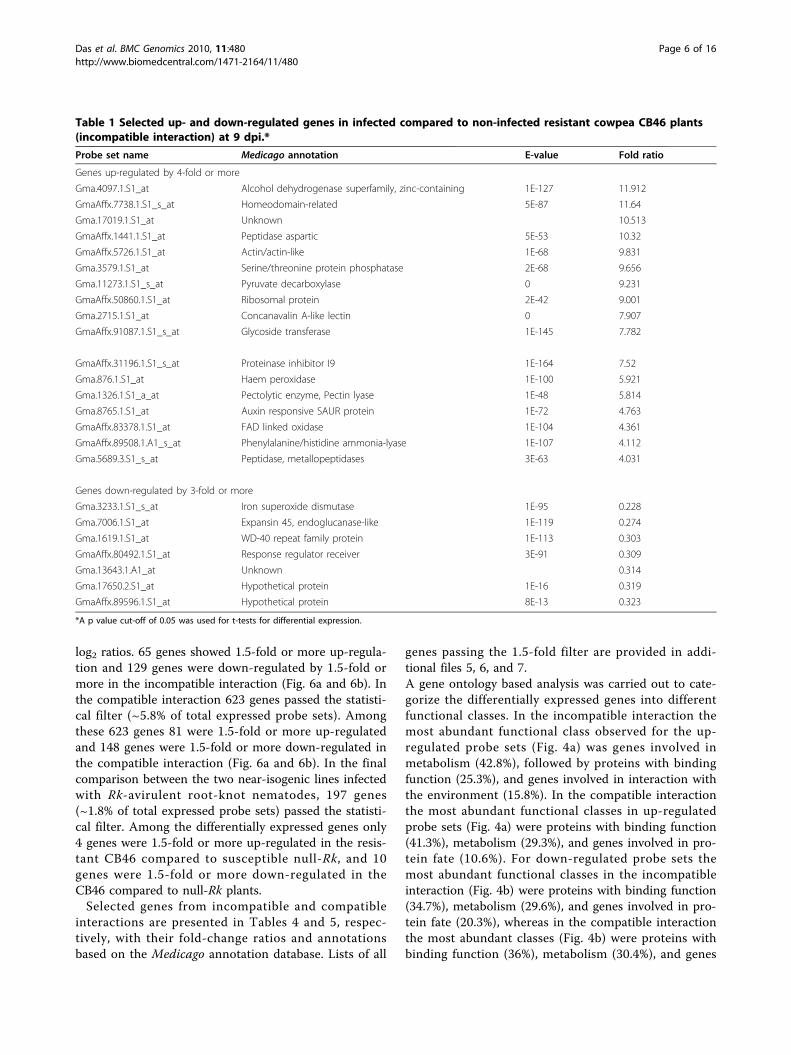
log2 ratios. 65 genes showed 1.5-fold or more up-regula-tion and 129 genes were down-regulated by 1.5-fold ormore in the incompatible interaction (Fig. 6a and 6b). Inthe compatible interaction 623 genes passed the statisti-cal filter (~5.8% of total expressed probe sets). Amongthese 623 genes 81 were 1.5-fold or more up-regulatedand 148 genes were 1.5-fold or more down-regulated inthe compatible interaction (Fig. 6a and 6b). In the finalcomparison between the two near-isogenic lines infectedwith Rk-avirulent root-knot nematodes, 197 genes(~1.8% of total expressed probe sets) passed the statisti-cal filter. Among the differentially expressed genes only4 genes were 1.5-fold or more up-regulated in the resis-tant CB46 compared to susceptible null-Rk, and 10genes were 1.5-fold or more down-regulated in theCB46 compared to null-Rk plants.Selected genes from incompatible and compatible
interactions are presented in Tables 4 and 5, respec-tively, with their fold-change ratios and annotationsbased on the Medicago annotation database. Lists of all
genes passing the 1.5-fold filter are provided in addi-tional files 5, 6, and 7.A gene ontology based analysis was carried out to cate-gorize the differentially expressed genes into differentfunctional classes. In the incompatible interaction themost abundant functional class observed for the up-regulated probe sets (Fig. 4a) was genes involved inmetabolism (42.8%), followed by proteins with bindingfunction (25.3%), and genes involved in interaction withthe environment (15.8%). In the compatible interactionthe most abundant functional classes in up-regulatedprobe sets (Fig. 4a) were proteins with binding function(41.3%), metabolism (29.3%), and genes involved in pro-tein fate (10.6%). For down-regulated probe sets themost abundant functional classes in the incompatibleinteraction (Fig. 4b) were proteins with binding function(34.7%), metabolism (29.6%), and genes involved in pro-tein fate (20.3%), whereas in the compatible interactionthe most abundant classes (Fig. 4b) were proteins withbinding function (36%), metabolism (30.4%), and genes
Table 1 Selected up- and down-regulated genes in infected compared to non-infected resistant cowpea CB46 plants(incompatible interaction) at 9 dpi.*
Probe set name Medicago annotation E-value Fold ratio
Genes up-regulated by 4-fold or more
Gma.4097.1.S1_at Alcohol dehydrogenase superfamily, zinc-containing 1E-127 11.912
GmaAffx.7738.1.S1_s_at Homeodomain-related 5E-87 11.64
Gma.17019.1.S1_at Unknown 10.513
GmaAffx.1441.1.S1_at Peptidase aspartic 5E-53 10.32
GmaAffx.5726.1.S1_at Actin/actin-like 1E-68 9.831
Gma.3579.1.S1_at Serine/threonine protein phosphatase 2E-68 9.656
Gma.11273.1.S1_s_at Pyruvate decarboxylase 0 9.231
GmaAffx.50860.1.S1_at Ribosomal protein 2E-42 9.001
Gma.2715.1.S1_at Concanavalin A-like lectin 0 7.907
GmaAffx.91087.1.S1_s_at Glycoside transferase 1E-145 7.782
GmaAffx.31196.1.S1_s_at Proteinase inhibitor I9 1E-164 7.52
Gma.876.1.S1_at Haem peroxidase 1E-100 5.921
Gma.1326.1.S1_a_at Pectolytic enzyme, Pectin lyase 1E-48 5.814
Gma.8765.1.S1_at Auxin responsive SAUR protein 1E-72 4.763
GmaAffx.83378.1.S1_at FAD linked oxidase 1E-104 4.361
GmaAffx.89508.1.A1_s_at Phenylalanine/histidine ammonia-lyase 1E-107 4.112
Gma.5689.3.S1_s_at Peptidase, metallopeptidases 3E-63 4.031
Genes down-regulated by 3-fold or more
Gma.3233.1.S1_s_at Iron superoxide dismutase 1E-95 0.228
Gma.7006.1.S1_at Expansin 45, endoglucanase-like 1E-119 0.274
Gma.1619.1.S1_at WD-40 repeat family protein 1E-113 0.303
GmaAffx.80492.1.S1_at Response regulator receiver 3E-91 0.309
Gma.13643.1.A1_at Unknown 0.314
Gma.17650.2.S1_at Hypothetical protein 1E-16 0.319
GmaAffx.89596.1.S1_at Hypothetical protein 8E-13 0.323
*A p value cut-off of 0.05 was used for t-tests for differential expression.
Das et al. BMC Genomics 2010, 11:480http://www.biomedcentral.com/1471-2164/11/480
Page 6 of 16

Table 2 Selected up- and down-regulated genes in infected compared to non-infected susceptible null-Rk cowpeaplants (compatible interaction) at 9 dpi.*
Probe set name Medicago annotation E-value Fold ratio
Genes up-regulated by 4-fold or more
GmaAffx.8712.1.S1_s_at Haem peroxidase 1E-130 10.98
Gma.17805.1.A1_s_at Haem peroxidase 7E-47 9.492
Gma.289.1.S1_s_at Alpha/beta hydrolase 1E-107 8.21
GmaAffx.20156.1.S1_s_at Glycoside hydrolase 4E-96 6.855
GmaAffx.7738.1.S1_s_at Homeodomain-related 5E-87 6.594
Gma.4674.1.A1_at Esterase/lipase/thioesterase 3E-12 4.573
Gma.8525.1.S1_s_at Haem peroxidase 1E-156 4.351
Gma.2446.1.S1_a_at Rhodanese-like 5E-08 4.26
GmaAffx.84607.2.S1_at Phosphate-induced protein 1 2E-19 4.09
Genes down-regulated by 2-fold or more
GmaAffx.89665.1.A1_s_at Hypothetical protein 4E-64 0.273
GmaAffx.47611.1.S1_s_at Pollen Ole e 1 allergen 3E-70 0.42
Gma.4750.1.S1_at Protein of unknown function 4E-56 0.429
GmaAffx.6711.1.S1_at Auxin Efflux Carrier 8E-61 0.439
Gma.3429.1.S1_at Dehydrogenase, E1 component 1E-158 0.464
GmaAffx.20418.1.A1_s_at Similar to unknown protein [Arabidopsis thaliana] 1E-19 0.5
*A p value cut-off of 0.05 was used for t-tests for differential expression.
Table 3 Selected up- and down-regulated genes in infected resistant (CB46) when compared to infected susceptible(null-Rk ) cowpea plants at 9 dpi.*
Probe set name Medicago annotation E-value Fold ratio
Select up-regulated genes
GmaAffx.89665.1.A1_s_at Hypothetical protein 4E-64 2.605
GmaAffx.89786.1.A1_s_at Hypothetical protein 4E-43 2.343
GmaAffx.76516.1.S1_at Major facilitator superfamily 2E-21 2.165
GmaAffx.6711.1.S1_at Auxin Efflux Carrier 8E-61 2.07
GmaAffx.46592.1.S1_s_at Rhamnogalacturonate lyase 6E-67 1.905
Gma.10150.1.A1_at 2OG-Fe(II) oxygenase 3E-51 1.806
Gma.17019.1.S1_at Unknown 1.804
Gma.5057.1.S1_a_at Ubiquinol cytochrome reductase transmembrane region 1E-124 1.798
GmaAffx.42856.1.S1_at Peptidase S10, serine carboxypeptidase 1E-40 1.693
GmaAffx.31196.1.S1_s_at Proteinase inhibitor I9 1E-164 1.687
Select down-regulated genes
Gma.289.1.S1_s_at Alpha/beta hydrolase 3E-75 0.124
Gma.3233.1.S1_s_at Iron superoxide dismutase 1E-95 0.152
GmaAffx.8712.1.S1_s_at Peroxidase, putative 1E-130 0.221
Gma.17805.1.A1_s_at Haem peroxidase 7E-47 0.232
GmaAffx.91763.1.S1_s_at Xyloglucan endo-transglycosylase 1E-155 0.243
Gma.8525.1.S1_s_at Haem peroxidase 1E-156 0.279
Gma.2801.1.S1_at Glycoside hydrolase 1E-124 0.29
Gma.9086.2.S1_at Cellulose synthase 5E-74 0.3
Gma.1955.4.S1_a_at Photosystem II oxygen evolving complex protein 3E-13 0.312
Gma.2446.1.S1_a_at Rhodanese-like 5E-8 0.318
*A p value cut-off of 0.05 was used for t-tests for differential expression.
Das et al. BMC Genomics 2010, 11:480http://www.biomedcentral.com/1471-2164/11/480
Page 7 of 16

involved in transcription (14.4%). A significant numberof probe sets were also categorized under unclassified orunknown proteins in all the above comparisons.
Comparison of gene expression between 9-dpi and 3-dpiroot samplesA comparison of differentially expressed genes wasmade between the 9-dpi and 3-dpi samples. In theincompatible interaction 188 genes (137 up-regulated by
1.5-fold or more and 51 down-regulated 1.5-fold ormore) were uniquely expressed at 9 dpi and 182 (62 up-regulated by 1.5-fold or more and 120 down-regulated1.5-fold or more) genes were unique for 3 dpi. 12 geneswere differentially expressed at both time points (addi-tional file 8). In the compatible interaction 238 genes(198 up-regulated by 1.5-fold or more and 40 down-regulated 1.5-fold or more) were uniquely expressed at9 dpi and 208 genes (61 up-regulated by 1.5-fold or
0 5 10 15 20 25 30 35 40 45
METABOLISMENERGY
CELL CYCLE AND DNA PROCESSINGTRANSCRIPTIONPROTEIN FATE
PROTEIN WITH BINDING FUNCTIONCELLULAR TRANSPORT
SIGNAL TRANSDUCTIONDEFENSE RELATED
INTERACTIONWITH THE ENVIRONMENTSYSTEMIC INTERACTIONWITH THE ENVIRONMENT
BIOGENESIS OF CELLULAR COMPONENTSDEVELOPMENT
CELL FATEUNCLASSIFIED PROTEINS
Compa�ble (3dpi)
Incompa�ble (3dpi)
Compa�ble (9dpi)
Incompa�ble (9dpi)
% down-regulated
(a)
(b)
% up-regulated
Figure 4 Functional classification of up- and down-regulated genes in compatible and incompatible cowpea-RKN interactions basedon MIPS using homologous sequence of Arabidopsis. Only the main functional categories are listed. (a) 1.5-fold or more up-regulated genesin both 9- and 3-dpi samples, (b) 1.5-fold or more down-regulated genes in both 9- and 3-dpi samples.
Das et al. BMC Genomics 2010, 11:480http://www.biomedcentral.com/1471-2164/11/480
Page 8 of 16

0 10 20 30 40
METABOLISM
ENERGY
CELL CYCLE AND DNA PROCESSING
TRANSCRIPTION
PROTEIN FATE
PROTEIN WITH BINDING FUNCTION
CELLULAR TRANSPORT
SIGNAL TRANSDUCTION
DEFENSE RELATED
INTERACTIONWITH THE ENVIRONMENT
SYSTEMIC INTERACTIONWITH THE ENVIRONMENT
BIOGENESIS OF CELLULAR COMPONENTS
DEVELOPMENT
CELL FATE
UNCLASSIFIED PROTEINSDown-regulatedUp-regulated
Percent genesFigure 5 Functional classification of genes differentially expressed between infected CB46 (resistant) and infected null-Rk (susceptible)cowpea roots at 9 dpi, based on MIPS using homologous sequence of Arabidopsis. Only the main functional categories are listed.
63 7931
Incompa�ble Compa�ble
Up-regulated
116 135down-regulated
13
(i) (ii)(iii)
(i) (ii)(iii)
Incompa�ble Compa�ble
(a)
(b)
Figure 6 Venn diagram of differentially expressed genes in incompatible (resistant CB46) and compatible (susceptible null-Rk)interactions at 3 dpi. (a) Genes 1.5-fold or more up-regulated in incompatible (i) and compatible (ii) interactions and genes overlappingbetween both interactions (iii). (b) Genes 1.5-fold or more down-regulated in incompatible (i) and compatible (ii) interactions and genesoverlapping between both interactions (iii).
Das et al. BMC Genomics 2010, 11:480http://www.biomedcentral.com/1471-2164/11/480
Page 9 of 16

more and 147 down-regulated 1.5-fold or more) wereunique for 3 dpi. 21 genes were differentially expressedat both time points (additional file 9).
DiscussionRecently a number of interspecies comparisons of geneexpression have been carried out including human ver-sus monkeys [26,27], between rodents [28], human ver-sus mouse [29], within Xenopus [30], and withinDrosophila [31]. Cross-species analysis of gene expres-sion in non-model mammals was reported by Nieto-Díaz et al. [32]. The reproducibility of probe dataobtained from hybridizing deer, Old-World primates,and human RNA samples to the Affymetrix humanGeneChip® U133 Plus 2.0 was also compared. The stu-dies showed that cross-species hybridization affectedneither the distribution of the hybridization reproduci-bility among different categories nor the reproducibil-ity values of the individual probes. In plants, the use ofheterologous platforms for transcriptome profiling alsois becoming more popular. Recently the AffymetrixArabidopsis GeneChip was used to analyze geneexpression during seed germination in Brassica [33].The Affymetrix tomato GeneChip was used to surveythe early events associated with the potato tuber coldsweetening [34]. The usefulness of the soybean genomearray to study cowpea was shown when the Affymetrixsoybean GeneChip was used successfully to identify
and validate single feature polymorphisms in cowpea[12].Several microarray studies have been conducted to
elucidate the molecular mechanism of the root-knotnematode infection process. Bar-Or et al. [15] reporteda transcriptome profile of the compatible interaction insusceptible tomato roots infected with root-knot nema-todes. Jammes et al. [13] and Fuller et al. [14] havedone similar studies in Arabidopsis infected with root-knot nematodes. Several GeneChip microarray studieshave also been made recently to investigate the infectionprocess by soybean cyst nematode, Heterodera glycines[17,22,20,21].Microarray studies available so far in the area of plant-
nematode interactions mostly examined the compatibleor susceptible interaction. There is a dearth of informa-tion available for the incompatible plant-root-knotnematode interaction. Very recently Bhattarai et al. [16]reported the expression profile of Mi-1-mediated incom-patible interaction in tomato roots infected with root-knot nematodes. They reported the gene expression pro-file for only one time point, as early as 24 hours-postinoculation. Incompatible interactions have been moni-tored for soybean cyst nematode by Klink et al. [23,24]for two time points. In our study both compatible andincompatible interactions were studied using the soy-bean genome array. This is the first insight into thecowpea-root-knot interaction at the transcriptome level.
Table 4 Selected up- and down-regulated genes in infected compared to non-infected resistant CB46 cowpea plants(incompatible interaction) at 3 dpi.*
Probe set name Medicago annotation E-value Fold ratio
Genes up-regulated by 3-fold or more
Gma.1555.1.S1_a_at Early light-inducable protein 5E-58 5.126
Gma.18079.1.S1_s_at Protein kinase 7E-82 4.692
Gma.7289.1.S1_at Glycosyl transferase 2E-36 4.091
Gma.289.1.S1_s_at Hydrolase, alpha/beta 3E-75 4.039
GmaAffx.47649.1.S1_at S-adenosyl-L-methionine:carboxyl methyltransferase 1E-78 3.64
Gma.7224.1.S1_at C-terminal; Protein kinase 3E-82 3.499
Gma.12211.2.S1_at Phytochelatin synthetase-like 2E-48 3.463
Gma.8441.1.S1_at Copper-resistance protein 0 3.263
Genes down-regulated by 2.5-fold or more
GmaAffx.92973.1.S1_s_at hypothetical protein 3E-15 0.209
GmaAffx.80492.1.S1_at Response regulator receiver 3E-91 0.22
Gma.2313.2.S1_s_at Aluminum-induced protein 9E-91 0.273
Gma.10406.1.S1_a_at Hypothetical protein 2E-81 0.325
GmaAffx.81362.1.S1_at Endoglucanase-like 7E-60 0.326
GmaAffx.55568.1.S1_at Histidine kinase related protein 5E-70 0.332
Gma.5992.2.S1_at Aldehyde dehydrogenase 2E-67 0.334
GmaAffx.57046.1.S1_at Zinc finger, RING-type 1E-63 0.378
Gma.3712.1.S1_s_at AKIN gamma - Medicago 0 0.38
*A p value cut-off of 0.05 was used for t-tests for differential expression.
Das et al. BMC Genomics 2010, 11:480http://www.biomedcentral.com/1471-2164/11/480
Page 10 of 16

It has already been shown in related work that Rk-mediated resistance in cowpea is characterized by a verydelayed but strong and effective resistance response [8].For this study the 9-dpi time point was critical
because histologically there are some subtle observabledifferences between compatible and incompatible inter-action at 9 dpi. Though the nematodes were able tomaintain normal giant cells in resistant roots at 9 dpi,more vacuolation was evident for the first time in thosegiant cells when compared to the giant cells in the sus-ceptible roots at the same stage [8]. Among the highlyup-regulated genes in the incompatible interaction at 9dpi was an alcohol dehydrogenase (Adh). Adh genes arewidely known to respond to different biotic stimuli likefungal elicitors [35] and cyst nematodes [20]. Thisresponse leads to heavy lignification of cell walls andcreates a mechanical barrier for the pathogen. In ricethe sequence of 340 kb surrounding the two Adh geneloci Adh1 and Adh2 revealed the presence of 33 putativegenes, several of them being resistance gene analogues[36]. Also, among highly up-regulated genes there was aserine threonine protein phosphatase which is known toplay a role in negative regulation of defense response inArabidopsis [37]. Also several plant lectins were highlyup-regulated in the incompatible interaction at 9 dpi.Plant lectins are carbohydrate binding proteins whichare reported to be toxic to several plant pathogens [38].These findings are consistent with the indications madeby Das et al. [8] that the vacuoles of giant cells in the
resistant genotype might be loaded with certain toxinswhich leads to developmental and reproductive arrest ofthe female nematode. Among the down-regulated genesin the incompatible interaction was a superoxide dismu-tase which generates super oxides [39]. Down-regulationof this gene in the plant prevents reactive oxygen spe-cies-mediated cell death which is combined with up-reg-ulation of peroxidases (involved in breakdown of H2O2)in both incompatible and compatible interactions. Theseresults are consistent with the absence of hypersensitiveresponse (HR)-mediated cell death in the Rk-RKNincompatible interaction in cowpea [8]. In the incompa-tible interaction an expansin was highly down-regulated,and expansins are found to be important for maintain-ing the specialized feeding structures in hosts by plantparasitic nematodes [23,24]. These findings may indicatethat though there is a visible effect of resistance at 9 dpias indicated by increased vacuolation, the plant is ableto generate some defense response against the nematodefeeding but the nematode is able to partially suppressthe plant defense at this time and continue feeding anddevelopment.When the response of the two near-isogenic lines
infected with nematodes was compared at 9 dpi, it wasespecially noteworthy that a greater number of geneswere suppressed in the resistant genotype than wereinduced or up-regulated compared to the susceptiblegenotype. This observation is novel because typically insuch comparisons more genes are up-regulated than
Table 5 Selected up- and down-regulated genes in infected compared to non-infected susceptible null-Rk cowpeaplants (compatible interaction) at 3 dpi.*
Probe set name Medicago annotation E-value Fold ratio
Genes up-regulated by 3-fold or more
Gma.5785.2.S1_at Glycoside transferase 3E-32 7.464
GmaAffx.84607.2.S1_at Phosphate-induced protein 2E-19 4.498
Gma.6152.1.S1_at Multicopper oxidase 2E-98 3.569
GmaAffx.60283.1.S1_at Zinc finger, RING-type 2E-36 3.416
Gma.15048.2.S1_at Zinc finger, RanBP2-type 8E-35 3.409
Gma.16367.2.S1_a_at Ras GTPase 2E-94 3.406
GmaAffx.33748.1.S1_at Translation factor 1E-76 3.335
GmaAffx.84607.1.S1_at Phosphate-induced protein 1 3E-24 3.146
Genes down-regulated by 3-fold or more
Gma.10580.2.S1_a_at PDS1 (phytoene desaturation 1) 1E-106 0.195
Gma.1746.1.S1_s_at Isocitrate lyase and phosphorylmutase 7E-9 0.265
Gma.2079.3.S1_at Adenosine/AMP deaminase 1E-158 0.268
Gma.4182.1.S1_s_at CMP/dCMP deaminase, zinc-binding 9E-89 0.294
Gma.10456.2.S1_a_at Zinc finger, CCHC-type 1E-161 0.302
GmaAffx.89665.1.A1_s_at Hypothetical protein 4E-64 0.303
GmaAffx.80492.1.S1_at Response regulator receiver 3E-91 0.306
GmaAffx.89425.1.A1_s_at Hypothetical protein 4E-24 0.312
*A p value cut-off of 0.05 was used for t-tests for differential expression.
Das et al. BMC Genomics 2010, 11:480http://www.biomedcentral.com/1471-2164/11/480
Page 11 of 16

down-regulated in infected resistant plants compared toinfected susceptible plants. For example, more geneswere induced in the resistant genotype when near-iso-genic lines were compared in sugarcane mosaic virusinfected maize plants [40] and in wheat plants infectedwith leaf rust fungus [41]. A plausible explanation forthis observation in line with the delayed resistanceresponse is that the defense machinery in the resistantcowpea plant is still suppressed to a large extent and asa result the feeding nematodes are able to maintainfunctional giant cells even at the 9-dpi stage.At 3 dpi in both compatible and incompatible interac-
tions, more genes were down-regulated than up-regu-lated. Jammes et al. [13] also reported that there were asignificant number of genes down-regulated duringgiant cell formation in Arabidopsis roots, indicating thatthese suppressed genes might be important negative reg-ulators of nematode parasitism. Though in both incom-patible and compatible interactions at 3 dpi there aremany induced genes involved in basal defense, only afew genes were common in both interactions. This indi-cates that despite the similar nature of the infection pro-cess in both compatible and incompatible interactions,these two responses have their own molecular signature,unlike Mi-1 mediated resistance to RKN in tomato inwhich many genes are shared between the incompatibleand compatible interactions [16]. When expression pat-terns from both time points were compared we foundthat there were very few genes which were differentiallyexpressed in both the 3-dpi and 9-dpi samples. Thesubtle variation in expression of these genes across timepoints might play a significant role in this biologicalpathway. For example, an expansin 45 family member(GmaAffx.81362.1.S1_at) was differentially expressed inboth 3- and 9-dpi incompatible interactions. At bothtime points this particular gene was suppressed but thelevel of suppression was more in the 3-dpi sample whencompared to the 9-dpi sample. It is already establishedthat expansin plays a role in feeding site maintenance inboth cyst nematode induced syncytia [23,24] and root-knot nematode induced giant cells [16]. Several expan-sins were found to be up-regulated in syncitia developedby sugarbeet cyst nematode Heterodera schachtii in Ara-bidopsis [42]. These subtle variances in gene expressionlevels might lead to the manifestation of the defenseresponse, and represent areas warranting further investi-gation through functional analysis.
ConclusionsIn conclusion the results of this study have shown thatthe typical defense response is still partially suppressedat 9 dpi in resistant cowpea roots. There is an indicationthat subtle variation of ROS concentration, induction oftoxins and other defense related genes play a role in this
unique resistance mechanism. It is clear from this studythat nematodes are able to keep plant defense responsesunder considerable control until a high amount of tox-ins accumulate in the vacuoles which might haveresulted from switching on of the plant defense machin-ery. One of the possible strategies applied by the nema-tode might be to control the ROS scavengingmechanism in the plants to avoid localised cell death. InMi-1-mediated defense response the nematode is unableto regulate the ROS scavenging and as a result a rapidhypersensitive reaction is triggered upon nematodeinfection. Further functional analysis of these differen-tially expressed genes will help us to understand thisintriguing plant-nematode interaction in a more precisemanner.
MethodsPlant materialTwo near-isogenic lines (NIL) differing in presence orabsence of gene Rk were used. The two parents used todevelop the NIL were M. incognita race 3 resistant cow-pea genotype ‘CB46’ (homozygous resistant, RkRk) and ahighly susceptible genotype ‘Chinese Red’ (homozygoussusceptible, rkrk). The F1 was backcrossed to recurrentparent CB46 (BC1), homozygous Rk plants were dis-carded in BC1F2, and non-segregating rkrk plants wereadvanced to the next back-cross (BC2). Repeated back-crossing and selection was used to recover the rkrk linein the CB46 background. BC6F4 progenies were used forall the experiments described here. The rkrk line isreferred to as the null-Rk line from here on.
Nematode inoculumEggs of M. incognita race 3 (isolate Beltran) cultured onsusceptible tomato host plants were extracted fromroots using 10% bleach solution [43]. This isolate isavirulent to gene Rk in CB46. Eggs were hatched in anincubator at 28°C and J2 were collected in fresh deio-nized water. The J2 inoculum was prepared accordingto the experimental requirements.
Root infections for microarray analysisSeeds of CB46 and null-Rk cowpea lines were surface-sterilized using 10% (v/v) bleach solution and plantedsingly in seedling growth pouches. Plants were grownunder controlled environmental conditions of 26.7°C ±0.5°C constant temperature and daily light/dark cyclesof 16/8 hours. This temperature was used because it lieswithin the optimum temperature range of 26 - 28°C fordevelopment and reproduction of M. incognita on cow-pea in growth pouches [44]. Each of 100 pouches (50pouches for each genotype) was inoculated with 3000 J2in 5 ml of deionized water 12 days after planting (dap).This inoculum level was found to be optimum in a
Das et al. BMC Genomics 2010, 11:480http://www.biomedcentral.com/1471-2164/11/480
Page 12 of 16

previous study (Das and Roberts, unpublished data) andit generated uniform infection throughout the root sys-tem. As a result the amount of infected tissue was maxi-mized. An equal number of pouches were mock-inoculated with 5 ml of deionized water to use as non-infected controls. Infected and non-infected plants werearranged in a completely randomized design. Nematodeinfected root tissue was excised using a sterile scalpel at3 days post-inoculation (dpi) and 9 dpi, respectively,under a magnifying glass and flash frozen immediatelyin liquid nitrogen. In previous studies (Das and Roberts,unpublished) the infected root regions showed swellingat 3 dpi which is indicative of initiation of giant cell for-mation, and at 9 dpi prominent galling was visible oninfected roots. The infected tissue was collected basedon these visual indicators. For each biological replicateinfected tissue was collected from 7 plants picked ran-domly and pooled together. This was done in order toobtain enough biological material for RNA isolation.Similarly root tissue was collected from equivalent rootregions of the control plants (tissue near root tips ofsecondary and tertiary roots) and flash frozen. Galledtissue was excised by cutting immediately adjacent tothe root-gall in order to minimize the amount of non-infected tissue included in the assays. The harvested tis-sue was stored at -80°C until RNA isolation. A fewinfected root pieces were stained in acid fuchsin [45] toconfirm the nematode infection.
RNA isolationRNA from nematode infected and non-infected root tis-sue was isolated using RNeasy plant mini kit (QIAGENInc., Valencia, CA, USA) according to the manufacturer’sprotocol. One volume of Plant RNA Isolation Aid(Ambion, Austin, TX, USA) per unit mass of frozen tis-sue (ml/g) was added before the tissue homogenizationstep for removal of common contaminants such as poly-saccharides and polyphenolics. RNA was treated withRNase-Free DNase set (QIAGEN Inc., Valencia, CA,USA) to digest any genomic DNA which might be pre-sent. RNA was quantified using a UV-spectrophotometer.RNA quality and integrity was examined using RNA Lab-On-A-Chip (Caliper Technologies Corp., MountainView, CA, USA) evaluated on an Agilent Bioanalyzer2100 (Agilent Technologies, Palo Alto, CA, USA).
Soybean genome arrayPhylogenetic relationships based on the conservedsequences within Papilionoideae legumes imply thatVigna (cowpea) is closely related to soybean [46]. Sincea commercial cowpea genome array was not available, asoybean genome array (Affymetrix Inc., Santa Clara, CA,USA) was used for transcriptome profiling in cowpea.The soybean genome array contains 37,500 probe sets
derived from soybean (Glycine max L.) unigenes. Thisrepresents 61% of the total probe sets on the chip, withthe remainder targeting two pathogens important forsoybean research, of which 15,800 (26%) probe sets tar-get Phytophthora sojae (a water mold) and 7,500 (12%)probe sets target Heterodera glycines (soybean cystnematode). This array uses probe sets composed of 11probe pairs to measure the expression of each gene.Each probe pair consists of a perfect match (PM) probeand a mismatch (MM) probe (see also http://www.affy-metrix.com/products_services/arrays/specific/soybean.affx).
Array hybridizationDouble-stranded complementary deoxyribonucleic acid(cDNA) was synthesized using SuperScript Double-Stranded cDNA Synthesis Kit (Invitrogen) and T7-oligo(dT) promoter primers. The IVT Labeling Kit (Affymetrix)was then used to synthesize biotin-labeled complementaryRNA (cRNA) from template cDNA by in vitro transcrip-tion. Twelve to 16 μg labeled cRNA was fragmented bymetal-induced hydrolysis to 35-200 base fragments follow-ing Affymetrix protocols. 10 μg labeled, fragmented cRNAwas then hybridized at 45°C with rotation for 16 h in anAffymetrix microarray Hybridization Oven 320 on Affy-metrix soybean genome arrays. The arrays were washedand stained using streptavidin phycoerythrin on an Affy-metrix Fluidics Station 450. The arrays were scanned on aHewlett-Packard GeneArray scanner. cRNA synthesis andarray hybridizations were performed in the GenomicsCore Facility http://www.genomics.ucr.edu at the Univer-sity of California, Riverside.
Data analysisFor 9-dpi samples three biological replicates were usedfor each of the four treatments (Rk infected and non-infected, and Rk-null infected and non-infected), requir-ing 12 soybean GeneChips. For the 3-dpi samples twobiological replicates were used for each treatmentrequiring 8 GeneChips. The data from all 20 chips (CELand CHP files) are publicly available in Gene ExpressionOmnibus (http://www.ncbi.nlm.nih.gov/geo/, platformGPL 4592, series GS13631). Expression signals were firstanalyzed in GeneChip operating software 1.3 (GCOS,Affymetrix Inc.) to determine the “present” probe setlist. To detect “present” calls using GCOS software weused all the probe pairs in the probe set as “stat pairs”.The definition of the term “stat pairs” is the number ofprobe pairs per probe set used in the analysis. Duringdata analysis a specified subset of probe pairs can beselected by a probe mask file, but if the default settingsare used no probe mask file will be applied and all theprobe pairs will be used as “stat pairs” (11 probe pairsin the case of the soybean GeneChip). The detection
Das et al. BMC Genomics 2010, 11:480http://www.biomedcentral.com/1471-2164/11/480
Page 13 of 16

algorithm uses probe pair intensities to generate adetection p-value and assign a “present”, “marginal”, or“absent” call. Each probe pair in a probe set has apotential vote in determining whether the measuredtranscript is or is not “present”. The vote is described bythe discrimination score (R), which is calculated foreach probe pair and compared to a predefined thresh-old, Tau. Probe pairs with R higher than Tau vote “pre-sent” and the voting result is summarized as a p-value.The greater the number of discrimination scores (R)that are above Tau, the smaller the p-value and themore likely the given transcript is truly present in thesample. Only probe sets with a “present” call in all threereplicates of at least one treatment were considered tobe “expressed”.Data normalization and further analysis was carried
out in GeneSpring GX 7.3 (Agilent Technologies, PaloAlto, CA, USA). Robust Multiarray Average (RMA,[47,48]) normalization was performed. Each chip wasnormalized to the 50th percentile and each gene wasnormalized to the median. As we were only interestedin plant response to nematode infection, all the probeset data from P. sojae and H. glycines were excludedfrom any further analysis.Principal component analysis (PCA) is often used to
reduce multidimensional data sets to lower dimensionsfor summarizing the most important part of the datawhile simultaneously filtering out the background errors.PCA involves the calculation of the eigenvalue decom-position of a data covariance matrix or singular valuedecomposition of a data matrix, usually after mean cen-tering the data for each attribute. The results of PCAare usually discussed in terms of component scores andloadings [49]. PCA on conditions (treatments) based onall genes which were present in at least one chip in the9-dpi and 3-dpi samples were carried out to visualizethe overall genome response to nematode infection inthe resistant and susceptible cowpea genotypes.For the 3-dpi samples, with only two biological repli-
cates available, a Pearson correlation coefficient was cal-culated for normalized values of all probe sets betweenthe two replicates of each treatment to determine therobustness of the data. This analysis was carried out indChip software [50].Differentially expressed genes were identified using a
one-way analysis of variance (ANOVA) with a p-valuecut-off of 0.05. A multiple testing correction was per-formed using the Bonferroni error correction model[51]. False discovery rate (FDR) was set at 5.0%. Subse-quently, differentially expressed genes were filtered for1.5-fold change in expression level between the controland nematode infected treatment for both genotypesand also between the nematode infected treatments ofthe resistant and susceptible genotypes.
Validation of the use of Affymetrix soybean genomearray for cowpea transcriptional profilingIn our recent related work [12] the Affymetrix soybeangenome array was used successfully to identify singlefeature polymorphisms in cowpea and the statisticaldata were validated using PCR amplicon sequencing.Thus, we were able to correctly identify polymorphismsbetween two cowpea genotypes at a resolution as highas the single nucleotide level. Also, we conducted asmall analysis to look at the sequence homologybetween sequence information files (SIF) of 30 probesets selected to carry out PCR validation of predictedSFPs and their corresponding cowpea sequences. Thehomology ranged from 87% to as high as 94.5%. Thoughthis analysis is not exhaustive, it provided a good indica-tion that the homology between cowpea and soybeangenomes is quite high at least in the SIF regions fromwhere the probe sets were designed. For this work RNAwas used as surrogate for genomic DNA. These dataestablished that the soybean probe sets faithfully mea-sure cowpea transcripts, validating the general reliabilityof the soybean-based platform for cowpea.
Annotations and functional classification of genesThe soybean genome array unigene sequences wereused to query (using blastx) Arabidopsis translated genemodels (version 7.0) from The Arabidopsis InformationResource (TAIR, http://www.arabidopsis.org) and Medi-cago truncatula 2.0 assembly release http://www.medi-cago.org. Annotations for the Affymetrix soybean probesets were compiled into a browser called HarvEST:Soy-Chip which can be accessed online http://www.harvest-web.org or downloaded for Windows installation http://harvest.ucr.edu/. The E value cut-off for the gene anno-tations was equal to or less than E-10, E0 being a nearperfect match.Gene ontology based classification was obtained by
transferring the corresponding Arabidopsis gene modelsto Munich Information Center for Protein SequencesArabidopsis thaliana FunCat database (MIPS, http://mips.gsf.de/proj/funcatDB/search_main_frame.html).Arabidopsis gene models were taken from HarvEST:SoyChip.
Additional material
Additional file 1: Principal component analysis (PCA) plot ofcowpea genome response to nematode infection at 3 days post-inoculation. Each dot represents the mean of a particular condition(treatment).
Additional file 2: Genes passing 1.5-fold filter in the incompatiblecowpea-RKN interaction (9 days post-inoculation).
Additional file 3: Genes passing 1.5-fold filter in the compatiblecowpea-RKN interaction (9 days post-inoculation).
Das et al. BMC Genomics 2010, 11:480http://www.biomedcentral.com/1471-2164/11/480
Page 14 of 16

Additional file 4: Genes passing 1.5-fold filter in infected Rkcompared to the infected null-Rk (9 days post-inoculation).
Additional file 5: Genes passing 1.5-fold filter in the incompatiblecowpea-RKN interaction (3 days post-inoculation).
Additional file 6: Genes passing 1.5-fold filter in the compatiblecowpea-RKN interaction (3 days post-inoculation).
Additional file 7: Genes passing 1.5-fold filter in infected Rkcompared to the infected null-Rk (3 days post-inoculation).
Additional file 8: Genes differentially expressed in both 9- and3-dpi samples in cowpea-RKN incompatible interaction.
Additional file 9: Genes differentially expressed in both 9- and3-dpi samples in cowpea-RKN compatible interaction.
AcknowledgementsThe authors thank William Matthews for technical assistance, Dr. David Fangand Barbara Walter for array hybridizations, Steve Wanamaker for help withHarvEST, and Dr. Livia Tommasini for assistance with the GeneSpringsoftware. This work was funded in part by the Bean/Cowpea CollaborativeResearch Support Program of USAID (Grant no. GDG-G-00-02-00012-00), theCGIAR Generation Challenge Program, and the University of CaliforniaAgricultural Experiment Station. The opinions and recommendations hereinare those of the authors and not necessarily those of USAID.
Author details1Department of Botany and Plant Sciences, University of California, Riverside,CA 92521, USA. 2Department of Nematology, University of California,Riverside, CA 92521, USA.
Authors’ contributionsSD, PAR and TJC designed the experiments. SD performed the research anddid the data analysis. SD, PAR and TJC wrote the paper. JDE provided plantmaterials. All the authors have read and approved the final manuscript.
Received: 6 July 2009 Accepted: 19 August 2010Published: 19 August 2010
References1. Ehlers JD: Cowpea (Vigna unguiculata L. Walp.). Field Crops Res 1997, 53(1-
3):187-204.2. Timko MP, Ehlers JD, Roberts PA, eds: Cowpea Berlin: Springer-Verlag 2007.3. Trudgill DL, Blok VC: Apomictic, polyphagus, root-knot nematodes:
exceptionally successful and damaging biotrophic root pathogens. AnnuRev Phytopathol 2001, 39:53-77.
4. Jung C, Wyss W: New approaches to control plant parasitic nematodes.Appl Microbiol Biotechnol 1999, 51(4):439-446.
5. Roberts PA, Frate CA, Matthews WC, Osterli PP: Interactions of virulentMeloidogyne incognita and Fusarium wilt on resistant cowpeagenotypes. Phytopathology 1995, 85(10):1288-1295.
6. Ehlers JD, Matthews WC, Hall AE, Roberts PA: Breeding and evaluation ofcowpeas with high levels of broad-based resistance to root-knotnematodes. Proceedings of World Cowpea Conference III: 2002; InternationalInstitute of Tropical Agriculture (IITA), Ibadan, Nigeria 2002, 41-51.
7. Fery RL, Dukes PD: Inheritance of root-knot nematode resistance incowpea (Vigna unguiculata [L.] Walp.). J Am Soc Hortic Sci 1980,105:671-674.
8. Das S, Demason DA, Ehlers JD, Close TJ, Roberts PA: Histologicalcharacterization of root-knot nematode resistance in cowpea and itsrelation to reactive oxygen species modulation. J Exp Bot 2008,59(6):1305-1313.
9. Williamson VM: Plant nematode resistance genes. Curr Opinion Plant Biol1999, 2:327-331.
10. Pegard A, Brizzard G, Fazari A, Soucaze O, Abad P, Djian-Caporalino C:Histological characterization of resistance to different root-knotnematode species related to phenolics accumulation in Capsicumannuum. Phytopathology 2005, 95(2):158-165.
11. Kaplan DT, Thomason IJ, Van Gundy SD: Histological study of compatibleand incompatible interaction of soybeans and Meloidogyne incognita.J Nematol 1979, 11(4):338-343.
12. Das S, Bhat PR, Sudhakar C, Ehlers JD, Wanamaker S, Roberts PA, Cui X,Close TJ: Detection and validation of single feature polymorphisms incowpea (Vigna unguiculata L. Walp) using a soybean genome array.BMC Genomics 2008, 9:107.
13. Jammes F, Lecomte P, Almeida-Engler J, Bitton F, Martin-Magniette ML,Renou JP, Abad P, Favery B: Genome-wide expression profiling of thehost response to root-knot nematode infection in Arabidopsis. Plant J2005, 44(3):447-458.
14. Fuller VL, Lilley CJ, Atkinson HJ, Urwin PE: Differential gene expression inArabidopsis following infection by plant-parasitic nematodesMeloidogyne incognita and Heterodera schachtii. Mol Plant Pathol 2007,8(5):595-609.
15. Bar-Or C, Kapulnik Y, Koltai H: A broad characterization of thetranscriptional profile of the compatible tomato response to the plantparasitic root knot nematode Meloidogyne javanica. Eur J Plant Pathol2005, 111(2):181-192.
16. Bhattarai KK, Xie Q-G, Mantelin S, Bishnoi U, Girke T, Navarre DA, Kaloshian I:Tomato susceptibility to root-knot nematodes requires an intactjasmonic acid signaling pathway. Mol Plant-Microbe Interact 2008,21(9):1205-1214.
17. Puthoff DP, Nettleton D, Rodermel SR, Baum TJ: Arabidopsis geneexpression changes during cyst nematode parasitism revealed bystatistical analyses of microarray expression profiles. Plant J 2003,33(5):911-921.
18. Puthoff DP, Ehrenfried ML, Vinyard BT, Tucker ML: GeneChip profiling oftranscriptional responses to soybean cyst nematode, Heteroderaglycines, colonization of soybean roots. J Exp Bot 2007, 58(12):3407-3418.
19. Alkharouf NW, Klink VP, Chouikha IB, Beard HS, MacDonald MH, Meyer S,Knap HT, Khan R, Matthews BF: Timecourse microarray analyses revealglobal changes in gene expression of susceptible Glycine max (soybean)roots during infection by Heterodera glycines (soybean cyst nematode).Planta 2006, 224(4):838-852.
20. Ithal N, Recknor J, Nettleton D, Hearne L, Maier T, Baum TJ, Mitchum MG:Parallel genome-wide expression profiling of host and pathogen duringsoybean cyst nematode infection of soybean. Mol Plant-Microbe Interact2007, 20(3):293-305.
21. Ithal N, Recknor J, Nettleton D, Maier T, Baum TJ, Mitchum MG:Developmental transcript profiling of cyst nematode feeding cells insoybean roots. Mol Plant-Microbe Interact 2007, 20(5):510-525.
22. Tucker ML, Burke A, Murphy CA, Thai VK, Ehrenfried ML: Gene expressionprofiles for cell wall-modifying proteins associated with soybean cystnematode infection, petiole abscission, root tips, flowers, apical buds,and leaves. J Experimental Bot 2007, 58(12):3395-3406.
23. Klink VP, Overall CC, Alkharouf NW, MacDonald MH, Matthews BF: A time-course comparative microarray analysis of an incompatible andcompatible response by Glycine max (soybean) to Heterodera glycines(soybean cyst nematode) infection. Planta 2007, 226(6):1423-1447.
24. Klink VP, Overall CC, Alkharouf NW, MacDonald MH, Matthews BF: Lasercapture microdissection (LCM) and comparative microarray expressionanalysis of syncytial cells isolated from incompatible and compatiblesoybean (Glycine max) roots infected by the soybean cyst nematode(Heterodera glycines). Planta 2007, 226(6):1389-1409.
25. Alvord WG, Roayaei JA, Quiñones OA, Schneider KT: A microarray analysisfor differential gene expression in the soybean genome usingBioconductor and R. Briefings in Bioinformatics 2007, 8(6):415-431.
26. Gilad Y, Rifkin SA, Bertone P, Gerstein M, White KP: Multi-speciesmicroarrays reveal the effect of sequence divergence on geneexpression profiles. Genome Res 2005, 15(5):674-680.
27. Gilad Y, Oshlack A, Smyth GK, Speed TP, White KP: Expression profiling inprimates reveals a rapid evolution of human transcription factors. Nature2006, 440(7081):242-245.
28. Voolstra C, Tautz D, Farbrother P, Eichinger L, Harr B: Contrasting evolutionof expression differences in the testis between species and subspeciesof the house mouse. Genome Res 2007, 17(1):42-49.
29. Liao BY, Zhang JZ: Evolutionary conservation of expression profilesbetween human and mouse orthologous genes. Mol Biol Evol 2006,23(3):530-540.
Das et al. BMC Genomics 2010, 11:480http://www.biomedcentral.com/1471-2164/11/480
Page 15 of 16

30. Sartor MA, Zorn AM, Schwanekamp JA, Halbleib D, Karyala S, Howell ML,Dean GE, Medvedovic M, Tomlinson CR: A new method to removehybridization bias for interspecies comparison of global gene expressionprofiles uncovers an association between mRNA sequence divergenceand differential gene expression in Xenopus. Nucleic Acids Res 2006,34(1):185-200.
31. Moehring AJ, Teeter KC, Noor MAF: Genome-wide patterns of expressionin Drosophila pure species and hybrid males. II. Examination of multiple-species hybridizations, platforms, and life cycle stages. Mol Biol Evol 2007,24(1):137-145.
32. Nieto-Diaz M, Pita-Thomas W, Nieto-Sampedro M: Cross-species analysis ofgene expression in non-model mammals: reproducibility ofhybridization on high density oligonucleotide microarrays. BMC Genomics2007, 8:89.
33. Hudson ME, Bruggink T, Chang SH, Yu W, Han B, Wang X, van der Toorn P,Zhu T: Analysis of gene expression during Brassica seed germinationusing a cross-species microarray platform. Crop Sci 2007, 47(S2):S-96-112.
34. Bagnaresi P, Moschella A, Beretta O, Vitulli F, Ranalli P, Perata P:Heterologous microarray experiments allow the identification of theearly events associated with potato tuber cold sweetening. BMCGenomics 2008, 9:176.
35. Mitchell HJ, Hall JL, Barber MS: Elicitor-induced cinnamyl alcohol-dehydrogenase activity in lignifying wheat (Triticum aestivum L) leaves.Plant Physiol 1994, 104(2):551-556.
36. Tarchini R, Biddle P, Wineland R, Tingey S, Rafalski A: The completesequence of 340 kb of DNA around the rice Adh1-Adh2 region revealsinterrupted colinearity with maize chromosome 4. Plant Cell 2000,12(3):381-391.
37. Schweighofer A, Kazanaviciute V, Scheikl E, Teige M, Doczi R, Hirt H,Schwanninger M, Kant M, Schuurink R, Mauch F, Buchala A, Francesca C,Meskiene I: The PP2C-type phosphatase AP2C1, which negativelyregulates MPK4 and MPK6, modulates innate immunity, jasmonic acid,and ethylene levels in Arabidopsis. Plant Cell 2007, 19(7):2213-2224.
38. Van Damme EJM, Peumans WJ, Barre A, Rouge P: Plant lectins: Acomposite of several distinct families of structurally and evolutionaryrelated proteins with diverse biological roles. Critical Rev Plant Sci 1998,17(6):575-692.
39. Apel K, Hirt H: Reactive oxygen species: metabolism, oxidative stress andsignal transduction. Annu Rev Plant Biol 2004, 55:373-399.
40. Shi C, Thummler F, Melchinger AE, Wenzel G, Lubberstedt T: Comparisonof transcript profiles between near-isogenic maize lines in associationwith SCMV resistance based on unigene-microarrays. Plant Sci 2006,170(1):159-169.
41. Hulbert SH, Bai J, Fellers JP, Pacheco MG, Bowden RL: Gene expressionpatterns in near isogenic lines for wheat rust resistance gene Lr34/Yr18.Phytopathology 2007, 97(9):1083-1093.
42. Szakastis D, Heinen P, Krzysztof W, Hofmann J, Wagner F, Kreil DP,Sykacek P, Grundler FMW, Bohlman H: The transcriptome of syncytiainduced by the cyst nematode Heterodera schachtii in Arabidopsisroots. Plant J 2009, 57(6):771-784.
43. Hussey RS, Barker KR: A comparison of methods of collecting inocula forMeloidogyne spp. including a new technique. Plant Dis Rep 1973,57:1025-1028.
44. Ehlers JD, Matthews WC, Hall AE, Roberts PA: Inheritance of a broad-basedform of root-knot nematode resistance in cowpea. Crop Sci 2000,40:611-618.
45. Byrd DW, Kirkpatrick T, Barker KR: An improved technique for clearing andstaining plant tissue for detection of nematodes. J Nematol 1983,15:142-143.
46. Zhu HY, Choi HK, Cook DR, Shoemaker RC: Bridging model and croplegumes through comparative genomics. Plant Physiol 2005,137(4):1189-1196.
47. Irizarry RA, Hobbs B, Collin F, Beazer-Barclay YD, Antonellis KJ, Scherf U,Speed TP: Exploration, normalization, and summaries of high densityoligonucleotide array probe level data. Biostatistics 2003, 4(2):249-264.
48. Bolstad BM, Irizarry RA, Astrand M, Speed TP: A comparison ofnormalization methods for high density oligonucleotide array databased on bias and variance. Bioinformatics 2003, 19(2):185-193.
49. Knudsen S: A biologist’s guide to analysis of DNA microarray data. NewYork: Wiley-Interscience 2002.
50. Li C, Wong WH: Model-based analysis of oligonucleotide arrays:Expression index computation and outlier detection. Proc Nat Acad SciUSA 2001, 98(1):31-36.
51. Bender R, Lange S: Adjusting for multiple testing-when and how? JClinical Epidemiol 2001, 54:343-349.
doi:10.1186/1471-2164-11-480Cite this article as: Das et al.: Transcriptional profiling of root-knotnematode induced feeding sites in cowpea (Vigna unguiculata L. Walp.)using a soybean genome array. BMC Genomics 2010 11:480.
Submit your next manuscript to BioMed Centraland take full advantage of:
• Convenient online submission
• Thorough peer review
• No space constraints or color figure charges
• Immediate publication on acceptance
• Inclusion in PubMed, CAS, Scopus and Google Scholar
• Research which is freely available for redistribution
Submit your manuscript at www.biomedcentral.com/submit
Das et al. BMC Genomics 2010, 11:480http://www.biomedcentral.com/1471-2164/11/480
Page 16 of 16


![Carbon and nitrogen assimilation, and growth of moongbean (Vigna radiata [L.] Wilczek) cultivars grown under sulfur regimes](https://static.fdokumen.com/doc/165x107/63254f6b545c645c7f09a25b/carbon-and-nitrogen-assimilation-and-growth-of-moongbean-vigna-radiata-l-wilczek.jpg)