Quantitative trait loci for resistance to trichostrongylid infection in Spanish Churra sheep

Genet. Res., Camb. (1999), 74, pp. 313–322. With 2 figures. Printed in the United Kingdom # 1999 Cambridge University Press 313
Mapping quantitative trait loci for murine growth:
a closer look at genetic architecture
TY T. VAUGHN*, L. SUSAN PLETSCHER, ANDREA PERIPATO,
KELLY KING-ELLISON, EMILY ADAMS, CHRISTOPHER ERIKSON
JAMES M. CHEVERUDDepartment of Anatomy and Neurobiology, Washington Uni�ersity School of Medicine, 600 South Euclid A�enue,St Louis, MO 63110, USA
(Recei�ed 21 April 1999 and in re�ised form 23 June 1999)
Summary
Over 20 years ago, D. S. Falconer and others launched an important avenue of research into the
quantitative of body size growth in mice. This study continues in that tradition by locating
quantitative trait loci (QTLs) responsible for murine growth, such as age-specific weights and
growth periods, and examining the genetic architecture for body weight. We identified a large
number of potential QTLs in an earlier F2 intercross (Intercross I) of the SM}J and LG}J inbred
mouse strains. Many of these QTLs are replicated in a second F2 intercross (Intercross II) between
the same two strains. These replicated regions provide candidate regions for future fine-mapping
studies. We also examined body size and growth QTLs using the combined data set from these
two intercrosses, resulting in 96 microsatellite markers being scored for 1045 individuals. An
examination of the genetic architecture for age-specific weight and growth periods resulted in
locating 20 separate QTLs, which were mainly additive in nature, although dominance was found
to affect early growth and body size. QTLs affecting early and late growth were generally distinct,
mapping to separate chromosome locations. This QTL pattern indicates largely separate genetic
and physiological systems for early and later murine growth, as Falconer suggested. We also found
sex-specific QTLs for body size with implications for the evolution of sexual dimorphism.
1. Introduction
One of the greatest problems in the history of genetics
was reconciled with the realization that continuous
phenotypic variation could reflect the influence of
many genes of small effect (reviewed in Falconer &
Mackay, 1996). This realization has since challenged
geneticists and evolutionary biologists with the task of
defining the genetic architecture of organisms in order
to understand the development of evolutionarily
important phenotypes, such as body size, and pro-
cesses such as complex disease states. Genes of small
effect are called quantitative trait loci (QTLs) and
provide insight into questions about the genetic
control of complex traits. For example, a QTL analysis
can allow us to address specific questions concerning
genetic architecture, such as the number of loci
* Corresponding authors.Tel : 1 (314) 362 4189. Fax: 1 (314)3446. e-mail : vaughnt!thalamus.wustl.edu
potentially affecting the trait, the distribution of gene
effects, and the underlying patterns of gene action,
including additivity, dominance, sex-specificity, epis-
tasis and pleiotropy.
Body size has been considered the quintessential
quantitative phenotypic trait ; that is, a trait that does
not exhibit classic Mendelian inheritance attributable
to a single genetic locus, but is strongly heritable.
Body weight variation in mice is normally distributed
and seems to be controlled by many genes, each
having a relatively small additive effect on the
phenotype (Falconer, 1953), thus making it an ideal
trait for a QTL analysis. Falconer and colleagues
(1978) found that body size growth in rodents appears
to occur through two general physiological
mechanisms that act at different life stages (Atchley et
al., 1997; Atchley & Zhu, 1997). Other studies of
rodent growth report a second principal component
contrasting early with later age-specific weight

T. Vaughn et al. 314
(Cheverud et al., 1983; Atchley et al., 1984; Leamy &
Cheverud, 1984; Riska et al., 1984), suggesting a
trade-off between growth during these two periods.
Recently, Atchley and colleagues (1997) reported the
results of an index selection experiment for high and
low early growth, holding later growth constant, and
for high and low later growth, holding early growth
constant. These experiments illustrate the ability to
separate the evolution of these two growth periods.
A common approach for detecting QTLs for growth
and body size in mice incorporates an intercross
between inbred strains that vary for the trait of
interest followed by an examination of associations
between trait values and marker genotypes (Keightley
et al., 1996; Cheverud et al. (1996); Brockman et al.,
1998; Morris et al., 1999) also used this approach to
examine the QTLs influencing body weight in two
strains of inbred mice selected for large, LG}J
(Goodale, 1938), and small, SM}J (MacArthur, 1944),
body size that would be expected to have allelic
differences at a large number of loci affecting growth
(Chai, 1956b). From an F2 intercross between the
LG}J and SM}J strains, a large number of QTLs were
located, each with relatively minor effects on murine
growth an body weight. Specifically, 11 QTLs were
found to affect early growth and 12 QTLs were found
to affect late growth. Further, early growth QTLs
mapped to different chromosomal positions from the
late QTLs, with only four instances where early and
late growth mapped within the same intermarker
interval. Because of the distinct nature of the loci
affecting early and late growth, the hypothesis of
antagonistic pleiotropy was rejected in favour of
separate genetic modules for early and late growth.
In the present paper, we compare the QTLs mapped
in a second F2 intercross of the LG}J and SM}J
mouse strains with the results of the first QTL
analysis. This second F2 intercross provides an
independent evaluation of the original QTLs and
allows the formation of a priori hypotheses to test for
replication of QTLs affecting body size. We also
combine the data from these two intercross experi-
ments, thereby doubling our sample size in order more
accurately to define the number and positions of
QTLs, as well as their genotypic, sex-specific and
pleiotropic effects on murine growth.
2. Materials and methods
(i) Mouse strains and microsatellites
The history of the mouse strains used in these
experiments and the details of animal husbandry are
available in Cheverud et al. (1996). Briefly, the mouse
strains used in both the mapping experiments
originated from the intercross of the Large (LG}J)
and Small (SM}J) mouse strains acquired from
Jackson Laboratories. SM}J had been selected for
small body size at 60 days while LG}J was selected for
large body size at 60 days (Chai, 1956a,b). Both
strains have been systematically inbred for over 104
generations (Festing, 1996). In this study, two in-
dependent intercross experiments are considered using
these inbred mouse strains and are referred to as
Intercross I and Intercross II, where Intercross II is
the replicate study. Both F2 study populations were
initiated by mating 10 SM}J males with 10 LG}J
females to produce F1 hybrid animals. The F1 hybrids
were randomly mated starting at 10 weeks of age
producing 535 F2 animals in Intercross I and 510 F2
animals in Intercross II for a total of 1045 F2 animals
in the combined mapping data set.
At 70 days, mice were necropsied to obtain DNA
from the liver or spleen. DNA extraction and
polymerase chain reaction amplification protocols can
be found in Routman & Cheverud (1995). Seventy-
five polymorphic microsatellite loci arranged in 55
intervals were scored in Intercross I while 96 poly-
morphic loci arranged in 72 intervals were scored in
Intercross II. The relative positions of these markers
are given in Dietrich et al. (1992, 1996). All 19
autosomes were represented in each experiment and
the relative positions of these microsatellite loci in this
intercross are shown in Fig. 1. Microsatellite markers
were chosen to cover the genome as completely as
possible with additional markers added in Intercross
II to fill in larger intervals from Intercross I. These
additional markers are denoted by an asterisk fol-
lowing the name of the microsatellite marker.Three
markers on chromosomes 3, 18 and 19 were scored in
Intercross I that were not used in Intercross II due to
difficulty in scoring. These markers are enclosed in
parentheses in Fig. 1. The combined data set defines a
total map distance of approximately 1780 cM with an
average interval length of approximately 23 cM.
Centimorgan distances are provided using Haldane’s
units (Weir, 1996).
(ii) Growth measurements
The F2 hybrids were weighed at 10 weekly intervals
starting at 7 days of age. Weights were recorded to the
nearest 0±1 g with a digital balance integrated with a
microcomputer. The 10 age-specific weights were
corrected for a series of covarying environmental
effects such as F1 dam, litter size at birth, parity and
sex (Cheverud et al., 1996; Kramer et al., 1998). The
raw weights were corrected by the effects of each
covariate by adding the difference in means between
each class and a standard class to each individuals’
record.
Various growth rates were also calculated from the
age-specific weights. Early growth was defined as
growth between weeks 1 and 3. The Middle growth
Mapping QTLs for murine growth 315
1 2 3 4 5 6 7 8 9 10
11 12 13 14 15 16 17 18 19
25 cM
D19Mit16(D19Mit14)
D19Mit2D19Mit35*
D19Mit137*
D18Mit12D18Mit17
(D18Mit8)D18Mit51*
D18Mit79*
D17Mit46
D17Mit16
D17Mit39
D16Mit2
D16Mit5
D15Mit13
D15Mit5
D15Mit2
D15Mit42
D14Nds1
D14Mit5
D14Mit7
D14Mit266*
D13Mit1
D13Mit115*
D13Mit9
D13Mit35
D12Mit37
D12Mit2
D12Mit5
D12Mit6
D12Nds2
D11Mit62
D11Mit64D11Mit15
D11Mit14
D11Mit333*
D11Mit48
D1Mit3
D1Mit20
D1Mit74*
D1Mit7
D1Mit11
D1Mit14
D1Mit17
D2Mit1
D2Mit37*
D2Mit38*
D2Mit17D2Mit28
D2Mit22
D2Mit265*
D3Mit54
(D3Mit22)
D3Mit22
D3Mit12
D3Mit49*
D3Mit194*
D3Mit32
D4Mit2
D4Mit163*
D4Mit17
D4Mit45
D4Mit16
D4Mit13
D5Mit47
D5Mit61
D5Mit6
D5Mit26
D5Mit32
D5Mit43
D6Mit1
D6Mit9
D6Nds5
D6Mit58*D6Mit15
D7Mit21
D7Mit26*
D7Nds1
D7Mit148*D7Mit17
D7Mit9
D7Mit71*
D7Mit46*
D7Nds4
D8Mit293*
D8Mit8
D8Mit89*
D8Mit56
D9Mit2
D9Mit4
D9Mit8
D9Mit19
D10Mit2
D10Mit15*
D10Mit20
D10Mit65*
D10Mit10
D10Mit133*
D10Mit14
Fig. 1. Relative positions of microsatellite markers scored in the intercross of LG}J with SM}J. Markers denoted withan asterisk are new markers added in the analysis of Intercross II and were not scored in Intercross I. Markers enclosedin parentheses were scored in Intercross I but not scored in Intercross II.
period was defined as growth from 3 to 6 weeks and
the Late growth period consisted of growth from 6 to
10 weeks. Six-week weight gain was defined as growth
from 1 to 6 weeks. The data were analysed for each
age-specific weight as well as for Early, Middle, Six-
week and Late growth periods.
(iii) QTL analysis: replication
The presence and relative positions of potential QTLs
were determined in Intercross I using the interval
mapping methods described in Lander & Botstein
(1989) as realized in the Mapmaker}QTL 1.1b
software (Paterson et al., 1988; Lincoln et al.,
1992a, b). This procedure, as performed on the data
from Intercross I, is described in detail in Cheverud et
al. (1996). The level of statistical significance was
determined via simulation and QTL effects were
accepted liberally so as to reduce the chance of
rejecting true positive QTL effects. Replication of
these potential QTLs was analysed using Intercross II
by performing a multiple regression analysis at each
previously identified QTL location. The analysis
included either an age-specific weight or a growth
period as the dependent variable and the additive and
dominance scores (discussed below) as the inde-
pendent variables (Haley & Knott, 1992). This
statistical test is based on an a priori hypothesis that
a QTL found in Intercross I will also be found in the
same location in Intercross II and is therefore
protected from multiple comparison problems. A
QTL was considered replicated if its point-wise
probability was less than 5%.
(iv) QTL analysis: combined data
Interval mapping was performed on the combined
data from Intercross I and Intercross II using the map
distances generated from the combined data using
Mapmaker 3.0b (Lander et al., 1987; Lincoln et al.,
1992a, b). This data set included 1045 individuals and
the full complement of 96 microsatellite markers.
While the relative positions of the markers used are
given by Dietrich et al. (1992, 1996), map distances
may vary between crosses. Therefore, the micro-
satellite positions for Intercross I and II were mapped
independently as well as in combination using the
Mapmaker 3.0b program. Map distances were
measured for Intercross I, Intercross II and the
combined data set. Significant differences in map
distance between the intercrosses were tested for using
the procedure of Ott (1991) as modified by Williams et
al. (1995). Differences were found only for chromo-
somes 2 and 3 and thus a blocking variable was
incorporated into the interval mapping model to
account for this source of variation. Each of these
chromosomes was relatively poorly marked in
Intercross I (Cheverud et al., 1996).

T. Vaughn et al. 316
(v) QTL analysis: inter�al mapping
We employed the regression interval mapping method
of Haley & Knott (1992) with the combined data set
by imputing genotype scores every 2 cM throughout
the intervals between mapped molecular markers. The
marker genotypes and their levels of recombination
were used to obtain the probability that an arbitrary
position lying between flanking markers is homo-
zygous SM}J, heterozygous, or homozygous LG}J.
These probabilities were then multiplied by ®1, 0 and
1, respectively, and summed to obtain an additive
genotypic score (Xa). Likewise, the probability of
heterozygosity at the arbitrary intermediate location
was calculated and used as a dominance genotypic
score (Xd). The growth periods or age-specific weights
were then jointly regressed onto the additive and
dominance genotypic scores to obtain estimates of
additive (a) and dominance (d ) genotypic values and
the probability of a gene affecting the character at a
specific location. The probability was obtained using
the SECTOR option in SYSTAT 7.0 (Cohen &
Cohen, 1983; Cohen & Wilkinson, 1997) which
provides F and χ# statistics and associated prob-
abilities for the full multivariate trait set and F values
and associated probabilities for each individual trait.
(vi) QTL analysis: significance le�els
As discussed by Lander & Kruglyak (1995), we
adjusted point-wise probabilities for the presence of
multiple comparisons. We calculated two threshold
levels to distinguish between chromosome-wide and
genome-wide significance. Lander & Kruglyak (1995)
recommended LOD thresholds for a F2 intercross at
2±8 for suggestive linkage, roughly corresponding to
our 5% chromosome-wide value, and 4±3 for
significant linkage at a 5% genome-wide significance
level. However, Lander & Kruglyak’s (1995)
thresholds are overly conservative, assuming a dense
marker map not obtained here. Further, QTLs
described here are being followed up in an additional
advanced intercross population (Darvasi & Soller,
1995), not by further saturating the F2 population
with markers. We derived chromosome-wide and
genome-wide significance levels for our combined
experiment by first calculating the number of in-
dependent markers on each chromosome or the
effective marker number (Meff
; Cheverud, 1999a).
The effective number is less than the total number of
markers scored because of intercorrelations among
linked markers. The effective marker number is
Meff
¯M[1®(V(λ)}M))], (1)
where M is the number of markers scored and (V(λ))
is the variance of the eigenvalues of the intermarker
correlation matrix for each chromosome (Cheverud,
1999a). Each 5% chromosome-wide significance
thresholdwas obtained by dividing 0±05 by the effective
number of markers on that chromosome. Five per
cent LOD score thresholds are given in the last
column in Table 2. The genome-wide 5% threshold
was obtained by dividing 0±05 by the effective number
of markers summed across all the chromosomes.
Summing these values is justified in a F2 population
because chromosomes are in linkage equilibrium. The
5% genome-wide threshold is 3±49 on the LOD scale.
These experiment-specific values match well with
those predicted by Lander & Kruglyak (1995) based
on map densities similar to those realized in our
experiment.
(vii) Sex-specific QTLs
We also examined sex-specific effects by testing the
interaction between sex and the additive and domi-
nance genotypic scores. If the mapping results
indicated a significant interaction, males and females
were mapped separately with a concordant adjustment
of the Bonferroni-corrected LOD threshold values.
(viii) QTL analysis
The tests described above are for a single QTL on
each chromosome. If it appeared that an additional
QTL for the same trait may also reside on the
chromosome, specific two-QTL models were fitted to
the data using the additive and dominance genotypic
values for two chromosomal positions at a time
(Haley & Knott, 1992). If the two-QTL model fitted
significantly better than the one-QTL model at the
5% level, the two-QTL model was accepted.
Significance was determined using a χ# test with 2 df
on twice the difference in natural logarithms of the
probabilities of each model.
(ix) Pleiotropy
When QTLs for two or more traits map to the same
chromosome, it is necessary to consider whether they
map to the same position, indicating pleiotropy, or to
different positions. A formal description and simu-
lation model for testing pleiotropy between QTL
effects can be found in Cheverud (1999b). Pleiotropy
was tested by identifying the most likely chromosomal
position for each trait considered separately (traits A
and B) and then for the combination of both traits
(AB). A χ# value was obtained for trait A at its mostly
likely position and at the most likely combined trait
position (AB), controlling for variation in trait B
(Cohen & Cohen, 1983; Cohen & Wilkinson, 1997).
Likewise, a χ# value was obtained for trait set B at its
most likely position and at the most likely combined
trait position (AB), controlling for variation in trait

Mapping QTLs for murine growth 317
A. The differences in χ# values between the separate-
position model and the combined-position model for
traits A and B were summed to produce a χ# value for
pleiotropy with 1 df. A significant result indicates that
the two traits are likely to be affected by two different
QTLs while a non-significant result indicates that a
single QTL affecting both traits cannot be rejected.
This test was performed on the Early, Middle and
Late growth periods and for groups of age-specific
weights whenever they mapped to the same
chromosome.
3. Results
(i) Variation in age-specific weights and growth
Table 1 provides the means and phenotypic standard
deviations for age-specific weights and growth rates
after correction for covariates described in Cheverud
et al. (1996) and Kramer et al. (1998). Correlations
between age-specific weights decline as the time
between weights increases. Correlations among Early
and Late age-specific weights are low, sharing less
than 10% of their variance in common. Early growth
is independent of Middle and Late growth. The
Middle growth period shares less than 10% of its
variance with Late growth. Six-week weight gain is the
sum of Early and Middle growth periods accounting
for the correlation with its components.
(ii) Replicated QTLs
The results from Intercross I indicated that QTLs
affecting age-specific weights and growth rates were
detected on 17 of the 19 chromosomes with only
Table 1. Means³standard de�iations and correlations for age-specific weights and growth periods
Age (weeks)
Age Weight (g) 1 2 3 4 5 6 7 8 9 10 E M SW
1 4±83³0±652 8±26³1±00 0±753 12±55³1±49 0±69 0±834 19±20³2±13 0±63 0±70 0±805 23±36³2±33 0±52 0±62 0±70 0±876 27±37³2±55 0±45 0±53 0±60 0±76 0±907 29±73³3±90 0±40 0±48 0±54 0±69 0±85 0±948 31±45³3±30 0±34 0±42 0±48 0±63 0±79 0±88 0±949 33±67³3±58 0±32 0±39 0±46 0±59 0±75 0±85 0±91 0±94
10 35±52³3±92 0±30 0±38 0±43 0±56 0±72 0±82 0±88 0±92 0±94
E 7±73³1±14 0±34 0±66 0±91 0±68 0±62 0±53 0±48 0±44 0±42 0±35M 14±78³2±04 0±05 0±05 0±02 0±37 0±62 0±81 0±77 0±75 0±73 0±71 0±01
SW 22±54³2±33 0±21 0±36 0±46 0±65 0±85 0±97 0±91 0±87 0±84 0±78 0±48 0±87L 8±15³2±33 0±01 0±06 0±07 0±11 0±21 0±29 0±46 0±58 0±66 0±81 0±07 0±30 0±31
Growth periods are designated as Early (E), Middle (M), Six-week (SW) and Late (L). Correlations " 0±08 are significantat the 5% level.
chromosomes 5 and 16 not containing any QTLs at
the 10% level. In Intercross II we found QTLs on 15
of the 19 chromosomes. The replicated QTLs from
Intercross II for each trait are presented in bold type
in Table 2. A QTL was considered replicated if it was
significant at the 5% level at the same location as the
QTL found in Intercross I. We found no instances of
a QTL having an opposite effect between intercrosses.
In general, we had greater replication success for the
most robust QTLs from Intercross I and for the later
age-specific weights than for earlier age-specific weight
QTLs. We detected nearly all of the previously
identified QTLs on six chromosomes from Intercross
I (chromosomes 4, 6, 7, 8, 9 and 10). These QTLs were
generally associated with the highest LOD scores. The
mean LOD score for the replicated QTLs was 5±25
(³0±36) and the mean for the QTLs that did not
replicate was 3±34 (³0±19). Replication was generally
poor for QTLs that were of marginal significance in
Intercross I or on chromosomes that were not as well
covered by microsatellite markers. However, a few
QTLs in Intercross I that did exhibit a high LOD
score also failed to replicate in Intercross II. Only
chromosome 3 failed to replicate any QTLs found in
Intercross I. In Intercross I, the one-QTL model was
not significantly better than the null model for
chromosome 3, but a two-QTL model did fit signifi-
cantly better than the null model (Cheverud et al.,
1996). This was not replicated in Intercross II.
In a number of instances, QTLs located in intercross
II were not significant at the 5% level but were
significant at the 10% level. This occurred when the
QTL was at a slightly different location on the
chromosome compared with Intercross I. While these
QTLs are not considered to have replicated in this

T. Vaughn et al. 318
Table 2. Quantitati�e trait loci for age-specific weights and growth periods
ChromosomeLength(cM) Traits Common position
Distancefromcentromere(cM)
Chromosome-specific LOD
1 152 1, 2, 4, 5, 6, 7, 8, 9, 10, M, L D1Mit1110 84 2±122 146 2, 3, 7, 8, 9, 10, E, M, SW, L D2Mit388 80 2±043 124 No QTLs 1±984 128 2, 3, 4, 5, 6, 7, 8, 9, 10, E, M, SW, L D4Mit178 50 1±975 132 L D5Mit3210 130 2±026 100 1, 2, 3, 4, 5, 6, 7, 8, 9, 10, E, M, SW, L D6Nds514 88 1±907 100 1, 2, 3, 4, 5, 6, 7, 8, 9, 10, E, M, SW, L D7Nds14 50 2±078 104 2, 3, 4, E D8Mit2932 24 1±81
5, 6, 7, 8, 9, 10, M, SW D8Mit88 569M 94 5, 6, 7, 8, 9, 10, E, M, SW, L D9Mit48 42 1±82
10 94 4, 5, 6, 7, 8, 9, 10, E, M, SW, L D10Mit104 84 1±9711 118 1, 2, 3, 4, 5, 6, E, M, SW D11Mit6232 36 2±0212M 74 10, L D12Mit20 24 1±95
3, E D12Mit620 7413 98 3, 4, 5, 7, 8, E D13Mit14 14 1±83
6, 9, 10, M, SW D13Mit914 8614 88 5, 6, 7, 8, 9, 10, M, SW, L D14Mit510 58 1±8415M 76 1, 2, 3, 4, 5, 6, 7, 8, 9, 10, E, M, SW, L D15Mit516 46 1±8216M,F 30 2, 3, 4, 5, 6, 7, 8, 9, 10, E, M, SW D16Mit2 (0M ; 30F) 14; 44 1±5317 54 7, 8, 9, M, SW D17Mit164 18 1±6718 46 8, 9, 10, M, L D18Mit1714 38 1±7219 66 No QTLs 1±84
Significant QTL effects for age-specific weights (in weeks) and growth periods (Early (E), Middle (M), Six-week (SW) andLate (L)) for each chromosome are shown. Sex-specific QTLs are denoted by (M) or (F). The common position is the mostlikely location for the traits where pleiotropic effects were unresolved. Replicated QTLs are shown in bold italics. Alsoincluded are the map distances from the centromere on each chromosome. Significance testing was performed on eachchromosome separately using chromosome- and genome-wide criteria as describe in the text. The chromosome-widethreshold is provided in the last column and the genome-wide threshold is 3±49.
part of the study, the combination of effects from
Intercross I and Intercross II may produce a significant
effect in the overall mapping of the combined data set
due to the increase in sample size
(iii) Combined inter�al mapping
(a) Number of genes and effects The combined in-
terval mapping analysis is presented in Table 2. We
found 20 QTLs affecting age-specific weight and}or
growth on 17 of the 19 autosomes in the mouse
genome with no QTLs being found on chromosomes
3 or 19. The raw and standardized additive (a, 2a}sp)
and dominance (d, d}sp) genotypic values for each
QTL are available from the authors upon request.
A wide range of genetic architectures were found in
the combined mapping analysis, a few of which will be
highlighted below. For example, simple additivity was
discovered at D1Mit1110 for Late growth, LG}J
dominant to SM}J at D11Mit6232 for Early
growth, SM}J dominant to LG}J at D11Mit6410
for Late growth, and overdominance at D4Mit176
for Early growth. Considering growth rates, the most
extreme dominance value is ®0±22 g (0±09 SD) at
D14Mit510 cM for Late growth rate. Generally, the
LG}J allele is dominant to the SM}J allele, indicating
that higher weight is dominant to lower weight at
most loci. Significant LOD scores for Early growth
rates ranged from 1±82 on chromosome 9 to 8±15 on
chromosome 15 while those for Late growth ranged
from 2±52 on chromosome 18 to 7±92 on chromosome
2. The highest LOD score (22±64) was observed for
week 7 weight on chromosome 6 at D6Nds514. In
general, chromosomes 6 and 7 produced the most
highly significant results. Further, nearly half of all
QTLs exceeding the chromosome-wide threshold also
exceeded the genome-wide threshold.
We also examined the age-specific sums for additive
and dominance genotypic values. The sum of the
additive genotypic values increases with age, from
1±24 g multiple homozygote difference at 1 week (25%
of the mean) to a 23±38 g multiple homozygote at
week 10 (66% of the mean). This is also reflected in
the Early and Late growth periods (0±65 g difference
for Early growth and 5±27 g difference for Late
growth). Sums of standardized additive genotypic
values also increased with age from approximately
2 SD in the first 2 weeks to over 6 SD by week 10.

Mapping QTLs for murine growth 319
1 2 3 4 5 6 7 8 9 10
11 12 13 14 15 16 17 18 19
25 cMLE
(L)
EL
E
(L)
L
E
E
L
(E)
L E
L
L
E
L
E
L
E
L
E
(L)
E
LL
E
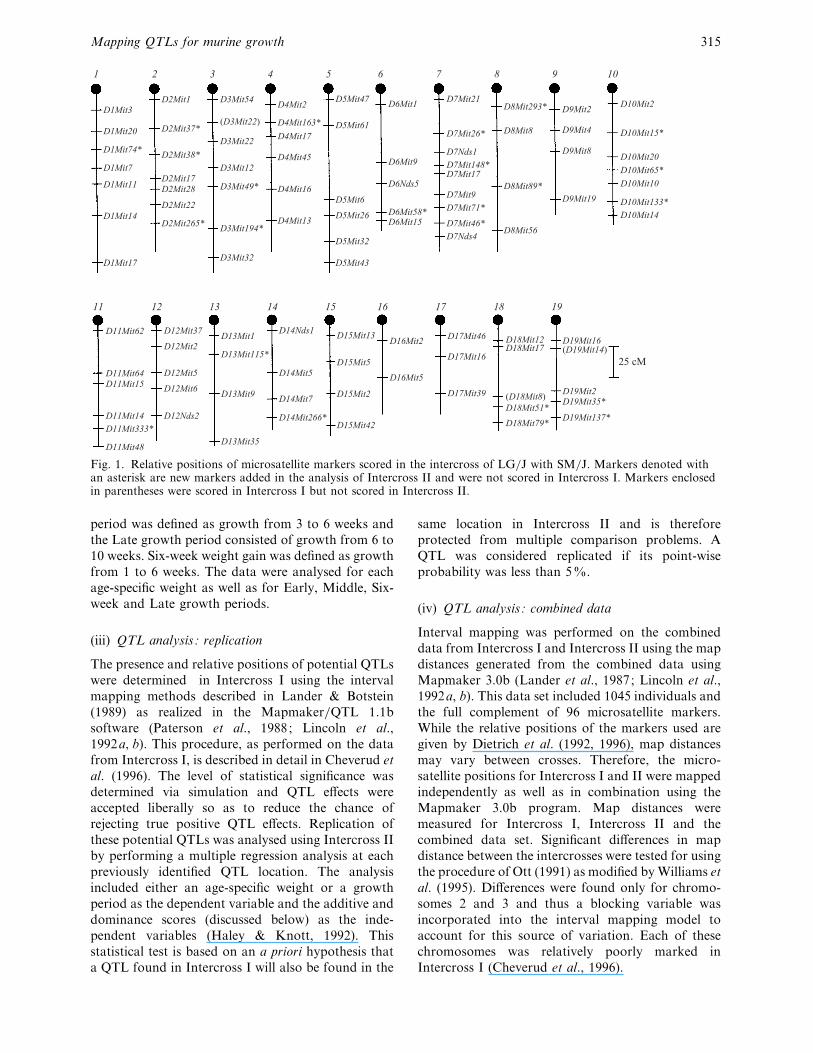
Fig. 2. Relative positions of QTLs affecting Early (E) and Late (L) growth. Parenthetical entries represent locations withexclusive effects on early or late weights but not on growth itself.
While some of this increase in homozygote difference
between early and late ages can be accounted for by
the increase in the number of QTL detected at later
ages (from 6 at week 1 to 13 at week 10), the average
additive genotypic values also increased with age from
approximately 0±10 SD during the first few weeks to
approximately 0±85 SD during the last few weeks.
In terms of the dominance genotypic values, there is
a trend for dominance to increase during weeks 1–3
and then level off at later ages. When the Early and
Late growth periods are considered, the dominance
value is much larger in the Early growth period
(2±52 SD), due to several overdominant loci, than in
the Late growth period (0±97 SD). A similar pattern is
also observed in the raw dominance values. This
indicates that the multiple heterozygote is born larger
than either homozygote and grows at approximately
the same rate as the LG}J homozygote and much
faster than the SM}J homozygote during the Early
growth period. Heterozygote growth then slows
relative to the multiple homozygotes during the
Middle and Late growth periods. This is reflected in
the much larger dominance ratios (d}a) at week 1 and
week 2 (1±4 and 1±9, respectively) than at week 10
(0±01).
In a few cases, it appeared that more than one QTL
could be present for a particular trait. We analysed
these instances using two QTL models. In no case did
a two-QTL model fit better than the one-QTL model.
(b) Pleiotropy In this analysis, we found a total of 12
QTLs affecting Early growth and 11 QTLs affecting
Late growth explaining 19% and 18% of the variance,
respectively, among the F2 hybrids. The distribution
of these Early and Late growth QTLs among the 19
autosomes is shown in Fig. 2. In addition, we include
four positions with exclusive effects on early and late
weights but not on growth itself in Fig. 2. These are
indicated in parentheses. A total of 12 chromosomes
(1, 2, 4, 6, 7, 8, 9, 10, 11, 12, 13 and 15) contained
QTLs affecting both Early and Late growth and were
analysed for pleiotropy. Of these 12 chromosomes
harbouring QTLs affecting both Early and Late
growth, those found on chromosomes 7, 8, 12 and 13
indicated separate genes for the two traits. In the
other eight instances the QTLs could not be resolved
into independent positions, retaining the possibility
that a single gene affects both Early and Late growth.
However, if the distributions of effects on Early and
Late growth are unrelated, as indicated in Table 1, five
co-occurrences of separate Early and Late growth
genes in 72 intervals would be expected by chance
alone. Of these eight Early}Late QTL pairs, none
exhibit a significant opposite effect, that is, the genetic
architecture of these QTLs does not exhibit an-
tagonistic pleiotropy. Genotypic effects on Middle
and Six-week growth periods generally mapped either
with Early or Late growth periods, rarely mapping to
distinct positions. In two cases, on chromosomes 8

T. Vaughn et al. 320
and 17, Six-week and Middle growth periods mapped
without either Early or Late but did map with Middle
age-specific weights.
We also examined pleiotropic relationships between
groups of age-specific QTLs where the confidence
intervals did not overlap or where there was only
minor overlap. A break within the rows of a given
chromosome between ages in Table 2 denotes separate
QTLs for age-specific weights only. Otherwise, the
QTLs for the age-specific weights are assumed to be
affected by the same QTL. Generally, pleiotropy
could not be rejected between these groups except on
chromosomes 12 and 13.
(c) Sex-specific QTLs. Sex-specific results, based on
the significance of sex by genotype interaction, were
observed on four of the chromosomes: 9, 12, 15 and
16 (Table 2). Typically, when the sexes were analysed
separately, one sex was observed to have a significant
QTL for a given age-specific weight or growth rate
while the other sex had no effect on the QTL.
Chromosome 16 produced no significant QTLs in
Intercross I. However, when the data from the two
experiments were combined and analysed for sex-
specific effects, significant QTLs were indicate at
opposite ends of the chromosome for males and
females for the Middle and Late growth periods and
for Middle and Late age-specific weights (Table 2).
4. Discussion
Falconer et al. (1978) investigated whether genetic
changes in body weight, viewed as an adjustment of
growth regulation, operated by changing cell number,
cell size, or via both mechanisms. Their results
indicated that both mechanisms were involved such
that the cells of mice selected for increased body size
at 6 weeks of age were more numerous and larger than
control mice. Additionally, mice that were selected for
small body size showed that opposite effect, their cells
being smaller and less numerous than those of
unselected lines. Thus, it was concluded from this and
other genetic studies by Atchley and colleagues
(Atchley et al., 1997; Atchley & Zhu, 1997) that body
size growth involved separate physiological
mechanisms: an early mechanism facilitating increase
in cell number and a later-developing mechanism
leading to an increase in cell size. Our studies of body
size growth in the SM}J by LG}J intercross are
consistent with expectations based on this earlier
work.
Interval mapping of the combined data set revealed
many genes with relatively small effects on age-specific
body weights and growth. More QTLs were found for
later ages than for early ages (6 vs 13 for week 1 and
week 10, respectively). A larger proportion of the
phenotypic variance was detected at later ages because
more QTLs were detected and their standardized
additive genotypic effects were larger. The maximum
effect for a single QTL was on the order of 11% with
an average effect per QTL of approximately 2±5% of
the phenotypic variance after correction for covariates.
We were also able to detect QTLs accounting for only
1% of the phenotypic variance due to the large
sample size of this study. These results are consistent
with earlier biometric studies of this intercross (Chai,
1965a, b ; Kramer et al., 1998). Chai (1965a, b)
estimated at least 11 effective genes for body size at 60
days. At 63 days we found 14 genes controlling body
size variation. A complete biometrical, quantitative
genetic analysis was performed for Intercross II by
Kramer et al. (1998) and, again, similar trends in
variance components were reported. For example, the
total phenotypic variation was shown to increase with
age as did the heritability. However, the additive and
dominance variance components are generally lower
in the mapping study than were found in the
biometrical analysis. This indicates that there may still
be more QTLs of smaller effect segregating in this
intercross than we could detect despite our ability to
identify QTLs contributing only about 1% to the
total phenotypic variance. Alternatively, significant
amounts of epistatic interaction were found for week
10 weight in Intercross I (Routman & Cheverud,
1997; Cheverud, 1999a). The observed difference in
percentage variance accounted for between the bio-
metrical study and mapping study could be due in
part to epistatic interactions. Thus, body weight in
this F2 intercross of the LG}J and SM}J mouse
strains behaves as a classic quantitative trait with
variation due to many loci, each of relatively small
effect, and shows distinct and repeatable patterns of
additive and dominance effects.
Another aspect of genetic architecture is the
occurrence of genetic correlation between traits. Our
results indicate that, in general, there are distinct
genetic systems responsible for early and later growth.
This is further evidenced by the relatively low
phenotypic correlations between early and later
weights and growth in this F2 population. Low
phenotypic correlations between early and later
growth have been found in other studies of rodent
growth (Rutledge et al., 1972; Cheverud et al., 1983;
Atchley et al., 1984; Riska et al., 1984) and can have
two genetic sources. Correlations will be low when the
loci do not display pleiotropic effects and}or when
loci displaying positive pleiotropy are balanced by loci
displaying negative pleiotropy. In the combined F2
population we found a general trend for loci to affect
either Early or Late growth. Four chromosomes
contained only an Early or a Late growth QTL. An
additional four chromosomes contained both Early
and Late QTLs but were separated into distinct loci
with our test for pleiotropy. In another eight cases

Mapping QTLs for murine growth 321
where Early and Late QTLs were found on the same
chromosome, we could not eliminate the potential for
pleiotropic control. In the previous intercross ex-
periment, Cheverud et al. (1996) found four co-
occurrences of Early and Late growth. However,
Early and Late growth QTLs were found in com-
bination on 10 chromosomes and a formal test of
pleiotropy was not performed. In other studies where
pleiotropy for body size QTLs were found, significant
negative correlations for Early and Later growth have
been reported (Rutledge et al., 1972; Cheverud et al.,
1983; Atchley et al., 1984; Riska et al., 1984).
However, we did not find negative correlations
between Early and Late growth in this study. A more
highly resolved map in these regions would be needed
to confirm or reject pleiotropy for these QTLs.
Intraspecific variation in size may reflect genetic
variation, differential investment of mothers, environ-
mental factors as well as gender of offspring. Sexual
dimorphism is present in the strains used in our
intercross experiments ; males are about 8±0 g larger
than females in the LG}J strain and about 4±0 g larger
than females in the SM}J strain. Few mapping studies
have examined sex-specific effects in mammals even
though variation between males and females for
phenotypic traits is the raw genetic material that
produces sexual dimorphism. We found four cases
where sex interacted with genotype. On chromosomes
9, 12 and 15, the QTL is primarily due to a male-
specific locus. On chromosome 16, separate male- and
female-specific QTLs were found. Interestingly, the
QTLs on chromosome 16 were not resolved until the
sexes were analysed separately. The male-specific
QTL appears near the centromeric end of the
chromosome and displays additivity. The female-
specific QTL is near the telomeric end of the
chromosome with the SM}J allele dominant to the
LG}J allele.
As we move closer to being able to identify precisely
the genes contributing to complex genetic traits, it
becomes increasingly important to correctly and
precisely identify the QTL region responsible for
affecting the trait. In the initial F2 intercross ex-
periment with LG}J and SM}J mice, Cheverud et al.
(1996) located and quantified numerous QTLs
affecting body size. QTLs were accepted liberally in
this initial scan in order not to overlook QTLs
responsible for significant variation in body size. Our
second F2 intercross provided an a priori hypothesis
to test the consistency of these initial loci. Although
we were able to detect replicated QTLs with an
original LOD score of 1±50, we found that the average
LOD score was nearly 2 orders of magnitude higher
than the average LOD value for QTLs that did not
replicate. While these results indicate that replication
was most successful on the larger LOD results from
Intercross I, failure to replicate does not necessarily
prove the hypothesis of no genetic effect at a particular
location (Lander & Kruglyak, 1995). Linkages be-
tween markers and phenotypes will often have weak
effects, which, by chance may be weaker or stronger in
a second study. By combining the data from the two
intercrosses and interval mapping with twice as many
individuals, we found 20 distinct QTLs affecting body
size and various growth periods during murine
development. We are now in a position to examine
epistatic interactions among these QTLs and to map
the replicated QTLs in an advanced intercross line in
preparation for future positional cloning.
We thank Adam Bonislawski, Safina Koreishi, RobinLinsey, Bonny Leung and David Durand for help withlaboratory work. This research was supported by NationalScience Foundation grants DEB 9419992 and DEB 9726433and NIH grant DK 52514.
References
Atchley, W., Riska, B., Kohn, L., Plummer, A. & Rutledge,J. (1984). A quantitative genetic analysis of brain andbody size associations, their origin and ontogeny: datafrom mice. E�olution 38, 1165–1179.
Atchley, W. R. & Zhu, J. (1997). Developmental quan-titative genetics, conditional epigenetic variability andgrowth in mice. Genetics 147, 765–776.
Atchley, W. R., Cowely, D. E. & Xu, S. (1997). Restrictedindex selection for altering developmental trajectories inmice. Genetics 146, 629–640.
Brockman, G., Haley, C. S., Renne, U., Knott, S. A. &Schwerin, M. (1998). QTLs affecting body weight andfatness from a mouse line selected for extreme highgrowth. Genetics 150, 369–381.
Chai, C. (1956a). Analysis of quantitative inheritance ofbody size in mice. I. Hybridization and maternal influence.Genetics 41, 157–164.
Chai, C. (1956b). Analysis of quantitative inheritance ofbody size in mice. II. Gene action and segregation.Genetics 41, 167–178.
Cheverud, J. (1999a) Detecting epistasis among quantitativetrait loci. In Epistasis and the E�olutionary Process (ed. J.Wolf, E. Brodie III & M. Wade). New York: OxfordUniversity Press (in press).
Cheverud, J. (1999b). The genetic architecture of pleiotropicrelations and differential epistasis. In E�olutionary Biologyand Characteristics (ed. G. Wagner). New York: Aca-demic Press (in press).
Cheverud, J., Rutledge, J. & Atchley, W. (1983). Quan-titative genetics of development: genetic correlationsamong age-specific trait values and the evolution ofontogeny. E�olution 37, 895–905.
Cheverud, J., Routman, E. J., Duarte, F. A., van Swinderen,B., Cothran, K. & Perel, K. (1996). Quantitative trait locifor murine growth. Genetics 142, 1305–1319.
Cohen, J. & Cohen, P. (1983). Applied Multiple Regression}Correlation Analysis for the Beha�ioral Sciences, 2nd edn.Hillsdale, NJ: Lawrence Erlbaum.
Cohen, J. & Wilkinson, L. (1997). Set and canonicalcorrelations. In Systat 8.0 Statistics, pp. 817–840.Chicago: SPSS.
Darvasi, A. & Soller, M. (1995). Advanced intercross lines,an experimental population for fine genetic mapping.Genetics 141, 1199–1207.

T. Vaughn et al. 322
DeChiara, T. M., Efstratiadis, A. & Robertson, E. J. (1990).A growth-deficiency phenotype in heterozygous micecarrying an insulin-like growth factor II gene disrupted bytargeting. Nature 345, 78–80.
Dietrich, W., Katz, H., Lincoln, S., Shin, H.-S., Friedman,J., Dracopoli, N. & Lander, E. S. (1992). A genetic mapof the mouse suitable for typing intraspecific crosses.Genetics 131, 423–447.
Dietrich, W. F., Miller, J., Steen, R., Merchant, M.,Damron-Boles, D., Husain, D. Z., Dredge, R., Daly, M.,Ingalls, K., O’Conner, T., Evans, C., DeAngelis, M.,Levinson, D., Kruglyak, L., Goodman, N., Copeland, N.,Jenkins, N., Hawkins, T., Stein, L., Page, D. & Lander, E.(1996). A comprehensive genetic map of the mousegenome. Nature 380, 149–152.
Falconer, D. S. (1953). Selection for large and small size inmice. Journal of Genetics 51, 470–501.
Falconer, D. S. & Mackay, T. (1996). Introduction toQuantitati�e Genetics. 4th Ed. Harlow, Essex: Longman.
Falconer, D. S., Gauld, I. & Roberts, R. (1978). Cellnumbers and cell sizes in organs of mice selected for largeand small body size. Genetical Research 31, 387–301.
Festing, M. (1996). Origins and characteristics of inbredstrains of mice. In Genetic Variants and Strains of theLaboratory Mouse (ed. M. F. Lyon, S. Raston & S. D. M.Brown). New York: Oxford University Press.
Greenspan, F. S. & Baxter, J. D. (1994). Basic and ClinicalEndocrinology, 4th edn. Norwalk, CN: Appleton andLange.
Goodale, H. (1938). A study of the inheritance of bodyweight in the albino mouse by selection. Journal ofHeredity 29, 101–112.
Haley, C. S. & Knott, S. A. (1992). A simple regressionmethod for mapping quantitative trait loci in line crossesusing flanking markers. Heredity 69, 315–324.
Keightly, P. D., Hardge, T., May, L. & Bulfield, G. (1996).A genetic map of quantitative trait loci for body-weight inthe mouse. Genetics 142, 227–235.
Kramer, M. G., Vaughn, T. T., Pletscher, L. S., King-Ellison, K., Adams, E., Erickson, C. & Cheverud, J. M.(1998). Genetic variation in body weight growth andcomposition in the intercross of Large (LG}J) and Small(SM}J) inbred strains of mice. Genetics and MolecularBiology 21, 211–218.
Lander, E. S. & Botstein, D. (1989). Mapping Mendelianfactors underlying quantitative traits using RFLP linkagemaps. Genetics 121, 185–199.
Lander, E. & Kruglyak, L. (1995). Genetic dissection ofcomplex traits : guidelines for interpreting and reportinglinkage results. Nature Genetics 11, 241–247.
Lander, E. S., Green, P., Abrahamson, J., Barlow, A.,Daley, M., Lincoln, S. & Newburg, L. (1987).MAPMAKER: an interactive computer package for
constructing primary genetic linkage maps of exper-imental and natural populations. Genomics 1, 174–181.
Leamy, L. & Cheverud, J. (1984). Quantitative genetics andthe evolution of ontogeny. II. Genetic an environmentalcorrelations among age-specific characters in randombredmice. Growth 48, 339–353.
Lincoln, S., Daly, M. & Lander, E. (1992a). ConstructingGenetic Maps with MAPMAKER}EXP 3.0, 3rd edn.Whitehead Institute Technical Report.
Lincoln, S., Daly, M. & Lander, E. (1992b). Mapping GenesControlling Quantitati�e Traits with MAPMAKER}QTL1.1, 3rd edn. Whitehead Institute Technical Report.
MacArthur, J. (1944). Genetics of body size and relatedcharacters. I. Selection of small and large races of thelaboratory mouse. American Naturalist 78, 142–157.
Morris, K. H., Ishikawa, A. & Keightley, P. D. (1999).Quantitative trait loci for growth traits in C57BL}6J¬DBA}2J mice. Mamalian Genome 10, 225–228.
Ott, J. (1991). Analysis of Human Genetic Linkage, 2nd edn.Baltimore: Johns Hopkins University Press.
Parks, J. S., Pfaffle, R., Brown, M., Abdul-Latif, H. &Meacham, L. (1995). Growth hormone deficiency. InMolecular Endocrinology: Basic Concepts and ClinicalCorrelations (ed. B. Weintraub), pp 473–490. New York:Raven Press.
Paterson, A., Lander, E., Hewitt, J., Peterson, S., Lincoln,S. & Tanksley, S. (1998). Resolution of quantitative traitsinto Mendelian factors by using a complete linkage mapof restriction length polymorphisms. Nature 335, 721–726.
Rappaport, R. (1993). Fetal growth. In Pediatric Endo-crinology: Physiology, Pathophysiology and ClinicalAspects, 2nd edn (ed. J. Bertrand, R. Rappaport & P.Sizonenko), pp. 175–184. Baltimore: Williams andWilkins.
Riska, B., Atchley, W. & Rutledge, J. (1984). A geneticanalysis of targeted growth in mice. Genetics 107, 79–101.
Routman, E. & Cheverud, J. (1995). Polymorphism forPCR-analyzed microsatellites : data for two additionalinbred mouse strains and the utility of agarose gelelectrophoresis. Mammalian Genome 6, 401–404.
Routman, E. & Cheverud, J. (1997). Gene effects on aquantitative trait : two-locus epistatic effects measured atmicrosatellite markers and at estimated QTL. E�olution51, 1654–1662.
Rutledge, J., Robison, O., Eisen, E. & Legates, J. (1972).Dynamics of genetic and maternal effects in mice. Journalof Animal Science 35, 1441–1444.
Weir, B. S. (1996). Genetic Data Analysis. Sunderland, MA:Sinauer Associates.
Williams, C. G., Goodman, M. M. & Stuber, C. W. (1995).Comparative recombination distances among Zea maysL. Inbreds, Wide crosses and interspecific hybrids.Genetics 141, 1573–1581.
Copyright © 2022 FDOKUMEN