Regional Heritability Mapping of Quantitative Trait Loci ... - MDPI
18
plants Article Regional Heritability Mapping of Quantitative Trait Loci Controlling Traits Related to Growth and Productivity in Popcorn (Zea mays L.) Gabrielle Sousa Mafra 1 , Janeo Eustáquio de Almeida Filho 2 , Antônio Teixeira do Amaral Junior 3, * , Carlos Maldonado 4 , Samuel Henrique Kamphorst 3 , Valter Jário de Lima 3 , Divino Rosa dos Santos Junior 3 , Jhean Torres Leite 3 , Pedro Henrique Araujo Diniz Santos 3 , Talles de Oliveira Santos 3 , Rosimeire Barboza Bispo 3 ,Uéliton Alves de Oliveira 3 , Vitor Batista Pinto 3 , Alexandre Pio Viana 3 , Caio Cezar Guedes Correa 3 , Sunny Ahmar 5 and Freddy Mora-Poblete 5 Citation: Mafra, G.S.; de Almeida Filho, J.E.; do Amaral Junior, A.T.; Maldonado, C.; Kamphorst, S.H.; de Lima, V.J.; dos Santos Junior, D.R.; Leite, J.T.; Santos, P.H.A.D.; de Oliveira Santos, T.; et al. Regional Heritability Mapping of Quantitative Trait Loci Controlling Traits Related to Growth and Productivity in Popcorn (Zea mays L.). Plants 2021, 10, 1845. https://doi.org/10.3390/ plants10091845 Academic Editor: Tika Adhikari Received: 17 June 2021 Accepted: 31 August 2021 Published: 6 September 2021 Publisher’s Note: MDPI stays neutral with regard to jurisdictional claims in published maps and institutional affil- iations. Copyright: © 2021 by the authors. Licensee MDPI, Basel, Switzerland. This article is an open access article distributed under the terms and conditions of the Creative Commons Attribution (CC BY) license (https:// creativecommons.org/licenses/by/ 4.0/). 1 Centro de Ciências Agrárias, Universidade Estadual da Região Tocantina do Maranhão, R. Godofredo Viana, 1300, Imperatriz 65900-000, Brazil; [email protected] 2 Bayer, Estrada da Invernadinha, 2000, Coxilha 99145-000, Brazil; janeo.fi[email protected] 3 Laboratory of Plant Breeding, Center of Agricultural Science and Technology, Darcy Ribeiro State University of Northern Rio de Janeiro, Av. Alberto Lamego, 2000, Campos dos Goytacazes 28013-602, Brazil; [email protected] (S.H.K.); [email protected] (V.J.d.L.); [email protected] (D.R.d.S.J.); [email protected] (J.T.L.); [email protected] (P.H.A.D.S.); [email protected] (T.d.O.S.); [email protected] (R.B.B.); [email protected] (U.A.d.O.); [email protected] (V.B.P.); [email protected] (A.P.V.); [email protected] (C.C.G.C.) 4 Instituto de Ciencias Agroalimentarias, Animales y Ambientales, Universidad de O’Higgins, San Fernando 3070000, Chile; [email protected] 5 Institute of Biological Sciences, University of Talca, 1 Poniente 1141, Talca 3460000, Chile; [email protected] (S.A.); [email protected] (F.M.-P.) * Correspondence: [email protected]; Tel.: +55-22-999-220-192 Abstract: The method of regional heritability mapping (RHM) has become an important tool in the identification of quantitative trait loci (QTLs) controlling traits of interest in plants. Here, RHM was first applied in a breeding population of popcorn, to identify the QTLs and candidate genes involved in grain yield, plant height, kernel popping expansion, and first ear height, as well as determining the heritability of each significant genomic region. The study population consisted of 98 S1 families derived from the 9th recurrent selection cycle (C-9) of the open-pollinated variety UENF-14, which were genetically evaluated in two environments (ENV1 and ENV2). Seventeen and five genomic regions were mapped by the RHM method in ENV1 and ENV2, respectively. Subsequent genome- wide analysis based on the reference genome B73 revealed associations with forty-six candidate genes within these genomic regions, some of them are considered to be biologically important due to the proteins that they encode. The results obtained by the RHM method have the potential to contribute to knowledge on the genetic architecture of the growth and yield traits of popcorn, which might be used for marker-assisted selection in breeding programs. Keywords: candidate genes; linkage disequilibrium; genomic regions; regional heritability mapping; single nucleotide polymorphism 1. Introduction Maize (Zea mays L.) is among the most important cereal crops in the world in addition to wheat and rice [1], which has been widely cultivated due to its nutritional composition, versatility, and broad adaptability. Both the land area used for maize grain production and the amount of maize produced per unit area in Brazil has increased in recent years by 25% and 60%, respectively [2], which makes Brazil the third largest maize grain producer worldwide. Popcorn is a special type of maize primarily used for human consumption due Plants 2021, 10, 1845. https://doi.org/10.3390/plants10091845 https://www.mdpi.com/journal/plants
-
Upload
khangminh22 -
Category
Documents
-
view
1 -
download
0
Transcript of Regional Heritability Mapping of Quantitative Trait Loci ... - MDPI

plants
Article
Regional Heritability Mapping of Quantitative Trait LociControlling Traits Related to Growth and Productivity inPopcorn (Zea mays L.)
Gabrielle Sousa Mafra 1 , Janeo Eustáquio de Almeida Filho 2, Antônio Teixeira do Amaral Junior 3,* ,Carlos Maldonado 4, Samuel Henrique Kamphorst 3 , Valter Jário de Lima 3 , Divino Rosa dos Santos Junior 3,Jhean Torres Leite 3 , Pedro Henrique Araujo Diniz Santos 3 , Talles de Oliveira Santos 3 ,Rosimeire Barboza Bispo 3, Uéliton Alves de Oliveira 3, Vitor Batista Pinto 3, Alexandre Pio Viana 3,Caio Cezar Guedes Correa 3, Sunny Ahmar 5 and Freddy Mora-Poblete 5
�����������������
Citation: Mafra, G.S.; de Almeida
Filho, J.E.; do Amaral Junior, A.T.;
Maldonado, C.; Kamphorst, S.H.; de
Lima, V.J.; dos Santos Junior, D.R.;
Leite, J.T.; Santos, P.H.A.D.; de
Oliveira Santos, T.; et al. Regional
Heritability Mapping of Quantitative
Trait Loci Controlling Traits Related
to Growth and Productivity in
Popcorn (Zea mays L.). Plants 2021, 10,
1845. https://doi.org/10.3390/
plants10091845
Academic Editor: Tika Adhikari
Received: 17 June 2021
Accepted: 31 August 2021
Published: 6 September 2021
Publisher’s Note: MDPI stays neutral
with regard to jurisdictional claims in
published maps and institutional affil-
iations.
Copyright: © 2021 by the authors.
Licensee MDPI, Basel, Switzerland.
This article is an open access article
distributed under the terms and
conditions of the Creative Commons
Attribution (CC BY) license (https://
creativecommons.org/licenses/by/
4.0/).
1 Centro de Ciências Agrárias, Universidade Estadual da Região Tocantina do Maranhão, R. Godofredo Viana,1300, Imperatriz 65900-000, Brazil; [email protected]
2 Bayer, Estrada da Invernadinha, 2000, Coxilha 99145-000, Brazil; [email protected] Laboratory of Plant Breeding, Center of Agricultural Science and Technology, Darcy Ribeiro State University
of Northern Rio de Janeiro, Av. Alberto Lamego, 2000, Campos dos Goytacazes 28013-602, Brazil;[email protected] (S.H.K.); [email protected] (V.J.d.L.);[email protected] (D.R.d.S.J.); [email protected] (J.T.L.);[email protected] (P.H.A.D.S.); [email protected] (T.d.O.S.);[email protected] (R.B.B.); [email protected] (U.A.d.O.);[email protected] (V.B.P.); [email protected] (A.P.V.); [email protected] (C.C.G.C.)
4 Instituto de Ciencias Agroalimentarias, Animales y Ambientales, Universidad de O’Higgins,San Fernando 3070000, Chile; [email protected]
5 Institute of Biological Sciences, University of Talca, 1 Poniente 1141, Talca 3460000, Chile;[email protected] (S.A.); [email protected] (F.M.-P.)
* Correspondence: [email protected]; Tel.: +55-22-999-220-192
Abstract: The method of regional heritability mapping (RHM) has become an important tool in theidentification of quantitative trait loci (QTLs) controlling traits of interest in plants. Here, RHM wasfirst applied in a breeding population of popcorn, to identify the QTLs and candidate genes involvedin grain yield, plant height, kernel popping expansion, and first ear height, as well as determiningthe heritability of each significant genomic region. The study population consisted of 98 S1 familiesderived from the 9th recurrent selection cycle (C-9) of the open-pollinated variety UENF-14, whichwere genetically evaluated in two environments (ENV1 and ENV2). Seventeen and five genomicregions were mapped by the RHM method in ENV1 and ENV2, respectively. Subsequent genome-wide analysis based on the reference genome B73 revealed associations with forty-six candidategenes within these genomic regions, some of them are considered to be biologically important dueto the proteins that they encode. The results obtained by the RHM method have the potential tocontribute to knowledge on the genetic architecture of the growth and yield traits of popcorn, whichmight be used for marker-assisted selection in breeding programs.
Keywords: candidate genes; linkage disequilibrium; genomic regions; regional heritability mapping;single nucleotide polymorphism
1. Introduction
Maize (Zea mays L.) is among the most important cereal crops in the world in additionto wheat and rice [1], which has been widely cultivated due to its nutritional composition,versatility, and broad adaptability. Both the land area used for maize grain productionand the amount of maize produced per unit area in Brazil has increased in recent years by25% and 60%, respectively [2], which makes Brazil the third largest maize grain producerworldwide. Popcorn is a special type of maize primarily used for human consumption due
Plants 2021, 10, 1845. https://doi.org/10.3390/plants10091845 https://www.mdpi.com/journal/plants
Plants 2021, 10, 1845 2 of 18
to its exceptional nutritional and functional properties, i.e., the average dietary fiber contentof 17.79%, and low-calorie count when prepared without oil or fat [3]. The economicallymost important traits evaluated in popcorn breeding programs are grain yield (GY) andpopping expansion (PE) [4]. However, the selection of cultivars based on traits such asplant height (PH) and ear height (EH) have important effects on plant lodging in intensivemaize cultivation systems [1]. The yield (GY and PE) and growth (PH and EH) traits ofmaize are usually quantitatively inherited, and their genetic basis is controlled by theinteraction between multiple genetic and environmental factors [1,5–7].
A successful tool to explain the genetic basis of complex traits in association studies,which allow the identification of quantitative trait loci (QTLs) based on the significantassociations between genotypic markers and phenotypic data [8]. The identification ofQTLs related to PE and GY has been reported in several studies, for example, simplesequence repeat (SSR) and single-nucleotide polymorphism (SNP) markers [5,8–12]. Thakuret al. [10] identified three QTLs associated (using SSR markers) with the popping volume,which covers 78% of total phenotypic variance. Dell’Acqua et al. [12] identified threesuggestive QTLs for GY, of which the locus on the short arm of chromosome 6 was definedas a major QTL, accounting for 13% of the variance in GY. The identification of QTLsrelated to PE has mainly been reported using SSR markers, presenting a reduced numberof identified QTLs. This fact may be related to the low density of markers used. The useof high-throughput genotyping technologies has filled this gap, as they are more accurateand allow the deeper dissection of genomes of species such as popcorn [13].
The SNP has been widely used in association studies for the detection of a largenumber of QTLs and candidate genes involved in the yield and growth [8,14,15]. Despitetheir wide usage, association studies have been criticized, since according to certain studies,they are inefficient in detecting the total genetic variation of complex traits [16,17]. In thissense, some studies have reported that SNPs markers associated with a complex trait cantypically capture only a small proportion of genetic variance [10], which has been calledthe “missing heritability” problem [18].
Research in human genetics has shown that multiple independent loci with differentfrequencies and allelic effects are commonly located in the same gene region or short-segment regions [19,20]. These loci may be undetectable by single SNP analyses since thistype of analysis is not sufficiently sensitive to identify relatively small individual alleliceffects, even if the cumulative effect of the entire locus on the trait variance is high [17].
To overcome this drawback and capture most of the genetic variance that cannot becaptured by association studies, recent studies have proposed a method called regionalheritability mapping (RHM) [16,17], which facilitates the detection of the genetic variationrelated to each genome segment [16–18,21]. The RHM method uses a relationship matrixbetween individuals based on common and rare SNP information from small regions ofgenomes to estimate the trait variance explained by each region and localize variation [22].In RHM, the genomic and regional heritability is estimated using a mixed model basedon the restricted maximum likelihood (REML) and two components of variance; oneis attributed to the entire genome and the other to a specific genomic region [17]. It issuggested here that an approach with the RHM methodology could identify common andrare variants involved in the expression of complex traits, e.g., of grain yield and poppingexpansion in popcorn populations.
To date, studies based on RHM analysis are not well consolidated for plant species,since most research using this type of methodology has been developed to identify QTLsrelated to complex traits in humans and animals [17,22,23]. Thus far, few studies with plantspecies are available in the literature. Some examples are the comparisons of the method-ologies of association studies and RHM in Eucalyptus [18], in common bean (Phaseolusvulgaris L.) [24], and cassava (Manihot esculenta Crantz) [25]. Resende et al. [18] comparedan association analysis and RHM in complex traits of Eucalyptus and observed that RHMallowed the identification of 13 more QTLs than association analysis. In addition, theauthors observed that RHM outperformed the genome-wide association study analysis
Plants 2021, 10, 1845 3 of 18
for all traits evaluated, capturing, in general, two or three times the amount of genomicheritability. Similarly, RHM allowed a greater proportion of genomic heritability to beexplained compared to association analysis, in accessions of Phaseolus vulgaris L. [24].
To the best of our knowledge, this is the first study to apply RHM to understand thegenetic basis of complex traits in popcorn. The objectives of this study were to identifygenomic regions and candidate genes associated with growth (plant height and ear height),popping expansion, and grain yield of popcorn, as well as to examine the genomic heri-tability attributed to these traits, using regional heritability mapping with a mixed modelapproach.
2. Results
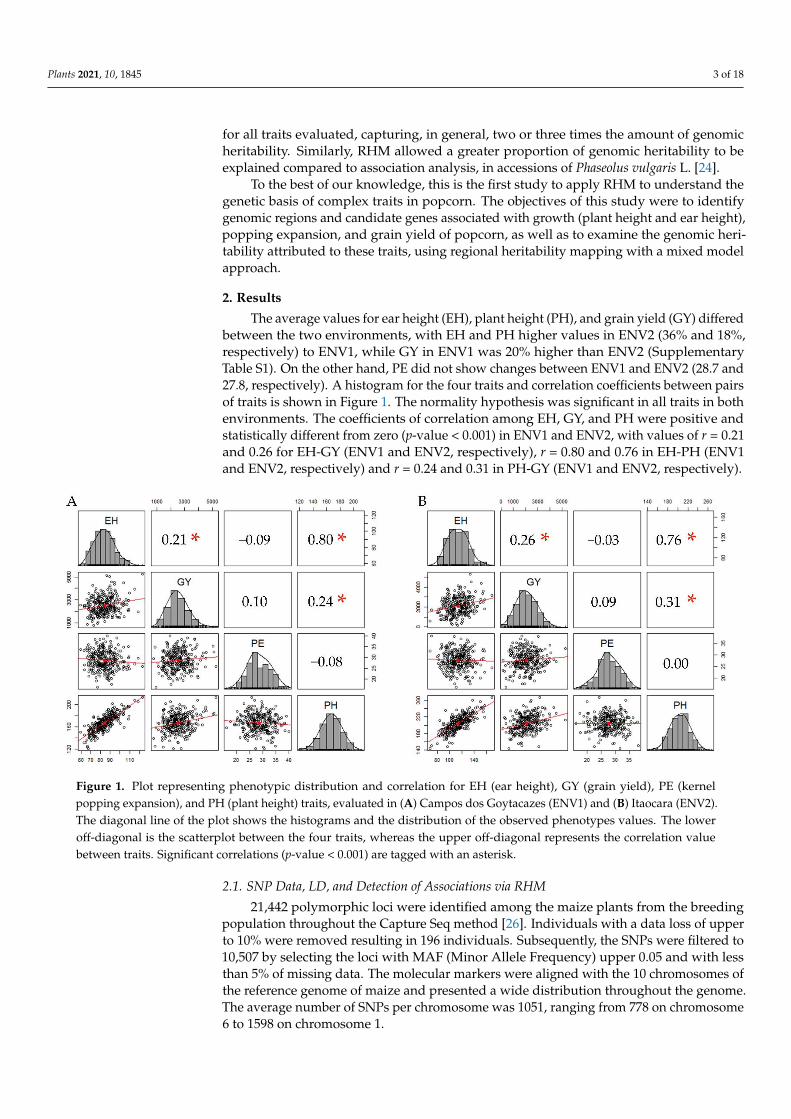
The average values for ear height (EH), plant height (PH), and grain yield (GY) differedbetween the two environments, with EH and PH higher values in ENV2 (36% and 18%,respectively) to ENV1, while GY in ENV1 was 20% higher than ENV2 (SupplementaryTable S1). On the other hand, PE did not show changes between ENV1 and ENV2 (28.7 and27.8, respectively). A histogram for the four traits and correlation coefficients between pairsof traits is shown in Figure 1. The normality hypothesis was significant in all traits in bothenvironments. The coefficients of correlation among EH, GY, and PH were positive andstatistically different from zero (p-value < 0.001) in ENV1 and ENV2, with values of r = 0.21and 0.26 for EH-GY (ENV1 and ENV2, respectively), r = 0.80 and 0.76 in EH-PH (ENV1and ENV2, respectively) and r = 0.24 and 0.31 in PH-GY (ENV1 and ENV2, respectively).
Plants 2021, 10, x FOR PEER REVIEW 3 of 19
that RHM allowed the identification of 13 more QTLs than association analysis. In addi-
tion, the authors observed that RHM outperformed the genome-wide association study
analysis for all traits evaluated, capturing, in general, two or three times the amount of
genomic heritability. Similarly, RHM allowed a greater proportion of genomic heritability
to be explained compared to association analysis, in accessions of Phaseolus vulgaris L. [24].
To the best of our knowledge, this is the first study to apply RHM to understand the
genetic basis of complex traits in popcorn. The objectives of this study were to identify
genomic regions and candidate genes associated with growth (plant height and ear
height), popping expansion, and grain yield of popcorn, as well as to examine the genomic
heritability attributed to these traits, using regional heritability mapping with a mixed
model approach.
2. Results
The average values for ear height (EH), plant height (PH), and grain yield (GY) dif-
fered between the two environments, with EH and PH higher values in ENV2 (36% and
18%, respectively) to ENV1, while GY in ENV1 was 20% higher than ENV2 (Supplemen-
tary Table S1). On the other hand, PE did not show changes between ENV1 and ENV2
(28.7 and 27.8, respectively). A histogram for the four traits and correlation coefficients
between pairs of traits is shown in Figure 1. The normality hypothesis was significant in
all traits in both environments. The coefficients of correlation among EH, GY, and PH
were positive and statistically different from zero (p-value < 0.001) in ENV1 and ENV2,
with values of r = 0.21 and 0.26 for EH-GY (ENV1 and ENV2, respectively), r = 0.80 and
0.76 in EH-PH (ENV1 and ENV2, respectively) and r = 0.24 and 0.31 in PH-GY (ENV1 and
ENV2, respectively).
Figure 1. Plot representing phenotypic distribution and correlation for EH (ear height), GY (grain yield), PE (kernel pop-
ping expansion), and PH (plant height) traits, evaluated in (A) Campos dos Goytacazes (ENV1) and (B) Itaocara (ENV2).
The diagonal line of the plot shows the histograms and the distribution of the observed phenotypes values. The lower off-
diagonal is the scatterplot between the four traits, whereas the upper off-diagonal represents the correlation value between
traits. Significant correlations (p-value < 0.001) are tagged with an asterisk.
2.1. SNP Data, LD, and Detection of Associations via RHM
21,442 polymorphic loci were identified among the maize plants from the breeding
population throughout the Capture Seq method [26]. Individuals with a data loss of upper
to 10% were removed resulting in 196 individuals. Subsequently, the SNPs were filtered
to 10,507 by selecting the loci with MAF (Minor Allele Frequency) upper 0.05 and with
Figure 1. Plot representing phenotypic distribution and correlation for EH (ear height), GY (grain yield), PE (kernelpopping expansion), and PH (plant height) traits, evaluated in (A) Campos dos Goytacazes (ENV1) and (B) Itaocara (ENV2).The diagonal line of the plot shows the histograms and the distribution of the observed phenotypes values. The loweroff-diagonal is the scatterplot between the four traits, whereas the upper off-diagonal represents the correlation valuebetween traits. Significant correlations (p-value < 0.001) are tagged with an asterisk.
2.1. SNP Data, LD, and Detection of Associations via RHM
21,442 polymorphic loci were identified among the maize plants from the breedingpopulation throughout the Capture Seq method [26]. Individuals with a data loss of upperto 10% were removed resulting in 196 individuals. Subsequently, the SNPs were filtered to10,507 by selecting the loci with MAF (Minor Allele Frequency) upper 0.05 and with lessthan 5% of missing data. The molecular markers were aligned with the 10 chromosomes ofthe reference genome of maize and presented a wide distribution throughout the genome.The average number of SNPs per chromosome was 1051, ranging from 778 on chromosome6 to 1598 on chromosome 1.

Plants 2021, 10, 1845 4 of 18
The pattern of LD was estimated for each chromosome considering all SNPs belongingto the same chromosome. The slowest LD decay was observed in chromosome 8, in whichhalf of the decay occurred at ~151 Kb (kilobase pairs), while chromosome 4 decreased thefastest, in which half of the decay was observed at ~76 Kb. The average half of the LDacross the chromosomes was ~110 Kb ± 6.82 (Figure 2). This result is consistent with thatpreviously reported by [27], which observed that with the same population, half of the LDoccurred in ~107 Kb.
Plants 2021, 10, x FOR PEER REVIEW 4 of 19
less than 5% of missing data. The molecular markers were aligned with the 10 chromo-
somes of the reference genome of maize and presented a wide distribution throughout
the genome. The average number of SNPs per chromosome was 1051, ranging from 778
on chromosome 6 to 1598 on chromosome 1.
The pattern of LD was estimated for each chromosome considering all SNPs belong-
ing to the same chromosome. The slowest LD decay was observed in chromosome 8, in
which half of the decay occurred at ~151 Kb (kilobase pairs), while chromosome 4 de-
creased the fastest, in which half of the decay was observed at ~76 Kb. The average half of
the LD across the chromosomes was ~110 Kb ± 6.82 (Figure 2). This result is consistent
with that previously reported by [27], which observed that with the same population, half
of the LD occurred in ~107 Kb.
Figure 2. Decay of linkage disequilibrium (LD) of all SNPs (10.507) in the ten chromosomes estimated by r2 (y-axis) along
with physical distance in Mb (x-axis).
Seventeen QTLs were found by RHM in ENV1, each encompassing between 2 and 8
SNPs on chromosomes 1, 2, 4, 5, 6, and 8, while in ENV2, five QTLs were mapped, which
ranged between 2 and 9 SNPs on chromosomes 2, 4 and 7 (Figures 3 and 4). In ENV1, the
regional QTLs for EH and PH were located on individual chromosomes, while QTLs for
GY and PE were mapped on several different chromosomes (Figure 3 and Supplementary
Table S2). Notably, three regionals QTL (two associated with GY and one associated with
PE) were detected at the same positions as the QTLs detected by Mafra et al. [8] using
SNP-based mixed-model association (Supplementary Table S2). In ENV2 (Figure 4 and
Supplementary Table S2), for trait GY, regional QTLs were identified on individual chro-
mosomes, while for EH, they were mapped on different chromosomes. Heritability varied
between 0.079 (EH) and 0.93 (GY) in ENV1 and between 0.078 (GY) and 0.14 (EH) in ENV2.
The genome-wide distribution of regional heritability QTLs mapped by RHM along the
10 maize chromosomes are shown in Figures 3 and 4, displaying significant QTLs (p-value
≤ 0.001, or −log10 (p-value) ≥ 3) found in ENV 1 and ENV 2, respectively.
Figure 2. Decay of linkage disequilibrium (LD) of all SNPs (10.507) in the ten chromosomes estimated by r2 (y-axis) alongwith physical distance in Mb (x-axis).
Seventeen QTLs were found by RHM in ENV1, each encompassing between 2 and8 SNPs on chromosomes 1, 2, 4, 5, 6, and 8, while in ENV2, five QTLs were mapped, whichranged between 2 and 9 SNPs on chromosomes 2, 4 and 7 (Figures 3 and 4). In ENV1, theregional QTLs for EH and PH were located on individual chromosomes, while QTLs forGY and PE were mapped on several different chromosomes (Figure 3 and SupplementaryTable S2). Notably, three regionals QTL (two associated with GY and one associatedwith PE) were detected at the same positions as the QTLs detected by Mafra et al. [8]using SNP-based mixed-model association (Supplementary Table S2). In ENV2 (Figure 4and Supplementary Table S2), for trait GY, regional QTLs were identified on individualchromosomes, while for EH, they were mapped on different chromosomes. Heritabilityvaried between 0.079 (EH) and 0.93 (GY) in ENV1 and between 0.078 (GY) and 0.14 (EH)in ENV2. The genome-wide distribution of regional heritability QTLs mapped by RHMalong the 10 maize chromosomes are shown in Figures 3 and 4, displaying significant QTLs(p-value ≤ 0.001, or −log10 (p-value) ≥ 3) found in ENV 1 and ENV 2, respectively.

Plants 2021, 10, 1845 5 of 18Plants 2021, 10, x FOR PEER REVIEW 5 of 19
Figure 3. Manhattan plots of the statistical significance of the genomic regions associates with the GY, PE, PH, and EH
traits in Campos dos Goytacazes (ENV1). The x-axis shows chromosomal positions and the y-axis shows −log10 p-values.
The blue horizontal line represents the genome-wide significance threshold (p-value = 1 × 10⁻³).
Figure 3. Manhattan plots of the statistical significance of the genomic regions associates with the GY, PE, PH, and EH traitsin Campos dos Goytacazes (ENV1). The x-axis shows chromosomal positions and the y-axis shows −log10 p-values. Theblue horizontal line represents the genome-wide significance threshold (p-value = 1 × 10⁻³).
Plants 2021, 10, x FOR PEER REVIEW 6 of 19
Figure 4. Manhattan plots of the statistical significance of the genomic regions associates with the GY, PE, PH, and EH
traits in Itaocara (ENV2). The x-axis shows chromosomal positions and the y-axis shows −log10 p-values. The blue hori-
zontal line represents the genome-wide significance threshold (p-value = 1 × 10⁻³).
2.2. Gene Identification in QTL Regions
As the main findings by RHM in both environments, possible candidate genes were
identified based on the physical position of reference genome B73 (Tables 1 and 2) and
regions significantly associated with the traits. Forty-six candidate genes were found
within these regions, of which thirty-seven candidate genes were found to be associated
with GY, PE, and PH of ENV1, and nine to the EH and GY traits in ENV2. Notably, in the
PE (ENV1) and PH (ENV1), the regions 13388849-13488849 (chromosome 2) and
171723438-171823438 (chromosome 8) presented the largest number of associated candi-
date genes (8 and 7, respectively).
Figure 4. Cont.

Plants 2021, 10, 1845 6 of 18
Plants 2021, 10, x FOR PEER REVIEW 6 of 19
Figure 4. Manhattan plots of the statistical significance of the genomic regions associates with the GY, PE, PH, and EH
traits in Itaocara (ENV2). The x-axis shows chromosomal positions and the y-axis shows −log10 p-values. The blue hori-
zontal line represents the genome-wide significance threshold (p-value = 1 × 10⁻³).
2.2. Gene Identification in QTL Regions
As the main findings by RHM in both environments, possible candidate genes were
identified based on the physical position of reference genome B73 (Tables 1 and 2) and
regions significantly associated with the traits. Forty-six candidate genes were found
within these regions, of which thirty-seven candidate genes were found to be associated
with GY, PE, and PH of ENV1, and nine to the EH and GY traits in ENV2. Notably, in the
PE (ENV1) and PH (ENV1), the regions 13388849-13488849 (chromosome 2) and
171723438-171823438 (chromosome 8) presented the largest number of associated candi-
date genes (8 and 7, respectively).
Figure 4. Manhattan plots of the statistical significance of the genomic regions associates with the GY, PE, PH, and EH traitsin Itaocara (ENV2). The x-axis shows chromosomal positions and the y-axis shows −log10 p-values. The blue horizontalline represents the genome-wide significance threshold (p-value = 1 × 10⁻³).
2.2. Gene Identification in QTL Regions
As the main findings by RHM in both environments, possible candidate genes wereidentified based on the physical position of reference genome B73 (Tables 1 and 2) andregions significantly associated with the traits. Forty-six candidate genes were found withinthese regions, of which thirty-seven candidate genes were found to be associated with GY,PE, and PH of ENV1, and nine to the EH and GY traits in ENV2. Notably, in the PE (ENV1)and PH (ENV1), the regions 13388849-13488849 (chromosome 2) and 171723438-171823438(chromosome 8) presented the largest number of associated candidate genes (8 and 7,respectively).
Table 1. Candidate genes detected by regional heritability analysis for four traits of interest for popcorn in environmentENV1.
Trait * Chrom. Minor-Major Position(Base Pairs) Gene ID Annotation Putative Function
GY 1 48905387-49005387 GRMZM2G003984 Lon-like ATP-dependent protease Seed germination [28]
GY 1 56805387-56905387 GRMZM2G069618 TPR domain-containing protein Plant development [29]
GY 1 56855387-56955387 GRMZM2G353147 GTP diphosphokinase/stringentfactor Plant fertilization [30]
GY 6 165623194-165723194GRMZM5G846343 Protein of unknown function ** NA
GRMZM5G846057 AP2 domain (AP2) Growth and developmentof plant tissues [31]
GY 2 225088849-225188849GRMZM2G037993 Respiratory burst oxidase homolog
protein a-related Root development [32]
GRMZM2G015945 Respiratory burst oxidase homologprotein b Pathogen resistance [33]
GY 2 225138849-225238849 GRMZM2G414114
Dnaj domain (dnaj) //TCP familytranscription factor
(TCP)//transposase-associateddomain
Growth of axillary organsand corn ear formation
[34]
GRMZM2G114948 Plant protein of unknown function ** NA
GRMZM2G023328 Arginine and glutamate-rich protein1 (ARGLU1) ** NA
GRMZM2G023585 Hira-interacting protein 3 ** NA

Plants 2021, 10, 1845 7 of 18
Table 1. Cont.
Trait * Chrom. Minor-Major Position(Base Pairs) Gene ID Annotation Putative Function
GY 4 219528603-219628603 GRMZM2G043242 Zinc finger cw-type coiled-coildomain protein 3
Plant immunity todisease [35]
GY 4 219578603-219678603 GRMZM2G109159 Reticulon-like protein Seed filling [36]
PE 2 13388849-13488849 GRMZM5G886913 Predicted membrane protein Essential for manyfunctions [37]
GRMZM2G051958 Phosphoenolpyruvatecarboxykinase ATP
Involved in the coating ofseeds and cotyledons [38]
GRMZM2G354053 Myosin heavy chain-related//
Movement of the Golgicomplex and
mitochondria in plantcells [39].
GRMZM5G866405 Isoleucine–tRNAligase/Isoleucyl-tRNA synthetase ** NA
GRMZM5G899760GDP dissociation inhibitor
(GDI)//transcription initiationfactor IIA,
Pollen germination andtube growth [40]
GRMZM2G059791 2-keto-3-deoxy-l-rhamnonatealdolase ** NA
GRMZM2G359331 Myosin heavy chain-related
Movement of the Golgicomplex and
mitochondria in plantcells [39]
AC195235.3_FG003 PhosphoglyceromutaseConcentration increase in
iron-deficient Cucumissativus L. roots [41]
PE 5 13560296-13660296 GRMZM2G461948 Ubiquitin-protein ligase ** NA
AC194618.2_FG008 DNA(??) homolog subfamily cmember
Cold tolerance intransgenic tomato plants
[42]
PE 5 13560296-13660296 GRMZM2G461959 Serine/threonine-proteinphosphatase pp2a-1 catalytic
Expressed in stems,flowers, and roots of
Oryza sativa [43]
GRMZM2G461936 Translation initiation factor 2C(eif-2C)
Regulation of variousaspects of plant
development and theirinteractions with the
environment [44]
GRMZM2G161242 Protein Y55F3AM.3, isoform a ** NA
GRMZM2G161222Serine/threonine-protein
phosphatase 2a 57 kDa regulatorysubunit β’ alpha isoform
Control of biotic andabiotic stress responses in
plants [45]
GRMZM2G148130 Ubiquitin-conjugating enzymeE2 16
Maintenance of normalmaize growth understress conditions [46]
PE 5 13610296-13710296 GRMZM2G148098 Homeobox protein transcriptionfactors
Maintenance of adequatemeristem and organ
initiation [47]
GRMZM2G122185 Pre-mRNA splicing factor Temperature signaling inplants [48]
PH 8 171723438-171823438 GRMZM2G133249 Insulysin (IDE, ide) Beta-amyloid (Aβ)degradation [49]
GRMZM2G562929 Proteasome subunit alpha type-4 ** NA
GRMZM2G133175 Cysteine-rich TM module stresstolerance (CYSTM)
Tolerance to heavymetals, such as cadmium
and copper [50]
GRMZM2G133029 Aspartyl protease family protein Plant defense againstfungi [51]
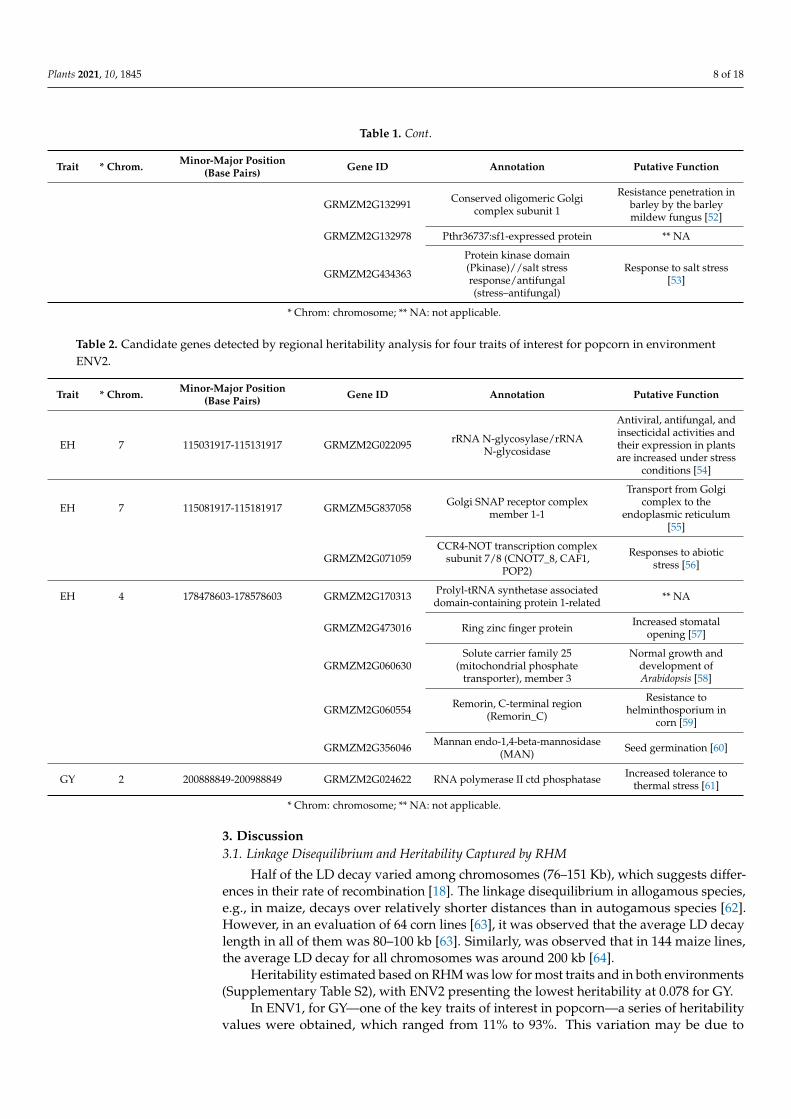
Plants 2021, 10, 1845 8 of 18
Table 1. Cont.
Trait * Chrom. Minor-Major Position(Base Pairs) Gene ID Annotation Putative Function
GRMZM2G132991 Conserved oligomeric Golgicomplex subunit 1
Resistance penetration inbarley by the barleymildew fungus [52]
GRMZM2G132978 Pthr36737:sf1-expressed protein ** NA
GRMZM2G434363
Protein kinase domain(Pkinase)//salt stressresponse/antifungal(stress–antifungal)
Response to salt stress[53]
* Chrom: chromosome; ** NA: not applicable.
Table 2. Candidate genes detected by regional heritability analysis for four traits of interest for popcorn in environmentENV2.
Trait * Chrom. Minor-Major Position(Base Pairs) Gene ID Annotation Putative Function
EH 7 115031917-115131917 GRMZM2G022095 rRNA N-glycosylase/rRNAN-glycosidase
Antiviral, antifungal, andinsecticidal activities andtheir expression in plantsare increased under stress
conditions [54]
EH 7 115081917-115181917 GRMZM5G837058 Golgi SNAP receptor complexmember 1-1
Transport from Golgicomplex to the
endoplasmic reticulum[55]
GRMZM2G071059CCR4-NOT transcription complex
subunit 7/8 (CNOT7_8, CAF1,POP2)
Responses to abioticstress [56]
EH 4 178478603-178578603 GRMZM2G170313 Prolyl-tRNA synthetase associateddomain-containing protein 1-related ** NA
GRMZM2G473016 Ring zinc finger protein Increased stomatalopening [57]
GRMZM2G060630Solute carrier family 25
(mitochondrial phosphatetransporter), member 3
Normal growth anddevelopment ofArabidopsis [58]
GRMZM2G060554 Remorin, C-terminal region(Remorin_C)
Resistance tohelminthosporium in
corn [59]
GRMZM2G356046 Mannan endo-1,4-beta-mannosidase(MAN) Seed germination [60]
GY 2 200888849-200988849 GRMZM2G024622 RNA polymerase II ctd phosphatase Increased tolerance tothermal stress [61]
* Chrom: chromosome; ** NA: not applicable.
3. Discussion3.1. Linkage Disequilibrium and Heritability Captured by RHM
Half of the LD decay varied among chromosomes (76–151 Kb), which suggests differ-ences in their rate of recombination [18]. The linkage disequilibrium in allogamous species,e.g., in maize, decays over relatively shorter distances than in autogamous species [62].However, in an evaluation of 64 corn lines [63], it was observed that the average LD decaylength in all of them was 80–100 kb [63]. Similarly, was observed that in 144 maize lines,the average LD decay for all chromosomes was around 200 kb [64].
Heritability estimated based on RHM was low for most traits and in both environments(Supplementary Table S2), with ENV2 presenting the lowest heritability at 0.078 for GY.
In ENV1, for GY—one of the key traits of interest in popcorn—a series of heritabilityvalues were obtained, which ranged from 11% to 93%. This variation may be due to

Plants 2021, 10, 1845 9 of 18
population effects, environmental factors, or experimental precision [24], or, more likely,genome partitioning caused by the RHM methodology. Moreover, simulating data ofparental lines, genotypes, and phenotypes F1 and F2 and using the maximum likelihoodapproach by interval mapping for low heritability QTLs and high SNP density, obtained avalue of approximately 95% heritability for GY when using a sample number of 200 [65].
Previous studies have reported that the trait heritability of GY varies from low tomoderate [66,67], indicating a lower additive genetic control and high environmentalinfluence. However, other research has claimed that the heritability of GY is high andsignificant [68,69] and suggested, therefore, that these values depend on the populationunder study. In the UENF-14 population intrapopulation recurrent selection program, itwas observed that heritability remained stable in cycles 4, 5 and 6 (45.97%, 51.94%, and45.04%, respectively) [70]. In addition, a heritability of 91% for GY was observed in cycle9 of the same population [71]. In research carried out by Resende and collaborators [24],the estimated genomic heritability captured a relatively large proportion (72%) of the totalheritability of the traits. This was useful in identifying favorable alleles for GY of Phaseolusvulgaris L, demonstrating that the RHM method was effective in detecting the hereditaryportion of the trait in the population.
On the other hand, in ENV1, the inheritable proportion of total variability of PH andEH traits was the lowest (Supplementary Table S2). Some hypotheses can be raised inthis regard, e.g., the fact that the traits EH and PH are directly correlated and have a highheritability [7]. However, when partitioning the genome, as in the RHM method, the valueswithin each genomic window may be too low to be detected by the analysis. The sameis not true for GY, for which the highest heritability values were recorded by RHM, andwhich, despite the strong environmental influence on it [66,67], has been shown to remainstable in successive cycles of intrapopulation recurrent selection in the population sampledhere [70,71].
3.2. RHM Analysis and Candidate Genes
Among the QTLs observed in ENV1, some genes were considered to be biologicallyimportant due to their encoded proteins and proven participation in the studied traits.
The GRMZM2G069618 gene reported to be involved in the expression of GY encodesthe protein containing the tetratricopeptide repeat domain (TPR). The TPR is involvedwith numerous outstanding functions in plant organisms, for example, hybrid sterilityin rice [72], hormonal signaling and stress [73], root development [29], and failure ofendosperm development, with a consequent reduction in seed number [74]. In addition, inrice, TPR may be involved in amylose content, grain appearance, physical and chemicalproperties [75], and grain size and starch quality [76]. The results found in this studycorroborate the hypotheses of TPR can be directly involved with the expression of kernelweight in popcorn, consequently influencing the GY trait.
The GRMZM5G846057 gene, linked to the GY trait, is related to the AP2 domain (AP2)protein. APETALA2/ethylene proteins (AP2/EREBPs) are the main regulators of responsesto plant development, growth, and stress [77,78]. AP2/EREBP genes play a crucial rolein responding to various environmental stresses in cotton [77]. ERF transcription factorsare AP2/EREBP proteins that contain only one AP2 domain and constitute the largestsubfamily of the AP2/EREBP family [78]. Although a direct relationship has not beenidentified between GRMZM5G846057 and GY, this trait seems to be directly influencedby abiotic stress, as reported in several studies [79–83]. Therefore, it is possible to suggestthat the trait GY is related to responses to stresses and when there is a reduction in grainyield, there is also overexpression of the GRMZM5G846057 gene, which codes AP2/EREBP,related to stresses in plants.
The GRMZM2G414114 gene, which is related to the expression of the protein DNAj (??)domain//TCP family transcription factor//Transposase-associated domain, is involvedwith grain yield. This protein, called TCT, refers to transcription factors observed in plantsand is involved in the growth and development of several species [84], including the

Plants 2021, 10, 1845 10 of 18
growth of axillary organs and corn ear formation [34], formation of the shoot meristem andshoot development of Arabidopsis [85], and development or ripening of tomato fruits [86].Thus, the involvement of TCP in the development process of popcorn kernels can besuggested, since kernel weight is directly related to the total trait yield, represented here bythe acronym GY.
The GRMZM2G051958 gene, responsible for coding the enzyme phosphoenolpyruvatecarboxykinase ATP (PEPCK), is involved in the expression of the trait PE. Studies reportthat this protein plays a significant role in the photosynthesis of C4 plants of the Poaceaefamily, in which corn is inserted [87], as well as the increase in the photosynthetic rate ofwheat plants with a significant increase in the grain yield of the species [88,89]. In addition,research reports the importance of the enzyme phosphoenolpyruvate carboxykinase inthe development of seeds of species such as peas (Pisum sativum), highly involved in thecoating of seeds and cotyledons [38]. An overexpression of PEPCK in common bean seedswas found to raise protein accumulation in the organ [90].
GRMZM2G069618, GRMZM2G414114, and GRMZM2G051958 encode proteins thatwould directly affect GY by regulating the weight and size of grains, increase in thephotosynthetic rate, and the physical and chemical properties of popcorn. Moreover, thesegenes are involved in the growth and development of plants, and the development processof popcorn kernels, key aspects in the GY. Particularly, GRMZM2G051958 has shown asignificant increase in the grain yield in wheat through an increase in the photosyntheticrate. On the other hand, GRMZM5G846057 encodes a protein AP2, which regulates the GYin conditions of abiotic stress. In this sense, Xu et al. [91] overexpressed the ZmCBF3 (amaize AP2/ERF-type transcription factor) in rice plants, and they showed that toleranceto drought stress was improved without not affect the grain yield. Therefore, advancingthe knowledge of this gene in popcorn can help preserve GY under conditions of droughtstress, an important aspect considering current climatic conditions.
A relationship between PH and the GRMZM2G133175 gene, which encodes a cysteine-rich TM module stress tolerance (CYSTM), was observed. The cysteine-rich transmembranemodule CYSTM, commonly found in eukaryotes, is composed of a small family of molec-ular proteins [92]. The CYSTM genes exhibit a broad and constant expression patternthat may play vital roles in plant growth and development [92]. Moreover, this modulewas responsible for conferring tolerance to heavy metals such as cadmium and copperin Digitaria ciliaris and Oryza sativa [50], and resistance to abiotic stress in Arabidopsisthaliana [92]. Xu et al. [92] suggest that the CYSTM family, as newly discovered smallpeptides, plays multiple roles in plant growth and development, especially in response toabiotic stresses.
In ENV2, the GRMZM2G060630 gene, which encodes the mitochondrial phosphatetransporter (MPT) member 3 protein, was related to EH. Mitochondrial phosphate trans-porters have been identified as responsible for plant responses to salt stress in Arabidopsisthaliana [93] and indispensable for the growth and development of plants of this species [58].This led to the assumption of their direct involvement in growth related to the insertionheight of the first ear (EH) in popcorn plants. Jia et al. [58] suggested that MPT3 playedimportant role in regulating plant growth and development in Arabidopsis.
The RHM approach to the analysis of SNP data has the potential to explain part of themissing heritability by capturing QTL variance from small regions of the genome, whichescape the standard association, single SNP-based studies. For example, Mafra et al. [8], inthis same population, observed that heritability estimates for the SNP markers allowedthem to capture <0.01 in GY for ENV1, while the RHM method registered a heritabilitybetween 0.11 and 0.93, capturing the missing heritability in this trait. Therefore, the RHMstrategy used in the present study was proven to be useful and robust, complementary toother association analyses. Moreover, RHM analysis identified QTLs and candidate genesrelated to traits of interest, which can be incorporated into breeding programs and genomicselection strategies in maize.

Plants 2021, 10, 1845 11 of 18
4. Materials and Methods4.1. Study Population and Phenotypic Evaluations
The study was carried out in August 2016, at the Research Station of the Antônio SarloState College of Agriculture (21◦43′14.8′′ S, 41◦20′38.3′′ W), in the county of Campos dosGoytacazes (Rio de Janeiro—RJ) (hereafter ENV1), and on an experimental field of the StateUniversity of Northern Rio de Janeiro—UENF (21◦38′45.2 S 42◦03′16.3′′ W), on the IlhaBarra do Pomba, county of Itaocara (Rio de Janeiro—RJ) (henceforth ENV2). The ENV1has a dry tropical climate with an average annual temperature around 24 ◦C and annualprecipitation of 1112 mm [94], while ENV2 has a warm climate with an average annualtemperature around 22.5 ◦C and annual precipitation of 1041 mm [95].
The study population consisted of 98 S1 families derived from the 9th recurrentselection cycle (C-9) of the open-pollinated variety UENF-14 [96–98], which was developedfrom five cycles of recurrent selection of the population UNB-2U. The UNB-2U was derivedfrom UNB-2 after two mass selection cycles in Campos dos Goytacazes, Rio de Janeiro,Brazil [99]. After five cycles of intrapopulation recurrent selection of UNB-2U, the cultivarUENF-14 was launched [96], and today it is in the 9th cycle of recurrent selection (C-9),used in this research.
The cycles of recurrent selection to obtain the studied population were obtainedthrough the strategies described in Table 3, with their respective gains in PE% and GY%.
Table 3. Genetic gains across recurrent selection cycles in the UNB-2U population.
Cycle Reference Strategy PE (%) * GY (%) *
1◦ Daros et al. [97] Full-sib families 10.39 4.692◦ Daros et al. [98] Inbred families (S1) 17.8 26.953◦ Santos et al. [99] Half-sibling families 7.16 10.004◦ Freitas Júnior et al. [100] Full-sib families 10.58 7.715◦ Rangel et al. [101] Full-sib families 6.01 8.536◦ Ribeiro et al. [69] Full-sib families 10.97 15.307◦ Freitas et al. [102] Full-sib families 5.11 7.788◦ Guimarães et al. [71] Full-sib families 3.61 4.60
Cycle: selection cycle; Reference: started by the first author of the publication of the article referring to therespective cycle; PE: kernel popping expansion; GY: grain yield; * Genetic gains (in percentage) for each selectioncycle.
The tests were designed in incomplete blocks with three orthogonal repetitions. Seedsof each family were sown in a 5 m long row, at a spacing of 0.90 m between rows and 0.20 mbetween plants. When necessary, cultural treatments were carried out as recommended forthe crop.
At both locations, the main traits of agronomic interest for the crop were measured:grain yield (GY, Kg/ha), kernel popping expansion (PE, mL/g), plant height (PH, cm), andthe first ear height (EH, cm). GY was measured after the threshing process of all ears inthe plot, where the weight (weighed on a precision scale) in Kg of the kernels per plot wastransformed to kg ha−1. PE was measured by weighing 30 g kernels per plot on a precisionscale; then, these were inserted into kraft paper bags and microwaved for 2 min 20 s.Afterward, the popped kernels were filled in 2000 mL beakers, and the resulting volumewas divided by the initial kernel weight (30 g of grains). PH was measured from the soillevel to the flag leaf insertion in six healthy plants per plot (with a ruler). Similarly, EH wasmeasured in six healthy plants per plot, from the soil level to the insertion of the first ear(with a ruler). Data from the phenotypic evaluations are shown in Supplementary Table S1.The phenotypic data were adjusted using the lme4 package [103] in R software [104], bythe following mixed model:
y = Xβ1 + Z1b + Z2 p + e (1)

Plants 2021, 10, 1845 12 of 18
where y is the phenotype vector of a given trait; β1 is the vector with fixed effects, includ-ing intercept, repetition, and covariates such as the number of plants per plot, countedimmediately after thinning and kernel moisture, for the traits GY and PE [8]; b is a vectorof block effects within replications; p is the progeny effect, assumed as fixed to estimatethe adjusted means (with package LSMeans) [105]; e is the vector of residual effects of themodel. X is the incidence matrix of systematic fixed effects, and Z1,2 are incidence matricesof random effects.
4.2. Genotyping
Genomic DNA was extracted from the young leaves of 200 plants, from the breedingpopulation, using the standard CTAB method of Doyle and Doyle [106] with modifications.The collected DNA samples were sent to the company Rapid Genomics LLC for sequencingby the Capture Seq method [26], with 5000 well-distributed probes in the maize referencegenome. These probes are selected and obtained from known reference regions, availablein the database. In the Capture Seq method, the genomic DNA is fragmented to hybridizewith barcode adapters. After the probes have captured the target fragments amplified, thelibraries are assembled for sequencing. Subsequently, the sequencing data file is filtered byindividual barcodes and is aligned by the reference genome.
4.3. Genetic Aspects of the Population
From the panel of 10,507 SNPs and 196 individuals, the Genetic Relationship Ma-trix (GRM) was calculated, with the rrBLUP package [107], based on the algorithm ofVanRaden [108]. This same panel of genotypic data was used to estimate the linkagedisequilibrium (LD), based on r2 statistics, using PLINK software [109]. To analyze the LDdecay across the genome, the nonlinear model proposed by Hill and Weir [110] was fitted,using the nlm function of the R language [104].
4.4. Regional Heritability Mapping
Regional heritability mapping provides heritability estimates for genomic segmentscontaining common and rare allelic effects [24]. The RHM model presented in the followingequation was adjusted using the Regress package [111] in R software [104].
y = Xβ1 + Z1b + Z2 r + Z3 u + e (2)
where y is the vector with the phenotypes of a given trait; β1 is the vector with fixedeffects—intercept, repetition and covariables such as the number of plants per plot, countedimmediately after thinning and kernel moisture for the traits GY and PE; b is the vector ofblock effects; r is the vector of random regional genomic additive effects; u is the vector ofpolygenic effects; e is the residual effect vector of the model. X is the incidence matrix ofsystematic fixed effects, and Z1,2,3 are incidence matrices of random effects.
The following was assumed:
b∣∣∣σ2
b ∼ N(
0, Iσ2b
); r∣∣∣σ2
r ∼ N(
0, Gregσ2r
); u∣∣∣σ2
u ∼ N(
0, Gσ2u
); e∣∣∣σ2
e ∼ N(
0, Iσ2e
); (3)
cov(u, b′
)= cov
(u, e′
)= cov
(b, e′
)= 0 (4)
where G is the genomic matrix of kinship, calculated with the rrBLUP package [107], basedon the algorithm of VanRaden [108]; Greg is a matrix similar to G, but uses a subset of matrixW (W is the SNP marker incidence matrix assuming W ⊂ (−1, 0, 1)). These subsets weredetermined by 100 kb long genomic “windows” or “regions”, with overlapping stretches of50 kb (for example, the first three regions are 0–100, 50–150, and 100–150 kb), correspondingto the estimated LD—see Results section); Ib and In are identity matrices with the sameorder as that of the number of incomplete blocks and number of observations, respectively;σ2
b , σ2r , σ2
u , and σ2e are the components of variance associated with b, r, u, and e, respectively.
These components were estimated by REML, using the average information (AI) algorithm.

Plants 2021, 10, 1845 13 of 18
RHM was adjusted by the Regress package [111], in language R 3.2.3 [103], according tothe procedure proposed by Resende [18]. Significance testing was based on a likelihoodratio test statistic (LRT) with p-value ≤ 0.001, or −log10 (p-value) ≥3.
For each segment of the genomic window, the regional heritability was determined bythe following equation:
cov(u, b′
)= cov
(u, e′
)= cov
(b, e′
)= 0 (5)
where σ2r , σ2
g , and σ2e are the components of variance associated with r, g, and e, respectively.
4.5. Identification of Candidate Genes
The QTLs identified by RHM analysis were subjected to gene identification analysis,using the public maize genome data set, based on the reference genome B73 version 3(gene annotation in the B73 Zea mays AGPv3 assembly) [112]. Functional gene annotationswere identified using the Phytozome genome browser (https://phytozome.jgi.doe.gov/pz/portal.html, (accessed on 10 November 2020)). The gene search regions were definedaccording to the start and end position of each region. The genes detected within theseregions were defined as candidate genes.
5. Conclusions
RHM allowed us to combine common and rare variants within the same analysis,which provided valuable information on the genetic architecture of yield and growth traits.It was confirmed that RHM has the potential to explain some portion of missing heritabilityby capturing variance caused by QTL with low MAF and multiple independent QTLwithin a region, as determined for grain yield. Moreover, the genomic regions identifiedby RHM allowed further examination towards candidate genes discovery. In this regard,a total of 22 genomic regions were identified in both tropical environments, which maybe related to the adaptability of the genotypes to each environment. Subsequent geneidentification study revealed associations with several genes with a known function inplants. Forty-six candidate genes were associated with these genomic regions, of whichseven are considered to be biologically important, encoding proteins that participate inplant development processes, and suggesting different roles in the performance of functionsrelated to popcorn growth and yield. The QTLs and candidate genes detected in this studybroaden the knowledge on the molecular basis of these important agronomic traits andcould potentially help to increase the efficiency of popcorn breeding programs, creatingnew opportunities for the development and selection of elite breeding genotypes.
Supplementary Materials: The following are available online at https://www.mdpi.com/article/10.3390/plants10091845/s1, Table S1: Phenotypic data of 98 genotypes evaluated in the environmentsof Campos dos Goytacazes (ENV1) and Itaocara (ENV2).Table S2: Genomic regions detected byregional heritability mapping (RHM) in 0.1 Mb genomic segments with a 0.05 Mb sliding windowfor traits grain yield (GY), kernel popping expansion (PE), plant height (PH), and ear height (EH)evaluated in a popcorn population under intrapopulation recurrent selection in the environments ofCampos dos Goytacazes (ENV1) and Itaocara (ENV2).
Author Contributions: Conceptualization, methodology, investigation and formal analysis, G.S.M.,J.E.d.A.F., A.T.d.A.J. and S.H.K.; writing—original draft preparation, G.S.M.; data curation, G.S.M.,J.E.d.A.F. and C.C.G.C.; writing—original draft preparation, project administration and fundingacquisition, A.T.d.A.J.; software, resources, validation, and formal analysis, C.M. and F.M.-P.; con-ceptualization, V.J.d.L., D.R.d.S.J. and J.T.L.; writing—review and editing, C.M., P.H.A.D.S., T.d.O.S.,R.B.B., U.A.d.O. and S.A.; conceptualization, S.A., V.B.P., A.P.V. and C.C.G.C.; supervision, A.T.d.A.J.and F.M.-P. All authors have read and agreed to the published version of the manuscript.
Funding: This study was partially financed by the Coordination for the Improvement of HigherEducation Personnel (CAPES), Brazil, finance code 001, to D.R.d.S.J., J.T.L., R.B.B., and U.T.L. Fundingwas also provided by Rio de Janeiro State Research Support Foundation (FAPERJ), with the projectnumbers E26/200.585/2016 and E26/201.616/2018 to G.S.M. and E26/ 202.310/2017 to A.T.d.A.J.

Plants 2021, 10, 1845 14 of 18
Bayer provided support in the form of a salary to the author J.E.d.A.F. but did not have any additionalrole in the study design, data collection or analysis; a decision to publish the results; or preparationof the manuscript.
Institutional Review Board Statement: Not applicable.
Data Availability Statement: The data presented in this study are openly available in FigShare athttps://doi.org/10.6084/m9.figshare.12867062.v1, (accessed on 25 March 2021).
Acknowledgments: G.S.M. thanks the Rio de Janeiro State Research Support Foundation (FAPERJ)for providing a doctoral scholarship. F.M.-P. and S.A. acknowledge the Chilean National Fund forScientific and Technological Development (FONDECYT) grant number 1201973.
Conflicts of Interest: The authors declare that they have no conflict of interest.
References1. Maldonado, C.; Mora, F.; Scapim, C.A.; Coan, M. Genome-wide haplotype-based association analysis of key traits of plant lodging
and architecture of maize identifies major determinants for leaf angle: HapLA4. PLoS ONE 2019, 14, e0212925. [CrossRef]2. FAO. FAOSTAT—Crops. 2017. Available online: http://www.fao.org/faostat/en/#data/QC (accessed on 20 May 2021).3. Paraginski, R.T.; Ziegler, V.; Ferreira, C.D.; Colussi, R.; Gutkoski, L.C.; Zavareze, E.D.R.; Elias, M.C. Properties of popcorn starch
expanded in a microwave, with and without the presence of vegetable oil. J. Food Process. Pres. 2017, 41, e13142. [CrossRef]4. Vittorazzi, C.; Junior, A.A.; Guimarães, A.G.; Viana, A.P.; Silva, F.H.L.; Pena, G.F.; Daher, R.F.; Gerhardt, I.F.S.; Oliveira, G.H.F.;
Pereira, M.G. Indices estimated using REML/BLUP and introduction of a super-trait for the selection of progenies in popcorn.Genet. Mol. Res. 2017, 16, gmr16039769. [CrossRef]
5. Lu, H.-J.; Bernardo, R.; Ohm, H. Mapping QTL for popping expansion volume in popcorn with simple sequence repeat markers.Theor. Appl. Genet. 2003, 106, 423–427. [CrossRef]
6. Coan, M.M.D.; Pinto, R.J.B.; Kuki, M.C.; Amaral Júnior, A.T.; Figueiredo, A.S.T.; Scapim, C.A.; Warburton, M. Inheritance Studyfor Popping Expansion in Popcorn vs. Flint Corn Genotypes. Agron. J. 2019, 111, 2174–2183. [CrossRef]
7. Li, Y.; Dong, Y.; Niu, S.; Cui, D. The genetic relationship among plant-height traits found using multiple-trait QTL mapping of adent corn and popcorn cross. Genome 2007, 50, 357–364. [CrossRef]
8. Mafra, G.S.; do Amaral Júnior, A.T.; de Almeida Filho, J.E.; Vivas, M.; Santos, P.H.A.D.; Santos, J.S.; Pena, G.F.; de Lima, V.J.;Kamphorst, S.H.; de Oliveira, F.T.; et al. SNP-based mixed model association of growth- and yield-related traits in popcorn. PLoSONE 2019, 14, e0218552. [CrossRef]
9. Babu, R.; Nair, S.K.; Kumar, A.; Rao, H.S.; Verma, P.; Gahalain, A.; Singh, I.S.; Gupta, H.S. Mapping QTLs for popping ability in apopcorn × flint corn cross. Theor. Appl. Genet. 2006, 112, 1392–1399. [CrossRef] [PubMed]
10. Thakur, S.; Kumar, R.; Vikal, Y.; Vyas, P.; Sheikh, I.; Dhaliwal, H.S. Molecular mapping of popping volume QTL in popcorn (Zeamaize L.). J. Plant Biochem. Biotechnol. 2021, 30, 496–503. [CrossRef]
11. Li, Y.L.; Dong, Y.B.; Cui, D.Q.; Wang, Y.Z.; Liu, Y.Y.; Wei, M.G.; Li, X.H. The genetic relationship between popping expansionvolume and two yield components in popcorn using unconditional and conditional QTL analysis. Euphytica 2008, 162, 345–351.[CrossRef]
12. Dell’Acqua, M.; Gatti, D.M.; Pea, G.; Cattonaro, F.; Coppens, F.; Magris, G.; Hlaing, A.L.; Aung, H.H.; Nelissen, H.; Baute, J.; et al.Genetic properties of the MAGIC maize population: A new platform for high definition QTL mapping in Zea mays. Genome Biol.2015, 16, 167. [CrossRef]
13. Li, J.; Li, D.; Espinosa, C.Z.; Pastor, V.T.; Rasheed, A.; Rojas, N.P.; Wang, J.; Varela, A.S.; Carolina de Almeida Silva, N.; Schnable,P.S.; et al. Genome-wide analyses reveal footprints of divergent selection and popping-related traits in CIMMYT’s maize inbredlines. J. Exp. Bot. 2021, 72, 1307–1320. [CrossRef]
14. Valenzuela, C.E.; Ballesta, P.; Ahmar, S.; Fiaz, S.; Heidari, P.; Maldonado, C.; Mora-Poblete, F. Haplotype-and SNP-Based GWASfor Growth and Wood Quality Traits in Eucalyptus cladocalyx Trees under Arid Conditions. Plants 2021, 10, 148. [CrossRef]
15. Maldonado, C.; Mora, F.; Bertagna, F.A.B.; Kuki, M.C.; Scapim, C.A. SNP-and haplotype-based GWAS of flowering-related traitsin maize with network-assisted gene prioritization. Agronomy 2019, 9, 725. [CrossRef]
16. Nagamine, Y.; Pong-Wong, R.; Navarro, P.; Vitart, V.; Hayward, C.; Rudan, I.; Campbell, H.; Wilson, J.; Wild, S.; Hicks, A.A.; et al.Localising Loci underlying Complex Trait Variation Using Regional Genomic Relationship Mapping. PLoS ONE 2012, 7, e46501.[CrossRef] [PubMed]
17. Uemoto, Y.; Pong-Wong, R.; Navarro, P.; Vitart, V.; Hayward, C.; Wilson, J.F.; Rudan, I.; Campbell, H.; Hastie, N.D.; Wright, A.F.;et al. The power of regional heritability analysis for rare and common variant detection: Simulations and application to eyebiometrical traits. Front. Genet. 2013, 4, 232. [CrossRef]
18. Resende, R.T.; Resende, M.D.V.; Silva, F.F.; Azevedo, C.F.; Takahashi, E.K.; Silva-Junior, O.B.; Grattapaglia, D. Regional heritabilitymapping and genome-wide association identify loci for complex growth, wood and disease resistance traits in Eucalyptus. NewPhytol. 2017, 213, 1287–1300. [CrossRef] [PubMed]

Plants 2021, 10, 1845 15 of 18
19. Haiman, C.A.; Patterson, N.; Freedman, M.L.; Myers, S.R.; Pike, M.C.; Waliszewska, A.; Neubauer, J.; Tandon, A.; Schirmer, C.;McDonald, G.J.; et al. Multiple regions within 8q24 independently affect risk for prostate cancer. Nat. Genet. 2007, 39, 638–644.[CrossRef]
20. Duerr, R.H.; Taylor, K.D.; Brant, S.R.; Rioux, J.D.; Silverberg, M.S.; Daly, M.J.; Steinhart, A.H.; Abraham, C.; Regueiro, M.;Griffiths, A.; et al. A Genome-Wide Association Study Identifies IL23R as an Inflammatory Bowel Disease Gene. Science 2006, 314,1461–1463. [CrossRef]
21. Resende, R.T. Regional Heritability Mapping and Gwas for Molecular Breeding in Eucalyptus Hybrids. Ph.D. Thesis, UniversidadeFederal de Viçosa, Viçosa, MG, Brazil, 2017.
22. Shirali, M.; Pong-Wong, R.; Navarro, P.; Knott, S.; Hayward, C.; Vitart, V.; Rudan, I.; Campbell, H.; Hastie, N.D.; Wright, A.F.; et al.Regional heritability mapping method helps explain missing heritability of blood lipid traits in isolated populations. Heredity2016, 116, 333–338. [CrossRef] [PubMed]
23. Caballero, A.; Tenesa, A.; Keightley, P.D. The Nature of Genetic Variation for Complex Traits Revealed by GWAS and RegionalHeritability Mapping Analyses. Genetics 2015, 201, 1601–1613. [CrossRef]
24. Resende, R.T.; de Resende, M.D.V.; Azevedo, C.F.; Fonseca e Silva, F.; Melo, L.C.; Pereira, H.S.; Souza, T.L.P.O.; Valdisser, P.A.M.R.;Brondani, C.; Vianello, R.P. Genome-Wide Association and Regional Heritability Mapping of Plant Architecture, Lodging andProductivity in Phaseolus vulgaris. G3-Genes Genom. Genet. 2018, 8, 2841–2854. [CrossRef] [PubMed]
25. Okeke, U.G.; Akdemir, D.; Rabbi, I.; Kulakow, P.; Jannink, J. Regional Heritability Mapping Provides Insights into Dry MatterContent in African White and Yellow Cassava Populations. Plant Genome US 2018, 11, 1–18. [CrossRef] [PubMed]
26. Neves, L.G.; Davis, J.M.; Barbazuk, W.B.; Kirst, M. A High-Density Gene Map of Loblolly Pine (Pinus taeda L.) Based on ExomeSequence Capture Genotyping. G3 Genes Genomes Genet. 2014, 4, 29–37. [CrossRef] [PubMed]
27. Schwantes, I.A.; do Amaral Júnior, A.T.; Almeida Filho, J.E.; Vivas, M.; Silva Cabral, P.D.; Gonçalves Guimarães, A.; Lima e Silva,F.H.; Araújo Diniz Santos, P.H.; Gonzaga Pereira, M.; Pio Viana, A.; et al. Genomic selection helps accelerate popcorn populationbreeding. Crop Sci. 2020, 60, 1373–1385. [CrossRef]
28. Rigas, S.; Daras, G.; Tsitsekian, D.; Alatzas, A.; Hatzopoulos, P. Evolution and significance of the Lon gene family in Arabidopsisorganelle biogenesis and energy metabolism. Front. Plant Sci. 2014, 5, 145. [CrossRef]
29. Zhang, M.; Wang, C.; Lin, Q.; Liu, A.; Wang, T.; Feng, X.; Liu, J.; Han, H.; Ma, Y.; Bonea, D.; et al. A tetratricopeptiderepeat domain-containing protein SSR1 located in mitochondria is involved in root development and auxin polar transport inArabidopsis. Plant J. 2015, 83, 582–599. [CrossRef]
30. Masuda, S.; Mizusawa, K.; Narisawa, T.; Tozawa, Y.; Ohta, H.; Takamiya, K. The Bacterial Stringent Response, Conserved inChloroplasts, Controls Plant Fertilization. Plant Cell Physiol. 2008, 49, 135–141. [CrossRef]
31. Sun, R.; Ye, R.; Gao, L.; Zhang, L.; Wang, R.; Mao, T.; Zheng, Y.; Li, D.; Lin, Y. Characterization and Ectopic Expression of CoWRI1,an AP2/EREBP Domain-Containing Transcription Factor from Coconut (Cocos nucifera L.) Endosperm, Changes the Seeds OilContent in Transgenic Arabidopsis thaliana and Rice (Oryza sativa L.). Front. Plant Sci. 2017, 8, 63. [CrossRef] [PubMed]
32. Arthikala, M.-K.; Quinto, C. RbohA coordinates lateral root emergence in common bean. Commun. Integr. Biol. 2018, 11, 1–5.[CrossRef] [PubMed]
33. Yoshioka, H.; Numata, N.; Nakajima, K.; Katou, S.; Kawakita, K.; Rowland, O.; Jones, J.D.G.; Doke, N. Nicotiana benthamianagp91 phox Homologs NbrbohA and NbrbohB Participate in H2O2 Accumulation and Resistance to Phytophthora infestans. PlantCell 2003, 15, 706–718. [CrossRef]
34. Chai, W.; Jiang, P.; Huang, G.; Jiang, H.; Li, X. Identification and expression profiling analysis of TCP family genes involved ingrowth and development in maize. Physiol. Mol. Biol. Plants 2017, 23, 779–791. [CrossRef] [PubMed]
35. Manohar, M.; Choi, H.W.; Manosalva, P.; Austin, C.A.; Peters, J.E.; Klessig, D.F. Plant and Human MORC Proteins HaveDNA-Modifying Activities Similar to Type II Topoisomerases, but Require One or More Additional Factors for Full Activity. Mol.Plant-Microbe Interact. 2017, 30, 87–100. [CrossRef] [PubMed]
36. Nziengui, H.; Schoefs, B. Functions of reticulons in plants: What we can learn from animals and yeasts. Cell. Mol. Life Sci. 2009,66, 584–595. [CrossRef]
37. Tai, F.J.; Yuan, Z.L.; Wu, X.L.; Zhao, P.F.; Hu, X.L.; Wang, W. Identification of membrane proteins in maize leaves, altered inexpression under drought stress through polyethylene glycol treatment. Plant Omi. J. 2011, 4, 250–256.
38. Delgado-Alvarado, A.; Walker, R.P.; Leegood, R.C. Phosphoenolpyruvate carboxykinase in developing pea seeds is associatedwith tissues involved in solute transport and is nitrogen-responsive. Plant. Cell Environ. 2007, 30, 225–235. [CrossRef] [PubMed]
39. Avisar, D.; Abu-Abied, M.; Belausov, E.; Sadot, E.; Hawes, C.; Sparkes, I.A. A Comparative Study of the Involvement of 17Arabidopsis Myosin Family Members on the Motility of Golgi and Other Organelles. Plant Physiol. 2009, 150, 700–709. [CrossRef]
40. Ge, W.; Song, Y.; Zhang, C.; Zhang, Y.; Burlingame, A.L.; Guo, Y. Proteomic analyses of apoplastic proteins from germinatingArabidopsis thaliana pollen. Biochim. Biophys. Acta Proteins Proteom. 2011, 1814, 1964–1973. [CrossRef]
41. Donnini, S.; Prinsi, B.; Negri, A.S.; Vigani, G.; Espen, L.; Zocchi, G. Proteomic characterization of iron deficiency responses inCucumis sativus L. roots. BMC Plant Biol. 2010, 10, 268. [CrossRef]
42. Kong, F.; Deng, Y.; Zhou, B.; Wang, G.; Wang, Y.; Meng, Q. A chloroplast-targeted DnaJ protein contributes to maintenance ofphotosystem II under chilling stress. J. Exp. Bot. 2014, 65, 143–158. [CrossRef]
43. Yu, R.M.; Zhou, Y.; Xu, Z.F.; Chye, M.L.; Kong, R.Y. Two genes encoding protein phosphatase 2A catalytic subunits aredifferentially expressed in rice. Plant Mol. Biol. 2003, 51, 295–311. [PubMed]

Plants 2021, 10, 1845 16 of 18
44. Dutt, S.; Parkash, J.; Mehra, R.; Sharma, N.; Singh, B.; Raigond, P.; Joshi, A.; Chopra, S.; Singh, B.P. Translation initiation in plants:Roles and implications beyond protein synthesis. Biol. Plant. 2015, 59, 401–412. [CrossRef]
45. País, S.M.; Téllez-Iñón, M.T.; Capiati, D.A. Serine/Threonine Protein Phosphatases type 2A and their roles in stress signaling.Plant Signal. Behav. 2009, 4, 1013–1015. [CrossRef] [PubMed]
46. Jue, D.; Sang, X.; Lu, S.; Dong, C.; Zhao, Q.; Chen, H.; Jia, L. Genome-Wide Identification, Phylogenetic and Expression Analysesof the Ubiquitin-Conjugating Enzyme Gene Family in Maize. PLoS ONE 2015, 10, e0143488. [CrossRef] [PubMed]
47. Bolduc, N.; Yilmaz, A.; Mejia-Guerra, M.K.; Morohashi, K.; O’Connor, D.; Grotewold, E.; Hake, S. Unraveling the KNOTTED1regulatory network in maize meristems. Genes Dev. 2012, 26, 1685–1690. [CrossRef] [PubMed]
48. Capovilla, G.; Pajoro, A.; Immink, R.G.; Schmid, M. Role of alternative pre-mRNA splicing in temperature signaling. Curr. Opin.Plant Biol. 2015, 27, 97–103. [CrossRef] [PubMed]
49. Kim, M.; Hersh, L.B.; Leissring, M.A.; Ingelsson, M.; Matsui, T.; Farris, W.; Lu, A.; Hyman, B.T.; Selkoe, D.J.; Bertram, L.; et al.Decreased Catalytic Activity of the Insulin-degrading Enzyme in Chromosome 10-Linked Alzheimer Disease Families. J. Biol.Chem. 2007, 282, 7825–7832. [CrossRef]
50. Kuramata, M.; Masuya, S.; Takahashi, Y.; Kitagawa, E.; Inoue, C.; Ishikawa, S.; Youssefian, S.; Kusano, T. Novel Cysteine-RichPeptides from Digitaria ciliaris and Oryza sativa Enhance Tolerance to Cadmium by Limiting its Cellular Accumulation. PlantCell Physiol. 2009, 50, 106–117. [CrossRef] [PubMed]
51. Li, Y.; Kabbage, M.; Liu, W.; Dickman, M.B. Aspartyl Protease-Mediated Cleavage of BAG6 Is Necessary for Autophagy andFungal Resistance in Plants. Plant Cell 2016, 28, 233–247. [CrossRef]
52. Ostertag, M.; Stammler, J.; Douchkov, D.; Eichmann, R.; Hückelhoven, R. The conserved oligomeric Golgi complex is involved inpenetration resistance of barley to the barley powdery mildew fungus. Mol. Plant Pathol. 2013, 14, 230–240. [CrossRef]
53. Zhang, L.; Tian, L.-H.; Zhao, J.-F.; Song, Y.; Zhang, C.-J.; Guo, Y. Identification of an Apoplastic Protein Involved in the InitialPhase of Salt Stress Response in Rice Root by Two-Dimensional Electrophoresis. Plant Physiol. 2009, 149, 916–928. [CrossRef]
54. Stirpe, F. Ribosome-inactivating proteins: From toxins to useful proteins. Toxicon 2013, 67, 12–16. [CrossRef]55. Tian, S.; Muneeruddin, K.; Choi, M.Y.; Tao, L.; Bhuiyan, R.H.; Ohmi, Y.; Furukawa, K.; Furukawa, K.; Boland, S.; Shaffer, S.A.;
et al. Genome-wide CRISPR screens for Shiga toxins and ricin reveal Golgi proteins critical for glycosylation. PLoS Biol. 2018, 16,e2006951. [CrossRef] [PubMed]
56. Walley, J.W.; Kelley, D.R.; Nestorova, G.; Hirschberg, D.L.; Dehesh, K. Arabidopsis Deadenylases AtCAF1a and AtCAF1b PlayOverlapping and Distinct Roles in Mediating Environmental Stress Responses. Plant Physiol. 2010, 152, 866–875. [CrossRef][PubMed]
57. Hsu, K.; Liu, C.; Wu, S.; Kuo, Y.; Lu, C.; Wu, C.; Lian, P.; Hong, C.; Ke, Y.; Huang, J.; et al. Expression of a gene encoding a riceRING zinc-finger protein, OsRZFP34, enhances stomata opening. Plant Mol. Biol. 2014, 86, 125–137. [CrossRef]
58. Jia, F.; Wan, X.; Zhu, W.; Sun, D.; Zheng, C.; Liu, P.; Huang, J. Overexpression of Mitochondrial Phosphate Transporter 3Severely Hampers Plant Development through Regulating Mitochondrial Function in Arabidopsis. PLoS ONE 2015, 10, e0129717.[CrossRef]
59. Jamann, T.M.; Luo, X.; Morales, L.; Kolkman, J.M.; Chung, C.L.; Nelson, R.J. A remorin gene is implicated in quantitative diseaseresistance in maize. Theor. Appl. Genet. 2016, 129, 591–602. [CrossRef]
60. Iglesias-Fernández, R.; Rodríguez-Gacio, M.C.; Barrero-Sicilia, C.; Carbonero, P.; Matilla, A. Three endo-β-mannanase genesexpressed in the micropylar endosperm and in the radicle influence germination of Arabidopsis thaliana seeds. Planta 2011, 233,25–36. [CrossRef]
61. Qi, Y.; Liu, Y.; Zhang, Z.; Gao, J.; Guan, Z.; Fang, W.; Chen, S.; Chen, F.; Jiang, J. The over-expression of a chrysanthemum geneencoding an RNA polymerase II CTD phosphatase-like 1 enzyme enhances tolerance to heat stress. Hortic. Res. 2018, 5, 37.[CrossRef]
62. Newell, M.A.; Cook, D.; Tinker, N.A.; Jannink, J.-L. Population structure and linkage disequilibrium in oat (Avena sativa L.):Implications for genome-wide association studies. Theor. Appl. Genet. 2011, 122, 623–632. [CrossRef] [PubMed]
63. Morosini, J.S.; de Freitas Mendonça, L.; Lyra, D.H.; Galli, G.; Vidotti, M.S.; Fritsche-Neto, R. Association mapping for traits relatedto nitrogen use efficiency in tropical maize lines under field conditions. Plant Soil 2017, 421, 453–463. [CrossRef]
64. Wang, M.; Yan, J.; Zhao, J.; Song, W.; Zhang, X.; Xiao, Y.; Zheng, Y. Genome-wide association study (GWAS) of resistance to headsmut in maize. Plant Sci. 2012, 196, 125–131. [CrossRef]
65. Viana, J.M.S.; e Silva, F.F.; Mundim, G.B.; Azevedo, C.F.; Jan, H.U. Efficiency of low heritability QTL mapping under high SNPdensity. Euphytica 2017, 213, 13. [CrossRef]
66. Arnhold, E.; Mora, F.; Silva, R.G.; Good-God, P., IV; Rodovalho, M.A. Evaluation of top-cross popcorn hybrids using MixedLinear Model methodology. Chil. J. Agric. Res. 2009, 69, 46–53. [CrossRef]
67. Soni, N.V.; Khanorkar, S.M. Genetic architecture of yield traits and popping quality in popcorn (Zea mays var. everta) inbredlines. Electron. J. Plant Breed. 2014, 5, 11–16.
68. de Rodovalho, M.A.; Mora, F.; dos Santos, E.M.; Scapim, C.A.; Arnhold, E. Heredabilidad de la sobrevivencia en 169 familias demaíz-roseta de granos blancos: Un enfoque Bayesiano. Int. J. Agric. Nat. Resour. 2008, 35, 303–309. [CrossRef]
69. Ribeiro, R.M.; do Amaral Júnior, A.T.; Gonçalves, L.S.A.; Candido, L.S.; Silva, T.R.C.; Pena, G.F. Genetic progress in the UNB-2Upopulation of popcorn under recurrent selection in Rio de Janeiro, Brazil. Genet. Mol. Res. 2012, 11, 1417–1423. [CrossRef]

Plants 2021, 10, 1845 17 of 18
70. Ribeiro, R.M.; do Amaral Júnior, A.T.; Pena, G.F.; Vivas, M.; Kurosawa, R.N.; Gonçalves, L.S.A. Effect of recurrent selection on thevariability of the UENF-14 popcorn population. Crop Breed. Appl. Biotechnol. 2016, 16, 123–131. [CrossRef]
71. Guimarães, A.G.; do Amaral Júnior, A.T.; Pena, G.F.; de Almeida filho, J.E.; Pereira, M.G.; Santos, P.H.A.D. Genetic gains in thepopcorn population UENF-14: Developing the ninth generation of intrapopulation recurrent selection. Rev. Caatinga 2019, 32,625–633. [CrossRef]
72. Yu, Y.; Zhao, Z.; Shi, Y.; Tian, H.; Liu, L.; Bian, X.; Xu, Y.; Zheng, X.; Gan, L.; Shen, Y.; et al. Hybrid Sterility in Rice (Oryza sativa L.)Involves the Tetratricopeptide Repeat Domain Containing Protein. Genetics 2016, 203, 1439–1451. [CrossRef] [PubMed]
73. Sharma, M.; Pandey, G.K. Expansion and Function of Repeat Domain Proteins During Stress and Development in Plants. Front.Plant Sci. 2016, 6, 1218. [CrossRef] [PubMed]
74. Awasthi, A.; Paul, P.; Kumar, S.; Verma, S.K.; Prasad, R.; Dhaliwal, H.S. Abnormal endosperm development causes female sterilityin rice insertional mutant OsAPC6. Plant Sci. 2012, 183, 167–174. [CrossRef]
75. Wu, Y.; Pu, C.; Lin, H.; Huang, H.; Huang, Y.; Hong, C.; Chang, M.; Lin, Y. Three novel alleles of FLOURY ENDOSPERM2 (FLO2 )confer dull grains with low amylose content in rice. Plant Sci. 2015, 233, 44–52. [CrossRef] [PubMed]
76. She, K.-C.; Kusano, H.; Koizumi, K.; Yamakawa, H.; Hakata, M.; Imamura, T.; Fukuda, M.; Naito, N.; Tsurumaki, Y.; Yaeshima,M.; et al. A Novel Factor FLOURY ENDOSPERM2 Is Involved in Regulation of Rice Grain Size and Starch Quality. Plant Cell2010, 22, 3280–3294. [CrossRef]
77. Liu, C.; Zhang, T. Expansion and stress responses of the AP2/EREBP superfamily in cotton. BMC Genom. 2017, 18, 118. [CrossRef]78. Zhang, M.; Chen, Y.; Jin, X.; Cai, Y.; Yuan, Y.; Fu, C.; Yu, L. New different origins and evolutionary processes of AP2/EREBP
transcription factors in Taxus chinensis. BMC Plant Biol. 2019, 19, 413. [CrossRef]79. Khan, M.B.; Hussain, N.; Iqbal, M. Effect of water stress on growth and yield components of maize variety YHS 202. J. Res. 2001,
12, 15–18.80. Borrmann, D.; de Junqueira, R.M.; Sinnecker, P.; de Gomes, M.S.O.; Castro, I.A.; Marquez, U.M.L. Chemical and biochemical
characterization of soybean produced under drought stress. Ciência Tecnol. Aliment. 2009, 29, 676–681. [CrossRef]81. Terra, T.G.R.; de Leal, T.C.A.B.; Borém, A.; Rangel, P.H.N. Tolerância de linhagens de arroz de terras altas à seca. Pesqui.
Agropecuária Trop. 2013, 43, 201–208. [CrossRef]82. Zain, N.A.M.; Ismail, M.R.; Puteh, A.; Mahmood, M.; Islam, M.R. Impact of cyclic water stress on growth, physiological responses
and yield of rice (Oryza sativa L.) grown in tropical environment. Ciência Rural 2014, 44, 2136–2141. [CrossRef]83. Kamphorst, S.H.; Lima, V.J.; Schimitt, K.F.M.; Leite, J.T.; Azeredo, V.C.; Pena, G.F.; Santos, P.H.A.D.; Júnior, D.R.S.; da Júnior,
S.B.S.; Bispo, R.B.; et al. Water stress adaptation of popcorn roots and association with agronomic traits. Genet. Mol. Res. 2018, 17,1–14. [CrossRef]
84. Zheng, K.; Ni, Z.; Qu, Y.; Cai, Y.; Yang, Z.; Sun, G.; Chen, Q. Genome-wide identification and expression analyses of TCPtranscription factor genes in Gossypium barbadense. Sci. Rep. 2018, 8, 14526. [CrossRef] [PubMed]
85. Koyama, T.; Furutani, M.; Tasaka, M.; Ohme-Takagi, M. TCP Transcription Factors Control the Morphology of Shoot LateralOrgans via Negative Regulation of the Expression of Boundary-Specific Genes in Arabidopsis. Plant Cell 2007, 19, 473–484.[CrossRef] [PubMed]
86. Parapunova, V.; Busscher, M.; Busscher-Lange, J.; Lammers, M.; Karlova, R.; Bovy, A.G.; Angenent, G.C.; de Maagd, R.A.Identification, cloning and characterization of the tomato TCP transcription factor family. BMC Plant Biol. 2014, 14, 157.[CrossRef] [PubMed]
87. Koteyeva, N.K.; Voznesenskaya, E.V.; Edwards, G.E. An assessment of the capacity for phosphoenolpyruvate carboxykinase tocontribute to C4 photosynthesis. Plant Sci. 2015, 235, 70–80. [CrossRef]
88. Qin, N.; Xu, W.; Hu, L.; Li, Y.; Wang, H.; Qi, X.; Fang, Y.; Hua, X. Drought tolerance and proteomics studies of transgenic wheatcontaining the maize C4 phosphoenolpyruvate carboxylase (PEPC) gene. Protoplasma 2016, 253, 1503–1512. [CrossRef]
89. Hu, L.; Li, Y.; Xu, W.; Zhang, Q.; Zhang, L.; Qi, X.; Dong, H. Improvement of the photosynthetic characteristics of transgenicwheat plants by transformation with the maize C4 phosphoenolpyruvate carboxylase gene. Plant Breed. 2012, 131, 385–391.[CrossRef]
90. Leegood, R.C.; Walker, R.P. Regulation and roles of phosphoenolpyruvate carboxykinase in plants. Arch. Biochem. Biophys. 2003,414, 204–210. [CrossRef]
91. Xu, M.; Li, L.; Fan, Y.; Wan, J.; Wang, L. ZmCBF3 overexpression improves tolerance to abiotic stress in transgenic rice (Oryzasativa) without yield penalty. Plant Cell Rep. 2011, 30, 1949–1957. [CrossRef]
92. Xu, Y.; Yu, Z.; Zhang, D.; Huang, J.; Wu, C.; Yang, G.; Yan, K.; Zhang, S.; Zheng, C. CYSTM, a Novel Non-Secreted Cysteine-RichPeptide Family, Involved in Environmental Stresses in Arabidopsis thaliana. Plant Cell Physiol. 2018, 59, 423–438. [CrossRef]
93. Zhu, W.; Miao, Q.; Sun, D.; Yang, G.; Wu, C.; Huang, J.; Zheng, C. The Mitochondrial Phosphate Transporters Modulate PlantResponses to Salt Stress via Affecting ATP and Gibberellin Metabolism in Arabidopsis thaliana. PLoS ONE 2012, 7, e43530.[CrossRef]
94. Climate Data for Cities Worldwide—Climate-Data.org. OpenStreetMap Contributor. Available online: https://en.climate-data.org/amerika-selatan/brasil/rio-de-janeiro-208/ (accessed on 11 August 2021).
95. Fontes, P.S.F.; Carvalho, A.J.C.D.; Cereja, B.S.; Marinho, C.S.; Monnerat, P.H. Avaliação do estado nutricional e do desenvolvimentoda bananeira-prata-anã (Musa spp.) em função da adubação nitrogenada. Rev. Bras. Frutic. 2003, 25, 156–159. [CrossRef]

Plants 2021, 10, 1845 18 of 18
96. Amaral Júnior, A.T.; Gonçalves, L.S.A.; de Freitas Júnior, S.P.; Candido, L.S.; Vittorazzi, C.; Pena, G.F.; Ribeiro, R.M.; da Silva,T.R.C.; Pereira, M.G.; Scapim, C.A.; et al. UENF 14: A new popcorn cultivar. Crop Breed. Appl. Biotechnol. 2013, 13, 218–220.[CrossRef]
97. Daros, M.; do Amaral Júnior, A.T.; Pereira, M.G. Genetic gain for grain yield and popping expansion in full-sib recurrent selectionin popcorn. Crop Breed. Appl. Biot. 2002, 2, 339–344. [CrossRef]
98. Daros, M.; Amaral, A.T.D., Jr.; Pereira, M.G.; Santos, F.S.; Gabriel, A.P.C.; Scapim, C.A.; Freitas Júnior, S.D.P.; Silvério, L. Recurrentselection in inbred popcorn families. Sci. Agr. 2004, 61, 609–614. [CrossRef]
99. Santos, F.S.; Amaral Júnior, A.T.D.; Freitas Júnior, S.D.P.; Rangel, R.M.; Pereira, M.G. Predição de ganhos genéticos por índices deseleção na população de milho pipoca UNB-2U sob seleção recorrente. Bragantia 2007, 66, 389–396. [CrossRef]
100. Freitas, S.P., Jr.; Amaral Juniot, A.T.; Rangel, R.M.; Viana, A.P. Genetic gains in popcorn by full-sib recurrent selection. Crop. Breed.Appl. Biotechnol. 2009, 9, 1–7. [CrossRef]
101. Rangel, R.M.; doAmaral Júnior, T.; Gonçalves, L.S.; Freitas Júnior, S.D.; Candido, L.S. Biometric analysis of selection gains inpopcorn population of the fifth cycle of recurrent selection. Rev. Cienc. Agron. 2011, 42, 473. [CrossRef]
102. Freitas, I.L.J.; Amaral Júnior, A.T.; Freitas Júnior, S.P.; Cabral, P.D.S.; Ribeiro, R.M.; Goncalves, L.S.A. Genetic gains in the UENF-14popcorn population with recurrent selection. Genet. Mol. Res. 2014, 13, 518–527. [CrossRef] [PubMed]
103. Bates, D.; Mächler, M.; Bolker, B.; Walker, S. Fitting Linear Mixed-Effects Models Using lme4. J. Stat. Softw. 2015, 67, 1–51.[CrossRef]
104. R Core Team, R. A Language and Environment for Statistical Computing; R Core Team R: Vienna, Austria, 2016.105. Lenth, R.V. Least-Squares Means: The R Package lsmeans. J. Stat. Softw. 2016, 69, 1–33. [CrossRef]106. Doyle, J.J.; Doyle, J.L. Isolation of plant DNA from fresh tissue. Focus 1990, 12, 13–15.107. Endelman, J.B. Ridge Regression and Other Kernels for Genomic Selection with R Package rrBLUP. Plant Genome J. 2011, 4, 250.
[CrossRef]108. VanRaden, P.M. Efficient Methods to Compute Genomic Predictions. J. Dairy Sci. 2008, 91, 4414–4423. [CrossRef]109. Purcell, S.; Neale, B.; Todd-Brown, K.; Thomas, L.; Ferreira, M.A.R.; Bender, D.; Maller, J.; Sklar, P.; de Bakker, P.I.W.; Daly, M.J.;
et al. PLINK: A Tool Set for Whole-Genome Association and Population-Based Linkage Analyses. Am. J. Hum. Genet. 2007, 81,559–575. [CrossRef] [PubMed]
110. Hill, W.G.; Weir, B.S. Variances and covariances of squared linkage disequilibria in finite populations. Theor. Popul. Biol. 1988, 33,54–78. [CrossRef]
111. Clifford, D.; McCullagh, P. The Regress Package; R Package Version; R Core Team R: Vienna, Austria, 2012; pp. 1–3.112. Schnable, P.S.; Ware, D.; Fulton, R.S.; Stein, J.C.; Wei, F.; Pasternak, S.; Liang, C.; Zhang, J.; Fulton, L.; Graves, T.A.; et al. The B73
Maize Genome: Complexity, Diversity, and Dynamics. Science 2009, 326, 1112–1115. [CrossRef]