Fine mapping and comparative genomics integration of two quantitative trait loci controlling...
33
1 Fine mapping and comparative genomics integration of two quantitative trait loci controlling resistance to powdery mildew in a Spanish barley landrace Cristina Silvar 1,4 , Dragan Perovic 2,* , Uwe Scholz 3 , Ana M. Casas 1 , Ernesto Igartua 1 and Frank Ordon 2 1 Department of Genetics and Plant Production, Aula Dei Experimental Station, CSIC, Avda Montañana 1005, 50059-Zaragoza, Spain. 2 Julius Kühn-Institute (JKI), Federal Research Institute for Cultivated Plants, Institute for Resistance Research and Stress Tolerance, Erwin-Baur-Str. 27, 06484 Quedlinburg, Germany 3 Leibniz-Institute of Plant Genetics and Crop Plant Research (IPK), Corrensstr. 3, 06466 Gatersleben, Germany 4 Dpto. de Bioloxía Animal, Bioloxía Vexetal e Ecoloxía, Universidade da Coruña, Campus da Zapateira s/n, 15071-A Coruña, Spain. * Address for correspondence: Dragan Perovic, Julius Kühn-Institute (JKI), Federal Research Institute for Cultivated Plants, Institute for Resistance Research and Stress Tolerance, Erwin-Baur-Str. 27, 06484 Quedlinburg, Germany E-mail: [email protected] Telephone: +49(0)394647611 Fax: +49(0)394647600
-
Upload
independent -
Category
Documents
-
view
1 -
download
0
Transcript of Fine mapping and comparative genomics integration of two quantitative trait loci controlling...

1
Fine mapping and comparative genomics integration of two quantitative trait
loci controlling resistance to powdery mildew in a Spanish barley landrace
Cristina Silvar
1,4, Dragan Perovic
2,*, Uwe Scholz
3, Ana M. Casas
1, Ernesto Igartua
1 and Frank
Ordon2
1Department of Genetics and Plant Production, Aula Dei Experimental Station, CSIC, Avda
Montañana 1005, 50059-Zaragoza, Spain.
2Julius Kühn-Institute (JKI), Federal Research Institute for Cultivated Plants, Institute for
Resistance Research and Stress Tolerance, Erwin-Baur-Str. 27, 06484 Quedlinburg, Germany
3 Leibniz-Institute of Plant Genetics and Crop Plant Research (IPK), Corrensstr. 3, 06466
Gatersleben, Germany
4Dpto. de Bioloxía Animal, Bioloxía Vexetal e Ecoloxía, Universidade da Coruña, Campus da
Zapateira s/n, 15071-A Coruña, Spain.
* Address for correspondence:
Dragan Perovic, Julius Kühn-Institute (JKI), Federal Research Institute for Cultivated Plants,
Institute for Resistance Research and Stress Tolerance, Erwin-Baur-Str. 27, 06484 Quedlinburg,
Germany
E-mail: [email protected]
Telephone: +49(0)394647611
Fax: +49(0)394647600

2
Abstract
The intervals containing two major quantitative trait loci (QTL) from a Spanish barley landrace
conferring broad spectrum resistance to Blumeria graminis, were subjected to marker saturation.
First, all the available information on recently developed marker resources for barley was exploited.
Then, a comparative genomic analysis of the QTL regions to other sequenced grass model species
was performed. As a result of the first step, thirty-two new markers were added to the previous map
and new flanking markers closer to both QTL were identified. Next, syntenic integration revealed
that the barley target regions showed homology with regions on chromosome 6 of rice (Oryza
sativa), chromosome 10 of Sorghum bicolor and chromosome 1 of Brachypodium distachyon. A
nested insertion of ancestral syntenic blocks on Brachypodium chromosome 1 was confirmed.
Based on sequence information of the most likely candidate orthologous genes, twenty-three new
barley unigene-derived markers were developed and mapped within the barley target regions. The
assessment of colinearity revealed an inversion on chromosome 7HL of barley compared to the
other three grass species and nearly perfect colinearity on chromosome 7HS. This two-step marker
enrichment allowed for the refinement of the two QTL to much smaller intervals. Inspection of all
predicted proteins for the barley unigenes identified within the QTL intervals did not reveal the
presence of resistance gene candidates. This study demonstrates the usefulness of sequenced
genomes for fine mapping and paves the way for the use of these two loci in barley breeding
programs.
Key words: comparative genomics, barley powdery mildew resistance, marker saturation,
candidate genes

3
Introduction
Albeit the numerous efforts in the past decades to identify and characterize new resistance genes,
Blumeria graminis still ranks high among barley pathogens worldwide due to its adaptability and
ability to cause severe yield losses (McDonald and Linde 2002). Therefore, barley breeders need
new resistance genes or alleles effective against the virulence spectra arising in the existing
pathogen populations. A strategy that has been proposed to increase the durability of resistance
consists in pyramiding several resistance genes in a single cultivar (Friedt et al. 2003). This strategy
specifically demands for the use of molecular markers. Indeed, any introgression scheme is made
more effective by the use of marker technology (Varshney et al. 2006a). An efficient introgression
of new resistance genes from un-adapted germplasm demands perfect markers within the target loci
or, at least, so-called diagnostic markers, tightly linked to the trait of interest (Perovic et al. 2009).
The development of efficient markers is facilitated by a rapidly growing array of genomic resources
and, in many cases, even the full sequence of the target species. The advent of complete sequence
information will reshape research approaches in plant genetics. Although, previoussequencing
activities (e.g. Wicker et al. 2006; Mayer et al. 2009), have been hampered due to the large genome
size and the presence of large fractions of repetitive DNA, the firts draft sequences of Morex and
Betzes opened a new era to barley genetics (Wicker et al 2011) . However, searching for genes in
barley will still rely on synteny with related species (Mayer et al. 2011). This study describes a
practical approach to develop a high resolution map for two disease resistance loci using genomic
resources developed for barley and other grasses.
In barley, a major focus has lately been put on the generation of expressed sequence tag-based
(EST-based) molecular markers. More than 500,000 ESTs generated from different cDNA libraries
are deposited at NCBI (http://www.ncbi.nlm.nih.gov/dbEST/), providing an excellent source for
developing DNA markers (Rostoks et al. 2005; Varshney et al. 2006b; Marcel et al. 2007). The first
comprehensive barley transcript map was developed by Stein et al. (2007), using more than 1,000

4
EST-derived markers. More recently, two high density transcript linkage maps of barley were
reported by Sato et al. (2009) and Close et al. (2009), each one containing more than 2,500 loci.
These maps offer great opportunities for increasing the marker density on promising chromosomal
regions.
Several grasses with complete genome sequence, namely rice (Oryza sativa), sorghum (Sorghum
bicolor) and Brachypodium distachyon (subsequently Brachypodium), have been proposed as
models for molecular genomics of cereals with large genomes. The model based strategy is
supported by the extensive conservation of gene content -synteny- among the Poaceae genomes
(Bolot et al. 2009; Abrouk et al. 2011). Since the release of the rice genome (Goff et al. 2002; Yu et
al. 2002), colinearity between rice and barley has been widely exploited to develop EST-based
markers for saturation mapping of different loci (Perovic et al. 2004; Mammadov et al. 2005;
Komatsuda et al. 2007; Chen et al. 2009; Ramsay et al. 2011; among others), to identify putative
orthology/paralogy of multigene family members (Faure et al. 2007; Perovic et al., 2007) and to
mine for candidate genes (Stein et al. 2005). Regarding marker saturation, a significant level of
colinearity has been demonstrated for large regions of barley chromosome 7H and rice chromosome
6 (Thiel et al. 2009; Druka et al. 2011). Barley synteny studies involving sorghum and
Brachypodium, which have been sequenced recently (Paterson et al. 2009; International
Brachypodium Initiative 2010), are still rare, although the number is increasing. Among these
recent reports, the wild grass Brachypodium has emerged as the most important model for wheat
and barley (Bossolini et al. 2007; Faris et al. 2008; Chen et al. 2009; Drader and Kleinhofs 2010;
Higgins et al. 2010). Synteny between species is not equally conserved across genomic regions. For
instance, Turner et al. (2005) used synteny with Brachypodium to locate an orthologous gene in
barley, because local synteny with rice in the region was poor. Therefore, any approach using
synteny approaches to search for genes in barley (or any species lacking a reference sequence) may
benefit from complementary information contributed by surveying several related species.

5
The loci targeted in this study derive from a largely untapped reservoir of genetic diversity, i.e. the
Spanish Barley Core Collection (SBCC) (Igartua et al. 1998). It has been evaluated for a wide range
of agronomic traits, including resistance to a variety of fungal and viral diseases by Silvar et al.
(2010a). This study revealed promising levels of resistance to the fungal pathogen Blumeria
graminis, the causal agent of powdery mildew. A more exhaustive analysis of powdery mildew
resistance in Spanish barleys revealed that some landrace-derived inbred lines might possess novel
genes or alleles that have not been identified in other barley resources (Silvar et al. 2011a). The
resistances from the two most interesting lines were investigated further in mapping populations,
resulting in the identification of different QTL (Silvar et al. 2010b, Silvar et al. submitted).
The novel resistance loci detected in Spanish landraces may be valuable for barley breeding
programs, given their broad spectra of resistance. This will be especially true if they are pyramided
with other genes or QTL against B. graminis. For this purpose, the knowledge of either the
candidate gene or at least closely linked markers is needed. In previous work, two QTL for
resistance to powdery mildew were identified in the Spanish barley landrace-derived line SBCC097
(Silvar et al. 2010b). The first locus was located on chromosome 7HS in a 15 cM interval. The
second QTL mapped to 7HL, but was located outside the most distal telomeric marker of the
linkage group (EBmac0755), which added uncertainty to its position. The marker density in the
QTL intervals at that time did not allow for efficient marker assisted selection, less to say map-
based cloning. The main goals of the present study were, therefore, (i) to employ EST-derived
markers from previously published sources for marker enrichment of the QTL regions of
chromosome 7H in the SBCC097×Plaisant population and (ii) to conduct genomic comparisons
between barley, rice, sorghum and Brachypodium within this region to refine the position of the
QTL and develop more tightly linked DNA markers for the resistance loci, paving the way for
future map-based cloning of the genes involved.

6
Materials and Methods
Plant and pathogen materials
The SBCC097×Plaisant F5 and F6 RIL population (262 lines) was used to select 94 lines showing
recombination between flanking markers GBM1126/GBM1060 (7HS QTL) and markers
GBM1120/EBmac0755 (7HL QTL) (Silvar et al. 2010b, Fig. 1A). Out of these 94 lines, 46 were
selected as the most informative ones, for their clear-cut phenotypic responses, and for the
unequivocal presence of just one of the two QTL on 7H, based on marker information.
Three barley reference doubled haploid (DH) populations: Igri×Franka (I×F) (Graner et al. 1991),
Steptoe×Morex (S×M) (Kleinhofs et al. 1993) and Oregon Wolfe Barley OWB-D×OWB-R (D×R)
(Costa et al. 2001) were used for the selection of GBR, GBM and GBS markers at the target
intervals. Phenotypic data on the disease scores of four B. graminis isolates (R79, R180, R126 and
R178) after infection of the SBCC097×Plaisant RIL population are available from a previous work
(Silvar et al. 2010b).
Marker development and genotyping
Previously published barley genetic maps of EST-based markers were surveyed to select potential
markers at the target intervals on chromosome 7H (Stein et al. 2007; Marcel et al. 2007; Sato et al.
2009).
The three barley reference populations described above were screened with both sets of QTL
flanking markers; GBM1126/GBM1060 and GBM1102/EBmac0755. Then, GBR (RFLP), GBM
(microsatellite) and GBS (SNP) markers from Stein et al. (2007) were selected within the QTL
intervals based on single recombination data. The sequences of the primer pairs and amplification
protocols for microsatellite markers (GBM) and SNP based markers (GBS) were obtained from
Stein et al. (2007). GBR markers were sequenced and converted into PCR based markers. For this
purpose, publicly available genomic sequence information in GrainGenes

7
(http://wheat.pw.usda.gov/) and GenBank (http://www.ncbi.nlm.nih.gov/) was employed to design
primers for amplification of about 400 bp fragments from genomic DNA of ‘SBCC097’ and
‘Plaisant’. Primers were designed using Primer 3 software (Rozen and Skaletsky 2000). Newly
designed PCR-markers derived from RFLP-GBR markers were named as QBS, standing for
Quedlinburg Barley SNP.
Selected markers from Sato et al. (2009) were directly amplified with primers designed by those
authors, and the PCR fragment of both parents was sequenced. Therefore, markers from Sato et al.
(2009) were not renamed, although the SNPs found in the present work were different from those
reported by Sato et al. (2009).
Simultaneously, 46 out 94 recombinant lines were genotyped with the 1,536-SNP Illumina
GoldenGate Oligonucleotide Pool Assay (BOPA1) (Close et al. 2009) at the Southern California
Genotyping Consortium at UCLA.
Routine PCR was done in 10 µl reaction volume including 25–50 ng genomic DNA, 0.5 U of Taq
DNA Polymerase (Solis Biodyne, Tartu, Estonia) 1×PCR reaction buffer, 1.5 mM MgCl2, 0.2 mM
dNTPs and 0.2 µM of each primer. All fragments were amplified using the following touch-down
PCR profile: an initial denaturing step of 5 min at 94°C was followed by 35 cycles with
denaturation at 94°C for 30s and extension at 72°C for 30s, respectively. The annealing temperature
was decreased in 0.5 °C increments from 62ºC in the first cycle to 56 °C and was then kept constant
for the remaining 35 cycles (always 30-50s). A final extension step was performed at 72 °C for 10
min.
Purified amplicons were subjected to cycle-sequencing from both ends on the ABI377XL
sequencers using BigDye v3.1 terminator sequencing chemistry (ABI Perkin Elmer, Weiterstadt,
Germany). Sequence analysis and identification of polymorphisms were conducted using the free-
trial version of the software package Geneious Pro (Drummond et al. 2007; available at
www.geneious.com). The presence of restriction sites at SNP positions was analysed with the

8
NEBcutter v.2.0 tool (http://tools.neb.com/NEBcutter2). Sequence polymorphisms between the
parents were transformed to either CAPS (Cleaved Amplified Polymorphism) markers or
pyrosequencing markers. Restriction digestion of PCR products were carried out in a 15 µl volume
using 1U of the respective restriction endonuclease (NEB, Fermentas) and an incubation time of 3
hours. The restricted fragments were separated in 1.8 % agarose gel. When there was no restriction
enzyme available for the SNP, a pyrosequencing assay was developed on a PyroMark ID system
(Biotage). The experimental procedure for the pyrosequencing assays, including PCR optimization,
was done by using an M13 universal primer labelled with biotin (Silvar et al. 2011b). Genotyping
of SNP markers from BOPA1 (Close et al. 2009) on additional 48 RILs was performed by using the
same pyrosequencing approach.
Comparative genomic analysis
In order to define more accurately the regions including the resistance loci, we developed new
markers based on the synteny of the barley genome with rice, sorghum and Brachypodium. The
closest flanking markers identified after QTL analysis on the previous marker saturated map (Fig.
1B), were used to select the target region for comparative analysis on both 7HS and 7HL intervals.
Identification of syntenic regions at the three model species was performed basically according to
Perovic et al. (2004). Nucleotide sequences of flanking markers were used as queries for BLASTN
search (Altschul et al. 1997) against the Oryza sativa ssp. japonica IRGSP Build5
(http://rapdb.dna.affrc.go.jp), Sorghum bicolor release v1.0
(http://www.phytozome.net/sorghum.php) and Brachypodium distachyon JGI 8X
(http://www.brachypodium.org) genomes. The sequences of all genes located at the syntenic region
on each genome were then used in a BLASTN search to screen barley ESTs stored in the HarvEST
database Assembly#35 (http://harvest.ucr.edu) using cut-off parameters of E-value≤e-10
, identity ≥
80% and a minimum of 100 bp match length. In the third step, barley ESTs that yielded a positive

9
hit to any of the three genomes were subjected to BLASTN against all available genomic sequences
of rice, sorghum and Brachypodium. Only those barley ESTs that had their most significant hit (E-
value ≤ e-10
) with the rice, sorghum or Brachypodium chromosome identified in the first instance
were considered as potential orthologous and employed in further analysis.
The consensus sequence from each barley unigene was downloaded from HarvEST and used as a
template for design of specific primers. The location of primers in regions with a potentially high
rate of polymorphisms (3´UTR, 5´UTR and introns) was emphasized by comparing the barley
unigene sequence with the genomic sequence of the corresponding putative ortholog in rice,
sorghum or Brachypodium using the online version of the software Spidey
(http://www.ncbi.nlm.nih.gov/spidey). Primers for sequencing each barley unigene were designed
using Primer 3 software with parameter setting of product size up to 400 bp. When the length of the
unigene was around 1 kb, several primer combinations were designed to cover the whole sequence.
Analysis of polymorphisms on PCR amplicons and development of new CAPS or pyrosequencing-
based markers was performed as described above.
Linkage and QTL analysis
Ninety-four informative lines that showed recombination at the target intervals were used to map
the new markers. The previously mapped microsatellite markers on 7H (Silvar et al. 2010b) were
used as a framework to place the new markers. Genetic distances were calculated by minimizing the
number of recombinants within the progeny. Linkage analyses were performed with JoinMap 4.0
(van Ooijen 2006), using Kosambi’s map function and a minimum logarithm of the odds ratio
(LOD score) of 3.
QTL analysis was performed using the Multiple QTL Model (MQM) (Jansen and Stam 1994)
implemented in MapQTL 5.0 (van Ooijen 2004). Several rounds of analysis with cofactors were

10
conducted until a stable LOD profile was reached. The LOD threshold for QTL detection was
calculated by permutation test with 1,000 iterations and a genome-wide significance level of 0.05.
Results
Marker saturation and QTL analysis
In a first step for map saturation, 94 lines with recombinations across the QTL regions were
identified on both QTL intervals, out of the 262 original RIL population. Markers GBM1126 and
GBM1060 on 7HS and markers GBM1102 and EBmac0755 on 7HL were designated as flanking
markers for the QTL intervals (Fig. 1A, Silvar et al. 2010b). These four markers were used to
anchor our population with three reference barley populations. Marker GBM1126 was polymorphic
in the I×F population, GBM1060 showed polymorphism in S×M and D×R populations, GBM1102
was mapped on D×R, and EBmac0755 on S×M and D×R. This information together with the
available data from Stein et al. (2007) served to select for GBS, GBR and GBM markers within the
interesting intervals (Table S1). Marker WBE106, which is close to EBmac0755 in Marcel et al
(2007), and marker GBM1006, proximal to GBM1102 (Varshney et al. 2007), were chosen based
on their polymorphism in SBCC097 and Plaisant. Among GBS markers, only GBS0572 and
GBS0028 turned out to be polymorphic between the parental lines. Ten GBR (RFLP) markers were
converted to PCR-based markers (named as QBS) by designing specific primers for amplification
and sequencing. Two of them (QBS8 and QBS12) did not amplify any PCR product. Among the
other eight, five showed a SNP between the parents, 3 at the QTL on 7HS and 2 at the target region
on 7HL (Table S1, Fig. 1B).
Forty-six lines showing recombination in one or both QTL regions on chromosome 7H, and
unequivocal phenotyping, were selected for the Illumina genotyping assay. Out of 1,563-SNP
BOPA1 markers, 160 were assigned to chromosome 7H. Among these, 64 showed polymorphism
between SBCC097 and Plaisant. These new markers were combined with previous microsatellite

11
markers mapped on chromosome 7H (Silvar et al. 2010b) and a new map was constructed using
only these 46 recombinant lines. Four and ten markers mapped within the target regions on 7HS and
7HL, respectively (data not shown). These 14 markers were selected to genotype the additional 48
RIL, in order to improve the quality of the map, using a newly developed pyrosequencing protocol
(Silvar et al. 2011b). Out of these, marker 11_0080 amplified multiple bands and marker 11_1043
did not show the polymorphism previously reported by Close et al. (2009) and were discarded. Four
markers (two within the target interval) showed linkage to markers on the 7HS region whereas eight
mapped at the 7HL region (Table S1, Fig.1B).
Markers from Sato et al. (2009) were selected according to information available at HarvEST and
Sato and Takeda (2009). Ninety-three percent of these markers are formatted in Affymetrix Barley
1 GeneChip (HarvEST Assembly#25). By comparing the unigenes on this assembly with the
unigenes on which the BOPA1 markers were designed (Assembly#35), we could infer which
markers were probably designed on the same unigenes from different assemblies. We selected the
markers that were potentially located at the QTL intervals on chromosome 7H. For example, SNP
marker 11_0619 is designed on unigene 2036 (Assembly#35) and it corresponds to unigene 5570 in
Assembly#25 and, therefore, to marker k08205 from Sato et al. (2009). Some of these markers co-
segregated in the population Haruna Nijo×H602, and thus were not selected. Twenty-one markers
were chosen according to this procedure. Out of these, primers for marker k00065 did not generate
any amplicon and primers for k06838 amplified multiple bands. The other nineteen selected
markers were sequenced, SNPs were detected in eleven of them, four corresponding to the QTL
interval on 7HS and seven markers to the QTL on 7HL (Table S1, Fig. 1B).
Polymorphism rate was quite high among all screened markers and the majority of sequences
displayed more than one SNP between parental lines. Indeed, up to 10 SNPs between SBCC097 and
Plaisant were identified in the sequence BU989280 (marker QBS9), with a length of ca. 1140bp.

12
In total, out of fifty-two previously published markers examined for this first saturation step, thirty-
two were polymorphic and could be integrated into the previously published genetic map of
SBCC097×Plaisant (Silvar et al. 2010b) (Fig. 1B). The current map for chromosome 7H comprises
two linkage groups, rather than the three described earlier (Silvar et al. 2010b) (Fig. 1A and 1B).
Each linkage group approximately corresponds to the short and long arm of chromosome 7H. Nine
markers mapped at the GBM1126-GBM1060 interval on 7HS and 14 at the GBM1122-EBmac0755
interval on 7HL (Fig. 1B), whereas 9 markers were close, but not within, the QTL intervals. With
this abundance of markers, it was not surprising to find four groups of co-segregating markers (Fig
1B).
QTL analysis performed with MapQTL on the saturated map, using phenotypic data obtained with
four B. graminis isolates (Silvar et al. 2010b) markedly reduced the size of the QTL intervals (Fig
1C). The 7HS QTL was non-significant for isolate R178 but, for the other isolates, it was located in
an interval of ca. 6.7 cM, between markers QBS3 and GBM1060 (Fig. 1C) (compared to 12.2 cM in
the original work). The QTL on 7HL was detected for all four isolates and it now spans over a
genetic distance of ca. 3 cM depending on the isolate (interval k02857-11_0115), with the peaks at
11_0934 for isolates R79, R126 and R180 or EBmac0755 for isolate R178 (Fig. 1C). In this case,
the width of the original interval was not accurately assessed, since the flanking markers mapped at
the extremes of two linkage groups, over a span of around 40 cM (Silvar et al. 2010b).
Comparative analysis on 7H QTL intervals
The new flanking markers of each QTL were used as starting points for a second step of marker
enrichment, based on a comparative approach using rice, sorghum and Brachypodium genomes.
BLASTN search using sequences of flanking markers of the 7HS QTL (QBS3-GBM1060)
identified a syntenic region of 95 Kb on chromosome 6 (Os06) of rice (from gene Os06g0114000 to
gene Os06g0116300), of 130 Kb on chromosome 10 (Sb10) of sorghum (from Sb10g001120 to

13
Sb10g001350) and of 203 Kb on chromosome 1 (Bd1) of Brachypodium (from gene Bradi1g50410
to gene Bradi1g50610). These regions include in total 63 putative orthologous genes, 20 for rice, 22
for sorghum and 21 for Brachypodium. Flanking markers of the 7HL QTL (k02857-11_0115)
identified 23, 30 and 20 putative orthologs in rice, sorghum and Brachypodium, respectively, which
covered a 198 Kb region in rice (from gene Os06g0651200 to Os06g0655100), a 276 Kb region in
sorghum (from Sb10g025780 to Sb10g026070) and a 199 Kb region in Brachypodium (from
Bradi1g31080 to Bradi1g31270). Curiously, the comparative genomic analysis between barley and
Brachypodium revealed that the barley 7HS interval hits a syntenic region on the proximal part of
Bd1L, whereas the interval k02857-11_0115 on barley 7HL showed homology to a region on the
proximal part of Bd1S. The sequences of all 136 putative orthologous genes were employed to
screen the HarvEST barley unigene database (Assembly#35). Two genes from rice (Os06g0652500
and Os06g0653300) were not considered due to the small size of the coding sequences. Four,
thirteen and five genes of rice, sorghum and Brachypodium, respectively did not hit any barley
unigene above an E-value of e-10
. Sixty-one and eighty barley unigenes were identified for the 7HS
and 7HL intervals, respectively. All 141 barley unigenes were employed in a second step of
BLASTN against the publicly available whole genome sequences of the three grass species. Only
unigenes with the first hit to Os06 of rice, Sb10 of sorghum and Bd1 of Brachypodium were
retained and considered as true orthologous loci. The other ESTs exhibiting the best match
elsewhere in the reference genomes likely represent homologous or paralogs in each genome. At
this point, 104 (73.7%) barley hits, 48 at 7HS and 56 at 7HL, were selected for further work. In the
7HS region, 25 out of 48 hits were common to the three genomes, 2 to rice and Brachypodium, 7 to
sorghum and Brachypodium, and 2, 4 and 8 were specific for rice, sorghum and Brachypodium,
respectively (Fig. 2A). Among the 56 hits for 7HL, 26 were common to the three genomes, and 3 to
rice and sorghum, 4 to rice and Brachypodium and 8 shared common hits to sorghum and
Brachypodium. Four barley unigenes were identified based only on homology to sorghum and

14
eleven barley unigenes were orthologous only to the Brachypodium genome (Fig. 2B). Notoriously,
species specific genes, which possess a counterpart only in barley, were identified for rice (1.9%),
sorghum (5.8%) and Brachypodium (11.6%). Information on selected barley unigenes and their
homologies to the three reference genomes is provided in Table S2.
Among all hits we were able to infer the location of some of the markers mapped in the previous
step, based on the information available at HarvEST and Sato et al. (2009). For example, markers
k03115 and k08921 seem to be developed from unigenes U35_1490 and U35_1176 on different
assemblies, whereas markers k02857, 11_0934 and 11_0115 seem to correspond to unigenes
U35_24124, U35_17138 and U35_7579, respectively. Those target unigenes served as the starting
points for the selection of fifty barley unigenes, whose orthologous genes are located in the rice,
sorghum and Brachypodium syntenic regions. Barley unigenes matching the same orthologs were
avoided (Table S2). Primers were designed for amplification and sequencing of selected barley
unigenes (Table S3). Twenty-five out of fifty screened unigenes were polymorphic and genetically
mapped yielding twenty-five new loci. Most markers (sixteen) were genotyped as CAPS and in nine
cases the SNP was converted into a marker for pyrosequencing as described earlier (Silvar et al.
2011b). Twelve new unigene-based markers were mapped within the 7HS target interval; eleven
were located at the 7HL interval and two markers (QBS34 and QBS54) did not map on
chromosome 7H (Fig. 3). A comparison of colinearity among the syntenic blocks on the four
species indicated that the interval k02857-11_0115 on 7HL was inverted in barley compared to rice,
sorghum and Brachypodium genomes. Apart from this, all 23 newly developed markers were
almost in perfect colinearity with their corresponding orthologous genes in rice, sorghum and
Brachypodium, although some small rearrangements affecting single genes were detected, for
example for marker QBS58 (Fig. 3). Interestingly, markers designed on barley unigenes (QBS15,
QBS17, QBS24, QBS25, QBS30, QBS36, QBS46, QBS52 and QBS61) with no counterparts in all

15
three reference genomes, but just in one or two, were mapped following the expected order
according to their putative orthologs in the corresponding genome.
The addition of 23 new markers allowed the definition of narrower QTL intervals. To achieve this,
the RILs were grouped according to the presence/absence of each resistance region. Then, only the
lines that presented at most one QTL were selected. Five lines had to be discarded due to an
apparent mismatch between marker information and disease scores. The remaining thirty-five
informative lines are presented in Fig. 4. An examination of the twenty-three RILs lacking the 7HS
resistance suggested the presence of the QTL co-segregating with marker QBS46 in 7HL (based on
recombinations in two lines). A more conservative assessment, based on seven recombinants,
placed the QTL in the interval k00557-QBS36 (Fig. 4). Among twenty lines without the resistance
allele in the 7HL QTL, three lines define the most likely region conferring resistance to powdery
mildew in 7HS, between markers QBS23 and Bmag206. Again, a conservative assessment, based
on five recombinants, defines a wider interval, QBS3-Bmag206 (Fig. 4).
The protein homologies of all barley unigenes identified within the chromosomal regions
harbouring each QTL were inspected using BLASTX search in the NCBI database. Six out of
sixteen inspected sequences contained coding regions for proteins with predicted functions. The
remaining ten are referred to as “hypothetical proteins”. Among these, nine barley unigenes showed
sequence similarity to the protein coded by their counterpart in rice or sorghum (Table 1).
Discussion
Marker enrichment of QTL regions
Marker saturation of chromosomal regions affecting a specific trait represents one of the first steps
towards map-based gene isolation, but it also has the direct benefit of improving the precision
during marker assisted selection. In a previous work, the regions conferring resistance to powdery
mildew on the Spanish line SBCC097 were mapped to large confidence intervals on the short and

16
long arms of chromosome 7H (Silvar et al. 2010b). Increasing marker density within both QTL
intervals is essential before further efforts towards either QTL pyramiding or gene cloning can be
carried out.
In the present work, we first took advantage of all the available information on recently developed
EST-derived markers (Stein et al. 2007; Sato et al. 2009; Close et al. 2009). The main advantage of
these so-called functional markers is that, as long as there is an association between their molecular
polymorphism and the relevant phenotypic trait, they can be postulated as candidate genes (Aubert
et al. 2006). Additionally, EST-derived markers are specially suited for fine mapping based on
comparative genomic analysis since sequence conservation between species is mainly restricted to
coding regions (Tang et al. 2008). The choice of markers from barley resources was restricted to
those derived from single mapping populations (marker position based on segregation data), to
avoid potential variations in marker order derived from integrated (consensus) maps.
Some QBS markers were developed from barley ESTs-RFLP described by Stein et al (2007). RFLP
are very robust markers, but their analysis is expensive and laborious. Here, we converted GBR
markers into cheaper and easy-to-use PCR-based markers genotyped as cleaved amplified
polymorphic sites (CAPS) or pyrosequencing makers. These new PCR markers proved to be locus-
specific and showed mapping locations corresponding to their counterpart RFLP markers.
Sato et al. (2009) developed a high-density transcript linkage map with more than 3,000 3’EST-
PCR based markers using a single double haploid (DH) population, i.e. Haruna Nijo×H602. Later
on, Sato and Takeda (2009) integrated the BOPA1 markers with EST-markers from Sato et al.
(2009). Due to the absence of common polymorphic markers between the SBCC097×Plaisant and
Haruna Nijo×H602 populations at the target regions, we had to follow a different strategy to find
Sato´s markers that might be within the QTL intervals. The BOPA1 markers coming from Illumina
data and information available at HarvEST provided the clue for cross-referring to the map from
Sato et al (2009), allowing the identification of synonymous markers targeting the same unigene.

17
For example, the marker GBM1060 comes from barley clone HW05A06u which is the unigene
#1176 in assembly #35, but unigene #3326 in assembly #25. Marker k08921 (clone bah42j17) is
represented in unigene #3326 in assembly #25. Both markers share the same hit to the UniProt
database (UniRef90_Q84UD4) and they should have a similar position in SBCC097×Plaisant
population, as it was demonstrated. Both Sato´s and OPA-SNP resources provide a large and
complementary source of molecular markers for saturation purposes. Addition of all new markers
allowed to delimit the QTL regions to smaller intervals compared with previously published data
(Silvar et al. 2010b) and to define closer flanking markers for further fine mapping.
Syntenic integration of QTL conferring resistance to powdery mildew
Since the release of the sequenced rice genome (Goff et al. 2002; Yu et al. 2002), several fine
mapping strategies for different Triticeae species took advantage of synteny-based approaches
(Perovic et al. 2004; Liu et al. 2006; Drader et al. 2009; Mayer et al 2009). Recently, the whole
genome sequencing of other grass species, such as S. bicolor (Paterson et al. 2009) and B.
distachyon (International Brachypodium Initiative 2010), has shed light on the diversification and
phylogenetic relationships among grasses. These new reference genomes represent additional tools
for syntenic integration and facilitate the genetic studies of larger cereal genomes (Higgins et al.
2010; Xue et al. 2010).
In the present study, we investigated the potential of all these genomic tools to develop additional
genetic markers within target genomic regions by exploiting the colinearity between cereal and
grass reference genomes. The success of this approach highly depends on the strategy employed for
the in silico selection of the synteny-based regions and candidate ESTs. In this work, we followed a
“reciprocal BLASTN search” procedure similar to that proposed by Perovic et al. (2004).
According to this method, the putative orthologous genes were only confirmed after two steps of
BLASTN searches, which allowed for effective removal of putative paralogous and homologous.

18
Comparative genomic analysis identified syntenic regions in Os06 of rice, Sb10 of sorghum and
Bd1 of Brachypodium. Previous studies highlighted a syntenic relationship between barley
chromosome 7H and rice chromosome 6 (Devos 2005; Stein et al. 2007; Thiel et al. 2009).
However, the syntenic regions to Brachypodium and sorghum had not been clearly reported.
Notoriously, genomic comparisons reveal reorganization in conserved regions of Brachypodium
Bd1 when compared to the other species. Thus, barley 7HS and 7HL target regions identified
inverted syntenic blocks on Bd1. This result confirms the grass chromosome evolution model (Salse
et al. 2008; Bolot et al. 2009; International Brachypodium Initiative 2010), which hypothesized that
syntenic blocks on distal parts of barley chromosome 7H and centromeric region of Brachypodium
Bd1 derived from a common ancestral chromosome that suffered multiple rearrangements to shape
the actual cereal and grass chromosome structures.
The largest syntenic regions for the resistance mapped on barley chromosome 7H were identified in
sorghum (406 Kb) and Brachypodium (402 Kb). The gene content of these two intervals was higher
in sorghum, harbouring 52 genes in total. However, only 75% of them presented hits on barley
unigenes. This absence of hits may be explained by different factors, such as the time of divergence
among species and the speed of divergence at certain loci, but may also be affected by the quality of
chromosome annotation of model species. After the last step of BLASTN comparison, the higher
number of barley unigenes, corresponding to “true” orthologous, were identified through the
Brachypodium syntenic region (Fig. 2). The slightly better performance of this model genome in
order to identify barley unigenes from putative orthologous may be explained by the closer
coancestry between Brachypodium and barley (Bossolini et al. 2007; Chen et al. 2009; Drader and
Kleinhofs 2010).
Fifty barley unigenes, identified according to the synteny-based approach, were selected for marker
development. Of the 60 primer pairs tested for polymorphism between SBCC097 and Plaisant, 25
pairs (41.6%) amplified polymorphic fragments on different unigenes. Such polymorphism rate was
19
similar to the 40% observed on chromosome 7H after genotyping with SNP-BOPA markers, which
are mainly designed on exons (Close et al. 2009). We expected that pointing at 3’ and 5’UTR
regions and introns for amplification would increase the chances of polymorphism in barley
unigenes, according to previous reports on soybean (Van et al. 2005), which detected higher SNP
rates in non-coding regions than in exons. Twenty-three out of twenty-five polymorphic markers
(92%) mapped within the defined target intervals. This percentage is very high in comparison to
previous studies on comparative genomics of cereals (Mammadov et al. 2005; Drader et al. 2009;
Liu et al. 2010) and demonstrates the good level of conservation of sequence order between these
species, as well as the suitability of our “reciprocal BLASTN” procedure to correctly identify the
orthologous genes.
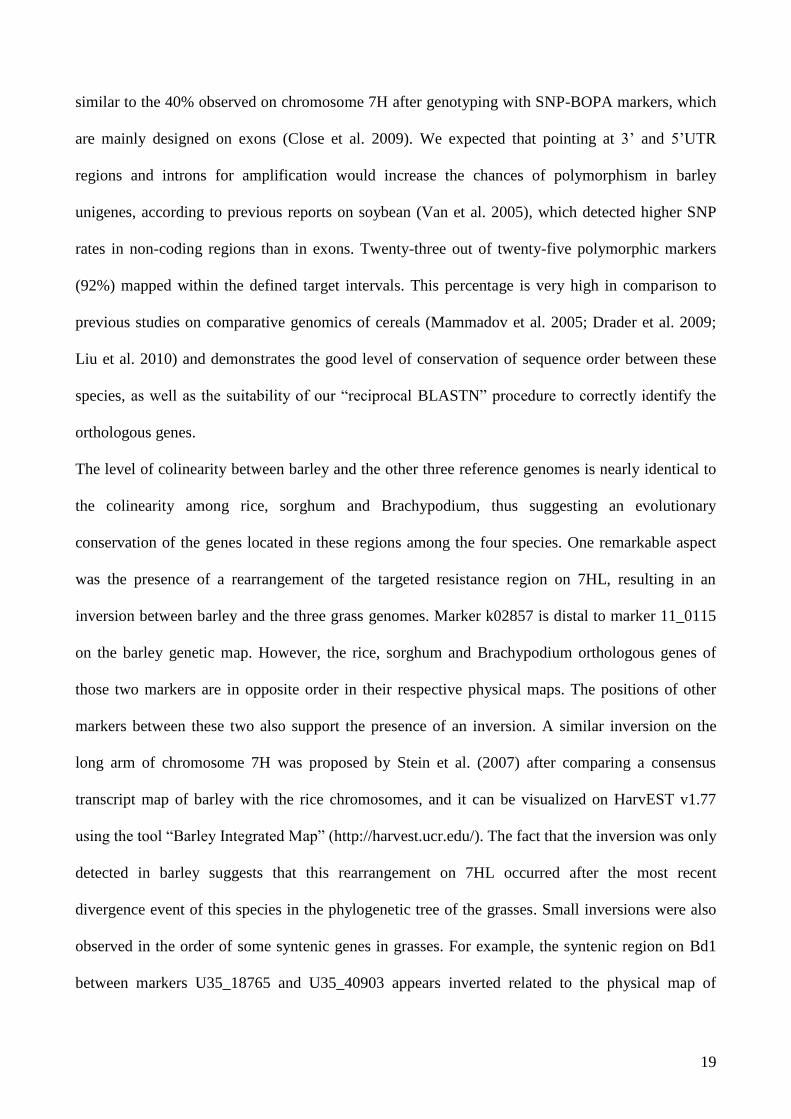
The level of colinearity between barley and the other three reference genomes is nearly identical to
the colinearity among rice, sorghum and Brachypodium, thus suggesting an evolutionary
conservation of the genes located in these regions among the four species. One remarkable aspect
was the presence of a rearrangement of the targeted resistance region on 7HL, resulting in an
inversion between barley and the three grass genomes. Marker k02857 is distal to marker 11_0115
on the barley genetic map. However, the rice, sorghum and Brachypodium orthologous genes of
those two markers are in opposite order in their respective physical maps. The positions of other
markers between these two also support the presence of an inversion. A similar inversion on the
long arm of chromosome 7H was proposed by Stein et al. (2007) after comparing a consensus
transcript map of barley with the rice chromosomes, and it can be visualized on HarvEST v1.77
using the tool “Barley Integrated Map” (http://harvest.ucr.edu/). The fact that the inversion was only
detected in barley suggests that this rearrangement on 7HL occurred after the most recent
divergence event of this species in the phylogenetic tree of the grasses. Small inversions were also
observed in the order of some syntenic genes in grasses. For example, the syntenic region on Bd1
between markers U35_18765 and U35_40903 appears inverted related to the physical map of

20
sorghum and rice and the genetic map of barley. In general, rearrangements in syntenic regions
across species appear to be a common attribute (Devos 2005; Pourkheirandish et al. 2007; Chen et
al. 2009).
Another interesting feature is that each reference genome contained a few species specific genes
which are absent from at least one of the model species addressed, but are conserved in the barley
genome. For example, genes Os06g0115500, Sb10g001330 and Bradi1g31190 seem to be
exclusively present in rice, sorghum and Brachypodium, respectively, and they conserved their
counterpart only in barley, even maintaining the gene order. Although purely speculative, these
genes may be considered as “orphans”, i.e., genes in which the corresponding orthologs has either
been lost or has failed to be predicted in some lineages (Guo et al. 2007; Merkeev and Mironov
2008).
Several comparative genomic studies including rice, Brachypodium, sorghum and a member of the
Triticeae pointed out a better synteny between Brachypodium and the Triticeae than between rice or
sorghum and the Triticeae (Opanowicz et al. 2008; Faricelli et al. 2009). Looking at our results, we
cannot clearly conclude that any of the three grasses used was outperforming the others in its
quality as a model for barley, at least in the regions targeted. On the contrary, we must highlight the
good performance of all three genomes, which provide common and individual blocks of genes that
can be assembled like building blocks to reconstitute the large genome of related barley. Therefore,
they should be considered together as an integrated resource for fine mapping and gene
identification.
The addition of new synteny-based markers resulted in an average density of 1 marker per 0.6-0.7
cM within the previously reported QTL regions, narrowing down the resistance regions to much
smaller intervals. Inspection of all predicted proteins located in the shortened QTL regions did not
reveal the presence of resistance gene candidates such as the “nucleotide binding site-leucine rich
repeat” (NBS-LRR) proteins or “serine/threonine-protein kinases”, the two major classes of

21
resistance genes. The majority of predicted proteins are referred as “hypotethical protein”, meaning
that they have hits to uncharacterised proteins without predicted functions. In any case,
identification of candidate genes would be beyond the genetic resolution of this work.
Successful fine mapping of single genes and quantitative trait loci by extensive exploitation of the
synteny among genomes has been widely reported (Pourkheirandish et al. 2007; Hanemann et al.
2009; Liu et al. 2010; Xue et al. 2010). However, strategies relying on the micro-colinearity of
related genomes have sometimes proven fruitless in fine mapping and candidate gene identification.
(Tarchini et al. 2000; Bulgarelli et al. 2004; Pourkheirandish et al. 2007). The low genetic
resolution of the SBCC097×Plaisant population does not clarify the status of micro-colinearity at
the targeted regions. However, the newly developed synteny-based markers should enable the
effective screening for recombinants of large F2 populations, which also will allow validating and
resolving the order of tightly linked markers as well as the further search for candidate genes based
on micro-colinearity of related genomes. Similarly, those markers will be extremely useful in barley
breeding programs aimed at introgression of the novel powdery mildew resistance found in the
Spanish line SBCC097 via marker-assisted selection approaches.
Acknowledgments
This work was funded by the Spanish Ministry of Science and Innovation (projects GEN2006-
28560-E, AGL2007-63625, and Plant-KBBE ExpResBar, EUI2009-04075), and co-funded by the
European Regional Development Fund. CS held an I3P contract from CSIC. CS was supported by
mobility fellowships from the Deutsche Forschungsgemeinschaft (DFG OR72/5-1), CSIC,
Fundación Caja Inmaculada and COST Action FA0604 (Tritigen). The DNA of three standard
mapping populations was kindly provided by Dr. Nils Stein, IPK, Gatersleben.
References

22
Abrouk M, Murat F, Pont C, Messing J, Jackson S, Faraut T, Tannier E, Plomion C, Cooke R,
Feuillet C, Salse J (2010) Palaeogenomics of plants: synteny-based modelling of extinct
ancestors. Trends Plant Sci 15:479–487.
Altschul SF, Madden TL, Schaffer AA, Zhang J, Zhang Z, Miller, Lipman DJ (1997) Gapped
BLAST and PSI-BLAST: a new generation of protein database search programs. Nucleic Acids
Res. 25:3389–3402.
Aubert G, Morin J, Jacquin F, Loridon K, Quillet MC, Petit A, Rameau C, Lejeune-Hénaut I,
Huguet T, Burstin J (2006) Functional mapping in pea, as an aid to the candidate gene selection
and for investigating synteny with the model legume Medicago truncatula. Theor Appl Genet
112:1024–1041.
Bolot S, Abrouk M, Masood-Quraishi U, Stein N, Messing J, Feuillet C, Salse J (2009) The ‘inner
circle’ of the cereal genomes. Curr Opin Plant Biol 12:119–125.
Bossolini E, Wicker T, Knobel PA, Keller B (2007) Comparison of orthologous loci from small
grass genomes Brachypodium and rice: implications for wheat genomics and grass genome
annotation. Plant J 49:704–717.
Bulgarelli D, Collins NC, Tacconi G, Dellaglio E, Brueggeman R, Kleinhofs A, Stanca AM, Valè G
(2004) High resolution genetic mapping of the leaf stripe resistance gene Rdg2a in barley. Theor
Appl Genet 108:1401–1408
Chen A, Brule-Babel A, Baumann U, Collins N (2009) Structure-function analysis of the barley
genome: the gene-rich region of chromosome 2HL. Funct Integr Genomics 9:67–79
Costa JM, Corey A, Hayes PM, Jobet C, Kleinhofs A, Kopisch-Obusch A, Kramer SF, Kudrna D,
Li M, Riera-Lizarazu O, Sato K, Szűcs P, Toojinda T, Vales MI, Wolfe RI (2001) Molecular
mapping of the Oregon Wolfe barleys: a phenotypically polymorphic doubled-haploid
population. Theor Appl Genet 103:415–424.
Chen A, Baumann U, Fincher GB, Collins NC (2009) Flt-2L, a locus in barley controlling
flowering time, spike density, and plant height. Funct Integr Genomics 9:243–254
Close, TJ, Bhat PR, Lonardi S, Wu Y, Rostoks N, Ramsay L, et al. (2009) Development and
implementation of high-throughput SNP genotyping in barley. BMC Genomics 10:582.
Devos KM (2005) Updating the ‘crop circle’. Curr Opin Plant Biol 8:155–162.
Drader T, Kleinhofs A (2010) A synteny map and disease resistance gene comparison between
barley and the model monocot Brachypodium distachyon. Genome 53: 406–417.
Drader T, Johnson K, Brueggeman R, Kudrna D, Kleinhofs A (2009) Genetic and physical mapping
of a high recombination region on chromosome 7H(1) in barley. Theor Appl Genet 118:811–
820.
Drummond AJ, Ashton B, Cheung M, Heled J, Kearse M, Moir R, Stones-Havas S, Thierer T,
Wilson A (2009) Geneious v4.7, Available from http://www.geneious.com/
Druka A, Franckowiak J, Lundqvist U, Bonar N, Alexander J, Houston K, Radovic S, Shahinnia F,
Vendramin V, Morgante M, Stein N, Waugh R (2011) Genetic dissection of barley morphology
and development. Plant Physiol 155:617–627.
Faricelli ME, Valarik M, Dubcovsky J (2010) Control of flowering time and spike development in
cereals: the earliness per se Eps-Am1 region in wheat, rice, and Brachypodium. Funct Integr
Genomics 10:293–306.

23
Faris JD, Zhang Z, Fellers JP, Gill BS (2008) Micro-colinearity between rice, Brachypodium and
Triticum monococcum at the wheat domestication locus Q. Funct Integr Genomics 8:149–164.
Faure S, Higgins J, Turner A, Laurie DA (2007) The flowering locus T-like gene family in barley
Hordeum vulgare. Genetics 176:599–609.
Friedt W, Pellio B, Werner K, Weiskorn C, Krämer M, Ordon F (2003) Strategies for breeding of
durable disease resistance in cereals. Progress in Botany 64:138–167
Goff SA, Ricke D, Lan TH, Presting G, Wang R, Dunn M, et al. (2002) A draft sequence of the rice
genome (Oryza sativa L. ssp. japonica). Science 296:92–100.
Graner A, Jahoor A, Schondelmaier J, Siedler H, Pillen K, Fischbeck G, Wenzel G, Herrmann RG
(1991) Construction of an RFLP map in barley. Theor Appl Genet 83:250–256.
Guo WJ, Li P, Ling J, Ye SP (2007) Significant Comparative Characteristics between Orphan and
Nonorphan Genes in the Rice (Oryza sativa L.) Genome. Comp Funct Genomics 21676.
doi:10.1155/2007/21676.
Hanemann A, Schweizer GF, Cossu R, Wicker T, Röder MS (2009) Fine mapping, physical
mapping and development of diagnostic markers for the Rrs2 scald resistance gene in barley.
Theor Appl Genet 119:1507–1522.
Higgins JA, Bailey PC, Laurie DA (2010). Comparative genomics of flowering time pathways
using Brachypodium distachyon as a model for the temperate grasses. PLoS One 5:e10065.
Igartua E, Gracia MP, Lasa JM, Medina B, Molina-Cano JL, Montoya JL, Romagosa I (1998) The
Spanish barley core collection. Genet Resour Crop Ev 45:475–481.
International Brachypodium Initiative (2010) Genome sequencing and analysis of the grass
Brachypodium distachyon. Nature 463:763–768.
Jansen R, Stam P (1994) High resolution of quantitative traits into multiple loci via interval
mapping. Genetics 136:1447–1455
Kleinhofs A, Kilian A, Saghai Maroof MA, Biyashev RM, Hayes P, Chen FQ, et al. (1993) A
molecular, isozyme and morphological map of barley (Hordeum vulgare) genome. Theor Appl
Genet 86:705–712
Komatsuda T, Pourkheirandish M, He C, Azhaguvel P, Kanamori H, Perovic D, Stein N, Graner A,
Wicker T, Tagiri A, Lundqvist U, Fujimura T, Matsuoka M, Matsumoto T, Yano M (2007) Six-
rowed barley originated from a mutation in a homeodomain leucine zipper I-class homeobox
gene. Proc Natl Acad Sci USA 104:1424–1429.
Liu S, Zhang X, Pumphrey MO, Stack RW, Gill BS, Anderson JA (2006) Complex
microcolinearity among wheat, rice, and barley revealed by fine mapping of the genomic region
harboring a major QTL for resistance to Fusarium head blight in wheat. Funct Integr Genomics
6:83–89
Liu Z, Faris JD, Edwards MC, Friesen TL (2010) Development of Expressed Sequence Tag (EST)–
based markers for genomic analysis of a barley 6H Region harboring multiple net form net
blotch resistance genes. Plant Genome 3:41–52.
Mammadov JA, Steffenson BJ, Saghai-Maroof MA (2005) High-resolution mapping of the barley
leaf rust resistance gene Rph5 using barley expressed sequence tags (ESTs) and synteny with
rice. Theor Appl Genet 111:1651–1660.

24
Marcel TC, Varshney RK, Barbieri M, Jafary H, de Kock MJD, Graner A, Niks RE (2007) A high-
density consensus map of barley to compare the distribution of QTLs for partial resistance to
Puccinia hordei and of defence gene homologues. Theor Appl Genet 114:487–500.
Mayer KFX, Taudien S, Martis M, Imková H, Suchánková P, Gundlach H, Wicker T, Petzold A,
Felder M, Steuernagel B, Scholz U, Graner A, Platzer M, Doleel J, Stein N. (2009) Gene content
and virtual gene order of barley chromosome 1H. Plant Physiol 151:496–505.
McDonald BA. Linde C (2002) The population genetics of plant pathogens and breeding strategies
for durable resistance. Euphytica 124: 163–180.
Merkeev IV, Mironov AA (2008) Orphan Genes: Function, Evolution, and Composition. J Mol Biol
42:143–149.
Opanowicz M, Vain P, Draper J, Parker D, Doonan JH (2008) Brachypodium distachyon: making
hay with a wild grass. Trends Plant Sci 13:172–177
Paterson AH, Bowers JE, Bruggmann R, Dubchak I, Grimwood J, Gundlach H, et al. (2009) The
Sorghum bicolor genome and the diversification of grasses. Nature 457:551–556
Perovic D, Stein N, Zhang H, Drescher A, Prasad M, Kota R, Kopahnke D, Graner A (2004) An
integrated approach for comparative mapping in rice and barley with special reference to the
Rph16 resistance locus. Funct Integr Genomics 4:74–83
Perovic D, Tiffin P, Douchkov D, Bäumlein H and Graner A (2007) An integrated approach for
comparative analysis of multigene families with special reference to the barley nicotianamine
synthase genes. Funct Integr Genomics 2:169–179
Perovic D, Förster J, Devaux P, Hariri D, Guilleroux M,
Kanyuka K, Lyons R,
Weyen J, Feuerhelm
D, Kastirr U, Sourdille P, Röder M and Ordon F (2009) Mapping and diagnostic marker
development for soil-borne cereal mosaic virus resistance in bread wheat. Mol Breed 23:641–
653.
Pourkheirandish M, Wicker T, Stein N, Fujimura T, Komatsuda T (2007) Analysis of the barley
chromosome 2 region containing the six-rowed spike gene vrs1 reveals a breakdown of rice-
barley micro collinearity by a transposition. Theor Appl Genet114:1357–1365.
Ramsay L, Comadran J, Druka A, Marshall DF, Thomas WTB, Macaulay M, MacKenzie K,
Simpson C, Fuller J, Bonar N, Hayes PM, Lundqvist U, Franckowiak JD, Close TJ, Muehlbauer
GJ, Waugh R (2011) Intermedium-C, a modifier of lateral spikelet fertility in barley, is an
ortholog of the maize domestication gene Teosinte branched. Nat Genet 43:169–172.
Rostoks N, Mudie S, Cardle L, Russell J, Ramsay L, Booth A, Svensson J, Wanamaker S, Walia H,
Rodriguez E, Hedley P, Liu H, Morris J, Close T, Marshall D, Waugh R (2005) Genome-wide
SNP discovery and linkage analysis in barley based on genes responsive to abiotic stress. Mol
Genet Genomics 274:515–527.
Rozen S, Skaletsky H (2000) Primer3 on the WWW for general users and for biologist
programmers. In: Krawetz S, Misener S (eds) Bioinformatics Methods and Protocols: Methods
in Molecular Biology. Humana Press, Totowa, NJ, pp 365–386.
Salse J, Bolot S, Throude M, Jouffe V, Piegu B, Quraishi UM, Calcagno T, Cooke R, Delseny M,
Feuillet C (2008) Identification and characterization of shared duplications between rice and
wheat provide new insight into grass genome evolution. Plant Cell 20:11–24.
Sato K, Takeda K (2009) An application of high-throughput SNP genotyping for barley genome
mapping and characterization of recombinant chromosome substitution lines. Theor Appl Genet
119:613–619.

25
Sato K, Nankaku N, Takeda K (2009) A high-density transcript linkage map of barley derived from
a single population. Heredity 103:110–117.
Silvar C, Casas AM, Kopahnke D, Habekuß A, Schweizer G, Gracia MP, Lasa JM, Ciudad FJ,
Molina-Cano JL, Igartua E, Ordon F (2010a) Screening the Spanish Barley Core Collection for
disease resistance. Plant Breed 129:45–52.
Silvar C, Dhif H, Igartua E, Kopahnke D, Gracia MP, Lasa JM, Ordon F, Casas AM, (2010b)
Identification of quantitative trait loci for resistance to powdery mildew in a Spanish barley
landrace. Mol Breed 25:581–592.
Silvar C, Flath K, Kopahnke D, Gracia MP, Lasa JM, Casas AM, Igartua E, Ordon F (2011a)
Analysis of powdery mildew resistance in the Spanish Barley Core Collection. Plant Breed
doi:10.1111/j.1439-0523.2010.01843.x
Silvar C, Perovic D, Casas AM, Igartua E, Ordon F (2011b) Development of a cost-effective
pyrosequencing approach for SNP genotyping in barley. Plant Breed doi:10.1111/j.1439-
0523.2011.01853.x
Stein N, Perovic D, Kumlehn J, Pellio B, Stracke S, Streng S, Ordon F, Graner A (2005) The
eukaryotic translation initiation factor 4E confers multiallelic recessive bymovirus resistance in
Hordeum vulgare (L.). Plant J 42:912–922.
Stein N, Prasad M, Scholz U, Thiel T, Zhang H, Wolf M, Kota R, Varshney RK, Perovic D, Grosse
I, Graner A (2007) A 1000-loci transcript map of the barley genome: new anchoring points for
integrative grass genomics. Theor Appl Genet 114:823–829.
Tang H, Bowers JE, Wang X, Ming R, Alam M, et al. (2008) Synteny and collinearity in plant
genomes. Science 320:486–488.
Tarchini R, Biddle P, Wineland R, Tingey S, Rafalski A (2000) The complete sequence of 340 kb
of DNA around the rice Adh-Adh2 region reveals interrupted colinearity with maize
chromosome 4. Plant Cell 12:381–391.
Thiel T, Graner A, Waugh R, Grosse I, Close TJ, Stein N (2009) Evidence and evolutionary
analysis of ancient whole-genome duplication in barley predating the divergence from rice. BMC
Evol Biol 9:209.
Turner A, Beales J, Faure S, Dunford RP, Laurie DA (2005) The pseudo-response regulator Ppd-H1
provides adaptation to photoperiod in barley. Science 310:1031–1034.
van Ooijen JW (2004) MapQTL 5, Software for the mapping of quantitative trait loci in
experimental populations. Kyazma BV, Wageningen, Netherlands
van Ooijen JW (2006) JoinMap 4, software for the calculation of genetics linkage maps in
experimental populations. Kyazma, BV, Wageningen, Netherlands.
Van K, Hwang EY, Kim MY, Park HJ, Lee SH, Cregan PB (2005) Discovery of SNPs in soybean
genotypes frequently used as the parents of mapping populations in the United States and Korea.
J Hered 96:529–535.
Varshney RK, Hoisington DA, Tyagi AK (2006a) Advances in cereal genomics and applications in
crop breeding. Trends Biotechnol 24:490–499
Varshney RK, Grosse I, Hähnel U, Siefken R, Prasad M, Stein N, Langridge P, Altschmied L,
Graner A (2006b) Genetic mapping and BAC assignment of EST-derived SSR markers shows
non-uniform distribution of genes in the barley genome. Theor Appl Genet 113:239–250.

26
Varshney RK, Marcel TC, Ramsay L, Russell J, Röder MS, Stein N, Waugh R, Langridge P, Niks
RE, Graner A (2007) A high density barley microsatellite consensus map with 775 SSR loci.
Theor Appl Genet 114:1091–1103
Wicker T, Schlagenhauf E, Graner A, Close TJ, Keller B, Stein N (2006) 454 sequencing put to the
test using the complex genome of barley. BMC Genomics 7:275.
Xue S, Li G, Jia HX, Lin F, Tang F, Wang M, An X, Zhang L, Kong Z, Ma Z (2010) Fine mapping
Fhb4, a major QTL conditioning resistance to Fusarium infection in bread wheat (Triticum
aestivum L.). Theor Appl Genet 121:147–156.
Yu J, Hu S, Wang J, Wong GKS, Li S, Liu B, et al (2002) A draft sequence of the rice genome
(Oryza sativa L. ssp. indica). Science 296:79–92.

27
Table 1 Putative function of those barley unigenes mapped at the QTL regions deduced by
BLASTX sequence comparison against the NCBI database
Marker Unigene Crom Protein homology E -value
QBS28 U35_5413 Hypotetical protein similar to Sb10g001330 3e-76
QBS24 U35_43149 Hypothetical protein similar to Os06g0115800 2e-24
k03115 U35_1490 Hypothetical protein 1e-173
QBS25 U35_1177 GAMYB-binding protein 9e-71
k08921 U35_1176 GAMYB-binding protein 0
QBS29 U35_25087 Transcription activator GRF3 9e-71
QBS30 U35_6111 Hypothetical protein simmilar to Os06g0116300 (putative syntaxin) 1e-144
GBM1060 - GAMYB-binding protein 7e-15
QBS61 U35_3292 CONSTANS-like protein 2e-150
QBS52 U35_23045 Hypothetical protein similar to Os06g0654000 3e-19
QBS50 U35_7866 Hypothetical protein similar to Os06g0654000 and Sb10g026010 1e-90
QBS46 U35_49745 Protein transport protein SEC61 gamma subunit 1e-29
QBS45 U35_38716 Hypothetical protein similar to Os06g0653800 and Sb10g025990 7e-33
QBS44 U35_4068 Hypothetical protein similar to Os06g0653800 and Sb10g025990 0
11_0934 U35_17138 Hypothetical protein similar to Sb10g025930 5e-88
QBS42 U35_11617 Hypothetical protein similar to Os06g0653000 and Sb10g025920 2e-61
7HS
7HL

28
Fig. 1 Genetic linkage map of barley chromosome 7H developed in the SBCC097 Plaisant
population before (A, Sivar et al. 2010b) and after (B) map saturation. (C) MQM LOD scans for
resistance scores to different isolates of B. graminis. For comparison purposes, the two genetic
maps are not drawn to scale. Flanking markers for both QTLs are shown in bold and connected
with thin discontinuous lines
Fig. 2 Venn diagrams showing the number of common and single barley unigenes selected on
chromosome 7HS (A) and 7HL (B) by using BLASTN against the publicly available sequences of
rice, sorghum and Brachypodium. Numbers in brackets indicate the number of barley unigenes
identified by each reference genome
Fig. 3 Comparative maps of syntenic regions of barley chromosome 7H in relation to sorghum
chromosome 10 (Sb10), rice chromosome 6 (Os06) and Brachypodium chromosome 1 (Bd1).
Barley flanking markers employed as starting point for the comparative approach are in bold,
markers developed on barley unigenes that showed only one hit to one reference genome are
underlined, and markers developed on barley unigenes that showed two matches to two reference
genomes are in italics. Asterisks (*) indicate barley unigenes that have not been mapped but show
high similarity to markers previously included in the enriched map (see Fig. 1B). Note that physical
maps of sorghum, rice and Brahcypodium are not on the same scale as the genetic map of barley.
Note that both arms of Bd1 are shown on inverted position. For the sake of clarity, direct
comparison between sorghum and barley are not indicated, but the homology to the sorghum
genome is represented through the rice orthologous (for better clarification see Table S2)
Fig. 4 Diagram of the short and long arms of chromosome 7H in RILs of the SBCC097× Plaisant
population showing recombination on the regions harboring QTL. Allelic identities are shown in
grey for SBCC097 and white for Plaisant. For each RIL, the disease score (ranging from 0 to 4) is
presented for each isolate and for the mean of four isolates. Potential chromosomal regions
conferring resistance to B. graminis are highlighted in grey and light grey. For the sake of clarity,
the interval k03816 11_0115 is represented for chromosome arm 7HL. S indicates susceptibility
and R resistance

29
GBM112611_137211_1309GBS0028GBS0572QBS6S9202QBS3QBS4k08921k03115
GBM1060
3.5
2.5
1.3
5.1
0.21.4
GBM1102GBM100611_061911_0068
11_0537
k03816
11_1402
11_112911_0227k00557k0285711_0934WBE106
EBmac0755k0821611_0115QBS9QBS10k09277k04770k02180
2.91.20.33.8
8.5
9.8
8.9
1.50.5
5.5
2.00.81.72.80.91.20.6
A
0 2 4
0 5
10
15
11_0036
15.0
GBM112611_137211_1309GBS0028GBS0572QBS6S9202QBS3QBS4k08921k03115
GBM1060
3.5
2.5
1.3
5.1
0.21.4
GBM1102
GBM100611_061911_0068
11_0537
k03816
11_1402
11_112911_0227k00557
k0285711_0934WBE106
EBmac0755k0821611_0115QBS9QBS10k09277k04770k02180
2.9
1.20.3
3.8
8.5
9.8
8.9
1.50.5
5.5
2.00.81.7
2.8
0.91.20.6
A
11_0761
k06375k10750
1.4
0.6
11_0036
7h
6.0
PIC25-1Bmag021
GBM1126S9202
GBM1060Bmag206scssr07970bHvM04
3.32.17.34.93.32.85.5
scssr07970GBM1464
HvSS1
scssr15864
Bmac064
GBM1102
3.45.9
21.9
22.2
9.4
EBmac0755
Bmac156
GBM1456
HvM05scssr04056
HvGLB2
14.7
7.0
7.9
3.3
6.9
7HPIC25-1Bmag021
GBM1126S9202
GBM1060Bmag206scssr07970bHvM04
3.32.17.34.93.32.85.5
scssr07970GBM1464
HvSS1
scssr15864
Bmac064
GBM1102
3.45.9
21.9
22.2
9.4
EBmac0755
Bmac156
GBM1456
HvM05scssr04056
HvGLB2
14.7
7.0
7.9
3.3
6.9
7HPIC25-1Bmag021
GBM1126S9202
GBM1060Bmag206scssr07970bHvM04
3.32.17.34.93.32.85.5
scssr07970GBM1464
HvSS1
scssr15864
Bmac064
GBM1102
3.45.9
21.9
22.2
9.4
EBmac0755
Bmac156
GBM1456
HvM05scssr04056
HvGLB2
14.7
7.0
7.9
3.3
6.9
7H
A B C

30
Rice (31) Brachypodium (42)
Sorghum (36)
A
25
2
7 0
2
4
8
Sorghum (42)
Rice (33) Brachypodium (49)
B
26 3
4
8
4
11
0

31
Sb10g001120971.0
Sb10g0011801031.3Sb10g0011901034.1Sb10g0012001036.5Sb10g0012401050.0Sb10g0012501054.2Sb10g0012701067.0Sb10g0012801070.5Sb10g0012901075.8Sb10g0013001079.9Sb10g0013101084.0Sb10g0013301098.0
Sb10g0013501116.9
Sb10g02578055127.5Sb10g02580055133.4Sb10g02581055143.4Sb10g02582055146.6
Sb10g02584055174.7
Sb10g02587055187.8
Sb10g02589055223.8
Sb10g02592055266.5Sb10g02593055276.5Sb10g02593555280.9
Sb10g02599055310.2
Sb10g02600055330.5Sb10g02601055332.5
Sb10g02602055353.5
Sb10g02606055386.3
Sb10g02607055401.1
Sb10g02608055416.4
Sb10g02612055472.2
Sb10Sb10g001120971.0
Sb10g0011801031.3Sb10g0011901034.1Sb10g0012001036.5Sb10g0012401050.0Sb10g0012501054.2Sb10g0012701067.0Sb10g0012801070.5Sb10g0012901075.8Sb10g0013001079.9Sb10g0013101084.0Sb10g0013301098.0
Sb10g0013501116.9
Sb10g02578055127.5Sb10g02580055133.4Sb10g02581055143.4Sb10g02582055146.6
Sb10g02584055174.7
Sb10g02587055187.8
Sb10g02589055223.8
Sb10g02592055266.5Sb10g02593055276.5Sb10g02593555280.9
Sb10g02599055310.2
Sb10g02600055330.5Sb10g02601055332.5
Sb10g02602055353.5
Sb10g02606055386.3
Sb10g02607055401.1
Sb10g02608055416.4
Sb10g02612055472.2
Sb10
Sb10g001120971.0
Sb10g0011801031.3Sb10g0011901034.1Sb10g0012001036.5Sb10g0012401050.0Sb10g0012501054.2Sb10g0012701067.0Sb10g0012801070.5Sb10g0012901075.8Sb10g0013001079.9Sb10g0013101084.0Sb10g0013301098.0
Sb10g0013501116.9
Sb10g02578055127.5Sb10g02580055133.4Sb10g02581055143.4Sb10g02582055146.6
Sb10g02584055174.7
Sb10g02587055187.8
Sb10g02589055223.8
Sb10g02592055266.5Sb10g02593055276.5Sb10g02593555280.9
Sb10g02599055310.2
Sb10g02600055330.5Sb10g02601055332.5
Sb10g02602055353.5
Sb10g02606055386.3
Sb10g02607055401.1
Sb10g02608055416.4
Sb10g02612055472.2
Sb10 sintenia_markers
Os06g0114000810.0Os06g0114400828.2Os06g0114500831.5Os06g0114700840.4Os06g0115000849.9Os06g0115100851.5Os06g0115200854.6Os06g0115300859.9Os06g0115400863.3Os06g0115500866.5Os06g0115600870.8Os06g0115700874.4Os06g0116100884.8Os06g0116200892.2Os06g0116300901.7
Os06g065120026276.3Os06g065130026277.4Os06g065160026281.5Os06g065190026293.0Os06g065200026296.5Os06g065220026309.8
Os06g065240026324.5
Os06g065300026353.0
Os06g065310026368.9Os06g065320026372.6
Os06g065380026395.3Os06g065400026401.5
Os06g065430026422.8
Os06g065490026459.7
Os06g065510026471.4
Os06g065550026495.2
no_gene26547.0
Os06
sintenia_markers
Bradi1g5041048996.3Bradi1g5042048999.6
Bradi1g50440Bradi1g50470
49039.6
Bradi1g5048049112.6Bradi1g5050049117.0Bradi1g5051049124.7Bradi1g5052049128.0Bradi1g5053049146.0Bradi1g5054049148.8Bradi1g5055049166.1Bradi1g5056049171.6Bradi1g5057049172.6Bradi1g5058049176.6Bradi1g5059049185.5Bradi1g5060049186.8Bradi1g5061049194.9
Bradi1g3103026511.4
Bradi1g3107026528.5no_gene26539.0Bradi1g3108026541.5
Bradi1g3110026553.8
Bradi1g3111026568.7Bradi1g3112026574.0Bradi1g3113026579.4
Bradi1g3114026595.7
Bradi1g3115026608.8Bradi1g3117026614.7Bradi1g3118026619.9
Bradi1g3119026644.8
Bradi1g3120026688.1
Bradi1g3122026708.3
Bradi1g3124026717.5
Bradi1g3126026733.8Bradi1g3127026738.5
Bd1
sintenia_markers
Bradi1g5041048996.3Bradi1g5042048999.6
Bradi1g50440Bradi1g50470
49039.6
Bradi1g5048049112.6Bradi1g5050049117.0Bradi1g5051049124.7Bradi1g5052049128.0Bradi1g5053049146.0Bradi1g5054049148.8Bradi1g5055049166.1Bradi1g5056049171.6Bradi1g5057049172.6Bradi1g5058049176.6Bradi1g5059049185.5Bradi1g5060049186.8Bradi1g5061049194.9
Bradi1g3103026511.4
Bradi1g3107026528.5no_gene26539.0Bradi1g3108026541.5
Bradi1g3110026553.8
Bradi1g3111026568.7Bradi1g3112026574.0Bradi1g3113026579.4
Bradi1g3114026595.7
Bradi1g3115026608.8Bradi1g3117026614.7Bradi1g3118026619.9
Bradi1g3119026644.8
Bradi1g3120026688.1
Bradi1g3122026708.3
Bradi1g3124026717.5
Bradi1g3126026733.8Bradi1g3127026738.5
Bd1sintenia_markers
Bradi1g5041048996.3Bradi1g5042048999.6
Bradi1g50440Bradi1g50470
49039.6
Bradi1g5048049112.6Bradi1g5050049117.0Bradi1g5051049124.7Bradi1g5052049128.0Bradi1g5053049146.0Bradi1g5054049148.8Bradi1g5055049166.1Bradi1g5056049171.6Bradi1g5057049172.6Bradi1g5058049176.6Bradi1g5059049185.5Bradi1g5060049186.8Bradi1g5061049194.9
Bradi1g3103026511.4
Bradi1g3107026528.5no_gene26539.0Bradi1g3108026541.5
Bradi1g3110026553.8
Bradi1g3111026568.7Bradi1g3112026574.0Bradi1g3113026579.4
Bradi1g3114026595.7
Bradi1g3115026608.8Bradi1g3117026614.7Bradi1g3118026619.9
Bradi1g3119026644.8
Bradi1g3120026688.1
Bradi1g3122026708.3
Bradi1g3124026717.5
Bradi1g3126026733.8Bradi1g3127026738.5
Bd1
QBS3
QBS14QBS15QBS16QBS17QBS18QBS21QBS23QBS28QBS24U35_1490*(k03115)QBS25U35_1176*(k08921)QBS29QBS30QBS4GBM1060
1.7
0.9
0.6
0.5
0.9
0.6
0.9
QBS58U35_24124*(k02857)QBS60QBS61QBS52QBS50QBS46QBS45QBS44U35_17138*(11_0934)QBS42QBS36QBS31WBE106EBmac0755U35_22998*(k08216)U35_7579*(11_0115)
0.4
0.5
0.6
0.5
0.7
1.0
0.9
7H QBS3
QBS14QBS15QBS16QBS17QBS18QBS21QBS23QBS28QBS24U35_1490*(k03115)QBS25U35_1176*(k08921)QBS29QBS30QBS4GBM1060
1.7
0.9
0.6
0.5
0.9
0.6
0.9
QBS58U35_24124*(k02857)QBS60QBS61QBS52QBS50QBS46QBS45QBS44U35_17138*(11_0934)QBS42QBS36QBS31WBE106EBmac0755U35_22998*(k08216)U35_7579*(11_0115)
0.4
0.5
0.6
0.5
0.7
1.0
0.9
7H
Sb10 (Kb) Os06 (Kb) 7H (cM) Bd1L (Kb)
Bd1S (Kb)

32
RIL
16
2
RIL
16
9
RIL
06
7
RIL
14
1
RIL
17
6
RIL
15
6
RIL
00
6
RIL
01
2
RIL
01
1
RIL
04
3
RIL
02
6
RIL
15
2
RIL
01
4
RIL
04
1
RIL
08
4
RIL
01
3
RIL
02
0
RIL
02
5
RIL
10
9
RIL
18
5
RIL
00
3
RIL
00
9
RIL
15
1
RIL
19
1
RIL
19
7
RIL
04
6
RIL
12
3
RIL
12
4
RIL
15
9
RIL
09
7
RIL
11
8
RIL
06
0
RIL
15
3
RIL
16
4
RIL
04
4
GBM1126 a b a a b a a a a b b b b b a b b a b b b b b b b b b b b b b b b b b
11_1372 a a a a b a a a a b b b b b a b b a b b b b b b b b b b b b b b b b b
11_1309 a a a a b a a a a b b b b b a a b a b b b b b b b b b b b b b b b b b
GBS0028 a a a a b a a a a b b b b b a a b a b b b b b b b b b b b b b b b b b
GBS0572 a a a a b a a a a b b b b b a a b a b b b b b b b b b b b b b b b b b
QBS6 a a a a b a a a a b b b b b a a b a b b b b b b b b b b b b b b b b b
S9202 a a a a b a a a a b b b b b b a b a b b b b b b b b b b b b b b b b b
QBS3 a a a a b a a a a b b b b b b a b a b b b b b b b b b b b b b b b b b
QBS14 a a a a b a a a a b b b b b b b b b b b b b b b b b b b b b b b b b b
QBS15 a a a a b a a a a b b b b b b b b b b b b b b b b b b b b b b b b b b
QBS16 a a a a b a a a a b b b b b b b b b b b b b b b b b b b b b b b b b b
QBS17 a a a a b a a a a b b b b b b b b b b b b b b b b b b b b b b b b b b
QBS18 a a a a b a a a a b b b b b b b b b b b b b b b b b b b b b b b b b b
QBS21 a a a a b a a a a b b b b b b b b b b b b b b b b b b b b b b b b b b
QBS23 a a a a b a a a a b b b b b b b b b b b b b b b b b b b b b b b b b b
QBS28 a a a a a a a a a b b b b b b b b b b b b b b b b b b b b b b b b b b
QBS24 a a a a a a a a a b b b b b b b b b b b b b b b b b b b b b b b b b b
k03115 a a a a a a a a a b b b b b b b b b b b b b b b b b b b b b b b b b b
QBS25 a a a a a a a a a b b b b b b b b b b b b b b b b b b b b b b b b b b
k08921 a a a a a a a a a b b b b b b b b b b b b b b b b b b b b b b b b b b
QBS29 a a a a a a a a a b b b b b b b b b b b b b b b b b b b b b b b b b b
QBS30 a a a a a a a a a b b b b b b b b b b b b b b b b b b b b b b b b b b
QBS4 a a a a a a a a a b b b b b b b b b b b b b b b b b b b b b b b b b b
GBM1060 a a a a a a a a a b b b b b b b b b b b b b b b b b b b b b b b b b b
Bmag206 a a a b a a a a a b b b b b a b b b b b b b b b b b b b b b b b b b b
K3816 b b b a a a b b a h a a b b a b a a b b a b a a b b b b b b b b b b b
11_1402 b b b a a b b b b b a a b b a b a a b b a b a a a a b b b b a b b a b
11_1129 b b b a a b b b b b b a b b b b h b b b a b a b a a a a a b a a a a b
11_0227 b b b b a b b b b b b a b b b b b b b b a b a b a a a a a a a a a a b
K00557 b b b b a b b b b b b A b b b b b b b b a b a b a a a a a a a a a a b
QBS58 b b b b b b b b b b b b b b b b b b b b a b a a a a a a a a a a a a b
k02857 b b b b b b b b b b b b b b b b b b b b a b a a a a a a a a a a a a b
QBS60 b b b b b b b b b b b b b b b b b b b b a b a a a a a a a a a a a a b
QBS61 b b b b b b b b b b b b b b b b b b b b a b a a a a a a a a a a a a a
QBS52 b b b b b b b b b b b b b b b b b b b b a b a a a a a a a a a a a a a
QBS50 b b b b b b b b b b b b b b b b b b b b a b a a a a a a a a a a a a a
QBS46 b b b b b b b b b b b b b b b b b b b b b b a a a a a a a a a a a a a
QBS45 b b b b b b b b b b b b b b b b b b b b b a a a a a a a a a a a a a a
QBS44 b b b b b b b b b b b b b b b b b b b b b a a a a a a a a a a a a a a
11_0934 b b b b b b b b b b b b b b b b b b b b b a a a a a a a a a a a a a a
QBS42 b b b b b b b b b b b b b b b b b b b b b a a a a a a a a a a a a a a
QBS36 b b b b b b b b b b b b b b b b b b b b b a a a a a a a a a a a a b a
QBS31 b b b b b b b b b b b b b b b b b b b b b a a a a a a a a a a a a b a
WBE106 b b b b b b b b b b b b b b b b b b b b b a a a a a a a a a a a a b a
k08216 b b b b b b b b b b b b b b b b b b b b b a a a a a a a a a a a a b a
EBmac0755 b b b b b b b b b b b b b b b b b b b b b a a a a a a a a a a a a b a
11_0115 b b b b b b b b b b b b b b b b b b b b b a a a a a a a a a a a a b a
R R R R R R R R R S S S S S S S S S S S S S R R R R R R R R R R R R RIsolate R79 1 1 1 1 2 1-2 1 1 1 2-3 2-3 2-3 2-3 2-3 2-3 2-3 3 2-3 3 3 2 2-3 1 1 1 1 1 1-2 1-2 1-2 1-2 1-2 1-2 1-2 1-2
Isolate R126 0 0 1 1 1 1 1 1 1 2-3 2-3 2-3 2-3 3 2-3 2-3 2 2-3 2-3 2 2 1-2 0 0 0 0 0 0 0 0 0 1 1 1 1
Isolate R178 - 0 1 1-2 0 1 1-2 1-2 2 2-3 2-3 2-3 2-3 2 2-3 2-3 2-3 3-4 2-3 2-3 2-3 2-3 0 0 0 0 0 1 1 1 1 1 1 1 1-2
Isolate R180 0 1 1 1 1-2 1 1 1 1 2 2-3 2-3 2-3 2-3 2-3 3 3-4 2-3 3 3-4 2 2-3 1 1 1 1 1-2 1-2 1-2 2 2 1-2 1-2 1-2 1-2
Average 0.33 0.5 1 1.13 1.13 1.13 1.13 1.13 1.25 2.38 2.5 2.5 2.5 2.5 2.5 2.63 2.75 2.75 2.75 2.75 2.13 2.25 0.5 0.5 0.5 0.5 0.63 1 1 1.13 1.13 1.25 1.25 1.25 1.38
7HS
7HL

33