Mapping of quantitative trait loci affecting resistance to Phytophthora nicotianae in tobacco (...
10
Mapping of quantitative trait loci affecting resistance to Phytophthora nicotianae in tobacco (Nicotiana tabacum L.) line Beinhart-1000 Vijay Vontimitta • Ramsey S. Lewis Received: 18 August 2010 / Accepted: 20 October 2010 / Published online: 4 November 2010 Ó Springer Science+Business Media B.V. 2010 Abstract Black shank, caused by Phytophthora nicotianae, is one of the most important diseases affecting tobacco (Nicotiana tabacum L.) production worldwide. While monogenic resistance to Race 0 of this pathogen has been transferred via interspecific introgression, quantitative resistance is currently needed to provide adequate resistance to all races. The objective of this research was to gain increased insight into the inheritance of resistance in the highly- resistant cigar tobacco line, Beinhart-1000, and to identify genomic regions contributing to this resistance. A doubled haploid population was generated from a cross between Beinhart-1000 and the susceptible cultivar, Hicks. The population was evaluated for field resistance in three environments and genotyped with 206 polymorphic microsatellite markers. No doubled haploid line exhibited as high a level of resistance as Beinhart-1000. Heritability was high and multiple interval mapping suggested that at least six quantitative trait loci (QTL) may contribute to the high level of resistance in this line. The two largest QTL explained 25.4 and 20.4% of the observed phenotypic variation for end percent survival. A model including all six significant QTL explained 64.3% of the phenotypic variation and 73.1% of the genetic variation. The two major identified QTL and their associated markers may be of use for employing Beinhart-1000 as a source of black shank resistance in tobacco breeding. The major QTL on linkage group four was found to cosegregate with Abl, a gene involved in accumulation of the trichome exudate cis-abienol. The question of pleiot- ropy versus linkage needs to be investigated with respect to partial resistance against P. nicotianae. Keywords Black shank Á Phytophthora nicotianae Á Tobacco Á Quantitative trait locus Á cis-abienol Introduction The oomycete genus Phytophthora contains species that are amongst the most destructive pathogens on a very large range of economically important plant species around the world. Phytophthora nicotianae is the causal agent of black shank, the most important disease affecting tobacco (Nicotiana tabacum L.) production in the United States. This soil-borne organism infects roots and stalks, resulting in stunting and plant death. Growers can use combinations of crop rotation, chemical inputs, and resistant varieties to reduce loss from this pathogen. Genetic resistance is the most attractive, however, because of the potential for cost-effective protection. Monogenic resistance to Race 0 provided by the genes Php and Phl has been introgressed into N. tabacum from the diploid relatives, N. plumbagin- ifolia and N. longiflora, respectively (Valleau et al. V. Vontimitta Á R. S. Lewis (&) Department of Crop Science, North Carolina State University, Campus Box 7620, Raleigh, NC 27695, USA e-mail: [email protected] 123 Mol Breeding (2012) 29:89–98 DOI 10.1007/s11032-010-9528-8
-
Upload
independent -
Category
Documents
-
view
4 -
download
0
Transcript of Mapping of quantitative trait loci affecting resistance to Phytophthora nicotianae in tobacco (...

Mapping of quantitative trait loci affecting resistanceto Phytophthora nicotianae in tobacco (Nicotiana tabacum L.)line Beinhart-1000
Vijay Vontimitta • Ramsey S. Lewis
Received: 18 August 2010 / Accepted: 20 October 2010 / Published online: 4 November 2010
� Springer Science+Business Media B.V. 2010
Abstract Black shank, caused by Phytophthora
nicotianae, is one of the most important diseases
affecting tobacco (Nicotiana tabacum L.) production
worldwide. While monogenic resistance to Race 0 of
this pathogen has been transferred via interspecific
introgression, quantitative resistance is currently
needed to provide adequate resistance to all races.
The objective of this research was to gain increased
insight into the inheritance of resistance in the highly-
resistant cigar tobacco line, Beinhart-1000, and to
identify genomic regions contributing to this resistance.
A doubled haploid population was generated from a
cross between Beinhart-1000 and the susceptible
cultivar, Hicks. The population was evaluated for field
resistance in three environments and genotyped with
206 polymorphic microsatellite markers. No doubled
haploid line exhibited as high a level of resistance
as Beinhart-1000. Heritability was high and multiple
interval mapping suggested that at least six quantitative
trait loci (QTL) may contribute to the high level of
resistance in this line. The two largest QTL explained
25.4 and 20.4% of the observed phenotypic variation
for end percent survival. A model including all six
significant QTL explained 64.3% of the phenotypic
variation and 73.1% of the genetic variation. The two
major identified QTL and their associated markers may
be of use for employing Beinhart-1000 as a source of
black shank resistance in tobacco breeding. The major
QTL on linkage group four was found to cosegregate
with Abl, a gene involved in accumulation of the
trichome exudate cis-abienol. The question of pleiot-
ropy versus linkage needs to be investigated with
respect to partial resistance against P. nicotianae.
Keywords Black shank � Phytophthora nicotianae �Tobacco � Quantitative trait locus � cis-abienol
Introduction
The oomycete genus Phytophthora contains species
that are amongst the most destructive pathogens on a
very large range of economically important plant
species around the world. Phytophthora nicotianae is
the causal agent of black shank, the most important
disease affecting tobacco (Nicotiana tabacum L.)
production in the United States. This soil-borne
organism infects roots and stalks, resulting in stunting
and plant death. Growers can use combinations of
crop rotation, chemical inputs, and resistant varieties
to reduce loss from this pathogen. Genetic resistance
is the most attractive, however, because of the
potential for cost-effective protection.
Monogenic resistance to Race 0 provided by
the genes Php and Phl has been introgressed into
N. tabacum from the diploid relatives, N. plumbagin-
ifolia and N. longiflora, respectively (Valleau et al.
V. Vontimitta � R. S. Lewis (&)
Department of Crop Science, North Carolina State
University, Campus Box 7620, Raleigh, NC 27695, USA
e-mail: [email protected]
123
Mol Breeding (2012) 29:89–98
DOI 10.1007/s11032-010-9528-8
1960; Apple 1962; Chaplin 1962; Johnson et al.
2002a). This resistance mechanism provides no
resistance to alternative races of the black shank
pathogen, however (Carlson et al. 1997). Recent
wide-scale planting of cultivars possessing the Php
gene has resulted in race shifts in many growing areas,
and alternative races which are able to overcome this
type of resistance are now prevalent (Sullivan et al.
2005). The other type of resistance that has been
utilized in tobacco breeding is polygenic in nature and
is probably mostly derived from the cigar tobacco
cultivar, Florida 301 (Tisdale 1931). This is a classic
example of quantitative disease resistance in plants in
that it is controlled by multiple genes, is partial (not
complete), and is believed to be race non-specific. In
flue-cured tobacco, this type of resistance appears to
be negatively correlated with yield.
Additional sources of resistance may be of value for
extending the range and level of resistance to black
shank in flue-cured and burley tobacco (the major
market types), and with less of a negative influence
on yield. In addition, DNA markers associated with
genomic regions contributing to resistance might
increase the efficiency of developing resistant culti-
vars. The cigar tobacco line, Beinhart-1000, has the
highest reported level of quantitative resistance to
P. nicotianae (Heggestad and Lautz 1957; Silber and
Heggestad 1963; Chaplin 1966; Wills 1971; Nielsen
1992). Resistance in this line is believed to be effec-
tive against all races and its inheritance is likely
complex in nature (Chaplin 1966). Past efforts to
incorporate resistance from this line into burley and
flue-cured tobacco cultivars have been unsuccessful
due to unfavorable associations between resistance and
undesirable cigar-type characteristics (Nielsen 1992).
DNA markers closely associated with major genes
affecting resistance might increase the possibility of
transferring this resistance to commercial US tobacco
cultivars while selecting against the undesired cigar-
type characteristics of Beinhart-1000. The value of
DNA markers in breeding for black shank resistance in
tobacco has previously been demonstrated in connec-
tion with the Php gene derived from N. plumbaginifolia
(Johnson et al. 2002b).
To date, the vast majority of marker–trait associ-
ation studies in N. tabacum have focused on traits
introgressed from other Nicotiana species (Yi et al.
1998; Johnson et al. 2002b; Lewis 2005; Milla et al.
2005; Moon and Nicholson 2007). This is mostly due
to the limited amounts of polymorphisms revealed
amongst lines of N. tabacum using marker systems
such as restriction fragment length polymorphism
(RFLP), randomly amplified polymorphic DNA
(RAPD), or amplified fragment length polymorphism
(AFLP) (Bai et al. 1995; Ren and Timko 2001). Only
a few quantitative trait loci (QTL) mapping experi-
ments have been published to date for N. tabacum
(Nishi et al. 2003; Julio et al. 2006). Opportunities
for genome-wide mapping experiments have been
greatly enhanced with the development of microsat-
ellite markers for this species which exhibit an
increased degree of polymorphism and reproducibility
(Bindler et al. 2007; Moon et al. 2009a, b). The first
microsatellite marker-based linkage map for N. tabacum
was recently published (Bindler et al. 2007). To date,
microsatellite markers have been used to identify a
N. tabacum genomic region derived from Beinhart-
1000 carrying genes affecting leaf surface chemistry
(Vontimitta et al. 2010).
The overall purpose of the current investigation
was to gain an increased understanding of the inher-
itance of the high level of black shank resistance
exhibited by the cigar tobacco line, Beinhart-1000, and
to identify microsatellite markers associated with
genomic regions contributing to this resistance. The
first objective was to generate a doubled haploid
mapping population derived from a cross between
Beinhart-1000 and the black shank-susceptible flue-
cured tobacco cultivar Hicks. The second objective
was to genotype this population with several hundred
microsatellite markers and to subsequently perform
marker–trait association tests. Results for two genomic
regions identified to be associated with resistance may
have implications for breeding for resistance to this
disease, and for gaining increased insight into the
mechanisms underlying quantitative disease resistance
to Phytophthora in plants.
Materials and methods
Genetic materials
The cigar tobacco line, Beinhart-1000 (highly resis-
tant to black shank), was hybridized with the black
shank-susceptible flue-cured tobacco cultivar, Hicks.
The F1 was then crossed as a female with N. africana
to produce gynogenic haploids from seed according to
90 Mol Breeding (2012) 29:89–98
123

Burk et al. (1979). Random haploid plants were
chromosome doubled using the midvein culture
method of Kasperbaur and Collins (1972).
Field evaluation
The doubled haploid mapping population consisting
of 118 lines, along with the parental lines, were
evaluated in black shank disease nurseries at two
locations during 2007 (Cunningham Research Sta-
tion, Kinston, NC; and Upper Coastal Plain Research
Station, Rocky Mount, NC) and at one location
during 2008 (Cunningham Research Station, Kinston,
NC). The experimental design at each location was a
randomized complete block design with three repli-
cations. Plots consisted of single 12-plant rows. Inter-
row spacing was 1.20 m, and within-row spacing was
0.56 m at both locations. A cultivar with a low level
of partial black shank resistance, K 326, was planted
in every third row to permit testing for uniformity of
disease pressure in each of the three field environ-
ments. Beginning 30 days after transplanting, plots
were evaluated at 15-day intervals for number of
plants killed by black shank. At approximately
120 days after transplanting, end percent survival
was calculated for each plot.
Genotyping
DNA was isolated from the doubled haploid lines and
the parents according to Johnson et al. (1995), except
that a BIO 101 FastPrep machine (BIO 101, Holbrook,
NY, USA) was used for leaf tissue grinding. A total of
438 microsatellite primer pairs were screened to
identify those that amplified polymorphic bands
between the parental lines. Most primer sequences
were previously described by Bindler et al. (2007).
Additional primer sequences were provided by Altria
Client Services Inc. (Richmond, VA, USA). Detection
of PCR products was conducted using the labeling
method of Schuelke (2000). PCR reactions were
performed in 15 ll volumes containing 25 ng of
template DNA, 1 9 PCR buffer (10 mM KCl,
20 mM Tris–HCl pH 8.8, 2 mM MgSO4), 0.015 lM
forward primer, 0.06 lM reverse primer, 0.06 lM
M-13 primer, 0.2 mM dNTPs, and 1 U Taq DNA
polymerase (New England Biolabs, Ipswich, MA).
PCR reaction conditions consisted of a denaturation
step at 94�C for 5 min; 29 cycles of 94�C for 30 s, 55�C
for 45 s, 72�C for 45 s; followed by 7 cycles of 94�C for
30 s, 52�C for 45 s, 72�C for 45 s; and a final extension
step at 72�C for 5 min. Amplification products were
separated using 8% polyacrylamide gels and a LI-COR
4300 DNA Analysis System (LI-COR Biosciences,
Lincoln, NE, USA) under the following conditions:
1,500 V, 40 mA, 40 W, and 45�C for 2.5 h. IRDye
700- or 800-labeled molecular weight standards
(50–700 bp) were loaded on each gel to facilitate allele
sizing using AFLP Quantar 1.0 software (KeyGene
Products B.V., Wageningen, The Netherlands).
Statistical analysis
An arcsine transformation of the end percent survival
data was performed in order to approximate homoge-
neity of residual variance. Arcsine-transformed data
was used for analysis of variance (ANOVA) using
PROC GLM of SAS 9.1 software (SAS Institute,
Cary, NC, USA), and composite interval mapping and
multiple interval mapping analyses were performed as
described below. Various correlation coefficients
were calculated using PROC CORR of SAS 9.1.
Heritability on a plot basis and entry mean basis was
calculated using a univariate mixed model analysis as
described by Holland et al. (2003).
Linkage map construction
Linkage analysis and genetic map construction were
carried out using MapMaker/EXP 3.0 (Lander et al.
1987). Linkage was established on the basis of a
minimum logarithm of odds (LOD) score of 3.0 and
maximum map distance of 40 centimorgans (cM).
Marker order was established by first selecting a
subset of eight markers and then identifying the best
order by executing the ‘Compare’ command. Remain-
ing markers were added using the ‘Try’ command.
The final marker order was confirmed by executing
the ‘Ripple’ command. Map distances in cM were
estimated from recombination fractions using the
Haldane mapping function (Haldane 1919). Graphical
representations of linkage groups were created using
MAPCHART software (Voorrips 2002).
QTL detection
Composite interval mapping (Zeng 1994) and multi-
ple interval mapping (Kao and Zeng 1997; Kao et al.
Mol Breeding (2012) 29:89–98 91
123
1999) were performed using Windows QTL Cartog-
rapher V2.5 (Wang et al. 2007). In composite interval
mapping, log-likelihood values for statistically sig-
nificant associations between genotype and arcsine-
transformed end percent survival were generated by
calculating LOD scores at 0.5 cM intervals along
linkage groups. LOD threshold significance levels
were determined using 1,000 permutations of the
method of Churchill and Doerge (1994). Composite
interval mapping was executed only to provide an
initial model for further analysis using multiple
interval mapping. QTL peaks from composite interval
mapping with a LOD threshold value greater than 2.5
were used in the initial model for multiple interval
mapping. Models were created and tested in an
iterative, stepwise fashion, searching for new QTL,
and testing the significance of the QTL after each
search cycle. New models were accepted only when
they had a decreasing effect on the value of the
Bayesian Information Criterion (BIC) (Piepho and
Gauch 2001). After QTL were added according to the
BIC criterion, all possible interactions between QTL
were tested for their significance and were retained in
the model if they decreased the BIC. While develop-
ing the model using multiple interval mapping, there
is always a possibility of over-fitting the model, and to
avoid this, it was made sure that the proportion of total
phenotypic variation explained by QTL did not
exceed the trait heritability. The model with minimum
BIC was chosen, and the QTL effects were simulta-
neously estimated using the ‘summary’ option of QTL
Cartographer. Genetic variability explained by the
identified QTL was calculated as the total phenotypic
variation explained by QTL divided by the entry mean
heritability of the trait. Confidence intervals for the
identified QTL were calculated according to Lander
and Botstein (1989) using 1 LOD score as the support
interval.
Results
Phenotypic analyses
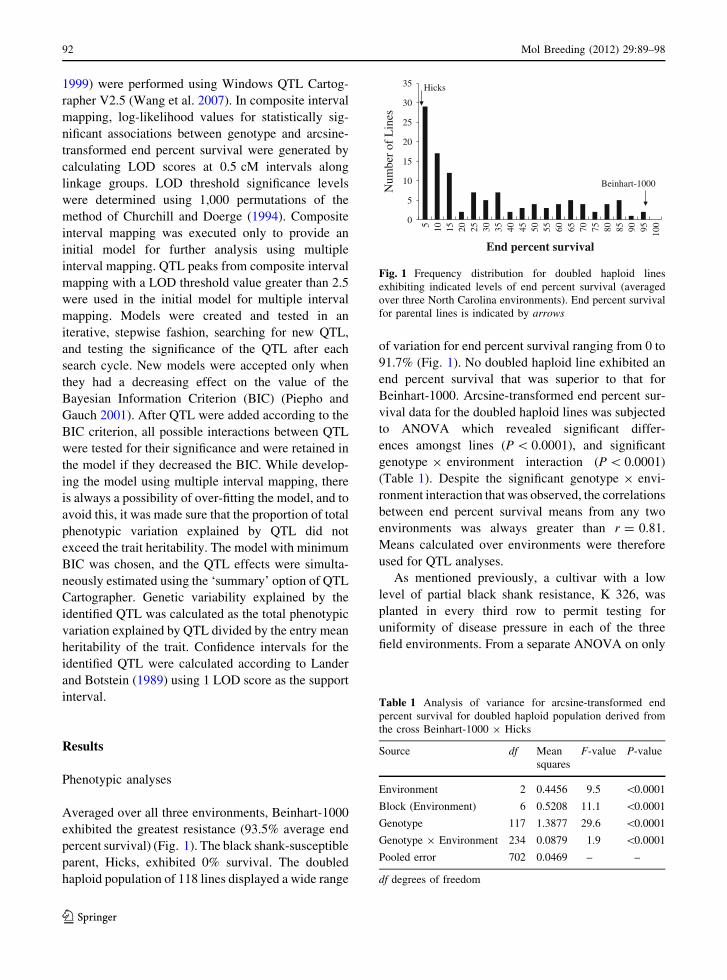
Averaged over all three environments, Beinhart-1000
exhibited the greatest resistance (93.5% average end
percent survival) (Fig. 1). The black shank-susceptible
parent, Hicks, exhibited 0% survival. The doubled
haploid population of 118 lines displayed a wide range
of variation for end percent survival ranging from 0 to
91.7% (Fig. 1). No doubled haploid line exhibited an
end percent survival that was superior to that for
Beinhart-1000. Arcsine-transformed end percent sur-
vival data for the doubled haploid lines was subjected
to ANOVA which revealed significant differ-
ences amongst lines (P \ 0.0001), and significant
genotype 9 environment interaction (P \ 0.0001)
(Table 1). Despite the significant genotype 9 envi-
ronment interaction that was observed, the correlations
between end percent survival means from any two
environments was always greater than r = 0.81.
Means calculated over environments were therefore
used for QTL analyses.
As mentioned previously, a cultivar with a low
level of partial black shank resistance, K 326, was
planted in every third row to permit testing for
uniformity of disease pressure in each of the three
field environments. From a separate ANOVA on only
0
5
10
15
20
25
30
35
5 10 15 20 25 30 35 40 45 50 55 60 65 70 75 80 85 90 95 100
End percent survival
Beinhart-1000
Hicks
Num
ber
of L
ines
Fig. 1 Frequency distribution for doubled haploid lines
exhibiting indicated levels of end percent survival (averaged
over three North Carolina environments). End percent survival
for parental lines is indicated by arrows
Table 1 Analysis of variance for arcsine-transformed end
percent survival for doubled haploid population derived from
the cross Beinhart-1000 9 Hicks
Source df Mean
squares
F-value P-value
Environment 2 0.4456 9.5 \0.0001
Block (Environment) 6 0.5208 11.1 \0.0001
Genotype 117 1.3877 29.6 \0.0001
Genotype 9 Environment 234 0.0879 1.9 \0.0001
Pooled error 702 0.0469 – –
df degrees of freedom
92 Mol Breeding (2012) 29:89–98
123
PT605570.0
PT5153911.1
PT5226015.5
PT5101329.0
PT3035142.5PT2039142.9PT2018943.3
PT3048550.2
1
PT303270.0PT201633.9PT518785.2PT507369.5PT5263312.3PT5369713.6PT3024215.7PT3011416.7PT5162417.6PT30183PT3006721.4
PT5054322.7PT6158324.5PT60715PT5370124.9
2
PT400210.0
PT203724.7PT30197PT124210.1
PT2028736.1
PT3036840.5
PT3001163.2
3
PT302720.0PT302242.9PT302233.3
PT3035427.7PT30209PT2031531.6
PT52061PT6136232.9
PT5131135.7PT6014637.0PT5509137.9PT3012440.1PT6137340.7PT5116443.8
PT5096256.4
PT2034372.3PT3034673.2
4
PT202750.0
PT2028917.7PT3031618.1PT3033718.5PT2019620.3PT3030221.2
5
PT302960.0PT20234PT300874.7
PT3024515.9
PT3018422.6
PT3046841.1
PT1199PT3016948.9
PT3047752.8
6
PT303930.0PT301383.8PT303944.9PT302026.1
PT3021516.1
PT3029221.7PT3041923.3
PT3045244.0
7
PT607990.0PT614724.4PT3017412.4PT6151220.1PT5000123.2PT5140527.3PT5275330.1PT5351830.5PT3014732.8PT5379533.7PT52986PT5133134.1
PT6131134.5PT30218PT3039535.8
PT5430540.2
8
PT202910.0
PT3047027.2PT4001527.6
PT114042.3PT139946.1
PT3010758.7
PT2023594.0
PT30416102.4PT30140PT30213103.5
PT30421105.3PT20149110.3
9
PT300770.0PT302501.8PT304085.4
PT3013212.5
PT30372PT2044524.7
PT2019225.1
10
PT300310.0PT301700.5PT534933.8PT518598.7PT300089.6
PT3001819.6
PT127923.9
PT2002136.6
11
PT300960.0PT300993.1
PT2024227.9
PT6049434.4PT2021334.8PT5053937.1
PT5518861.5
12
PT304800.0PT304172.6
PT3004611.6
PT5280421.0
PT3042026.9
PT134833.5PT2038337.1
13PT303140.0PT301735.1PT553925.5PT6101112.1PT6133712.5PT5441914.3PT54081PT5328716.1
PT3046218.4PT3040322.5
14
PT1154PT605100.0
PT204595.5
PT3046320.1
PT6011424.6
PT107845.4
15
PT528100.0
PT502468.0PT300529.8PT3006313.1
PT6005324.5
PT5357637.7
16
PT553600.0
PT300536.5
PT3015617.7PT2037621.7PT3027423.2
PT6149930.2PT3033931.5
17
PT301110.0PT11930.4PT302850.8PT600502.7PT527529.3
PT5510317.8
PT3009437.5
18
PT300050.0
PT302484.1
PT4000912.8
PT3016519.0
19
PT302890.0
PT30043PT300449.1
PT2012714.0PT5070015.9
PT3026536.2
PT2040048.8
20
PT302350.0PT301100.5PT604862.8PT11945.1PT503925.5
PT5472920.5
21
PT601830.0
PT5342410.7
PT3002830.3PT6114334.8PT131341.2PT30095PT1194-2PT30084
43.0
PT30034PT3036444.8
PT3017247.6
22
PT202020.0PT303551.1PT302575.8
PT3042412.9
23
PT301710.0
PT400056.1PT13059.1PT3009711.4
PT5231827.1
24
Unlinked markersPT20165 PT20286 PT61153 PT55416 PT61019 PT20291-2
*
*
*
**
**
*
****
*********
****
*
*
**
***
*
*
*
*
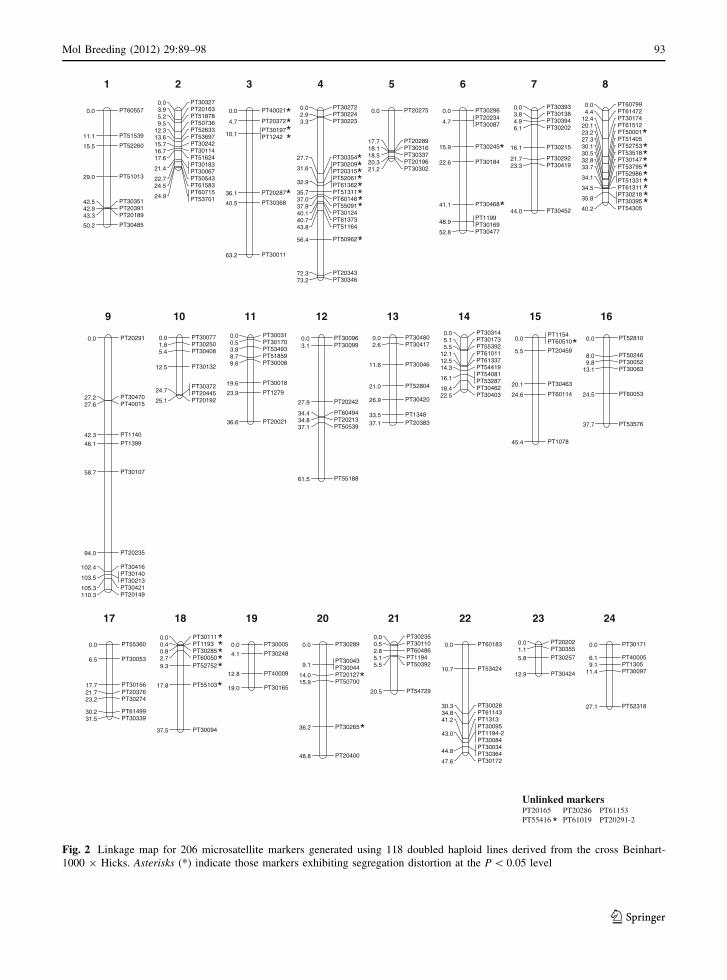
Fig. 2 Linkage map for 206 microsatellite markers generated using 118 doubled haploid lines derived from the cross Beinhart-
1000 9 Hicks. Asterisks (*) indicate those markers exhibiting segregation distortion at the P \ 0.05 level
Mol Breeding (2012) 29:89–98 93
123

these plots, no significant differences in disease
pressure were observed among plots within blocks
for any of the three environments. The heritability for
end percent survival was high. On a plot basis,
heritability was found to be h2 = 0.70, while herita-
bility on an entry mean basis was calculated to be
h2 = 0.88.
Genetic linkage map
From a total of 438 microsatellite primer pairs that
were made available to us, 204 were found to produce
clear bands that were polymorphic between Beinhart-
1000 and Hicks. Nearly all primer pairs amplified
single PCR products. Two primer pairs, PT1194 and
PT20291, generated two polymorphic products. As a
result, a total of 206 markers were subjected to linkage
analysis using MapMaker/EXP 3.0 (Lander et al.
1987). Two hundred markers were placed into 24
linkage groups, while six markers remained unlinked
(Fig. 2). Linkage groups consisted of 4–17 markers
with genetic lengths of each group ranging from 12.9
to 110.3 cM. The total genetic length of the linkage
map was estimated to be 990.8 cM. Significant levels
of segregation distortion (P \ 0.05) were observed
for 36 markers (Fig. 2). For the majority of these
markers (28 of 36), Beinhart-1000 alleles were
predominantly observed.
QTL identification
Using composite interval mapping, four genomic
regions on linkage groups 4, 8, 11 and 14 were found
to be significantly associated with end percent
survival (LOD scores greater than the threshold level
of 2.5). These four QTL were included in the initial
model for multiple interval mapping, and two addi-
tional QTL were added using the BIC criterion. The
final multiple interval mapping model included six
QTL located on linkage groups 2, 4, 8, 9, 11, and 14
(Table 2; Fig. 3). No significant QTL 9 QTL inter-
action effects were found, and the final model
therefore contained only six QTL main effects
(Table 2). High LOD score values of 11.53 and
13.20 were observed for the QTL identified on linkage
groups 4 and 8, respectively. These QTL explained
20.4 and 25.4% of the observed phenotypic variation,
respectively. The major QTL on linkage group 4 was
relatively well resolved with a 1 LOD confidence
interval of 2.8 cM, while that on linkage group 8 had a
confidence interval of 5.0 cM. The major objective of
this paper is to report these two major QTL and their
associated markers. The remaining four QTL were
minor and explained much lower percentages of the
observed phenotypic variation (\6.0%), and had
larger confidence intervals (Fig. 3). We are reporting
this information because of its statistical significance,
but the practical value of these additional marker–trait
associations is probably low. Beinhart-1000 contrib-
uted the favorable allele at each of the six genomic
regions. The final model composed of six QTL
explained 64.3% of the phenotypic variation and
73.1% of the genetic variation for end percent
survival. As the phenotypic variation explained by
the final model was less than the calculated heritabil-
ity on a plot basis (h2 = 0.70), over-fitting of the
model was determined not to be a problem.
Discussion
Previous researchers have concluded that the inheri-
tance of black shank resistance in N. tabacum is
complex. Incomplete penetrance typically compli-
cates studies designed to investigate this ques-
tion. Resistance derived from Florida 301 has been
Table 2 Estimates of QTL
positions, effects, and
explained phenotypic
variation from multiple
interval analysis
a Effect is presented as
back-transformed value to
approximate the
corresponding end percent
survival
QTL Linkage
group
Left
marker
Right
marker
Position
(cM)
LOD Effecta % Of phenotypic
variance explained
1 8 PT61472 PT30174 11.90 13.20 14.94 25.4
2 4 PT61373 PT51164 40.80 11.53 14.17 20.4
3 11 PT53493 PT51859 5.80 4.69 9.64 6.2
4 14 PT30314 PT30173 4.00 3.36 6.38 5.5
5 9 PT20291 PT30470 7.00 1.39 4.70 3.5
6 2 PT30067 PT50543 21.50 2.04 6.53 3.3
94 Mol Breeding (2012) 29:89–98
123

reported to be from simple recessive (Clayton 1958),
to partially dominant and affected by modifying
factors (Moore and Powell 1959), to polygenic and
additive (Smith and Clayton 1948; Crews et al. 1964;
Chaplin 1966). In studies of F1 hybrids involving
Beinhart-1000 and more susceptible lines, Silber and
Heggestad (1963) found resistance to be intermediate.
Chaplin (1966) concluded that resistance of Beinhart-
1000 was complex and highly influenced by the
environment. The current investigation provides fur-
ther evidence for the conclusion that the inheritance of
resistance in Beinhart-1000 is complex. This is
supported by the frequency distribution in Fig. 1
where none of the 118 doubled haploid lines exhibited
as high a level of resistance as Beinhart-1000, and also
by the fact that six significant QTL were identified.
The range in their effects was great, with two of the
six QTL exhibiting very large effects. The level of
dominance of the identified regions cannot be deter-
mined from the current data, but past research has
suggested at least some degree of additivity (Silber
and Heggestad 1963; Chaplin 1966).
PT607990.0
PT614724.4
PT3017412.4
PT6151220.1
PT5000123.2
PT5140527.3PT5275330.1PT5351830.5PT3014732.8PT5379533.7PT52986PT5133134.1
PT6131134.5PT30218PT3039535.8
PT5430540.2
QT
L-1
0 5
10 PT302720.0PT302242.9PT302233.3
PT3035427.7PT30209PT2031531.6
PT52061PT6136232.9
PT5131135.7PT6014637.0PT5509137.9PT3012440.1PT6137340.7PT5116443.8
PT5096256.4
PT2034372.3PT3034673.2
QT
L-2
0 5
10 PT300310.0PT301700.5
PT534933.8
PT518598.7PT300089.6
PT3001819.6
PT127923.9
PT2002136.6
QT
L-3
0 5
10
PT303140.0
PT301735.1PT553925.5
PT6101112.1PT6133712.5
PT5441914.3
PT54081PT5328716.1
PT3046218.4
PT3040322.5
QT
L-4
0 5
10
PT202910.0
PT3047027.2PT4001527.6
PT114042.3PT139946.1
PT3010758.7
PT2023594.0
PT30416102.4PT30140PT30213103.5
PT30421105.3PT20149110.3
QT
L-5
0 5
10
PT303270.0
PT201633.9
PT518785.2
PT507369.5
PT5263312.3
PT5369713.6
PT3024215.7PT3011416.7PT5162417.6
PT30183PT3006721.4
PT5054322.7
PT6158324.5PT60715PT5370124.9
QT
L-6
0 5
10
Linkage Group 8 Linkage Group 4 Linkage Group 11
Linkage Group 14 Linkage Group 9 Linkage Group 2
Fig. 3 LOD score peaks generated from multiple interval
analysis of arcsine-transformed end percent survival data for
Beinhart-1000 9 Hicks doubled haploid mapping population.
Length of vertical solid black bars indicates confidence
interval (96.8%) calculated with a support interval of 1 LOD
score
Mol Breeding (2012) 29:89–98 95
123
Previous research efforts to map N. tabacum
genomic regions controlling quantitative traits have
been greatly limited relative to most major crops.
This is largely due to low levels of DNA polymor-
phism revealed by earlier molecular marker systems.
Opportunities for mapping quantitative traits in this
species have now been greatly improved with the
development of microsatellite markers (Bindler et al.
2007). The map presented here is only the second
published N. tabacum map based upon microsatellite
markers. The total genetic length of the map reported
here was only 990.8 cM, however, and likely covers
slightly less than 50% of the total genome. Never-
theless, we were successful in identifying genomic
regions that, together, explained 73.1% of the genetic
variation. As mentioned previously, the major objec-
tive of this publication is to report the two major QTL
found to be associated with black shank resistance on
linkage groups 4 and 8 (explaining 20.4 and 25.4% of
the phenotypic variation, respectively). The QTL on
linkage group 4 appeared to have been mapped fairly
precisely with a confidence interval of only 2.8 cM.
Although we have reported additional statistically
significant marker–trait associations, their potential
contribution to a breeding scheme is likely very
small. As additional microsatellite markers become
publicly available, further genotyping may permit
identification of more genomic regions contributing
to black shank resistance in Beinhart-1000, and
permit an increased marker density in regions of
interest identified here.
The overriding objective of this research is to
develop marker-based tools for utilizing a previously
unused source of black shank resistance in flue-cured
and burley tobacco. In the end, it may be possible to
increase the range and level of resistance to this
important disease. The objective would be to transfer
genomic regions positively affecting resistance to
these tobacco types while selecting against the
remainder of the Beinhart-1000 genome. This is the
case because cigar tobacco characteristics are gener-
ally undesirable for flue-cured and burley tobacco
cultivars. The two major QTL identified in this study
on linkage groups 4 and 8 might be candidates for
marker-assisted selection. Additional markers might
need to be added to better resolve the QTL on linkage
group 8, however. Further work might also be
conducted to determine if any of the markers identi-
fied to be associated with black shank resistance in
Beinhart-1000 are also associated with resistance
derived from Florida 301. If this were the case, such
markers might be immediately useful in flue-cured
and burley tobacco populations segregating for resis-
tance derived from this source. Figure 1 illustrates the
low frequency of lines exhibiting resistance levels
comparable to the resistant parent. Genotyping of
plants in initial segregating generations derived from
breeding crosses followed by intercrossing desirable
genotypes might increase the frequency of lines
exhibiting high levels of resistance extracted from
breeding populations.
Finally, an interesting finding of this research is
that the major black shank resistance QTL identified
on linkage group 4 co-locates with two genes, Abl and
BMVSE, influencing the accumulation of certain
trichome exudates on above-ground plant parts in
Oriental and some cigar tobaccos. The first gene, Abl,
is associated with the accumulation of cis-abienol, and
may encode for cis-abienol synthase (Wagner 1999).
The second gene, BMVSE, is involved in controlling
the biosynthesis of Groups III–VI sucrose esters
(Gwynn et al. 1985). These two genes were previously
mapped onto linkage group 4 using the exact same
population utilized in the current investigation
(Vontimitta et al. 2010). Microsatellite marker PT30124
exhibited complete cosegregation with Abl and also
resides within the small black shank resistance QTL
confidence interval on linkage group 4, which corre-
sponds to chromosome A of the N. tabacum genome
(Vontimitta et al. 2010). Microsatellite markers
PT30209 and PT20315 exhibited complete cosegre-
gation with BMVSE at a distance of 8.5 cM from Abl,
and were outside of the confidence interval for the
black shank resistance QTL identified on this chro-
mosome. The possibility that either of these trichome
exudates may affect resistance to Phytophthora
nicotianae needs to be investigated, especially given
past mention of their possible role in plant defense
(Severson et al. 1985; Jackson and Danehower 1996;
Wagner 1999). The reported isolation of genes
involved in cis-abienol synthesis (Sallaud et al.
2008) might permit plant transformation studies
designed to study the effect of either up-regulating
or down-regulating production of this compound on
partial resistance to Phytophthora. This possibility is
interesting from a plant biology perspective, but is
also important from the point of view of tobacco
cultivar development. Cis-abienol and Groups III–VI
96 Mol Breeding (2012) 29:89–98
123

sucrose esters are leaf surface chemistry traits that are
generally specific to Oriental and some cigar tobac-
cos. Their breakdown products contribute in a
substantial way to flavor and aroma of these tobacco
types (Severson et al. 1985), but are undesirable for
flue-cured or burley tobacco. If Abl does not have a
pleiotropic effect on black shank resistance, and there
is very close linkage between this gene and the gene
affecting resistance, significant effort might be needed
to break the linkage in order to utilize this genomic
region in breeding for disease resistance in flue-cured
or burley tobacco. Finally, information obtained
from the study presented here may be valuable in
preliminary efforts to better understand the molecu-
lar mechanism(s) behind quantitative resistance to
Phytophthora species in plants.
Acknowledgments This research was supported, in part, by
Altria Client Services Inc. and Philip Morris International.
References
Apple JL (1962) Transfer of resistance to black shank (Phytoph-thora parasitica var nicotianae) from Nicotiana plumba-ginifolia to N. tabacum. Phytopathology (Abstract)52:1
Bai D, Reeleder R, Brandle JE (1995) Identification of two
RAPD markers tightly linked with the Nicotiana debneyigene for resistance to black root rot of tobacco. Theor
Appl Genet 91:1184–1189
Bindler G, van der Hoeven R, Gunduz I, Plieske J, Ganal M,
Rossi L, Gadani F, Donini P (2007) A microsatellite marker
based linkage map of tobacco. Theor Appl Genet 114:
341–349
Burk LG, Gerstel DU, Wernsman EA (1979) Maternal haploids
of Nicotiana tabacum from seed. Science 206:585
Carlson SR, Wolff MF, Shew HD, Wernsman EA (1997)
Inheritance of resistance to race 0 of Phytophthora par-asitica var. nicotianae from the flue-cured tobacco culti-
var Coker 371-Gold. Plant Dis 81:1269–1274
Chaplin JF (1962) Transfer of black shank resistance from
Nicotiana plumbaginifolia to flue-cured N. tabacum. Tob
Sci 6:184–189
Chaplin JF (1966) Comparison of tobacco black shank (Phy-tophthora parasitica var. nicotianae) resistance from four
sources. Tob Sci 10:55–58
Churchill GA, Doerge RW (1994) Empirical threshold values
for quantitative trait mapping. Genetics 138:963–971
Clayton EE (1958) The genetics and breeding progress in
tobacco during the last 50 years. Agron J 50:352–356
Crews JW, Wills WH, Laprade JL (1964) Black shank disease
reactions of six flue-cured tobacco varieties and the F1
hybrids among them. Tob Sci 8:128–132
Gwynn GR, Severson RF, Jackson DM, Stephenson MG
(1985) Inheritance of sucrose esters containing b-meth-
ylvaleric acid in tobacco. Tob Sci 29:79–81
Haldane JBS (1919) The combination of linkage values, and
the calculation of distances between the loci of linked
factors. J Genet 8:299–309
Heggestad HE, Lautz W (1957) Some results of studies on
resistance to tobacco black shank. Phytopathology 47:452
Holland JB, Nyquist WE, Cervantes-Martinez CT (2003)
Estimating and interpreting heritability for plant breeding:
an update. Plant Breed Rev 22:9–112
Jackson DM, Danehower DA (1996) Integrated case study:
Nicotiana leaf surface components and their effects on
insect pests and diseases. In: Kerstiens G (ed) Plant
cuticles—an integrated functional approach. BIOS Sci.
Publishers, Oxford, pp 231–254
Johnson E, Miklas PN, Stavely JR, Martinez-Cruzado JC
(1995) Coupling- and repulsion-phase RAPDs for marker-
assisted selection of PI 181996 rust resistance in common
bean. Theor Appl Genet 90:659–664
Johnson ES, Wolff MF, Wernsman EA, Atchley WR, Shew HD
(2002a) Origin of the black shank resistance gene, Ph, in
tobacco cultivar Coker 371-Gold. Plant Dis 86:1080–1084
Johnson ES, Wolff MF, Wernsman EA, Rufty RC (2002b)
Marker-assisted selection for resistance to black shank
disease in tobacco. Plant Dis 86:1303–1309
Julio E, Denoyes-Rothan B, Verrier JL, de Borne F (2006)
Detection of QTLs linked to leaf and smoke properties in
Nicotiana tabacum based on a study of 114 recombinant
inbred lines. Mol Breed 18:69–91
Kao CH, Zeng ZB (1997) General formulas for obtaining the
MLEs and the asymptotic variance-covariance matrix in
mapping quantitative trait loci when using the EM algo-
rithm. Biometrics 53:653–665
Kao CH, Zeng ZB, Teasdale RD (1999) Multiple interval map-
ping for quantitative trait loci. Genetics 152:1203–1216
Kasperbaur MJ, Collins GB (1972) Reconstitution of diploids
from leaf tissue of anther-derived haploids in tobacco.
Crop Sci 12:98–101
Lander ES, Botstein D (1989) Mapping Mendelian factors
underlying quantitative traits using RFLP linkage maps.
Genetics 121:185–199
Lander ES, Green P, Abrahamson J, Barlow A, Daly MJ,
Lincoln SE, Newburg L (1987) MAPMAKER: an inter-
active computer package for constructing primary genetic
linkage maps with experimental and natural populations.
Genomics 1:174–181
Lewis RS (2005) Transfer of resistance to potato virus Y
(PVY) from Nicotiana africana to Nicotiana tabacum:
possible influence of tissue culture on the rate of intro-
gression. Theor Appl Genet 110:678–687
Milla SR, Levin JS, Lewis RS, Rufty RC (2005) RAPD and
SCAR markers linked to an introgressed gene condition-
ing resistance to Peronospora tabacina Adam. in tobacco.
Crop Sci 45:2346–2354
Moon H, Nicholson JS (2007) AFLP and SCAR markers linked
to tomato spotted wilt virus resistance in tobacco. Crop
Sci 47:1887–1894
Moon HS, Nicholson JS, Heineman A, Lion K, van der Hoeven
P, Hayes AJ, Lewis RS (2009a) Changes in genetic
diversity of US flue-cured tobacco germplasm over seven
decades of cultivar development. Crop Sci 49:498–508
Moon HS, Nifong JM, Nicholson JS, Heineman A, Lion K,
van der Hoeven R, Hayes AJ, Lewis RS (2009b)
Mol Breeding (2012) 29:89–98 97
123
Microsatellite-based analysis of tobacco (Nicotianatabacum L.) genetic resources. Crop Sci 49:2149–2159
Moore EL, Powell NT (1959) Dominant and modifying genes
for resistance to black shank of tobacco. Proc Assoc
Southern Agric Workers, p. 211
Nielsen MT (1992) Sources of resistance to black shank and
black root rot diseases. CORESTA Info Bull 3(4):144–150
Nishi T, Tajima T, Noguchi S, Ajisaka H, Negishi H (2003)
Identification of DNA markers of tobacco linked to bac-
terial wilt resistance. Theor Appl Genet 106:765–770
Piepho HP, Gauch HG (2001) Marker pair selection for map-
ping quantitative trait loci. Genetics 157:433–444
Ren N, Timko MP (2001) AFLP analysis of genetic poly-
morphism and evolutionary relationships among culti-
vated and wild Nicotiana species. Genome 44:559–571
Sallaud C, Rontein D, Tissier A (2008) Genes coding for cis-
labda-12,14-dien-8 alpha-ol (cis-abienol) synthase and
syn-copalyl-8-ol diphosphate synthase and uses thereof.
International Patent Application PCT/FR2007/051654
Schuelke M (2000) An economic method for the fluorescent
labelling of PCR fragments. Nat Biotechnol 18:233–234
Severson RF, Johnson AW, Johnson DM (1985) Cuticular
constituents of tobacco: factors affecting their production
and their role in insect and disease persistence and smoke
quality. Rec Adv Tob Sci 11:105–174
Silber G, Heggestad HE (1963) Comparative black shank
resistance of Beinhart-1000 (Quin Diaz), N.C. 5346, and
Rg in F1 generation involving various tobacco types. Tob
Sci 7:144–147
Smith TE, Clayton EE (1948) Resistance to bacterial wilt and
black shank in flue-cured tobacco. Phytopathology 38:
227–229
Sullivan MJ, Melton TA, Shew HD (2005) Managing the race
structure of Phytophthora parasitica var. nicotianae with
cultivar rotation. Plant Dis 89:1285–1294
Tisdale WB (1931) Development of strains of cigar wrapper
tobacco resistant to black shank (Phytophthora nicotianaeBreda de Haan). Florida Univ Agr Expt Stat Bull 226:1–45
Valleau WD, Stokes GW, Johnson EM (1960) Nine years
experience with the Nicotiana longiflora factor for resis-
tance to Phytophthora parasitica var. nicotianae in the
control of black shank. Tob Sci 4:92–94
Vontimitta V, Danehower DA, Steede T, Moon HS, Lewis RS
(2010) Analysis of a Nicotiana tabacum L. genomic region
controlling two leaf surface chemistry traits. J Agric Food
Chem 58:294–300
Voorrips RE (2002) MapChart: software for the graphical
presentation of linkage maps and QTLs. J Hered 93:77–78
Wagner G (1999) Leaf surface chemistry. In: David DL,
Nielsen MT (eds) Tobacco production, chemistry and
technology. Blackwell, Malden, pp 292–303
Wang S, Basten CJ, Gaffney P, Zeng ZB (2007) Windows
QTL Cartographer 2.5 User manual. available online at:
http://statgen.ncsu.edu/qtlcart/wqtlcart.htm. NC State
University Bioinformatics Research Center, Raleigh
Wills WH (1971) A comparison of black shank resistance of
tobacco measured in inoculated whole plants and excised
leaf tissue. Tob Sci 15:47–50
Yi YH, Rufty RC, Wernsman EA (1998) Identification of
RAPD markers linked to the wildfire resistance gene in
tobacco. Tob Sci 42:52–57
Zeng ZB (1994) Precision mapping of quantitative trait loci.
Genetics 136:1457–1468
98 Mol Breeding (2012) 29:89–98
123