Additional Quantitative Trait Loci and Candidate Genes for Seed Isoflavone Content in Soybean
14
Journal of Agricultural Science; Vol. 5, No. 11; 2013 ISSN 1916-9752 E-ISSN 1916-9760 Published by Canadian Center of Science and Education 20 Additional Quantitative Trait Loci and Candidate Genes for Seed Isoflavone Content in Soybean M. Akond 1 , Bazelle Richard 1 , Bobby Ragin 1 , Harmin Herrera 2 , Umerah Kaodi 2 , Cevdet Akbay 2 , Stella K. Kantartzi 3 , Victor Njiti 4 , Abdelali Barakat 5 , Khalid Meksem 3 , David A Lightfoot 3 & My Abdelmajid Kassem 1 1 Plant Genomics and Biotechnology Lab, Department of Biological Sciences, Fayetteville State University, Fayetteville, NC 28301-4298, USA 2 Department of Chemistry and Physics, Fayetteville State University, Fayetteville, NC 28301-4298, USA 3 Department of Plant, Soil and Agricultural Systems, Southern Illinois University, Carbondale, IL 62901-4415, USA 4 Department of Agriculture, Alcorn State University, Alcorn State, MS 39096, USA; 5 Department of Biology, University of South Dakota, 414 E. Clark Street Vermillion, SD 57069, USA Correspondence: My Abdelmajid Kassem, Department of Biological Sciences, Fayetteville State University, Fayetteville, NC 28301-4298, USA. Tel: 1-910-672-1114. E-mail: [email protected] Received: September 11, 2013 Accepted: September 30, 2013 Online Published: October 15, 2013 doi:10.5539/jas.v5n11p20 URL: http://dx.doi.org/10.5539/jas.v5n11p20 Abstract Seed isoflavone content of soybean (Glycine max L. Merr.) is a trait of moderate heritablity and an ideal target for marker selection. To date over 20 QTL have been identified underlying this trait among seven populations. The objectives of this study were to identify additional QTL and candidate genes controlling isoflavone content in a set of recombinant inbred line (RIL) populations of soybean grown in two different seasons. Variations of isoflavones namely daidzein, glycitein and genistein contents over two growing seasons and locations suggests that isoflavones are influenced by both genes and environments. Six QTL were identified on five different chromosomes (Chr) or linkage groups (LG) that controlled daidzein (Chr_2/LG-M; Chr_17a/LG-D2), glycitein (Chr_2/LG-D1b; Chr_8/LG-A2) and genistein (Chr_8/LG-A2; Chr_12/LG-H) respectively in the seeds grown in season 2010. Two QTL were identified for daidzein (Chr_6/LG-C2; Chr_13b/LG-F), two QTLs for glycitein (Chr_1/LG-D1a; Chr_17c/LG-D2) and five QTLs for genistein (Chr_3/ LG-N; Chr_8/LG-A2; Chr_9/LG-K; Chr_18/LG-G) in the seeds of the 2011 growing season. Genes located within QTL confidence intervals were retrieved and gene ontology (GO) terms were used to identify those related to the flavonoid biosynthesis process. Twenty six candidate genes were identified that may be involved in isoflavones accumulation in soybean seeds. Keywords: soybean (Glycine max L. Merr.), RILs, isoflavone, SNP, QTL, genetic linkage map 1. Introduction Isoflavones are secondary metabolites produced mainly by Papilionoideae subfamily to which soybean [Glycine max (L.) Merr.] belongs. The most studied soybean seed isoflavones are genistein, daidzein, and glycitein that have numerous health benefits in humans and some animals (Alderkreutz, Banwart, Wahala, Makela, Brunow, Hase, & Arosemena, & Vickery, 1993; Setchell, 1998; Regal, Frazer, Weeks, & Greenberg, 2000; Hedlund, Johannes, Miller, 2003). These compounds have antimutagenic activity (Miyazawa, Sakoano, Nakamura, & Kosaka, 1999), reduce the risk of breast and prostate cancer (Wang, Wang, Lu, Kao, & Chen, 2009; Jiang, Payton- Stewart, Elliott, Driver, Rhodes, Zhang, Zheng, & Wang, 2010), reduce the risk of cardiovascular diseases, osteoporosis and also have effect on ameliorate the symptoms of menaupose in women (Regal et al., 2000; Hedlund et al., 2003). In plants, isoflavones play a role in different types of stresses and in defense against pathogenes (Mabrouk, Zourgui, Delavault, Simier, & Belhadj, 2007). In Soybean, Isoflavones can be produced in all parts of plants but the seeds are the major sites of isoflavones synthesis and storage in soybean plant. However, the biological effects of the isoflavones on human appear to depend on purity and dose of isoflavones, age of consumed person, and other dietary cofactors (Knight & Eden, 1996). Previous studies showed that seed isoflavones contents fluctuates within cultivars, growing seasons, and environments (Njiti et al., 1999; Kassem, Meksem, Iqbal, Wood, & Lightfoot, 2004; Primomo et al., 2005; Kim
Transcript of Additional Quantitative Trait Loci and Candidate Genes for Seed Isoflavone Content in Soybean
Journal of Agricultural Science; Vol. 5, No. 11; 2013 ISSN 1916-9752 E-ISSN 1916-9760
Published by Canadian Center of Science and Education
20
Additional Quantitative Trait Loci and Candidate Genes for Seed Isoflavone Content in Soybean
M. Akond1, Bazelle Richard1, Bobby Ragin1, Harmin Herrera2, Umerah Kaodi2, Cevdet Akbay2, Stella K. Kantartzi3, Victor Njiti4, Abdelali Barakat5, Khalid Meksem3, David A Lightfoot3 & My Abdelmajid Kassem1
1 Plant Genomics and Biotechnology Lab, Department of Biological Sciences, Fayetteville State University, Fayetteville, NC 28301-4298, USA 2 Department of Chemistry and Physics, Fayetteville State University, Fayetteville, NC 28301-4298, USA 3 Department of Plant, Soil and Agricultural Systems, Southern Illinois University, Carbondale, IL 62901-4415, USA 4 Department of Agriculture, Alcorn State University, Alcorn State, MS 39096, USA; 5 Department of Biology, University of South Dakota, 414 E. Clark Street Vermillion, SD 57069, USA Correspondence: My Abdelmajid Kassem, Department of Biological Sciences, Fayetteville State University, Fayetteville, NC 28301-4298, USA. Tel: 1-910-672-1114. E-mail: [email protected] Received: September 11, 2013 Accepted: September 30, 2013 Online Published: October 15, 2013 doi:10.5539/jas.v5n11p20 URL: http://dx.doi.org/10.5539/jas.v5n11p20
Abstract Seed isoflavone content of soybean (Glycine max L. Merr.) is a trait of moderate heritablity and an ideal target for marker selection. To date over 20 QTL have been identified underlying this trait among seven populations. The objectives of this study were to identify additional QTL and candidate genes controlling isoflavone content in a set of recombinant inbred line (RIL) populations of soybean grown in two different seasons. Variations of isoflavones namely daidzein, glycitein and genistein contents over two growing seasons and locations suggests that isoflavones are influenced by both genes and environments. Six QTL were identified on five different chromosomes (Chr) or linkage groups (LG) that controlled daidzein (Chr_2/LG-M; Chr_17a/LG-D2), glycitein (Chr_2/LG-D1b; Chr_8/LG-A2) and genistein (Chr_8/LG-A2; Chr_12/LG-H) respectively in the seeds grown in season 2010. Two QTL were identified for daidzein (Chr_6/LG-C2; Chr_13b/LG-F), two QTLs for glycitein (Chr_1/LG-D1a; Chr_17c/LG-D2) and five QTLs for genistein (Chr_3/ LG-N; Chr_8/LG-A2; Chr_9/LG-K; Chr_18/LG-G) in the seeds of the 2011 growing season. Genes located within QTL confidence intervals were retrieved and gene ontology (GO) terms were used to identify those related to the flavonoid biosynthesis process. Twenty six candidate genes were identified that may be involved in isoflavones accumulation in soybean seeds. Keywords: soybean (Glycine max L. Merr.), RILs, isoflavone, SNP, QTL, genetic linkage map 1. Introduction Isoflavones are secondary metabolites produced mainly by Papilionoideae subfamily to which soybean [Glycine max (L.) Merr.] belongs. The most studied soybean seed isoflavones are genistein, daidzein, and glycitein that have numerous health benefits in humans and some animals (Alderkreutz, Banwart, Wahala, Makela, Brunow, Hase, & Arosemena, & Vickery, 1993; Setchell, 1998; Regal, Frazer, Weeks, & Greenberg, 2000; Hedlund, Johannes, Miller, 2003). These compounds have antimutagenic activity (Miyazawa, Sakoano, Nakamura, & Kosaka, 1999), reduce the risk of breast and prostate cancer (Wang, Wang, Lu, Kao, & Chen, 2009; Jiang, Payton- Stewart, Elliott, Driver, Rhodes, Zhang, Zheng, & Wang, 2010), reduce the risk of cardiovascular diseases, osteoporosis and also have effect on ameliorate the symptoms of menaupose in women (Regal et al., 2000; Hedlund et al., 2003). In plants, isoflavones play a role in different types of stresses and in defense against pathogenes (Mabrouk, Zourgui, Delavault, Simier, & Belhadj, 2007). In Soybean, Isoflavones can be produced in all parts of plants but the seeds are the major sites of isoflavones synthesis and storage in soybean plant. However, the biological effects of the isoflavones on human appear to depend on purity and dose of isoflavones, age of consumed person, and other dietary cofactors (Knight & Eden, 1996). Previous studies showed that seed isoflavones contents fluctuates within cultivars, growing seasons, and environments (Njiti et al., 1999; Kassem, Meksem, Iqbal, Wood, & Lightfoot, 2004; Primomo et al., 2005; Kim

www.ccsenet.org/jas Journal of Agricultural Science Vol. 5, No. 11; 2013
21
& Chung, 2007; Tsai et al., 2007; Bennett, Yu, Heatherly, & Krishnan, 2004; Lee et al., 2008). Selection soybean cultivar for high-isoflavone content is one of goal to the breeders. To date, genetic linkage analysis has been used to identify loci for isoflavones in two or more populations. However, it is likely that the genetic map locations of all quantitative trait loci (QTL) associated with isoflavone content have not yet been determined. The control of isoflavone content in soybean seeds is largely genetic rather than the environmental interactions (Gutierrez-Gonzalez et al., 2009; Hoeck, Fehr, Murphy, & Welke, 2000; Murphy et al., 2009), and several minor effects QTL have been found which determined amounts of isoflavonein soybean. Numerous studies have shown soybean isoflavones to be a quantitatively inherited trait (Kassem et al., 2004; Primomo et al., 2005; Meksem et al., 2001; Kassem et al., 2006; Zeng et al., 2009). Identification and mapping isoflavones QTL could offer breeders improving the level of isoflavones in soybean through marker assisted selection (MAS). Researchers have been creating genetic maps for soybean using several different DNA markers in order to identify allelic polymorphisms. To date, different molecular techniques including, amplified fragment length polymorphisms (AFLPs), restriction fragment length polymorphisms (RFLPs), simple sequence repeats (SSRs or microsatellites), and single nucleotide polymorphisms (SNPs) were used for constructing map and subsequently QTL identification. Updated genetic maps have been created for the soybean genome and the recent consensus map was created using 1,536 SNP markers, which showed that the soybean genome is approximately 2,300 centimorgans (cM) in length (Hyten et al., 2010) The creations of genetic linkage maps for soybeans have proved useful for identifying QTL (Hyten et al., 2010) and for this purpose recently we developed a genetic linkage map of soybean from RILs of MD 96-5722 by ‘Spencer’ using the SoySNP6K Illumina Infinium BeadChip Genotyping Array (Akond et al., 2013). Another high density genetic linkage maps was constructed using the 1,536 Universal Soy Linkage Panel 1.0 SNP markers in the ‘PI 438489B’ by ‘Hamilton’ populations and 31 linkage groups were obtained and used in this study (Kassem et al., 2012). Up to date several isoflavones QTL were identified from the linkage map constructed by different markers (Kassem et al., 2004; Gutierrez-Gonzalez et al., 2009; Zeng et al., 2009; Gutierrez-Gonzalez et al., 2010). SNP markers allow the anchoring of genetic maps and QTL on the soybean genome sequence so identifying large genomic regions each containing several hundred genes. However, imbedding of the genetic maps and QTL on soybean genome sequence allows identifying genome regions that contained hundreds of genes. Functional annotations can be applied in order to reduce the number of candidate genes. Identification of more QTL and candidate genes will enhance the marker assisted selection (MAS) for genetic improvement of soybeans. The objectives of this research were; (1) to map additional QTL controlling isoflavone contents in soybean; and (2) to identify candidate genes underlying the QTL intervals using annotation based enrichment tools and Gene Ontology databases. 2. Materials and Methods 2.1 Plant Material Isoflavones Quantification and Data Analysis In this study, we used a set of 50 recombinant inbred line (RIL) of soybean derived from a cross between the cultivars PI 438489B and Hamilton. This RIL population was developed by the Agronomy Research Center, Iowa State University by Dr. Silvia Cianzio and was provided to us by Dr. Khalid Meksem of Southern Illinois University. The population was grown in two different seasons and locations (FSU campus, Fayetteville, NC – 2010 and Saint Pauls, NC – 2011) as described earlier (Ragin, Bazelle, Clark, Kantartzi, Meksem, Akond, and Kassem, 2012). RIL population and parental lines were harvested at maturity and seeds were dried for having samples for isoflavones analysis. Five grams (g) of seeds were grinded to flour in hexane using a laboratory blender and incubated at room temperature for 1 hour shaking period. To the defatted flour samples 8 mL of methanol was added and the mixtures were then centrifuged at 1,000 g for 20 min and incubated overnight under a fume hood. The supernatant was then placed under nitrogen flow, when the solvent reached to a final volume of 2 mL, the evaporation method was stopped (Xu & Godber, 2002). For quantification of isoflavones using HPLC, 200 µl of the samples were diluted with 200 µL of mobile phase diluent which separated the liquid into two layers. The resulting mixture was vortex then centrifuged at 12,000 g for 5 min and thereafter 200 µL aliquot of the supernatant was dispensed into an HPLC vial for analysis. Daidzein, glycitein, and genistein standards (Chromadex, Irvine, CA) were used in quantification by HPLC. To determine the interactions between genotypic effect of RILs and growing seasons or locations the isoflavones data was analysed via combined analyses of variance using the general linear model (GLM) procedure of Statistical Analysis System (SAS).

www.ccsenet.org/jas Journal of Agricultural Science Vol. 5, No. 11; 2013
22
2.2 SNP Genotyping, Genetic Map Construction and QTL Mapping DNA from RIL population was genotyped using the 1,536 Universal Soy Linkage Panel 1.0 (Hyten et al., 2010). SNPs markers were created through the GoldenGate assay on BeadStation 500G (Illumina Inc., San Diego, CA) following the manufactures protocols; detail information of SNPs and procedures were described previously by Fan et al. (2003) and Hyten et al. (2008). BeadStudio version 3.2 software (Illumina Inc., San Diego, CA) was used for allele calling for each locus. The genetic linkage map (Kassem et al., 2012) was computed using Join-Map 4.0 software (Stam, 1993). Win-QTL Cartographer version 2.5 (Wang, Basten, & Zeng, 2005) was used for map QTL and estimating their effects, Composite interval mapping (CIM) was performed preferring the option Model 6 and its default settings. The LOD score at P ≤ 0.05 was selected for QTL significance by performing 1,000 permutations (Akond, Ragin, Bazzelle, Kantartzi, Meksem, & Kassem, 2012). 2.3 Detecting Interactions Between QTL SNP markers were analyzed by the Two Way Mixed ANOVA using SAS PROC GLM (General Linear Model) procedure to detect non-additive interactions between the unlinked QTL (Lark, Chase, Adler, Mansur, & Orf, 1995). Non-additive interactions between markers associated with the traits were analysed at P≤0.05 level. 2.4 Analysis of QTL Regions for Candidate Genes The identification of genes within the QTL regions was performed as described earlier (Barakat, Staton, Cheng, Park, Yassin, Ficklin, Yeh, Hebard, & Sederoff, 2012; Kassem et al., 2012). Briefly, each QTL was bounded by two single nucleotide polymorphism markers (SNPs). The SNP DNA sequences were obtained from the NCBI database (http://www.ncbi.nlm.nih.gov/projects/SNP/). SNP-harboring sequences were mapped to the Glycine max genome (http://soybase.org/gbrowse/cgi-bin/gbrowse/gmax1.01/). Soybean predicted coding DNA sequences (CDS) from QTL regions were retrieved from the phytozome website (www.phytozome.net/soybean) and were annotated by querying them against the plant proteome using Blastx (Blastx, e-value < e-6) as previously described by Barakat et al. (2012). The Gene Ontology (GO) system (The Gene Ontology Consortium, 2008) was used for functional classification of each gene. Annotation categories were parsed to identify genes from the flavonoid biosynthesis pathways as described previously (Barakat et al., 2012). 3. Results 3.1 Isoflavone Traits in Parents and RILs Mean values showed that plants grown in 2010 season at FSU campus had a higher seed daidzein and genistein but less glycitein than those grown in 2011 season at St. Pauls (Table 1). Daidzein contents were higher than parental means in both seasons/locations however glycitein and genistein were lesser. The variation for isoflavones among soybean lines over seasons and locations suggested that isoflavone contents were influenced by both location/environments and genes (Table 2). To verify the probable causes of such variation an analysis of variance was conducted using GLM procedure of SAS. Genotypic and environmental effects was highly significant at P<0.0001 for genistein, daidzein and glycitein accumulation. The results of GLM analysis showed that genotype x environment interaction (GXE) effects were important components for genistein, daidzein and glycitein accumulation in soybean grown in two seasons and locations. Table 1. Comparisons of Daidzein, glycitein, and genistein contents in the RILs of ‘PI438489B’ and ‘Hamilton’ between two growing period at Fayetteville State University, North Carolina, USA in 2010 (FSU2010) vs. St. Pauls, North Carolina, USA in 2011 (SP2011) employed from a two-tailed t test (type 2) at α = 0.05
Daidzein Glycitein Genistein
FSU2010 SP2011 FSU2010 SP2011 FSU2010 SP2011
Mean 0.329
(0.205)*
0.289 (0.350) 0.143 (0.192) 0.199 (0.255) 0.268 (0.280) 0.200 (0.225)
Percentage of variance 11.50 6.90 9.51 4.80 7.22 6.73
*Values in parentheses are mean values of each trait from two parents (PI 438489B and ‘Hamilton’) in each year.

www.ccsenet.org/jas Journal of Agricultural Science Vol. 5, No. 11; 2013
23
Table 2. The GLM analysis of variance for contents of isoflavones components in 51 soybean RILs in two locations in NC in two cropping seasons
Source DF Mean Square F Value Pr > F
Daidzein (DAID)
Year 1 85.55 1072.50 <.0001 RIL 47 3.90 48.90 <.0001 Year x RIL 25 5.68 71.19 <.0001
Glycitein (GLY)
Year 1 27.68 13266.90 <.0001 RIL 45 3.24 1553.57 <.0001 Year x RIL 22 0.72 344.16 <.0001
Genistein (GEN)
Year 1 9.73 636.95 <.0001 RIL 47 2.71 177.31 <.0001 Year x RIL 25 2.63 171.93 <.0001
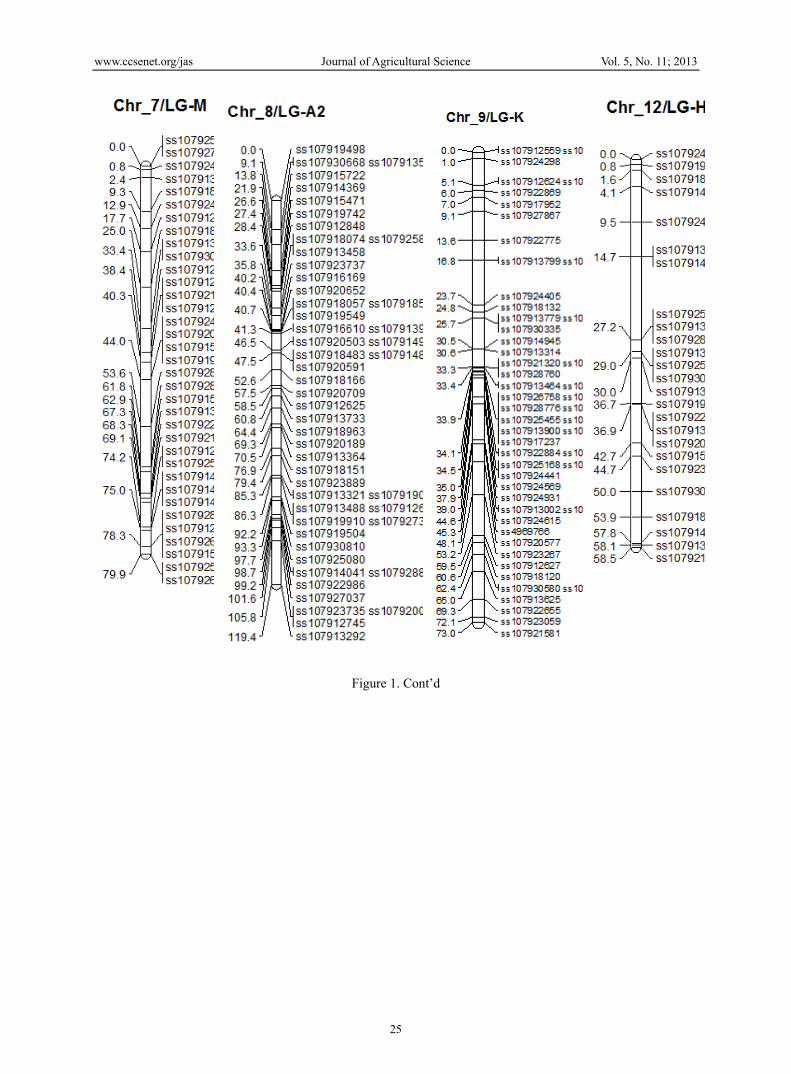
All significant at the 0.001 level. 3.2 QTL for Seed Isoflavones Contents Seven QTL for seed isoflavone contents was identified on 5 different linkage groups (LGs) or chrosomes (Chr) from the seeds grown in 2010 season at FSU campus, Fayetteville, NC (Table 3; Figure 1). Nine QTL for seed isoflavone content was identified on nine different linkage group (LG) or chromosome (Chr) from the seeds grown in 2011 season at Saint Pauls, NC (Table 3; Figure 1). The LOD scores of all QTL in 2010 and 2011 ranged from 2.6 to 5.3 and 2.51 to 7.87 respectively (Table 3). In the seeds of 2010 growing period, two QTL were identified each for daidzein (Chr_7/LG-M: qDAID001-2010 and Chr_17a/LG-D2: qDAID002-2010) and glycitein (Chr_2/LG-D1b: qGLY001-2010 and Chr_8/LG-A2: qGLY002-2010) (Table 3, Figure 1). Three QTL were identified for genistein on Chr_8/LG-A2 (qGEN001-2010) and Chr_12/LG-H(qGEN002-2010 and qGEN003). Among the seven QTL, one QTL (qGLY002-2010/qGEN001-2010) controls both glycitein and genistein contents (Table 3, Figure 1). From the seeds of 2011 growing season at Saint Paul, two QTL were identified for daidzein (Chr_6/LG-C2: qDAID001-2011 and Chr_13b/LG-F: qDAID002-2011) and two QTL were identified for glycitein (Chr_1/LG-D1a: qGLY001-2011 and Chr_17c/LG-D2: qGLY002-2011). Five QTL for genistein (qGEN001-2011 to qGEN005-2011) were identified also on Chr_3/LG-N, Chr_8/LG-A2, Chr_9/LG-K, and Chr_18/LG-G.

www.ccsenet.org/jas Journal of Agricultural Science Vol. 5, No. 11; 2013
24
Figure 1. Locations of SNP markers and the QTL that underlie soybean seed daidzein (DAID), genistein (GEN), and glycitein (GLY) contents in the ‘PI438489B’ by ‘Hamilton’ RIL population grown in FSU campus
(Cumberland County, NC). LGs were drawn using MapChart according to the PIxH genetic linkage map
www.ccsenet.org/jas Journal of Agricultural Science Vol. 5, No. 11; 2013
25
Figure 1. Cont’d

www.ccsenet.org/jas Journal of Agricultural Science Vol. 5, No. 11; 2013
26
Figure 1. Cont’d

www.ccsenet.org/jas Journal of Agricultural Science Vol. 5, No. 11; 2013
27
Table 3. SNP markers and intervals most likely to be associated with the isoflavones QTL for mean seed genistein (GEN), daidzein (DAID), and glycitein (GLY) values across two environments
Trait Chr/LG QTL Marker(s) Position (cM)
LOD* R2 (%)
2010 Daidzein Glycitein Genistein 2011 Daidzein Glycitein Genistein
7/M 17a/D2 2/D1b 8/A2 8/A2 12/H 6/ C2 13b/ F 1/ D1a 17c/ D2 3/ N 8/ A2 9/ K 17a/ D2 18/ G
qDAID001-2010qDAID002-2010 qGLY001-2010 qGGLY002-2010 qGEN001-2010 qGEN002-2010 qGEN003-2010 qDAID001-2011qDAID002-2011 qGLY001-2011 qGLY002-2011 qGLY001-2011 qGEN002-2011 qGEN003-2011 qGEN004-2011 qGEN005-2011
ss107915334–ss107921357 ss107930758–ss107920404 ss107930023–ss107914208 ss107912848–ss107916610 ss107914369–ss107918074 ss107924882–ss107918731 ss107914072–ss107925200 ss107921568–ss107912977 ss107912991–ss107919342 ss107914319–ss107927468 ss107927109–ss107919160 ss107912938–ss107913541 ss107930668–ss107915722 ss107918120–ss107913625 ss107921332–ss107913385 ss107931011–ss107916757
66.6–70.6 19.9–22.8 0–1.4 31.7–40.9 26.1–32.4 0–1 7.9–26.6 18.7–33.3 13.9–37.9 34.3–40.1 11.5–17.0 30.8–2.49 9.3–13.4 60.5–65.1 11.9-13.2 33.6-33.9
2.6 2.8 5.3 4.4 4.4 2.6 2.6 4.79 6.62 2.51 2.72 7.87 2.88 6.16 2.58 3.37
11 14 24 22 23 12 12 03 37 07 25 44 07 34 10 08
* LOD: logarithm of odds. 3.3 Detecting Interactions Between QTL SNP markers were analyzed by the Two Way Mixed ANOVA using SAS PROC GLM procedure for non-additive interactions between markers which were significantly (P≤0.05) associated with the traits response. Twenty SNP markers most likely to be associated with the isoflavones QTL were identified in 2010 grown seeds. Among these QTL, 8 were underlying daidzein content and 6 of each for seed genistein and glycitein (Table 4). Seven SNPs identified on Chr_12 (LG-H), six SNPs in Chr_18 (LG-G), three in Chr_2 (LG-D1b) and two of each in Chr_1 (LG-D1a) and Chr_2 (LG-D1b), respectively. Five SNP-markers most likely to be associated with QTL in 2011 grown seeds for each daidzein and genistein are shown in Table 4. Chr_1 (LG-D1a) and Chr_17 (LG-D2) both have three SNPs, Chr_8 (LG-A2) has two SNPs and the rest Chr_2 (LG-D1a) and Chr_3 (LG-N) both has one SNP each (Table 4).

www.ccsenet.org/jas Journal of Agricultural Science Vol. 5, No. 11; 2013
28
Table 4. SNP markers encompassing QTL for seed isoflavone content in soybean seed of the PI 438489B and Hamilton population across two environments
SNP markers
Chr./LG Isoflavones QTL p Value R2 (%) Mean traits indices ±SEM for RILs with alleles from
PI 438489B Hamilton
2010 QTL ss107920404 17/ D2 qDAID001-2010 0.08 8.3 0.559±0.619 1.168±1.456ss107914208 2/D1B qDAID002-2010 0.023 13.6 0.456±0.399 1.205±1.347ss107924882 12/H qDAID003-2010 0.038 11.7 0.983±1.117 0.378±0.330ss107918731 12/H qDAID004-2010 0.065 9.4 0.954±1.123 0.411±0.339ss107914319 1/D1A qDAID005-2010 0.077 8.2 0.431±0.395 1.022±1.218ss107931011 18/G qDAID006-2010 0.062 9.1 1.120±1.324 0.509±0.561ss107916757 18/G qDAID007-2010 0.075 8.5 1.108±1.364 0.509±0.561ss107919986 12/H qDAID008-2010 0.006 16.3 0.260±0.190 0.844±1.160ss107914208 2/D1B qGEN001-2010 0.013 16.1 0.294±0.219 1.081±1.324ss107924882 12/H qGEN002-2010 0.06 9.7 0.864±1.208 0.285±0.242ss107914319 1/D1A qGEN003-2010 0.035 11.5 0.241±0.128 0.917±1.185ss107927109 17/D2 qGEN004-2010 0.035 11.4 0.242±0.127 0.917±1.185ss107931011 18/G qGEN005-2010 0.039 11 1.000±1.361 0.353±0.309ss107916757 18/G qGEN006-2010 0.034 11.9 1.035±1.382 0.353±0.309ss107914208 2/D1B qGLY001-2010 0.032 13.5 0.118±0.168 0.610±0.919ss107924882 12/H qGLY002-2010 0.073 10.3 0.530±0.886 0.087±0.085ss107918731 12/H qGLY003-2010 0.077 10.1 0.528±0.887 0.090±0.084ss107931011 18/G qGLY004-2010 0.063 10.3 0.575±0.937 0.143±0.173ss107916757 18/G qGLY005-2010 0.078 9.7 0.566±0.969 0.143±0.173ss107919986 12/H qGLY006-2010 0.096 18.6 0.064±0.032 0.490±0.770
2011 QTL ss107912848 8/A2 qDAID001--2011 0.031 13.7 2.686±1.489 1.577±1.377ss107921332 17/D2 qDAID002--2011 0.087 9.2 1.764±1.478 2.764±1.463ss107913849 1/D1A qDAID003--2011 0.083 15.7 1.268±1.323 2.569±1.388ss107929868 1/D1A qDAID004--2011 0.083 15.7 2.268±1.388 1.368±1.323ss107917765 1/D1A qDAID005--2011 0.083 15.7 2.569±1.388 1.268±1.323ss107920404 17/D2 qGEN001--2011 0.042 13.1 1.271±1.098 0.516±0.791ss107930023 2/D1B qGEN002--2011 0.02 16.8 1.289±1.116 0.422±0.625ss107918074 8/A2 qGEN003--2011 0.03 15.3 0.568±0.547 1.353±1.180ss107919160 17/D2 qGEN004--2011 0.073 10.3 0.588±0.551 1.317±1.285ss107912938 3/N qGEN005--2011 0.073 10.3 0.588±0.551 1.317±1.285
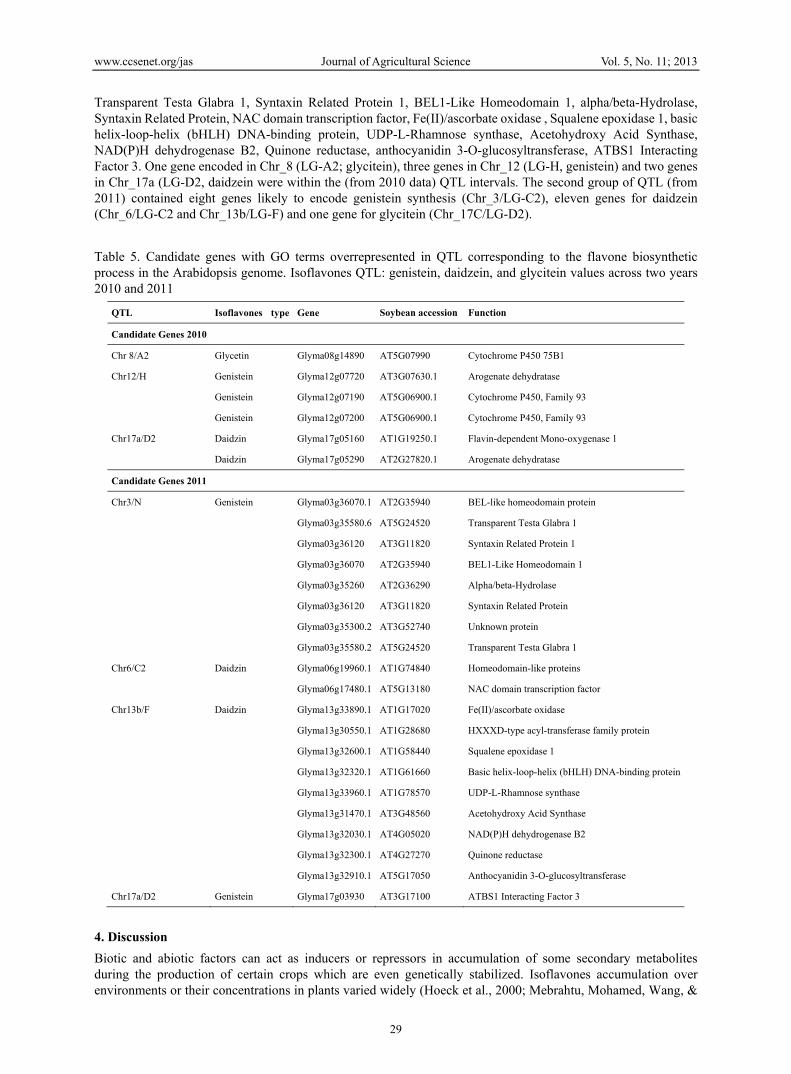
3.4 Analysis of QTL Regions for Candidate Genes Annotation on the sequences from QTL genomic regions has provided the opportunity to search for genes that could be related to the traits of this study. Genes from each QTL region were retrieved and parsed based on their annotation categories to identify those from the flavonoid biosynthesis or regulator pathways. Twenty six genes involved in flavonoid biosynthesis pathways (Table 5) which would influence isoflavones were found on seven different chromosomes. These genes encode various proteins including BEL-like homeodomain protein,
www.ccsenet.org/jas Journal of Agricultural Science Vol. 5, No. 11; 2013
29
Transparent Testa Glabra 1, Syntaxin Related Protein 1, BEL1-Like Homeodomain 1, alpha/beta-Hydrolase, Syntaxin Related Protein, NAC domain transcription factor, Fe(II)/ascorbate oxidase , Squalene epoxidase 1, basic helix-loop-helix (bHLH) DNA-binding protein, UDP-L-Rhamnose synthase, Acetohydroxy Acid Synthase, NAD(P)H dehydrogenase B2, Quinone reductase, anthocyanidin 3-O-glucosyltransferase, ATBS1 Interacting Factor 3. One gene encoded in Chr_8 (LG-A2; glycitein), three genes in Chr_12 (LG-H, genistein) and two genes in Chr_17a (LG-D2, daidzein were within the (from 2010 data) QTL intervals. The second group of QTL (from 2011) contained eight genes likely to encode genistein synthesis (Chr_3/LG-C2), eleven genes for daidzein (Chr_6/LG-C2 and Chr_13b/LG-F) and one gene for glycitein (Chr_17C/LG-D2). Table 5. Candidate genes with GO terms overrepresented in QTL corresponding to the flavone biosynthetic process in the Arabidopsis genome. Isoflavones QTL: genistein, daidzein, and glycitein values across two years 2010 and 2011
QTL Isoflavones type Gene Soybean accession Function
Candidate Genes 2010
Chr 8/A2 Glycetin Glyma08g14890 AT5G07990 Cytochrome P450 75B1
Chr12/H Genistein Glyma12g07720 AT3G07630.1 Arogenate dehydratase
Genistein Glyma12g07190 AT5G06900.1 Cytochrome P450, Family 93
Genistein Glyma12g07200 AT5G06900.1 Cytochrome P450, Family 93
Chr17a/D2 Daidzin Glyma17g05160 AT1G19250.1 Flavin-dependent Mono-oxygenase 1
Daidzin Glyma17g05290 AT2G27820.1 Arogenate dehydratase
Candidate Genes 2011
Chr3/N Genistein Glyma03g36070.1 AT2G35940 BEL-like homeodomain protein
Glyma03g35580.6 AT5G24520 Transparent Testa Glabra 1
Glyma03g36120 AT3G11820 Syntaxin Related Protein 1
Glyma03g36070 AT2G35940 BEL1-Like Homeodomain 1
Glyma03g35260 AT2G36290 Alpha/beta-Hydrolase
Glyma03g36120 AT3G11820 Syntaxin Related Protein
Glyma03g35300.2 AT3G52740 Unknown protein
Glyma03g35580.2 AT5G24520 Transparent Testa Glabra 1
Chr6/C2 Daidzin Glyma06g19960.1 AT1G74840 Homeodomain-like proteins
Glyma06g17480.1 AT5G13180 NAC domain transcription factor
Chr13b/F Daidzin Glyma13g33890.1 AT1G17020 Fe(II)/ascorbate oxidase
Glyma13g30550.1 AT1G28680 HXXXD-type acyl-transferase family protein
Glyma13g32600.1 AT1G58440 Squalene epoxidase 1
Glyma13g32320.1 AT1G61660 Basic helix-loop-helix (bHLH) DNA-binding protein
Glyma13g33960.1 AT1G78570 UDP-L-Rhamnose synthase
Glyma13g31470.1 AT3G48560 Acetohydroxy Acid Synthase
Glyma13g32030.1 AT4G05020 NAD(P)H dehydrogenase B2
Glyma13g32300.1 AT4G27270 Quinone reductase
Glyma13g32910.1 AT5G17050 Anthocyanidin 3-O-glucosyltransferase
Chr17a/D2 Genistein Glyma17g03930 AT3G17100 ATBS1 Interacting Factor 3
4. Discussion Biotic and abiotic factors can act as inducers or repressors in accumulation of some secondary metabolites during the production of certain crops which are even genetically stabilized. Isoflavones accumulation over environments or their concentrations in plants varied widely (Hoeck et al., 2000; Mebrahtu, Mohamed, Wang, &

www.ccsenet.org/jas Journal of Agricultural Science Vol. 5, No. 11; 2013
30
Andebrhan, 2004; Caldwell, Britz, & Mirecki, 2005; Lozovaya, Lygin, Ulanov, Nelson, Dayde, & Widhohm, 2005) and generally plants are conducive to accumulate more isoflavone when growing in a controlled environment. This might due to desire well-watered and temperature condition. Temperature, water, and soil nutrient conditions are known to play significant role in isoflavone production in soybean (Gutierrez-Gonzalez et al., 2009) and these findings could explain the difference we reported here in this study for accumulation of isoflavones in two different seasons. But also the variability observed for the seed isoflavones among RILs was attributable not only by environment but also for genetic and also genetic and environment (GXE) interactions. Total of sixteen QTL have been identified for seed isoflavones content on 12 different chromosome (Chr) or linkage groups (LG). Other studies identified QTL for total and individual isoflavone on the same Chr or LG. The QTL for daidgein (qDAID001-2010 on Chr_7/LG-M) reported in this study is 16 cM apart from the QTL (dai-M) identified on same LG in the ‘Essex’ by ‘Forrest’ RIL population (n=100) by Gutierrez-Gonzalez et al. (2009). They identified two QTL for glycitein (gly-D2_1 and gly-D2_2) on LG-D2, on the same LG we reported a second QTL for daidgein (qDAID002-2010). The QTL identified for glycitein content (gly-D2_1) on LG-D2 by Gutierrez-Gonzalez et al. (2009), on the same LG and same position we also reported a QTL for glycetin (qGLY002-2011). Two QTL for genistein (qGEN002-2010 and qGEN003-2010) were reported in this study on LG-H/Chr_12, which are closely located QTL for daidzein (dai-H) and total isoflavones (tot-H) on LG-H reported by Gutierrez-Gonzalez et al. (2009). Kassem et al. (2004) identified two QTL for genistein and glycetin on LG-H/Chr_12 in the ‘Essex’ by ‘Forrest’ population, which are very close to identified QTL, qGEN002-2010 and qGEN003-2010 of this study. Primomo, Poysa, Ablett, Jackson, & Rajcan, (2005) identified another QTL that controlls daidzein on LG-A2/Chr_8 which is approximately 100 cM from the QTL for glycetin (qGLY002-2010) of this study. Same study identified QTL for daidzein, genistein, glycitein on LG-H/Chr_12. Moreover, total isoflavones QTL of same study is approximately 60 cM apart from the QTL we identified for genistein (qGEN002-2010 and qGEN003-2010) in this study. Primomo, Poysa, Ablett, Jackson, & Rajcan, (2005) also identified QTL for daidzein, genistein, glycitein, and total isoflavones on LG-M/Chr_7 which are approximately 14.6 cM apart from the QTL, qDAID001-2010 of this study. All QTL identified by Primomo, Poysa, Ablett, Jackson, & Rajcan, (2005) was from the ‘AC756’ by ‘RCAT Angora’ RIL population (n=207) and they also observed sigificant genotype by environment interactions for isoflavones contents which is consistent with our study. Zeng et al. (2009) identified a QTL that controls genistein content on LG-A2/Chr_8 using ‘Zhongdou 27’ by ‘Jiumong 20’ RIL population (n=130), which was approximately 70 cM apart from the QTL, qGLY002-2010 identified in this study. Same study identified QTL controlling genistein, glycitein, and total isoflavones contents on LG-M/Chr_7, which are approximately 34 cM apart from the QTL we identified for daidgein (qDAID001-2010). The total isoflavone QTL identified by Zeng et al. (2009) on LG-D2 is approximately 9.4 cM apart from the QTL for daidgein (qDAID002-2010 on LG D2/Chr_17) identified in this study. The mixed-model approach yielded slightly different results for detecting multiple genetic main effects of QTL, as composite interval mapping with the same sets of marker cofactors. Results of the approach shown in Table 4, indicated that the mixed model approaches were powerful in detecting QTL with relatively large additive and/or epistatic effects (coefficient of determination R2 > 8.3%) (Wang, Zhu, Li, & Paterson, 1999). Linkage, particularly close linkage between QTL, had a significant impact on the detection power in QTL mapping using the mixed-model approaches. The nature of this impact depends on the directions of the QTL main effects (including epistatic effects) among linked QTL. When the effects of the linked QTL are in coupling (in the same direction), the QTL tended to be detected with increased power. However, when in repulsion (having effects of opposite direction), the QTL tended to be detected with decreased power. The LR threshold of P=0.005 (equivalent to LOD = 2.79 for df = 3) (Wang et al., 1999) used in our simulations is considered as an typical one for most QTL mapping studies, but it gave us a consistent high power in detecting QTL of moderate additive/epistatic effects (R2~5%). However, increasing the threshold to 0.001 in our simulations resulted in a significantly reduced power for detecting QTL with moderate additive/epistatic effects (Wang et al., 1999). Interaction among QTL that underlie daidzein content in soybean explained 33% of the total variation in daidzein in the seeds harvested in 2010 and 27% in the seeds harvested in 2011. Interaction among QTL that underlie genistein content in soybean explained 34% of the total variation in genistein in the seeds harvested in 2010 and 18% in the seeds harvested in 2011. Interaction among QTL that underlie glycitin content in soybean explained 24% of the total variation in daidzein in the seeds harvested in 2010. Annotation of genes several hundreds of genes from QTL allowed us to identify twenty eight candidate genes that may control flavonoid synthesis in soybean seeds under different environments. These candidate genes

www.ccsenet.org/jas Journal of Agricultural Science Vol. 5, No. 11; 2013
31
identified in this study represent a valuable resource for studying the genetic basis underlying isoflavones biosynthesis in soybean. References Akond, M, Schoener, L., Kantartzi, S. K., Meksem, K., Song, Q., Wang, D., … Kassem, M. A. (2013). A
SNP-Based Genetic Linkage Map of Soybean Using the SoySNP6K Illumina Infinium BeadChip Genotyping Array. Journal of Plant Genome Sciences, 1(3). (in press).
Akond, A. S. M., Ragin, B., Bazzelle, R., Kantartzi, S. K., Meksem, K., & Kassem, M. A. (2012). Quantitative Trait Loci Associated with Moisture, Protein, and Oil Content in Soybean [Glycine max (L.) Merr.]. Journal of Agricultural Science, 4, 16-25. http://dx.doi.org/10.5539/jas.v4n11p16
Alderkreutz, H., Banwart, C., Wahala, K., Makela, T., Brunow, G., Hase, T., Arosemena, P. J., … Vickery, L. E. (1993). Inhibition of human aromatase by mammalian lignans and isoflavonoid phytoestrogens. J. Steroid Biochem Mol Biol, 44, 147-153.
Barakat, A., Staton, M., Cheng, C. H., Park, J., Yassin, N. B., Ficklin, S., … Sederoff, R. (2012). Chestnut resistance to the blight disease: insights from transcriptome analysis. BMC Plant Biol, 12, 38. http://dx.doi.org/10.1186/1471-2229-12-38
Bennett, J. O., Yu, O., Heatherly, L. G., & Krishnan, H. B. (2004). Accumulation of Genistein and Daidzein, Soybean Isoflavones Implicated in Promoting Human Health, Is Significantly Elevated by Irrigation. J Agric Food Chem, 52, 7574-7579. http://dx.doi.org/10.1021/jf049133k
Caldwell, C. R., Britz, S. J., & Mirecki, R. M. (2005). Effect of temperature, elevated carbon dioxide, and drought during seed development on the isoflavone content of dwarf soybean [Glycine max (L.) Merrill] grown in controlled environments. J Agric Food Chem, 53, 1125-1129. http://dx.doi.org/10.1021/jf0355351
Fan, J. B., Oliphant, A., Shen, R., Kermani, B., Garcia, G. F., Gunderson, K. L., & Deloukas, P. (2003). Highly parallel SNP genotyping, Cold Spring Harb Symp Quant Biol, 68, 69-78. http://dx.doi.org/10.1101/sqb.2003.68.69
Gutierrez-Gonzalez, J. J., Wu, X., Gillman, J. D., Lee, J. D., Zhong, R., Yu, O., Shannon, G., Ellersieck, M., … Sleper, D. A. (2010). Intricate environment-modulated genetic networks control isoflavone accumulation in soybean seeds. BMC Plant Biol, 10, 105. http://dx.doi.org/10.1186/1471-2229-10-105
Gutierrez-Gonzalez, J. J., Wu, X., Zhang, J., Lee, J. D., Ellersieck, M., Shannon, J. G., … Sleper, D. A. (2009). Genetic control of soybean seed isoflavone content: importance of statistical model and epistasis in complex traits. Theor Appl Genet, 119, 1069-1083. http://dx.doi.org/10.1007/s00122-009-1109-z
Hedlund, T. E., Johannes, W. U., & Miller, G. J. (2003). Soy isoflavonoid equol modulates the growth of benign and malignant prostatic epithelial cells in vitro. Prostate, 54, 68-78.
Hoeck, J. A., Fehr, W. R., Murphy, P. A., & Welke, G. A. (2000). Influence of genotype and environment on isoflavone contents of soybean. Crop Sci, 40, 48-51.
Hyten, D. L., Choi, I. Y., Song, Q. J., Specht, J. E., Carter, T. E., Shoemaker, R. C., … Cregan, P. B. (2010). A high density integrated genetic linkage map of soybean and the development of a 1536 universal soy linkage panel for quantitative trait locus mapping. Crop Sci, 50, 960-968. http://dx.doi.org/10.2135/cropsci2009.06.0360
Hyten, D. L., Song, Q., Choi, I. Y., Yoon, M. S., Specht, J. E., Matukumalli, L. K., & Cregan, P. B. (2008). High-throughput genotyping with the GoldenGate assay in the complex genome of soybean. Theor Appl Genet, 116, 945-952. http://dx.doi.org/10.1007/s00122-008-0726-2
Jiang, Q., Payton- Stewart, F., Elliott, S., Driver, J., Rhodes, L. V., Zhang, Q., … Wang, G. (2010). Effects of 7-O Substitutions on Estrogenic and Anti-Estrogenic Activities of Daidzein Analogues in MCF- Breast Cancer cells. J Med Chem, 53, 6153-6163. http://dx.doi.org/10.1021/jm100610w
Kassem, M. A., Meksem, K., Iqbal, M. J., Wood, A. J., & Lightfoot, D. A. (2004). Definition of soybean genomic regions that control seed phytoestrogen amounts. J Biomed & Biotech, 1, 52-60.
Kassem, M. A., Ramos, L., Leandro, L., Mbofung, G., Hyten, D., Kantartzi, S., … Meksem, K. (2012). The First ‘PI438489B’ by ‘Hamilton’ SNP-Based Genetic Linkage Map of Soybean [Glycine max (L.) Merr.] and Quantitative Trait Loci (QTL) that Underlie SDS Resistance. J of Plant Genome Sciences, 1, 18-30. http://dx.doi.org/10.5147/jpgs.2012.0053

www.ccsenet.org/jas Journal of Agricultural Science Vol. 5, No. 11; 2013
32
Kassem, M. A., Shultz, J., Meksem, K., Cho, Y., Wood, A. J., Iqbal, M. J., & Lightfoot, D. A. (2006). An updated ‘Essex’ by ‘Forrest’ linkage map and first composite map of QTL underlying six soybean traits. Theor Appl Genet, 113, 1015-1026. http://dx.doi.org/10.1007/s00122-006-0361-8
Kim, J. A., & Chung, L. M., (2007). Change in Isoflavones concentration of soybeans (Glycine max L.) seeds at different growth stages. J Sci Food Agric, 87, 496-503. http://dx.doi.org/10.1002/jsfa.2743
Knight, D. C., & Eden, J. A. (1996). A review of the clinical effects of phytoestrogens. Obstet Gynecol, 78, 897-904.
Lark, K. G., Chase, K., Adler, F., Mansur, L. M., & Orf, J. H. (1995). Interactions between quantitative trait loci in soybean in which trait variation at one locus is conditional upon a specific allele at another. Proc Natl Acad Sci, 92, 4656-4660.
Lee, S. J., Kim, J. J., Moon, H. I., Ahn, J. K., Chun, S. C., Jung, W. O., … Chung, I. M. (2008). Analysis of Isoflavones and Phenolic Compounds in Korean Soybean [Glycine max (L.) Merrill] Seed of Different Seed Weights. J. Agric. Food Chem., 56, 2751-2758. http://dx.doi.org/10.1021/jf073153f
Lozovaya, V. V., Lygin, A. V., Ulanov, A. V., Nelson, R. L., Dayde, J., & Widhohm, J. M. (2005). Effect of temperature and soil moisture status during seed development on soybean seed isoflavone concentration and composition. Crop Sci, 45, 1934-1940.
Mabrouk, Y., Zourgui, L., Delavault, P., Simier, P., & Belhadj, O. (2007). Some compatible Rhizobium leguminosrum strains in peas decrease infections when parasitized by Orobanche crenata. Weed Res, 47, 44-53.
Mebrahtu, T., Mohamed, A., Wang, C. Y., & Andebrhan, T. (2004). Analysis of isoflavone contents in vegetable soybeans. Plant Foods Hum Nutr, 59, 55-61. http://dx.doi.org/10.1007/s11130-004-0023-4
Meksem, K., Njiti, V. N., Banz, W. J., Iqbal, M. J., Kassem, M. A., Hyten, D. L., … Lightfoot, D. A. (2001). Genomic regions that underlie soybean seed isoflavone content. J Biomed Biotech, 1, 38-45. http://dx.doi.org/10.1155/S1110724301000110
Miyazawa, M., Sakoano, K., Nakamura, S. I., & Kosaka, H. (1999). Antimutagenic Activity of Isoflavones from Soybean Seeds (Glycine max (L.) Merr.). J Agric Food Chem, 47, 1346-1349.
Murphy, S. E., Lee, E. A., Woodrow, L., Seguin, P., Kumar, J., Rajcan, I., & Ablett, G. R. (2009). Genotype × Environment interaction and stability for isoflavone content in soybean. Crop Sci, 49, 1313-1321.
Njiti, V. N., Meksem, K., Yuan, J., Lightfoot, D. A., Banz, W. J., & Winters, T. A. (1999). DNA markers associated with loci underlying seed phytoestrogen content in soybean. J Medicinal Food, 2, 185-187.
Primomo, V. S., Poysa, V., Ablett, G. R., Jackson, C. J., & Rajcan, I. (2005). Agronomic Performance of Recombinant Inbred Line Populations Segregating for Isoflavone Content in Soybean Seeds. Crop Sci, 45, 2203-2211.
Primomo, V. S., Poysa, V., Ablett, G. R., Jackson, C. J., Gijzen, M., & Rajcan, I. (2005). Mapping QTL for Individual and Total Isoflavones Content in Soybean Seeds. Crop Sci, 45, 2454-2464. http://dx.doi.org/10.2135/cropsci2004.0672
Ragin, B., Bazelle, R., Clark, W., Kantartzi, S. K., Meksem, K., Akond, M., & Kassem, M. A. (2012). Genetic Analysis of Yield Components in the PI 438489B By ‘Hamilton’ Recombinant Inbred Line (RIL) Population of Soybean [Glycine max (L.) Merr.]. Journal of Agricultural Science, 4, 98-105. http://dx.doi.org/10.5539/jas.v4n9p98
Regal, J. F., Frazer, D. G., Weeks, C. E., & Greenberg, N. A. (2000). Dietary phytoestrogens have anti-inflammatory activity in a Guinea pig model of asthma. Exp Biology & Med, 223, 372-378.
Setchell, K. D. R. (1998). Phytoestrogens: the biochemistry, physiology, and implications for human health of soy isoflavones. Am J Clin Nutr, 68, 1333-1346.
Stam, P. (1993). Construction of integrated genetic linkage maps by means of a new computer package: JoinMap. The Plant Journal, 3, 739-744. http://dx.doi.org/10.1111/j.1365-313X.1993.00739.x
The Gene Ontology Consortium. (2008). The Gene Ontology project in 2008. Nucleic Acids Res, 36, 440-444. http://dx.doi.org/10.1093/nar/gkm883

www.ccsenet.org/jas Journal of Agricultural Science Vol. 5, No. 11; 2013
33
Tsai, H. S., Huang, L. J., Lai, Y. H., Chang, J. C., Lee, R. S., & Chiou, R. Y. Y. (2007). Solvent Effects on Extraction and HPLC Analysis of Soybeans Isoflavones and Variations of Isoflavone Compositions As Affected by Crop Season. J Agric Food Chem, 55, 7712-7715. http://dx.doi.org/10.1021/jf071010n
Wang, B. F., Wang, J. S., Lu, J. F., Kao, T. H., & Chen, B. H. (2009). Antiproliferation Effect and Mechanism of Prostate Cancer Cell Lines as Affected by Isoflavones from Soybean Cake. J Agric Food Chem, 57, 2221-2232. http://dx.doi.org/10.1021/jf8037715
Wang, D. L., Zhu, J., Li, Z. K., & Paterson, A. H. (1999). Mapping QTL with epistatic effects and QTL´environment interactions by mixed linear model approaches. Theor Appl Genet, 99, 1255-1264.
Wang, S., Basten, C. J., & Zeng, Z. B. (2005). Windows QTL Cartographer 2.5. Department of Statistics, NCSU, Raleigh, NC. Retrieved from http://statgen.ncsu.edu/qtlcart/WQTLCart.htm
Xu, Z., Wu, Q., & Godber, J. S. (2002). Stabilities of daidzin, glycitin, genistin, and generation of derivatives during heating, J Agric Food Chem, 50, 7402-7406. http://dx.doi.org/10.1021/jf025626i
Zeng, G., Li, D., Han, Y., Teng, W., Wang, J., Qiu, L., & Li, W. (2009). Identification of QTL underlying isoflavone contents in soybean seeds among multiple environments. Theor Appl Genet, 118, 1455-1463. http://dx.doi.org/10.1007/s00122-009-0994-5
Copyrights Copyright for this article is retained by the author(s), with first publication rights granted to the journal. This is an open-access article distributed under the terms and conditions of the Creative Commons Attribution license (http://creativecommons.org/licenses/by/3.0/).