Foreign Demand for U.S. Soybeans and Soybean Products
60
1968 Technical Buletin 256 Domestic and Foreign Demand for U.S. Soybeans and Soybean Products
-
Upload
khangminh22 -
Category
Documents
-
view
1 -
download
0
Transcript of Foreign Demand for U.S. Soybeans and Soybean Products

1968 Technical Buletin 256
Domestic and Foreign Demand for
U.S. Soybeans and Soybean Products

This study . of market and trade relationships in the soybean industry represents a particularly fruitful collaboration between the U.S. Department of Agriculture (USDA) and the Department of Agricultural Economics at the University of Minnesota.
Minnesota is one of the leading soybean producing states. Through the Commodity Credit Corporation (CCC) and its domestic and international programs, USDA plays an active role in the soybean market. The analytical models that were developed and the research reported in this study should contribute significantly to the precision with which the CCC and private firms can manage their market activities.
The study made particularly effective use of the analytical skills of Minnesota staff members, who prepared the report, and of the policy perspective, knowledge of the soybean market, and research resources, including data sources, available within USDA. The bimonthly conference between researchers and their USDA advisory committee proved especially valuable. Such arrangements might well be standard in future research contracts of this kind.
The return on research investment involved in a report such as this is highest in terms of improved public and private decisions if the results are continuously reevaluated and the models and estimates updated. Arrangements have been made by the University's Department of Agricultural Economics and the USDA Economic Research Service to continue their collaboration in this field. The collaboration will involve a continuous updating of the model and an examination of relationships between the soybean market and markets for related products.
-Vernon W. Ruttan, Head Department of Agricultural Economics University of Minnesota
Contents THE ~ARKET AND THE ~ODEL
The Demand and Price Structure of the U.S. Soybean Market Supply Side .......................... 0 ••••••••••••••••••••••••••••••••• :............................................ 4 Demand Side .............. , ............................................................. o......................... 4 Market Growth in Perspective ................................................... . Conclusion
The Analytical Framework
6 7
Joint_Products ....................................................... ............................................. 8 Multiple Markets .................................................................. 0.......................... 8 Soybean Products in Wider Markets ...... .......................... 8 Simultaneity ......................................................................................................... 8 Other Considerations ........................................................... 8 Simplified Price-Quantity Graphics of the Model 8
The Simultaneous Model Technical and Physical Relationships ......... 10 Jointly Determined Variables ................................ ....................... 10 Behavioral Equations .............................................. 12 Other Features of the Model ..................................... 15 Mathema'tical and Statistical Considerations 15 The Data ......................... :....................................................................... 16
ESTIMATION OF THE SIMULTANEOUS ~ODEL
The Estimation Process. ·····································'······························· ................ 16 Estimation Results for Behavioral Equations ................................. 16
Equation Descriptions .............................................................................. 17 -20 Demand Elasticities Implied by the Structural Results 20
Reduced Form Equations ..... ....................................... 2.1
ANALYSIS AND PROJECTION WITH THE
SIMULTANEOUS ~ODEL
Partial Equilibrium Illustrations Using the Models as Estimated ................................................ 23 Using a Modified Model .......................................................................... 25
Projection with the Simultaneous Model The Models Used . ............................................................ ............................ 27 The Projections ................................................................................................... 28
REGIONAL EXPORT DEMAND
Estimates of Regional Export Demand ......................... 32 Projections
Soybeans .... ................. .......................................................................................... 34 Soybean Meal ........................................................................................ 36 Soybean Oil (Commercial Exports) ................................................ 37 Short Term Projections to 1970 .......................................... 38
SUMMARY AND IMPLICATIONS
The Market and the Models .............................................. 39 Estimates of the Simultaneous Model and Regional
Equations ...................................................................................................... 40 Projections with the Estimated Models .............................. ....... 41 Concluding Comments .............................................................................. 42
Appendix A-The Data Series ..................................................................... 43 Appendix B-Estimates of Supply Relations .................................... 46 Appendix C-Reduced Forms........................................................................ 47 Appendix D-Projections ................................................................................. 52 Appendix E-Information on Regional Analysis ........................... 56 Appendix F-Bibliography of Related Research........................... 58

An Analysis of Domestic and Foreign Demand for lJ. S. Soybeans and Soybean Products
James P. Houck and Jitendar S. Mann"
Soybeans rose from obscurity in the 1930's to third place among U.S. cash crops in 1966. Only cotton and corn now return more cash income to the nation's farmers, even when government payments are included. Currently, about 11 cents of each dollar received by U.S. farmers from crops comes from soybeans. In the immediate post-World War II years, soybean farmers received 4 cents of each crop dollar. About 40 cents of each soybean dollar now earned by farmers comes from the export of beans, meal, and oil, contrasted with 6 cents shortly after the war. These increases are the result of balanced growth in both total demand and aggregate supply. Consequently, the soybean market has not been burdened with heavy surpluses, extreme shortages, or extremely wide price fluctuations.
Although domestic markets have displayed healthy growth, much of the credit for this orderly development belongs to strong increases in the export demand for soybeans and soybean products, especially whole beans and soybean meal. In addition, exports of soybean oil under Public Law ( PL) 480 have increased total vegetable oil exports substantially while augmenting the nation's food aid programs. On the supply side, soybean production has been attractive in the United States because of acreage restrictions and relatively low prices for feed grains, cotton, and other alternative crops.
Since the history and current status of this growth are widely known and well presented elsewhere (see appendix F, pages 58-59), this report does not include much descriptive material. Rather, it concerns almost exclusively the analytical aspects of demand estimation and market adjustment within the framework of well defined economic and statistical models.
The major objectives of the research underlying this report were to formulate and estimate the relevant demand, price, and market adjustment relationships for soybeans, soybean oil, and soybean meal in the United States and other important dollar markets. Using these estimated relationships, the quantity and value of soybeans and soybean products were projected into the 1970's on the basis of alternative assumed combinations of prices and government operations in the market.
Th.e core of the analysis is a 13-equation simultaneous model of the soybean sector that focuses on price making forces for U.S. soybeans. This model emphasizes the demand side and encompasses both domestic and foreign markets. The unique features of the
soybean market are reflected in the theoretical and statistical versions of the model. These features include ( 1) the joint production relationships that link prices and quantities of soybeans, meal, and oil, ( 2) the multiple market outlets, both domestic and foreign, that compete for available supplies of each commodity, ( 3) the role played by government programs in these interconnected markets, and ( 4) the simultaneous adjustment processes that characterize bean, meal, and oil markets.
The simultaneous model includes export relationships for beans, meal, and oil. Estimates of these relationships are helpful in analyzing and predicting the total magnitude of exports. However, in order to study export markets more closely, the world outside the United States was divided into six regions: ( 1) the European Economic Community ( EEC), ( 2) Canada and non-EEC Europe, ( 3) Latin America, ( 4) Africa, ( 5) Japan, and ( 6) the balance of Asia and Oceania.
Demand relationships were formulated for each region for soybeans, oil, and meal. The estimates of
"James P. Houck is an associate professor and Jitendar S. Mann is a research associate, Department of Agricultural Economics. This project was conducted under a USDA-University of Minnesota research contract. The funds were provided by the USDA's Com
modity Credit Corporation (CCC). Technical advice and overall contract supervision were provided the Economic Research Service ( ERS), USDA, through its Economic and Statistical Analysis Division, James P. Cavin, director. Robert M. Walsh, deputy director of this division, served as the technical coordinator for the contract and chairman of an informal advisory committee consisting of representatives of the ERS,. the Foreign Agricultural Service ( FAS), and the Agricultural Stabilization and Conservation Service ( ASCS). Research personnel and facilities were provided by the agricultural economics department of the University of Minnesota.
The advisory committee members were very helpful throughout the study. The authors especially acknowledge the valuable advice offered by M. E. Abel, A. C. Egbert, G. W. Kromer, C. 0. Nohre, A. S. Rojko, R. M. Walsh, and F. E. Walters of ERS; T. L. Oyloe and G. E. Wanamaker of FAS; and D. E. McGarry and M. W. Maclay of ASCS. Special acknowledgment is given to the Fats and Oils Section of the Economic and Statistical Analysis Division of ERS, the Foreign Regional Analysis Division of ERS, and the Fats and Oils Division of FAS.
The University's Institute of Agriculture and Department of Agricultural Economics supported this project from the outset. Several persons in the agricultural economics department worked on various phases of the study. Particularly diligent efforts were provided by Osama A. AlZand and Robert R. Wilson.
Finally, acknowledgment must be given to those individuals in the USDA and the University of Minnesota who promoted and encouraged this cooperative effort between public agencies. It is hoped that this work represents only part of the continued collaboration in economic research between USDA and land-grant universities.
Although many persons contributed time and effort to the project, the authors assume responsibility for the contents of this report.
-3-

these relationships were used to project the direction and amounts of soybean and soybean product exports into the 1970's. The results of these projections were reconciled with the export estimates from the model.
The final section of this bulletin contains a summary of results and conclusions. It is designed to pull together the implications of the research and provide a concise statement of procedures and analysis.
The Market and the Model
The major focus of this analysis was upon price making forces that operate mainly on the U.S. market. However, the impact of important export markets for soybeans and soybean products was not overlooked. These export outlets for beans, meal, and oil are represented in the model by total demand equations. No consideration was given to the ultimate destination of soybean and soybean product exports. See pages 32-39 for information on projections of individual foreign market demands.
The Demand and Price Structure of the U.S. Soybean Market
A look at the overall economic structure of the U.S. soybean market provides a good starting point from which to build a useful analytical framework-an economic model. The U.S. soybean market is broad and complex, extending into both the fats and oils and feed-livestock sectors. Comprehensive analysis of these two large economic sectors is beyond the scope of this report. Recognizing that the soybean market is woven closely into the fabric of several broad economic systems, it is possible to isolate, discuss, and estimate a set of economic relationships peculiar to soybeans.
These major economic relations are presented in figure l. This type of diagram is useful in visualizing a commodity's markets and identifying the critical price making forces that are at work. This particular diagram was helpful in analyzing the problem prior to formulating a specific crop year model.
Supply Side
Soybean production on U.S. farms is determined each fall by the acreage planted the previous spring and by per acre yields. After deducting the modest portion of the crop used for seed, on-farm feed, and other residual uses, the remaining production plus carryin stocks from the previous crop year can be regarded as the current year's commercial supply.
The interaction of this commercial supply and the total market demand throughout each crop year determines the soybean prices received by farmers. These
prices, plus many other factors, affect the following year's soybean plantings. These factors are indicated in figure l by the term "Lag."
Demand Side
The total market demand for soybeans is the summation of the export soybean demand, the storage demand for carryout stocks, and the U.S. crushing industry's bean demand. The export demand stems from requirements by foreign buyers for soybeans as raw material for crushing and other processing in their own nations. Export buyers in this country compete for supplies with firms that process soybeans domestically or store them for later use. The market price for soybeans determines the available supply among these three major outlets.
The crushers' demand arises because the products of soybean processing-meal and oil-can be sold for the manufacture of many products. The crushing and handling margin lies between the crushers' average revenue from processed output and prices paid to farmers for soybeans. This margin is the cost (or price) of the total crushing and handling service. It depends not only upon industry-wide technology but, for individual plants, upon location, inventory management, integration with related lines of business, and operational efficiency.1
The revenue obtained by processors for soybean products depends upon the wholesale prices of these products and upon the physical rate at which they arc extracted from raw soybeans. The latter is regarded in this study as a fixed technical constant depending mainly on the processing method and on bean quality. These crushing yields are now about 48 pounds of meal and ll pounds of oil per 60-pound bushel of soybeans. Although crushing yields have changed slowly with improvements in processing and handling methods, they have not been altered significantly by processors in response to shortrun changes in market conditions. Thus meal and oil production are directly related to the level of soybean crushing. On the other hand, meal and oil prices are determined by the interaction of meal and oil market demands with amounts produced.
1 It is not within the scope of this study to analyze the behavior of the crushing margin. Rather, it will be taken as given and will represent the gross difference between average earnings at one end of the marketing system and prices paid for soybeans at an earlier stage. For recent studies of the crushing margin, see Allen B. Paul, "Pricing Below Cost iii the Soybean Processing Industry," ]. Farm Econ., Vol. 48, No. 3, Part II, Aug. 1966, and Allen B. Paul and William T. Wesson, "Short-Run Supply of Services-The Case of Soybean Processing," ]. Fann Econ., Vol. 48, No.4, Part I, Nov. 1966.
-4-

(LAG)
EXPORT DEMAND, BEANS
ARROWS INDICATE MAJOR DIRECTION OF INFLUENCE
Figure 1. Simplified demand and price structure of the U.S. soybean market.
Soybean meal and crude soybean oil are relatively homogeneous products that are essentially independent of each other in use.2 The economic forces underlying the demand for soybean meal are largely unrelated
. to those sustaining the demand for soybean oil, although some indirect mutual forces possibly could be identified. One such force might be a shift in the demand for margarine made with soybean oil at the expense of butter, which in turn would affect the
markets for dairy feeds containing soybean meal. But for this analysis, the two product markets have been regarded as independent of each other.
The demand for U.S.-produced soybean meal can be separated into domestic and export demands. Domestic meal demand is the sum of the demands for meal in direct livestock feeding, formula feed manufacture, and industrial processing. The major determinants of meal demand in the United States are the
2 Processors derive small amounts of additional revenue from the sale of residual materials to industrial users. However, the total value is negligible compared with returns from meal and oil.
-5-

size and composition of the nation's livestock inventory and feeding practices followed by stockmen. Similarly, the export demand for meal is determined largely by requirements for high protein livestock feeds in foreign nations. Since large quantities of whole soybeans are crushed abroad, the export demand for meal also is affected by U.S. whole bean exports. For example, everything else being constant, the more beans exported, the lower would be the expected demand for export meal.
The demand for carryout meal stocks has been rather small in relation to total disappearance. Technical limitations prevent economical soybean meal storage for much more than a few weeks. Strong demand and favorable prices also have discouraged accumulation of stocks.
The total demand for U.S. soybean oil also is comprised of domestic and export demands. In some ways, the soybean oil market is more complex economically than the meal market because of very close substitution among vegetable oils, including soybean, cottonseed, peanut, and others. Domestic soybean oil demand stems largely from vegetable oil requirements for margarine, shortening, cooking and salad oils, and some nonfood products such as paint and resins. Small price differences among competing oils can cause important shortrun shifts in proportions used.
The soybean oil export market has two major segments-commercial oil sales for dollars and special sales to developing nations under the Food for Peace Program ( PL 480). Commercial export demand is subject to economic forces similar to those that affect domestic oil sales, except on a broader and more complex scale. Not only are there many end uses for soybean oil abroad, but a myriad of other oils and oilbearing materials vie for available markets. Import and export policies of foreign consuming and producing nations also complicate matters. In addition, the demand for soybean oil abroad is linked to exports of whole beans in the same fashion as export meal demand.
Oil shipments under the Food for Peace Program depend largely upon government decisions concerning the authorization of funds for shipments and the estimated requirements of potential recipient nations. A guiding principle is that concessional shipments of soybean oil (and other products) should not displace commercial sales or disrupt traditional trading arrangements. . The demand for carryout stocks of soybean oil is
relatively more important than that for meal, partly because it is technically possible to store oil cheaply for long periods and partly because slow demand growth for oil since World War II often has resulted in abundant oil supplies and weak prices.
Market Growth in Perspective
Figure 2 is designed to illustrate the growth of the soybean market and the relative economic importance of its major sectors during a recent 15-year period. This chart traces the value of soybeans and direct soybean products as they move from farm to end products. Two periods are represented. The shaded rectangles refer to average crop year values in 1947-48 and 1948-49. The plain rectangles show average values in the 1962-63 and 1963-64 crop years. Because the soybean crop year runs from October through September, the Rrst period extends from October 1947 through September 1949 and the second extends from October 1962 through September 1964. Additional growth in all major sectors shown in the Rgure has occurred since 1964, but the character of the growth pattern has remained similar to this 15-year illustration.
The values for all sectors were converted to farm level values.3 The conversion was simply for comparison, since other marketing levels could have been used. All parts of Rgure 2 are directly comparable with each other (i.e., the rectangles are approximately proportional to the relative differences in contributed value between sectors and periods). For example, the area of the production rectangle is equal to the sum of the three rectangular areas representing export, crushing, and other whole bean uses less average net change in stocks.
This same correspondence holds for the meal and oil sectors and for the breakdown within each sector. Similarly, the rectangle representing the average value of production in 1947-49 is only about one third the size of the 1962-64 production rectangle, since values in the latter period were about three times those of the Rrst.
Although the diagram reflects changes in both prices and quantities between the two periods, it shows how the various sectors of the industry contribute to the overall value of the soybean itself and it shows how this picture has changed since the immediate postwar days.
In many ways, this chart is like a snapshot of the industry in recent times superimposed on a snapshot of the industry 15 years earlier. Although there is no indication of the paths taken by the several sectors through time, both 2-year periods are generally representative.
Conclusion The preceding is a brief view of the soybean and
soybean product markets that guided the development of the economic and statistical models. Each part of the model can be related directly to this concept of the ·market and identi£ed on either Rgure 1 or 2. AI-
3 The procedure used in computing the data for figure 2 follows the method outlined in Measuring the Supply and Utilization of Farm Comrncdities, Agr. Handbook 91, AMS, USDA, 1955, pp. 14 and 25.
~6-

PRODUCTION
60*
130
560*
1657
FEED,. SEED ETC.
~+-r------.
88
57
EXPORT
34*
450
~C_R_U_SH __ IN~G--------~~~--------------~ 467* v
1108 ~
• 224*
+ FEED
612'
238*
712 396
18*
62
38 96*
96
39* NON~ 29 FOOD
33*
107
Sha·ded areas and starred values refer to 1947-49 period.
Figure 2. Farm level value and utilization of soybeans and soybean products, millions of dollars, 1947-49 and 1962-64.
though soybean production and utilization have grown enormously since World War II, the basic supply and demand structure has remained intact. The export sectors have expanded greatly, especially in beans and meal, and some shifts have occurred in the relative importance of end products. However, with the exception of PL 480. oil exports, similar economic forces have operated from 1946 to the present.
The Analytical Framework Four main ideas underpin the crop year model of
the soybean market presented in this secticn. When incorporated into a formal structure, they give the model its distinctive characteristics~ They are: ( 1) the joint product aspects of soybean meal and oil, ( 2) the multiple market outlets that compete for available beans, meal, and oil, ( 3) the position of the soybean products within the fats and oils complex and the feed-livestock sector, and ( 4) the simultaneous determination of product prices and market flows within each crop year.
-7-

Joint Products Soybean meal and oil are joint products of the
crushing industry.4 To obtain one of these items, the other must be produced. Once the annual crush of soybeans has been determined, market supplies of meal and oil are fixed. They must be sold into end-use markets or held as inventory. Hence, supplies of meal and oil are linked tightly to each other and to the quantity of soybeans crushed domestically.
The joint product situation with soybeans differs from joint product questions involving other commodities. For example, joint products of beef slaughter-steak, roasts, hamburger, etc.-can be substituted rather closely for one another. But soybean meal and oil markets are largely independent. Economic factors that influence growth in meal demand do not affect demand growth for oil and vice versa. Hence, widely different demand growth rates for meal and oil are possible and have occurred since World War II. Since their supplies are bound together by technical constraints, differing demand growth rates produce unique price behavior patterns. This joint product relationship is the pivot on which many peculiar features of the soybean market turn.
Multiple Markets Many distinct market outlets compete for available
beans, meal, and oil. Ignoring usage for seed, on-farm feed, and a few minor whole bean products, soybeans move into domestic crushing, export, or storage. Similarly, meal and oil move into domestic utilization, export, or stocks. Prices adjust to ration supplies among alternative outlets. Since these outlets are growing at different rates, an economic model of the total market must allow for such changes within the overall requirement that supplies equal total demand for each commodity in each crop year.·
Soybean Products in Wider Markets A third central notion underlying the model is
that soybean meal and oil are each components of broad market complexes. Hence, an economic model focusing on soybeans and soybean products should specify whatever sources of demand growth and competition from other commodities operate in the wider context-both domestic and foreign. Although a complete system has not been developed for either the fats and oils market or the feed-livestock economy, both should be represented effectively in the model.
Simultaneity The soybean market does not operate in an eco
nomic vacuum. General conditions in the economy af-
fe~t the soybean market through the several subsectors discussed previously. In return, the soybean market influences these subsectors and the general economy. It is always difficult to know where to sever mutual dependence in an economic model. Much depends upon the purpose of the analysis, the data available, and the resources committed to the study. It is clear, however, that within the soybean market mutual influence and interdependence cannot be ignored, especially when the analysis is cast in a crop year framework. To do so could seriously undermine the empirical relevance such a model might have.
For example, the amount of soybeans demanded for export in any given crop year depends partly upon current U.S. bean prices. This price is influenced by the demand for domestic crushing, which reflects domestic and export demands for meal and oil. Should the export demand for beans shift suddenly, bean price adjustments would occur and the amount demanded for crushing could be expected to change. Changes in crushing would influence meal and oil supplies, and these supply changes could be expected to affect meal and oil prices.
In general, changes in one sector of the market will reverberate throughout the entire system. Hence, a useful economic model of this market should encompass as much simultaneous determination of prices and quantities as practicable.
Other Considerations Three additional considerations help to give this
model its distinctive character. First, the price support and loan programs of the federal government were effective in holding bean prices above free market levels in a few years during the 1946-66 period. This influence was introduced indirectly into the model. Secondly, PL 480 shipments of soybean oil made since 1954 were regarded as an external factor affecting prices and marketings. Finally, the crop year supply of soybeans was regarded as independent of the current year's price, since the supply is largely determined at the beginning of the crop year. However, past price levels were permitted to affect future acreage and production in the model.
Simplified Price-Quantity Graphics of the Model
The relationships discussed earlier can be reflected in a series of two dimensional diagrams based on the theory of economic statics (see figure 3). These pricequantity diagrams are generalized versions of the meal, oil, and soybean markets at a given moment in time, with all nonprice factors held constant.
4 The classic definition of joint products is, "things (commodities) which cannot be produced separately but are joined in a common origin ... , such as beef and hides, or wheat and straw," Alfred Marshall, Principles of Economics, Eighth Edition, (MacMillan: 1959), pp. 321-22.
-8-

A. US meal demand
s
B. Export meal demand
0 p
C. Total meal j demand
I I I I
D. Total oil I demand
I
0 p
E. 0 0
US oil F. Export oil q 0 q
demand demand G. Oil stocks
R I p $
s
~,· ,· p
----------~ -K-J w I r I I
s s s s s q q q
K. Bean price q
0 q
H. Total bean supply I. US crushing J. Export bean L. Commercial
and demand demand demand support bean stocks
Figure 3. Simplified graphic model of soybean and soybean products markets.
The total demand for soybean meal at wholesale is shown in section C of figure 3. Although the graph is not drawn to scale, the curve in section C is meant to be the horizontal summation of the derived demands for meal in the United States (section A) and for exports to foreign nations (section B). The symbols pm and qm indicate meal price and quantity, respectively. Meal inventory changes have been disregarded here.
The total wholesale demand for soybean oil is shown in section D. It is to be regarded as the horizontal summation of the derived · demands for oil in the United States (section E), for exports to foreign nations (section F), and for oil stock changes (section G). The symbols p0 and qo indicate price and quantity of soybean oil, respectively.5 The foreign demand for soybean oil (section F) is expressed in two parts: ( 1) the perfectly inelastic function represents administratively determined PL 480 concessional sales and ( 2) the balance of the oil export demand is the
demand for commercial exports through normal trade channels.
Since meal and oil production are locked together through technically-fixed crushing yields for meal and oil, each point on the qm axis of section C is precisely related to a corresponding point on the qo axis directly below in section D. Lining up the qm and qo axis in this way illustrates the joint product relationship between meal and oil. Together, the meal and oil total demand functions form the average revenue function ( R) in the crushing sector, section 1.6 By subtracting the crushing and handling spread, w, from R, the farm level demand for soybeans for crushing is formedwith ps and qs indicating price and quantity of soybeans, respectively.
To the crushing demand, add horizontally ( 1) the export bean demand in section J, ( 2) the perfectly elastic government demand for soybeans at the support rate, r, in section K, and ( 3) the commercial storage relationship for beans, section L. 7 The summation
5 Empirical investigation suggests a net positive relation between the current price of soybean oil and changes in oil stocks. For details, see the section beginning on page 16. ·
• In this model, R = 11 p 0 + 48 pm where 11 and 48 are the approximate pounds of oil and meal yielded by a 60-pound bushel of soybeans after processing.
7 Empirical investigation suggests a net positive relation between the current price of soybeans and changes in commercial bean stocks. For details, see the section beginning on page 16.
-9-

of these four relationships forms the total farm-level demand for soybeans shown in section H. This total demand is negatively sloped at prices above the support rate, r, and perfectly elastic at the support rate. Bean prices can drop to r but no lower, since the government stands ready to accept all offered quantities at the support level.
In reality, of course, not all of these demand relationships are independent of each other. The price of soybeans undoubtedly affects the positioning of the export demands for meal and oil, and vice versa. However, in the equilibrating process, several of the functions can shift as relative prices change within the overall soybean and soybean product sectors.
To illustrate a final equilibrium position in this simplified framework, a supply function for soybeans was added to section H of figure 3. This function includes market supplies of soybeans and excludes the feed, seed, and other on-farm soybean uses. This particular supply function has a positive slope with respect to current prices. However, it can easily be assumed to be independent of current price levels. In any case, the intersection of the total demand and total supply functions produces an equilibrium price and output of soybeans, indicated with dotted lines in section H. The equilibrium soybean price rations the available supply among crushing, exports, and other uses. Since the equilibrium bean price is above the support rate, no government stocks are accumulated.
The quantity of soybeans crushed, shown in section I, yields fixed amounts of oil and meal, indicated by the dotted vertical line through sections C and D. These oil and meal supplies intersect with the total demand curves for the two products, establishing equilibrium prices in both markets. The equilibrium oil and meal prices ration the supplies among domestic and foreign outlets as shown by the dotted lines in sections E, F, G for oil and sections A and B for meal.
The direction of causation does not run exclusively in the way just discussed. The entire system moves toward equilibrium in a simultaneous manner, with all sectors interacting with one another. What is shown in figure 3 is the equilibrium achieved if all sections have time to make full adjustment. In reality, one equilibrium position is only approached before new supply considerations and new demand factors change the equilibrium position. The market then moves in search of the new equilibrium. The diagrams in figure 3 are useful in that all the basic equations of the statistical model can be identified in this framework and also related to the component parts of figure 1.
Furthermore, this simplified framework can be used to trace marketwide repercussions of specific changes or shifts in one or more sectors of the soybean economy. However, institutional and dynamic actual market features not reflected in this framework may modify and obscure the adjustments suggested by the geometry of figure 3. A theoretical system of this kind can indicate only the probable direction of change.
The actual or relative magnitude of price and quantity changes cannot be determined unless actual or relative values of demand and supply parameters are known, estimated, or assumed. The purpose of the following statistical analyses is to estimate the relevant parameters for this theoretical model.
The Simultaneous Model
Technical and Physical Relationships
No matter how the model's various supply and demand functions are formulated, constraints imposed by the physical and technical relationships outlined in the previous section must remain intact to hold the simultaneity of the system together. These relationships (often called identities) are expressed in equations 1-6 ·and in equation 12 in table 1. Equations 1 and 2 simply state that meal and oil production in each crop year depend upon that year's soybean crush and average meal and oil outturns per bushel, the latter being fixed by technological considerations.
Equation 3 is the price linkage that joins the wholesale value of crushed soybeans to the farm price. The wholesale product value is reflected in the per-pound prices of meal and oil, each multiplied by their per-bushel outturn. From this summation, the gross crushing and handling spread (treated here as an independent variable) is subtracted. The result is the farm level price of beans. This relationship constrains overall price behavior but allows individual prices scope for fluctuation. Sections C, D, and I of figure 3 illustrate these identities graphically.
Equations 4-6 are market-clearing identities which insure that total demand for beans, meal, and oil in all outlets will be equivalent to total supplies for each crop year.
The final identity in the model is equation 14 in the supply subsection. It converts acreage harvested for commercial purposes into actual bean supplies via multiplication by externally determined per acre yields.
Jointly Determined Variables
In a simultaneous economic model, the variables that are determined within the model are known as jointly determined or endogenous variables. Those that are external to the model are called predetermined or exogenous variables. The distinction is elusive. In economic systems every variable probably affects every other variable to some extent. Nevertheless, many economic variables influencing a particular sector are negligibly affected in return. In the context of this model, predetermined variables can be regarded as those that influence the soybean market without being measurably affected in return during the same crop year.
-10-

Table 1.-The domestic soybean model, crop year basis
Demand side Physical and technical relationships
1. Meal production: qtmp = Ytm • qt"0
2. Oil production: qtop = yt • qt80
3. Price linkage: Pt" = Ytm • Ptm + Yt0 • Pt0 - Wt 4. Market clearing-beans: qt"" = qt"0 + qt"x + St" + gt" 5. Market clearing-meal: qtmp = qtmd + qtmx + Stm 6. Market clearing-oil: qt0 P = qtod + qtox + St0 + qtoxpl
Behavioral relationships 7. U.S. meal demand: (qtmct, Ptmi qtP, lt, qtdP, e 7)
8. Export meal relation: (qtmx, qtmp; ltw, ft, es) 9. U.S. oil demand: (qt0 d, Pt0 i q{0 d, Ptb+l, Et, e9)
10. Export oil demand: (qt0x, Pt0 i It, qtcox, qtxvi, elo) 11. Change in commercial oil stocks: (s0 , p0 , q0 P, s"; S0 , qoxvi, e11)
12. Export bean demand: (qt"x, Pt", Ptmi It, ft, e12) 13. Change in commercial bean stocks: (st", Pt", St0 i St", qt"", e13)
Supply side 14. Commercial bean supply: qt"" = Yt" • St"h 15. Acreage harvested: (st"h; Pt-1", Pt-2", dpt"", atw, atct, at0 , eu;)
Variable identification-demand side
qtmp quantity of soybean meal produced in United States (endog.)* Ytm qt"c qtop
Yt0
Pt" Ptm
Pt0
Wt qt"" qt"x
St" gt" qtmd qtmx Stm qtod qtox
Sto qtoxpl
qtP
lt qtdp
ltW
Ft qtcod
-
yield of meal per bushel of soybeans crushed (exog.) quantity of soybeans crushed in United States (endog.) quantity of soybean oil produced in United States (endog.) yield of oil per bushel of soybeans crushed (exog.) price received by U.S. farmers for soybeans per bushel (endog.) wholesale price of soybean meal per pound (endog.) wholesale price of soybean oil per pound (endog.) crushing and handling margin per bushel (exog.) commercial supply of U.S. soybeans; production less feed, seed, and residual disposition (exog.) quantity of soybeans exported from the United States as whole beans (endog.) change in stocks of U.S. soybeans held by private firms (endog.) change in stocks of soybeans owned by CCC (exog.) quantity o·f soybean meal demanded in the United States (endog.) quantity of soybean meal exported from the United States (endog.) change in total U.S. stocks of soybean meal (exog.) quantity of soybean oil demanded in the United States (endog.) quantity of soybean oil commercially exported from the United States (endog.) changes in total U.S. stocks of soybean oil (endog.) concessional exports of soybean oil (Pl 480 shipments, except barter) (exog.) U.S. supplies of other high protein feedstuffs (exog.) livestock production units based on concentrates in the United States: hogs, cattle, poultry (exog.) percentage of digestible protein in concentrate rations fed to all U.S. livestock and poultry (exog.) numbers of soybean-meal-consuming units in the countl"ies importing soybean meal from the United States: cattle, hogs, poultry (exog.) production of feed grains in soybean importing nations (exog.) domestic disappearance of cottonseed oil in the United States (exog.)
*The subscript 't' refers to the current crop year. The variables are presented in the order of their appearance in equations 1·15. Abbreviations in par.,ntheses indicate whether the variable is endogenous or exogenous in the simultaneous model.
-11-

Table 1 (continued)-The domestic soybean model, crop year basis
Ptb+l
Et
Variable identification-demand side (continued)
U.S. wholesale price index of butter and lard (exog.)* total U.S. food expenditures deflated by retail food price index (exog.)
It qtcox
index of personal income in fat-and-oil-importing nations other than the United States (exog.) quantity of cottonseed oil commercially exported from the United States (exog.)
St0
St" Yt"
crop-year opening stocks of soybean oil in the United States (exog.) crop-year opening stocks of soybeans in the United States (exog.) per acre yield of soybeans harvested (exog.)
Variable identification-supply side
at"" acres harvested for soybeans to be sold in commercial markets Pt"" price support rate for soybeans per bushel dpt"" change in Pt88 from (t- 1) tot atw acres seeded to wheat in Nebraska, North Dakota, South Dakota, and Kansas atct acres seeded to cotton in Louisiana, Arkansas, Mississippi, South Carolina, Virginia, and North Carolina at0 acres seeded to oats in Missouri, Iowa, Indiana, Ohio, Illinois, Wisconsin, Michigan, Minnesota, Nebraska,
North Dakota, South Dakota, and Kansas ei disturbance terms (i = 7, 8, .... 15)
*The superscript "t" refers to the current crop yeor. The variables are pres~nted in the order of their appearance in equations 1-15. Abbrevia· lions in parentheses indicate whether the variable is endogenous or exogenous in the simultaneous model.
If, in a given crop year, the value of each predetermined variable is known and the entire structure of the model also is known, then simultaneous solution of all equations in the model will produce a unique value for each jointly determined variable. The variables that are jointly determined in the simultaneous demand model are:
1. The wholesale meal price, Ptm 2. The wholesale crude oil price, Pt" 3. The soybean price received by farmers, Pt" 4. Exports of whole beans, qtsx 5. Changes in commercial carryout bean stocks,
St8
6. Crushings of beans, qt"" 7. Amount of meal produced, qtmp 8. Amount of oil produced, qtop 9. Domestic utilization of meal, q1md
10. Domestic utilization of oil, q1od 11. Exports of meal, q1mx 12. Commercial exports of oil, q1°" 13. Changes in commercial carryout oil stocks, st Several versions of the basic model are used. Each
is specified and estimated as a complete system. That is, each version contains as many separate equations as there are jointly determined variables .. When estimated, a complete model can be solved so that a predicted value for each jointly determined variable can be computed for each crop year for which the predetermined variables are known or assumed.
Behavioral Equations
Together, the identities and behavioral equations comprise the simultaneous structure of the soybean market model. However, the behavioral equations in an economic model are fundamentally different from physical and technical relationships among variables. The latter indicate the formal constraints on the variables, while the former express reactions of buyers and sellers to prices, incomes, supplies and prices of related commodities, and other economic and noneconomic variables.
Since all of the variables affecting buyers and sellers over the sample period cannot be either specified or measured, a random disturbance (error) term is included in each behavioral equation. By assumption, it accounts for the unknown effects of unspecified _or unmeasured factors. Introduction of a disturbance in each behavioral equation permits the use of statistical estimation techniques. These estimation procedures are systematic means of examining historical data to discover how the behavioral equation variables have been related to one another over time. Certain estimation procedures, such as two-stage least squares, can reflect the simultaneity that is built into the model.
The variables included in each equation were selected on the basis of substantial preliminary analysis. The final specification of any one of the equations is open to question. Many other specifications are possible and would be consistent with the overall character of the model. A summary of each equation is provided in notation form in table 1.
-12-

U.S. demand for soybean meal. The domestic soybean meal demand faced by processors is the total of several derived demand functions. 8 It includes the derived demands for soybean meal for farm mixed and manufactured high protein livestock feeds and for soy flour for industrial and food products. Since the soybean meal market is overwhelmingly dominated by the feed outlet (figure 2), the variables having a major impact on meal demand originate in the feed-livestock sector.
The quantity of domestic soybean meal demanded is expressed jointly in a function with the wholesale meal price and several predetermined variables ( equation 7, table 1). First is the quantity supplied of other · high protein feeds, including cottonseed meal, linseed meal, tankage, meat scraps, and others.9 Economic theory suggests that the higher the supplies of other high protein feeds are, the lower soybean meal demand will be.
Next is the number of livestock production units of hogs, cattle, and poultry-the consumers of soybean meal. Their influence in this equation is similar to population effect in a retail demand equation. ,
The next variable is the estimated percentage of digestible protein in concentrate rations for livestock and poultry. This variable is assumed to be an indicator of changes in feeding practices, since these practices affect high protein feed sources. Theory suggests that the higher the protein level in concentrate rations, the more soybean meal is demanded for farm mixed and manufactured feeds.
The final variable in equation 7 is a disturbance term to indicate the stochastic nature of the relationship.10 The yearly influence of this disturbance term is expected to be small and irregular. Each of the other behavioral equations contains a similar random disturbance term. This particular equation can be viewed as a statistical representation of the graph in section A of figure 3.
Export relation for meal. Substantial preliminary testing revealed that consistent relationships among meal exports, prices, and other variables were difficult to identify. In particular, the net relationship between meal exports and meal prices was not acceptable in any specification of the model. To avoid considering meal exports simply as a predetermined variable, equation 8 was formed to link meal exports to the other jointly determined variables.
The quantity of meal exported is expressed jointly in a function with the quantity of meal produced in the United States, the number of soybean meal consuming animal units (hogs, poultry, cattle) in 28 importing nations, and the foreign production of feed-
grains. The hypothesis here is that the higher the population of meal consuming animal units, the more meal will be demanded for export. On . the other hand, the larger the worldwide supply of feedgrains, the lower the export meal demand should be, in the absence of other changes. This equation can be associated with section B of figure 3.
U.S. demand for soybean oil. The domestic demand for soybean oil faced by processors also is the total of several derived demand functions. It includes the demand for crude soybean oil by refiners, who sell refined oil to manufacturers of shortening, margarine, and other· oil-using foods, and by industrial users of soybean oil and its byproducts.
The quantity of soybean oil demanded domestically is expressed jointly in a function with the price of crude oil and several predetermined variables (equation 9, table 1). The first of the predetermined variables is the demand for cottonseed oil, the other main vegetable food oil. All vegetable food oils in the United States, including cottonseed oil, are regarded as nearly perfect substitutes for one another. This fact leads to special estimating restrictions described later. However, the total crop year supply of other vegetable food oils, particularly cottonseed oil, is assumed to be determined outside of the soybean market.
To account for the influence of animal fats and oils on soybean oil demand, the wholesale price index for butter and lard is assumed to be a predetermined variable. Both butter and lard compete with soybean oilusing products, mainly margarine and vegetable shortenings. When market prices of animal fats increase, the soybean oil demand also can be expected to increase as users substitute soybean oil for animal fats.
To reflect the overall demand growth for soybean oil-using products in the United States, total yearly deflated expenditures for food are included as a predetermined variable. This variable accounts for changes in both population and individual incomes. Increases in this variable are likely to be associated with increases in soybean oil demand. Section E of figure 3 is a graphic version of this statistical equation.
.Export demand for oil. The foreign demand for soybean oil is the sum of derived demands for oil-using products faced by foreign oil importers. In this model, the foreign oil demand is introduced in a total or global demand function.
The export quantity of oil demanded in commercial markets is expressed jointly in a function with the price of oil and other predetermined variables (equation 10, table 1). The first predetermined varia-
8 The theory of derived demand for agricultural products is well presented in F. L. Thomsen and R. J. Foote, Agricultural Prices, ( McGraw-Hill: 1952), pp. 51-54.
0 The notation guide in table I gives a brief definition of each variable. 1° For a good elementary discussion of the nature of the disturbance terms, see J. Johnston, Econometric Methods, (New York: McGraw
Hill), 1963,_ pp. 5-7.
-13-

ble is an index of personal income in foreign nations. Each nation's contribution to the index is weighted by its average imports of vegetable oils in the sample period. This index reflects changes in purchasing power in those nations that are important international buyers of fats, oils, and related products. Increases in this index should be associated with increases in the export demand for U.S. soybean oil. The second predetermined variable is the commercial export of cottonseed oil. Because of the substitutability between soybean and cottonseed oils, the latter is assumed to be a perfect substitute for soybean oil exports. Finally, this system includes concessional exports of soybean oil under PL 480 as a predetermined variable affecting commercial exports. Although the PL 480 program is designed to avoid displacement of commercial sales and disruption of regular trade patterns, it was hypothesized that some side effects in these directions might appear.
The worldwide supply of fats and oilbearing materials was used as a predetermined variable in several preliminary analyses, but high intercorrelation with the income index precluded the use of both in the same equation. Further work is needed on this relationship so that the availability of substitutable fats and oils from other sources can be included in the export relationship, much as other fats and oils are included in domestic oil demand. This equation can be associated with section F of figure 3. .
Commercial stocks of oil. In this model, the demand for carryout soybean oil stocks by private firms is formulated in terms of changes from the previous year's carryout position. Thus, stock changes are positive or negative, depending on whether soybean oil displayed a net movement in or out of storage during the year. As indicated in figure 2, inventory holdings of soybean oil have become increasingly important in recent years. Carryout stocks in the 1962 crop year amounted to a record 16 percent of the year's total disposition. The 1954-65 average was approximately 9 percent.
Much of the carryout oil demand is for "pipeline" stocks needed for manufacturing requirements and export commitments. Current oil prices, price expectations, the level of other commodity stocks, and expected PL 480 activity affect oil carryout demand. The carryout demand for oil in this model is formulated much more simply than if this sector's behavior was the central focus of the analysis.
The change in oil stocks is expressed jointly in a function with the wholesale price of oil and four other variables, two of which are predetermined (equation 11, table 1). The predetermined variables are opening stocks of oil and PL 480 oil shipments. The larger the carryin stocks of soybean oil and concessional sales, the smaller would be the expected increase in oil stocks.
The jointly determined variables include price of oil, quantity of oil produced in the United States, and
changes in commercial soybean stocks. The larger the available oil supply (given by oil production) to be allocated among market outlets in a given year, the more commercial oil stocks would be expected to increase in the absence of other changes. The larger the increase in oil stocks as whole beans, the smaller would be the expected increase in oil stocks (as oil). Similarly, the larger the opening oil stocks on October 1, the smaller the expected increase in total stocks would be over that crop year. This equation can be associated with section G of figure 3.
Export demand for soybeans. The foreign demand for U.S. soybeans faced by exporters is the sum of the derived demands for soybean-using products confronting foreign processors and handlers. In th:s model, the foreign soybean demand is introduced in a total or global demand function.
The export quantity of beans demanded is expressed jointly in a function with the price of beans and other variables, two of which are predetermined (equation 12, table 1). The first predetermined variable is the index of personal income in foreign nations. Its influence on export bean demand is expected to be positive.
The next predetermined variable is the production of feed grains (corn, oats, barley) in the countries that import U.S. soybeans. This variable indicates the availability of substitutable feed materials from other sources. When production of other feeds increases,
·theoretically the demand .for U.S. soybeans in foreign markets can be expected to decline if no other changes occur. The same argument can be advanced for including world fats and oils production in this equation to account for changes in demand for the oil component of bean exports. Preliminary tests showed that either feed grain output or fats and oils output performed well as competitive commodities in relation to soybean exports, but high intercorrelation precluded the use of both in the same equation.
The current prices of soybean meal and oil were tested in several versions of the bean export equation. The objective here was to determine if variation in these product prices affected export bean demand. Since foreign buyers can substitute bean purchases for purchases of meal or oil, increases in relative prices of the products theoretically should lead to increased export bean demand. Equation 12 (table 1) shows only the price of meal in the behavioral function, since preliminary tests indicated that inclusion of the oil price did not improve the statistical results. In addition, a version of the export bean demand equation was computed without either meal or oil prices. This equation can be associated with section J of figure 3.
Commercial stocks of soybeans. As with oil stocks, the relationship for carryout bean stocks by private firms is formulated in terms of positive or negative net changes from the carryout position of the previous year.
-14-
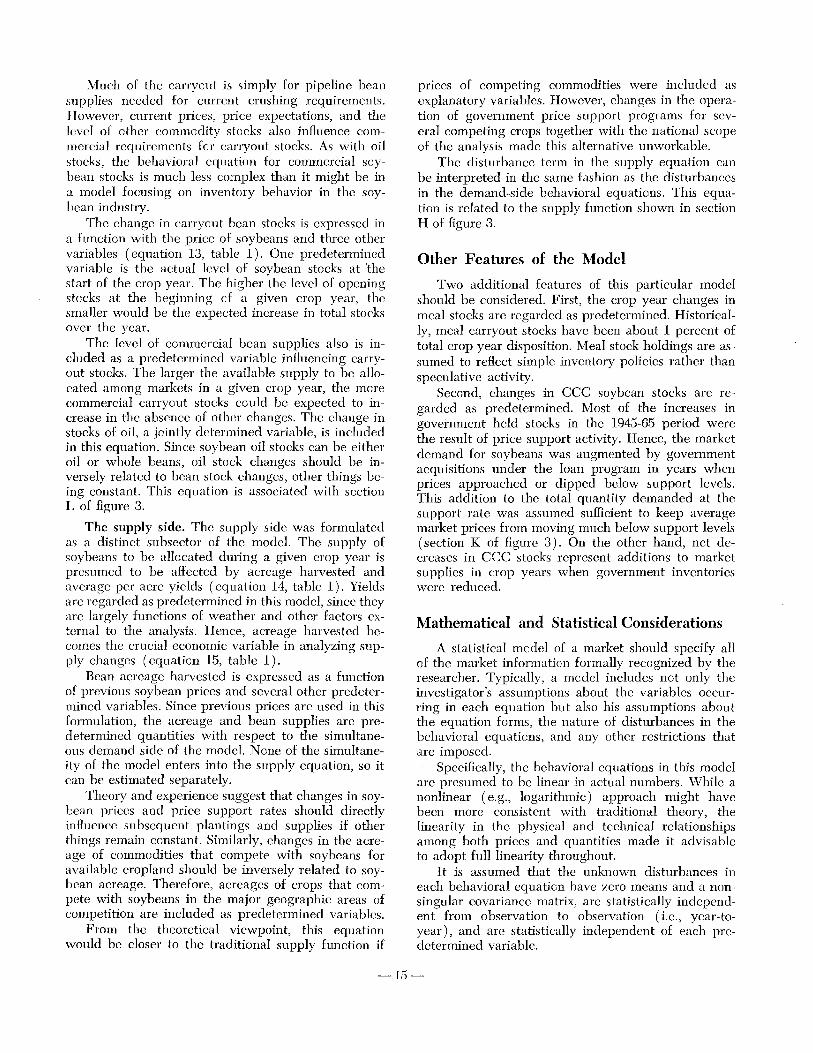
Much of the carrycut is simply for pipeline bean supplies needed for current crushing requirements. However, current prices, price expectations, and the level of other commodity stocks also influence commercial requirements for carryout stocks. As with oil stocks, the behavioral equation for commercial soybean stocks is much less complex than it might be in a model focusing on inventory behavior in the soybean industry.
The change in carryout bean stocks is expressed in a function with the price of soybeans and three other variables (equation 13, table 1). One predetermined variable is the actual level of soybean stocks at 'the start of the crop year. The higher the level of opening stocks at the beginning cf a given crop year, the smaller would be the expected increase in total stocks over the year.
The level of commercial bean supplies also is included as a predetermined variable influencing carryout stocks. The larger the available supply to be allocated among markets in a given crop year, the more commercial carryout stocks could be expected to increase in the absence of other changes. The change in stocks of oil, a jointly determined variable, is included in this equation. Since soybean oil stocks can be either oil or whole beans, oil stock changes should be inversely related to bean stock changes, other things being constant. This equation is associated with section L of figure 3.
The supply side. The supply side was formulated as a distinct subsector of the model. The supply of soybeans to be allocated during a given crop year is presumed to be affected by acreage harvested and average per acre yields (equation 14, table 1). Yields are regarded as predetermined in this model, since they are largely functions of weather and other factors external to the analysis. Hence, acreage harvested becomes the crucial economic variable in analyzing supply changes (equation 15, table 1).
Bean acreage harvested is expressed as a function of previous soybean prices and several other predetermined variables. Since previous prices are used in this formulation, the acreage and bean supplies are predetermined quantities with respect to the simultaneous demand side of the model. None of the simultaneity of the model enters into the supply equation, so it can be estimated separately.
Theory and experience suggest that changes in soycean prices and price support rates should directly influence subsequent plantings and supplies if other things remain constant. Similarly, changes in the acreage of commodities that compete with soybeans for available cropland should be inversely related to soybean acreage. Therefore, acreages of crops that compete with soybeans in the major geographic areas of competition are included as predetermined variables.
From the theoretical viewpoint, this equation would be closer to the traditional supply function if
prices of competing commodities were included as explanatory variables. However, changes in the operation of government price support programs for several competing crops together with the national scope of the analysis made this alternative unworkable.
The disturbance term in the supply equation can be interpreted in the same fashion as the disturbances in the demand-side behavioral equations. This equation is related to the supply function shown in section H of figure 3.
Other Features of the Model
Two additional features of this particular model should be considered. First, the crop year changes in meal stocks are regarded as predetermined. Historically, meal carryout stocks have been about 1 percent of total crop year disposition. Meal stock holdings are assumed to reflect simple inventory policies rather than speculative activity.
Second, changes in CCC soybean stocks are regarded as predetermined. Most of the increases in government held stocks in the 1945-65 period were the result of price support activity. Hence, the market demand for soybeans was augmented by government acquisitions under the loan program in years when prices approached or dipped below support levels. This addition to the total quantity demanded at the support rate was assumed sufficient to keep average market prices from moving much below support levels (section K of figure 3). On the other hand, net decreases in CCC stocks represent additions to market supplies in crop years when government inventories were reduced.
Mathematical and Statistical Considerations
A statistical model of a market should specify all of the market information formally recognized by the researcher. Typically, a model includes not only the investigator's assumptions about the variables occurring in each equation but also his assumptions about the equation forms, the nature of disturbances in the behavioral equations, and any other restrictions that are imposed.
Specifically, the behavioral equations in this model are presumed to be linear in actual numbers. While a nonlinear (e.g., logarithmic) approach might have been more consistent with traditional theory, the linearity in the physical and technical relationships among both prices and quantities made it advisable to adopt full linearity throughout.
It is assumed that the unknown disturbances in each behavioral equation have zero means and a nonsingular covariance matrix, are statistically independent from observation to observation (i.e., year-toyear), and are statistically independent of each predetermined variable.
-15-

The Data The data used in the estimation procedures are
October-September crop year averages and totals for the 1946-64 period.n When original data series were
available only on a calendar year basis, proportional adjustments were made to shift the data to a crop year basis. The actual data used are presented and defined in appendix A, pages 43-46.
Estimation of the Simultaneous Model
This section contains a discussion of the statistical estimates of the basic simultaneous model outlined in the preceding section and summarized in table 1. Four versions of the model were specified and estimated with annual data from the 1946-64 period. Figure 4 illustrates the differences among models I, II, III, and IV. .
Differences among the four models hinge on two considerations: ( 1) whether or not soybean meal prices are included in the soybean export demand equation and ( 2) whether or not cottonseed oil is regarded as a perfect substitute for soybean oil. These alternative specifications are only a fe~ of the many that could be analyzed, but preliminary work showed that these four were among the most useful. By utilizing these four models, a range of estimation results emerges.
The Estimation Process
Each of the behavioral equations in table 1 was expressed in linear form. The coefficients were then estimated by statistical methods using the data and assumptions summarized in the preceding section. Several estimation methods are available for a system of simultaneous equations. However, there is no general agreement on small sample statistical properties of the various estimators. In his widely used econometrics text, Johnston surveyed several Monte Carlo studies of estimation procedures and concluded:
. . . on structural parameters, the evidence would appear to be that FIML (Full Information Maximum Likelihood) is the best method. Its disadvantages, however, are still very serious; the computational burden is very heavy and the optimal properties of the estimator depend heavily upon the correctness of the a priori specifications of the model. . . . Concentrating-then on single-equation estimators ... the best choice would appear to be TSLS (Two Stage Least Squares) first, LISE (Limited Information Single Equation) second, and OLS (Ordinary Least Squares) third.12
The conventional identification criteria show that all behavioral equations in the system are overidenti-
A Cottonseed oil Cottonseed oi I as not in soybean perfect substitute oil demand for soybean oil Is
Meal price included in Modell Model Ill bean export demand
Meal price excluded from Model II Model IV bean export demand
Figure 4. Specification of simultaneous models I, II, Ill, IV.
ned. The two-stage least squares method was used for estimating the structural form of the simultaneous model. However, for pinpointing the specifications of the model, much preliminary work was done with ordinary least squares. The results of ordinary least squares estimation also are presented, along with twostage least squares results for the four models.
Estimation Results for Behavioral Equations
The estimates of the structural form are presented in this section. Each equation is written with the normalized variable on the left side; all other variables appear to the right of the equality sign.13 The figures in parentheses under the coefficients are estimates of standard errors. Although the traditional significance tests are not appropriate for two-stage least squares and ordinary least squares estimates of a simultaneous model, an idea of the strength of each estimated coefficient can be obtained by comparing it to its estimated standard error. The identifying numbers assigned to the equations here correspond with those in table 1. The ordinary least squares ( OLS) results of the supply relationship (equation 15, table 1) are presented in appendix B.
In general, the OLS and two-stage least squares ( TSLS) estimation results are similar. However, there are some differences among the four models.
11 Although USDA recently adopted a September !-August 30 crop year for soybeans, this analysis is based on the original crop year specification.
12 J. Johnston, op. cit., pp. 293-294. 13 For a discussion of these procedures, see Johnston, op. cit., pp. 258 ff.
-16-

U.S. Meal Demand (equation 7)
Ordinary least squares, models I-IV qtmd = -28,874.158- 1,346.000 Ptm- 2.254 qtt> + 0.156 Lt + 3,495.000 qtt!p
( 402.100) ( .0469) ( 0.046) ( 1,117.000) R2 = 0.97
Two-stage least squares, models I and II qtmd = -27,563.940- 1,917.550 Ptm- 2.372 qtll + 0.140 Lt + 3,766.800 qtdp
(525.336) (0.700) (0.054) (1,289.077)
Two-stage least squares, models III and IV qtmt! = -27,574.325- 1,811.593 Ptm- 2.347 qtv + 0.144 Lt + 3,683.837 qtd11
( 519.047) ( 0.686) ( 0.055) ( 1,317.649)
In all cases, the signs on the coefficients for U.S. soybean meal demand were in accord with the theoretical expectations and were rather large relative to their individual standard error estimates. The price of meal and the quantity demanded are negatively related, as would be expected. Similarly, the quantity demanded is negatively related to the supply of other high protein feeds that compete for the same general markets.
U.S. Oil Demand (equation 8)
Ordinary least squares, models I and II
Both livestock units and the percentage of protein in prepared feeds act as direct demand shifters for soybean meal. The coefficients on livestock units are especially large in relation to their estimated standard error. The estimated OLS and TSLS coefficients are quite similar. In the OLS formulation, over 97 percent of the variation in soybean meal demanded in the United States is associated with the specified variables.
qtoa = -3,747.626- 85.340 Pt0 + 13.060 Ptb+ 1 + 0.084 Et ( 28.440) ( 7. 731) ( 10.007)
R2 = 0.96
Ordinary least squares, models III and IV qto<l = -929.666- 105.600 Pt0 + 10.500 Pt"+l + 0.071 Et- qtcotl
( 31.790) ( 8.643) ( 0.008) R2 = 0.95
Two-stage least squares, models I and II qtod = -4,200.588- 131.927 Pt0 + 24.048 Pt"+ 1 + 0.082 Et
( 73.551) ( 18.702) ( 0.008)
Two-stage least squares, models III and IV qto<l = -2,113.474- 193.859 Pt0 + 33.032 Pt"+l + 0.070 Et- qtcod
(121.908) (31.022) (0.014)
As previously mentioned, U.S. soybean oil demand was formulated in two ways-with and without consideration of cottonseed oil. In models I and II, cottonseed oil does not appear in the demand equation. In models III and IV, cottonseed oil is introduced as a perfect substitute for soybean oil, with its coefficient fixed at -1.0.
In all formulations, the estimated coefficients display theoretically appropriate signs and are large relative to standard error estimates. Price and quantity demanded are negatively related. One interesting feature of these two formulations is that when cottonseed oil quantities are held constant (models III and IV),
the impact of a given soybean oil price change on quantity demanded is larger than when cottonseed oil is not specifically accounted for (models I and II).
The competitive influence of animal fats and oils is indicated by the positive relation between the price index of butter and lard and the quantity of soybean oil demanded. The positive coefficient on real expenditures for food includes the direct demand-shifting influences of increasing per capita income and population growth. Again, both OLS and TSLS estimates are close. Over 95 percent of the variation in £oybean oil demanded is associated with changes in the variables specified in the OLS method of estimation.
-17-

Export Bean Demand (equation 9)
Ordinary least squares, models I and III qtsx = -88,310.947- 18,340.000 Pts + 9,470.000 Pt'll + 1,913.000 It- 1.215 Ft
(14,200.000) (8,881.000) (230.700) (0.736) R2 = 0.98
Ordinary least squares, models II and IV qtsx = -88,185.737- 6,404.000 Pt8 + 1,900.000 It- 1.155 Ft
( 9,029.000) ( 229.900) ( 0.733) R2 = 0.97
Two-stage least squares, model I qtsx = -93,169.721 - 38,916.032 Pt8 + 26,829.143 Ptm + 1,914.561 It- 1.252 Ft
(23,400.571) (15,971.837) (304.817) (1.012)
Two-stage least squares, model II qtsx = -90,960.804- 5,429.574 Pt8 + 1,887.329 It- 1.123 Ft
( 11,322.413) ( 281.252) ( 0.932)
Two-stage least squares, model III qtsx = -96,711.512- 20,511.040 Pt8 + 13,214.584 Ptm + 1,895.016 It- 1.155 Ft
( 18,256.411) ( 11,939.065) ( 287.921) ( 0.954)
Two-stage least squares, model IV qtsx = -92,917.220- 4,837.053 Pt8 + 1,884.926 It- 1.109 Ft
( 11,958.409) (298.660) ( 0.989)
The export bean demand equation is specified in two ways-with and without the price of soybean meal. In models I and III, the meal price is included, but it is excluded in models II and IV.
The relationship between exports and bean price is negative, as expected, although the coefficient is not large relative to its standard error in models II and IV. The positive relation between bean exports and meal prices (models I and III) indicates that U.S.
Export Oil Demand (equation 10)
Ordinary least squares, models I - IV
beans and meal compete in foreign outlets as livestock feed sources. The negative coefficients on foreign feed grain production indicate a competitive relation between U.S. soybeans and other livestock feed sources.
The increasing demand for soybean products in foreign nations is closely associated with increases in the income index computed specifically for this analysis. This relationship is evident in all versions of the export bean demand equation.
qtox = -15.576- 9.797 Pt0 + 5.247 It- 0.201 qtoxpl- qtcox ( 11.456) ( 2.065) ( 0.224)
R2 = 0.69
Two-stage least squares, models I and II qtox = -212.665 - 7.899 Pt0 + 6.895 It- 0.312 qtoxpl - qtcox
(14.914) (2.055) (0.244)
Two-stage least squares, models III and IV qtox = -211.557- 7.950 Pt0 + 6.897 It - 0.312 qtoxpl- qtcox
( 15.707) ( 2.165) ( 0.257)
Because of the complexity of international fats and oils markets, commercial demand for U.S. soybean oil exports was difficult to measure. In the formulations presented here, all estimated coefficients display appropriate signs, but the overall fit is not exceptionally good.
Commercial oil exports appear to respond negatively to price change, as expected, but the coefficients estimated by OLS or TSLS are not large in comparison with their standard errors. Cottonseed oil again was regarded as highly substitutable for soybean oil and entered with an a priori coefficient of
-18-

-1.0. In the OLS formulation, the concessional ex
ports of soybean oil exhibit a competitive relation with
commercial sales, but the coefficient is not large relative
to its estimated standard error. However, this relationship is more pronounced in the TSLS versions.
Export Meal Relation (equation 11)
Ordinary least squares, models I - IV
Much of the explained variation in the oil export demand resulted from the positive impact of the specially constructed income index that acts as a demand shifter. About 69 percent of the variation in commercial soybean oil exports is associated with variation in the specified variables under the OLS procedure.
qtmx = -10,009.763 + 0.077 qtmp + 0.033 Ltw- 0.054 Ft
( 0.079) ( 0.014) ( 0.035) R2 = 0.82
Two-stage least squares, models I and II qtmx = -9,854.156 + 0.082 qtmp + 0.033 Ltw- 0.054 Ft
( 0.103) ( 0.018) ( 0.045)
Two-stage least squares, models III and IV qtmx = -9,849.166 + 0.082 qtmp + 0.033 Ltw- 0.054 Ft
( 0.109) ( 0.019) ( 0.048)
As mentioned in the preceding section, it was not possible to establish an acceptable empirical relationship between total meal exports and meal prices within the framework of this model, although exhaustive preliminary analyses were made. However, meal exports were incorporated into the simultaneous structure of the model through a relation with meal production. This alternative formulation explains much
of the variation in meal exports in relation to changes in world livestock units and world feed grain output.
A substantial positive relation is exhibited between meal exports and livestock units, as would be anticipated. On the other hand, a moderately strong competitive relationship between feed grain production and meal exports emerged. In total, the OLS equation explained about 82 percent of the annual variation in soybean meal exports.
Change in Commercial Bean Stocks (equation 12)
Ordinary least squares, models I - IV St8 = -8,605.380 + 1,008.000 Pt8 - 25.420 St0 - 0.717 St8 + 0.035 qtss
( 2,831.300) ( 5.654) ( 0.203) ( 0.007) R2 = 0.83
Two-stage least squares, models I and II St8 = -7,252.481 + 776.138 Pt8 - 16.810 St0 - 1.324 St8 + 0.042 qtss
( 5,218.401) ( 10.566) ( 0.240) ( 0.012)
Two-stage least squares, models III and IV St8 = -6,852.414 + 647.898 Pt8 - 18.798 St0 - 1.332 sts + 0.042 qtss
( 5,512.837) ( 10.475) ( 0.254) ( 0.013)
In all versions of this behavioral equation, the estimation results from OLS and TSLS are similar. Although a weak relationship emerges between commercial soybean stock changes and bean prices, the coefficients on the other variables are rather large in relation to their estimated standard errors.
Increases in soybean oil stocks are associated with decreases in bean stocks. This relationship is reasonable, since oil can be held either as the processed product or in the bean form. Similarly, increased open-
ing bean stocks at the start of a crop year lead to decreases in the net stock of beans over the year. The same is true of an increase in total bean supplies. A given change in opening bean stocks has a substantially larger impact on bean stock changes than does an equivalent change in quantity supplied. In the OLS version of this equation, approximately 82 percent of the fluctuation in bean stock changes was associated with the specified variables.
-19-

Change in Commercial Oil Stocks (equation 13)
Ordinary least squares, models I - IV St0 = 561.425 + 11.890 pt + 0.214 qtop- 0.010 St"- 0.540 St0 - 0.302 qtoxpl
( 8.8l0) ( 0.077) ( 0.005) ( 0.224) ( 0.201) R2 = 0.73
Two-stage least squares, models I and II St0 = -101.330- 0.118 Pt0 + 0.094 qtop- 0.661 St0
( 16.738) ( 0.080) ( 0.329)
Two-stage least squares, models III and IV St0 = -65.040- 1.603 Pt0 + 0.087 qtop- 0.644 St0
(17.772) (0.085) (0.350)
Preliminary investigation of the oil stock change relationship resulted in the interesting OLS equation shown above. This equation indicates a positive net relation of oil stock changes with price, a negative relation with commercial bean stock changes (to correspond with similar results in the bean stock equation), a positive relation with oil production and opening oil stocks, and a negative relation with concessional oil exports under PL 480. As might be expected, the impact of opening oil stocks on stock changes during the ensuing crop year is larger than the less direct impacts of change in oil production or PL 480 oil shipments. Over 73 percent of the variation in oil stock changes was accounted for by the specified variables in OLS estimation, and each
Demand Elasticities Implied by the Structural Results
Economists often find it useful to convert results of linear demand and supply estimates to elasticities. The relevant demand elasticity estimates for model III ( TSLS) were. computed from the estimated structural slope coefficients and data averages for the 1960-64 period. These figures differ slightly from those computed at the overall data means but are regarded as more appropriate since they reflect the relationships for a recent period in this rapidly growing sector.
The estimated domestic demand elasticity for meal is -.33, compared with a -.56 figure indicated in research recently published by ERS, USDA.14 Another recent study by Vandenborre indicates an elasticity of -.28 for domestic soybean meal.15
The domestic demand elasticity for soybean oil is estimated at -.51, compared with -.45 computed by Vandenborre.16 The export demand elasticity of soy-
estimated coefficient was large in relation to its standard error.
However, under the TSLS procedure, these rather neat results were not maintained. The coefficient on price became negative and weak relative to its standard error. In addition, the reciprocal relation with bean stocks and the negative relation with PL 480 oil exports disappeared. Hence, the TSLS equations for models I-IV contain only price, opening oil stocks, and oil production. The coefficients on the latter two variables compare well to each other and are large relative to their standard errors. This particular relationship warrants further study, though the OLS formulation may be useful by itself.
bean oil is estimated in model III at a very low -.15. Using these demand elasticity estimates for meal
and oil together with a relationship linking the elasticities of these joint products with the elasticity of the basic product, the farm level demand elasticity of soybeans for processing is -.35, assuming an average crushing and handling margin of 25 cents per bushel.17
This elasticity coefficient is almost identical with the farm level export elasticity of -.32 indicated by model III.
·All four models revealed a highly inelastic export demand with respect to price change for soybean oil, from -.15 to -.18. This, together with the difficulty in establishing a significant price-quantity relation for meal exports, suggests that during the sample period the demand shifters in foreign markets overrode the price influences sufficiently so that when estimated, price-quantity relationships appeared highly inelastic. In a subsequent modification of the model for predictive purposes, the export elasticities for the two prod-
1• Malcolm Clough, "Major Factors Influencing High-Protein Feed Prices," Feed Situation, ERS, USDA, Apr. 1966, p. 26. This elasticity estimate is computed as the reciprocal of the pri'ce flexibility coefficient reported in this study.
15 R. J. Vandenborre, "Demand Analysis of the Markets for Soybean Oil and Soybean Meal," /. Farm Econ., Vol. 48, No. 4, Part I. Nov. 1966, p. 930.
16 Ibid., p. 929. Price elasticity estimates for a product with such a close substitute as soybean oil depend importantly upon the specification of the demand equation and whether price or quantity is placed in the dependent position. When price is dependent, the implied elasticities are much higher than when quantity is dependent. See, for example, J. P. Houck, Demand and Price Analysis of the Soybean Market, Tech. Bull. 244, Univ. of Minn. Agr. Exp. Sta., 1963, p. 35.
17 J. P. Houck, "Price Elasticities and Joint Products," J. Farm Econ., Vol. 46, No. 3, Aug. 1964, pp. 652-56.
-20-

ucts are increased to allow for the price responsiveness that seems likely to prevail in the future.
Reduced Form Equations
The estimated behavioral equations together with the physical and technical relationships (table 1) make up the complete estimated structure. There are 13 jointly determined variables and 13 equations in all four models, so the system is complete. It is well known that the equations of such a system can be manipulated algebraically so that each of the jointly determined variables is expressed as a linear function of all the predetermined variables. These latter equations are called the reduced form of the system.
The coefficients of the solved reduced form equations preserve all of the physical and technical relationships (identities) that are built into the structure. For example, the quantities of soybeans demanded for crushing, export, and storage each year are equal to the marketed supply. Any change in the supply (a predetermined variable) will be apportioned exhaustively among the three market outlets (jointly deter-
19, 000 Milllo11pounds
18,000
17,000
16,000
15,000
14,000
13,000
12,000
11,000
10,000
9,000
8,000 ........ /
1946 47 48 49 so 51 52 53 54 55 56 57 58 59 60 61 62 63 64
Figure 5. Quantity of soybean meal demanded, actual and computed from reduced form, model Ill, two-stage
least squares, 1946-64. 20, 000 Thou•andbushls
-24,000
Figure 7. Net additions to commercial stocks of soybeans, actual and computed from reduced form, model
Ill, two-stage least squares, 1946-64.
mined variables). Similarly, any change in domestic crushing will alter the production of oil and meal according to the yield factors, and this change will be apportioned among the domestic and export outlets for these products. In short, the reduced form coefficients measure the net impact on a given jointly determined variable of an isolated one-unit increase in each of the predetermined variables while maintaining the relationships among variables implicit in the struc-ture. ·
Tables C-1 through C-8 in appendix C contain the complete set of reduced form coefficients for all four models under both the OLS and TSLS estimations of the behavioral equations. To assist the reader in visualizing the simultaneous operation of the system, a set of time series charts (figures 5-17) illustrates the actual versus the computed values of the jointly determined variables over the sample period for the TSLS estimates of model III. Time series charts for the other estimated versions of the simultaneous model are similar to this set and are not included. These computed values were obtained by multiplication of the solved reduced form coefficients and the sample data· for the predetermined variables.
Million pounds
4,900
4,500
1,300
- ~ g • ~ ~ ~. ~ M B M g $ • M ~ ~ U M Vec;~r
Figure 6. Quantity of soybean oil demanded, actual and computed from reduced form, model Ill, two-stage least
squares, 1946-64.
500 Millionpounds
400
""" 1946 47 48
Figure 8. Net additions to stocks of soybean oil, actual and computed from reduced form, model Ill, two-stage
least squares, 1946-64.
-21-

200,000
180,000
160,000
140,000
120,000
100,000
80,000
60,000
40,000
20,000
Thousandbu5hels
/
,,-·-'
,,' ActliCII
~ Q ~ • S • D D M B ~ g ~ ~ W ~ ~ ~ M v~,
Figure 9. Quantity of soybeans exported, actual and com· puted from reduced form, model Ill, two-stage least squares,
1946-64.
3,900
3,600 Millionpoundsr
3,300
3,000
2,700
2,400
2,100
1,800
1,500
1,200
900
600
300
1946
Computed 11
, .... ' , ...... ../' ' ,
v
I ---...
I I
,~
I I
I' I ',
,' ',, I
I --
• • • D D M B ~ g ~ B 60 ~ ~ ~ M v~,
Figure 11. Quantity of soybean meal exported, actual and computed from reduced form, model Ill, two-stage leas·l
squares, 1946-64.
10,0
8,0
6,0
4,0
2,0
- Q ~ • • • D D M B ~ g ~ B 60 ~ a ~ M Year
Figure 13. Price of soybean oil, actual and computed from reduced form, model Ill, two-stage least squares, 1946-64.
SOO Millianpounds
700
600
500
400
300
200
100
i I
I
I I
I
,,---J
- 0 ~ • S • D D M B ~ g ~ B W ~ ~ ~ M Year
Figure 10. Quantity of soybean oil commercially exported, actual and computed from reduced form, model Ill, two
stage least squares, 1946-64.
5,2 Cents per pound
4.8
4,4
3,6 J- ......
3,2 I \
I 2,8 I vi
I 2,4 ' I .. , __ J
2,0
1.6
1,2
0,8
1946 Q ~ • 50 • D D 54 55 ~ 57 ~ • 60 ~ • ~ M Year
Figure 12. Price of soybean meal, actual and computed from reduced form, model Ill, two-stage least squares,
1946-64.
4_4 Dallarsperbushal
4,0
3,6
3,2
2,8
1.6
1.2
0.9
0.4
- Q ~ • 60 • D D M ~ ~ g ~ B ~ ~ a ~ M y~,
Figure 14. Price of soybeans, actual and computed from reduced form, model Ill, two-stage least squares, 1946-64.
-22-

5, 400 Million pound;
5,000
4,600
4, 200
3,800
3,400
3,000
2,600
2, 200 I
// ...... _,' 1,800 .......... //
1,400
/ Actuol ///Computed
/ /
,/
l'--.-----.----.-.--.-.-.----.--.----.--.--.-.---.---.-----.--.-.. ~ 1946 47 48 49 50 51 52 53 54 55 56 57 58 59 60 61 62 63 (,~
Year
Figure 15 (above, left). Quantity of soybean oil produced, actual and computed from reduced form, model Ill, two~
stage least squares, 1946-64.
Figure (above, right). Quantity of soybean meal produced, actual and computed from reduced form, model Ill, two
stage least squares, 1946-64.
Figure 17 (right). Quantjty of soybeans crushed, actual and computed from reduced form, model Ill, two-stage least
squares, 1946-64.
?~, OOO Million poumh
22,000.
20,000
1[',000.
1&,000
14,000 Actual
12,000
10,000
6,000
1946 41 43 49 :.o 51 52 53 54 55 56 57 58 59 60 61 62 63 64
Thomand bushels 520
430
440
40C.
360
320
:ao
240
200
160
1946 47
Year
Actual //
/ Computed
///
•/
49 50 51 52 53
Analysis and Projection with the Simultaneous Model
Both partial equilibrium analyses and annual projections to the 1970-71 crop year are developed in the following section. In neither case, however, is an exhaustive set of analyses or projections attempted. The objective is to illustrate, through selected examples, the usefulness of the model in studying questicm w"th economic and policy implications.
For one series of analyses and projections, the statistically estimated coefficients were adjusted in order to incorporate additional assumptions about market behavior. The modifications are discussed as they arise.
Partial Equilibrium Illustrations
The solved reduced form equations of th0 four models can be used to investigate the impact of selected changes in each of the predetermined variables on 13 jointly determined variables. In the
solved reduced form equations, each jointly determined variable is expressed as a function of all predetermined variables in the system. The reduced form coefficients preserve all of the physical and technical identities built into the structural equations. Hence, the estimated impact of an isolated change in any of the predetermined variables on the jointly deter~ mined variables is captured in the reduced form coefficients, all simultaneous relationships having worked themselves out and all else remaining constant. These partial equilibrium illustrations are not predictions of projections, but they are useful in tracing the consequences of specific changes in predetermined variables on the jointly determined variables.
Using the Models as Estimated
Five illustrations are presented in tables 2-6. Results from each of the four estimated models are given in order to show the range of estimated outcomes.
-23-

Supply increase. The figures in table 2 indicate the impact on the 13 jointly determined variables when the markets are forced to absorb an extra 10 million bushels of soybeans without any changes occurring on the demand side. The low elasticities of demand implied by the direct price-quantity slope coefficients produce substantial price effects in farm level bean prices. The models indicate that most of the additional beans are crushed domestically, although some export increases occur. The price declines induce additional domestic disappearance of meal and oil as well as some increases in commercial exports of both products, PL 480 oil shipments remaining constant. Similar but opposite changes would occur if supplies were reduced by 10 million bushels.
Change in PL 480 oil shipments. The impacts of a 200-million pound increase in concessional soybean oil shipments under PL 480 are indicated by the figures in table 3. Again, no other changes in the system are introduced. Prices of oil and beans increase, but meal prices drop a little in some versions and increase a little in other versions. These increased oil exports under PL 480 are associated with consistent decreases in both bean and commercial oil exports.
The figures in table 4 suggest the consequences of abandoning the PL 480 oil export program with no other changes occurring. Substantial drops in oil . prices occur, but rather modest changes in meal prices help to soften the impact on farm level bean prices. About 40-60 percent of the oil previously moving abroad under the program would move into domestic
Table 2. The impact on jointly determined variables of an increase in soybean supply by 10 mil-lion bushels
Model I Model II Model Ill Model IV
Variable Units OLS TSLS OLS TSLS OLS TSLS OLS TSLS
qtmd = U.S. meal demand ... ... mil.lbs. +378.9 +384.5 +381.0 +389.7 +398.1 +419.0 +387.8 +396.7 qtod = U.S. oil demand ......... mil.lbs. + 74.0 + 84.4 + 74.4 + 85.5 + 76.2 + 91.0 + 74.8 + 86.2 Sts =bean carryout ..... mil. bu. 0.2 + 0.1 0.2 + 0.1 0.3 + 0.1 - 0.2 + .1 St0 = oil carryout ....... mil.lbs. + 11.5 + 9.1 + 11.6 + 9.2 + 14.9 + 9.8 + 14.5 + 9.3 qtsx = bean exports ..... .............. mil. bu. + 1.5 + 1.0 + 1.5 + 0.9 + 1.2 + 2.4 +. 1.4 + .7 qtox = commercial oil exports mil. lbs. + 8.5 + 2.5 + 8.5 + 2.6 + 7.1 + 3.7 + 6.9 + 3.5 qtmx = meal exports ...... mil.lbs. + 31.6 + 34.3 + 31.8 + 34.8 + 33.0 + 37.4 + 32.3 + 35.4 Ptm = meal price ........................... $/ton* 5.60 4.00- 5.60 4.00 5.80 4.60 5.80- 4.40 pt =oil price ¢/lb. 0.9 0.6 - 0.9 0.6 0.7 0.5 0.7 0.4 Pt" = bean price ........... .. $/bu. 0.23 0.16- 0.23 0.17 0.22 0.16 0.21 - 0.15 qtop =oil production .......... mil.lbs. + 94.1 + 96.0 + 94.6 + 97.3 + 98.2 + 104.6 + 96.3 + 99.0 qtmp = meal production . . mil. lbs. +410.6 +418.9 +412.8 +424.5 +428.4 +456.4 +420.2 +432.1 qtsc = bean crush ........................ .. mil. bu. + 8.7 + 8.9 + 8.7 + 9.0 + 9.1 + 7.5 + 8.8 + 9.2
* Meal price is in cents per pound in the reduced form equations.
Table 3. The impact of an increase in PL 480 shipments of soybean oil by 200 million pounds
Model I Model II Model Ill Model IV
Variable Units OLS TSLS OLS TSLS OLS TSLS OLS TSLS
qtmd = U.S. meal demand . ...... mil.lbs. + 5.6 +206.3 45.3 + 25.4 12.6 + 62.9 53.7 + 11.9 qtod = U.S. oil demand . ..mil. lbs. 82.4 -118.5 91.6 -158.2 84.7 -117.5 92.1 -128.6 St" = bean carryout ............ .... mil. bu. + 1.8 * + 1.9 + 0.1 + 1.8 * + 2.0 + 0.1 Sto = oil carryout ..... mil.lbs. 66.6 + 4.7 68.9 + 0.4 70.3 + 0.4 72.4 0.8 qtsx = bean exports .... .......... ... mil. bu. 1.9 4.7 0.8 0.7 1.6 1.5 - 0.7 0.3 qtox = commercial oil exports mil. lbs. 49.7 34.7 50.7 35.9 48.1 67.2 - 48.7 67.7 qtmx =meal exports ..................... mil. lbs. + 0.5 + 18.4 3.8 + 2.3 1.1 + 5.6 4.5 + 1.1 Ptm. = meal price .......................... $/tent 0.08 2.15 + 0.67 0.26 + 0.19 0.70 + 0.80 0.13 Pt0 =oil price ........... .. ..... ¢/lb. + 1.0 + 1.0 + 1.1 + 1.2 + 0.8 + 0.6 + 0.9 + 0.7 Pt" =bean price ........... $/bu. + 0.10 + 0.05 + 0.13 + 0.1 + 0.09 + 0.05 + 0.11 + 0.07 qtop = oil production .. ....... mil.lbs. + 1.4 + 51.5 11.2 + 6.3 3.1 + 15.7 13.3 + 3.0 qtmp =meal production .............. mil. lbs. + 6.1 +224.7 - 49.1 + 27.7 13.7 + 68.5 58.2 + 13.0 qt•c = bean crush ... ................... mil. bu. + 0.1 + 4.7 1.0 + 0.6 0.3 + 1.4 1.2 + 0.3
* Negligible. t Meal price is in cents per pound in the reduced form equations.
-24-

Table 4. The impact of a decrease in PL 480 shipments of soybean oil by 500 million pounds
Model I Model II Model Ill Model IV
Variable Units OLS TSLS OLS TSLS OLS TSLS OLS TSLS
qtmd = U.S. meal demand ........ mil.lbs. 14.1 -515.7 + 113.3 - 63.5 + 31.6 -157.3 + 134.3 - 29.7 qtod = U.S. oil demand ... ........ mil.lbs. +205.9 +296.2 +229.1 +395.4 +211.9 +293.7 +230.4 +321.4 St" = bean carryout ........... ... mil. bu. - 4.5 + 0.1 - 4.7 0.2 - 4.7 0.1 - 4.9 0.1 Sto = oil carryout ........... mil.lbs. +166.5 - 11.8 +172.2 1.0 + 175.8 1.0 + 181.1 + 2.0 qtsx = bean exports . mil. bu. + 4.8 + 11.7 + 2.1 + 1.7 + 4.0 + 3.7 + 1.8 + 0.8 qtox = commercial oil exports mil. lbs. + 124.1 + 86.9 + 126.8 + 89.8 + 120.2 + 168.0 + 121.9 +169.2 qtmx = meal exports ..................... mil. lbs. 1.2 - 46.1 + 9.4 5.7 + 2.6 14.1 + 11.2 2.7 Ptm = meal price ........................... $/ton* + 0.21 + 5.38 1.68 + 0.65 0.48 + 1.75 2.00 + 0.32 Pt0 =oil price .................... ¢/lb. 2.4 - 2.3 2.7 3.0 2.0 1.5 2.2 1.7 Pt" = bean price ... ..... $/bu. 0.26- 0.12 0.33 0.31 0.23 0.12 0.28 0.17 qtop = oil production .... mil.lbs. 3.5 -128.7 + 28.1 15.9 + 7.8 39.3 + 33.3 7.4 qtmp = meal production ........ mil. lbs. 15.3 -561.7 + 122.7 69.2 + 34.2 -171.4 +145.5 32.4 qtsc = bean crush ..... . mil. bu. 0.3 - 11.9 + 2.6 1.5 + 0.7 - 3.6 + 3.1 0.7
* Meal price is in cents per pound in the reduced form equafo~;.
Table 5. The impact of an increase in index of world income by 5 percentage points
Model I Model II Model Ill Model IV
Variable Units OLS TSLS OLS TSLS OLS TSLS OLS TSLS
qtmd = U.S. meal demand ........ mil. lbs. -356.11 -363.18 -369.52 --381.30 -376.68 -398.63 -378.24 -387.24 95.36 -119.44 - 95.64 -116.96
+ 0.63 + 0.29 + 0.63 + 0.28 qtod = U.S. oil demand .............. mil. lbs. 92.67 - 96.41 95.12 -100.39 St8 =bean carryout ................... mil. bu. + 0.53 + 0.28 + 0.56 + 0.29 st = oil carryout ......................... mil. lbs. 11.35 - 8.61 11.95 9.04 15.56 9.65 - 15.64 9.38 qtsx =bean exports ..................... mil. bu. qtox = commercial oil exports mil. lbs. qtmx = meal exports ...................... mil. lbs. Ptm =meal price ............................ $/ton* Pt0 =oil price ............................. ¢/lb. Pt" = bean price ............................ $/bu. qtop = oil production ........ mil. lbs.
+ 7.61 + 8.07 + 7.89 + 8.48 + 15.60 + 14.35 + 15.32 + 14.23 - 29.71 - 32.44 30.83 34.06 + 5~+ 3~+ 5.49+ 3~ + 1.09 + 0.73 + 1.11 + 0.76 + 0.24 + 0.17 + 0.25 + 0.18 - 88.42 - 90.67 - 91.75 95.19
+ 7.98 + 8.87 + 8.02 + 8.62 + 17.39 + 29.56 + 17.36 + 29.66
31.42 35.61 - 31.55 34.59 + 5.60 + 4.40 + 5.62 + 4.28 + 0.90 + 0.62 + 0.90 + 0.60 + 0.23 + 0.17 + 0.23 + 0.17 - 93.53 - 99.52 - 93.92 - 96.68
qtmp = meal production ............. mil. lbs. -385.82 -395.62 -400.34 -415.36 -408.11 -434.24 -409.80 -421.83 qt"c = bean crush . mil. bu. . - 8.14 - 8.35 - 8.45 - 8.77 - 8.61 - 9.16 - 8.65 - 8.90
*Meal price is in cents per pound in the reduced form equafons.
utilization. The balance would be exported or added to stocks (some TSLS versions show a stock decrease).
Increase in foreign demand. The coefficients in table 5 indicate what happens in the estimated models when the specially constructed world income index increases by five points with no other changes occurring. Price increases occur for all three commodities, although a small decrease in meal exports is indicated in response to reduced crushing of beans. As this income increase is translated into increased demand for meat and other livestock products in foreign countries, the demand for meal exports also would be expected to increase. However, exports of oil and beans respond directly to this income change. A drop in world income would reverse the signs on all these estimated coefficients.
Changes in crushing margin. Table 6 contains the estimated impact of a 10-cent increase in crushing and
handling charges. The results are consistent with the theory of derived demand applied to joint products. Product prices increase a bit and bean prices decline a bit. A decline in domestic crushing is offset by an almost equal increase in bean exports at the lower price.
Other illustrations. Additional partial equilibrium exercises can be performed by using multiples of the coefficients in tables 2-6. The reduced form tables in appendix C can be used to analyze changes in other predetermined variables.
Using a Modified Model
The TSLS estimates of model III were used as the basis for an analytical model that incorporates some a priori assumptions not specified in the original structure of the simultaneous system. These modifications add additional price responsiveness to the meal and
-25-

Table 6. The impact of an increase in crushing margin by 1 0 cents per bushel
Model I Model II Model Ill Model IV
Variable Units OLS TSLS OLS TSLS OLS TSLS OLS TSLS
qtmd = U.S. meal demand . ...... mil.lbs. 66.97 -153.09 19.67 - 18.93 70.00 86.87 20.13 17.34 qtod = U.S. oil demand .. mil.lbs. 13.64 - 33.59 5.02- 4.15 14.03 18.87 5.04 3.78 St" =bean carryout .... .......... mil. bu. .0.02 + 0.03 0.11 0.06 + 0.01 0.005 - 0.10 -- 0.05 Sto = oil carryout ..... ..... mil.lbs. 1.43 - 3.62 + 0.71 - 0.45 - 2.05 2.04 + 0.51 - 0.41 qtsx =bean exports ................. mil. bu. + 1.55 + 3.49 + 0.56 + 0.50 + 1.61 + 2.00 + 0.56 + 0.45 qtox = commercial oil exports mil. lbs. 1.57 1.01 0.58- 0.12 1.30 0.77- 0.47- 0.45 qtmx = meal exports . . mil.lbs. 5.59- 13.67 - 1.64- 1.69 5.84 7.76- 1.68- 1.55 Ptm = meal price . .... $/ton* + 1.00 + 1.60 + 0.29 + 0.20 + 1.04 + 0.96 + 0.30 + 0.19 Pt0 =oil price .......... ..... ¢/lb. + 0.16 + 0.25 + 0.06 + 0.03' + 0.13 + 0.10 + 0.05 + 0.02 Pt" = bean price ...... ......... $/bu. 0.06- 0.03- 0.09 0.09 0.06 0.07 0.09 0.09 qtop = oil production .. .... mil.lbs. 16.63 - 38.22 - 4.88 4.73 17.38 21.69 5.00 4.33 qtmp = meal production ........ mil. lbs. 72.56 -166.76 21.31 20.62 75.84 94.63 21.81 18.89 qtsc = bean crush ..... mil. bu. 1.53- 3.52 0.45- 0.44 1.60 2.00 0.46 0.40
* Meal price is in cents per pound in the reduced form equations.
Table 7. Partial equilibrium analyses using modified model
Increase supply
Variable Units (10 mil. bu.).
qtmd = U.S. meal demand .. .......... mil.lbs. +345.1 qtod = U.S. oil demand . ............ mil.lbs. + 79.6 St" = bean carryout ... ................ mil. bu. + .5 Sto = oil carryout .. ............. mil.lbs. + 9.4 qtsx = bean exports ..... ................ mil. bu. + .3 qtox = commercial oil exports ........ mil. lbs. + 11.1 qtmx = meal exports ........................... .... mil.lbs. + 91.5 Ptm = meal price............ . .................... $/tent 3.60 Pt0 =oil price ....... ............ ¢/lb. .4 bt" = bean price ... .................... $/bu. .13 qtop = oil production ............................. mil. lbs. + 100.1 qtmp = meal production ...... .... mil.lbs. +436.6
......... mil. bu. + 9.2 qtsc =bean crush
* Negligible. t Meal price is in cents per pound in the reduced form equations.
oil export equations. In this modification, the following coefficient adjustments were made:
I. The slope coefficient on Pt0 in the oil export equation was changed from -7.899 to -26.984. This change adjusts the implied export price elasticity to the level of the 1960-64 average domestic oil demand elasticity, -.51. To offset this adjustment, the coefficients on It and qtoxpl in the export oil equation were changed to + 7.428 and - .088, respectively.
2. A direct price-quantity term was added to the meal export equation. This term is -260.458 Ptm and is consistent with the 1960-64 average domestic meal demand elasticity of -.33. To offset this addition, the coefficients on qtmP, Ft> and Ltw were adjusted to +.096, -.050, and -.034, respectively.
The structural equations incorporating these changes .were manipulated algebraically into the solved reduced form (table C-9, appendix C). Each
Increase Decrease Increase Increase PL 480 PL 480 income index margin
(200 mil. lbs.) (500 mil. lbs.) (5 points) (10¢/bu.)
+ 65.4 -163.5 +342.1 -74.5 -143.8 +359.5 -111.3 -17.2
* * + .3 * + .5 1.25 9.6 - 2.0
1.8 + 4.5 + 8.9 + 2.0 37.6 + 94.0 + 21.6 - 2.4
+ 17.4 43.5 - 90.8 -19.8 .72 + 1.80 + 3.78 + .82
+ .7 1.8 + .6 + .1 + .06 .15 + .15 - .07 + 19.0 47.5 99.2 -21.6 + 82.8 -207.0 -432.8 -94.3 + 1.8 - 4.5 - 9.2 - 2.0
of the five illustrative examples of the previous section were calculated for this revised model (table 7). The partial equilibrium results for these illustrations are similar to those of the original TSLS model III except for increased responsiveness of meal and bean exports to price change. Based on a number of criteria, the original and modified versions of TSLS model III may be regarded as the best or most useful of the estimated versions for partial equilibrium analyses. However, both models III and IV are used in the projection exercises that follow.
Projection with the Simultaneous Model
In this section, two versions of the TSLS estimated simultaneous model are used to project the year-byyear development of the soybean and soybean prod-
-26-

uct markets through the 1971-72 crop year. The estimates used for the structural parameters are those of model IV and the modified model III [denoted henceforth as model III (mod. ) ] .
The Models Used The structural version of model IV was used al
most intact because it is slightly less complex than the others and it shows projected results under the most inelastic set of estimated price-quantity coefficients in the export sector. Model III (mod.), on the other hand, displays the highest set of export elasticities.
The only change in model IV for projection purposes was that the coefficient on total bean supplies, qt"", in the bean stock equation was increased from . 042 to .080 to account for the larger bean inventory changes that occurred in the 1965-67 period. This adjustment also was applied to model III (mod.). For both models, it was assumed that carryout meal stocks would amount to 1 percent of the meal production for the crop year. This assumption also is consistent with recent experience.
In order to begin the projections from the current position, both models were set up on the 1965 crop year by adjusting the constants in the structural equa-
tions so that the actual 1965 values of the jointly determined variables, shown in the first column of table 8, can be calculated from the two models. The full set of adjusted behavioral equations for both model IV and model III (mod. ) follows.
U.S. meal demand Models IV. and III (mod.)
qtmd = -26,637.360 - 1,811.593 Ptm - 2.347 qtP + .144 Lt + 3,683.837 qtctv
U.S. oil demand Models IV. and III (mod.)
qtod = -1,090.074- 193.859 Pt0 + .070 Et + 33.032 pb+I - 1.000 qtcod
Export bean demand Model IV .
qtsx = -35,190.182 - 4,837.053 Pt" + 1,884.926 It - 1.109 F1
Model III. (mod.) qtsx = - 47,391.813 - 20,511.040 Pt" + 13,214.584
Ptm + 1,895.016 It- 1.155 Ft
Export oil demand Model IV.
qtox = - 346.209- 7.950 Pt + 6.892 It- .312 qoxpl - 1.000 qtcox
Table 8. Actual 1965 and predicted 1966 values of jointly determined variables using model IV and model Ill (mod.)
Variable Units
Ptm
Pt0
Pt" qtmd
= meal price ... . .. ..... .. ................. . ..................... $/ton = oil price .. .............. .... . ................ ¢/lb. = bean price ................................................................................ $/bu. = U.S. meal demand ... . .. ... .. ... .. . .. mil. lbs.
qtod = U.S. oil demand ..................... ............... ... . ...... mil. lbs. St" = be:an stock change ................ . ............. mil. bu.
mil. lbs. . mil.lbs.
...... mil. bu. mil. lbs.
Stm = meal stock change ........... . St0 = oil stock change ................... . qt"" = bean exports .................................... . qtmx = meal exports . qtox = commercial oil exports .. . . .......... . .. mil. lbs. qtoxpl = PL 480 oil exports .................... . . ........ mil. lbs.
qt"t = total oil exports ............................ . .............. mil. lbs. qtop = oil production ..................................... . ......... mil. lbs. qtmp = meal production ................................. mil. lbs. qt"c = bean crush .................................... . ....................... mil. bu. qt"" = total bean supplyt mil. bu. St" = bean stocks (open) .................. . ... mil. bu.
(close) ..................... . ... . ....... mil. bu. Stm = meal stocks (open) .......................................... . .. mil. lbs.
(close) . ............... . . mil. lbs. St0 = oil stocks (open) ...................................................... .. mil. lbs.
(close) ........ . ............ ........ ..... .. mil. lbs.
*Assumed. t Bean supply is production less feed, seed, etc.
-27-
1965 (actual)
81.50 11.8 2.54
20,395 4,688
+ 5.9 +52 +165 250.6 5,074
647 502
1,149 6,002
25,521 537.5 794.0
29.7 35.6 212 264 297 462
:j: Estimated independently.
Crop year
1966
Model IV Model Ill (mod.)
69.88 76.16 10.6 11.9 2.70* 2.70*
22,007 22,576 5,050 4,788
+36.5 +34.8 +10 +15 +98 +107 261.1 250.2 5,341 5,362
384 395 738 1,118
1,122 1,513 6,270 6,408
27,358 27,953 577.3 589.9 874.9:j: 874.9:j:
35.6 35.6 72.1 70.4 264 264 274 279 462 462 560 569

Model III. (mod.) qtox = -346.209 - 26.984 Pt0 + 7.428 It - .088
qtoxpl _ 1.000 qtcox
Export meal relation Model IV.
qtmx = -8,007.891 + .082 qtmp - .054 Ft + .033 Ltw
Model III. (mod.) qtmx = - 8,128.296- 260.458 Ptm + .096 qtmp
- .050 Ft + .034 Ltw
Commercial bean stock change Models IV. and III. (mod.)
St8 = + 13,550.433 - 647.898 Pt" - 18.798 St0
+ .080 qt"" - 1.322 St"
Oil stock change Models IV. and III. (mod.)
St0 = - 132.636 - 1.603 Pt0 + .087 qtop - .644 St0
The calculated results of both models for the current 1966 crop year are shown in the last two columns of table 8. These results were obtained by inserting the estimated bean supply (less feed, seed, etc. ) and setting the farm level price at $2.70 per bushel. The other 1966 figures in the table are generated by the model, including PL 480 oil shipments, previously a
predetermined variable. The data used for other predetermined variables are projections (see appendix A). . .
The tabular 1966 values for the two models are consistent with the estimated 1966 supply of 874.9 million bushels and a farm price of $2.70 per bushel. Notice the large oil exports required (especially PL 480 shipments) by both models. Neither model indicates an expansion of commercial oil exports over the 1965 level. In addition, oil stocks continue to expand in both calculations.
The Projections Detailed 5-year projections were developed from
these two models encompassing the 1967 to 1971 crop years. The objective of these projections was to examine the behavior of the soybean sector under a variety of price relationships for beans, meal, and oil. Hence, the projections were computed as follows:
1. Specific prices were assumed for soybeans, meal, and oil. Actually, only two of these three prices can be selected independently because of the price-linkage identity and the assumed 25-cent per bushel crushing and handling spread.
Table 9. Model IV-Projected values of jointly determined variables, PL 480 oil exports, and bean sup· plies at meal, oil, and bean prices of $75/ton, 9 cents/pound, and $2.50/bushel, respectively, 1967-1971
Crop year
Variable Unit 1967 1968 1969 1970 1971
Ptm = meal price ... ................................. ........ $/ton 75.00 75.00 75.00 75.00 75.00
Pt0 =oil price .................. ...................... . ... ¢/lb. 9.0 9.0 9.0 9.0 9.0
Pt8 = bean price ............ . ............ $/bu. 2.50 2.50 2.50 2.50 2.50 qtmd = U.S. meal demand ..... mil.lbs. 23,240 24,408 25,497 26,621 27,464 qtod = U.S. oil demand ... ... mil. lbs. 5,470 5,589 5,709 5,828 5,948 St" = bean stock change ............................... .mil. bu. -14.6 +10.0 -11.1 + 3.9 + 1.7 Stm = meal stock change ..... ·························· .... mil. lbs. +15 +14 +13 +14 +14 Sto = oil stock change ............ .................................. ..mil. lbs. +67 +53 +44 +42 +42 qtsx = bean exports ... . .. mil. bu. 273.3 284.6 295.6 306.9 318.1 qtmx = meal exports ................... mil. lbs. 5,574 5,764 6,019 6,241 6,464 qtox = commercial oil exports ... . .......... mil. lbs. 498 478 461 448 434 qtoxpl = PL 480 oil exports* ............................................ mil. lbs. 573 798 1,013 1,216 1,420
--- ---qtoxt =total oil exports ....... . ................................ mil. lbs. 1,071 1,276 1,474 1,664 1,854 qtop = oil production .... .. ..... mil. lbs. 6,608 6,918 7,227 7,534 7,844 qtmp = meal production ................. .......................... mil. lbs. 28,829 30,186 31,529 32,876 33,942 qtsc = bean crush ....................................................... ..... mil. bu. 608.4 637.0 665.4 693.8 722.3 qtss = total bean supply* ....................................... mil. bu. 867.1 931.6 959.9 1,004.6 1,042.1
St" = bean stocks (open) ........................................... mil. bu. 72.1 57.5 67.5 66.4 70.3 (close) .... ··················· ...... mil. bu. 57.5 67.5 66.4 70.3 72.0
Stm = meal stocks (open) ............................................... mil. lbs. 274 289 303 316 330 (close) . .......................................... mil. lbs. 289 303 316 330 344
St = oil stocks (open) ................................................... mil. lbs. 560 627 680 724 766 (close) ............................................. mil. lbs. 627 680 724 766 808
* Required to sustain the given price relationships. Bean supply is production less feed, seed, etc.

Table 10. Model Ill (mod.)-Projected values of jointly determined variables, PL 480 oil exports, and bean supplies at meal, oil, and bean prices of $75/ton, 9 cents/pound, and $2.50/bushel, respectively, 1967-1971
Variable
Ptm = meal price .. Pt0 = oil price . Pt8 = bean price .. qtmd = U.S. meal demand . qtod =U.S. oil demand . St8 = bean stock change .. Stm = meal stock change .. St0 = oil stock change . qtsx = bean exports .. qtmx =meal exports .. qtox = commercial oil exports .. qtoxpl = PL 480 oil exports*
Unit
..... $/ton ········ ............. ¢/lb.
................ $/bu. . mil. lbs.
. ....... mil. lbs. . ............ mil. bu.
..mil. lbs. mil. lbs.
...... ...... mil. bu. . ....... mil. lbs.
. ... mil. lbs. mil. lbs.
qtoxt = total oil exports ..... mil. lbs. qtop = oil production .. .. .. mil. lbs. qtmv = meal production .. . ............... mil. lbs. qtsc = bean crush ...... .. .................. mil. bu. qt88 =total bean supply* .......................................... mil. bu. St8 =bean stocks (open) . .. ... mil. bu.
· (close) ....... . .. mil. bu. Stm =meal stocks (open) ........................................ mil. lbs.
(close) .... . .......... mil. lbs. St0 = oil stocks (open) . ...... .. ....................... mil. lbs.
(close) . mil. lbs.
1967
75.00 9.0 2.50
23,240 5,470
-10.0 +12 +65 269.5 5,760
578 536
1 '114 6,649
29,012 612.3 871.8 70.3 60.3
278 290 569 634
1968
75.00 9.0 2.50
24,408 5,589
+ 8.4 +14 +52 280.7 6,021
616 719
1,335 6,976
30,443 642.5 931.6
60.3 68.7
290 304 634 686
Crop year
1969 1970
75.00 9.0 2.50
25,497 5,709
.2 +14 +45 292.0 6,278
657 874
1,531 7,285
31,789 670.8 962.6
68.7 68.5
304 318 686 731
75.00 9.0 2.50
26,621 5,828
+ 3.6 +14 +44 303.2 6,539
697 1,034
1,731 7,603
33,17 4 700.1
1,006.9 68.5 72.1
318 332 731 775
1971
75.00 9.0 2.50
27,749 5,948
+ 1.9 +14 +43 314.4 6,800
734 1 '193
1,927 7,918
34,563 729.4
1,045.7 72.1 74.0
332 346 775 818
* Required to sustain the given price relationships. Bean supply is production less feed, seed, etc. '
2. Fixing the previously jointly determined prices requires that two other independent variables be regarded as determined within the system for projection purposes. They are supply of beans, qtss, and PL 480 oil shipments, qtoxvi.
3. The structural equations, as adjusted, were used to compute simultaneously consistent values for the 10 other jointly determined variables, meal stock changes, bean supplies, and PL 480 oil exports.
4. The values of the 10 jointly determined variables, plus stm, qtss, and qtoxpl are the levels that these variables would have to assume in order to sustain the given price relationships when the other predetermined variables take on the projected values shown in appendix B. The bean supply estimate is then the quantity of soybeans which will be required for domestic crushing, export, and storage at the given bean price. The PL 480 oil estimate is the release valve for oil utilization. It balances disappearance with production at given oil and meal price relationships.
Six alternative sets of price relationships were computed for each of the projection models, model IV and model III (mod. ) . These six (listed below) are only illustrative of the many alternatives that could be examined, but they span a reasonable range of possible prices. Others can be calculated as needed.
Soybeans ( Pt8 )
dollars per bushel L $2.30 2..... 2.50 3.... 2.50 4. .. 2.60 5.... 2.60 6.... 2.75
Meal ( Ptm)
dollars per ton $70.00 70.00 75.00 75.00 79.00 75.00
Oil ( Pt0 )
cents per pound 8.0¢
10.0 9.0
10.0 9.0
11.0
The projection results from alternatives 3 and 4 are shown in tables 9-12. Projection results for the other four alternatives are presented in appendix D.
One of the clearest results emerging from these six · exercises is that soybean supplies required to meet projected market needs (at the assumed prices) increase at a much lower rate than recent advances in U.S. soybean production. The annual projected increase in soybean market requirements is about 35 million bushels per year in all versions of the model. With no change in per acre yields from the 1962-66 average of 24.3 bushels per acre, this amounts to an annual increment of 1.44 million acres. An additional .06 million acres annually will be needed for increases in seed and incidental utilization, bringing the total to 1.50 million acres per year. On the other hand, if
-29-

Table 11. Model IV-Proiected values of iointly determined variables, PL 480 oil exports, and bean supplies at meal, oil, and bean prices of $75/ton, 10 cents/pound, and $2.60/bushel, respec· tively, 1967-1971
========================~-=================================
Variable Unit
Ptm = meal price ....... $/ton Pt0 = oil price ..... ............ ... .. ... ¢/lb. Pt" = bean price .... .. ..... ... .. ... . $/bu. qtmd = U.S. meal demand ..... . .. ........ mil. lbs. qtod = U.S. oil demand ........ ... mil. lbs. St" = bean stock change ..... . Stm = meal stock change . St0 = oil stock change ............ . qt"x =bean exports .. qtmx =meal exports ...................... . qtox = commercial oil exports qtoxpl = PL 480 oil exports* ................. .
. .......... mil. bu. mil. lbs. mil. lbs. mil. bu. mil. lbs. mil. lbs. .mil. lbs.
qtoxt = total oil exports ............. mil. lbs. qt0P = oil production ..... . ...... mil. lbs. qtmp = meal production ................ ,....... mil. lbs. qt"c = bean crush ............................ mil. bu. qt"" = total bean supply* ...... mil. bu. St" = bean stocks (open) ......... mil. bu.
(close) ............ ... .. mil. bu. Stm = meal stocks (open) .................... . mil. lbs.
(close) .... . . .... mil. lbs. St0 = oil stocks (open) ............................... mil. lbs.
(close) .............. mil. lbs.
1967
75.00 10.0 2.60
23,240 5,276 ~14.6
+15 +65
272.8 5,574
398 868
1,266 6,607
28,829 608.4 866.6 72.1 57.5
274 289 560 625
1968
75.00 10.0 2.60
24,408 5,396 + 9.9 +14 +51
284.1 5,764
378 1,093
1,471 6,918
30,186 637.0 931.0 57.5 67.4
289 303 625 676
Crop year
1969
75.00 10.0 2.60
25,497 5,515
- 1.0 +13 +44
295.1 6,019
361 1,306
1,667 7,226
31,529 665.4 959.5 67.4 66.4
303 316 676 720
1970
75.00 10.0 2.60
26,621 5,634 + 3.9 +14 +42 306.4 6,241
348 1,510
1,858 7,534
32,876 693.8
1,004.1 66.4 70.3
316 330 720 762
1971
75.00 10.0 2.60
27,749 5,754
+1.7 +14 +42 317.7 6,464
335 1,714
2,049 7,845
34,227 722.3
1,041.7 70.3 72.0
330 344 762 804
* Required to sustain the given price relationships. Bean supply is production less feed, seed, etc.
acreage remains constant, yields would have to increase about 1 bushel per acre per year to meet indicated needs. Actual supplies in excess of the indicated requirements will exert downward pressure on prices in line with the partial equilibrium analyses of the previous section.
Even with actual bean output equal to the indicated requirements, the more rapid projected growth in meal markets as compared with oil markets suggests that some form of export disposal will be required for large quantities of oil. Some of these projections run more than two or three times the 1965 level. Although commercial oil exports are projected to decline in model IV and increase only slightly in model III (mod.), the total export requirement for soybean oil increases strongly in both models. This is because domestic oil markets are projected to grow slowly from present levels while oil production grows in relation to the increase in meal demand and production. The size of the required PL 480 oil committment at all assumed price relationships suggests that bean prices at current levels will be difficult to sustain unless ( 1 ) some major unforeseen increase in meal or commercial oil demand develops, ( 2) a drop in bean output occurs, ( 3) a major departure from historical oil-meal
price relationships develops, with meal prices increasing and oil prices dropping dramatically, or ( 4) concessional oil sales can be expanded as required in the higher price projections.
Assuming that a sizable quantity of oil can be exported in one form or another and that 1971 farm prices for soybeans approximate the 1965 level, the total farm level value of soybeans will climb from $2 billion in 1965 to about $2.6 billion in 1971. The value of domestic crushing will increase from $1.4 bi~lion to $1.9 billion, and bean export values will move from $.6 billion to $.7 billion.
The projections indicate that at fairly constant bean prices, whole bean exports will take about 31 percent of market supplies throughout the 1967-71 pericd. Meal exports will continue to account for about 20 percent of meal supplies. However, oil exports, commercial and concessional, are projected to grow from the current 19 percent of production to 25-28 percent. If sufficient oil cannot be exported, then downward pressures on oil and bean prices will develop in line with the partial equilibrium analyses cf the previous section.
Stocks of soybeans in commercial hands will not change much from present levels. Meal stocks, as pipe-
-30-

line requirements, will increase in relation to production, but oil stocks will grow a total of about 200-250 million pounds between 1967 and 1971, according to these projections.
The overall growth in the demand for U.S. soybeans in terms of requirements for the 1967-71 period at stable prices is estimated at 4-5 percent per year. Meal markets will grow at a similar rate, but commercial oil markets in the United States and overseas are projected to grow 1-2 percent per year. If forces beyond these levels exist, this study was unable to uncover them or measure their impact.
However, there are some other factors working against expansion in soybean product markets which this study also was unable to measure directly. For example, the development of protein rich feed ingredients made from urea and high lysine corn varieties may retard the growth in soybean meal demand in the United States and abroad. Some USDA evidence in-
dicates that U.S. sales of feed grade urea more than doubled in the 1955-63 period.18 A recent survey by the USDA indicates that more than 50 percent of the nation's cattle and calves on feed in April 1966 received some urea in their rations. Although the precise amounts being fed have yet to be established, total utilization of urea for feed now may be in excess of 2 million tons, as compared with the 1966 U.S. soybean meal disappearance of 10.2 million tons. With current price relationships, urea utilization in feed can be expected to expand.
Considerations such as these must be kept in mind when interpreting and using projections based primarily on historical experience and relationships.19 By 1970 or 1971, experience may reveal that some of these projections are too high and others too low at the alternative price levels. But, since a rather formal model was used, error sources can be identified and possibly corrected by respecification and re-estimation.
18 Earl F. Hodges, Economic Implications of Urea and Natural High Protein Feeds, Address to American Soybean Congress, ERS, USDA, Aug. 1965.
19 For another series of aggregate projections to 1970 for soybeans and soybean products, see Quentin M. West, Foreign Supply and Demand Projections; Outlook for U.S. Agricultural Exports, paper presented to annual meeting of AFEA, College Park, Md., Aug. 1966, tables 7-9. West's projections are generally higher than those of this study. Total soybean exports for the 1970 crop year projected by the simultaneous model average about 14 percent lower than West's estimate of 353 million bushels (expressed as metric tons, table 7). Simultaneous model projections of total meal exports average about 22 percent below West's 1970 total of 8,158 million pounds (shown in metric tons, table 8). Finally, the simultaneous model projections of total oil exports are generally quite close to West's estimate of 2,062 million pounds in 1970 (shown in metric tons, table 9).
Table 12. Model Ill (mod.)-Projected values of jointly determined variables, PL 480 oil exports, and bean supplies at meal, oil, and bean prices of $75/ton, 10 cents/pound, and $2.60/bushel, re· spectively, 1967-1971
Crop year
Variable Unit 1967 1968 1969 1970 1971
Ptm = meal price . . $/ton 75.00 75.00 75.00 75.00 75.00 Pt0 =oil price . ¢/lb. 10.0 10.0 10.0 10.0 10.0 Pt8 = bean price . $/bu. 2.60 2.60 2.60 2.60 2.60 qtmd = U.S. meal demand . . mil. lbs. 23,240 24,408 25,497 26,621 27,749 qtod = U.S. oil demand . mil. lbs. 5,276 5,396 5,515 5,634 5,754 Sts = bean stock change . . ... mil. bu. -10.1 + 8.4 .2 + 3.6 + 1.7 ·stm = meal stock change . mil. lbs . +12 +14 +14 +14 +14 Sto = oil stock change . mil. lbs. +63 +51 +45 +44 +40 qtsx = bean exports ... mil. bu. 267.5 278.7 289.9 301.1 312.4 qtmx = meal exports . .mil. lbs. 5,755 6,021 6,278 6,539 6,657 qtox = commercial oil exports . mil. lbs. 530 568 609 649 692 qtoxpl = PL 480 oil exports* . . mil. lbs. 779 962 1 '117 1,276 1,402
qtoxt = total oil exports . .. mil. lbs . 1,309 1,530 1,726 1,925 2,094 qtop = oil production .. . mil. lbs . 6,648 6,977 7,286 7,603 7,888 qtmp = meal production . ................... mil. lbs . 29,007 30,443 31,789 33,174 34,420 qtsc = bean crush . mil. bu. 612.1 642.5 670.9 700.1 726.4 qtss = total bean supply* . mil. bu. 869.5 929.6 960.6 1,004.8 1,040.5 St8 =bean stocks (open) . . mil. bu . 70.4 60.3 68.7 68.5 72.1
(close) . .. mil. bu . 60.3 68.7 68.5 72.1 73.8 Stm = meal stocks (open) ..
• n ••••••••••••••• ••••• mil. lbs. 279 291 305 319 333 (close) . .. mil. lbs . 291 305 319 333 347
St0 = oil stocks (open) ................................................ mil. lbs. 569 632 683 728 772 (close) . mil. lbs. 632 683 728 772 812
* Required to sustain the given price relationships. Bean supply is production less feed, seed, etc.
-31-

Regional Export Demand
Exports of U.S. soybeans and soybean products have increased remarkably since the early 1950's. From 1950 to 1965, soybean exports increased 800 percent, meal exports 1,300 percent, and oil exports almost 200 percent.
Before World War II, the world market for soybeans was dominated by Mainland China. In 1965, 89 percent of total world soybean exports originated in the United States. Similarly, 70 percent of the world exports of soybean meal and 80 percent of the world exports of soybean oil during 1965 were from the United States.
For studying the export demand for U.S. soybeans, meal, and oil, the noncommunist world outside the United States was divided into six regions: ( 1) Canada and non-EEC Europe, ( 2) EEC, ( 3) Latin America, ( 4) Africa, ( 5) Asia and Oceania (excluding Japan), and ( 6) Japan. The countries included in each region are listed in appendix E. Combining Canada and nonEEC Europe into a single region, although somewhat arbitrary, made the analyses more convenient and lessened the data problems associated with transshipments through Canadian ports.
Canada, Western Europe, and Japan are the most important customers for U.S. soybeans and soybean meal. This fact is clearly illustrated in table 13, which shows the regional distribution of exports for the 1965 crop year. However, Asia, Latin America, and Africa import the bulk of U.S. soybean oil shipments both commercially and on a concessional basis.
Estimates of Regional Export Demand
In order to estimate demand functions for U.S. exports in the six regions, multiple regression analysis was used. The results of the analyses are summarized in tables 14-16. The time period for each regression also is shown. The following variables were computed separately for each of the six regions and used in the analysis. However, the prices were the same for all regions.20 All data were converted to an October !September 30 crop year basis.
Pts = average price received by U.S. farmers, dollars per bushel. 20
Ptm = average wholesale price of soybean meal, bulk, Decatur, dollars per short ton."0
Pt0 = price of soybean oil, domestic crude, in tank cars at midwestern mills, cents per pound. 20
qtsx = quantity of soybeans exported in thousand bushels. For the years 1960, 1961, 1962, 1963, and 1964, adjustments were made for transshipments through Canadian ports. Data on
Table 13. Percent share of each region in U.S. exports of soybeans and soybean products in 1965 crop year
Oil Oil Region Soybeans Meal (commercial) (PL 480)
percent Canada and non-
EEC Europe .. 30.0 26.2 16.6 1.1 EEC 36.8 61.5 .9 0.0 Japan 24.7 1.3 0.0 0.0 Asia and Oceania 6.4 2.8 38.1 51.3 Latin America .5 2.0 30.1 6.5 Africa 0.0 0.1 10.7 12.9 Other* 1.5 6.1 3.6 28.2
Total ... 100.0 100.0 100.0 100.0
* Mostly Eostern European countries. The figure for Pl 480 oil con· tains substantial quantities of unallocated donations.
re-exports from Canada were obtained from Thomas A. Warden, "Transshipments of U.S. Agricultural Products Through Canada," Foreign Agricultural Trade of the United States, ERS, USDA, Dec. 1966, and various issues of Grain Market News, Grain Division, Consumer and Marketing Service, USDA.
qtmx = quantity of soybean meal exported from the United States, in short tons.
qtox = quantity of soybean oil exported commercially from the United States in million pounds. In this study, barter transactions under Title III of PL 480 are treated as commercial exports.
It = index of national income. These index numbers are based on estimates of national income published by the United Nations in the annual Statistical Year Book and the Monthly Bulletin on Statistics. These estimates were deflated by the Consumer Price Index from the same publications. These estimates were then adjusted from differing fiscal years to uniform OctoberSeptember years on the assumption that the income was uniformly distributed over the year for which it was reported. Then an index number was constructed for each country with 1950 as the base. From these index numbers for individual countries, weighted index numbers were constructed for the six regions. (An index for the world for use in the export demand equations in the simultaneous model also was constructed.) Since the main purpose of the index was for use in the fats, oils, and oilseeds markets, the relative weight for each country in the index reflects its importance in the world fats and oils market. These weights were based on the total imports of food fats and oils
"' It may seem more appropriate to use international or export prices for studying foreign demand. But preliminary analysis showed that various price series were highly correlated with each other. With a few exceptions, discussed as they arise, domestic U.S. prices were used in order to facilitate comparisons with the simultaneous models.
-32-

Table 14. Summary of regression analysis of regional export demand for U.S. soybeans
Equation Time number Region period
L .. .latin America 1955-62
2 .. ........ ...... ..... . .. Asia and Oceania 1950-64
3 ................................ Japan 1951-64
4 ............................ Africa 1953-62
5 .... ... Canada and non-EEC Europe 1950-64
6. ... .. Canada and non-EEC Europe 1950-64
7. .. ... EEC 1950-64
8 .. .................... .. EEC 1950-64
R2
0.85
0.93
0.95
0.59
0.95
0.98 0.96
0.95
Regression*
qt sx = -3,692.181 + 25.880 It (5.872)
qtsx = -4,353.535 + 158.450 It- 344.100 Pt8
(11.944) (2.436) qtsx = 14,073.947 + 208.810 It- 9,489.700 Pt"
(13.271) (2.517) qtsx = 733.234 + 16.570 It- 1,019.000 Pt8
(2.078) (2.904) qtsx = -54,907.143 + 583.790 It
(15.335) log qtsx = -7.394 + 3.773 log It- 1.407 log Pt8
(2.27 4) (5.338) qtsx = -67,102.685 + 575.920 It- 3,501.700 Pt8
(16.349) (0.568) log qtsx = -4.123 + 3.053 log It- 1.419 log Pt8
(13.637) (2.513)
* The figures in parentheses below the regression coefficients are "t" values.
Table 15. Summary of regression analysis of regional export demand for U.S. soybean meal
Equation Time number Region period R2
L .. Latin America 1955-62 0.99361 qtmxt = 2 ... .................... Asia and Oceania 1950-62 0.82868 qtmxt = 3 ................................ Japan 1950-64 0.94004 qtmx§ =
4 ................................ .Japan 1950-64 0.85106 qtlllX§ =
5 .. ..... ......... . Canada and non- qtmx EEC Europe 1950-64 0.73509
6. .. ... EEC 1950-64 0.85331 qtmx
7 .. ............. EEC 1950-64 0.82597 qtmx
8 ... .. .EEC 1950-64 0.76382 log qtmx
* The figures in parentheses below the regression coefficients are "t'' values. t Estimated, for convenience, in terms of actual tons rather than thous~nd tons. :j: Average world export unit values of soybean meal (see appendix E). § Also includes meal equivalent of soybeans exported.
Regression*
-111,652.240 + 0.839 lt - 637.500 Ptm:j: (26.520) (7,556)
-147,117.707 + 0.698lt- 131.200 Ptm:j: (6.735) (0.693)
617.724 + 4.280 It - 293.918 Pts (12.576) (3.283)
85.089 + 0.194lt- 6.960 Pt111
(8.198) (1.807) - 1,562.808 + 0.032 lt - 0.104 Pt111
(5.765) (0.038) -3,840.128 + 0.076 lt- 0.037 Ft
(5.057) (1.500) -3,281.912 + 0.055 lt
(7.858) -249,309 + 25.081 log lt- 5.848 log Pt111
(5.819) (2.300)
Table 16. Summary of regression analysis of regional export demand for U.S soybean oil
Equation Time number Region period
L .. .latin America 1950-62
2 ... . ........ Asia and Oceania 1954-63
3 ... ...... Africa 1954-63
0.57
0.89 q.OX -t -
Regression*
-17.302 + 0.793 It- 3.854 Pt0
(1.808) (0.866) -1,056.488 + 8.7821t -2.400 Pt0
(4.535) (0.098) _ q{ox
0.83 qtox = -334.554 + 4.542 It- 9.375 Pt0
(3.520) (0.937)
* The figures in parentheses below the regression coefficients are "t" values.
-33-

from all sources during the period 1946-63. The data are presented in appendix E.
Lt = livestock units, i.e., cattle, hogs, and poultry in thousands. The data on livestock numbers were obtained from FAO annual Production Year Book. Since these three categories of livestock are not of equal importance in consumption of soybean meal, they were weighted in the ratio of cattle, 1.000; hogs, 0.400; and poultry, 0.025. These weights were based on the feeding ratios in Western Europe. Nonavailability of data prevented the use of different weights for each region. However, since Western Europe is the major importer of U.S. soybean meal, using Western European ratios seems reasonable.
qtcox = quantity of cottonseed oil commercially exported from the United States, in million pounds.
F t = production of feed grains (oats, barley, and corn) in the importing region, in thousand metric tons. Data are from F AO annual Production Year Book.
The results presented in tables 14-16 grew out of extensive preliminary investigation. Generally speaking, price and income are good explanatory variables for soybean export demand. Price and livestock are effective in the meal export equations. However, it was not possible to establish uniform and entirely comparable results for all six regions because of differences in market structures and other factors.
Efforts to establish functional relationships for commercial exports of soybean oil were less successful. A variety of tariff restrictions, special arrangements, and other trade barriers hinder the operation of market forces. 21 In addition, the joint product relationship of meal and oil complicates the analysis. The less rapid growth of commercial oil markets relative to meal demand has resulted in large quantities of oil being placed on international markets by the United States and other major soybean crushing nations, with consequent downward pressures on price. The close substitutability of soybean oil with other oils (both vegetable and animal) and the concessional export sales made to less developed nations added difficulty to the analysis.
Projections
In order to project the quantities demanded of soybeans and soybean products, estimates of future levels of the independent variables were needed. The values were obtained for the years 1975 and 1980 from time series regression analysis. Linear regressions were fitted for the income index and livestock units in each region. The equations used in projections are given in
table 17, and the actual projections are given in table 18.
These projected independent variables were used to estimate regional exports of beans, meal, and oil. Where appropriate, different price levels are assumed and the projected results are shown. For cases where several equations were fitted for the same commodity and the same region, the least complex formulation was used in the projections. In any case, the results were similar in most versions of the regional export equations.
Finally, a set of short term projections to 1970 is presented. The projections are based on methodology that differs somewhat from that used in the long term 1975 and 1980 projections.
These projections indicate that the upward trend in soybean and soybean meal exports will continue. Canada, Western Europe, and Japan will remain the major customers. A brief region-by-region review of the results for each of the soybean commodities follows. The results are summarized and tabulated in the tables that follow.
Soybeans
The regional equations for whole soybean exports are shown in table 14. Using projected values of the independent variables, the 1975 and 1980 export levels were computed at three soybean price levels per bushel-$2.75, $2.50, and $2.30. These projections are shown in table 19.
Canada and non-EEC Europe. Two equations ( 5 and 6, table 14) were fitted for this region's soybean imports. Equation 5 was used for projection purposes, since a useful price-quantity relationship could not be estimated. The export demand for U.S. soybeans here is projected at 79 million bushels in 1975 and 94 million bushels in 1980-all net of transshipments. Although not used in projections because of its multiplicative form, equation 6 indicates a rather high price elasticity of import demand for this region. If substantial price changes occur in the soybean market, future exports to this region might be affected, although a significant price relationship in the linear model did not emerge. In general, however, the continued economic growth in this area probably will spur soybean sales from the United States.
The European Economic Community ( EEC). The EEC leads all other regions as an outlet for U.S. soybeans and soybean products. Equations 7 and 8 in table 14 relate price and income to soybean exports to the EEC. Equation 7, the linear relationship, was used for projection purposes. Table 19 includes the soy-
" Some of these restrictions are considered by R. P. Dahl, "Demand for U.S. Soybeans in the European Common Market: A Case for Optimism,"' ]. Farm Econ., Vol. 47, No. 4, Nov. 1965, pp. 979-92; Dieter Elz, European Economic Community Import Demand for Oilseeds and Oilseed Products-A Summary, ERS-Foreign 170, ERS, USDA, Nov. 1966; Eric R. Berg, Nigeria, Senegal, and the Congo-Projected Level of Demand, Supply, and Exports of Oilseed Products to 1975 with Implications for U.S. Exports to the European Economic Community, Univ. of Alberta and ERS, USDA, Jan. 1967.
-34-

Table 17. Summary of time series regression analysis of indepe~dent variables used to forecast regional export demand for U.S. soybeans and soybean products
Region Time period Dependent variable R2 Regression*
Asia and Oceania ...... 1950-62 Livestock units 0.93071 Lt 217,725.731 + 2,645.000 t (12.160)
Asia and Oceania .................... H0000001950-63 Income 0.97650 It 87.681 + 6.042 t (22.330)
Japan .................... ........ 1951-62 Income 0.94604 It 7 4.492 + 14.570 t (13.250)
Japan ....... 1951-62 Livestock units 0.89254 Lt 3,293.044 + 293.900 t (9.114)
EEC ...... 1950-62 Livestock units 0.97734 Lt 53,949.462 + 1,242.00 t (21.780)
EEC ........ 1950-62 Income 0.99242 It 85.835 + 10.180 t (37.940)
Latin America .... 1950-63 Income 0.98221 It 92.131 + 6.358 t (25.740)
Latin America ........... 1950-62 Livestock units 0.98104 Lt 151,405.962 + 5,854.0 t (23.860)
Africa ................... ··················· ........ 1950-63 Income 0.58607 It 96.649 + 2.225 t (4.122)
Canada and non-EEC Europe ... 1950-63 Livestock units 0.90531 lt 48,739.484 + 1,102.000 t (1 0.71 0)
Canada and non-EEC Europe ... 1950-63 Income 0.98136 It 91.254 + 5.296 t (25.140)
* The figures in parentheses below the regression coefficients ore "t" values.
bean projections for the EEC at three illustrative price levels. At $2.50 per bushel, exports are projected at 126 million bushels in 1975 and 155 million bushels in 1980. At prices lower than $2.75, somewhat larger quantities are projected, and at higher prices somewhat smaller quantities are projected. Notice that the estimated price and income elasticities of U.S. soybean imports by the EEC and by Canada and non-EEC Europe are quite similar (equations 6 and 8, table 14). Substantial increases in exports in the 1965 crop year were not accounted for in these calculations. Hence, these projections may be more pessimistic than is warranted.
Japan. In this analysis, Japan is regarded as a separate region for three major reasons~ First, it is the single largest soybean-importing nation,. with current purchases almost twice as large as any other single nation. Second, large amounts of whole soybeans are used in Japan for human consumption in traditional dishes.22 Third, Japan also imports moderate quantities of soybeans from neighboring Mainland China.23
The demand for U.S. soybean exports to Japan is · estimated by equation 3, table 14. Exports are expressed as a function of price and income. Projected
Table 18. Projected values of national income indexes and numbers of livestock units, by regions, 1975 and 1980
Region Variable*
Asia and Oceania ............. .lt Asia and Oceania ............. ..It Japan .......................................... .lt Japan ............................................. It EEC ...................... .lt EEC ............................................ It Latin America ...................................... .lt Latin America ..................................... ..It Africa . . ....................... It Canada and non-EEC Europe Lt Canada and non-EEC Europe It
1975
269,068 244.8
10,640 438.7
86,241 350.5
303,610 257.4 154.5
77,391 229.0
1980
285,440 275.0
12,110 511.6
92,451 401.4
332,880 289.2 165.6
82,901 255.4
*Livestock units are in thousands, and 1950 is the base of the income indexes.
soybean exports under selected price levels are shown in table 19. At $2.50 per bushel, projected Japanese imports from the United States are 82 million bushels in 1975 and 97 million bushels in 1980. Projected imports are somewhat higher at lower prices and somewhat lower at higher prices. Because Japan is an im-
22 Important soybean-using foods are miso ( soy paste), shoyu ( soy sauce), and tofu (bean curd). These and other food uses of soybeans account for about one-third of total consumption. For more details see Chapter 8 of Japanese Import Requirements: Projections of Agricultural Supply and Demand for 1965, 1970, and 1975, Depart. of Agr. Econ., Univ. of Tokyo, 1964; and Use of United States Soybeans in Japan, ARS-71-12, USDA, 1958.
23 Although the United States is by far Japan's primary source of soybean imports, Mainland China also supplies some of the Japanese requirements. In 1962, Japan and China signed a 5-year trade agreement called the Liao-Takasaki Trade Agreement. As part of this pact, Japan agreed to purchase about 5.5 million bushels of soybeans annually under what are called "friendly terms." This amount is less than 10 percent of Japan's current annual imports.
-35-

portant market, additional projections were made on the basis of meal-equivalent units of soybeans and meal imported. These projections are reported in the soybean meal export section that follows.
Other regions. Only about 10 percent of whole soybean exports are accounted for by other regions of the world. Regression equations were fitted for Latin America, Asia and Oceania, and Africa (equations 1, 2, and 4, table 14). The projected soybean exports to these regions are shown in table 19 under differing prices where appropriate. Note that projections of soybean exports to Africa seem to be rather more sensitive to price changes than for other regions. Presumably, the availability of other oilseeds from domestic production is the major factor lying behind this price responsiveness.24 •
Soybean Meal
Regional equations for soybean meal exports are shown in table 15. Using projected values of the independent variables, the 1975 and 1980 levels of exports were computed. The character of the meal projections differs a bit from the whole soybean export projections for the EEC and Japan. Hence, the projections for these two regions are presented separately.
Canada and non-EEC Europe. The relationship used for projecting U.S. soybean meal sales to Canada and non-EEC Europe is equation 5 of table 15. The projections, made at three different meal price levels, are shown in table 20. At $75 per ton, exports to this region are projected at 906 thousand tons in 1975 and 1,083 thousand tons in 1980. Projected exports of meal to this region are only slightly lower at higher meal prices arid higher at lower meal prices. The livestock unit variable for the region is closely associated with changes in meal imports.
Latin America, Asia and Oceania. Equations 1 and 2 in table 15 indicate the estimated relationships between meal exports, livestock units, and meal prices for these two geographically large regions. In Latin America, both meal prices and livestock units are closely related to changes in meal purchases from the United States. In Asia and Oceania, meal prices are less closely related to meal purchases, but livestock unit changes are closely related. In both of these regions, the projected exports shown in table 20 are small relative to exports to the developed nations of Western Europe and Canada. Projected exports to Latin America approximate 10 percent of the soybean meal shipments to Canada and non-EEC Europe. Asia and Oceania take an amount approximately equal to 5 percent of the projected exports to Canada and nonEEC Europe.
European Economic Community ( EEC), The regression relationships for soybean meal exports to the EEC are shown in equations 6, 7, and 8 of table 15. Equations 6 and 7 were used as the basis for the projections in table 21. Using equation 7, the simpler of the two, projected meal exports into the 1970's appear to be too low to be realistic. A spurt in meal shipments to this region in 1965 and 1966 places current exports above projected values for 1975 (based on equation 7).
A more realistic set of projections seems to emerge from consideration of equation 6, which includes the estimated impact of changes in local feed grain production. The lower portion of table 21 shows projected meal exports to the EEC at the projected level of livestock units and three levels of possible EEC feed grain production-25 million metric tons, 27 million metric tons, and 30 million metric tons. In the 1964-65 period, EEC feed grain output was about 25 million metric tons. The equation that includes the estimated impact of domestic feed grains indicated a significant competitive relationship between soybean meal imports and feed grain production. If current levels of feed grain production continue into the future, then projected meal sales are more in line with other expectations. However, with increasing EEC feed grain production assumed, projected sales of soybean meal are correspondingly lower.
Here, perhaps more than with other regions, these particular export projections should be used in conjunction with other analyses. The rapid changes occurring in the EEC grain and livestock sector, especially the expanding use of high protein feedstuffs, suggest that perhaps these projections are rather more pessimistic than actual circumstances warrant, especially at higher levels of local feed grain production. However, projected changes in meal exports rather than the actual levels indicated here may be useful.
Japan. As mentioned earlier, the Japanese case was handled a bit differently than the other regional analyses. First, whole soybean exports to Japan were analyzed and projections were made in the previous section. In this section, all Japanese imports of beans and meal were converted to meal equivalent units and analyzed with bean prices, meal prices, livestock units, and income (equations 3 and 4, table 15). 25 In recent years, soybean meal exports to Japan have been a relatively small, but variable, proportion of the meal equivalent imports represented by whole soybeans.
The projection results for these two formulations are shown in table 22. About one-third of Japanese soybean utilization is direct human consumption. Therefore, the projection results from equation 3 may be the most appropriate, since the income index pre-
"'E. R. Berg, Nigeria, Senegal, and the Congo: Projected Level of Demand, Supply and Exports of Oilseed Products to 1975 with Implications for U.S. Exports to the European Economic Community, Univ. of Alberta, Edmonton, Canada, Jan. 1967.
25 High intercorrelation between livestock units and income precluded inclusion of both in any one equation.
-36-

Table 19. Estimated export demand for U.S. soybeans at three price levels, 1975 and 1980
Thousand bushels Equation Region used 1975 1980
Soybean price= $2.75/bu. Canada and non-EEC Europe 5 78,752 EEC ........................ .......................... 7 125,136 Latin America ....................................... 1 2,970 Asia and Oceania .. . ... ......... ....... 2 33,484 Japan ......................................................... 3 79,591 Africa ... ..................................................... 4 491
Soybean price= $2.50/bu. Canada and non-EEC Europe 5 78,752 EEC ...................... ........................................ 7 126,012 Latin America .......... ............................ 1 2,970 Asia and Oceania ........................... 2 33,570 Japan .............................................. 3 81,963 Africa ............................................. ...... 4 756
Soybean price = $2.30/bu. Canada and non-EEC Europe 5 78,752 EEC .. .................................................... 7 126,712 Latin America ....................................... 1 2,970 Asia and Oceania ........................... 2 33,639 Japan ............................ 3 83,861 Africa ... .... ..... ................. 4 950
94,210 154,451
3,793 38,271 94,803
675
94,210 155,326
3,793 38,357 97,117
930
94,210 156,026
3,793 38,426 99,065
1,134
Table 21. Estimated demand for U.S. soybean meal in the EEC, 1975 and 1980
Basis for projection
Thousand short tons Equation used 1975 1980
Simple projection with Lt . 7 Projection with Ft at:
25,000 metric tons ..................... 6 27,000 metric tons .................. 6 30,000 metric tons . ... ........... 6
1,461
1,789 1,715 1,604
1,803
2,261 2,187 2,076
sumably represents the most important demand shifter for soybean foods and meal-using livestock products. The meal equivalent units are converted back into approximate amounts of whole soybeans. These figures can be compared to the whole bean projections for Japan (table 19). Using livestock units and meal prices (equation 4), the projections are a bit more pessimistic, though certainly within the same general range. These projections are much lower than those made in 1964 by the University of Tokyo.26 But, like the projections for the EEC, the estimates in this report may be somewhat low in view of the rapid increase in exports to this region during 1965 and 1966 and recent tariff concessions made by Japan.
Table 20. Estimated demand for U.S. soybean meal in Canada, non-EEC Europe, Latin America, and Asia and Oceania at three price levels, 1975 and 1980
Equation Thousand short tons Region used 1975 1980
Meal price = $80 per ton Canada and non-EEC Europe 5 905 1,082 Latin America .................... .................. 1 92 117 Asia and Oceania ........................... 2 42 52
Meal price = $75 per ton Canada and non-EEC Europe 5 906 1,082 Latin America 1 95 120 Asia and Oceania ... .......... ......... 2 43 52
Meal price = $70 per ton Canada and non-EEC Europe 5 906 1,083 Latin America ....................................... 1 98 123 Asia and Oceania ........................... 2 44 53
Table 22. Estimated demand for U.S. soybean meal (including meal equivalent of soybeans) in Japan, 1975 and 1980
Basis for projection
Equation used
Using Lt and meal priced at: $75 per ton ...................... 4 $70 per ton .... 4 $80 per ton ......... 4
Using It and beans priced at: $2.75 per bu. $2.50 per bu. $2.30 per bu.
3 3 3
Thousand short tons*
1975 1980
1,627 (67) 1,662 (70) 1,593 (67)
1,687 (71) 1,761 (7 4) 1,820 (77)
1,927 (81) 1,947 (82) 1,878 (79)
1,999 (84) 2,073 (87) 2,131 (90)
* Figures in parentheses are approximately equivalent amounts of soybeans in million bushels.
Soybean Oil (Commercial Exports)
Regional equations for commercial exports of soybean oil to Latin America, Asia and Oceania, and Africa are shown in table 16. Equations for commercial oil exports to Western Europe, Canada, and Japan were not useful within the framework of this analysis. Where substantial quantities of whole soybeans are purchased to supply a domestic crushing industry, imports of soybean oil generally are difficult to relate to standard economic variables, especially if the region
. also exports soybean oil derived from its own crushing facilities. Hence, formal projections of commercial oil sales are made only for Latin America, Asia and
26 Depart. of Agri. Econ., Univ. of Tokyo, op. cit., p. 164. This report projected 1965 soybean imports at approximately 83 million bushels. Actual imports in 1965 from all sources were less than 70 million bushels.
-37-

Oceania, and Africa. Concessional exports of soybean oil under PL 480 or other programs are regarded as administratively determined.
In Asia and Oceania and in Africa, the best results were obtained when commercial exports of cottonseed oil were treated as entirely substitutable with soybean oil. Equations 2 and 3 in table 16 reflect this assumption by exhibiting commercial exports of cottonseed oil with a fixed coefficient of -1.0. In all three equations, the price of soybean oil shows an expected negative sign, but in each case the size of the coefficient relative to its estimated standard error is not large.
Commercial oil export projections for these three regions are shown at three price levels in table 23. The first is with soybean oil priced at 9 cents per pound, the second is with the price at 10 cents per pound, and the third is with the price at 11 cents per pound. In order to arrive at a projected level of commercial soybean oil exports to Africa and to Asia and Oceania, some assumptions have to be made about the size of cottonseed exports to these regions and subtracted from the tabular figures.
Although no formal projection of soybean oil exports to the EEC was developed, some of the statistical analysis is of interest. In one estimated regression equation, commercial oil exports were expressed as a linear function of oil prices, income, and EEC imports of other food fats and oils from the rest of the world.27 The coefficient of multiple determination ( R2 ) was only .25, and only the coefficient on competitive imports was at least as large as its estimated standard error. However, the signs on the coefficients are of interest. First, the expected negative relation between quantity and price was observed. Second, a competitive relation with other fats and oils imports emerged. Finally, the net relationship with the income index suggests that soybean oil may be inferior with respect to income change. These results are hardly conclusive, but they suggest that with increasing incomes and increasing imports of fats and oils from associated territories, U.S. soybean oil sales to the EEC probably will not expand.28
It was not possible to establish a useful relationship for soybean oil sales to Canada and non-EEC Europe. Perhaps this grouping of countries is not appropriate for consideration of the soybean oil market. The only results worth reporting involve an estimated equation in which the combined oil equivalent of soybeans and soybean oil exports to this region were expressed as a linear function of income and other food
21 q,•x = 403.152- 5.827 p,•- .202 FFO,- .236 I, (.731) (1.175) (.290)
FFO, = other food fats and oils imports by the EEC. R2 = .25 The "t" values are in parentheses.
Table 23. Estimated commercial demand for U.S. soybean and coHonseed oil in Latin America, Africa, and Asia and Oceania, 1975 and 1980
Equation used
Million pounds
Region 1975 1980
Oil price = 9 cents per pound latin America .... .......................... ....... 1 152 Africa* ... ......... ................... 3 283 Asia and Oceania* ........................... 2 1,072
Oil price = 1 0 cents per pound latin America ....................................... 1 135 Africa* ... ..... ... ..... . ....... .......... .... 3 273 Asia and Oceania* ........................ 2 1,069
Oil price = 11 cents per pound latin America ....................................... 1 118 Africa* .......... ...... ........... ...................... 3 264 Asia and Oceania* ....... 2 1,067
* Includes commercial exports of cottonseed oil.
177 333
1,337
160 324
1,334
143 315
1,332
fats and oils imports into the region.29 In this analysis, a positive coefficient on income and competitive relationship with other fats and oils imports emerged. Again, the results are hardly conclusive and of limited applicability to the oil market itself, since this region imports most of its soybean oil in the form of whole beans.
Short Term Projections to 1970 The large increase in soybean and soybean meal
exports that occurred in the 1964 and 1965 crop years was not captured in the regional import demand equations. Consequently, several 1970 export projections based on the regression analysis fall short of current shipment levels. In order to overcome this difficulty and still retain the estimated effects of regional income and livestock changes, a series of adjusted 1970 projections was made beginning with the 1965 crop year exports at bean and meal prices of $2.50 per bushel and $70 per ton, respectively. These projections are summarized in table 24.
Projected changes (to 1970) in income and livestock units were multiplied by the relevant coefficients in the demand equations of tables 14 and 15. These indicated changes in U.S. exports of beans and meal were added to the 1965 crop year actual exports, forming the projections. Only slight adjustments were
28 This conclusion is supported by the Berg study. "The projected oil and oil equivalent exports from the three African countries will go far towards increased imports supplies needed by the EEC .... by 1975, ... the increased export supplies will be greater than the likely needs. of the EEC." Berg, op. cit., p. 12.
•• q,ox + y• q,•x = -471.750 + 8.507 I,- .609 FFO, . ( 1.457) ( .453)
FFO, =other food fats and.oils imports into Canada and non-EEC Europe. R2 = .62 'The "t" values are in parentheses.
-38-

Table 24. 1970 export projections for soybeans and soybean meal by regions
Soybeans ($2.50/bu)
Table and 1970 u.s. Region equation exports
million bushels Canada, non-EEC Europe .... 14, 5 90.6 EEC .. .................................. 14, 7 121.4 Japan. 14, 3 76.7 Asia and Oceania .. 14,2 20.8 latin America . 14, 1 2.1 Africa .. 14,4 .6 Other .. 4.7*
Total .. 316.9
*Same percentage of U.S. exports as in crop year 1965, see table 13.
t 6,677.8 million pounds.
needed for price change, since the 1965 bean price was $2.54 per bushel and the average meal price was $70.20 per ton. In some cases where usable equations were not available, it was assumed that 1970 exports to that region would retain their 1965 percentage of total shipments. The 1970 level of bean exports totals 317 million bushels with meal exports reaching 3,339 thousand short tons. These figures compare quite closely with the aggregate projections indicated in tables 9-12, especially at the selected prices.
Because of the difficulty in establishing useful equations for soybean oil exports and in untangling
Soybean meal ($70/ton)
Percent of Table and 1970 u.s. Percent of total equation exports total
thousand tons 28.6 15,5 857.9 25.7 38.3 15,6 2,071.9 62.0 24.2 43.4* 1.3
6.6 15, 2 82.1 2.5 .7 15, 1 76.6 2.3 .1 3.3* .1
1.5 203.7* 6.1
100.0 3,338.9t 100.0
the interrelationships with cottonseed oil and PL 480 vegetable oil shipments, a similar series of regional oil export projections was not computed.
The percentage distribution by regions of both soybean and meal exports under these projections changes little by 1970. The EEC gains a little relative to Canada and non-EEC Europe, but the other shares remain similar (see table 13 for comparisons). Total soybean exports increase in these projections about 5.3 percent, or 13 million bushels, per year. On the other hand, meal exports rise about 5.7 percent, or 147 thousand tons, per year.
Surn tnary and Implications
The research results reported in this bulletin were developed under a research contract between the U.S. Department of Agriculture and the University of Minnesota. Three major objectives underpin the analyses:
1. To develop theoretical and statistical models of the domestic and foreign markets for U.S. soybeans and soybean products.
2. To estimate and test these models using appropriate statistical techniques and crop year data from the post World War II period.
3. To project market requirements for soybeans and soybean products into. the 1970's under a variety of prices and price relationships, and, in so doing, to estimate the amount of soybean oil for which disposition outside commercial marketing channels may be required.
The Market and the Models
The core of the analysis is a 13-equation simultaneous model of the soybean sector which focuses on the price-making forces for U.S. soybeans and related products. This model emphasizes the demand side and encompasses both domestic and foreign markets.
The unique analytical characteristics of the soybean market are captured in both the theoretical and statistical expressions of the system. In particular, the models reflect ( 1) the joint product relationships that link together the prices and supplies of soybeans, meal, and oil, ( 2) the multiple market outlets, both · domestic and foreign, that compete for supplies of all three commodities, ( 3) the role played by government programs, especially PL 480 exports of soybean oil, in these interconnected markets, and ( 4) the simultaneous adjustment processes that operate to clear bean, meal, and oil markets within the crop year framework.
The domestic crop year demand for soybeans, net of seed, and direct feeding is derived from the demands for meal and oil faced by U.S. soybean processors and the demand for carryover stocks of whole beans. Consider first the domestic markets for soybean meal and oil. Since the demands for meal and oil are virtually independent of one another, these product markets can be analyzed separately.
Almost all soybean meal consumed in the United States is in livestock feed. Hence, the domestic meal demand equation relates the utilization and price of
-39-

meal to livestock production, supplies of competing feeds, and the average level of protein in rations fed by stockmen.
On the other hand, most of the soybean oil consumed in this country is in food products, especially oleomargarine, shortenings, and salad and cooking oils. The domestic oil demand equation relates the utilization and price of oil to total expenditures for food, supplies of the closely competitive cottonseed oil, and prices of butter and lard. Substantial quantities of soybean oil are carried out of one crop year into the next. Since these year-end stocks may amount to 16 percent of annual oil disposition, an equation to account for oil stock changes was added to the domestic oil sector. It relates oil stock changes and prices to oil production, opening oil stocks, bean stock changes, and PL 480 oil shipments during the crop year under consideration.
To the domestic demands for meal and oil, an export relation was added for each product. Meal exports were related to meal production, livestock numbers, and feed grain output in meal-importing nations. Soybean oil exports were divided into two sectors-commercial sales for dollars, plus barter transactions, and concessional oil sales (including donations) under PL 480. Commercial oil sales and prices were related to exports of cottonseed oil, income in oil-importing nations, and shipments of soybean oil under PL 480. The volume of soybean oil exported under PL 480 as concessional sales was assumed to be determined outside the system.
Domestic and export demands for meal were added together to form the total demand for U.S. meal. A similar addition produced the total demand for U.S. oil. Since meal and oil are joint products of the crushing process, their supplies are linked closely together via technical crushing yields. One 60-pound bushel of soybeans produces about 11 pounds of oil and 48 pounds of meal. Combining the demands for meal and oil as joint products provides an expression for the total demand faced by the U.S. soybean processing industry. .
The average per bushel crushing and handling spread (or margin)' for soybeans is regarded as a cost determined outside the system. By subtracting it from the joint meal and oil demand, the farm level demand for U.S. soybeans for crushing is formed. The total farm level demand for U.S. soybeans is formed as the sum of the crushing demand, the demand for whole soybean exports, and the demand for soybean stocks.
The export demand equation for soybeans relates prices and exports of whole beans to prices of meal, income abroad, and feed grain production in importing nations. The bean stock change equation relates prices and stock changes to prices of beans, bean supplies, opening bean stocks, and oil stock changes. The model includes an outlet for soybean stocks accumulated by the government for price support purposes in years when market prices approximate the loan rate.
The system is held together by the formal requirements that ( 1) prices equalize for each commodity in all of its markets, ( 2) amounts demanded and supplied of each commodity are equal in all markets, ( 3) meal supplies, oil supplies, and beans crushed are equivalent in terms of the fixed processing yields, and ( 4) the per bushel wholesale value of processed soybeans minus the externally determined crushing and handling spread is equal to the farm price of soybeans.
A subsector of the simultaneous model relates soybean production to previous bean prices and other variables. However, the supply of soybeans to be utilized in any given year is regarded as independent of the average price of that particular crop year. In other words, supplies are assumed to be fully determined in advance for each crop year.
This theoretical model is translated into a statistical framework for estimation by assuming that each of the equations is fully linear. Also, a random error term (or disturbance) is added to each behavioral equation. Since thi~ 13-equation model is "complete," there are 13 variables determined within the model for each crop year. They are:
1. The farm prices of soybeans 2. The wholesale price of soybean meal 3. The wholesale price of soybean oil 4. Domestic utilization of meal 5. Domestic utilization of oil 6. Exports of meal 7. Commercial exports of oil 8. Soybean exports 9. Soybean oil stock changes
10. Soybean stock changes 11. Soybeans crushed 12. Total meal production 13. Total oil production
The simultaneous model includes global export relationships for beans, meal, and oil. These relationships are helpful in analyzing and projecting the total magnitudes of these exports without explicit consideration of the countries or regions of destination. In order to study the export markets more closely, the world outside the United States was divided into six regions: ( 1 ) the European Economic Community ( EEC), ( 2) Canada and non-EEC Europe, ( 3) Latin America, ( 4) Africa, ( 5) Japan, and ( 6) the balance of Asia and Oceania. Demand relationships were formulated for each region for whole soybeans, meal, and, where possible, oil. These relationships were based on variables such as prices, income, production of feed grain, and numbers of livestock units.
Estimates of the Simultaneous Model and Region11l Equations
After exteqsive preliminary investigation, four versions of the ~imultaneous model were estimated by
-40-

means of ordinary least squares ( OLS) and two-stage least squares ( TSLS), the latter being a statistical technique that considers the simultaneity of the entire system. Crop year data for the 1946-64 period were used in the estimation processes. After much preliminary investigation, the regional equations were fitted by OLS using 1950-64 data. However, it was not possible to establish useful results for commercial oil exports to Canada and Western Europe.
The overall empirical results for the simultaneous model were satisfactory. When all the estimated relationships are considered together for the sample period, the performance of the system against actual data is rather good. The estimated relationships typically display signs and magnitudes consistent with economic theory and with the results of other related research. The general impression is that this formulation captures most of the relevant economic factors shaping the behavior of the soybean sector on a crop year basis.
Generally speaking, price and income are good explanatory variables in the regional soybean export demand equations. Similarly, price and livestock numbers and feed grain production are effective in the regional meal export equations. Differences in market structures, import regulations, and other factors made it impossible to establish entirely comparable results across all six regions.
Although it is difficult to summarize empirical results of this type, one rather clear outcome is that changes in amounts demanded of soybeans, meal, and oil in response to price change were relatively low in the sample period. Low demand elasticities for agricultural commodities are not unusual, but the rapid growth in the whole soybean sector since World War II suggests that rapid shifts in demand may have overridden and obscured adjustments in response to changes in relative prices. The wholesale level demand elasticity for meal is estimated at -0.3. For oil, it is estimated at -0.5. The total farm' level demand elasticity for soybeans is estimated at -0.3.
Another rather clear result is that concessional exports of soybean oil under PL 480 have done much to sustain prices and incomes of growers in the soybean sector since the mid-fifties. An abandonment of these shipments in 1965 would have depressed oil prices an estimated 2 or 3 cents per pound and bean prices by as much as 28 cents per bushel. In addition to their contribution to food aid programs, PL 480 soybean oil shipments have acted as a release valve preventing rapidly increasing oil supplies from depressing commercial oil markets and, in turn, bean prices. The joint product relationship together with the differing growth rates in meal and oil markets make this a very important, though complex, relationship. If a noncommercial outlet for oil supplies had not been available, much of the benefit from rapidly growing meal markets would not have been reflected back to farmers in the form of strong bean prices.
There is some evidence in the estimated models that commercial soybean oil exports and PL 480 oil shipments are inversely related, other things held constant. The estimates suggest that this is not a one-toone relationship. However, expanded PL 480 oil operations may make it slightly more difficult for U.S. oil exporters to negotiate dollar sales. The implication is that a given volume of PL 480 oil disposition is not entirely a net addition to total oil utilization; some displacement of other exports-in a global sense-may be involved.
A useful feature of the estimation process is that changes in external economic and administrative factors affecting the soybean sector, such as changes in livestock numbers or PL 480 decisions, can be evaluated in isolation. The net impact of a specified external change on each of the 13 internally determined variables is given by a series of numerical coefficients presented in tabular form. One can observe the estimated changes in prices and quantities directly attributable, for example, to a 100 million pound increase in PL 480 oil shipments or a 100 thousand unit drop in· livestock units. Several illustrations of this type are provided in the report.
Projections with the Estimated Models
After some modifications and adjustments, the simultaneous models and the regional equations were used to project market requirements for soybeans and soybean products into the 1970's at several alternative price combinations. Year-by-year projections with the simultaneous model at medium price levels ( $2.50 per bushel for beans, $70 per ton for meal, 10 cents per pound for oil) indicate that total requirements for soybeans will grow at the rate of 35-40 million bushels per year to a level of about 1,050 million bushels (net of feed and seed) by the 1971 crop year. Supply increases in excess of this rate can be expected to produce downward pressure on prices in all sectors of the soybean market. If price supports remain at $2.50 per bushel, then supply increases exceeding 35 million bushels per year could lead to accumulation of gov-ernment stocks. ·
Slower projected growth in domestic oil markets relative to meal markets results in a large total export requirement for soybean oil if prices are to remain near present levels. This oil export requirement increases about 100 to 200 million pounds per year. The estimated models are somewhat ambiguous about the extent to which concessional sales will be required to dispose of this oil. In all versions, however, commercial oil markets grow slowly-if at all. Even under the most favorable projections of commercial oil exports, some form of disposition outside market channels is indicated for an additional 150-160 million pounds of oil per year. Otherwise, oil prices will probably trend downward under supply pressure, in which case domestic utilization and commercial exports would ex-
-41-

pand. In total, commercial oil markets in the United States and elsewhere are projected to expand at about 1 to 2 percent per year, while meal markets grow at 4 to 5 percent. Whole bean exports are projected to increase about 4 percent per year. The following are projected 1970 and 1971 crop year data from one version of the model in which bean, meal, and oil prices are sustained at $2.50 per bushel, $70 per ton, and 10 cents per pound, respectively. They are compared with actual 1965 crop year values.
1965 Item Units (actual) 1970 1971
U.S. meal demand .. . .mil. tons 10.2 13.5 14.1 U.S. oil demand ... mil. tons 4,688 5,634 5,754 Soybean exports ... ...... .mil. bu. 250.6 299.9 311.1 Meal exports ...... .mil. tons 2.5 3.3 3.5 Commercial oil
exports ............................. .mil. lbs. 647 636 676 PL 480 oil exports ..... .mil. lbs. 502 1,420 1,580
Total oil exports ...... mil. lbs. 1,149 2,056 2,256 Soybean crush ............... mil. bu. 537.5 712.2 741.5 Total bean require-
ments (less feed and seed) ··············· .... mil. bu. 794.0 1,015.7 1,054.5
Closing bean stocks ..... mil. bu. 35.6 72.6 74.5 Closing meal stocks .. .mil. tons .1 .2 0.2 Closing oil stocks ........... .mil. lbs. 462 791 835
Beginning from the current position, the regional export projections of soybeans and meal into the 1970's are very much in line with the global projections of the simultaneous model. Canada, Western Europe, and Japan will continue as our major customers. In fact, relative importance among these regions does not appear to change much in the projections. According to these projections, Canada and non-EEC Europe will take 28.6 percent of our bean exports and 25.7 percent of our meal exports in 1970, compared with 30.0 percent and 26.2 percent, respectively, in the 1965 crop year. The EEC is projected to
take 38.3 percent of our bean exports and 62.0 percent of our meal exports in 1970, compared with 36.8 and 61.5 percent, respectively, in the 1965 crop year. Japan will remain a major outlet for beans but a rather small market for meal. In 1970, the Japanese are projected to take 24.2 percent of our soybean exports, compared with 24.7 percent in 1965. Meal exports to Japan are presumed to remain about 1.3 percent of the total. The less-developed nations will continue to purchase a relatively small proportion of our total exports of beans and meal.
Although the regional export projections for soybean oil were not definitive, it seems likely that the developing nations of Asia, Africa, and Latin America will continue to be the major outlets for both commercial and concessional shipments of soybean oil. Establishment of major new oil markets in the developed nations of Europe and in Japan seems unlikely.
Concluding Comments
Substantial overall growth can be expected to continue in markets for soybeans and soybean products. The demand for meal and whole soybean exports will continue to grow faster than the demand for oil. Consequently, a program for continual nondollar disposition of substantial quantities of soybean oil will be required if the price relationship between soybeans and the joint soybean products is to approximate its present form. Otherwise, falling oil prices will drive an increasing wedge between meal prices and farm level soybean prices.
Increases in market supplies in excess of about 35-40 million bushels per year either will exert downward pressure on all prices in the soybean sector or will result in government price support operations once market prices approximate loan rates. Careful operation of voluntary and other government programs for commodities competing with soybeans for available cropland can do much to prevent excessive resources from flowing into soybean production and depressing prices and incomes in this sector of U.S. agriculture.
-42-

Appendix A - The Data Series
Table A-1. Jointly determined variables: crop year data used in the simultaneous model~ 1946-64 *
Year beginning October
1
qtmd
Mil. lbs.
7,889.4
7,474.0
8,366.2
9,084.8
11,496.4
11,340.0
11,080.6
od qt Mil. lbs.
1,432.0
1,530.0
1,490.0
1,646.0
1,906.0
2,150.0
2,462.0
2,326.0
2,608.8
2,538.6
' St
Tho us. bu.
1,036
-2,775
564
-281
1,260
-572
4,566
-6,822
2,047
348
Sto qtsx qtox
Mil. Theus. Mil. lbs. bu. lbs.
10 3,880 89.0
-lOB 2,972 112.0
17 23,008 300.0
0 13,138 291.0
58 27,831 490.0
23 17,045 271.0
-20 31,906 93.0
-47 39,644 70.0
52 60,618 50.2
48 67,481 274.4
283.4
191.4
294.8
42.6
296.6
35.4
11.4
101.8
543.4
800.8
Ptm
Cents per lb.
Pto Pts
Cents Dol. per lb. per bu.
22.9 2.57
23.8 3.33
13.1 2.27
12.3 2.16
17.8 2.47
11.3 2.73
12.1 2.72
13.5 2.72
11.9 2.46
12.6 2.22
qtop
Mil. lbs.
1,531
1,534
1,807
1,937
2,454
2,444
2,536
2,350
2,711
3,143
q, mp
Mil. lbs.
8,172.8
7,665.4
8,661.0
9,171.2
11,793.6
11,407.4
11,102.6
10,101.2
11,409.6
13,091.6
qt sc
Theus. bu
1946
1947
1948
1949
1950
1951
1952
1953
1954
1955
1956
1957
1958
1959
1960
1961
1962
1963
1964
9,989.8
10,915.0
12,142.6
14,246.2
15,984.6
17,935.0
16,959.0
17,734.6
18,524.2
19,172.2
18,335.4
18,531.4
2,564.7 996 59 85,361 299.6 886.2
3.6150
4.0450
3.3050
3.2150
3.2225
3.1675
3.3775
3.9325
3.0350
2.6275
2.3725
2.6700
2.7900
2.7775
3.0300
3.1800
3.5650
3.5500
3.5100
12.7
10.8
9.5
8.3
2.18
2.07
2.00
1.96
2.13
2.28
2.34
2.51
2.66
3,431 15,019.2
170,245
161,397
183,664
195,265
251,990
244,380
234,404
213,158
249,010
283,126
315,950
353,806
401,226
393,417
402,217
438,838
474,498
440,917
473,074
3,051.0 2,474 -55 85,505 202.1 597.2 3,800 16,568.6
3,303.6 10,647 17 110,070 194.8 1,024.4 4,251 18,980.2
3,376.2 -4,326 10 141,381 363.6 1,297.2 4,338 18,304.8
3,328.6 -7,524 369 130,060 283.4 1,179.7 11.3
9.5
8.9
8.5
4,420 18,903.4
3,541.0 11 ,571
3,623.6 -4,210
4,058.5 18,583
-59 153,154 624.0 2,127.4
302 180,347 513.4 2,951.4.
-342 191,158 539.2 2,956.8
4,790 20,683.8
5,091 22,254.0
4,822 21,217.8
4,087.3 -22,313 -281 205,879 639.3 4,072.0 11.3 5,146 22,571.6
* Descriptions of each variable follow.
Description of the Jointly Determined Variables
q 1md = quantity of soybean meal demanded in the United States in million pounds. The quantity demanded includes quantities used for feed, food, industry, and other nonfeed uses. The data were obtained from American Soybean Association, The Soybean Digest, Blue Book Issue. (In the following description, this source will be referred to as Blue Book.)
p 1°d = quantity of soybean oil demanded (domestic disappearance) in the United States in million pounds. The source of data was USDA, ERS, U.S. Fats and Oils Statistics, 1909-65, Stat. Bull. No. 376, Aug. 1966. (Called Stat. Bull. 376 in the following description.)
sts = change in stocks of soybeans held by private firms in thousand bushels. (Source: Blue Book.)
St0 = change in stock of soybean oil in million pounds. (Source: Stat. Bull. 376.)
qt sx = quantity of soybeans exported as whole beans from the United States in thousand bushels. (Source: Blue Book.)
qtox = quantity of soybean oil commercially exported from the United States in million pounds. The transactions under Barter program of Title III of PL 480 were treated as commercial exports. The data were obtained from Stat. Bull. 376 and USDA, FAS, Foreign Agriculture Circular, FF07-65, May 1965.
qtmx = quantity of soybean meal exported (net of imports) from the United States in million pounds. (Source: Blue Book.)
Pt111 = average wholesale price of soybean meal, 44 percent protein, bulk at Decatur, cents per pound. (Source: Blue Book.)
Pt0 = average price of soybean oil, domestic crude, in tank cars at midwestern mills, cents per pound. (Source: Blue Book.)
Pt8 = average price received by U.S. farmers for soybeans, dollars per bushel. (Source: Blue Book.)
qtop = quantity of soybean oil produced in the United States in million pounds. (Source: Stat. Bull. 376.)
qtmp = quantity of soybean meal produced in the United States in million pounds. (Source: Blue Book.)
qtsc = quantity of soybeans crushed in the United States in thousand bushels. (Source: Blue Book.)
-43-

Table A-2. Predetermined variables: crop year data used in the simultaneous model, 1946-64 *
Year beginning qtP Lt qtdp Et pl+l qt"" St" St0 It October Thous. Tho us. Percent Mil. Index Tho us. Thous. Mil. Index
1 tons dol. bu. bu. lbs.
1946 ............................ 4,308 102,287 10.2 65,000 139.6 175,162 4,356 194 77.3 1947 .............................. 4,839 100,838 10.7 61,700 149.1 161,593 5,392 204 83.8 1948 .......................... 5,271 105,922 10.7 61,900 108.4 207,236 2,617 96 88.2 1949 .............................. 5,534 111,450 10.7 62,700 102.2 208,129 3,181 113 95.2 1950 .......... 4,985 119,279 10.9 63,000 120.8 281,075 2,900 113 100.0 1951 .......... 5,323 120,243 11.0 64,600 120.1 260,853 4,160 171 104.6 1952 ............................. 5,532 115,316 11.2 67,200 107.4 272,855 3,588 194 110.7 1953 .............................. 6,134 113,256 11.2 67,700 113.8 244,013 8,154 174 117.3 1954 .............................. 5,874 121,928 11.3 70,800 99.8 318,232 1,332 127 126.7 1955 ........................... 6,343 125,761 11.3 73,600 98.1 344,385 3,379 179 136.2 1956 .......................... 5,836 122,105 11.5 74,800 105.5 407,473 3,727 227 142.6
1957 ······························ 5,237 125,423 11.4 74,900 101.8 450,501 4,723 286 146.4 1958 ........ 5,616 136,284 11.7 77,500 95.6 552,301 7,197 281 151.3 1959 .... ....... 6,006 137,558 12.0 79,500 95.2 495,932 17,844 298 163.3 1960 ................... ······ 6,053 140,758 12.1" 80,100 100.1 515,053 13,518 308 173.8 1961 ····················· ....... 6,255 143,539 12.5 82,300 96.1 643,563 5,994 677 182.6 1962 .................... ....... 6,382 148,940 12.6 83,800 95.6 612,335 17,565 618 190.6 1963 .................. 6,534 151,437 12.6 85,900 96.7 633,711 13,355 920 203.4 1964 ................ 6,547 147,542 13.0 89,400 103.0 656,640 31,938 578 202.3
*See following page for description of each predetermined variable.
Table A-2. (continued) Predetermined variables: crop year data used in the simultaneous model, 1946-64*
Year beginning ft LtW Wt gt" Stm qtcod qtoxpl qtcox October Thous. Tho us. Dol. Thous. Mil. Mil. Mil. Mil.
1 metric tons per bu. bu. lbs. lbs. lbs. lbs.
1946 ....... 41,890 485,851 1.629,908 0 1,184 0 3.2 1947 ................... 43,404 493,682 1.171,403 -1 0 1,110 0 32.3 1948 ..................... 50,900 500,962 0.718,734 0 0 1,604 0 93.0 1949 51,575 515,954 0.699,208 7 43.8 1,671 0 145.0 1950 ......... 51,193 544,302 0.990,060 -6 0.6 1,115 0 56.0 1951 .......... 60,657 650,576 0.471,950 0 32.0 1,404 0 122.0 1952 ........ 59,206 568,111 0.194,488 1,979 10.6 1,162 0 50.0 1953 ........ 63,211 576,007 0.609,515 -1,967 9.6 1,824 0 398.0 1954 ......... 58,284 588,811 0.270,475 6,557 -48.8 1,543 0 540.0 1955 66,357 607,731 0.393,401 -6,570 148.2 1,384 282.0 309.0
1956 ····················· 72,247 614,937 0.323,429 5,166 -113.2 1,310 507.7 367.4 1957 ........... 67,996 614,169 0.368,060 8,716 -13.2 1,195 601.9 153.8 1958 ................. 68,468 633,219 0.353,742 30,358 20.8 1,147 735.6 263.1 1959 ..................... 76,189 644,626 0.257,498 -34,540 48.8 1,299 589.2 408.7 1960 ..................... 76,149 658~919 0.532,946 -9,700 -10.6 1,461 438.0 287.4 1961 ····················· 71,341 681,291 0.258,543 42,500 32.2 1,352 684.0 183.2 1962 ..................... 79,603 681,597 0.315,815 40,800 130.4 1,347 652.0 205.5 1963 .................. 85,081 693,701 0.095,270 1,338 -74.4 1,407 566.3 327.3 1964 .................... 85,891 703,788 0.230,390 -1,388 -31.8 1,555 700.4 453.5
* See following page for 'description of each predetermined variable.
-44-

Explanatory Notes for Predetermined Variables
q,• =production of high protein feeds other than soybean meal in the United States in soybean meal equivalent, thousand tons. For details, see appendix table A-4.
Lt =livestock production units (hogs, cattle, and poultry) based on concentrates in the United States, in thousands. For details of the method of construction of the series, see Livestock-Production Units, 1910-1961, Stat. Bull. No. 235, USDA, ERS, Feb. 1963. The data for recent years were obtained from Supplement for 1966 to Livestock-Feed Relationships, 1909-1965, Supplement for 1966 to Stat. Bull. No. 337, USDA, ERS, Nov. 1966.
qtdp =percentage of digestible protein in concentrates for all livestock and poultry, United States. Data from Economic Implications of Urea and Natural Protein Feeds. Address, American Soybean Congress, Memphis, Tenn., Aug. 16, 1965, by Earl F. Hodges, Agricultural Economist, ERS, USDA.
Et = real personal consumption expenditure on food in the United States in million dollars. The series was constructed from the quarterly data on personal consumption expenditure on food and beverages published in U.S. Department of Commerce, Office of Business Economics, Survey of Current Business (monthly) . The expenditure data were deflated by the consumer price index (retail) for food (Survey of Current Business) . ·
Pth+I =wholesale price index of butter and lard in the United States. The series was constructed by weighting the index numbers of wholesale prices of butter (seasonally adjusted) and lard as published in ERS, USDA, Fats and Oils Situation. The relative weights of butter (265) and lard ( 80) were based on the relative importance of the two commodities in the total weights of the wholesale price index. See Wholesale Prices and Price Indexes, 1961, Summary Volume (a reprint from BLS Bulletin No. 1382), U.S. Department of Labor, Bureau of Labor Statistics, Feb. 1964.
qt"" = commercial supply of U.S. soybeans in the United States in · thousand bushels. Equals production less feed, seed, waste, and residual disposition. (Source: Blue Book.)
St" =crop year opening stocks of soybeans in the United States held by private firms in thousand bushels. (Source: Blue Book.)
St = crop year opening stocks of soybe~n oil in the United States in million pounds. (Source: Stat. Bull. 376.)
It = index of national income in the countries import-ing U.S. soybeans and soybean products. The series is based on estimates of national income
published by the United Nations in the Annual Statistical Year Book and the Monthly Bulletin of Statistics. These estimates were deflated by the Consumer Price Index from the same publications. These estimates were then adjusted from different fiscal years to the common OctoberSeptember year on the assumption that the income was uniformly distributed over the year for which it was reported. Then an index number was computed for each country with 1950 as the base. From these indexes, a weighted index number for all the countries was constructed. Since the main purpose of the index was for use in the world fats, oils, and oilseeds markets, the relative weight for each country reflects its relative importance in the world fats and oils markets. These weights were based on the total imports of food fats and oils from all sources during the period 1946-63.
Ft =production of feed grains (oats, barley, and corn) in the countries importing U.S. soybeans and soybean meal, in thousand metric tons. Data are from F AO, Annual Production Year Book, and Monthly Bulletin of Agricultural Economics and Statistics. ·
Ltw =livestock units, i.e., cattle, hogs, and poultry, in countries importing soybean meal from the United States, in thousands. The data on livestock numbers were obtained from FAO annual Production Year Book. Since the three categories of livestock are not of equal importance in consumption of· soybean meal, they were weighted in the ratio of cattle, 1.000; hogs, 0.400; and poultry, 0.025. These weights were based on the feeding ratios in Western Europe. Nonavailability of data prevented the use of different ratios for different countries. However, since Western Europe is the major importer of U.S. soybean meal, using Western European ratios seems reasonable.
Wt =crushing and handling margin, dollars per bushel. The margin was calculated as a residual:
Wt = 0.10860 Pt0 + 0.47385 Ptm - Pt"
gt" = change in stocks of soybeans owned by CCC, in thousand bushels. (Source: Blue Book.)
stm = change in total U.S. stocks of soybean meal, million pounds. (Source: Blue Book.)
qtcod = quantity of cottonseed oil demanded (domestic disappearance) in the United States in million pounds. (Source: Stat. Bull. 376 and Fats and Oils Situation.)
qtoxpi = quantity of soybean oil shipped under PL 480 (except Title III, Barter), in million pounds. (Source of data, USDA, FAS, Foreign Agriculture Circular, FF07-65, May 1965.)
q{ox = quantity of cottonseed oil commercially exported from the United States in million pounds. (Data were obtained from Stat. Bull. 376 and Foreign Agriculture Circular, FF07-65, May 1965.)
-45-

Table A-3. Projected values of independent variables used in projection exercises (pages 26-31 ), 1965-1971.
Year beginning October
qtP
Thous. tons 1
1965 1966 1967 1968 1969 1970 1971
....... 6,448 6,608 6,678
....... 6,929 ....... 7,088
............ 7,250 7,410
Lt Tho us.
150,404 155,731 161,058 166,385 171,712 177,039 182,366
13.0 13.2 13.4 13.6 13.8 14.0 14.2
Et Mil. dol.
89,463 91,170 92,877 94,584 96,291 97,998 99,705
Ptb+I Index
100.0 100.0 100.0 100.0 100.0 100.0 100.0
It Index
209.5 216.8 224.1 231.4 238.6 245.9 253.2
Ft Thous.
met. tons
87,300 89,558 91,816 94,074 96,332 98,590
100,848
476,000 483,086 490,173 497,260 504,346 511,433 518,519
1,500 1,500 1,500 1,500 1,500 1,500 1,500
200.2 450.0 450.0 450.0 450.0 450.0 450.0
Table A-4. Production of high protein feed other than soybean meal in the United States in thousand short tons and soybean meal equivalent
Year beginning October
1 Linseed
meal
Cottonseed meal
Peanut Copra meal meal
Gluten feed
Soybean Tankage Dried Other meal and meat Fish milk milk equiv-
scraps meal products products alent
1946 ........................................... 370 1,434 98 190 1,040 740 191 120 1,300 6,448 1947 ............................................ 625 2,016 123 170 799 790 188 90 1,260 4,839 1948 ... ································· .... 687 2,416 117 128 348 817 189 110 1,280 5,271 1949 .............................. 689 2,497 138 154 916 813 218 115 1,400 5,534 1950 ...... 730 1,723 151 149 966 858 214 100 1,350 4,985 1951 ... ............... . ........ 495 2,524 94 122 897 912 197 110 1,265 5,323 1952 ................. 458 2,681 42 116 942 1,013 221 115 1,250 5,532 1953 ............................ 577 3,014 63 116 929 1,060 230 370 1,235 6,134 1954 .................................. 545 2,515 19 117 1,005 1,339 294 170 1,095 5,874 1955 .................... ·········· 582 2,628 57 112 1,072 1,557 342 170 1,045 6,343 1956 .................................. 576 2,294 63 113 1,010 1,502 298 165 935 5,836 1957 ....... ························· ........... 435 1,924 45 119 1,030 1,376 296 163 863 5,237 1958 ............... 452 2,154 75 115 1,046 1,468 354 174 793 5,616 1959 .. .... . ... ······· ....................... 361 2,508 60 131 1,142 1,657 335 153 737 6,006 1960 ..... .. . .......................... 399 2,465 75 139 1,098 1,691 350 167 726 6,053 1961 ·········· 342 2,629 54 122 1,237 1,757 363 165 679 6,255 1962 ....... 371 2,718 69 101 1,285 1,832 317 194 625 6,382 1963 ............ ... ·········· 400 2,730 79 93 1,368 1,938 299 215 568 6,534 _:_19:_:6:_:4:.___:.:=====·-··· _ .... _ .... _ .... _3_7_2 _ __:2,7 68::____ _ _::_9-=-8 _ ____::_1 0::_:1 __ 1.:___,4_:_0_:_6 _ ____:__:1,_93::_:0____::___:::2_:_9_:_1 __ 2_:_3_:_6 __ _:_5_::_1.::_5 __ 6~,.::_54_:_:_7_
To convert to soybean meol equivalent, the following conversion rates were used: linseed meal, .75; cottonseed meal, .80; peanut meal, 1.00; copra meal, .40; gluten feed, .60; tankage and meat scraps, 1.10; fish meal, 1.45; dried milk products, .70; and other milk products, .70. ·
These conversion rates are from USDA, ERS, Grain and Feed Stat:stics through 1961, Stat. Bull. No. 159. Revised June 1962, table 81, page 72. Source: Soybean Blue Book (1947 through 1966), American Soybean Association.
Appendix B
Estimates of Supply Relation The structural form of the simultaneous model in
cludes a supply relationship based on harvested soybean acreage, lagged prices, changes in the support rate, and acreages of competing crops. Since this relation has only one dependent variable, it was not necessary to include it in the simultaneous estimation and manipulation of the model. In fact, other estimates of quantities supplied were used in the projections.
However, statistical estimates of the general supply relation of table 1 are interesting in themselves. A
number of specifications were estimated by ordinary least squares, one of which is presented below. The following equation, based on 1945-64 data, is regarded as the best of the group: 1
atsh = 46,214.504 + 1,727.000 Pt-l" + 3,171.000 (1.536) (2.858)
Pt-2" + 6,588.000 dpt"" - 0.627 atw+ct+o
(3.463) (19.820) R2 = .967
1 The figures in parentheses below the regression coefficients are "t" values.
-46-

where:
atsh = acreage of soybeans harvested for commer-cial purposes, thousands.
Pt-l" =price of soybeans received by farmers in previous crop year, dollars per bushel.
Pt- 2 " = price of soybeans received by farmers in crop year prior to planting, dollars per bushel.
dpt"" = change in the support rate for soybeans announced prior to planting, dollars per bushel.
aw+ct+o= acres seeded for wheat in Nebraska, North Dakota, South Dakota, and Kansas; acres seeded for cotton in Louisiana, Arkansas, Mississippi, South Carolina, Virginia, and North Carolina; acres seeded for oats in Mis-
. souri, Iowa, Indiana, Ohio, Illinois, Wisconsin, Michigan, Minnesota, Nebraska, North Dakota, South Dakota, and Kansas, in thousand acres.
The estimated equation fits the data well, and the coefficients are large relative to their estimated standard errors. Furthermore, the estimated coefficients exhibit theoretically appropriate signs.
The estimated impact of market price change is distributed over the two lagged prices with the largest and most significant impact occurring in the second lag. This is reasonable since, at planting time, the closest crop year reference price for producers is the past year's market price, Pt-2" in this formulation. The price for crop year ( t-1) is partially determined
while beans are already in the ground. Hence, its main effect would be on cultivating and harvesting decisions, which are rather less critical than the basic planting decision. A sustained 10-cent farm price increase would lead to an estimated expansion of 173 thousand harvested acres in the first year and 317 thousand acres in the second year, other factors held constant. Using 1960-64 average prices and acreages, the indicated supply elasticity estimates are +.16 for the first crop year following a sustained price increase and +.29 for the second crop year.
Changes in the support rate indicate shifts in the possible bean price floor. Raising the floor price would be expected to increase plantings. The estimated impact of a 10-cent per bushel support rate increase is to boost acreage by 659 thousand acres, all else held constant. At 25 bushels to the acre, this is over 16 million bushels. A 25-cent increase would result in an estimated 41 million additional bushels of soybeans.
Acreages of competing crops are reflected in the composite variable, atw+ct+o. For each 100-acre decrease in plantings of these crops in the appropriate areas, soybean acreage increases an estimated 62.7 acres. No statistically significant results were observed when corn was included as a competing crop in the nationwide model. However, some additional analyses on a regional basis indicate a rather close relationship between soybeans and corn in the Corn Belt states. It is probable that the competitive relationship on the supply side between corn and soybeans has become closer in recent years.
Appendix C Table C-1. Reduced form of the simultaneous system, ordinary least squares, model I
Endogenous Predetermined variables
variables qtp Lt q,dp Et Ptb+I qtBS s,• s,o It
qtmd . 0.107,930 -.007,470 -167.353,024 +0.094,471 14.687,960 0.037,895 0.049,570 -1.556,326 -71.221,473
qtorl ...... 0.008,328 -.000,576 -12.912,982 +0.012,350 +1.920,100 0.007,404 -0.001,135 +0.482,340 -18.534,320
St 8 -1.294,084 +0.089,564 +2,006.575,814 -0.433,068 -67.331,694 -0.017,308 -1.078,187 +23.425,654 + 106.743,213
St 0 ......... +0.017,516 -0.001,212 -27.159,375 +0.019,333 +3.005,865 0.001,155 0.013,574 -0.924,158 -2.269,667
qtsx ............... -1.173,647 0.081,228 + 1,819.829,573 -1.726,939 -268.497,838 0.150,862 -0.055,204 +12.158,603 + 1 ,521.684,042 qtox +0.000,956 -0.000,066 -1.482,405 -0.008,225 -1.278,856 0.000,850 -0.000,130 +0.055,372 +3.119,267
qtmx . ........... +o.oo9,004 -0.000,623 -13.961,195 +o.oo7,881 1.225,323 0.003,161 0.004,135 -0.129,834 -5.941,553
ptm -0.001,755 0.000,121 2.720,916 -0.000,070 -0.010,912 -0.000,028 -0.000,037 +0.001,156 +0.052,913
pto ............ .... -0.000,098 +0.000,007 +0.151,312 +o.ooo,840 +0.130,536 -0.000,087 +0.000,013 -0.005,652 +0.217,182
Pt' ·················· -0.000,842 +o.ooo,058 +1.305,739 +0.000,058 +0.009,005 -0.000,023 0.000,016 0.000,066 0.058,659
qtop ............... +0.026,800 -0.001,855 -41.554,762 0.023,458 +3.647,109 0.009,410 0.012,309 -0.386,445 -17.684,720
qtmp ............ +0.116,933 -0.008,093 -181.314,219 0.102,352 15.913,282 0.041,057 0.053,706 -1.686,160 -77.163,025
qtsc ............... +2.467,730 -0.170,792 -3,826.405,387 2.160,006 335.829,533 0.866,446 1.133,391 -35.584,257 -1 ,628.427,255
-47-

Table C-1. (continued) Reduced form of the simultaneous system, ordinary least squares, model I
Endogenous Predetermined variables
variables ft ·Lt w Wt g,' Stm q, oxpl qc cox Constant
qtmd 0.105,568 -0.034,580 -669.687,518 -0.040,315 -1.047,884 +0.028,208 -1.124,652 10,176.501,308 qtod . .. . ............ +o.oo9,129 -0.000,122 -136.377,499 -0.007,349 -0.003,695 -0.411,777 +0.852,979 7 42.824,67 4 St' -0.115,980 0.018,946 -233.085,605 +0.069,940 +0.574,128 8.981,717 5.155,566 2,315.138,061 St 0 ................... +o.oo2,628 -0.000,256 -14.253,854 -0.001,818 -0.007,771 -0.332,947 -0.230,158 -1,201.348,603 qtsx .............. ································· -1.063,094 +0.017,183 15,545.004,449 -0.148,167 +0.520,695 -9.626,665 20.558,793 -6,127.488,399 qtox +0.001,048 -0.000,014 -15.656,086 -0.000,844 -0.000,424 -0.248,272 -0.902,078 499.926,054 qtmx ...... -0.049,698 +o.032,868 -55.867,756 -0.003,363 -0.003,995 +0.002,353 -0.093,823 -9,995.853,087 ptm ........ -0.000,078 +0.000,026 +0.497,539 +o.ooo,o3o +o.ooo,779 -0.000,021 +0.000,836 -29.012,377 Pt o ......... -0.000,107 +o.000,001 +1.598,049 +0.000,086 +o.ooo,o43 +0.004,825 -0.009,995 -52.618,358 Pt 8 ······· ............ -0.000,049 +0.000,012 -0.590,693 +0.000,024 +0.000,374 +0.000,514 -0.000,690 -19.461,868 qtop +0.012,805 -0.000,392 -166.287,439 -0.010,010 -0.011,890 +0.007,004 -0.279,258 + 41.402,125 qtmp +0.055,870 -0.001,712 -725.555,274 -0.043,678 -0.051,878 +0.030,561 -1.218,475 +180.648,221 qt sc ...... +1.179,074 -0.036,129 -15,311.918,843 -0.921,772 -1.094,823 0.644,948 -25.714,359 +3,812.350,337
Table C-2. Reduced form of the simultaneous system, ordinary least squares, model II
Endogenous Predetermined variables
variables q,• Lt q,dp Et Pt b+l qt ss s,' St o It
qtmd . -0.156,106 0.010,804 242.055,267 0.039,946 6.210,608 0.038,100 0.043,229 -1.084,402 -73.903,622 qtod -0.039,804 0.002,755 61.718,462 0.002,410 0.374,755 0.007,442 -0.002,291 0.568,368 -19.023,252 st' -0.836,026 0.057,862 1,296.322,023 -0.338,476 -52.624,930 -0.017,663 -1.067,186 22.606,947 111.396,285 St 0 0.005,611 -0.000,388 -8.699,940 0.016,875 2.623,638 0.001,164 0.013,288 -0.902,880 -2.390,600 q, " 4.405,290 -0.304,891 -6,830.739,937 -0.574,854 -89.376,106 0.146,541 0.078,788 2.187,120 1,578.356,359 qt ox ....... -0.004,569 0.000,316 7.085,256 -0.009,366 -1.456,261 0.000,854 -0.000,263 0.065,248 3.063,138 qtmx ............... -0.013,023 0.000,901 20.193,126 0.003,332 0.518,111 0.003,178 0.003,606 -0.090,465 -6.165,308 Ptm -0.001,586 0.000,108 0.024,167 -0.000,030 -0.004,614 -0.000,028 -0.000,032 0.000,806 0.054,906 Pt 0 0.000,466 -0.000,032 -0.723,207 -0.000,956 0.148,644 -0.000,087 0.000,027 -0.006,660 0.222,911 pt' -0.000,688 0.000,048 1.066,636 0.000,090 0.013,956 -0.000,023 -0.000,012 -0.000,342 0.050,225 qtop -0.038,762 0.002,683 60.103,779 0.009,919 1.542,131 0.009,460 0.010,734 -0.269,264 -18.350,714 qtmp -0.169,130 0.011,705 262.248,393 0.043,278 6.728,719 0.041,278 0.046,835 -1.174,867 -80.068,929 qt sc -3.569,264 0.247,030 5,534.417,914 0.913,330 142.001,036 0.871,122 0.988,398 -24.794,067 -1 ,689 .7 52,644
Table C-2. (continued) Reduced form of the simultaneous system, ordinary least squares, model II
Endogenous Predetermined variable~
variables ft lt w Wt ' m oxpl qt cox Constant gt St qt
qtmd 0.096,703 -0.030,714 -196.730,425 -0.040,210 -0.930,742 -0.226,502 -0.475,544 + 8,464.542,590 qtod 0.007,512 0.000,583 -50.161,682 -0.007,330 0.017,659 -0.458,208 0.971,305 +430.750,021 st' -0.100,599 0.012,240 -1,053.585,765 0.069,757 0.370,908 9.423,595 4.029,474 + 5,285.095,425 St 0 0.002,228 -0.000,082 7.070,876 -0.001,813 -0.002,489 -0.344,432 -Q.200,891 -1,278.537,543 qt sx -0.875,763 -0.064,496 5,551.684,097 -0.150,387 -1.954,432 -4.244,789 6.843,500 +30,045.247,254 qtox 0.000,862 0.000,067 -5.758,542 -0.000,841 0.002,027 -0.253,602 -0.888,495 +464.1 00,000 qtmx -0.050,438 0.033,191 -16.411,964 -0.003,354 0.005,778 -O.Ql8,896 -0.039,672 -10' 138.670,878 Ptm -0.000,072 0.000,023 0.146,159 0.000,030 0.000,691 0.000,168 0.000,353 -27.740,491 pto -0.000,088 -0.000,007 0.587,786 0.000,086 -0.000,207 0.005,369 -0.011,382 -48.961,519 Pt ' ......... -0.000,044 0.000,010 -0.866,909 0.000,023 0.000,305 0.000,663 -0.001,069 -18.462,053 qtop 0.010,603 0.000,568 -48.849,348 -0.009,984 0.017,197 -0.056,242 -0.118,080 -383.687,521 qtmp 0.046,265 0.002,476 -213.142,389 -0.043,564 0.075,035 -0.245,398 -0.515,216 -1,67 4.128,288 qt sc 0.976,362 0.052,256 -4,498.098,332 -0.919,370 1.583,524 -5.178,805 -10.872,974 -35,330.342,678
Table C-3. Reduced form of the simultaneous system, ordinary least squares, model Ill
Endogenous Predetermined variables
b+l variables q,• lt qtdp E, Pt qt ss St' s,o It
qtmd 0.109,779 -0.007,598 -170.220,148 0.066,404 9.820,250 0.039,539 0.049,318 -1.449,230 -75.336,727 qtO(l 0.008,570 -0.000,593 -13.287,790 0.008,681 1.283,763 0.007,619 -0.001,168 +0.496,341 -19.072,291
' ................ -1.302,560 0.090,151 2,019.719,120 -0.304,404 -45.017,419 -0.024,845 -1.077,032 +22.934,710 + 125.608,123 St St 0 0.017,894 -0.001,238 -27.746,128 0.013,589 2.009,697 0.001,492 0.013,522 -0.902,241 -3.111,847 qt sx .......... -1.207,448 +.083,568 + 1,872.240,988 -1.213,866 -179.515,456 +.120,809 -0.050,596 + 10.200,872 + 1,596.911,434 qt ox +o.ooo,795 -0.000,055 -1.232,770 -0.005,782 -0.855,033 +0.000,707 -0.000,108 +0.046,048 3.477,575 qtmx +0.009,158 -0.000,634 -14.200,381 +o.oo5,540 +2.819,241 +0.003,299 +0.004,114 -0.120,900 -6.284,862 ptm -.001,756 +.000,122 +2.723,046 -.000,049 -.007,296 -.000,029 -.000,037 +.001,077 +.055,971
Pt 0 -0.000,081 +o.ooo,oo6 +0.125,831 +o.ooo,590 +0.087,275 -0.000,072 +0.000,011 0.004,700 +0.180,609 pt' -0.000,841 +o.ooo,o5s + 1.303,981 +o.ooo,041 +0.006,021 -0.000,022 -0.000,016 +0.046,136 qt op +0.027,259 -0.001,887 -42.266,687 +0.016,488 +2.438,427 +0.009,818 +o.012,246 -0.359,852 -18.706,562 qtmp +0.118,937 -0.008,232 -184.420,530 +0.071,943 + 10.639,490 +0.042,838 +0.053,433 -1.570,130 -81.621,589 qt sc +2.510,008 -0.173,718 -3,891.960,108 +1.518,270 +224.532,876 +0.904,036 +1.127,628 -33.135,582 -1 ,722.519,557
' Not significant to six decimal places.
-48-

Table C-3. (continued) Reduced form of the simultaneous system, ordinary least squares, model Ill
Endogenous ~--Predetermined variables
variables Ft Ltw Wt gt ' St m Gt cod Gtoxpl Gt cox Constant
md 0.107,595 -0.034,607 -699.967,998 -0.041,947 -1.048,704 -0.935,262 -0.063,221 -0.935,262 + 13,809.065,804 Gt Gtod 0.009,394 -0.000,125 -140.335,948 -0.007,562 -0.003,802 -0.122,263 -0.423,729 +0.877,737 -1,217.695,667 St s .. -0.125,271 +o.019,070 -94.275,583 +0.077,420 +0.577,888 +4.287,373 +9.400,838 + 4.287,373 -14,337.053,772 St 0 +0.003,043 -0.000,262 -20.450,701 -0.002,152 -0.007,939 -0.191,400 -0.351,658 -0.191,400 -457.950,595 Gtsx -1.100,146 +o.o 17,678 + 16,098.535,608 -0.118,339 +0.535,691 + 17.096,710 -7.955,339 +17.096,710 -72,531.246,153 qtox +o.ooo,8n -0.000,012 -13.019,614 -0.000,702 -0.000,353 +0.081,432 -0.240,311 -0.918,568 + 183.644,665 Gtmx -0.049,529 +0.032,866 -58.393,863 -0.003,499 -0.004,063 -0.078,023 -0.005,274 -0.078,023 -9,692.811,412 Ptm -0.000,080 +o.ooo,026 +0.520,036 +0.000,031 +0.000,779 +0.000,695 +o.ooo,047 +0.000,695 -31.711,162
Pt 0 -0.000,089 +0.000,001 + 1.328,939 +0.000,072 +.000,036 -0.008,312 +0.004,013 -0.008,312 -20.334,864 pt' .. -0.000,048 +0.000,012 -0.609,258 +o.ooo,023 +0.000,373 -0.000,573 +0.000,458 -0.000,573 -17.234,700 qtop +0.013,308 -0.000,399 -173.806,264 -0.010,416 -0.012,093 -0.232,231 -0.015,698 -0.232,231 +943.389,737 qtmp +0.058,066 -0.001,741 -758.361,861 -0.045,446 -0.052,767 -1.013,285 -0.068,495 -1.013,285 +4,116.254,392 qt sc + 1.225,417 -0.036,7 48 -16,004.260,025 -0.959,081 -1.113,579 -21.384,083 -1.445,499 -21.384,083 +86,868.299,925
Table C-4. Reduced form of the simultaneous system, ordinary least squares, model IV
Endogenous Predetermined variables
variables qt" lt qtdp Et Pt h+l
Gt " s,' s,o It
md Gt . -0.159,758 0.011,057 247.717,386 0.027,437 4.057,574 0.038,782 0.043,019 -1.032,239 -75.648,836
Gt od -0.040,024 0.002,770 62.060,120 0.001,656 0.244,838 0.007,483 -0.002,304 0.571,514 -19.128,560
St s -0.805,084 0.055,720 1,248.344,648 -0.232,484 -34.381,426 -0.023,448 -1.065,405 22.165,121 126.184,173 St 0 0.004,068 -0.000,282 -6.308,007 0.011,591 1.714,100 0.001,453 0.013,199 -0.880,852 -3.127,856 qt sx 4.457,840 -0.308,528 -6,912.222,820 -0.394,842 -58.392,060 0.136,716 0.081,812 1.436,741 1,603.471,525 qtox -0.003,713 0.000,257 5.757,604 -0.006,433 -0.951,419 0.000,694 -0.000,214 0.053,022 3.472,355 qtmx . -0.013,328 0.000,922 20.665,481 0.002,289 0.338,498 0.003,235 0.003,589 -0.086,115 -6.310,900 Ptm -0.001,556 0.000,108 2.412,543 -0.000,020 -0.003,015 -0.000,029 -0.000,032 0.000,767 0.056,203
Pt 0 0.000,379 -0.000,026 -0.587,691 0.000,657 0.097,113 -0.000,071 0.000,022 -0.005,412 0.181,142 pt' -0.000,696 0.000,048 1.079,360 0.000,062 0.009,118 -0.000,021 -0.000,013 -0.000,224 0.046,304 qtop -0.039,669 0.002,745 61.509,717 0.006,813 1.007,250 0.009,630 0.010,682 -0.256,316 -18.784,061 qt mp .. -0.173,086 0,011,979 268.382,867 0.029,726 4.396,072 0.042,018 0.046,608 -1.118,374 -81.959,735 Gt sc -3.652,756 0.252,808 5,663.878,173 0.627,325 92.773,486 0.886,732 0.983,593 -23.601,862 -1,729.655,697
Table C-4. (continued) Reduced form of the simultaneous system, ordinary least squares, model IV
Endogenous Predetermined variables
variables Ft Ltw Wt g,' St m Gt
cod Gt
OX}ll qt cox Constant
md 0.097,392 -0.030,661 -201.332,314 -0.040,882 -0.929,122 -0.386,436 -0.268,539 -0.386,436 +9,936.831,564 qt qtod 0.007,554 0.000,586 -50.439,365 -0.007,370 0.017,757 -0.023,318 -0.460,744 0.976,682 +519.589,534 St ' .. -0.106,439 0.011,787 -1,014.592,151 0.075,455 0.357,180 3.274,422 9.779,786 3.274,422 -7,190.189,967 St 0 0.002,520 -0.000,060 5.126,833 -0.002,097 -0.001,805 -0.163,248 -0.362,190 -0.163,248 -656.576,981 qtsx -0.885,682 -0.065,266 5,617.909,313 -0.140,710 -1.977,746 5.561,149 -3.639,847 5.561,149 +8,857.714,285 qt ox 0.000,701 0.000,054 -4.679,493 -0.000,684 0.001,647 0.090,611 -0.243,745 -0.909,389 + 118.878,133 qtmx -0.050,380 0.033,195 -16.79 5,870 -0.003,411 0.005,913 -0.032,238 -0.022,402 -0.032,238 -1,005.847,204 ptm .. -0.000,073 0.000,023 0.149,578 0.000,030 0.000,690 0.000,287 0.000,200 0.000,287 -28.834,316 pt: -0.000,072 -0.000,006 0.477,645 0.000,070 -0.000,168 -0.009,249 0.004,363 -0.009,249 -13.724,011 pt -0.000,042 0.000,010 -0.877,250 0.000,022 0.000,309 -0.000,868 0.000,568 -0.000,868 -15.153,568 Gt 0 P 0.010,774 0.000,581 -49.992,024 -0.010,151 0.017,599 -0.095,954 -0.066,680 -0.095,954 -18.109,314 qtmp 0.047,012 0.002,534 -218.128,184 -0.044,293 0.076,791 -0.418,673 -0.290,941 -0.418,673 -79.015,640 qt sc 0.992,120 0.053,479 -4,603.317,162 -0.934,745 1.620,566 -8.835,570 -6.139,939 -8.835,570 -1,667.524,318
Table C-5. Reduced form of the simultaneous system, two-stage least squares, model I
Endogenous Predetermined variables
variables qt" lt qtdp E, Pt h+l Gt ss s, s s,o ,,
qtmd 0.434,776 -0.025,661 -690.435,296 0.100,198 29.384,802 0.038,453 0.053,144 -1.253,689 -72.635,512 qt od 0.095,401 -0.005,631 -151.499,006 0.024,438 7.167,029 0.008,438 0.011,661 0.366,139 -19.282,460 St s -0.772,224 0.045,578 1,226.311,816 -0.021,103 -6.188,851 0.013,938 -1.362,783 11.607,001 55.194,909 St 0 0.010,288 -0.000,607 -16.338,568 0.002,300 0.674,500 0.000,910 0.001,258 -0.690,094 -1.721,849 qtsx ... -9.222,748 0.544,344 14,645.971,930 -2.282,322 -699.332,696 0.102,075 0.141,073 17.213,818 1,614.608,862 qtox 0.002,856 -0.000,168 -4.535,427 -0.001,723 -0.505,366 0.000,252 0.000,349 0.010,961 2.870,241 qtmx 0.038,836 -0.002,292 -61.672,870 0.008,950 2.624,786 0.003,435 0.004,747 -0.111,985 -6.488,139 Ptm -0.001,464 0.000,086 2.324,443 -0.000,052 -0.015,324 -0.000,020 -0.000,028 0.000,654 0.037,879 pt: -0.000,723 0.000,043 1.148,355 0.000,436 0.127,957 -0.000,064 -0.000,088 -0.002,775 0.146,160 Pt -0.000,772 0.000,046 1.226,148 0.000,023 0.006,635 -0.000,016 -0.000,023 0.000,008 0.033,822 qt op 0.108,545 -0.006,406 -172.373,001 0.025,015 7.336,164 0.009,600 0.013,268 -0.312,994 -18.134,069
mp qt . 0.473,612 -0.027,953 -752.108,165 0.109,148 32.009,588 0.041,888 0.057,891 -1.365,674 -79.123,652 qt sc 9.994,971 -0.589,922 -15,872.283,7 46 2.303,425 675.521,548 0.883,987 1.221,710 -28.820,819 -1,669.803,772
-49-

Table C-5. (continued) Reduced form of the simultaneous system, two-stage least squares, model I
Endogenous------------------------------------------~P~re~d~et~e~rm~i~ne~d~v~a~r'~•a~b~le~•---------------------------------variables ft Wt
qtmd ............... ................................. 0.114,152
;:8od ... ::::::::::::::::::::::::::::::::::::::::::::::::::: _g:g!!:~~! -0.039,049 -1,530.887,794 -0.001,327 -335.915,589
0.010,743 341.072,044 St 0 ..........•..........•......•........•.•...•....••.... 0.001 ,423 -0.000,143 -36.227,166 q,•x ................................................. -1.328,560 0.128,310 34,852.211,949 q,ox ................................................... 0.000,395 -0.000,040 -10.056,308 q,mx ................................................ -0.048,627 0.032,460 -136.7 45,968 Pt m ................................................... -0.000,060 0.000,020 0.798,356 pt 0 ., .................................................... -0.000,100 0.000,010 2.546,223 Pt" ...................................................... -0.000,039 0.000,011 -0.345,179 qtop ................................................. 0.015,017 -0.001,510 -382.199,064 q,mp ........................ ......................... 0.065,525 -0.006,589 -1,667.633,762 q,•• ...................................................... 1.382,814 -0.139,053 -35,193.283,993
-0.040,139 -0.008,807
0.029,292 -0.000,950 -0.106,550 -0.000,264 -0.003,585
0.000,021 0.000,068 0.000,017
-0.010,021 -0.043,724 -0.922,742
-1.183,295 1.031,303 -0.040,220 -0.592,462
0.325,558 -0.217,207 -0.004,338 0.023,672
3.888,173 -23.491,217 -0.001,204 -0.173,736 -0.016,373 0.092,121
0.000,617 -0.000,538 0.000,305 0.004,491 0.000,326 0.000,233
-0.045,761 0.257,473 -0.199,668 1.123,423 -4.213,731 23.708,424
qtcox Constant
-0.610,961 15,288.611,867 0.350,985 1,268.272,201 0.128,677 -19,488.116,848
-0.014,024 31.096,767 13.916,598 -105,443.540,126
-0.489,492 57.388,826 -0.054,574 -9,368.725,302
0.000,319 -22.347,554 -0.002,660 -41.453,684 -0.000,138 -15.091,258 -0.152,532 1,356.757,795 -0.665,535 5,919.886,566
-14.045,275 124,931.656,974
Table C-6. Reduced form of the simultaneous system, two-stage least squares, model II
Endogenous Predetermined variables
variables q,• lt q,•• E, Pt b+l qtss s,• s,o It
qtmd ............ -0.110,962 0.006,549 176.210,849 0.120,347 3.621,140 0.038,972 0.053,862 -0.551,557 -76.259,401 qtod -0.024,348 0.001,437 38.665,127 0.005,162 1.513,829 0.008,552 0.011,819 0.520,204 -20.077,633 St ' --0.373,956 0.022,072 593.851,500 0.043,008 12.612,933 0.013,559 -1.363,307 11.094,600 57.839,548 St 0 ...... -0.002,626 0.000,155 4.169,881 0.000,221 0.064,825 0.000,922 0.001,274 -0.673,478 -1.807,606 qtsx ..... 2.924,842 -0.172,630 -4,644.728,695 -0.326,863 -95.858,629 0.090,511 0.125,091 1.585,038 1,695.273,103 qtox ... -0.000,729 0.000,043 1.157,518 -0.002,300 -0.674,606 0.000,256 0.000,354 0.015,573 2.846,436 qtmx ........... -0.009,912 0.000,585 15.739,967 0.001,103 0.323,457 0.003,482 0.004,811 -0.049,268 -6.811,842 Pt
m .... -0.001,179 0.000,070 1.872,488 -0.000,008 -0.001,888 -0.000,020 -0.000,028 0.000,288 0.039,769 Pt0 0.000,184 -0.000,011 -0.293,080 0.000,582 0.170,808 -0.000,065 -0.000,090 -0.003,943 0.152,187 pt' ................. -0.000,539 0.000,032 0.855,450 0.000,060 0.017,655 -0.000,017 -0.000,023 -0.000,292 0.035,372 qtop ........ -0.027,703 0.001,635 43.992,526 0.003,083 0.904,048 0.009,730 0.013,447 -0.137,701 -19.038,803 qtmp ...... -0.120,874 0.007,134 191.950,816 0.013,450 3.944,597 0.042,454 0.058,673 -0.600,825 -83.071,243 qtsc ......... -2.550,887 0.150,558 4,050.877,195 0.283,855 83.245,896 0.895,930 1.238,216 -12.679,637 -1,753.112,651
Table C-6. (continued) Reduced form of the simultaneous system, two-stage least squares, model II
Endogenous Predetermined variables
variables ft lt w Wt g,• Stm qtoxpl qtcox Constant
qtmd ......................... 0.097,159 -0.031,456 -1 89.306,660 -0.040,681 -0.953,220 0.127,089 -0.075,290 11,336.070,184 qtod ............ ............................ 0.009,470 0.000,339 -41.538,680 -0.008,926 0.010,265 -0.790,870 0.468,525 407.567,121 St ' ............................ -0.041,853 0.005,202 -637.985,940 0.029,688 0.157,654 0.442,669 -0.262,245 -16,625.527,581 St 0 ........................................ 0.001,021 0.000,036 -4.479,782 -0.000,963 0.001,107 0.002,275 -0.001,348 -61.726,868 qtsx ...... ........................................... -0.950,314 -0.040,691 4,989.920,214 -0.094,479 -1.233,070 -3.364,300 1.993,069 -18,131.575,766 qtox ··············································· 0.000,284 0.000,010 -1.243,544 -0.000,267 0.000,307 -0.179,676 -0.485,974 31.621,889 qtmx ····························· -0.050,145 0.033,138 -16.909,745 -0.003,634 0.004,179 0.011,352 -0.006,725 -9,719.104,842 Ptm ··············· -0.000,051 0.000,016 0.098,723 0.000,021 0.000,497 -0.000,066 0.000,039 -20.301,953 pto .......... .......................... -0.000,072 -0.000,002 0.314,861 0.000,068 -0.000,078 0.005,995 -0.003,551 -34.929,583 Pt" ...... -0.000,032 0.000,007 -0.919,026 0.000,017 0.000,227 0.000,620 -0.000,367 -13.413,433 qtop. ..... ························· 0.010,775 q.ooo,385 -47.262,006 -0.010,157 0.011,679 0.031,729 -0.018,797 377.462,142 qtmp ......................... 0.047,0.14 0.001,682 -206.216,406 -0.044,315 0.050,958 0.138,441 -0.082,015 1,646.965,342 qtsc ..... .............................. 0.992,167 0.035,489 -4,351.934,274 ~0.935,209 1.075,416 2.921,630 -1.730,824 34,757.103,346
Table C-7. Reduced form of the simultaneous sxstem, tw~-stage least squares, model Ill
Endogenous Predetermined variables
variables q,• lt q,"• Et Ptb:I qtss s,• s,o It
qtmd ...... 0.215,447 -0.013,219 -338.163,962 0.032,012 15.106,207 0.041,898 0.058,255 -0.823,965 -79.726,449 qtod 0.046,802 -0.002,872 -73.460,479 0.010,242 4.~32,880 0.009,102 0.012,655 0.434,763 -23.887,566
s -0.546,453 0.033,528 857.709,498 0.012,4.82 5.~89,884 0.013,075 -1.372,217 12.356,594 58.444,983 St 0 0.005,066 -0.000,311 -7.5152,455 0.000,201 0.094,936 0.000,985 0.001,370 -0.658,302 -1.929,205 St
qtsx ......... -4.406,411 0.270,355 6,916.276,558 -0.748,409 -353.163,565 0.023,739 0.033,007 6.585,377 1,774.370,965 qtox 0.001,919 -0.000,118 -3.q12,554 -0.002,451 -1.156,423 0.000,373 0.000,519 0.017,829 5.912,390 qtmx 0.019,245 -0.001,181 -30.206,367 0.002,859 1.349,356 0.003,742 0.005,204 -0.073,600 -7.121,535 Ptm -0.001,414 0.000,087 2.220,146 -0.000,018 -0.008,339 -0.000,023 -0.000,032 0.000,455 0.044,009
Pt 0 ········· -0.000,241 0.000,015 0.:178,938 0.0'00,308 0.145,462 -0.000,047 -0.000,065 -0.002,243 0.123,221 pt" ..... ······ -0.000,696 0.000,043 1.093,169 0.000,025 0.011,846 -0.000,016 -0.000,022 -0.000,028 0.034,236 qtO}J 0.053,788 -0.003,300 -84.425,4!18 0.007,992 3.771,392 0.010,460 0.014,544 -0.205,710 -19.904,381 qtmp 0.234,691 -0.014,399 -36~.370,329 0.034,872 16.455,563 0.045,640 0.063,458 -0.897,565 -86.847,984 qtsc 4.952,864 -0.303,883 -7,773.986,055 0.735,927 347.273,681 0.963,185 1.339,210 -18.941,971 -1,832.815,948
-50-

Table C-7. (continued) Reduced form of the simultaneous system, two-stage least squares, model Ill
Endogenous Predetermined variables
cod qtoxpl variables Ft ltw Wt gt' Stm qt. qtcox Constant
qtmd ............... 0.109,471 -0.036,029 -868.713,877 -0.043,735 -1.091,797 -0.457,320 0.314,636 -0.457,320 16,667.374,435 qtod ............... 0.012,050 -0.000,658 -188.713,598 -0.009,501 -0.019,941 -0.146,309 -0.587,339 0.853,691 1,645.492,228 St ' -0.047,446 0.007,683 -48.131,414 0.030,193 0.232,830 -0.178,308 0.122,676 -0.178,308 -17,859.274,455 St 0.001,304 -0.000,071 -20.429,166 -0.001,028 -0.002,159 -0.002,874 0.001,977 -0.002,874 114.135,930 qtsx ··············· -1.227,762 0.061,956 20,018.827,063 -0.024,780 1.877,465 10.961,559 -·7.355,792 10.691,559 -138,883.203,203 qtox ............... 0.000,494 -0.000,027 -7.738,991 -0.000,390 -0.000,818 0.035,009 -0.336,086 -0.964,991 -57.404,851 qtmx ............... -0.049,045 0.032,729 -77.597,536 -0.003,907 -0.008,200 -0.040,850 0.028,105 -0.040,850 -9,240.132,131 Ptm ............... -0.000,060 0.000,020 0.479,530 0.000,024 0.000,603 0.000,252 -0.000,174 0.000,252 -24.421,434 pto .................. -0.000,062 0.000,003 0.973,458 0.000,049 0.000,103 -0.004,404 0.003,030 -0.004,404 -19.390,207 Pt' .............. ... -0.000,035 0.000,010 -0.667,057 0.000,017 0.000,297 -0.000,359 0.000,247 -0.000,359 -13.677,873 qtop ............... 0.013,849 -0.000,756 -216.881,755 -0.010,919 -0.022,918 -0.114,174 0.078,552 -0.114,174 1,702.223,307 qtmp ............... 0.060,426 -0.003,300 -946.311,413 -0.047,641 -0.099,996 -0.498,170 0.342,741 -0.498,170 7,427.242,304 qtsc ............... 1.275,208 -0.069,640 -19,970.695,649 -1.005,413 -2.110,296 -10.513,250 7.233,116 -10.513,250 156,7 42.477,657
Table C-8. Reduced form of the simultaneous system, two-stage least squares, model IV
Endogenous Predetermined variables
variables qt" lt q,•• Et Ptb+I qtss s,' s,o It
q t md ............... -o. 1 06,479 0.006,533 167.129,372 0.006,053 2.856,262 0.039,665 0.055,150 -0.556,919 -77.447,412 qt 0 d ............... -0.023,131 0.001,419 36.306,068 0.004,602 2.171,783 0.008,616 O.Dl1,980 0.492,774 -23.392,484 St ' -0.324,207 0.019,892 508.873,869 0.030,403 14.346,788 0.014,617 -1.370,074 12.172,236 56.871,620 St 0 .................. -0.002,504 0.000,154 3.930,309 -0.000,409 -0.193,141 0.000,933 0.001,297 -0.652,022 -1.875,610 qt 2.772,041 -0.170,078 -4,350.978,754 -0.169,551 -80.008,843 0.073,533 0.102,240 0.630,664 1,723.551,980 qtox ............... -0.000,948 0.000,038 1.488,882 -0.002,682 -1.265,552 0.000,353 0.000,491 -0.020,208 5.932,693 qtmx ............... -0.009,511 0.000,584 14.928,767 0.000,541 0.255,134 0.003,543 0.004,926 -0.049,746 -6.917,960 Ptm -0.001,237 0.000,076 1.941,224 -0.000,003 -0.001,577 -0.000,022 -0.000,030 0.000,307 0.042,751 pto .................. 0.000,119 -0.000,007 -0.187,281 0.000,337 0.159,189 -0.000,044 -0.000,062 -0.002,542 0.120,668 Pt' .................. -0.000,573 0.000,035 0.899,510 0.000,035 0.016,541 -0.000,015 -0.000,021 -0.000,130 0.033,362 qtop ............... -0.026,583 0.001,631 41.725,259 0.001,511 0.713,090 0.009,903 0.013,769 -0.139,039 -19.335,400 qtmp -0.115,990 0.007,116 182.058,140 0.006,594 3.111,396 0.043,208 0.060,076 -0.606,665 -84.365,372 qt sc ...... -2.447,834 0.150,187 3,842.104,885 0.139,148 65.662,054 0.911,850 1.267,834 -12.802,899 -1,780.423,600
Table C-8. (continued) Reduced form of the simultaneous system, two-stage least squares, model IV
Endogenous Predetermined variables
variables Ft ltw Wt gt' Stm qt cod qtoxpl qtcox Constant
qtmd ............... 0.097,467 -0.031,503 -173.449,130 -0.041,404 -0.954,632 -0.086,470 0.059,491 --0.086,470 12,024.892,403 od 0.009,442 0.000,325 -37.678,930 -0.008,994 0.009,856 -0.065,748 -0.642,765 0.934,252 636.990,454 qt
St s -0.039,159 0.004,558 -528. 116,205 0.028,584 0.138,137 -0.434,330 0.298,819 -0.434,330 -14,654.278,410 St 0.001,022 0.000,035 -4.078,928 -0.000,974 0.001,067 0.005,847 -0.004,023 0.005,847 4.960,702 qtsx ............... -0.960,098 -0.038,976 4,515.504,776 -0.076,756 -1.181,100 2.422,162 -1.666,447 2.422,162 -35,363.075,905
ox 0.000,387 0.000,013 -1.545,182 -0.000,369 0.000,404 0.038,313 -0.338,359 -0.961,687 -98.762,689 qt ............... qtmx ............... -0.050,117 0.033,134 -15.493,277 -0.003,698 0.004,052 -0.007,724 0.005,314 -0.007,724 -9,654.820,068 ptm ............... -0.000,054 0.000,017 0.095,744 0.000,023 0.000,527 0.000,048 -0.000,033 0.000.048 -21.858,782 pto .................. -0.000,049 -0.000,002 0.194,362 0.000,046 -0.000,051 -0.004,819 0.003,316 -0.004,819 -14.187,964 pt s .................. -0.000,031 0.000,008 -0.933,524 0.000,016 0.000,244 -0.000,501 0.000,344 -0.000,501 -11.898,597 qtop 0.010,852 0.000,374 -43.303,040 -0.010,337 0.011,326 -0.021,588 0.014,852 -0.021,588 543.188,468 qtmp 0.047,350 0.001,631 -188.942,407 -0.045,102 0.049,421 -0.094,193 0.064,805 -0.094,193 2,370.072,334 qtsc 0.999,256 0.034,418 -3,987.388,572 -0.951,827' 1.042,963 -1.987,832 1.367,628 -1.987,831 50,017.354,315
Table C-9. Reduced form coefficients of the modified version of model Ill
Endogenous Predetermined variables
variables qt• lt q,•• Et Ptb+l qtss St' Sto It md -0.133,464 0.008,189 209.484,787 0.025,107 11.847,519 0.034,509 0.049,963 -0.685,076 -68.418,013 qt od 0.037,275 -0.002,287 -58.505,944 0.014,789 6.978,516 0.007,962 0.011,528 . 0.403,175 -22.259,079 qt
St s .................. -0.471,037 0.028,900 739.336,481 0.012,459 5.879,215 0.053,659 -1.370,137 12.337,895 55.578,420 St 0 0.004,384 -0.000,269 -6.880,938 0.000,177 0.083,453 0.000,936 0.001,356 -0.657,949 -1.910,095 qtsx ............... -3.842,671 0.235,757 0,031.432,859 -0.682,981 -322.221,981 0.024,902 0.036,054 5.954,441 1,771.263,417 qtox 0.005,188 -0.000,318 -8.143,673 -0.007,685 -3.626,487 0.001,108 0.001,605 0.056,120 4.329,671 qtmx 0.337,869 -0.020,730 -530.317,692 0.006,659 3.142,383 0.009,153 0.013,252 -0.181,706 -18.146,887 ptm -0.001,222 0.000,075 1.917,844 -0.000,014 -0.006,540 -0.000,019 -0.000,028 0.000,378 0.037,767 Pt0 .................. -0.000,192 0.000,012 0.301,796 0.000,285 0.134,394 -0.000,041 -0.000,059 -0.002,080 0.114,821 pt' .................. -0.000,600 0.000,037 0.941,545 0.000,024 0.011,496 -0.000,013 -0.000,020 -0.000,047 0.030,365 qtop ............... 0.046,847 -0.002,874 -73.530,555 0.007,280 3.435,482 0.010,007 0.014,488 -0.198,655 -19.839,502 mp qt ........ 0.204,405 -0.012,541 -320.832,905 0.031,766 14.989,902 0.043,662 0.063,215 -0.866,782 -86.564,900 qtsc ........ 4.313,708 -0.264,667 -6,770.769,339 0.670,380 316.342,766 0.921,438 1.334,082 -18.292,335 -1,826.841,837
-51-

Table C-9. (continued) Reduced form coefficients of the modified version of model Ill
Endogenous __________________ P_rc_ed_e_te_rm_i_c_ne:_d_v_a.c_ria_b_le_s ________________ _
variables ft Lt w Wt Qt s St m qt cod qt oxpl qt cox Constant
qtmd ............... 0.090,481 -0.032,067 q,•• ............... 0.010,790 -0.000,540 St 8 .•.•.•....•....••• -0.043,104 0.006,824
St 0 .................. 0.001,269 -0.000,064 q,•x .............. -1.205,600 0.055,667 q,ox ............... 0.001,502 -0.000,075 q,mx ............... -0.031,311 0.029,105 pt m ......•........ -0.000,050 0.000,018 Pt o ....•............. -0.000,056 0.000,003 Pt • .................. -0.000,030 0.000,009
q,•• ··············· 0.013,561 -0.000,679
-745.069,474 -0.037,510 -171.905,286 -0.008,654 -79'.154,789 0.028,631 -20.217,939 -0.001,018
19,973.390,601 -0.027,068 -23.928,176 -0.001,205
-197.618,890 -0.009,949 0.411 ,279 0.000,021 0.886,754 0.000,045
-0.708,814 0.000,015 -216.051,401 -0.010,877
-0.943,134 -0.358,668 0.327,105 -0.358,668 -0.015,882 -0.211,265 -0.719,326 0.788,735
7,781.018,849 1 ,205.372,501
0.200,697 -0.177,985 0.162,323 -0.177,985 -19,987.219,083 -0.001,868 -0.002,526 0.002,304 -0.002,526 -12.169,111
1.637,269 9.754,843 -8.896,417 9.754,843 -87,425.916,774 -0.002,211 0.109,787 -0.188,126 -0.890,213 -26.969,734
-0.143,958 -0.095,131 0.086,960 -0.095,131 -2,691.247,406 0.000,521 0.000,198 -0.000,181 0.000,198 -18.998,958 0.000,082 -0.004,069 0.003,711 -0.004,069 -11.840,804 0.000,256 -0.000,348 0.000,317 -0.000,348 -10.288,567
-0.019,960 -0.104,005 0.094,852 -0.104,005 1 '166.506,655 q,mp ............... 0.059,170 -0.002,961 -942.688,364 -0.047,459 -0.087,092 -0.453,799 0.413,865 -0.453,799 5,089.771,443 q,•c 1.248,704 -0.062,491 -19,894.235,812 -1.001,563 -1.837,967 -9.576,858 8.734,094 -9.576,858 107,413.135,856
Appendix D
Table D-1, modeiiV.-Projected values of jointly determined variables, PL 480 oil exports, and bean supplies at meal, oil, and bean prices of $70/ton, 8 cents/pound, and $2.30/bushel, respectively, 1967-1971
Variable Units
Ptm = meal price ........... . .. $/ton
Pt0 =oil price .................... . . .............................. ¢/lb.
Pt8 =bean price qtmd = U.S. meal demand
= U.S. oil demand St" = bean stock change Stm = meal stock change
= oil stock change .
....... $/bu. ................. mil.lbs.
.... mil.lbs. ...... mil. bu. ...... mil.lbs.
............ mil. lbs.
= bean exports ..................... .......................... . .. mil. bu.
qtmx = meal exports ................... . qtox = commercial oil exports qtoxpl = PL 480 oil exports* ..
qtoxt = total oil exports ........ . qtop = oil production qtmp = meal production qt"" =bean crush .................. . qtss = total bean supply*
St" = bean stocks (open) .. (close)
Stm = meal stocks (open) (close)
St0 = oil stocks (open) (close)
....... mil.lbs. .. .. mil.lbs.
.. mil. lbs.
.. mil. lbs. ...... mil.lbs. .......... mil.lbs.
.... mil. bu. ..... mil. bu. ... mil. bu.
....... mil. bu. .mil.lbs.
... mil.lbs. ...... mil.lbs.
....... mil. lbs.
1967
70.00 8.0 2.30
23,693 5,664
-13.8
+20 +78 274.3 5,615 551
428
979 6,721
29,328 618.9 879.4 72.1 58.3
274 294 560 638
1968
70.00 8.0 2.30
24,861 5,783
+9.6 +14 +56 285.5 5,804 527
666
1,193 7,032
30,679 647.4 942.5
58.3 67.9
294 308 638 694
* Required to sustain the given price relationships. Bean supply is production less feed, seed, etc.
-52-
Crop year
1969 1970
70.00 8.0 2.30
25,950 5,903
-.9 +13 +47 296.6 6,059
510 880
1,390 7,340
32,022 675.8 971.5
67.9 67.0
308 321 694 741
70.00 8.0 2.30
27,074 6,022
+.6 +14 +44 307.9 6,282 496 1,086
1,582 7,648
33,370 704.2
1,012.7 67.0 67.6
321 335 741 785
1971
70.00 8.0
·2.30
28,202 6,142
+6.4 +14 +42 319.1 6,504 483 1,291
1,774 7,959
34,720 732.7
1,058.2 67.6 74.0
335 349 785 827

Table D-2, model Ill (mod.).-Proiected values of iointly determined variables, PL 480 oil exports, and bean supplies at meal, oil, and bean prices of $70/ton, 8 ce_nts/pound, and $2.30/bushel, respectively, 1967-1971
Crop year
Variable Units 1967 1968 1969 1970 1971
Ptm =meal price ..... ..................................... ... $/ton 70.00 70.00 70.00 70.00 70.00 Pt0 =oil price ......... ................................ . ...... ¢/lb. 8.0 8.0 8.0 8.0 8.0 Pt" =bean price . ......................................... $/bu. 2.30 2.30 2.30 2.30 2.30 qtmd =U.S. meal demand ···················· ..................... mil.lbs. 23,693 24,861 25,950 27,074 28,202 qtod = u.s. oil demand ........................... mil.lbs. 5,664 5,783 5,903 6,022 6,142 St" =bean stock change ............................................. mil. bu. -9.3 +8.2 +3.6 +1.9 Stm =meal stock change ......................................... mil.lbs. +17 +14 +13 +14 +14 Sto =oil stock change ......... ........................................ mil. lbs. +76 +56 +47 +44 +44 qtsx =bean exports ........................................................... mil. bu. 270.3 281.5 292.8 304.0 315.2 qtmx =meal exports ........................................................... mil.lbs. 5,881 6,141 6,398 6,659 6,920 qtox = commercial. oil exports ................................... mil.lbs. 615 653 693 733 773 qtoxvi = PL 480 oil exports* ............................................. mil. lbs. 425 616 774 935 1,095
qtoxt =total oil exports .................. .............. mil.lbs. 1,040 1,269 1,467 1,668 1,868 qtP =oil production ................. mil.lbs. 6,782 7,108 7,417 7,754 8,054 qtmp =meal production .............. ·················· ....... mil. lbs. 29,591 31,016 32,361 33,747 35,136 qtsc = bean crush .................................................................. mil. bu. 624.5 654.5 682.9 712.2 741.5 qt"" =total bean supply* ····················· ...................... mil. bu. 885.5 944.2 975.7 1,019.8 1,058.6 St" =bean stocks (open) .......... ..................... mil. bu. 70.4 61.1 69.3 69.3 72.9 '
(close) ........ ........................... mil. bu. 61.1 69.3 69.3 72.9 74.8 Stm =meal stocks (open) . ....... mil.lbs. 279 296 310 323 337
(close) .................... ....................... mil.lbs. 296 310 323 337 351 St0 =oil stocks (open) ................................................... mil.lbs. 569 647 703 750 794
(close) ................................................... mil.lbs. 647 703 750 794 838
* Required to sustain the given price relationships. Bean supply is production less feed, seed, etc.
Table D-3, model IV.-Projected values of jointly determined variables, PL 480 oil exports, and bean supplies at meal, oil, and bean prices of $70/ton, 10 cents/pound, and $2.50/bushel, respectively, 1967-1971
Variable Units
Ptm =meal price ............................................................ $/ton Pt0 = oil price ........................................................................ ¢/lb. Pt" = bean price ............................................................... $/bu. qtmd = U.S. meal demand ......................... mil. lbs. qtod = U.S. oil demand ........ . ..................... mil. lbs. St" = bean stock change ............................................. mil. bu. Stm = meal stock change ............................................. mil. lbs. St0 = oil stock change ............ . ..................... mil. lbs. qt"x = bean exports ........................................................... mil. bu. qtmx = meal exports ............................................................ mil. lbs. qtox = commercial oil exports .............. . ............ mil. lbs. qtoxpi = PL 480 oil exports* ....................... mil. lbs.
qtoxt = total oil exports .................................................. mil. lbs. qtop = oil production ....................................... mil. lbs. qtmp = meal production .. ...................... .. ..... mil. lbs. qt"c = bean crush ....... mil. bu. qt"" = total bean supply* .................... . ...... mil. bu. St" = bean stocks (open) ......................... mil. bu.
(close) ............................................. mil. bu. Stm = meal stocks (open) .......................................... mil. lbs.
(close) ............................................. mil. lbs. Sto = oil stocks (open) .................................................. mil. lbs.
(close) .................. mil. lbs.
1967
70.00 10.0 2.50
23,693 5,276
-13.7 +20 +75 273.3 5,615
351 1,020
1,371 6,722
2,9,328 618.9 878.5 72.1 58.4
274 294 560 635
1968
70.00 10.0 2.50
24,861 5,396
+9.6 +14 +54 284.6 5,805
328 1,254
1,582 7,032
30,679 647.4 941.6 58.4 68.0
294 308 635 689
* Required to sustain the given price relationships. Bean supply is production less feed, seed, etc.
-53-·
Crop year
1969
70.00 10.0 2.50
25,950 5,515
-.9 +13 +46 295.6 6,060
311 1,468
1,779 7,340
32,023 675.8 970.5 68.0 67.1
308 321 689 735
1970
70.00 10.0 2.50
27,074 5,634
+3.8 +14 +43 306.9 6,282
297 1,673
1,970 7,647
33,370 704.2
1,014.9 67.1 70.9
321 335 735 778
1971
70.00 10.0 2.50
28,202 5,754
+1.7 +14 +42 318.1 6,504
284 1,878
2,162 7,958
34,720 732.7
1,052.5 70.9 72.6
335 349 778 820

Table D-4, model Ill (mod.). Projected values of jointly determined variables, PL 480 oil exports, and bean supplies at meal, oil, and bean prices of $70/ton, 10 cents/pound, and $2.50/b:ushel, respectively, 1967-1971
Variable
Ptm = meal price .. Pt0 = oil price . Pt' =bean price qtmd = U.S. meal demand qtod = U.S. oil demand St8 =bean stock change . St111 = meal stock change St0 = oil stock change ...... . qtsx = bean exports . qtmx = meal exports . qtox = commercial oil exports . qtoxpl = PL 480 oil exports* .
qtoxt = total oil exports .. qtop = oil production qtmp =meal production qtsc =bean crush . qtss = total bean supply* ... . St8 =bean stocks (open) .... .
(close) stm = meal stocks (open) .
(close) St0 =oil stocks (open) .
(close)
Units
........... $/ton .... ¢/lb.
............ $/bu.
............ mil.lbs. ...... mil.lbs.
........... mil. bu. .... mil. lbs.
.. mil.lbs. ....... mil. bu.
mil.lbs. .. mil.lbs.
.......... mil. lbs.
......... mil.lbs. ...... mil.lbs.
......... mil.lbs. ..... mil. bu. .... mil. bu.
....... mil. bu.
........ mil. bu. ... mil.lbs.
............. mil.lbs. ........ mil.lbs. ........ mil.lbs.
1967
70.00 10.0 2.50
23,693 5,276
-9.6 +17 +72 266.2 5,881
523 910
1,433 6,781
29,591 624.5 881.1
70.4 60.8
279 296 569 641
1968
70.00. 10.0 2.50
24,861 5,396
+8.3 +14 +57 277.4 6,141
556 1,100
1,656 7,109
31,016 654.5 940.2
60.8 69.1
296 310 641 698
* Required to sustain the given price relationships. Bean supply is production less feed, seed, etc.
Crop year
1969
70.00 10.0 2.50
25,950 5,515
-.1 +13 +48 288.5 6,398
596 1,259
1,855 7,418
32,361 682.9 971.3
69.1 69.0
310 323 698 746
1970
70.00 10.0 2.50
27,074 5,634
+3.6 +14 +45 299.9 6,659
636 1,420
2,056 7,735
33,747 712.2
1,015.7 69.0 72.6
323 337 746 791
1971
70.00 10.0 2.50
28,202 5,754
+1.9 +14 +44 311.1 6,920
676 1,580
2,256 8,054
35,136 741.5
1,054.5 72.6 74.5
337 351 791 835
Table D-5, model IV. Projected values of jointly determined variables, PL 480 oil exports, and bean supplies at meal, oil, and bean prices of $79/ton, 9 cents/pound, and $2.60/bushel, respectively, 1967-1971
Crop year
Variable Units 1967 1968 1969 1970 1971
pm =meal price . ........... $/ton 79.00 79.00 79.00 79.00 79.00 t Pt0 =oil price . ..... ¢/lb. 9.0 9.0 9.0 9.0 9.0
Pt8 =bean price ............. $/bu. 2.60 2.60 2.60 2.60 2.60 qtmd =U.S. meal demand ........... mil. lbs. 22,878 24,045 25,135 26,258 27,387 qtod = U.S. oil demand .......... mil.lbs. 5,470 5,589 5,709 5,828 5,948 Sts = bean stock change ...... ..... mil. bu. -15.3 +10.3 -1.2 +4.0 +1.7 Stm = meal stock change ... .. mil.lbs. + 11 +14 +13 +14 +14 St o = oil stock change . ...... mil.lbs. +59 +48 +44 +42 +42 qtsx = bean exports .... ....... mil. bu. 272.8 284.1 295.1 306.4 317.7 qtmx = meal exports . .... mil. lbs. 5,541 5,732 5,987 6,209 6,432 qtox =commercial oil exports . ... mil.lbs. 536 517 502 489 475 qtoxpl = Pl 480 oil exports* .... .... mil. lbs. 451 673 881 1,085 1,289
--- --- ---
qtoxt = total oil exports . ......... mil.lbs. 987 1 '190 1,383 1,574 1,764 qtop = oil production ......... mil.lbs. 6,516 6,827 7,136 7,444 7,754 qtmp =meal production ... mil.lbs. 28,430 29,791 31 '135 32,481 33,833 qtse =bean crush ........ mil. bu. 600.0 628.7 657.1 685.5 714.0 qtss = total bean supply* . .. mil. bu. 857.5 923.1 951.0 995.9 1,033.4 St8 = bean stocks (open) ..... mil. bu. 72.1 56.8 67.1 65.9 69.9
(close) ... mil. bu. 56.8 67.1 65.9 69.9 71.6 St111 = meal stocks (open) . ..... mil.lbs. 274 285 .299 312 326
(close) .......... mil.lbs. 285 299 312 326 340 St0 = oil stocks (open) . ... mil.lbs. 560 619 667 711 753
(close) mil. lbs. 619 667 711 753 795
* Required to sustain the given price relationships. Bean supply is production less feed, seed, etc.
-54-

Table D-6, model Ill (mod.). Proiected values of iointly determined variables, PL 480 oil exports, and bean supplies at meal, oil, and bean prices of $79/ton, 9 cents/pound, and $2.60/bushel, respectively, 1967-1971
Crop year
Variable Units 1967 1968 1969 1970 1971
Ptm =meal price ....... ........................... .... $/ton 79.00 79.00 79.00 79.00 79.00 Pt0 =oil price ································· .. ... ¢/lb. 9.0 9.0 9.0 9.0 9.0 Pt" =bean price ......... . ................................... ....... $/bu. 2.60 2.60 2.60 2.60 2.60 qtmd =U.S. meal demand ... . ...................... ....... mil.lbs. 22,878 24,045 25,135 26,258 27,387 qtod =U.S. oil demand . ................. ......................... .... mil.lbs. 5,470 5,589 5,709 5,828 5,948 St" =bean stock change ...................................... ... mil. bu. -10.6 +8.5 -.3 +3.7 +1.9 Stm =meal stock change .................................... ....... mil.lbs. +7 +14 +14 +14 +14 Sto =oil stock change ··························· .mil.lbs. +56 +49 +44 +43 +43 qtsx = bean exports ...... ................... ......................... .. mil. bu. 270.1 281.3 292.6 303.8 315.0 qtmx =meal exports ......................................................... mil.lbs. 5,658 5,924 6,182 6,443 6,704 qtox = commercial oil exports ........ ................ mil.lbs. 568 626 667 707 747 qtoxpl = PL 480 oil exports* . . ........................ mil. lbs. 448 608 760 919 1,078
qtoxt = total oil exports ....... . ...................... mil.lbs. 1,016 1,234 1,427 1,626 1,825 qtop =oil production .................. mil.lbs. 6,542 6,872 7,180 7,497 7,816 qtmp =meal production ..............................•....•......•• .... mil.lbs. 28,543 29,983 31,331 32,715 34,105 qt"c =bean crush ........................ ......... mil. bu. 602.4 632.8 661.2 690.4 719.7 qt"" =total bean supply* ........................... mil. bu. 861.9 922.6 953.5 997.9 1,036.6 St" =bean stocks (open) ...................................... .... mil. bu. 70.4 59.8 68.3 68.0 71.7
(close) .............. mil. bu. 59.8 68.3 68.0 71.7 73.6 Stm =meal stocks (open) .......... ....... mil.lbs. 278 285 299 313 327
(close) ...................... mil.lbs. 285 299 313 327 341 St0 =oil stocks (open) ......................... ...... mil.lbs. 569 625 674 718 761
(close) ....................................... .mil.lbs. 625 674 718 761 804
* Required to sustain the given price relationships. Bean supply is production less feed, seed, etc.
Table D-7, model IV. Projected values of iointly determined variables, PL 480 oil exports, and bean supplies at meal, oil, and bean prices of $75/ton, 11 cents/pound, and $2.75/bushel, respectively, 1967-1971
Variable Units
Ptm = meal price .. . ....................................... $/ton Pt0 = oil price .................................................................... ¢/lb. Pt8 = bean price ................ $/bu. qtm<l = U.S. meal demand .............................. mil. lbs. qtod = U.S. oil demand ................................................ mil. lbs. St" = bean stock change ........................................... mil. bu. Stm = meal stock change ......................... mil. lbs. St0 = oil stock change .............................................. mil. lbs. qtsx = bean exports .......................................................... mil. bu. qtmx = meal exports .......................................................... mil. lbs. qtox = commercial oil exports ......... .. .... mil. lbs. qtoxpi = PL 480 oil exports* ................................ mil. lbs.
qtoxt = total oil exports .................................................. mil. lbs. qtop = oil production ................................. mil. lbs. qtmv =meal production .................................... .. ... mil. lbs. qtsc =bean crush .................................................................. mil. bu. qt"8 = total bean supply* ............................................. mil. bu. St8 = bean stocks (open) ............................................. mil. bu.
(close) ............................................. mil. bu. stm = meal stocks (open) ............................................. mil. lbs.
(close) ............................................. mil. lbs. St0 = oil stocks (open) ................................................... mil. lbs.
(close) .. .. ............. ; ........................... mil. lbs.
1967
75.00 11.0 2.75
23,240 5,082
-14.6 +15 +64 272.1
. 5,574 298
1,164
1,462 6,608
28,829 608.4 865.9
72.1 57.5
274 289 560 624
1968
75.00 11.0 2.75
24,408 5,202
+10.0 +14 +SO 283.3 5,764
278 1,389
1,667 6,919
30,186 637.0 930.3
57.5 67.5
289 303 624 674
* Required to sustain the given price relationships. Bean supply is production less feed, seed, etc.
-55-
Crop year
1969
75.00 11.0 2.75
25,497 5,321
-1.0 +13 +44 294.4 6,019
262 1,598
1,860 7,225
31,529 665.4 958.8
67.5 66.5
303 316 674 718
1970
75.00 11.0 2.75
26,621 5,440
+3.9 +14 +43 305.7 6,241
249 1,803
---
2,052 7,535
32,876 693.8
1,003.4 66.5 70.4
316 330 718 761
1971
75.00 11.0 2.75
27,749 5,560
+1.7 +14 +42 316.9 6,464
235 2,007
2,242 7,844
34,227 722.3
1,040.9 70.4 72.1
330 344 761 803

Table D-8, model Ill (mod.). Projected values of jointly determined variables, PL 480 oil exports, and bean supplies at meal, oil, and bean prices of $75/ton, 11 cents/pound, and $2.75/bushel, respectively, 1967-1971
Crop year
Variable Units 1967 1968 1969 1970 1971
Ptm =meal price . . . . . . . . . . . . . . . . . . . . . . . . . . . . . ................................. $/ton 75.00 75.00 75.00 75.00 75.00 Pt0 =oil price ........................... .................................. . ...... ¢/lb. 11.0 11.0 11.0 11.0 11.0 Pt" =bean price .............................................................. $/bu. 2.75 2.75 2.75 2.75 2.75 qtmd =U.S. meal demand ...... mil.lbs. 23,240 24,408 25,497 26,621 27,749 qtod =U.S. oil demand ............ mil.lbs. 5,082 5,202 5,321 5,440 5,560 St" =bean stock change ························· ... mil. bu. -10.3 +8.4 -.2 +3.6 +1.9 Stm =meal stock change .................................... ...... mil.lbs. +12 +14 +14 +14 +14 St0 =oil stock change ......... .... mil.lbs. +62 +51 +45 +44 +43 qtsx = bean exports .................. . ..................... mil. bu. 264.4 275.6 286.8 298.1 309.3 qtmx =meal exports .............. mil.lbs. 5,755 6,021 6,278 6,539 6,800 qtox = commercial oil exports ...... mil.lbs. 482 520 560 601 641 qtoxri = PL 480 oil exports* ... . ....................... mil. lbs. 1,022 1,205 1,359 1,518 1,677
---
qtoxt = total oil exports ···················· ..... mil.lbs. 1,504 1,725 1,919 2,119 2,318 qtOJ! =oil production ................. mil.lbs. 6,648 6,978 7,285 7,603 7,921 qtmJ! =meal production .................................... ........... mil.lbs. 29,007 30,443 31,789 33,174 34,563 qt"c = bean crush .......... . ................... mil. bu. 612.1 642.4 670.9 700.1 729.4 qt"" =total bean supply* ............... mil. bu. 866.2 926.4 957.5 1,001.8 1,040.6 St" =bean stocks (open) ............ mil. bu. 70.4 60.1 68.5 68.3 71.9
(close) ............ mil. bu. 60.1 68.5 68.3 71.9 73.8 Stm =meal stocks (open) .......................... ................ mil.lbs. 279 291 305 319 333
(close) ............................................. mil.lbs. 291 305 319 333 347 St0 =oil stocks (open) ................................................... mil.lbs. 569 631 682 727 771
(close) ................................................... mil.lbs. 631 682 727 771 814
* Required to sustain the given price relationships. Bean supply is production less feed, seed, etc.
Appendix E
Countries Included in Each of the Six Export Regions
European Economic Community ( EEC)
Belgium France Italy Luxembourg Nether lands West Germany
Canada and non-EEC Europe
Austria Canada Denmark Finland Greece Irelan<;! Norway Spain Sweden Switzerland United Kingdom
Latin America
Argentina Brazil Chile Colombia Ecuador Haiti Mexico Peru Venezuela
Africa
Algeria Egypt Morocco Tunisia
Japan
-56-
Asia and Oceania
Australia Burma Hong Kong India Iran Israel Pakistan Philippines South Korea South Viet N am Taiwan Turkey

Table E-1. Indexes of national income for the six regions and the world
Asia and Year Africa EEC Oceania Japan
1950 ......... 100.0 100.0 100.0 100.0 1951 ............ 102.7 106.8 101.4 108.8 1952 107.6 116.4 108.2 114.9 1953 ......... 115.3 124.9 109.8 115.8 1954 111.7 136.5 116.1 124.6 1955 ......... 108.7 149.2 121.8 140.1 1956 104.9 156.3 126.8 153.5 1957 ......... 97.5 162.2 132.6 157.9 1958 .. 111.7 169.4 140.2 175.5 1959 ........... 116.6 187.5 145.5 201.0 1960 . 113.5 200.8 149.8 229.2 1961 121.8 211.8 158.4 244.6 1962 . 135.2 220.9 171.2 264.6 1963 ····················· 139.5 237.2 180.8 298.6 1964 . 139.9 249.5 220.0 316.4
Table E-2. Livestock numbers used in the regional analysis
Year Latin
America Asia and Oceania
Canada and non-EEC Europe
100.0 103.0 105.8 111.0 118.2 124.6 129.5 132.1 133.8 139.8 147.9 153.9 165.3 168.9 156.3
Japan
Latin America
100.0 102.2 107.9 112.6 123.5 135.0 142.9 148.7 151.0 153.4 159.8 167.0 171.4 182.6 206.4
Canada and non-EEC Europe
................... thousands of units ·······································
1950 ............................................... 159,877 219,395 3,187 50,472 1951 ....... .............................................. 161,716 225,228 3,747 50,792 1952 ... .... ............................................. 168,141 227,298 4,138 52,557 1953 ............ ....................................... 172,608 229,041 4,274 54,090 1954 .............................. ........ 179,046 230,195 4,530 54,053 1955 .............................................. 188,358 235,502 4,749 54,898 1956 ..................... 192,351 231,925 4,930 55,900 1957 ............................................... ........ 195,753 232,311 5,037 56,941 1958 ........................................................ 204,207 242,897 5,219 58,578 1959 ........................................................ 216,282 244,656 5,296 58,901 1960 ........ ............................................... 217,053 250,673 6,064 60,880 1961 ... ................................ ............ ....... 224,652 250,851 7,197 60,886 1962 ........................................................ 220,932 251,193 7,263 60,854 1963 ......................................................... 219,990 243,663 7,848 66,077 1964 ......................................................... 222,931 243,465 8,443 67,015
Table E-3. World average export unit value of soybean meal, 1950-64*
World
100.0 104.6 110.7 117.3 126.7 136.2 142.6 146.4 151.3 163.3 173.8 182.6 190.6 204.2 201.5
EEC
.............................
54,900 56,784 56,900 58,408 59,236 60,376 61,512 61,872 62,977 64,165 65,426 67,436 69,954 71,125 73,089
Year Average value Year Average value
1950 1951 1952 1953 1954 1955 1956 1957
do_llars/ton $52.80
67.59 68.58 65.86 65.23 66.50 61.42 56.06
1958 ............................................................................................. . 1959 ........................................................................................... .. 1960 ............................................................................................ . 1961 ......................................................................................... .. 1962 ........................................................................................... .. 1963 .......................................................................................... . 1964 ............................................................................................ .
dollars/ton
$49.62 61.51 61.60 57.79 63.14 70.58 68.95
* Source: FAO, Annual The State of Faocl and Agriculture. The series was converted from dollars per metric ton to dollars per short ton.
-57-

Appendix F
A Selected Bibliography of Related Research
Armore, S. J., The Demand and Price Structure for Food Fats and Oils, USDA Tech. Bull. 1068, Washington, D.C., 1953.
Asfour, Edmond Y., Saudi Arabia: Long-Term Projections of Supply of and Demand for Agricultural Products, Econ. Res. Institute, Amer. Univ. of Beirut, 1965.
Balassa, Bela, Trade Prospects for Developing Countries, Homewood, Richard D. Irwin, 1964.
Berg, Eric R., Nigeria, Senegal, and the Congo (Kinshasa): Projected Level of Demand, Supply, and Exports of Oilseed Products to 1975 with Implications for U.S. Exports to the European Community. Published by the author, Depart. of Econ. and Agri Econ., Univ. of Alberta, Edmonton, Canada, Jan. 1967.
Berg, Eric R., Structure of the Soybean Oil Export Market, Univ. of Ill. Agr. Exp. Sta. Bull. 674, Aug. 1961.
Clough, Malcolm, "Major Factors Influencing HighProtein Feed Prices," Feed Situation, ERS, USDA, Apr. 1966.
Communaute Economique Europeene Commission, Le Marche commun des produits agricoles. Perspectives, "1970", Etude, No. 10, Brussels, 1963.
Consejo de Bienestar Rural, Long Term Forecasts of the Supply and Demand of Agricultural and Livestock Products in Venezuela, Caracas, Venezuela, Dec. 1965.
Dahl, Reynold P., "Demand for U.S. Soybeans in the European Common Market: A Case for Optimism," J. Farm Econ., Vol. 47, No.4, Nov. 1965.
Drake, Albert E. and Vincent I. West, Econometric Analysis of the Edible Fats and Oils Economy, Univ. of Ill. Agr. Exp. Sta. Bull. 695, June 1963.
Elz, Dieter, Oilseed Product Needs of the European Economic Community, 1970, ERS, USDA, May 1967.
Elz, Dieter, European Economic Community Import Demand for Oilseeds and Oilseed Products: A Summary, ERS, USDA, Foreign Agr. Ser., ERS-Foreign 170, Nov. 1966.
European Econcmic Community, General Survey of the World Situation Regarding Fats and Oils, Overseas Dev. Studies No. 2, Brussels, 1964.
"Factors Influencing Soybean Meal Prices," Feed Situation, AMS, USDA, July 1959.
FAO, United Nations, Agricultural Commodities-Projections for 1970, FAO Commodity Review, 1962,
Special Supplement, Rome, E/CN, 13/48, CCP 62/5, 1962.
FAO, United Nations, Agricultural CommoditiesProjections for 1975 and 1985, Committee on Commodity Problems, Forty-first Session, CCP 67/3, Vols. I and II, October 1966. '
FAO, United Nations, Report of the Sixth Session of the FAG Group on Coconut Products to the Committee on Commodity Problems, Rome, May-June 1965.
Foote, Richard J., John W. Klein, and Malcolm Clough, The Demand and Price Structure for Corn and Total Feed Concentrates, USDA Tech. Bull. No. 1061, Oct. 1965.
Hall, Howard L., Peru, Market and Competitor for U.S. Farm Products, ERS, USDA, Foreign Regional Analysis Division, ERS-Foreign 157, June 1966.
Houck, James P. Demand and Price Analysis of the U.S. Soybean Market, Univ. of Minn. Agr. Exp. Sta. Tech. Bull. 244, June 1963.
Institute of Agr. Econ. Res., Depart. of Agr. Econ., Univ. of Tokyo, Japanese Import Requirement: Projections of Agricultural Supply and Demand for 1965, 1970 and 1975, Tokyo, Japan, March 1964.
Japanese Econ. Planning Agency, New Long-Range Economic Plan of Japan (1961-1970), Tokyo, The Times of Japan, 1961.
Jordan, G. L., What Determines Soybean Prices? Univ. of Ill. Agr. Exp. Sta. Bull. 546, 1951.
King, G. A., The Demand and Price Structure for ByProduct Feeds, USDA Tech. Bull. 1183, Aug. 1958.
Le Marche Des Oleagineux Tropicaux, Societe D'Etudes Pour Le Development Economique Et Social Compagnie General D'Etude Et De Recherches Pour L'Afrique, Paris, May 1964.
Long-Term Economic Projections for the Developing Asian Countries, 1961-1970, Maruzen Company for Institute of Asian Economic Affairs.
Mundlak, Yair, Long-Term Projections of Supply and Demand for Agricultural Products in Israel-I: General View and Summary, Jerusalem, Falk Project for Econ. Res. in Israel, The Faculty of Agriculture, The Hebrew Univ., May 1964.
National Council of Applied Economic Research, Long-Term Projections of Demand for and Supply of Agricultural Commodities, 1960-1961 to 1975-76, New Delhi, 1962.
Organization for European Economic Cooperation, The Main Products of the Overseas Territories: Oilseeds, Paris, 1957.
-58-

Osman, Nixar, W. R. Morrison, and L. D. Bender, Factors Affecting the Estimated Future Foreign Demand for Soybeans, Agr. Exp. Sta. Bull. 712, Univ. of Ark., Fayetteville, Ark., May 1966.
Paarlberg, D., Prices of Soybeans and Soybean Products, Purdue Univ. Agr. Exp. Sta. Bull. 538, Sept. 1949.
Spilsbury, Calvin C., Western Europe, A Growing Market for U.S. Soybeans and Soybean Meal, FASM-153, Foreign Agricultural Service, USDA, Oct. 1963.
Thorbecke, Erik and Alfred Field, "U.S. Farm Exports to the European Economic Community-Projections to 1970," Farm Policy Forum, Vol. 17, No. 4, 1964-65.
USDA, Austria: Projected Level of Supply, Demand, and Trade of Agricultural Products in 1965 and 1975, ERS-Foreign-62, May 1964.
USDA, Israel: Supply and Demand Projections for Agricultural Commodities to 1975, ERS-Foreign-137, Aug. 1965.
USDA, Italian Agriculture: Projections of Supply and Demand in 1965, 1970, and 1975, ERS-Foreign 68, Jan. 1964.
USDA, Jamaica, Trinidad, and Tobago, Leeward Island, Windward Islands, Barbados, and British Guiana: Projected Levels of Demand, Supply, and Imports of Agricultural Products to 1975, ERS-Foreign-94 (Undated). '
USDA, Nigeria: Determinants of Projected Level of Demand, Supply, and Imports of Farm Products in 1965 and 1975, ERS-Foreign-32, Aug. 1962.
USDA, Nigeria, Projected Level of Demand, Supply, and Imports of Farm Products in 1965 and 1975, With Implications for U.S. Agriculture, ERS-Foreign-105, Dec. 1964.
USDA, The Philippines: Long-term Projection of Supply of and Demand for Selected Agricultural Products, ERS-Foreign-34, (Undated).
USDA, Saudi Arabia: Supply and Demand Projections for Farm Products to 1975, with Implications for U.S. Exports, ERS-Foreign, ERS, Dec. 1966.
USDA, Summary and Evaluation of Austria: Projected Level of Supply, Demand, and Trade of Agricultural Products in 1965 and 1975 (ERS-Foreign-62), ERS-Foreign-56, Dec. 1963.
USDA, Summary and Evaluation of Jamaica, Trinidad, and Tobago, Leeward Islands, Windward Islands, Barbados, and British Guiana: Projected Levels of Demand, Supply, and Imports of Agricultural Products to 1975, ERS-Foreign-148, June 1966.
USDA, Summary and Evaluation of the Philippines: Long-term Projection of Supply and Demand for Selected Agricultural Products With Implications for U.S. Exports (ERS-Foreign-34), ERS-Foreign-58, Nov. 1963.
USDA, Summary and Evaluation of United Kingdom: Projected Level of Demand, Supply, and Imports of Farm Products in 1965 and 1975 (ERS-Foreign-19), ERS-Foreign-50, July 1963.
USDA, Supply of and Demand for Selected Agriculcultural Products in India, Projections to 1975-76, ERS-Foreign-100 (Undated).
USDA, United Kingdom, Projected Level of Demand, Supply, and Imports of Farm Products in 1965 and 1975, ERS-Foreign-19, Jan. 1962.
Vandenborre, Roger J., "Demand Analysis of the Markets for Soybean Oil and Soybean Meal," J. Farm Econ., Vol. 48, No.4, Part I, Nov. 1966.
West, Quentin M., "Foreign Supply and Demand Projections: Outlook for U.S. Agricultural Exports," J. Farm Econ., Vol. 48, No.5, Dec. 1966.
-59-