MAPPING QUANTITATIVE TRAIT LOCI FOR AGRONOMIC AND QUALITY FACTORS IN WHEAT

ORIGINAL PAPER
F. Marza Æ G. -H. Bai Æ B. F. Carver Æ W. -C. Zhou
Quantitative trait loci for yield and related traits in the wheat populationNing7840 · Clark
Received: 21 February 2005 / Accepted: 30 November 2005 / Published online: 21 December 2005� Springer-Verlag 2005
Abstract Grain yield and associated agronomic traits areimportant factors in wheat (Triticum aestivum L.)improvement. Knowledge regarding the number, geno-mic location, and effect of quantitative trait loci (QTL)would facilitate marker-assisted selection and thedevelopment of cultivars with desirable characteristics.Our objectives were to identify QTLs directly and indi-rectly affecting grain yield expression. A population of132 F12 recombinant inbred lines (RILs) was derived bysingle-seed descent from a cross between the Chinesefacultative wheat Ning7840 and the US soft red winterwheat Clark. Phenotypic data were collected for 15 yieldand other agronomic traits in the RILs and parentallines from three locations in Oklahoma from 2001 to2003. Twenty-nine linkage groups, consisting of 363AFLP and 47 SSR markers, were identified. Usingcomposite interval mapping (CIM) analysis, 10, 16, 30,and 14 QTLs were detected for yield, yield components,plant adaptation (shattering and lodging resistance,heading date, and plant height), and spike morphologytraits, respectively. The QTL effects ranged from 7 to23%. Marker alleles from Clark were associated with apositive effect for the majority of QTLs for yield andyield components, but gene dispersion was the rule ra-ther than the exception for this RIL population. Often,QTLs were detected in proximal positions for different
traits. Consistent, co-localized QTLs were identified inlinkage groups 1AL, 1B, 4B, 5A, 6A, and 7A, and lessconsistent but unique QTLs were identified on 2BL, 2BS,2DL, and 6B. Results of this study provide a benchmarkfor future efforts on QTL identification for yield traits.
Introduction
As the world’s most important food crop, wheat (Triti-cum aestivum L.) grows on over 208 million hectares andnow produces over 556 million metric tons annually(FAO 2004). Grain yield in wheat is determined con-currently by a number of plant and grain characteristics.These are complex quantitative traits controlled byseveral genes and highly influenced by environmentalconditions (Kearsey and Pooni 1996). These factorsmake it difficult to define yield according to gene effectand/or gene number using classical quantitative geneticmethods. The application of new molecular markertechnologies for quantitative trait locus (QTL) analysishas provided an effective approach to dissect compli-cated quantitative traits into component loci to studytheir relative effects on a specific trait (Doerge 2002).
Using single chromosome recombinant substitutionlines and restriction fragment length polymorphism(RFLP) markers, QTLs for yield and important agro-nomic traits were identified on chromosomes 3A (Shahet al. 1999; Campbell et al. 2003), 4A (Araki et al. 1999),and 5A (Kato et al. 2000). Using a more saturatedRFLP map derived from the population Opata 85/W7984, Borner et al. (2002) detected 64 QTLs for about20 agronomic characters. Additional QTLs controllingother plant adaptation and morphology traits were re-ported, including heading date (Shah et al. 1999; Bull-rich et al. 2002; Shindo et al. 2003), plant height(Cadalen et al. 1998; Huang et al. 2003, 2004), lodging(Keller et al. 1999), leaf rust reaction (Singh et al. 2000),and spike morphology (Sourdille et al. 2000; Borneret al. 2002).
Communicated by F. Salamini
F. Marza Æ B. F. CarverDepartment of Plant and Soil Sciences,Oklahoma State University, Stillwater, OK 74078, USA
G. -H. Bai (&)USDA-ARS, Plant Science and Entomology Research Unit,Manhattan, KS 66506, USAE-mail: [email protected].: +1-785-5321124Fax: +1-785-5326167
W. -C. ZhouAgriculture and Agri-Food Canada,T1J4B1, Lethbridge, AB, Canada
Theor Appl Genet (2006) 112: 688–698DOI 10.1007/s00122-005-0172-3

The development of molecular markers for importantwheat traits and their application in breeding programs ischallenged by multiple genome constitution (AABBDD,allohexaploid and amphidiploid: 2n=6·=42) and arelatively large genome size of 16,000 Mbp, of whichmore than 80% is repetitive DNA (Roder et al. 1998;Marshall et al. 2001). One advantageous marker classfor QTL detection in wheat is represented by amplifiedfragment length polymorphism (AFLP) markers, whichshow a high level of polymorphism, and offer highreproducibility and reliability under stringent PCRconditions (Vos et al. 1995). Another important markerclass is simple sequence repeat (SSR), also called micro-satellite, which is stable, abundantly dispersed through-out the genome, and locus-specific in hexaploid wheat.Detailed SSR genetic maps are now available for wheat(Roder et al. 1998, 2002; Pestsova et al. 2000; Somerset al. 2004; Song et al. 2005). A ‘skeletal’ genetic mapwith SSRs can provide physical anchor points for specificchromosomes in a saturated AFLP map.
Identification of QTLs influencing grain yield andrelated traits is needed to more precisely define theirinheritance. The vast majority of genomic-based re-search in wheat has previously focused on more simplyinherited traits with indirect effects on productivity. Theobjectives of this study were to (1) dissect QTLs affectinggrain yield in winter wheat, (2) determine the chromo-some locations and phenotypic effects of these yield-re-lated QTLs, and (3) identify molecular markersassociated with these traits.
Materials and methods
Plant materials
A population of 132 F12 recombinant inbred lines (RIL)was derived by single-seed descent from the F2 of thecross, Ning7840/Clark. Ning7840 is a Chinese hard redfacultative cultivar with the pedigree, Avrora/Anhui 11//Sumai 3. It has relatively low yield potential but is highlyresistant to various rust pathogens and Fusariumgraminearum (Bai et al. 1999). Clark is a soft red winterwheat cultivar developed at Purdue University, IN, USA(Ohm et al. 1988). Distinctive features of Clark are itsearly date of heading combined with good yield poten-tial, high kernel weight, and resistance to wheat soil-borne mosaic virus (Ohm et al. 1988).
Experimental design
Ning7840, Clark, and the 132 RILs were evaluated atone to three Oklahoma locations (Stillwater, 36�9¢N and97�05¢W, Lahoma, 36�22¢ and 98�00¢, and Altus, 34�39¢and 99�20¢) for each of three crop years ending in 2001,2002, and 2003, using a replicates-in-sets design withthree replications. A two-row plot size was 1.4 m2, andseeding rate was 58 kg ha�1. All experiments were
planted according to a grain-only management system(early October to early November), and fertilizer wasadded according to soil-test recommendations for a4,000 kg ha�1 yield goal.
Traits
In addition to grain yield, information on adult-plantcharacters was collected based on relevance to thismapping population and on level of trait expression(Table 1). Grain yield (GY) was measured as the weightof wheat grain harvested from the entire plot area. Spikenumber (SN) was calculated from the number of spikespresent in two 50-cm row segments 23 cm apart. Kernelnumber per spike (KS) and kernel weight per spike,hereafter called spike weight (SW), were determinedfrom the mean of 15 random spikes. Grain weight wasreported at 11% relative humidity. Heading date (HD)was recorded as the number of days after 31 Marchwhen spikes were fully emerged from 50% of the plantsin a plot. Physiological maturity date (MD) was re-corded on a visual scale from 1 (early) to 4 (late) basedon the appearance of a yellow peduncle at the base of thespike. Plant height (HT) was measured at harvestmaturity from ground level to the tip of the spike,excluding awns. Shattering (SH) and lodging (L) wererecorded at harvest maturity on a visual scale from 1 (noshattering or no lodging) to 5 (severe shattering or lod-ging). Plant yellowing, indicative of barley yellow dwarfsymptoms, was recorded from 10 to 30 April (headsemerged and during anthesis) using the scale from 1(completely green canopy as no symptoms) to 5 (yellowcanopy as severe symptoms). Leaf rust reaction (LR)was based on percent severity. Spike length (SL) wasmeasured from base to tip, excluding awns. Spike den-sity (SD) was rated on a scale from 1 (compact spike) to4 (lax spike). Chaff color (C) was recorded as dark (scoreof 1), intermediate (2), or light (3). Some trait mea-surements were restricted to two or three environmentsdepending on their levels of repeatability or expression(Table 1). Twenty-seven RILs which showed unusuallyhigh shattering were removed from the data analysis in2003.
Analysis of SSRs
Total genomic DNA was isolated from young leaf tissueof 2–4-week-old greenhouse-grown plants of both par-ents (Ning7840 and Clark) and the 132 F12 RILs usingthe CTAB procedure (Saghai-Maroof et al. 1984). ThePCR was performed in a volume of 12 ll containing0.2 mM of each dNTP, 1· PCR buffer, 3 pmol of eachprimer, 2.5 mM MgCl2, 1 U of Taq polymerase, and50 ng DNA. The PCR was performed by means of atouchdown program consisting of five cycles of 45 s at95�C, 5 min of annealing at 68�C which decreased by2�C each cycle, and 1 min at 72�C. In the following five
689

cycles the annealing temperature started at 58�C for2 min and lowered by 2�C per cycle. The PCR continuedfor 25 additional cycles of 45 s at 95�C, 2 min at 50�C,and 1 min at 72�C with a final elongation step of 72�Cfor 5 min. The PCR products were denatured for 5 minat 94�C before they were separated in a 6.5% poly-acrylamide gel on a Li-Cor IR-4200 DNA sequencer(Li-Cor Inc., Lincoln, NE, USA) using a fluorescence-labeled M13 primer for PCR detection. The SSRsscreened in this study included 181 XGWMs (Roderet al. 1998), 160 BARCs (Song et al. 2005), 36 GDMs(Pestsova et al. 2000), 20 WMCs (Gupta et al. 2002), and3 DUPWs (Du Pont, USA).
Linkage mapping
The two parents and the 132 RILs were previouslycharacterized using AFLP markers (Bai et al. 1999),producing 618 polymorphic band readings (G. Bai,unpublished data). Segregating SSR and AFLP markerswere scored visually for each RIL and recorded as eithertype ‘A’ (Ning7840) or ‘B’ (Clark), whereas ambiguousbands were scored missing (�) and later combined forconstructing a genetic linkage map. Linkage analysiswas performed using the MAPMAKER program(Macintosh V2.0, Lander et al. 1987). Recombinationfrequencies were converted to centimorgans (cM) usingthe Kosambi mapping function (Kosambi 1944).
Statistical analysis
The complete set of data from each environment wassubjected to analysis of variance (ANOVA) to determinethe main effects of genotype (RIL) and replication fac-tors. Phenotypic correlations, multiple R2 value andheritability (h2) on a line-mean basis were calculated forall traits across environments using SAS (SAS Institute2003).
Quantitative trait locus analysis
The Windows version of QTL Cartographer V2.0(Wang et al. 2004) was used to conduct composite-interval mapping (CIM) analysis based on model 6 ofthe Zmapqtl procedure (Basten et al. 2001). The closestmarker to each local LOD peak (putative QTL) wasused as a cofactor to control the genetic backgroundwhile testing at a position of the genome. The walkingspeed chosen for all QTL analysis was 2.0 cM. QTL wasclaimed to be significant at a LOD value of 3. Additiveeffects of detected QTL were estimated by the Zmapqtlprocedure. The proportion of phenotypic variance ex-plained by a QTL was estimated as the coefficient ofdetermination (R2) using single-factor analysis from ageneral linear model procedure (Basten et al. 2001). Foreach QTL, R2 was determined for the single markerclosest to the identified QTL.
Table 1 Phenotypic summary of yield-related traits, plant adaptation traits, and spike morphology for Ning7840, Clark, and their RILprogenies evaluated in three Oklahoma environments from 2001 to 2003
Trait Parents RIL populationa
Clark Ning7840 Mean Max. Min. SD h2 Multiple R2
YieldGrain yield (kg ha�1) 2,595 2,219 2,328 4,058 872 655 0.83 0.89Spike number (m2) 589 517 525 823 329 85 0.49 0.77Kernel number (spike�1) 35.8 32.5 33.4 46.7 21.6 4.8 0.87 0.82Spike weight (g) 1.10 0.81 0.93 1.28 0.58 0.13 0.70 0.83Plant adaptationHeading dateb (days) 23 26 25 32 19 3.0 0.78 0.85Maturity date (1–4)c 1.6 1.6 1.9 4.0 1.0 0.8 0.85 0.80Plant height (cm) 80 76 78 97 58 8 0.90 0.91Shattering score (1–5)d 2.1 2.0 2.0 4.2 1.0 0.9 0.61 0.58Lodging score (1–5)e 1.2 1.3 1.9 4.3 1.0 0.8 0.56 0.70Leaf yellowing (1–5)f 1.5 2.1 2.0 3.9 1.0 0.6 0.60 0.64Leaf rust reaction (%)g 24.3 8.7 34.5 74.1 1.6 21.8 0.71 0.95Spike morphologySpike length (cm) 8.0 7.0 8.0 10.0 6.0 1.0 0.89 0.72Spike density (1–4)h 3.3 2.4 3.0 4.0 1.0 0.7 0.87 0.88
aPopulation of 132 F12 recombinant inbred linesbDays after 31 MarchcEarly = 1, late = 4dNo shattering = 1, severe shattering = 5eNo lodging = 1, severe lodging = 5fNo yellowing = 1, severe yellowing = 5g% SeverityhCompact = 1, lax = 4
690

Results
Linkage map
A total of 400 SSR markers were screened, of which 82(21%) were polymorphic between the parents. Combinedwith the 619 AFLP markers previously identified aspolymorphic, 701 markers were subjected to linkageanalysis. Twenty-nine linkage groups were constructedfrom 363 AFLP and 47 SSR markers, after removal ofmarkers <1 cM apart. Each group contained at leastone anchor SSR marker (Fig. 1). This linkage mapspanned 2,223 cM, with an average interval length of5.4 cM. The recommended map distance for genome-wide QTL scanning is ten recombinations per 100 meioticevents, or an interval length less than 10 cM (Doerge2002), therefore the map is suitable for genome-wideQTL scanning in this study.
Phenotypic summary
The phenotypic data were classified into three catego-ries: yield traits, plant adaptation traits, and spikemorphology traits (Table 1). The ANOVA (data notshown) indicated a high level (P<0.01) of genetic vari-ation for all traits in all environments. Transgressivesegregation was common among all traits (Table 1).Continuous distributions were also common except forshattering score. Test statistics for skewness and kurtosiswere generally less than 1.0 (data not shown), indicatingsuitability of the data for QTL analysis.
Clark performed more favorably for yield and spikemorphology traits, and Ning7840 showed greater resis-tance to leaf rust (Table 1). Mean grain yield, spikenumber, kernel number per spike, and spike weight were9–26% greater for Clark than for Ning7840 acrossenvironments (P<0.05). Clark also produced longerspikes than Ning7840 in all environments (P<0.05).Only for yield in Stillwater 2003 and for spike number inStillwater 2001 did Ning7840 exceed Clark. Thoughgenetic variation was found in the RIL population forall plant adaptation traits, Ning7840 and Clark did notdiffer significantly for these traits, except for leaf rust.
Positive phenotypic correlation coefficients werefound between each of the three yield components andgrain yield (Fig. 2). Spike weight showed the strongestpositive association with grain yield, which might beexpected considering that spike weight integrates theeffects of kernel number per spike and kernel weight.Furthermore, given the breadth of environments forwhich yield and spike weight were associated, mappingof these traits could reveal consistent QTLs across var-iable environments. In addition, greater shattering,lodging, plant yellowing, and leaf rust susceptibility wereassociated with lower yield as expected. Hence, identi-fication of QTLs with direct effects on yield requiresscanning for QTLs that influence yield independently of
these adaptation traits. Differences in spike density didnot correlate with differences in grain yield, althoughmore compact spikes made shorter spikes.
Quantitative trait locus mapping
The composite-interval mapping analysis produced atotal of 206 putative QTLs (Table 2, Fig. 1). For allcategories of traits, QTL frequency was highest in the Bgenome with 124 QTLs (60%); another 64 (31%) and 18(9%) QTLs were found in genomes A and D, respec-tively. Distribution of QTLs was balanced amonghomologous chromosome groups one to seven as fol-lows: 25 (12%), 33 (16%), 34 (17%), 25 (12%), 29(14%), 36 (17%), and 24 (12%). Chromosomes 2A, 3D,and 4D were not included in the analysis due to lack ofpolymorphic SSRs identified in these chromosomes.
Ten QTL were identified for grain yield and eachof them explained 7.3–21.1% phenotypic variation(Table 2, Fig. 1). For three yield components, one QTLon 3BS was found for spike number, eight QTLs wereidentified for kernel number and seven QTLs weredetected for spike weight. For plant adaptation traits,three QTLs each were detected for heading and maturitydate, lodging score, and leaf rust reaction; and six QTLseach were detected for plant height, shattering and leafyellowing. In addition, ten QTLs were identified forspike length and four QTLs were identified for spikedensity. Overall, we detected a mean of six putative QTLfor yield-related traits, four for plant adaptation traits,and seven for spike-morphology traits. These results areconsistent with a summary of 47 studies on cereals,where the number of QTLs identified for a particulartrait varied up to about 16 with a mean of about 4(Kearsey and Farquhar 1998).
Discussion
Quantitative trait loci for plant adaptation traits
Plant heading date, maturity date, height, leaf yellowing,leaf rust reaction, and shattering and lodging scores areconsidered as plant adaptation traits. Expression ofshattering was relatively light in three environments(ST02, ST03, and LA03), but distinctly more severe inLA02 and AL03. Across those five environments, sixputative QTLs were found in linkage groups 4B, 5A, 6A,6B, 7A, and 7DL (Table 2). Detection of these QTLswas highly inconsistent among environments, and mosthad moderate effect with LOD values ranging from 3.2to 3.5. One notable exception was the QTL in linkagegroup 7DL identified in ST03, which accounted for 56%of the phenotypic variance (Table 2). Interestingly, thismajor QTL was the easiest to detect in an environmentthat produced the lowest RIL population mean forshattering. Grain yield in this environment did not mapto the same linkage group as did the shattering QTL.
691

Fig. 1 Primary genomic regions of QTLs identified by compositeinterval mapping for grain yield and yield components, plantadaptation traits, and spike morphology from the Ning7840 ·Clark RIL population evaluated in Oklahoma from 2001 to 2003.
Bars indicate the number of environments for which the samemarker interval was detected. Triangles indicate the intervalexhibiting the peak LOD value
692

Grain yield, however, did map to the same position forregions in linkage groups 5A (ACG.GAC1.2/ACG.GAC6) and 4B (AAC.CAG2/ACT.CAT11; closest mar-ker interval), but still only in isolated environments(ST02 and LA02, Table 2). The only linkage group towhich shattering was mapped in multiple environmentswas 6B, a linkage group relatively unimportant to directexpression of grain yield in this population. We havefound no published precedent for a shattering QTL inwheat.
Three QTLs for lodging score were identified inlinkage groups 1B, 4AL, and 5A. The QTL in 5A wasidentified in two of three environments. Keller et al.(1999) reported a QTL in the similar location. Chro-mosome 5A is also mentioned as one of the locations ofa stem solidness gene (Cook et al. 2004). Among allcorrelated traits plotted in Fig. 2, lodging score showedthe strongest negative association with yield. This rela-tionship may in part be attributed to the consistent QTLon linkage groups 5A and 1B, which mapped to thesame chromosome region for both traits. For these re-gions, the alleles from Clark increased yield but de-creased lodging score.
The leaf yellowing we observed immediately prior toheading was indicative of barley yellow dwarf symp-toms, though this was not confirmed serologically. SixQTLs were detected across linkage groups 2BL, 2DL2,3BS, 5A, 6A, and 7DL3. Marker-assisted selection forresistance to Barley Yellow Dwarf Virus (BYDV) was
previously attempted (Henry et al. 2002) based on mi-crosatellite marker XGWM37 that was also located on7DL. A single QTL was identified on 7DL3 (LA03). TheQTLs for leaf yellowing and yield coincided in a geno-mic region in linkage group 5A. Marker alleles associ-ated with this locus had inverse effects on yield versusleaf yellowing.
Three QTLs on 3BS, 1B, and 2DL2 were associatedwith leaf rust reaction. The QTL on 3BS (XGWM493/ACT.TGC7) was previously associated with Lr34/Yr18(Singh et al. 2000).
Spike development and date of heading in wheat areconsidered to be controlled by three major groups ofgenes: photoperiod response genes on 5A and 5D;vernalization response genes on 5A, 5B, and 5D; and‘earliness per se’ genes on homoeologous groups 2 and4, 3A, 6B, and 7B. (Shah et al. 1999; Bullrich et al.2002; Shindo et al. 2003). All QTLs identified in thispopulation for heading date, except the linkage groupin 3BL2, could be traced to those same chromosomes.The QTL on 5B, detected in three of the five environ-ments (Table 2), was most consistent though two QTLscould be detected from other linkage groups (3BL2 and6B) in certain environments. Hence, heading date dif-ferences were likely driven by a combination of devel-opmental factors in this population. The Ning7840allele always delayed heading date for all QTL. Thelinkage group 6B harboring QTL for heading datealso influenced maturity date. Two QTLs unique to
Fig. 1 (Contd.)
693

maturity date were detected in linkage groups 1B and3AS2, indicating independent mechanisms controllingmaturity.
Six putative QTLs influenced plant height, but QTLson 4B and 6A were the most consistent as they weredetected in most environments. These regions have beenwidely reported elsewhere (Cadalen et al. 1998; Borneret al. 2002; Huang et al. 2003, 2004). The Clark allele on6A increased plant height, but the Clark allele on 4Breduced it. We found no significant association betweenyield and height in this population to warrant the con-sideration of height QTLs to indirectly manipulate yield(Figs. 1, 2). However, a common marker interval wasidentified in linkage group 4B (ACT.CAT11//AAC.GCAG4; Table 2), in which the allele from Clarkincreased yield but decreased plant height.
Quantitative trait loci for spike morphology
Ten QTLs were identified for spike length. Those inlinkage groups 1AS, 2BL, 2BS, 4B, and 7A showed apositive effect from the Clark allele, whereas QTLs on1AL, 1B, 3BL, 5B, and 7BS showed a negative effect.
The QTL on chromosome 3BL was detected in everyenvironment (Table 2), although this chromosomerarely contributed to grain yield variation. Only theQTLs identified on 1AS and 2BS were consistent withprevious results (Sourdille et al. 2000). Contrary to theirmoderate phenotypic correlation coefficient, the degreeof spike compactness, or spike density, was mostly dis-sociated with spike length based on coincidence ofQTLs. Four QTLs affecting spike density were identifiedin linkage groups 1B, 4AL, 7BS, and 7DL3. Only theQTL on 7BS (AGC.GCG13/AGG.CT3) associated withboth traits (Fig. 1).
Quantitative trait loci for yield traits
Ten QTLs were detected for grain yield (Table 2) andwith a high degree of gene dispersion between the par-ents. The Clark allele increased grain yield for five QTLsin linkage groups 2BL, 4AL, 4B, 5A, and 6B, accountingfor 8–19% of the phenotypic variation. Alleles fromNing7840 increased yield at the other five QTLs inlinkage groups 1AL, 1B, 5B, 7A, and 7DL2, accountingfor 9–21% of the phenotypic variance.
Fig. 2 Correlation coefficient plot among yield-related traits, plantadaptation traits, and spike morphology for the Ning7840 · ClarkRIL population evaluated in Oklahoma from 2001 to 2003. Onlysignificant r-values (P<0.05) are shown in the plot. Traits are grain
yield (GY), spike number (SN), kernel number spike�1 (KS), spikeweight (SW), heading date (HD), plant height (HT), shatteringscore (SH), lodging score (L), leaf yellowing (Y), leaf rust reaction(LR), spike length (SL), and spike density (SD)
694
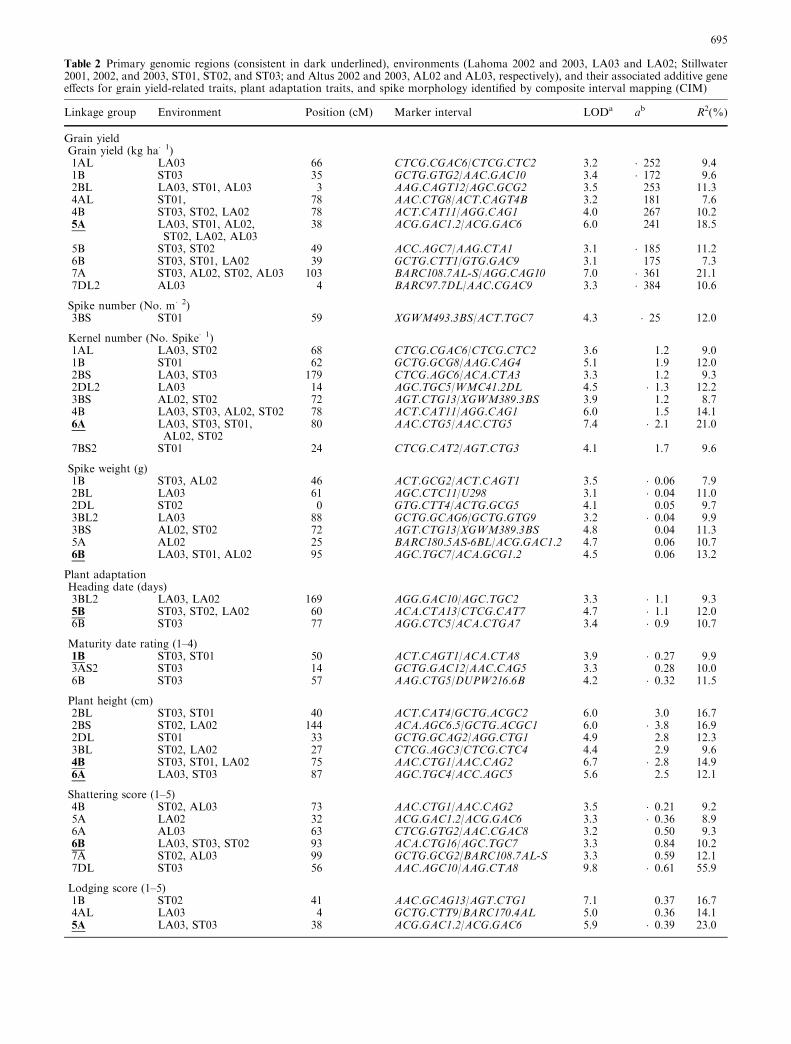
Table 2 Primary genomic regions (consistent in dark underlined), environments (Lahoma 2002 and 2003, LA03 and LA02; Stillwater2001, 2002, and 2003, ST01, ST02, and ST03; and Altus 2002 and 2003, AL02 and AL03, respectively), and their associated additive geneeffects for grain yield-related traits, plant adaptation traits, and spike morphology identified by composite interval mapping (CIM)
Linkage group Environment Position (cM) Marker interval LODa ab R2(%)
Grain yieldGrain yield (kg ha�1)1AL LA03 66 CTCG.CGAC6/CTCG.CTC2 3.2 �252 9.41B ST03 35 GCTG.GTG2/AAC.GAC10 3.4 �172 9.62BL LA03, ST01, AL03 3 AAG.CAGT12/AGC.GCG2 3.5 253 11.34AL ST01, 78 AAC.CTG8/ACT.CAGT4B 3.2 181 7.64B ST03, ST02, LA02 78 ACT.CAT11/AGG.CAG1 4.0 267 10.25A LA03, ST01, AL02,
ST02, LA02, AL0338 ACG.GAC1.2/ACG.GAC6 6.0 241 18.5
5B ST03, ST02 49 ACC.AGC7/AAG.CTA1 3.1 �185 11.26B ST03, ST01, LA02 39 GCTG.CTT1/GTG.GAC9 3.1 175 7.37A ST03, AL02, ST02, AL03 103 BARC108.7AL-S/AGG.CAG10 7.0 �361 21.17DL2 AL03 4 BARC97.7DL/AAC.CGAC9 3.3 �384 10.6
Spike number (No. m�2)3BS ST01 59 XGWM493.3BS/ACT.TGC7 4.3 �25 12.0
Kernel number (No. Spike�1)1AL LA03, ST02 68 CTCG.CGAC6/CTCG.CTC2 3.6 1.2 9.01B ST01 62 GCTG.GCG8/AAG.CAG4 5.1 1.9 12.02BS LA03, ST03 179 CTCG.AGC6/ACA.CTA3 3.3 1.2 9.32DL2 LA03 14 AGC.TGC5/WMC41.2DL 4.5 �1.3 12.23BS AL02, ST02 72 AGT.CTG13/XGWM389.3BS 3.9 1.2 8.74B LA03, ST03, AL02, ST02 78 ACT.CAT11/AGG.CAG1 6.0 1.5 14.16A LA03, ST03, ST01,
AL02, ST0280 AAC.CTG5/AAC.CTG5 7.4 �2.1 21.0
7BS2 ST01 24 CTCG.CAT2/AGT.CTG3 4.1 1.7 9.6
Spike weight (g)1B ST03, AL02 46 ACT.GCG2/ACT.CAGT1 3.5 �0.06 7.92BL LA03 61 AGC.CTC11/U298 3.1 �0.04 11.02DL ST02 0 GTG.CTT4/ACTG.GCG5 4.1 0.05 9.73BL2 LA03 88 GCTG.GCAG6/GCTG.GTG9 3.2 �0.04 9.93BS AL02, ST02 72 AGT.CTG13/XGWM389.3BS 4.8 0.04 11.35A AL02 25 BARC180.5AS-6BL/ACG.GAC1.2 4.7 0.06 10.76B LA03, ST01, AL02 95 AGC.TGC7/ACA.GCG1.2 4.5 0.06 13.2
Plant adaptationHeading date (days)3BL2 LA03, LA02 169 AGG.GAC10/AGC.TGC2 3.3 �1.1 9.35B ST03, ST02, LA02 60 ACA.CTA13/CTCG.CAT7 4.7 �1.1 12.06B ST03 77 AGG.CTC5/ACA.CTGA7 3.4 �0.9 10.7
Maturity date rating (1–4)1B ST03, ST01 50 ACT.CAGT1/ACA.CTA8 3.9 �0.27 9.93AS2 ST03 14 GCTG.GAC12/AAC.CAG5 3.3 0.28 10.06B ST03 57 AAG.CTG5/DUPW216.6B 4.2 �0.32 11.5
Plant height (cm)2BL ST03, ST01 40 ACT.CAT4/GCTG.ACGC2 6.0 3.0 16.72BS ST02, LA02 144 ACA.AGC6.5/GCTG.ACGC1 6.0 �3.8 16.92DL ST01 33 GCTG.GCAG2/AGG.CTG1 4.9 2.8 12.33BL ST02, LA02 27 CTCG.AGC3/CTCG.CTC4 4.4 2.9 9.64B ST03, ST01, LA02 75 AAC.CTG1/AAC.CAG2 6.7 �2.8 14.96A LA03, ST03 87 AGC.TGC4/ACC.AGC5 5.6 2.5 12.1
Shattering score (1–5)4B ST02, AL03 73 AAC.CTG1/AAC.CAG2 3.5 �0.21 9.25A LA02 32 ACG.GAC1.2/ACG.GAC6 3.3 �0.36 8.96A AL03 63 CTCG.GTG2/AAC.CGAC8 3.2 0.50 9.36B LA03, ST03, ST02 93 ACA.CTG16/AGC.TGC7 3.3 0.84 10.27A ST02, AL03 99 GCTG.GCG2/BARC108.7AL-S 3.3 0.59 12.17DL ST03 56 AAC.AGC10/AAG.CTA8 9.8 �0.61 55.9
Lodging score (1–5)1B ST02 41 AAC.GCAG13/AGT.CTG1 7.1 0.37 16.74AL LA03 4 GCTG.CTT9/BARC170.4AL 5.0 0.36 14.15A LA03, ST03 38 ACG.GAC1.2/ACG.GAC6 5.9 �0.39 23.0
695

Chromosome 5A, where our most repeatable yieldQTL was identified, is known to carry a number ofmajor genes affecting anthesis date, frost tolerance,drought tolerance (Sourdille et al. 2002; Toth et al.2003), productivity, and adaptability (Kato et al. 2000;Huang et al. 2004). The QTL in 5A identified here maybe related to the one detected for yield by Kato et al.(2000). The yield QTL in linkage group 4B was uniquelydetected in this population, though this genomic regionwas coincidental to other adaptation traits (plant heightand shattering) and to spike length (Fig. 1). We foundno previous report of a yield QTL on 4B.
Less consistent or environment-specific chromosomeregions associated with yield were identified in linkagegroups 2BL, 4AL, 5B, 6B, and 7DL2 (Fig. 1). Similarfindings with yield were reported for 2BL and 5B(Huang et al. 2003), 4AL (Araki et al. 1999), and 6B(Huang et al. 2004). No QTL was previously reportedon 7DL.
The lack of association between yield and spikenumber resulted in no common QTLs between them(Figs. 1, 2). Inconsistent parental differences in spikenumber (data not shown) further hindered an attempt todetect meaningful QTLs for this yield component.
Linkage group 3BS contained a QTL for spike numberthat explained 12% of the phenotypic variance (Table 2).This finding agrees with the results of Huang et al.(2003), but Huang et al. (2004) reported another QTLfor spike number on chromosome 1B.
In contrast to spike number, eight QTLs were detectedfor kernel number per spike (Table 2). Six of these weremapped to linkage groups 1AL, 1B, 2BS, 3BS, 4B, and7BS2 at which the Clark allele increased kernel numberper spike. Two other QTLs, with positive effects fromNing7840, were found in linkage groups 2DL2 and 6A.The major QTL in linkage group 6A was significant in allenvironments and coincident with the 6A QTL for yield(Fig. 1). In another unrelated population, Huang et al.(2004) identified a QTL in the same genomic position andwith similar effects. Other important QTLs for kernelnumber per spike, CTCG.CGAC6/CTCG.CT2 on 1ALand ACT.CAT11/AGG.CAG1 on 4B, showed commoneffects on grain yield in some, but not all, environments(Table 2, Fig. 1).
Distinct differences between parental lines for spikeweight allowed the identification of seven QTLs in asmany linkage groups (Table 2). Four QTLs in linkagegroups 2DL, 3BS, 5A, and 6B explained 10–13% of the
Table 2 (Contd.)
Linkage group Environment Position(cM)
Marker interval LODa ab R2(%)
Leaf yellowing (1–5)2BL LA02 38 ACT.CAT4/GCTG.ACGC2 4.6 �0.29 11.02DL2 LA03 16 AGC.TGC5/WMC41.2DL 5.2 0.31 14.53BS LA02 72 CTCG.AGC1/AGT.CTG13 4.0 0.27 9.35A LA03, ST03, LA02 38 ACG.GAC1.2/ACG.GAC6 6.0 �0.35 16.66A LA03, ST03 31 ACA.CTA1.5/AAC.GAC1 4.3 �0.35 12.37DL3 LA03 29 CTCG.GTG9/AAG.CTC6 3.4 �0.26 8.7
Leaf rust reaction (%)1B ST02, LA02 41 AAC.GCAG13/AGT.CTG1 3.4 7.7 7.42DL2 ST02, LA02 16 AGC.TGC5/WMC41.2DL 3.5 �9.2 7.93BS ST02, LA02 51 ACT.CAT3/XGWM493.3BS 7.2 �11.6 16.9
Spike morphologySpike length (cm)1AL LA03 58 AGG.CTG7/AGC.GCG3.7 4.1 �0.44 12.81AS ST03, AL02 79 BARC28.1AS/AGT.GCG6 3.3 0.31 10.81B ST03, ST02 70 CTCG.AGC9/AAG.CAGT1 3.7 �0.30 9.62BL ST01 53 AGC.CTC11/U298 3.8 0.37 11.92BS LA03, ST01 159 GCTG.GTG7/AAC.CAG1 4.3 0.31 13.73BL LA03, ST01, AL02, ST02 61 AGG.CTC7/CTCG.CTC11 3.3 �0.30 7.44B ST02 83 BARC20.4BS-7BL/AAC.GCAG4 8.2 0.40 18.05B LA03, ST03, ST01, AL02 134 ACA.CTG1/GCTG.GCAG3 6.8 �0.44 16.67A ST03, ST02 24 CTCG.CAT1/AAG.AGC12 4.7 0.40 17.17BS ST02 39 AGC.GCG13/AGG.CTC3 4.3 �0.28 8.7
Spike density (1–4)1B LA03, ST03 0 ACA.CTA7/CTCG.CTC10 3.2 �0.24 9.84AL LA03 21 CTCG.GTG3/ACC.AGC2 3.5 0.22 11.87BS ST01 38 E13/AGC.GCG13 5.8 �0.33 15.97DL3 ST03 7 BARC172.7DL/GTG.CAGT4 3.8 �0.29 14.1
aLOD value was calculated based on line mean from each location. All locations listed have a LOD value of 3 or higher. The largest LODvalue was listed if more than one location showed a LOD value of 3 or higherbAdditive effects were estimated as the mean (in trait unit) difference between the two RIL genotypic groups carrying the Clark andNing7840 alleles. A positive value implies the Clark allele increased phenotypic value whereas a negative value implies the Clark alleledecreased phenotypic value
696

phenotypic variation, in which the Clark allele increasedspike weight. Three QTLs in which Ning7840 increasedspike weight were located in linkage groups 1B, 2BL,and 3BL2, explaining 8–11% of the phenotypic vari-ance. Putative QTLs in linkage groups 1B and 6B wereamong the most consistent across environments, yet wefound no QTLs previously reported in those positions.Additional evidence of QTLs was reported on chromo-somes 3BS and 6A (Huang et al. 2004), 4A (Araki et al.1999; Borner et al. 2002), and 5A (Kato et al. 2000). Thestrongest phenotypic association exhibited by spikeweight and yield (Fig. 2) may be reflected in the commonQTL region in 1B and 5A. No common locus wasidentified among other QTLs that mapped to the samechromosome (2BL and 6B). The role of these uniqueQTLs for spike weight to yield formation is not easilyelucidated considering yield fluctuations are tempered byspikes with fewer heavy kernels or with more numerouslighter kernels.
Summarizing to this point, yield traits in this popu-lation were largely influenced by QTLs distributedamong linkage groups 1AL, 1B, 2BL, 3BS, 4B, 5A, 6B,and 7A. Grain yield QTLs were mapped in the samepositions as that for kernel number on linkage groups1A and 4B and for spike weight on 1B and 5A, sug-gesting that kernel size and spike weight may directlycontribute to yield in those four genomic regions. NoQTL for spike number was mapped in a yield QTLregion. Considering all traits (Table 2), a QTL for spikenumber, kernel number per spike, and spike weightmapped to the same position in the marker intervalXGWM533/CTCG.AGC1 (3BS) as did a QTL forkernel number per spike and kernel weight in themarker interval AGG.CTC13/CTCG.AGC9 (1B) andAGT.CTG13/XGWM389 (3BS).
In addition, genomic regions significantly associatedwith traits conditioning adaptation were also associatedwith yield. Clusters of yield-coincident QTLs were foundin linkage groups 1B (lodging and leaf rust reaction), 4B(plant height), 5A (shattering, lodging, and leaf yellow-ing), and 7A (shattering). Coincidence of QTLs mayindicate either single QTL with pleiotropic effects or thatthe genomic regions associated with these QTLs harbora cluster of linked genes associated with yield potentialand adaptation.
Summarizing across all traits, the QTLs for anunusually high number of traits were located on thelinkage group 1B (8 from 13 possible, Fig. 1). Ning7840is believed to possess the 1RS.1BL translocation (NGRP2005), which was likely segregating in this RIL popula-tion. The 1RS.1BL translocation from Avrora was pre-viously shown to increase grain yield in Oklahoma by 9–10% (Carver and Rayburn 1994), but only in oneenvironment (ST03) was a QTL directly attributed toyield in linkage group 1B (Table 2).
In conclusion, the genetic control of grain yield andassociated agronomic traits of wheat was dissected intoQTLs. These traits were primarily influenced by QTLsconcentrated in at least seven distinct genomic regions.
Key QTLs in 2BL, 2BS, 2DL, and 6B were uniquelyassociated with yield and yield components and offer thegreatest potential for marker-assisted yield improvementschemes. In addition to 1B, other QTLs in linkagegroups 1AL, 4B, 5A, 6A, and 7A impacted grain yieldthrough their effect on related traits (e.g., lodgingresistance). Several important flanking markers wereAFLPs and will thus need to be converted into sequence-tagged site (STS), or more SSR markers need to beidentified in these regions. With further validation, theidentified QTLs for yield and agronomic related traitsshould allow for the design of appropriate marker-as-sisted selection strategies that center on multi-traitselection for desirable characters with coincident QTLlocations and on breaking unfavorable linkages betweennegatively correlated traits.
Acknowledgements We gratefully acknowledge the contribution ofDr. G. Shaner, Purdue University (RIL population development),Drs. P. B. Cregan and Q. J. Song, USDA-ARS, Beltsville, MD(primers and sequence information of BARCs) and Dr. Roder,IPK, Gatersleben, Germany, (primers and sequences of XGWMs).Thank is also extended to the technical assistance of Mr. W.Whitmore (field experiment). Mention of trade names or com-mercial products in this article is solely for the purpose of providingspecific information and does not imply recommendation orendorsement by the U.S. Department of Agriculture. A portion ofthis research was funded by the Oklahoma Wheat ResearchFoundation and the Oklahoma Agric. Exp. Stn.
References
Araki E, Miura H, Sawada S (1999) Identification of genetic lociaffecting amylose content and agronomic traits on chromosome4A of wheat. Theor Appl Genet 98:977–984
Bai G, Kolb FL, Shaner G, Domier LL (1999) Amplified fragmentlength polymorphism markers linked to a major quantitativetrait locus controlling scab resistance in wheat. Phytopatho89:343–348
Basten CJ, Weir BS, Zeng Z-B (2001) QTL cartographer: a refer-ence manual and tutorial for QTL mapping. Department ofStatistics, North Carolina State University, Raleigh, pp 55–72
Borner A, Schumann E, Furste A, Coster H, Leithold B, RoderMS, Weber WE (2002) Mapping of quantitative trait locidetermining agronomic important characters in hexaploidwheat (Triticum aestivum L). Theor Appl Genet 105:921–936
Bullrich L, Appendino ML, Tranquilli G, Lewis S, Dubcovsky J(2002) Mapping of a thermo-sensitive earliness per se gene ontriticum monococcum chromosome 1Am. Theor Appl Genet105:585–593
Cadalen T, Sourdille P, Charmet G, Tixier MH, Gay G, Boeuf C,Bernard S, Leroy P, Bernard M (1998) Molecular markerslinked to genes affecting plant height in wheat using a double-haploid population. Theor Appl Genet 96:933–940
Campbell BT, Baenziger PS, Gill KS, Eskridge KM, Budak H,Erayman M, Dweikat I, Yen Y (2003) Identification of QTLsand environmental interactions associated with agronomictraits on chromosome 3A of wheat. Crop Sci 43:1493–1505
Carver BF, Rayburn AL (1994) Comparison of related wheatstocks possessing 1B or 1BL1RS chromosomes: agronomicperformance. Crop Sci 34:1505–1510
Cook JP, Wichman DM, Martin JM, Bruckner PL, Talbert LE(2004) Identification of microsatellite markers associated with astem solidness locus in wheat. Crop Sci 44:1397–1402
Doerge RW (2002) Mapping and analysis of quantitative trait lociin experimental populations. Nat Genet 3:43–52
697

Food and Agricultural Organization (2004) FAO, Rome. http://www.fao.org/ag/
Gupta K, Balyan S, Edwards J, Isaac P, Korzun V, Roder M,Gautier MF, Joudrier P, Schlatter R, Dubcovsky J, De La PenaC, Khairallah M, Penner G, Hayden J, Sharp P, Keller B, WangC, Hardouin P, Jack P, Leroy P (2002) Genetic mapping of 66new microsatellite (SSR) loci in bread wheat. Theor Appl Genet105:213–422
Henry M, Ginkel MV, Khairallah M (2002) Marker-assistedselection for BYDV resistance in wheat. Mexico, DF, Mexico,pp 41–44. http://www.cimmyt.org/Research
Huang XQ, Coster H, Ganal MW, Roder MS (2003) Advancedbackcross QTL analysis for the identification of quantitativetrait loci alleles from wild relatives of wheat (Triticum aestivumL). Theor Appl Genet 106:1379–1389
Huang XQ, Kempf H, Ganal MW, Roder MS (2004) Advancedbackcross QTL analysis in progenies derived from a cross be-tween a German elite winter wheat variety and a syntheticwheat (Triticum aestivum L). Theor Appl Genet 109:933–943
Kato K, Miura H, Sawada S (2000) Mapping QTLs controllinggrain yield and its components on chromosome 5A of wheat.Theor Appl Genet 101:1114–1121
Kearsey MJ, Farquhar AGL (1998) QTL analysis in plants; whereare we now? Heredity 80:137–142
Kearsey MJ, Pooni HS (1996) The genetical analysis of quantita-tive traits. 1st edn. Chapman and Hall, London
Keller M, Karutz Ch, Schmid JE, Stamp P, Winzeler M, Keller B,Messmer MM (1999) Quantitative trait loci for lodging resis-tance in a segregating wheat · spelt population. Theor ApplGenet 98:1171–1182
Kosambi DD (1944) The estimation of map distances fromrecombination values. Ann Eugen 12:172–175
Lander ES, Green P, Abrahamson J, Barlow A, Daly MJ, LincolnSE, Newburg I (1987) MAPMAKER: an interactive computerpackage for constructing primary genetic linkage maps ofexperimental and natural populations. Genomics 1:174–181
Marshall DR, Langridge P, Appels R (2001) Wheat breeding in thenew century. http://www.publish.csiro.au/journals/ajar
National Genetic Resources Program (2005) Germplasm resourcesinformation network. USDA-ARS, Beltsville. http://www.ars-grin.gov/cgi-bin/npgs/html
Ohm HW, Shaner G, Foster JE, Patterson FL, Buechley G (1988)Registration of ‘Clark’ wheat. Crop Sci 28:1031–1032
Pestsova E, Ganal MW, Roder MS (2000) Isolation and mappingof microsatellite markers specific for the D genome of breadwheat. Genome 43:689–697
Roder MS, Korsun V, Wendehake K, Plaschke J, Tixier MH,Leroy P, Ganal MW (1998) A microsatellite map of wheat.Genetics 149:2007–2023
Roder M, Wendehake K, Korzun V, Bredemeijer G, Laborie D,Bertrand L, Isaac P, Rendell S, Jackson J, Cooke R, Vosman B,Ganal M (2002) Construction and analysis of a microsatellite-based database of European wheat varieties. Theor Appl Genet106:67–73
Saghai-Maroof MA, Soliman KM, Jorgensen RA, Allard RW(1984) Ribosomal DNA spacer-length polymorphism in barley:Mendelian inheritance, chromosome location, and populationdynamics. Proc Natl Acad Sci USA 81:8014–8018
SAS Institute (2003) SAS/STAT user’s guide, version 9.1. SASInstitute, Cary
Shah MM, Gill KS, Baenziger PS, Yen Y, Kaeppler SM,Ariyarathne HM (1999) Molecular mapping of loci for agro-nomic traits on chromosome 3A of bread wheat. Crop Sci39:1728–1732
Shindo C, Tsujimoto H, Sasakuma T (2003) Segregation analysis ofheading traits in hexaploid wheat utilizing recombinant inbredlines. Heredity 90:56–63
Singh RP, Nelson JC, Sorrells ME (2000) Mapping Yr28 and othergenes for resistance to stripe rust in wheat. Crop Sci 40:1148–1155
Somers DJ, Isaac P, Edwards K (2004) A high-density microsat-ellite consensus map for bread wheat (Triticum aestivum L).Theor Appl Genet 109:1105–1114
Song QJ, Shi JR, Singh S, Fickus EW, Costa JM, Lewis J, Gill BS,Ward R, Cregan PB (2005) Development and mapping of mi-crosatellite (SSR) markers in wheat. Theor Appl Genet110:550–560
Sourdille P, Tixier MH, Charmet G, Gay G, Cadalen T, Bernard S,Bernard M (2000) Location of genes involved in ear compact-ness in wheat (Triticum aestivum) by means of molecularmarkers. Mol Breed 6:247–255
Sourdille P, Cadalen T, Gay G, Gill B, Bernard M (2002) Molec-ular and physical mapping of genes affecting awning in wheat.Plant Breed 121:320–324
Toth B, Galiba G, Feher E, Sutka J, Snape JW (2003) Mappinggenes affecting flowering time and frost resistance on chromo-some 5B of wheat. Theor Appl Genet 107:509–514
Vos P, Hogers R, Bleeker M, Reijans M, Van de Lee T, Hornes M,Frijters A, Pot J, Peleman J, Kuiper M, Zabeau M (1995)AFLP: a new technique for DNA fingerprinting. Nucleic AcidsRes 23:4407–4414
Wang S, Basten CJ, Zeng Z (2004) Windows QTL cartogra-pher. V2.0 Program in statistical genetics, North CarolinaState University, North Carolina. http://www.statgen.ncsu.edu/qtlcart/WQTLCart.htm
698
Copyright © 2022 FDOKUMEN