Genome-Wide Association Reveals Trait Loci for Seed ... - MDPI
18
Citation: Tandayu, E.; Borpatragohain, P.; Mauleon, R.; Kretzschmar, T. Genome-Wide Association Reveals Trait Loci for Seed Glucosinolate Accumulation in Indian Mustard (Brassica juncea L.). Plants 2022, 11, 364. https:// doi.org/10.3390/plants11030364 Academic Editor: Abdelmajid Kassem Received: 14 December 2021 Accepted: 26 January 2022 Published: 28 January 2022 Publisher’s Note: MDPI stays neutral with regard to jurisdictional claims in published maps and institutional affil- iations. Copyright: © 2022 by the authors. Licensee MDPI, Basel, Switzerland. This article is an open access article distributed under the terms and conditions of the Creative Commons Attribution (CC BY) license (https:// creativecommons.org/licenses/by/ 4.0/). plants Article Genome-Wide Association Reveals Trait Loci for Seed Glucosinolate Accumulation in Indian Mustard (Brassica juncea L.) Erwin Tandayu , Priyakshee Borpatragohain, Ramil Mauleon and Tobias Kretzschmar * Faculty of Science and Engineering, Lismore Campus, Southern Cross University, East Lismore, NSW 2480, Australia; [email protected] (E.T.); [email protected] (P.B.); [email protected] (R.M.) * Correspondence: [email protected] Abstract: Glucosinolates (GSLs) are sulphur- and nitrogen-containing secondary metabolites im- plicated in the fitness of Brassicaceae and appreciated for their pungency and health-conferring properties. In Indian mustard (Brassica juncea L.), GSL content and composition are seed-quality- determining traits affecting its economic value. Depending on the end use, i.e., condiment or oil, different GSL levels constitute breeding targets. The genetic control of GSL accumulation in Indian mustard, however, is poorly understood, and current knowledge of GSL biosynthesis and regulation is largely based on Arabidopsis thaliana. A genome-wide association study was carried out to dissect the genetic architecture of total GSL content and the content of two major GSLs, sinigrin and glu- conapin, in a diverse panel of 158 Indian mustard lines, which broadly grouped into a South Asia cluster and outside-South-Asia cluster. Using 14,125 single-nucleotide polymorphisms (SNPs) as genotyping input, seven distinct significant associations were discovered for total GSL content, eight associations for sinigrin content and 19 for gluconapin. Close homologues of known GSL structural and regulatory genes were identified as candidate genes in proximity to peak SNPs. Our results provide a comprehensive map of the genetic control of GLS biosynthesis in Indian mustard, including priority targets for further investigation and molecular marker development. Keywords: Brassica juncea; genome-wide association studies; glucosinolates (GSL); seed quality 1. Introduction Glucosinolates (GSLs) are a class of well-studied sulphur (S)- and nitrogen (N)- con- taining secondary metabolites almost exclusively found in Brassicaceae, which include the economically and nutritionally important crops B. napus (canola and rapeseed), B. juncea (Indian mustard), B. oleracea (cabbage) and B. rapa (Chinese cabbage, turnip) [1–3]. Most of our knowledge on GSL biosynthesis, its regulation and its links to other metabolic pathways is based on the closely related model plant, Arabidopsis thaliana [1,4,5]. GSLs are categorised into three major classes, depending on the amino acid they are derived from: (i) aliphatic GSLs, predominantly derived from methionine and, to a lesser extent, from leucine, isoleucine and valine; (ii) aromatic GSLs, mostly derived from phenylala- nine or tyrosine and (iii) indolic GSLs, derived from tryptophan. The synthesis of GSLs proceeds in three major steps: (i) chain elongation of precursor amino acids (only for methionine and phenylalanine), (ii) GSL core structure formation and (iii) GSL side chain modification. A recent comprehensive inventory from the literature and pathway databases (KNApSAcK, KEGG and AraCyc) listed as many as 113 genes associated with GSLs in Arabidopsis that were identified and characterised over the last two decades [4]. This in- cludes 53 biosynthetic genes found in the KEGG or AraCyc databases, 32 experimentally confirmed biosynthetic genes, 23 transcriptional components and five transporters. While the GSL biosynthetic pathways are well understood in Arabidopsis, the respective regulatory Plants 2022, 11, 364. https://doi.org/10.3390/plants11030364 https://www.mdpi.com/journal/plants
-
Upload
khangminh22 -
Category
Documents
-
view
2 -
download
0
Transcript of Genome-Wide Association Reveals Trait Loci for Seed ... - MDPI

�����������������
Citation: Tandayu, E.;
Borpatragohain, P.; Mauleon, R.;
Kretzschmar, T. Genome-Wide
Association Reveals Trait Loci for
Seed Glucosinolate Accumulation in
Indian Mustard (Brassica juncea L.).
Plants 2022, 11, 364. https://
doi.org/10.3390/plants11030364
Academic Editor:
Abdelmajid Kassem
Received: 14 December 2021
Accepted: 26 January 2022
Published: 28 January 2022
Publisher’s Note: MDPI stays neutral
with regard to jurisdictional claims in
published maps and institutional affil-
iations.
Copyright: © 2022 by the authors.
Licensee MDPI, Basel, Switzerland.
This article is an open access article
distributed under the terms and
conditions of the Creative Commons
Attribution (CC BY) license (https://
creativecommons.org/licenses/by/
4.0/).
plants
Article
Genome-Wide Association Reveals Trait Loci for SeedGlucosinolate Accumulation in Indian Mustard(Brassica juncea L.)Erwin Tandayu , Priyakshee Borpatragohain, Ramil Mauleon and Tobias Kretzschmar *
Faculty of Science and Engineering, Lismore Campus, Southern Cross University,East Lismore, NSW 2480, Australia; [email protected] (E.T.);[email protected] (P.B.); [email protected] (R.M.)* Correspondence: [email protected]
Abstract: Glucosinolates (GSLs) are sulphur- and nitrogen-containing secondary metabolites im-plicated in the fitness of Brassicaceae and appreciated for their pungency and health-conferringproperties. In Indian mustard (Brassica juncea L.), GSL content and composition are seed-quality-determining traits affecting its economic value. Depending on the end use, i.e., condiment or oil,different GSL levels constitute breeding targets. The genetic control of GSL accumulation in Indianmustard, however, is poorly understood, and current knowledge of GSL biosynthesis and regulationis largely based on Arabidopsis thaliana. A genome-wide association study was carried out to dissectthe genetic architecture of total GSL content and the content of two major GSLs, sinigrin and glu-conapin, in a diverse panel of 158 Indian mustard lines, which broadly grouped into a South Asiacluster and outside-South-Asia cluster. Using 14,125 single-nucleotide polymorphisms (SNPs) asgenotyping input, seven distinct significant associations were discovered for total GSL content, eightassociations for sinigrin content and 19 for gluconapin. Close homologues of known GSL structuraland regulatory genes were identified as candidate genes in proximity to peak SNPs. Our resultsprovide a comprehensive map of the genetic control of GLS biosynthesis in Indian mustard, includingpriority targets for further investigation and molecular marker development.
Keywords: Brassica juncea; genome-wide association studies; glucosinolates (GSL); seed quality
1. Introduction
Glucosinolates (GSLs) are a class of well-studied sulphur (S)- and nitrogen (N)- con-taining secondary metabolites almost exclusively found in Brassicaceae, which include theeconomically and nutritionally important crops B. napus (canola and rapeseed), B. juncea(Indian mustard), B. oleracea (cabbage) and B. rapa (Chinese cabbage, turnip) [1–3]. Mostof our knowledge on GSL biosynthesis, its regulation and its links to other metabolicpathways is based on the closely related model plant, Arabidopsis thaliana [1,4,5]. GSLsare categorised into three major classes, depending on the amino acid they are derivedfrom: (i) aliphatic GSLs, predominantly derived from methionine and, to a lesser extent,from leucine, isoleucine and valine; (ii) aromatic GSLs, mostly derived from phenylala-nine or tyrosine and (iii) indolic GSLs, derived from tryptophan. The synthesis of GSLsproceeds in three major steps: (i) chain elongation of precursor amino acids (only formethionine and phenylalanine), (ii) GSL core structure formation and (iii) GSL side chainmodification. A recent comprehensive inventory from the literature and pathway databases(KNApSAcK, KEGG and AraCyc) listed as many as 113 genes associated with GSLs inArabidopsis that were identified and characterised over the last two decades [4]. This in-cludes 53 biosynthetic genes found in the KEGG or AraCyc databases, 32 experimentallyconfirmed biosynthetic genes, 23 transcriptional components and five transporters. Whilethe GSL biosynthetic pathways are well understood in Arabidopsis, the respective regulatory
Plants 2022, 11, 364. https://doi.org/10.3390/plants11030364 https://www.mdpi.com/journal/plants

Plants 2022, 11, 364 2 of 18
and metabolic networks in the allotetraploid Brassica crops (B. napus and B. juncea) aresuggested to be much more complex due to their intricate evolutionary history [6].
Indian mustard is an economically important Brassica, cultivated for two distinctmarkets. In India, Bangladesh, China and the Ukraine, and more recently in Canada andAustralia, it is grown as an oilseed crop [7]. On the other hand, in Europe, North America,Argentina and China, it is primarily grown for condiment production (e.g., mustard and“wasabi” paste). Both end uses rely on GSL content as a trait to be selected either for oragainst during varietal improvement. “Canola” is a trademark term of the Canadian CanolaAssociation used to describe rape or oilseed cultivars with “double low” GSLs (<30 µmol/gin defatted seed meal) and less than 2% erucic acid [8]. In B. juncea grown as a canola-typeoilseed crop, GSLs have largely been selected against, which enables seed meal to be usedfor animal feed after oil extraction. Breeding for low-GSL B. juncea was spearheaded byCanadian breeders through the introgression of low-GSL “Bronowski” alleles from canolaB. napus into an Indian high-GSL B. juncea line [9]. The resulting donor genotype for thelow-GSL trait has been extensively used in breeding for low GSLs in Canadian and Aus-tralian germplasm [10]. As such, canola-quality B. juncea has become a viable alternativeoil crop [11–13]. For the condiment market, high GSL levels, high sinigrin in particular, aredesirable [14]. Sinigrin, when hydrolysed, produces allyl-isothiocyante (AITCs), includingsulphoraphane, responsible for the pungency of mustard and demonstrated to possess tu-mour suppression properties [15,16]. Notably, Indian mustard predominantly accumulatesthe aliphatic GSLs 2-propenyl-GSL (sinigrin) and 3-butenyl-GSL (gluconapin), and, to alesser extent, 2-hydroxy-3-butenyl-GSL (progoitrin) [14,17,18].
Enhancing the health-beneficial GSL levels in varieties aimed for vegetable or condi-ment use and reducing the overall GSL and erucic acid levels, while increasing desirablefatty acids in oilseed cultivars, remain among the key seed quality traits for B. junceavariety improvement [17]. A better understanding of the genetic bases of trait variation andcorresponding beneficial alleles would aid in the development of molecular markers forvarietal improvement and an accelerated rate of genetic gain [19,20]. Earlier, classical QTLmapping deciphered beneficial allelic variations for seed quality traits in B. juncea [21–23].Recently, genome-wide association study (GWAS) has become the more popular choiceto dissect the genetic basis of these complex traits. Compared with classical quantitativetrait locus (QTL) mapping, which is generally confined to alleles and novel recombina-tion within a bi-parental population, GWAS is able to tap into the allelic pool of broaderpopulations that have undergone natural and artifical selection throughout domesticationhistory. Since GWAS utilises a broader allelic pool, more variation is investigated. Fur-thermore, actual causal variants tend to be much closer to detected associated markers inGWAS, owing to the longer recombination history than in the case of a bi-parental popu-lation. As a result, GWAS offers a higher mapping resolution of the underlying genomicregions associated with the trait of interest. In Brassica crops, GWAS has been successfullyemployed for dissecting the genetic architecture of seed quality traits such as GSL accumu-lation, fatty acid composition and shattering resistance [24–28]. In B. juncea, high-densitysingle-nucleotide polymorphisms (SNPs) were identified through different strategies, in-cluding double-digest restriction-associated DNA (dd-RAD) [29], RNA sequencing [30],specific-locus amplified fragment sequencing (SLAF-seq) [31], genotyping-by-sequencing(GBS) [29] and resequencing [17]. With these, GWAS has been utilised to investigate seedGSL content using high-density SNPs [17,32]. Akhatar et al., 2020, employed GWAS forseed quality traits including GSL content at varying nitrogen levels under field conditions,while Yang et al., 2021, performed GWAS on a set of vegetable and oilseed B. juncea, inconjunction with deploying two new genome sequences representing vegetable and oilseedvarieties. Among the candidate genes proposed in these studies, only a MYB28, a majorregulatory gene for aliphatic GSL biosynthesis, could be linked to the current inventory [4]of GSL genes in Arabidopsis. This suggests that a large number of possible genetic mecha-nisms may yet be uncovered through GWAS. Thus, the aim of this study was to perform

Plants 2022, 11, 364 3 of 18
GWAS on a set of oilseed Indian mustard to further elucidate the genetic basis and add tothe current understanding of seed GSL accumulation in Indian mustard.
2. Results2.1. Genotype Data
A total of 69,594 SNP sites, with 61,931 (89%) anchored onto chromosomes, wasobtained from the variant calling. An initial filtering for SNPs anchored onto chromosomesfor 60% call rate, non-maf (minor allele frequency) filtered and 10% maximum markerheterozygosity resulted in 15,263 SNPs (26% overall with missing SNP calls), and missingstates were imputed. Following imputation, a final set of 14,125 SNPs resulted from filteringfor 5% minor allele frequency and 20% maximum heterozygosity and was used for GWAS.
2.2. Cluster, Population Structure and Principal Component Analyses of B. juncea Diverse Panel
The diversity panel consisted of 158 accessions from 28 countries, representing SouthAsia (53%, mostly from India and Pakistan), Asia (13%, other than South Asia), Europe (11%),North America (6%), Australia (6%), Africa (6%) and unknown origin (8%) (Table S1). Threeapproaches—(i) hierarchical clustering, (ii) population structure and (iii) PCA—revealed agenetic structure composed of two population clusters broadly reflecting geographical origin.UPGMA-based hierarchical clustering revealed one major cluster comprising accessions fromthe South Asian countries of India and Pakistan (blue-coloured branches), while the othermajor cluster contained accessions from outside of South Asia (green-coloured branches)(Figure 1a). Not all lines, however, matched this trend, including a few accessions from India,Nepal, Afghanistan and Bangladesh that located within the outside-South-Asia cluster anda few entries from Europe, Zimbabwe and China that fell within the South Asia cluster. Athird minor cluster was largely composed of accessions from China and a few from Bhutan.ADMIXTURE suggested a similar structure as UPGMA (Figure 1b). At K = 2, cluster 1 wascomposed of accessions from India and Pakistan, while cluster 2 was mostly composed ofaccessions from outside India and Pakistan, a trend consistent with a previous report [20].Using a 70% membership probability cut-off at K = 2, 46% of accessions fell into cluster 1while 37% of accessions fell into cluster 2, and the remaining 17% were classified as admixedsamples. The admixed samples comprised 13 South Asian (India, Bangladesh, Afghanistan,Nepal and Bhutan) accessions and 14 accessions from outside South Asia. With increasing Kuntil K = 4, geographical origin was still traceable to clustering. At K = 3, accessions from Indiaand Pakistan were dispersed into clusters 1 and 2, while accessions from outside India andPakistan mostly constituted cluster 3. This was similar at K = 4, with further sub-structuringof accessions from outside India and Pakistan comprising clusters 3 and 4. A ten-fold crossvalidation error plot of ADMIXTURE runs using K = 1 to 12 (Figure 1c) showed that the errorstarted to plateau at K = 4, suggesting this as a sensible K choice, while the lowest error wasobserved at K = 8. A PC plot reflecting the K = 2 assignment of ADMIXTURE clearly separatedthe two clusters at PC1 with admix samples interspersed between the clusters (Figure 1d).Further, only 18.7% of variation was explained by PC1, with succeeding PCs explaining lessthan 5% of variation.
2.3. Variance Components, Basic Descriptive Statistics and Correlations between Total GSLs,Sinigrin and Gluconapin
Residual distribution showed an approximately normal distribution with a mean ofzero for total GSLs, sinigrin and gluconapin (Figure S1). Sinigrin and gluconapin com-bined accounted for ~95–99% of the total GSLs for nearly all samples in the diverse panel(Supplemental File S1). Nearly the entire proportion of variation for total GSLs, sinigrinand gluconapin concentrations was accounted for by the samples, based on variance com-ponents analysis using Restricted Maximum Likelihood (REML) (Table S2). This wasfurther reflected by high broad heritability values of ~98% for the single major GLSs sin-igrin and gluconapin, and a slightly lower value of ~88% for the total GSLs. Sinigrinhad a higher range of concentrations (1.61–225.09 µmol/g−1) compared to gluconapin
Plants 2022, 11, 364 4 of 18
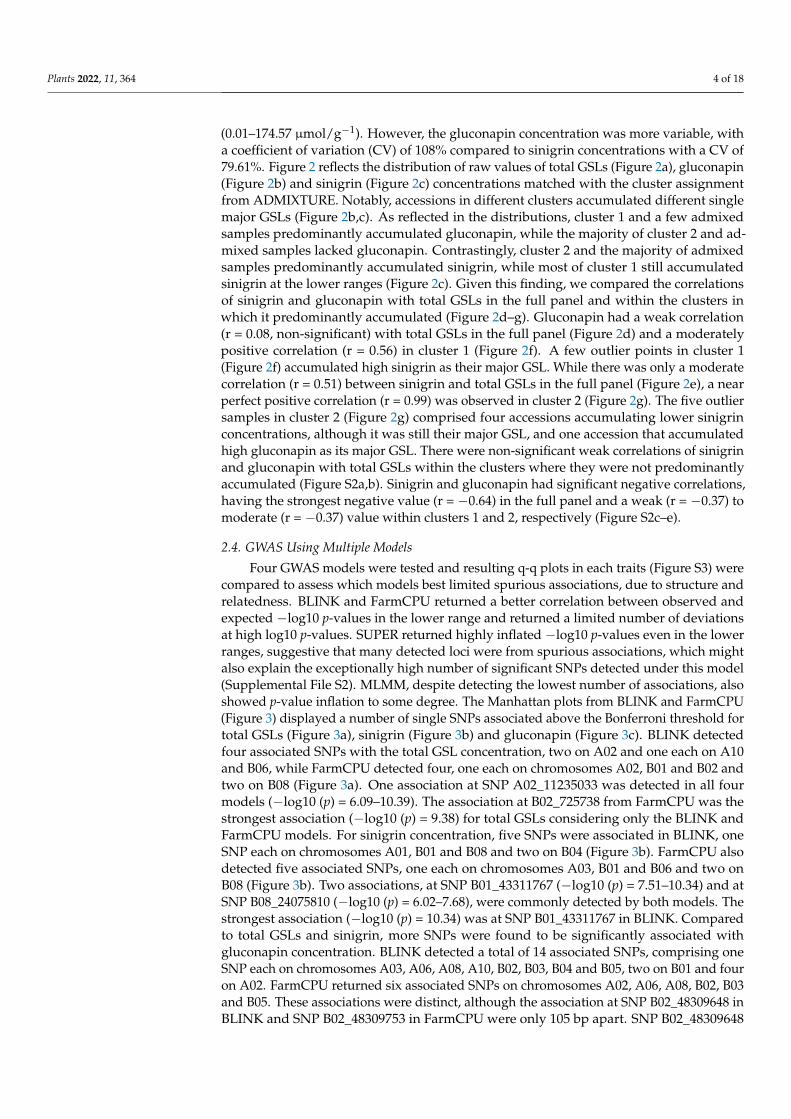
(0.01–174.57 µmol/g−1). However, the gluconapin concentration was more variable, witha coefficient of variation (CV) of 108% compared to sinigrin concentrations with a CV of79.61%. Figure 2 reflects the distribution of raw values of total GSLs (Figure 2a), gluconapin(Figure 2b) and sinigrin (Figure 2c) concentrations matched with the cluster assignmentfrom ADMIXTURE. Notably, accessions in different clusters accumulated different singlemajor GSLs (Figure 2b,c). As reflected in the distributions, cluster 1 and a few admixedsamples predominantly accumulated gluconapin, while the majority of cluster 2 and ad-mixed samples lacked gluconapin. Contrastingly, cluster 2 and the majority of admixedsamples predominantly accumulated sinigrin, while most of cluster 1 still accumulatedsinigrin at the lower ranges (Figure 2c). Given this finding, we compared the correlationsof sinigrin and gluconapin with total GSLs in the full panel and within the clusters inwhich it predominantly accumulated (Figure 2d–g). Gluconapin had a weak correlation(r = 0.08, non-significant) with total GSLs in the full panel (Figure 2d) and a moderatelypositive correlation (r = 0.56) in cluster 1 (Figure 2f). A few outlier points in cluster 1(Figure 2f) accumulated high sinigrin as their major GSL. While there was only a moderatecorrelation (r = 0.51) between sinigrin and total GSLs in the full panel (Figure 2e), a nearperfect positive correlation (r = 0.99) was observed in cluster 2 (Figure 2g). The five outliersamples in cluster 2 (Figure 2g) comprised four accessions accumulating lower sinigrinconcentrations, although it was still their major GSL, and one accession that accumulatedhigh gluconapin as its major GSL. There were non-significant weak correlations of sinigrinand gluconapin with total GSLs within the clusters where they were not predominantlyaccumulated (Figure S2a,b). Sinigrin and gluconapin had significant negative correlations,having the strongest negative value (r = −0.64) in the full panel and a weak (r = −0.37) tomoderate (r = −0.37) value within clusters 1 and 2, respectively (Figure S2c–e).
2.4. GWAS Using Multiple Models
Four GWAS models were tested and resulting q-q plots in each traits (Figure S3) werecompared to assess which models best limited spurious associations, due to structure andrelatedness. BLINK and FarmCPU returned a better correlation between observed andexpected −log10 p-values in the lower range and returned a limited number of deviationsat high log10 p-values. SUPER returned highly inflated −log10 p-values even in the lowerranges, suggestive that many detected loci were from spurious associations, which mightalso explain the exceptionally high number of significant SNPs detected under this model(Supplemental File S2). MLMM, despite detecting the lowest number of associations, alsoshowed p-value inflation to some degree. The Manhattan plots from BLINK and FarmCPU(Figure 3) displayed a number of single SNPs associated above the Bonferroni threshold fortotal GSLs (Figure 3a), sinigrin (Figure 3b) and gluconapin (Figure 3c). BLINK detectedfour associated SNPs with the total GSL concentration, two on A02 and one each on A10and B06, while FarmCPU detected four, one each on chromosomes A02, B01 and B02 andtwo on B08 (Figure 3a). One association at SNP A02_11235033 was detected in all fourmodels (−log10 (p) = 6.09–10.39). The association at B02_725738 from FarmCPU was thestrongest association (−log10 (p) = 9.38) for total GSLs considering only the BLINK andFarmCPU models. For sinigrin concentration, five SNPs were associated in BLINK, oneSNP each on chromosomes A01, B01 and B08 and two on B04 (Figure 3b). FarmCPU alsodetected five associated SNPs, one each on chromosomes A03, B01 and B06 and two onB08 (Figure 3b). Two associations, at SNP B01_43311767 (−log10 (p) = 7.51–10.34) and atSNP B08_24075810 (−log10 (p) = 6.02–7.68), were commonly detected by both models. Thestrongest association (−log10 (p) = 10.34) was at SNP B01_43311767 in BLINK. Comparedto total GSLs and sinigrin, more SNPs were found to be significantly associated withgluconapin concentration. BLINK detected a total of 14 associated SNPs, comprising oneSNP each on chromosomes A03, A06, A08, A10, B02, B03, B04 and B05, two on B01 and fouron A02. FarmCPU returned six associated SNPs on chromosomes A02, A06, A08, B02, B03and B05. These associations were distinct, although the association at SNP B02_48309648 inBLINK and SNP B02_48309753 in FarmCPU were only 105 bp apart. SNP B02_48309648

Plants 2022, 11, 364 5 of 18
in BLINK represented the strongest association (−log10 (p) = 17.47). FarmCPU appearedthe most suitable model for total GSLs and sinigrin with respect to the control of spuriousassociations as most observed p-values correlated with expected p-values, with only a fewp-values deviating sharply at the tail end (Figure S2a,b). For gluconapin, BLINK associateda higher number of SNPs, while controlling best for spurious associations (Figure S2c).
Plants 2022, 11, x FOR PEER REVIEW 4 of 19
Figure 1. (a) Cluster analysis based on genetic distance using an UPGMA tree with branches col-
oured based on geographical origin: India and Pakistan and rest of South Asia (blue), rest of Asia,
Europe, North America, Africa and Australia (green) and unknown origin (yellow). (b) Population
structure as depicted by a sorted bar plot of ancestry proportions for K = 2–4, inferred with ADMIX-
TURE. (c) Ten-fold cross-validation error of ADMIXTURE analyses of K = 1 to 12. (d) Principal com-
ponent analysis (PCA) coloured based on cluster assignment (threshold of 70% membership prob-
ability) at K = 2 in ADMIXTURE. Orange triangles used for cluster 1, purple squares for cluster 2
and green dots for admixture cluster.
2.3. Variance Components, Basic Descriptive Statistics and Correlations between Total GSLs,
Sinigrin and Gluconapin
Residual distribution showed an approximately normal distribution with a mean of
zero for total GSLs, sinigrin and gluconapin (Figure S1). Sinigrin and gluconapin com-
bined accounted for ~95–99% of the total GSLs for nearly all samples in the diverse panel
(Supplemental File S1). Nearly the entire proportion of variation for total GSLs, sinigrin
and gluconapin concentrations was accounted for by the samples, based on variance com-
ponents analysis using Restricted Maximum Likelihood (REML) (Table S2). This was fur-
ther reflected by high broad heritability values of ~98% for the single major GLSs sinigrin
and gluconapin, and a slightly lower value of ~88% for the total GSLs. Sinigrin had a
higher range of concentrations (1.61–225.09 µmol/g−1) compared to gluconapin (0.01–
174.57 µmol/g−1). However, the gluconapin concentration was more variable, with a coef-
ficient of variation (CV) of 108% compared to sinigrin concentrations with a CV of 79.61%.
Figure 2 reflects the distribution of raw values of total GSLs (Figure 2a), gluconapin (Fig-
ure 2b) and sinigrin (Figure 2c) concentrations matched with the cluster assignment from
ADMIXTURE. Notably, accessions in different clusters accumulated different single ma-
Figure 1. (a) Cluster analysis based on genetic distance using an UPGMA tree with branches colouredbased on geographical origin: India and Pakistan and rest of South Asia (blue), rest of Asia, Europe,North America, Africa and Australia (green) and unknown origin (yellow). (b) Population structureas depicted by a sorted bar plot of ancestry proportions for K = 2–4, inferred with ADMIXTURE.(c) Ten-fold cross-validation error of ADMIXTURE analyses of K = 1 to 12. (d) Principal componentanalysis (PCA) coloured based on cluster assignment (threshold of 70% membership probability) atK = 2 in ADMIXTURE. Orange triangles used for cluster 1, purple squares for cluster 2 and greendots for admixture cluster.
2.5. Significant GWAS Hits Had Known and Potential GSL Genes in Their Vicinity
The LD decay plot based on 14,125 SNPs suggested no effective LD (threshold ofr2 = 0.1) at distances above 500 kb (Figure S4); hence, the search for potential candidategenes (using the B. juncea var. tumida V1.5 annotation) proximal to the trait-associatedSNPs was limited to 250 kb upstream and downstream of the SNP position. Based ontheir homology with Arabidopsis genes and respective annotation, candidate genes wereclassified as known or potential GSL genes (Table 1).

Plants 2022, 11, 364 6 of 18
Plants 2022, 11, x FOR PEER REVIEW 5 of 19
jor GSLs (Figure 2b,c). As reflected in the distributions, cluster 1 and a few admixed sam-
ples predominantly accumulated gluconapin, while the majority of cluster 2 and admixed
samples lacked gluconapin. Contrastingly, cluster 2 and the majority of admixed samples
predominantly accumulated sinigrin, while most of cluster 1 still accumulated sinigrin at
the lower ranges (Figure 2c). Given this finding, we compared the correlations of sinigrin
and gluconapin with total GSLs in the full panel and within the clusters in which it pre-
dominantly accumulated (Figure 2d–g). Gluconapin had a weak correlation (r = 0.08, non-
significant) with total GSLs in the full panel (Figure 2d) and a moderately positive corre-
lation (r = 0.56) in cluster 1 (Figure 2f). A few outlier points in cluster 1 (Figure 2f) accu-
mulated high sinigrin as their major GSL. While there was only a moderate correlation (r
= 0.51) between sinigrin and total GSLs in the full panel (Figure 2e), a near perfect positive
correlation (r = 0.99) was observed in cluster 2 (Figure 2g). The five outlier samples in
cluster 2 (Figure 2g) comprised four accessions accumulating lower sinigrin concentra-
tions, although it was still their major GSL, and one accession that accumulated high glu-
conapin as its major GSL. There were non-significant weak correlations of sinigrin and
gluconapin with total GSLs within the clusters where they were not predominantly accu-
mulated (Figure S2a,b). Sinigrin and gluconapin had significant negative correlations,
having the strongest negative value (r = −0.64) in the full panel and a weak (r = −0.37) to
moderate (r = −0.37) value within clusters 1 and 2, respectively (Figure S2c–e).
Figure 2. Distribution of raw mean values of (a) total GSLs, (b) gluconapin and (c) sinigrin, reflecting
the ADMIXTURE cluster assignment at K = 2 of each accession (orange for cluster 1, purple for
cluster 2 and green for admixture cluster). Correlations using log-transformed values of (d) glucona-
pin and total GSLs and (e) sinigrin and total GSLs in the full diversity panel. Correlation using log-
transformed values of (f) gluconapin and total GSLs in cluster 1 and (g) sinigrin and total GSLs in
cluster 2. Orange used triangles for cluster 1, purple squares for cluster 2 and green dots for admix-
ture cluster.
Figure 2. Distribution of raw mean values of (a) total GSLs, (b) gluconapin and (c) sinigrin, reflectingthe ADMIXTURE cluster assignment at K = 2 of each accession (orange for cluster 1, purple for cluster2 and green for admixture cluster). Correlations using log-transformed values of (d) gluconapinand total GSLs and (e) sinigrin and total GSLs in the full diversity panel. Correlation using log-transformed values of (f) gluconapin and total GSLs in cluster 1 and (g) sinigrin and total GSLsin cluster 2. Orange used triangles for cluster 1, purple squares for cluster 2 and green dots foradmixture cluster.
For total GSLs, homologues of two known GSL genes were identified near SNPA02_3567961, a significant SNP detected in BLINK and explaining around 7% of the ob-served trait variation (phenotypic variation explained—PVE). These were GSTF11 [33–35]at 39.61 kb upstream and SCPL17 [36] at 68.54 kb downstream. SNP A02_11235033, themost reliable association detected in all four models and accounting for 6% PVE, waslocated 128.81 kb upstream of a homologue of OBP2, encoding a known regulator of GSLbiosynthesis [37]. SNP B02_7295738, which was detected in both FarmCPU and SUPERwith 11% PVE, was found located near two potential GSL genes. Homologues to the poten-tial GSL gene amino acid permease 4 (AAP4) at 213.38 kb upstream and SAL1 at 246.34 kbwere found. SNP B08_66155255, detected only in FarmCPU, albeit at 37% PVE, was agenic SNP within a potential GSL gene, a putative CYP18-3. Moreover, at 17.56 kb, anotherpotential GSL gene, a putative 2-oxoglutarate-dependent dioxygenase gene was found.
For sinigrin, SNP A03_27702263 with 4% PVE, detected by FarmCPU and SUPER,had homologues of several known GSL regulatory genes in proximity. These included aputative MYB28 [38,39] at 118.32 kb upstream, as well as a putative MYB34 [40,41] anda MAM1 [42,43] homologue at 115.48 kb and 160.65 kb downstream. SNP B04_9016612with 7% PVE, significant in BLINK, was found close to a homologue of the known GSLgene FMOGS-OX5 [44,45] at 1.51 kb upstream. B04_17138489 with 12% PVE, which wassignificantly associated only in BLINK, was flanked by a potential GSL gene homologousto phosphoserine aminotransferase 1 (PSAT1) at 12.75 kb.
For gluconapin, SNP A02_34185026, detected by BLINK at 11% PVE, was found tobe flanking an LSU2 homologue, a potential GSL gene, at 5.75 kb downstream. SNPA02_34995417 with 1% PVE, detected in BLINK, was found to be located near additionalhomologues of MYB28 and MYB34 at 81.62 kb and 96.36 kb downstream, respectively. SNPA10_999168, solely detected by BLINK, was flanked by potential GSL genes monothiol

Plants 2022, 11, 364 7 of 18
glutaredoxin S11 (GRXS11) at 105.45 kb upstream and a UDP-glycosyltransferase 71C3(UGT71C3) at 115.13 kb downstream. Variation within these two potential GSL genes mayhave contributed to the 11% PVE of this SNP. With 7% PVE, SNP B01_44925254, detectedin BLINK and SUPER, was located near potential GSL genes RETICULATA-RELATED 3(RER3) at 105.45 kb upstream and a Cysteine Synthase D1 (CYSD1) at 213.34 kb upstream.The strongest association from both BLINK and FarmCPU was only 105 bp apart and wasconsidered the same association, SNP B02_48309648-753 with 3% PVE. This association was180 kb upstream of a HY5 homologue, encoding a known regulator of GSL biosynthesis [46].SNP B03_474869, detected in FarmCPU with 6% PVE, was located near a potential GSLgene, SULPHUR DEFICIENCY-INDUCED 2 (SDI2), at 23.76 kb. On the other hand, SNPB03_7408562, detected in BLINK and MLMM, was found to be near a potential GSL gene,aldehyde dehydrogenase family 2 member B7 (ALDH2B7), located at 135.05 kb downstream.
Plants 2022, 11, x FOR PEER REVIEW 7 of 19
Figure 3. Manhattan and q-q plots for the GWAS of (a) total GSLs, (b) sinigrin and (c) gluconapin
using BLINK (purple dots) and FarmCPU (orange dots) models. The horizontal line represents sig-
nificance threshold at 5% after Bonferroni multiple test correction (−log10 (p) = 5.45).
2.5. Significant GWAS Hits Had Known and Potential GSL Genes in Their Vicinity
The LD decay plot based on 14,125 SNPs suggested no effective LD (threshold of r2 =
0.1) at distances above 500 kb (Figure S4); hence, the search for potential candidate genes
(using the B. juncea var. tumida V1.5 annotation) proximal to the trait-associated SNPs was
limited to 250 kb upstream and downstream of the SNP position. Based on their homology
with Arabidopsis genes and respective annotation, candidate genes were classified as
known or potential GSL genes (Table 1).
Figure 3. Manhattan and q-q plots for the GWAS of (a) total GSLs, (b) sinigrin and (c) gluconapinusing BLINK (purple dots) and FarmCPU (orange dots) models. The horizontal line representssignificance threshold at 5% after Bonferroni multiple test correction (−log10 (p) = 5.45).

Plants 2022, 11, 364 8 of 18
Table 1. Peak SNP characteristics and respective candidate genes homologous to known and potential Arabidopsis genes involved in GSL metabolism.
Trait a Peak SNP p-Value PVE b Model c Candidate Gene Homologous Genein Arabidopsis
% Amino AcidIdentity
Distance toPeak SNP [kb] Arabidopsis ID Gene Description
TGSL A02_3567961 5.08 × 10⁻⁸ 6.63 B BjuA041358 GSTF11 [33–35] 69.16 −39.61 AT3G03190.1 GSL core structure synthesisBjuA041338 SCPL17 [36] 61.43 68.54 AT3G12203.3 GSL side-chain modification
A02_11235033 2.54 × 10⁻⁷ 5.83 B, F, M, S BjuA045411 OBP2 [37] 84.92 −128.81 AT1G07640.1 GSL regulationB02_7295738 4.09 × 10⁻¹⁰ 11.41 F, S BjuB047551 AAP4 94.21 213.38 AT5G63850.1 potential GSL gene
BjuB047557 SAL1 64.76 246.34 AT5G63980.1 potential GSL geneB08_66155255 1.90 × 10⁻⁷ 37.03 F BjuB019211 CYP18-3 65.48 −0.7 AT4G38740.1 potential GSL gene
BjuB019215 Probable 2-ODD d 61.77 −17.56 AT5G05600.1 potential GSL gene
SIN A03_27702263 1.50 × 10⁻⁷ 3.76 F, S BjuA042263 MYB28 [38,39] 79.95 −118.32 AT5G61420.2 GSL regulationBjuA042229 MYB34 [40,41] 71.32 115.48 AT5G60890.1 GSL regulationBjuA042223 MAM1 [42,43] 82.72 160.65 AT5G23010.3 GSL side-chain elongation
B04_9016612 5.04 × 10⁻⁶ 6.84 B BjuB028146 FMOGS-OX5 [44,45] 69.41 −1.51 AT1G12140.3 GSL side-chain modificationB04_17138489 2.51 × 10⁻⁶ 11.71 B BjuB028703 PSAT1 83.57 12.75 AT4G35630.1 potential GSL gene
GNP A02_34185026 1.64 × 10⁻⁷ 11.24 B BjuA033112 LSU2 86.022 5.75 AT5G24660.1 potential GSL geneA02_34995417 1.29 × 10⁻⁶ 0.72 B BjuA002140 MYB28 [38,39] 67.46 81.62 AT5G61420.1 GSL regulation
BjuA001524 MYB34 [40,41] 72.00 96.36 AT5G60890.1 GSL regulationA10_999168 6.85 × 10⁻⁷ 10.72 B BjuA037371 GRXS11 96.97 −105.45 AT1G06830.1 potential GSL gene
BjuA037341 UGT71C3 79.19 115.13 AT1G07260.1 potential GSL geneB01_44925254 1.38 × 10⁻¹⁷ 7.15 B, S BjuB006588 RER3 78.44 −105.02 AT3G08640.1 potential GSL gene
BjuB006607 CYSD1 73.27 −213.34 AT3G04940.2 potential GSL geneB02_48309648-753 3.35 × 10⁻¹⁸ 2.80 B, F BjuB009816 HY5 [46] 89.94 180.71 AT5G11260.1 GSL regulation
B03_474869 2.49 × 10⁻⁶ 6.03 F BjuB005751 SDI2 82.50 23.76 AT1G04770.1 potential GSL geneB03_7408562 7.07 × 10⁻⁸ 4.78 B, M BjuB003011 ALDH2B7 91.01 135.05 AT1G23800.1 potential GSL gene
a TGSL (Total GSLs), SIN (sinigrin), GNP (gluconapin). b Phenotypic variance explained by marker calculated in GAPIT. In case of co-detection with BLINK, PVEs obtained were fromBLINK; if otherwise, PVEs were from FarmCPU. c BLINK(B), FarmCPU (F), MLMM (M), SUPER (S). d Probable 2-oxoglutarate-dependent dioxygenase.

Plants 2022, 11, 364 9 of 18
3. Discussion3.1. Population Structure
The population structure of a diversity panel can confound GWA analysis throughspurious associations [47]. Population clustering based on the UPGMA tree and ADMIX-TURE (at K = 2) reflected a broad grouping based on geographical origin, with one groupcomposed mainly of genotypes from South Asia (India and Pakistan) and another groupfrom outside of South Asia (Figure 1a,b). Recent studies on population structure in Indianmustard reported a similar trend, with optimal Ks in the range of K = 2–3 [20,48]. In ourstudy, ADMIXTURE K = 2 split the panel based on geographical origin (Figure 1b), withfurther sub-structuring of the two broad clusters until K = 4, a sensible K choice basedon the cross-validation error (Figure 1c). The admixed samples may have resulted frominterbreeding of the two population groups in variety improvement efforts. PCA was alsoconcordant with the other methods (Figure 1d). The distribution of total GSLs, sinigrinand gluconapin in our diversity panel resembled that of a different panel of 190 accessionsof diverse geographical origin, quantified for the same chemical traits [14] (Figure 2a–c).ADMIXTURE clustering reflected in the distribution of sinigrin and gluconapin confirmedprevious reports on the correlations of GSL profiles with origin. Accessions from SouthAsian countries India and Pakistan (cluster 1) contained mostly gluconapin and lower levelsof sinigrin, while accessions from outside of South Asia (cluster 2) mostly contained sini-grin in seeds [49–52]. This structure depicts crop divergence leading to these two varietalsubgroups based on different end uses [18,53]. A strong selection for the health-beneficialGSL in East-European-type mustard for leafy vegetable and condiment cultivation wasattributed to a predominant accumulation of sinigrin in samples originating from outsideof South Asia. On the other hand, in India, cultivation was geared towards edible oiluse, with yield and increasing the oil content as the main focus of selection for varietalimprovement and not for a specific GSL type [18,51]. Thus, accessions from the Indiansubcontinent, though predominantly accumulating gluconapin, also accumulated a lowerproportion of sinigrin in our panel, consistent with earlier reports [9,50,51]. As such, theindividual correlations of sinigrin and gluconapin with total GSLs were reflected moreaccurately at subgroup level than in the full panel (Figure 2f,g). In cluster 1, a weakercorrelation between gluconapin and total GSLs reflected the presence of other GSLs inthe total GSLs in these accessions. Conversely, in cluster 2, an almost perfect correlationwas observed between sinigrin and total GSLs, attributed to higher homogeneity of theGSL profile. While this structure and the inter-trait correlations might have confoundingeffects on the GWAS, the resulting q-q plots for the two selected models suggested thatthese covariates were well accounted for and corrected in our analysis.
3.2. Candidate Genes Identified in the Vicinity of Associated SNPs
With the development of newer models with improved statistical power, GWASrecently incorporated multiple model approaches to maximise the power of QTL detec-tion [25,54–56]. FarmCPU and BLINK are two of the newest models, with demonstratedsuperiority in statistical power compared to earlier GWAS methods [57,58]. The single SNPpeaks observed from our GWAS using BLINK and FarmCPU were characteristic results forthese models. Compared with other earlier models that display large peaks with multipleSNPs characteristic of “Manhattan” plots, these models highlight only the most significantmarker in each association [54,57,58]. We located several strong homologues of knownArabidopsis GSL biosynthetic and regulatory genes, as well as potential GSL genes, in thevicinity of most of the significantly associated SNPs (Table 1). The majority of SNPs showedminor effects of around 10% PVE or less, as expected for a complex quantitative trait. Anexception was SNP B08_66155255, with 37.03% PVE for total GSLs. These known and po-tential GSL genes were annotated as such in SuCCombase (https://plant-scc.org, accessedon 7 September 2021) [59], a curated repository of genes involved in the metabolism ofsulphur-containing compounds including GSLs. While the “known” genes were listed inthe inventory of GSL biosynthetic pathways in Arabidopsis [4,5], the “potential GSL genes”

Plants 2022, 11, 364 10 of 18
were identified from published co-expression data, which pinpoint genes that might beinvolved in GSL biosynthesis, yet lack experimental support.
Of the seven listed candidate genes for total GSL concentration, three were foundon chromosome A02, two on B02 and two on B08 (Table 1). BjuA041358 and BjuA041338were homologues of two GSL structural genes, GSTF11 and SCPL17, respectively, and werelinked to SNP A02_3567961. GSTF11 encodes glutathione S-transferase F11, responsible forconverting the intermediate derivative aci-nitro compounds to reduced glutathione (GSH)conjugates during aliphatic GSL core structure synthesis [33–35], making BjuA041358 thestronger candidate. SCPL17, on the other hand, is involved in the production of benzoyloxyGSLs in Arabidopsis [36], making BjuA041338 a less likely candidate. SNP A02_11235033was a high-confidence association, considering that it was detected in all four models. Theonly candidate gene in this region was BjuA045411, a homologue of OBP2 encoding aDNA-binding-with-one-finger (DOF) transcription factor [60], demonstrated to regulateindolic GSL in Arabidopsis [37]. Since nearly all GSLs in B. juncea are aliphatic, however,this OBP2 homologue would need to have a divergent role to account for the total GSLvariation. The association at SNP B02_7295738, the SNP with the second highest PVE(11%) for total GSLs, was linked to two potential GSL genes: BjuB047551, a homologueof AAP4 encoding an amino acid permease 4, and BjuB047557, a homologue of SAL1encoding an inositol polyphosphate 1-phosphatase [59]. Given the high predicted peptidesequence similarity (94%), the AAP4 homologue was likely the better candidate genecompared to the SAL1 homologue at 65% similarity. Despite an exceptionally high PVEof 37.03% for total GSLs, no homologues to known GSL genes were found in the vicinityof SNP B08_66155255. However, SNP B08_66155255 was located within the gene modelof BjuB019211, a homologue of CYP18-3, a putative peptidyl-prolyl cis-trans isomerasepotentially involved in GSL metabolism, as suggested by co-expression with known GSLgenes [59]. Furthermore, around 18 kb upstream, a probable 2-oxoglutarate-dependentdioxygenase encoding gene was located. Known GSL genes AOP2 and AOP3 similarlyencode 2-oxoglutarate-dependent dioxygenases, which catalyse the side-chain oxygenationin the aliphatic GSL core synthesis [61,62]. The high PVE of SNP B08_66155255 meritsfurther investigation.
Of the five candidate genes associated with sinigrin, homologues of three known GSLregulatory genes were found in the vicinity of SNP A03_27702263. BjuA042263, BjuA042229and BjuA042223 were homologues of MYB28, MYB34 and MAM1, respectively. MYB28, alsoknown as HAG1 (HIGH ALIPHATIC GLUCOSINOLATE 1), positively regulates aliphaticGSLs [38,39], with gain-of-function and knock-down mutants showing contrasting levelsof aliphatic GSLs and transcript levels of corresponding biosynthetic genes [38]. MYB28was further identified and validated through combined multi-omics approaches, includingGWAS, as the major gene controlling leaf and seed GSL content in B. napus [25], suggestingthat natural variation at this locus drives phenotypic variation. In oilseed B. juncea, tar-geted silencing of a MYB28 orthologue led to the down-regulation of GSL biosynthesis [6],making BjuA042263 a very strong candidate for this QTL region and a high priority forour further validation efforts. On the other hand, MYB34 mainly exerts its role in theroots to regulate indolic GSL synthesis [40,41] and MAM1 is a methylthioalkylmalate syn-thase involved in the GSL side-chain elongation of short-chained aliphatic GSLs [42,43],suggesting their respective B. juncea homologues to be less likely causal for the effectsassociated with SNP A03_27702263. SNP B04_9016612, with 7% PVE, was a genic SNPwithin BjuB028146, a homologue of FMOGS-OX5 encoding a flavin-containing monooxyge-nase. FMOGS-OX5 functions in aliphatic GSL side-chain modification by S-oxygenation ofthe basic aliphatic GSL derivatives [44,45], making BjuB028146 a high-priority candidategene. BjuB028703, homologous to the potential GSL gene PSAT1, was located near SNPB04_17138489, with 12% PVE. PSAT encodes a putative phosphoserine aminotransferasein the serine biosynthetic pathway [63]. Although this locus had a high PVE, PSAT1 hasnot been directly associated with aliphatic GSL metabolism. However, serine is a substratefor tryptophan biosynthesis, which in turn is a precursor for the production of indolic

Plants 2022, 11, 364 11 of 18
GSLs [64]. Furthermore, in Arabidopsis, it is regulated by MYB34 and MYB51, two activatorsof indolic GSL biosynthesis [63].
Ten candidate genes, three known and seven potential GSL genes, can be speculatedto contribute to gluconapin variation. Among these, BjuA033112 a homologue of LSU2(RESPONSE TO LOW SULPHUR 2), was found less than 6 kb from SNP A02_34185026.While LSU proteins are of unknown function, they were demonstrated to be importantstress-related hubs [65] and considered marker genes of sulphur metabolism [66], makingBjuA033112 a good candidate to account for the considerable 11% PVE of this locus. Interest-ingly, MYB28 and MYB34 homologues, additional copies of which were already implicatedin the variation in sinigrin concentration on chromosome A03, were found in the vicinityof SNP A02_34995417, although this SNP contributed little to the observed gluconapinvariation. BjuA002140 was a homologue of MYB28, while BjuA001524 was a homologue ofMYB34. Copy number variation (CNV) of MYB28 homologues on different chromosomesmight have led to the divergence that specifically accounts for sinigrin and gluconapinaccumulation in different genetic backgrounds. Recently, CNV was uncovered on MYB28loci through pairwise sequencing of a vegetable variety, T84-66, and an Australian oilseedvariety, AU213 [17]. Among the associations with high PVE (11%) was SNP A10_999168,located near homologues of two potential GSL genes. BjuA037341 was a homologue ofUGT71C3 encoding an UDP-glycosyltransferase, and BjuA037371 a homologue of GRXS11encoding monothiol glutaredoxin, implicated in nitrogen signalling [67]. The direct in-volvement of UDP-glycosyltransferase UGT74B1 [68] and of UGT74C1 in aliphatic GSLcore synthesis [69] suggests that BjuA037341 is the higher-confidence candidate for thisassociation. Having been detected in BLINK and SUPER, SNP B01_44925254 was a reliableand strong association (−log10 (p) = 16.86) for gluconapin. However, homologues of onlytwo potential GSL genes were found in proximity. These were BjuB006588, homologousto RER3 encoding RETICULATA-RELATED 3, and BjuB006607, homologous to CYSD1, acysteine synthase and a member of the O-acetylserine(thiol)lyase (OASTL) gene family.OASTLs include OASA1, an S assimilation pathway gene that catalyses the biosynthesis ofcysteine and a precursor for GSL formation [70].
A LONG HYPOCOTYL 5 (HY5) homologue, BjuB009816, was located near the high-confidence gluconapin associations SNP B02_48309748-53 at a PVE of 3%. HY5, a tran-scription regulator, was shown to partly control the light regulation of GSL biosyntheticgenes, as well as many genes in the sulphate assimilation pathway [46]. Additionally, hy5Arabidopsis mutants showed altered expression of GSL biosynthetic genes and MYB TFs as-sociated with aliphatic GSL regulation [46]. BjuB005751, a homologue of another potentialGSL gene, SDI2 encoding SULPHUR DEFICIENCY-INDUCED 2, was located near SNPB03_474869. Under sulphur-limiting conditions in Arabidopsis, SDI2 acts as a repressor ofaliphatic GSL biosynthesis at transcript and metabolite levels [71]. Despite being detectedunder non-limiting sulphur conditions, this B. juncea SDI2 homologue could affect GSLcomposition. Lastly, BjuB003011 a homologue of a potential GSL gene ALDH2B7 encodingan aldehyde dehydrogenase family 2 protein, was located near SNP B03_7408562. Whiletwo models detected this association for gluconapin, no literature support was found forthe involvement of ALDH2B7 in GSL biosynthesis, aside from it being listed as a potentialGSL gene in SuCCombase [4,59].
We found no overlap in proposed candidate genes with the GWAS study by Akhataret al., 2020, probably owing to different aims, translating to differences in panel composition,different methods of GSL quantification and differences in cultivation. Furthermore, theylimited the candidate gene search to a narrow window of 25 kb upstream and downstreamof peak SNPs. The Akhatar et al., 2020, study was conducted under field conditions, withthe aim to study the effects of various nitrogen levels. They used only 92 accessions, whichwere phenotyped for GSL content using Near-Infrared Reflectance Spectroscopy (NIRS) onintact seeds to predict total GSLs. In contrast, we phenotyped a larger, more diverse panelgrown under controlled conditions, using quantitative approaches for several specific GSLs.Their study detected associations using a relaxed −log10 (p) ≥ 3 threshold and proposed

Plants 2022, 11, 364 12 of 18
proximate candidate genes encoding for shikimate kinases (chromosome A04), chorismatemutase (chromosomes A06 and B04), jasmonate O-methyltransferase (chromosome B03),branched-chain-amino-acid transaminase (chromosome B06), cytochrome P450 enzymeCYP81G1 (chromosome B06) and MYB44 transcription factor (chromosome B06). Of thesecandidates, only the CYP81G1 was listed as a potential GSL potential gene in SuCCombaseand no genes had homologues of known and validated function in GSL biosynthesis orregulation. In contrast, our GWAS study used a controlled-environment growing condition,coupled with HPLC-MS-based analysis for the accurate quantification of individual GSLs,and applied a stringent Bonferroni threshold for the detection of associations. Yang et al.,2021, identified only two major control loci in a panel of 183 mixed vegetable and oilseedaccessions phenotyped for individual GSLs using HPLC and genotyped at a density of689,411 SNPs. MYB28 (chromosome A02 and A09) was highlighted as a priority candidategene, supporting the role of MYB28 as a key regulator of GSL accumulation in B. juncea.Thus, our findings add value to previous studies and provide an exceptional resourceof novel candidate gene homologues to known structural and regulatory genes of GSLmetabolism. Further validation through allele mining and gene expression profiling iswarranted, especially for associations explaining high levels of phenotypic variation anddetected in multiple models.
4. Materials and Methods4.1. Plant Materials and Growing Conditions
A diversity panel of 158 Indian mustard accessions from 28 countries, which had under-gone two rounds of single seed descent (SSD) (Table S1), were grown in a CONVIRON® plantgrowth chamber (model: PGCFLEX, Winnipeg, MB, Canada) at Southern Cross UniversityLismore, New South Wales (28.8◦ S, 153.3◦ E), from March to mid-May 2020. Several seeds peraccession were sown at 5 mm depth in a 10-cm-diameter free-draining plastic pot filled withcommercial potting soil and thinned to one plant per pot two weeks after emergence. Eachaccession was grown in triplicate in a complete randomised block design. Three-week-oldseedlings were supplied with 25 mL of diluted to half strength liquid fertiliser Canna A + B(CANNA Australasia, Subiaco Western Australia, delivered through syringe plunger, perpot. The growing conditions were set at 16 h of artificial lighting at 22 ◦C and eight hours ofdark at 16 ◦C. Harvesting was done when all siliques were dried, and harvested siliques werefurther air-dried at 40 ◦C for 72 h before threshing.
4.2. Glucosinolate Analysis
In total, three biological replicates per accession (consisting of two individual seedseach) were used for quantifying GSL concentrations, following the method by Borpa-tragohain et al., 2019 [72]. In brief, two seeds per sample were placed in an Eppendorfsafe-lock tube, to which 1.5 mL of 70% methanol and a 5 mm stainless-steel bead wasadded. The samples were then homogenised using a Qiagen Retsch MM 301 TissueLyser II(Qiagen Retsch, Hilden, Germany)) at 30 Hz for 45 s. Next, the samples were centrifugedfor 15 min at 15,000 rpm at 7 ◦C using a Sigma laboratory tabletop centrifuge (Osterodeam Harz Germany). An aliquot of 200 µL was transferred from the supernatant solutionafter centrifugation to a 2 mL Agilent HPLC screw-cap vial. The samples were then drieddown using Martin Christ Alpha RVC (Osterode am Harz Germany) at successively re-duced pressure of 180, 120, 80, 50, 20 and 5 mbar each at one-hour intervals, while 5 mbarwas kept overnight. The dried samples were resuspended in 1.5 mL water containing1.17 µmol mL−1 glucotropaeolin (a GSL not found in Brassicas) as internal standard. Thetubes were mixed by inverting several times. Eight individual GSLs were quantified, includ-ing sinigrin (SIN), gluconapin (GNP), progroitrin (PGT), epi-pogroitrin (EPI), glucoiberin(GIB), glucoraphanin (GRF), glucobrassicin (GBS) and gluconarturtiin (GNT), using anAgilent 1260 Infinity II High Performance LC-MS instrument (Agilent Technologies, PaloAlto, CA, USA). HPLC-MS parameters used are detailed in Supplemental File S3. TotalGSLs is the sum of the eight GSLs measured.

Plants 2022, 11, 364 13 of 18
4.3. Bioinformatic Analyses and Data Processing
Illumina’s FastQ sequence outputs were demultiplexed using Axe [73]. Both readsfrom the paired-end data were aligned against the B. juncea var. tumida T84-66 V1.5 genomereference (http://39.100.233.196:82/download_genome/Brassica_Genome_data/Braju_tum_V1.5, accessed on 15 January 2022) [53]. SNP calling was carried out using the Stackspipeline [74], using default parameters and a low-level filter by looking for a minimumallele frequency of 5% for an SNP to be considered. Among the duplicated samples, thesample with the lower call rate was removed. Filtering of the resulting variant table forSNPs with a 60% call rate, non-minor allele frequency filtered and 10% maximum markerheterozygosity was done using TASSEL 5.2.73 [75]. Missing marker states for all remainingunique genotypes were imputed using Beagle 5.2 [76] with default parameters and theeffective population size (Ne) set to 500,000.
4.4. Statistical Analysis
Residual distribution and quantile–quantile plots were visualised using Genstat 64-bitRelease 18.1 (VSN International Ltd., Hemel Hempstead, England UK) to assess the nor-mality and homoscedasticity of the phenotype data. Data were log10 (x + 0.01) transformedfor subsequent estimation of the variance components and heritability values using REMLRestricted Maximum Likelihood (REML) implemented in Genstat 64, as well as input forGWA. Best Linear Unbiased Predictions (BLUPs), calculated using genotype and replicateeffects in REML, were used as phenotype input in GWAS. Correlations among GSL traitsusing raw mean values were computed using the ‘ggpubr’ package [77], implemented inthe R environment.
4.5. Genome-Wide Association Analysis
Marker–trait association was performed using the Genome Association and PredictionIntegrated Tool (GAPIT Version 3) [78,79]. To select the best models, an initial analysis usingthe four most recommended models as discussed in the GAPIT manual based on statisticalpower was conducted [79]. These were multiple locus mixed linear model (MLMM) [80],Settlement of MLM Under Progressively Exclusive Relationship (SUPER) [81], Fixed andrandom model circulating probability unification (FarmCPU) [57], Bayesian-informationand Linkage-disequilibrium Iteratively Nested Keyway (BLINK) [58]. The best models wereselected based on the resulting q-q plots, which reflected how well each model accountedfor population structure and familial relatedness. Manhattan plots were visualised using Rpackage ‘CMplot’ [82].
4.6. Cluster, Population Structure and Principal Components Analysis
A separate set of 1174 higher-confidence SNPs imputed and filtered for >80% call rate,5% minor allele frequency (maf) and 10% maximum heterozygosity, covering pseudochro-mosomes, and linkage-disequilibrium (LD) pruned, was used for cluster, population andprincipal components analyses. LD pruning was done using Plink [83] (version 1.07) withthe following parameters: window of 50 SNPs, step size of five markers and an r2 thresholdof 0.4 [84]. An UPGMA (unweighted pair group method with arithmetic mean) tree wasbuilt for cluster analysis of all 158 lines. The genetic distance input for tree building wassimple matching coefficients calculated in TASSEL (version 5.2.72) [75] and UPGMA wasvisualised using ITOLv6 (https://itol.embl.de/, accessed on 3 September 2021). A maxi-mum likelihood estimate for population structure was carried out in ADMIXTURE [85] andbarplots for Q matrix (probability of group membership) were visualised using package‘pophelper’ [86] implemented in the R environment. The analysis was done for K = 1 toK = 10, and a ten-fold cross-validation procedure was used to determine the “best” K. PCAwas conducted in TASSEL (version 5.2.72) and plotted using the ‘ggplot2′ [87] R package.

Plants 2022, 11, 364 14 of 18
4.7. Candidate Genes within Significant SNPs
Predicted candidate genes within 250 kb upstream and downstream of each signif-icantly associated SNP were identified using the B. juncea BRAD v.1.5 annotation. TheBRAD V1.5 genes were annotated for putative function by alignment to the ArabidopsisTAIR10 release using NCBI BLASTP [88,89], integrated into the in-house SCPS Galaxy(http://lr-scps5-rh7v.scps.scu.edu.au:8080, accessed on 9 September 2021), and associatingthe annotation of the Arabidopsis genes in the top-scoring hits. All these annotations andgenome information were integrated into the SCPS Galaxy. Next, we matched the Arabidop-sis locus identifiers from our BLAST+ list and that of “known” and “potential GSL genes”curated in SuCCombase (https://plant-scc.org, accessed on 7 September 2021) for listingour candidate genes. Top hits identified as either “known” or “potential GSL genes” basedon SuCCombase were prioritised as candidate genes. In a few cases, we chose the “known”or “potential GSL gene” even if they ranked second to third in BLASTP, provided that thepercent identity was more than 60% across more than 50% of the total length alignment.
Supplementary Materials: The following supporting information can be downloaded at: https://www.mdpi.com/article/10.3390/plants11030364/s1, Supplemental File S1. Glucosinolate mea-surements of the accessions in the diversity panel; Table S1. List of accessions and country of originin the diversity panel; Figure S1. Residual distribution and normal plots for total GSLs, sinigrin andgluconapin; Table S2. Variance components analysis and descriptive statistics for total GSLs, sinigrinand gluconapin evaluated in 158 diverse B. juncea L. accessions; Figure S2. Correlations of majorGSLs, sinigrin and gluconapin, and total GSLs in ADMIXTURE clusters; Figure S3. Quantile–quantileplots reflecting correspondence between observed and expected −log10 (p) values from associationanalyses using four models (SUPER, MLMM, FarmCPU, BLINK) for total GSLs, sinigrin and glu-conapin; Supplemental File S2. List of SNPs passing the Bonferroni threshold from four models;Figure S4. Linkage disequilibrium (LD) depicted based on squared correlation coefficient of pairwisemarkers in a sliding window of 100 SNP markers; Supplemental File S3. HPLC-MS parameters usedfor glucosinolate analysis.
Author Contributions: E.T. and T.K. conceptualised and designed the experiment. E.T. performedthe experiments. P.B. advised and helped in glucosinolate quantification. R.M. advised and assistedin bioinformatic analyses and built the Galaxy instance used in candidate gene analysis. E.T. preparedthe manuscript. P.B., R.M. and T.K. edited the manuscript. All authors have read and agreed to thepublished version of the manuscript.
Funding: This study was funded by the Australian Research Council (ARC) linkage grant LP170101062.
Institutional Review Board Statement: Not applicable.
Informed Consent Statement: Not applicable.
Data Availability Statement: All relevant research data is included as supplementary material. Thegenotype data can be accessed through the following DOI: DOI 10.25918/data.186.
Acknowledgments: We acknowledge Carolyn Raymond for performing REML on the phenotypedata. We would like to thank LP170101062 co-chief investigators Graham King, Bronwyn Barkla andTerry Rose for their overall support in this study.
Conflicts of Interest: The authors declare no conflict of interest.
References1. Halkier, B.A.; Gershenzon, J. Biology and biochemistry of glucosinolates. Annu. Rev. Plant Biol. 2006, 57, 303–333. [CrossRef]2. Burow, M.; Halkier, B.A.; Kliebenstein, D.J. Regulatory networks of glucosinolates shape Arabidopsis thaliana fitness. Curr. Opin.
Plant Biol. 2010, 13, 347–352. [CrossRef] [PubMed]3. Bakhtiari, M.; Rasmann, S. Genotypic variation in below-to aboveground systemic induction of glucosinolates mediates plant
fitness consequences under herbivore attack. J. Chem. Ecol. 2019, 317–329. [CrossRef]4. Harun, S.; Abdullah-Zawawi, M.R.; Goh, H.H.; Mohamed-Hussein, Z.A. A comprehensive gene inventory for glucosinolate
biosynthetic pathway in Arabidopsis thaliana. J. Agric. Food Chem. 2020, 68, 7281–7297. [CrossRef] [PubMed]5. Sønderby, I.E.; Geu-Flores, F.; Halkier, B.A. Biosynthesis of glucosinolates—Gene discovery and beyond. Trends Plant Sci. 2010, 15,
283–290. [CrossRef] [PubMed]

Plants 2022, 11, 364 15 of 18
6. Augustine, R.; Mukhopadhyay, A.; Bisht, N.C. Targeted silencing of BjMYB28 transcription factor gene directs development oflow glucosinolate lines in oilseed Brassica juncea. Plant Biotechnol. J. 2013, 11, 855–866. [CrossRef]
7. Dixon, G.R. Vegetable brassicas and related crucifers: Origins and diversity of brassica and its relatives. Veg. Brassicas Relat.Crucif. 2006, 1–33. [CrossRef]
8. Raymer, P.L. Canola: An emerging oilseed crop. Trends New Crop. New Uses 2002, 1, 122–126.9. Love, H.K.; Rakow, G.; Raney, J.P.; Downey, R.K. Development of low glucosinolate mustard. Can. J. Plant Sci. 1990, 70, 419–424.
[CrossRef]10. Potts, D.A.; Rakow, G.W.; Males, D.R. Canola quality Brassica juncea, a new oilseed crop for the canadian prairies. In Proceedings
of the 10th International Rapeseed Congress, Canberra, Australia, 26–29 September 1999.11. Norton, R.; Potter, T.; Haskins, B.; Mccaffery, D.; Bambach, R. Juncea Canola in the Low Rainfall Zones of Victoria and South
Australia. Juncea Canola Growers Guide–Victoria and South Australia. Available online: http://anz.ipni.net/ipniweb/region/anz.nsf/0/CE50267DC5CD6D5385257AA10052C4E0/$FILE/ViCSAGrowersGuide.pdf (accessed on 26 September 2021).
12. Woods, D.L.; Capcara, J.J.; Downey, R.K. The potential of mustard (Brassica juncea (L.) Coss) as an edible oil crop on the Canadianprairies. Can. J. Plant Sci. 1991, 71, 195–198. [CrossRef]
13. Burton, W.; Pymer, S.; Salisbury, P.; Kirk, J.; Oram, R. Performance of Australian canola quality Brassica juncea breeding lines. InProceedings of the 10th International Rapeseed Congress, Canberra, Australia, 26–29 September 1999; pp. 2–7.
14. Merah, O. Genetic Variability in glucosinolates in seed of Brassica juncea: Interest in mustard condiment. J. Chem. 2015,2015, 606142. [CrossRef]
15. Misiewicz, I.; Skupinska, K.; Kowalska, E.; Lubinski, J.; Kasprzycka-Guttman, T. Sulforaphane-mediated induction of a phase 2detoxifying enzyme NAD(P)H:Quinone reductase and apoptosis in human lymphoblastoid cells. Acta Biochim. Pol. 2004, 51,711–721. [CrossRef] [PubMed]
16. Ullah, M. Sulforaphane (SFN): An isothiocyanate in a cancer chemoprevention paradigm. Medicines 2015, 2, 141–156. [CrossRef][PubMed]
17. Yang, J.; Wang, J.; Li, Z.; Li, X.; He, Z.; Zhang, L.; Sha, T.; Lyu, X.; Chen, S.; Gu, Y.; et al. Genomic signatures of vegetable andoilseed allopolyploid Brassica juncea and genetic loci controlling the accumulation of glucosinolates. Plant Biotechnol. J. 2021, 19,2619–2628. [CrossRef]
18. Sharma, M.; Mukhopadhyay, A.; Gupta, V.; Pental, D.; Pradhan, A.K. BjuB.CYP79F1 regulates synthesis of propyl fraction ofaliphatic glucosinolates in oilseed mustard Brassica juncea: Functional validation through genetic and transgenic approaches.PLoS ONE 2016, 11, e0150060. [CrossRef]
19. Moose, S.P.; Mumm, R.H. Molecular plant breeding as the foundation for 21st century crop improvement. Plant Physiol. 2008, 147,969–977. [CrossRef]
20. Harper, A.L.; He, Z.; Langer, S.; Havlickova, L.; Wang, L.; Fellgett, A.; Gupta, V.; Kumar Pradhan, A.; Bancroft, I. Validation of anassociative transcriptomics platform in the polyploid crop species Brassica juncea by dissection of the genetic architecture ofagronomic and quality traits. Plant J. 2020, 103, 1885–1893. [CrossRef]
21. Rout, K.; Sharma, M.; Gupta, V.; Mukhopadhyay, A.; Sodhi, Y.S.; Pental, D.; Pradhan, A.K. Deciphering allelic variations for seedglucosinolate traits in oilseed mustard (Brassica juncea) using two bi-parental mapping populations. Theor. Appl. Genet. 2015, 128,657–666. [CrossRef]
22. Rout, K.; Yadav, B.G.; Yadava, S.K.; Mukhopadhyay, A.; Gupta, V.; Pental, D.; Pradhan, A.K. QTL landscape for oil content inBrassica juncea: Analysis in multiple bi-parental populations in high and “0” erucic background. Front. Plant Sci. 2018, 9, 871.[CrossRef]
23. Ramchiary, N.; Bisht, N.C.; Gupta, V.; Mukhopadhyay, A.; Arumugam, N.; Sodhi, Y.S.; Pental, D.; Pradhan, A.K. qtl analysisreveals context-dependent loci for seed glucosinolate trait in the oilseed Brassica juncea: Importance of recurrent selectionbackcross scheme for the identification of “true” QTL. Theor. Appl. Genet. 2007, 116, 77–85. [CrossRef]
24. Raman, H.; Raman, R.; Kilian, A.; Detering, F.; Carling, J.; Coombes, N.; Diffey, S.; Kadkol, G.; Edwards, D.; McCully, M.; et al.Genome-wide delineation of natural variation for pod shatter resistance in Brassica napus. PLoS ONE 2014, 9, e101673. [CrossRef][PubMed]
25. Liu, S.; Huang, H.; Yi, X.; Zhang, Y.; Yang, Q.; Zhang, C.; Fan, C.; Zhou, Y. Dissection of genetic architecture for glucosinolateaccumulations in leaves and seeds of Brassica napus by genome-wide association study. Plant Biotechnol. J. 2020, 18, 1472–1484.[CrossRef] [PubMed]
26. Qu, C.; Jia, L.; Fu, F.; Zhao, H.; Lu, K.; Wei, L.; Xu, X.; Liang, Y.; Li, S.; Wang, R.; et al. Genome-wide association mapping andidentification of candidate genes for fatty acid composition in Brassica napus L. using SNP Markers. BMC Genom. 2017, 18, 232.[CrossRef]
27. Wang, B.; Wu, Z.; Li, Z.; Zhang, Q.; Hu, J.; Xiao, Y.; Cai, D.; Wu, J.; King, G.J.; Li, H.; et al. Dissection of the genetic architectureof three seed-quality traits and consequences for breeding in Brassica napus. Plant Biotechnol. J. 2018, 16, 1336–1348. [CrossRef][PubMed]
28. Kaur, S.; Akhatar, J.; Kaur, H.; Atri, C.; Mittal, M.; Goyal, A.; Pant, U.; Kaur, G.; Banga, S.S. Genome-wide association mappingfor key seed metabolites using a large panel of natural and derived forms of Brassica rapa L. Ind. Crops Prod. 2021, 159, 113073.[CrossRef]

Plants 2022, 11, 364 16 of 18
29. Sudan, J.; Singh, R.; Sharma, S.; Salgotra, R.K.; Sharma, V.; Singh, G.; Sharma, I.; Sharma, S.; Gupta, S.K.; Zargar, S.M. DdRADsequencing-based identification of inter-genepool SNPS and association analysis in Brassica juncea. BMC Plant Biol. 2019, 19, 594.[CrossRef]
30. Paritosh, K.; Gupta, V.; Yadava, S.K.; Singh, P.; Pradhan, A.K.; Pental, D. RNA-Seq based snps for mapping in Brassica juncea(AABB): Synteny analysis between the two constituent genomes A (from B. rapa) and B (from B. nigra) shows highly divergentgene block arrangement and unique block fragmentation patterns. BMC Genom. 2014, 15, 396. [CrossRef]
31. Yang, J.; Zhang, C.; Zhao, N.; Zhang, L.; Hu, Z.; Chen, S.; Zhang, M. Chinese root-type mustard provides phylogenomic insightsinto the evolution of the multi-use diversified allopolyploid Brassica juncea. Mol. Plant 2018, 11, 512–514. [CrossRef]
32. Akhatar, J.; Singh, M.P.; Sharma, A.; Kaur, H.; Kaur, N.; Sharma, S.; Bharti, B.; Sardana, V.K.; Banga, S.S. Association mapping ofseed quality traits under varying conditions of nitrogen application in Brassica juncea L. Czern & Coss. Front. Genet. 2020, 11, 744.[CrossRef]
33. Hirai, M.Y.; Klein, M.; Fujikawa, Y.; Yano, M.; Goodenowe, D.B.; Yamazaki, Y.; Kanaya, S.; Nakamura, Y.; Kitayama, M.; Suzuki,H.; et al. Elucidation of gene-to-gene and metabolite-to-gene networks in Arabidopsis by integration of metabolomics andtranscriptomics. J. Biol. Chem. 2005, 280, 25590–25595. [CrossRef]
34. Hirai, M.Y.; Sugiyama, K.; Sawada, Y.; Tohge, T.; Obayashi, T.; Suzuki, A.; Araki, R.; Sakurai, N.; Suzuki, H.; Aoki, K.; et al.Omics-based identification of Arabidopsis Myb transcription factors regulating aliphatic glucosinolate biosynthesis. Proc. Natl.Acad. Sci. USA 2007, 104, 6478–6483. [CrossRef] [PubMed]
35. Wentzell, A.M.; Rowe, H.C.; Hansen, B.G.; Ticconi, C.; Halkier, B.A.; Kliebenstein, D.J. Linking metabolic QTLs with network andcis-eqtls controlling biosynthetic pathways. PLoS Genet. 2007, 3, 1687–1701. [CrossRef] [PubMed]
36. Lee, S.; Kaminaga, Y.; Cooper, B.; Pichersky, E.; Dudareva, N.; Chapple, C. Benzoylation and sinapoylation of glucosinolateR-groups in Arabidopsis. Plant J. 2012, 72, 411–422. [CrossRef] [PubMed]
37. Skirycz, A.; Reichelt, M.; Burow, M.; Birkemeyer, C.; Rolcik, J.; Kopka, J.; Zanor, M.I.; Gershenzon, J.; Strnad, M.; Szopa, J.; et al.DOF transcription factor AtDof1.1 (OBP2) is part of a regulatory network controlling glucosinolate biosynthesis in Arabidopsis.Plant J. 2006, 47, 10–24. [CrossRef]
38. Gigolashvili, T.; Yatusevich, R.; Berger, B.; Müller, C.; Flügge, U.I. The R2R3-MYB transcription factor HAG1/MYB28 is a regulatorof methionine-derived glucosinolate biosynthesis in Arabidopsis thaliana. Plant J. 2007, 51, 247–261. [CrossRef]
39. Sønderby, I.E.; Hansen, B.G.; Bjarnholt, N.; Ticconi, C.; Halkier, B.A.; Kliebenstein, D.J. A systems biology approach identifies aR2R3 MYB gene subfamily with distinct and overlapping functions in regulation of aliphatic glucosinolates. PLoS ONE 2007,2, e1322. [CrossRef]
40. Celenza, J.L.; Quiel, J.A.; Smolen, G.A.; Merrikh, H.; Silvestro, A.R.; Normanly, J.; Bender, J. The Arabidopsis ATR1 Mybtranscription factor controls indolic glucosinolate homeostasis. Plant Physiol. 2005, 137, 253–262. [CrossRef]
41. Frerigmann, H.; Gigolashvili, T. Update on the role of R2R3-MYBs in the regulation of glucosinolates upon sulfur deficiency.Front. Plant Sci. 2014, 5, 626. [CrossRef]
42. Kroymann, J.; Textor, S.; Tokuhisa, J.G.; Falk, K.L.; Bartram, S.; Gershenzon, J.; Mitchell-Olds, T. A gene controlling variation inArabidopsis glucosinolate composition is part of the methionine chain elongation pathway. Plant Physiol. 2001, 127, 1077–1088.[CrossRef]
43. Benderoth, M.; Pfalz, M.; Kroymann, J. Methylthioalkylmalate synthases: Genetics, ecology and evolution. Phytochem. Rev. 2009,8, 255–268. [CrossRef]
44. Li, J.; Hansen, B.G.; Ober, J.A.; Kliebenstein, D.J.; Halkier, B.A. Subclade of flavin-monooxygenases involved in aliphaticglucosinolate biosynthesis. Plant Physiol. 2008, 148, 1721–1733. [CrossRef] [PubMed]
45. Li, J.; Kristiansen, K.A.; Hansen, B.G.; Halkier, B.A. Cellular and subcellular localization of flavin-monooxygenases involved inglucosinolate biosynthesis. J. Exp. Bot. 2011, 62, 1337–1346. [CrossRef] [PubMed]
46. Huseby, S.; Koprivova, A.; Lee, B.R.; Saha, S.; Mithen, R.; Wold, A.B.; Bengtsson, G.B.; Kopriva, S. Diurnal and light regulation ofsulphur assimilation and glucosinolate biosynthesis in Arabidopsis. J. Exp. Bot. 2013, 64, 1039–1048. [CrossRef] [PubMed]
47. Sul, J.H.; Martin, L.S.; Eskin, E. Population structure in genetic studies: Confounding factors and mixed models. PLoS Genet. 2018,14, e1007309. [CrossRef] [PubMed]
48. Akhatar, J.; Goyal, A.; Kaur, N.; Atri, C.; Mittal, M.; Singh, M.P.; Kaur, R.; Rialch, I.; Banga, S.S. Genome-wide association analysesto understand genetic basis of flowering and plant height under three levels of nitrogen application in Brassica juncea (L.) Czern &Coss. Sci. Rep. 2021, 11, 4278. [CrossRef]
49. Vaughan, J.G.; Gordon, E.I. A taxonomic study of Brassica juncea using the techniques of electrophoresis, gas-liquid chromatogra-phy and serology. Ann. Bot. 1973, 37, 167–184. [CrossRef]
50. Gland, A.; Röbbelen, G.; Thies, W. Variation of alkenyl glucosinolates in seeds of Brassica species. Z. Pflanzenzüchtg 1981, 87,96–110.
51. Sodhi, Y.S.; Mukhopadhyay, A.; Arumugam, N.; Verma, J.K.; Gupta, V.; Pental, D.; Pradhan, A.K. Genetic analysis of totalglucosinolate in crosses involving a high glucosinolate indian variety and a low glucosinolate line of Brassica Juncea. Plant Breed.2002, 121, 508–511. [CrossRef]
52. Velasco, L.; Becker, H.C. Variability for seed glucosinolates in a germplasm collection of the genus brassica. Genet. Resour. CropEvol. 2000, 47, 231–238. [CrossRef]

Plants 2022, 11, 364 17 of 18
53. Yang, J.; Liu, D.; Wang, X.; Ji, C.; Cheng, F.; Liu, B.; Hu, Z.; Chen, S.; Pental, D.; Ju, Y.; et al. The genome sequence of allopolyploidBrassica juncea and analysis of differential homoeolog gene expression influencing selection. Nat. Genet. 2016, 48, 1225–1232.[CrossRef] [PubMed]
54. Kaler, A.S.; Gillman, J.D.; Beissinger, T.; Purcell, L.C. Comparing different statistical models and multiple testing corrections forassociation mapping in soybean and maize. Front. Plant Sci. 2020, 10, 1794. [CrossRef] [PubMed]
55. Muhammad, A.; Li, J.; Hu, W.; Yu, J.; Khan, S.U.; Khan, M.H.U.; Xie, G.; Wang, J.; Wang, L. Uncovering genomic regionscontrolling plant architectural traits in hexaploid wheat using different GWAS models. Sci. Rep. 2021, 11, 6767. [CrossRef][PubMed]
56. Zhong, H.; Liu, S.; Meng, X.; Sun, T.; Deng, Y.; Kong, W.; Peng, Z.; Li, Y. Correction to: Uncovering the genetic mechanismsregulating panicle architecture in rice with GPWAS and GWAS. BMC Genom. 2021, 22, 86. [CrossRef] [PubMed]
57. Liu, X.; Huang, M.; Fan, B.; Buckler, E.S.; Zhang, Z. Iterative usage of fixed and random effect models for powerful and efficientgenome-wide association studies. PLoS Genet. 2016, 12, e1005767. [CrossRef] [PubMed]
58. Huang, M.; Liu, X.; Zhou, Y.; Summers, R.M.; Zhang, Z. BLINK: A package for the next level of genome-wide association studieswith both individuals and markers in the millions. Gigascience 2018, 8, giy154. [CrossRef]
59. Harun, S.; Abdullah-Zawawi, M.R.; A-Rahman, M.R.A.; Muhammad, N.A.N.; Mohamed-Hussein, Z.A. SuCComBase: Amanually curated repository of plant sulfur-containing compounds. Database 2019, 2019, 1–9. [CrossRef] [PubMed]
60. Kang, H.G.; Singh, K.B. Characterization of salicylic acid-responsive, Arabidopsis Dof domain proteins: Overexpression of OBP3leads to growth defects. Plant J. 2000, 21, 329–339. [CrossRef] [PubMed]
61. Kliebenstein, D.J.; Lambrix, V.M.; Reichelt, M.; Gershenzon, J.; Mitchell-Olds, T. Gene duplication in the diversification ofsecondary metabolism: Tandem 2-oxoglutarate-dependent dioxygenases control glucosinolate biosynthesis in Arabidopsis. PlantCell 2001, 13, 681–693. [CrossRef]
62. Burow, M.; Atwell, S.; Francisco, M.; Kerwin, R.E.; Halkier, B.A.; Kliebenstein, D.J. The glucosinolate biosynthetic gene AOP2mediates feed-back regulation of jasmonic acid signaling in Arabidopsis. Mol. Plant 2015, 8, 1201–1212. [CrossRef]
63. Benstein, R.M.; Ludewig, K.; Wulfert, S.; Wittek, S.; Gigolashvili, T.; Frerigmann, H.; Gierth, M.; Flügge, U.I.; Krueger, S.Arabidopsis phosphoglycerate dehydrogenase1 of the phosphoserine pathway is essential for development and required forammonium assimilation and tryptophan biosynthesis. Plant Cell 2013, 25, 5011–5029. [CrossRef]
64. Watanabe, M.; Tohge, T.; Fernie, A.R.; Hoefgen, R. The effect of single and multiple serat mutants on serine and sulfur metabolism.Front. Plant Sci. 2018, 9, 702. [CrossRef] [PubMed]
65. Niemiro, A.; Cysewski, D.; Brzywczy, J.; Wawrzynska, A.; Sienko, M.; Poznanski, J.; Sirko, A. Similar but not identical—Bindingproperties of LSU (Response to Low Sulfur) proteins from Arabidopsis Thaliana. Front. Plant Sci. 2020, 11, 1246. [CrossRef][PubMed]
66. Aarabi, F.; Naake, T.; Fernie, A.R.; Hoefgen, R. Coordinating sulfur pools under sulfate deprivation. Trends Plant Sci. 2020, 25,1227–1239. [CrossRef] [PubMed]
67. Ohkubo, Y.; Tanaka, M.; Tabata, R.; Ogawa-Ohnishi, M.; Matsubayashi, Y. Shoot-to-Root Mobile Polypeptides Involved inSystemic Regulation of Nitrogen Acquisition. Nat. Plants 2017, 3, 17029. [CrossRef]
68. Grubb, C.D.; Zipp, B.J.; Ludwig-Müller, J.; Masuno, M.N.; Molinski, T.F.; Abel, S. Arabidopsis glucosyltransferase UGT74B1functions in glucosinolate biosynthesis and auxin homeostasis. Plant J. 2004, 40, 893–908. [CrossRef]
69. Grubb, C.D.; Zipp, B.J.; Kopycki, J.; Schubert, M.; Quint, M.; Lim, E.K.; Bowles, D.J.; Pedras, M.S.C.; Abel, S. Comparative analysisof Arabidopsis UGT74 glucosyltransferases reveals a special role of UGT74C1 in glucosinolate biosynthesis. Plant J. 2014, 79,92–105. [CrossRef]
70. Romero, L.C.; Aroca, M.Á.; Laureano-Marín, A.M.; Moreno, I.; García, I.; Gotor, C. Cysteine and cysteine-related signalingpathways in Arabidopsis thaliana. Mol. Plant 2014, 7, 264–276. [CrossRef]
71. Aarabi, F.; Kusajima, M.; Tohge, T.; Konishi, T.; Gigolashvili, T.; Takamune, M.; Sasazaki, Y.; Watanabe, M.; Nakashita, H.; Fernie,A.R.; et al. Sulfur deficiency-induced repressor proteins optimize glucosinolate biosynthesis in plants. Sci. Adv. 2016, 2, e1601087.[CrossRef]
72. Borpatragohain, P.; Rose, T.J.; Liu, L.; Barkla, B.J.; Raymond, C.A.; King, G.J. Remobilization and fate of sulphur in mustard. Ann.Bot. 2019, 124, 471–480. [CrossRef]
73. Murray, K.D.; Borevitz, J.O. Axe: Rapid, Competitive sequence read demultiplexing using a trie. Bioinformatics 2018, 34, 3924–3925.[CrossRef]
74. Catchen, J.; Hohenlohe, P.A.; Bassham, S.; Amores, A.; Cresko, W.A. Stacks: An analysis tool set for population genomics. Mol.Ecol. 2013, 22, 3124–3140. [CrossRef]
75. Bradbury, P.J.; Zhang, Z.; Kroon, D.E.; Casstevens, T.M.; Ramdoss, Y.; Buckler, E.S. TASSEL: Software for association mapping ofcomplex traits in diverse samples. Bioinformatics 2007, 23, 2633–2635. [CrossRef] [PubMed]
76. Browning, B.L.; Zhou, Y.; Browning, S.R. A one-penny imputed genome from next-generation reference panels. Am. J. Hum.Genet. 2018, 103, 338–348. [CrossRef] [PubMed]
77. Kassambara, A. Ggpubr: ‘Ggplot2′ Based Publication Ready Plots 2020. 2021. Available online: https://github.com/kassambara/ggpubr (accessed on 1 September 2021).
78. Lipka, A.E.; Tian, F.; Wang, Q.; Peiffer, J.; Li, M.; Bradbury, P.J.; Gore, M.A.; Buckler, E.S.; Zhang, Z. GAPIT: Genome associationand prediction integrated tool. Bioinformatics 2012, 28, 2397–2399. [CrossRef] [PubMed]

Plants 2022, 11, 364 18 of 18
79. Buckler, E.; Zhang, Z. User Manual for Genomic Association and Prediction Integrated Tool (GAPIT). 2018. Version 3. Availableonline: https://zzlab.net/GAPIT/gapit_help_document.pdf (accessed on 27 August 2021).
80. Segura, V.; Vilhjálmsson, B.J.; Platt, A.; Korte, A.; Seren, Ü.; Long, Q.; Nordborg, M. An efficient multi-locus mixed-modelapproach for genome-wide association studies in structured populations. Nat. Genet. 2012, 44, 825–830. [CrossRef] [PubMed]
81. Wang, Q.; Tian, F.; Pan, Y.; Buckler, E.S.; Zhang, Z. A SUPER powerful method for genome wide association study. PLoS ONE2014, 9, e0107684. [CrossRef]
82. Yin, L.; Zhang, H.; Tang, Z.; Xu, J.; Yin, D.; Zhang, Z.; Yuan, X.; Zhu, M.; Zhao, S.; Li, X.; et al. RMVP: A memory-efficient,visualization-enhanced, and parallel-accelerated tool for genome-wide association study. Genom. Proteom. Bioinform. 2021.[CrossRef]
83. Purcell, S.; Neale, B.; Todd-Brown, K.; Thomas, L.; Ferreira, M.A.R.; Bender, D.; Maller, J.; Sklar, P.; De Bakker, P.I.W.; Daly, M.J.;et al. PLINK: A tool set for whole-genome association and population-based linkage analyses. Am. J. Hum. Genet. 2007, 81,559–575. [CrossRef]
84. Niu, S.; Song, Q.; Koiwa, H.; Qiao, D.; Zhao, D.; Chen, Z.; Liu, X.; Wen, X. Genetic diversity, linkage disequilibrium, andpopulation structure analysis of the tea plant (Camellia sinensis) from an origin center, guizhou plateau, using genome-wide SNPsdeveloped by genotyping-by-sequencing. BMC Plant Biol. 2019, 19, 328. [CrossRef]
85. Alexander, D.H.; Novembre, J.; Lange, K. Fast model-based estimation of ancestry in unrelated individuals. Genome Res. 2009, 19,1655–1664. [CrossRef]
86. Francis, R.M. Pophelper: An R package and web app to analyse and visualize population structure. Mol. Ecol. Resour. 2017, 17,27–32. [CrossRef] [PubMed]
87. Wickham, H. Ggplot2: Elegant Graphics for Data Analysis; Springer: New York, NY, USA, 2016; pp. 1–69. ISBN 978-0-387-98141-3.88. Camacho, C.; Coulouris, G.; Avagyan, V.; Ma, N.; Papadopoulos, J.; Bealer, K.; Madden, T.L. BLAST+: Architecture and
Applications. BMC Bioinform. 2009, 10, 1–9. [CrossRef] [PubMed]89. Cock, P.J.A.; Chilton, J.M.; Grüning, B.; Johnson, J.E.; Soranzo, N. NCBI BLAST+ Integrated into Galaxy. Gigascience 2015, 4,
s13742-015-0080-7. [CrossRef] [PubMed]