A Physiologically-based Model for Simulation of Color Vision Deficiency
Upload
independentCategory
view
4download
0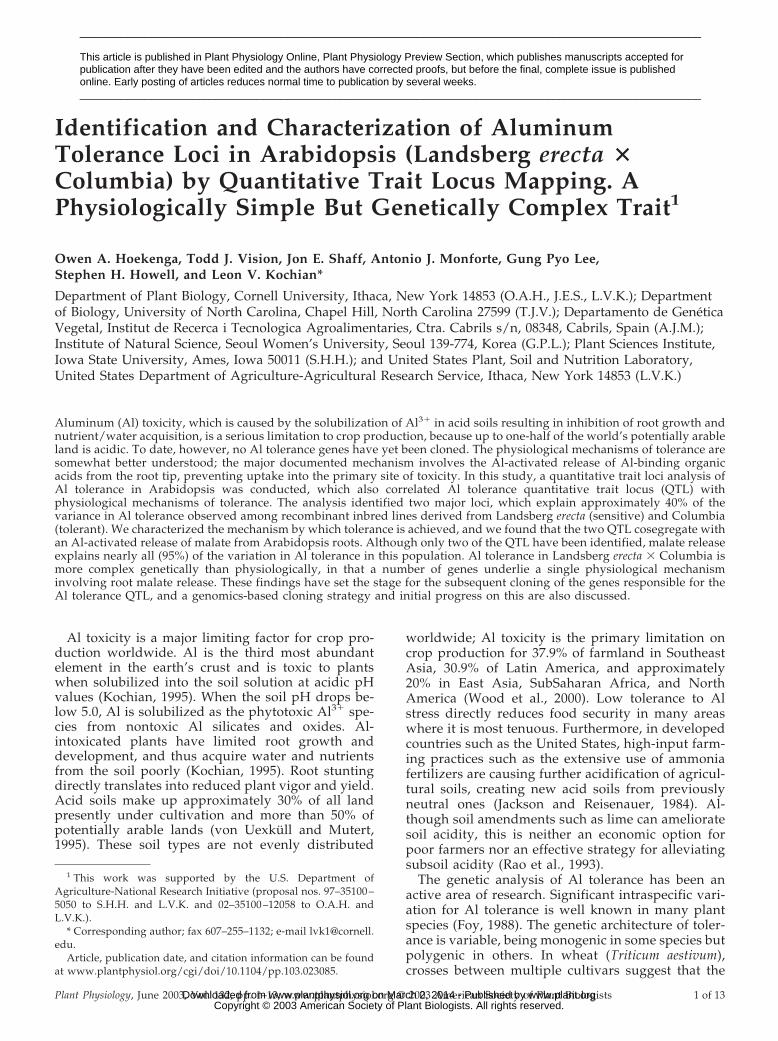
Identification and Characterization of AluminumTolerance Loci in Arabidopsis (Landsberg erecta 3Columbia) by Quantitative Trait Locus Mapping. APhysiologically Simple But Genetically Complex Trait1
Owen A. Hoekenga, Todd J. Vision, Jon E. Shaff, Antonio J. Monforte, Gung Pyo Lee,Stephen H. Howell, and Leon V. Kochian*
Department of Plant Biology, Cornell University, Ithaca, New York 14853 (O.A.H., J.E.S., L.V.K.); Departmentof Biology, University of North Carolina, Chapel Hill, North Carolina 27599 (T.J.V.); Departamento de GeneticaVegetal, Institut de Recerca i Tecnologica Agroalimentaries, Ctra. Cabrils s/n, 08348, Cabrils, Spain (A.J.M.);Institute of Natural Science, Seoul Women’s University, Seoul 139-774, Korea (G.P.L.); Plant Sciences Institute,Iowa State University, Ames, Iowa 50011 (S.H.H.); and United States Plant, Soil and Nutrition Laboratory,United States Department of Agriculture-Agricultural Research Service, Ithaca, New York 14853 (L.V.K.)
Aluminum (Al) toxicity, which is caused by the solubilization of Al31 in acid soils resulting in inhibition of root growth andnutrient/water acquisition, is a serious limitation to crop production, because up to one-half of the world’s potentially arableland is acidic. To date, however, no Al tolerance genes have yet been cloned. The physiological mechanisms of tolerance aresomewhat better understood; the major documented mechanism involves the Al-activated release of Al-binding organicacids from the root tip, preventing uptake into the primary site of toxicity. In this study, a quantitative trait loci analysis ofAl tolerance in Arabidopsis was conducted, which also correlated Al tolerance quantitative trait locus (QTL) withphysiological mechanisms of tolerance. The analysis identified two major loci, which explain approximately 40% of thevariance in Al tolerance observed among recombinant inbred lines derived from Landsberg erecta (sensitive) and Columbia(tolerant). We characterized the mechanism by which tolerance is achieved, and we found that the two QTL cosegregate withan Al-activated release of malate from Arabidopsis roots. Although only two of the QTL have been identified, malate releaseexplains nearly all (95%) of the variation in Al tolerance in this population. Al tolerance in Landsberg erecta 3 Columbia ismore complex genetically than physiologically, in that a number of genes underlie a single physiological mechanisminvolving root malate release. These findings have set the stage for the subsequent cloning of the genes responsible for theAl tolerance QTL, and a genomics-based cloning strategy and initial progress on this are also discussed.
Al toxicity is a major limiting factor for crop pro-duction worldwide. Al is the third most abundantelement in the earth’s crust and is toxic to plantswhen solubilized into the soil solution at acidic pHvalues (Kochian, 1995). When the soil pH drops be-low 5.0, Al is solubilized as the phytotoxic Al31 spe-cies from nontoxic Al silicates and oxides. Al-intoxicated plants have limited root growth anddevelopment, and thus acquire water and nutrientsfrom the soil poorly (Kochian, 1995). Root stuntingdirectly translates into reduced plant vigor and yield.Acid soils make up approximately 30% of all landpresently under cultivation and more than 50% ofpotentially arable lands (von Uexkull and Mutert,1995). These soil types are not evenly distributed
worldwide; Al toxicity is the primary limitation oncrop production for 37.9% of farmland in SoutheastAsia, 30.9% of Latin America, and approximately20% in East Asia, SubSaharan Africa, and NorthAmerica (Wood et al., 2000). Low tolerance to Alstress directly reduces food security in many areaswhere it is most tenuous. Furthermore, in developedcountries such as the United States, high-input farm-ing practices such as the extensive use of ammoniafertilizers are causing further acidification of agricul-tural soils, creating new acid soils from previouslyneutral ones (Jackson and Reisenauer, 1984). Al-though soil amendments such as lime can amelioratesoil acidity, this is neither an economic option forpoor farmers nor an effective strategy for alleviatingsubsoil acidity (Rao et al., 1993).
The genetic analysis of Al tolerance has been anactive area of research. Significant intraspecific vari-ation for Al tolerance is well known in many plantspecies (Foy, 1988). The genetic architecture of toler-ance is variable, being monogenic in some species butpolygenic in others. In wheat (Triticum aestivum),crosses between multiple cultivars suggest that the
1 This work was supported by the U.S. Department ofAgriculture-National Research Initiative (proposal nos. 97–35100 –5050 to S.H.H. and L.V.K. and 02–35100 –12058 to O.A.H. andL.V.K.).
* Corresponding author; fax 607–255–1132; e-mail [email protected].
Article, publication date, and citation information can be foundat www.plantphysiol.org/cgi/doi/10.1104/pp.103.023085.
Plant Physiology, June 2003, Vol. 132, pp. 1–13, www.plantphysiol.org © 2003 American Society of Plant Biologists 1 of 13
_________________________________________________________________________________________________________
This article is published in Plant Physiology Online, Plant Physiology Preview Section, which publishes manuscripts accepted forpublication after they have been edited and the authors have corrected proofs, but before the final, complete issue is publishedonline. Early posting of articles reduces normal time to publication by several weeks._________________________________________________________________________________________________________
www.plant.org on March 2, 2014 - Published by www.plantphysiol.orgDownloaded from Copyright © 2003 American Society of Plant Biologists. All rights reserved.

majority of variability for Al tolerance apparentlyoccurs at a single locus on chromosome 4DL (Ker-ridge and Kronstad, 1968; Camargo, 1984; Delhaize etal., 1993b). Other loci may contribute to Al tolerancein certain wheat cultivars, but variability in Al toler-ance in wheat and other members of the Triticeae(e.g. rye [Secale cereale] and barley [Hordeum vulgare])appears to be genetically very simple and centeredon the long arm of chromosome 4 (Camargo, 1981;Berzonsky, 1992; Tang et al., 2000; Miftahudin et al.,2002). In other species, such as maize (Zea mays) andrice (Oryza sativa), Al tolerance appears to be quan-titative and involves four to 10 QTL (Sawazaki andFurlani, 1986; Magnavaca et al., 1987; Prioli, 1987; Wuet al., 2000; Nguyen et al., 2001; Nguyen et al., 2002).Al tolerance has also recently been shown to be aquantitative trait in Arabidopsis (Kobayashi andKoyama, 2002). Despite the progress to date, no Altolerance genes have yet been cloned from any plantspecies.
More progress has been made in recent years inunderstanding the physiological basis of Al toler-ance. Exclusion of Al from the root tip is the mostcommon tolerance mechanism. An exclusion mecha-nism based on root exudation of Al-chelating organicacids such as malate, citrate, or oxalate has beendescribed in both monocots (for example, see Del-haize et al., 1993b; Pellet et al., 1995) and dicots (forexample, see Miyasaka et al., 1991; Silva et al., 2001).The organic acid is released into the rhizosphere,where it acts as a ligand for Al31 (the primary toxicAl species), forming a nontoxic complex that does notreadily enter the root. It has been shown that Al-activated root malate release cosegregates with theAl tolerance locus in wheat, directly linking the ge-netic and physiological studies (Delhaize et al.,1993a, 1993b).
Quantitative trait locus (QTL) mapping allows oneto statistically identify individual chromosomal re-gions containing genetic factors that contribute tovariation in a complex trait (Alonso-Blanco andKoornneef, 2000). QTL mapping has been usedwidely in the dissection of complex traits, Al toler-ance included, in crop plants and in model plantssuch as Arabidopsis (Burr and Burr, 1991; Doerge,2002). QTL mapping is the first step in the positionalcloning of genes underlying complex phenotypes. Inrecent years, positional cloning has become increas-ingly routine and is a particularly fruitful approachin a sequenced model organism such as Arabidopsis(Lukowitz et al., 2000).
Recombinant inbred lines (RIL) from a cross be-tween two ecotypes or inbreds provide a convenientpopulation type for QTL mapping. In the case of aselfing organism, each RIL is derived from an inde-pendent segregating individual (such as an F2) and isfixed by repeated generations of single-seed descent.As a result, each RIL is homozygous at (very nearly)every locus, and each line can be thought of as a
unique mosaic of the paternal and maternal chromo-some complements (Burr and Burr, 1991). An impor-tant property of an RIL population is that one canreplicate the same genotype within and across con-ditions and experiments.
We used an RIL population derived from an F2cross between the Arabidopsis ecotypes Landsbergerecta (Ler) and Columbia (Col) to identify factorscontributing to Al tolerance (Lister and Dean, 1993).This population has been intensively characterized,both genotypically (http://nasc.nott.ac.uk/new_ri-_map.html) and phenotypically (Yanovsky et al.,1997; Juenger et al., 2000; Lambrix et al., 2001;Kliebenstein et al., 2002; Perez-Perez et al., 2002; Que-sada et al., 2002). Col is considerably more Al tolerantthan Ler, requiring twice the level of Al to inhibit rootgrowth to the same degree as seen in Ler (Larsen etal., 1996). Col, Ler, and 99 RIL were grown on anacidic medium 6Al to estimate Al tolerance by mea-suring root growth in both environments. Two sig-nificant QTL were detected for Al tolerance. In hy-droponic culture, we then tested both parents andselected RIL to identify how Al tolerance was con-ferred by the two QTL. Both QTL correlated with arelease of malate from Arabidopsis roots, suggestingthat differences in malate release explain the differ-ences in Al tolerance observed between Col, Ler, andtheir derivative RIL.
RESULTS
QTL Mapping and Analysis
Al tolerance was estimated by measuring the im-pact of Al stress on root growth compared withplants grown under identical conditions lacking Al.Plants were grown in solid, gellan gum media wherethe soluble, toxic Al was introduced by soaking theplates in a full-strength nutrient solution containing 1mm AlCl3 (adapted from Larsen et al., 1996). TheLer 3 Col RIL set was chosen for our experimentsbecause we already had established a difference in Altolerance between these ecotypes and because of theavailability of the densely genotyped mapping pop-ulation (Lister and Dean, 1993; Larsen et al., 1996).
Ler and Col grew at approximately equal rates inthe absence of Al but differed substantially in thepresence of Al (Fig. 1). The distributions for rootlength in the RIL, under both control and Al stressconditions, were not obviously multimodal, whichmight have indicated a major gene. There was onlyminor transgressive segregation (no line was morethan two sds more extreme than either parent),which indicates that Col contains most of the allelesthat contribute to increased Al tolerance. Broad senseheritability was calculated for root growth underboth control (h2
b 5 0.98) and Al-treated (h2b 5 0.99)
conditions, indicating that root growth is a highlyheritable trait.
Hoekenga et al.
2 of 13 Plant Physiol. Vol. 132, 2003 www.plant.org on March 2, 2014 - Published by www.plantphysiol.orgDownloaded from Copyright © 2003 American Society of Plant Biologists. All rights reserved.

We investigated 10 variables related to root lengthto identify Al tolerance loci segregating in the RILpopulation. Four direct variables were used in theanalysis, the mean root length at each time point(after d 6 or 8) and growth condition (RLAl6, RLAl8,RLC6, and RLC8) as well as six derived variables,which resulted from differences and ratios betweenmean root lengths for the 6Al-treated plants (D6, D8,R1 R2, DAl, and DC). The typical measure of Al toler-ance is to consider a derived variable rather than adirect one in an attempt to scale root growth underAl stress to control conditions. For example, in Figure2A, we present the distribution of mean relative root
growth (RRG). As RRG approaches 100%, plantsgrowth equally well under both conditions (highlytolerant when RLC6 5 RLAl6), whereas RRG valuesthat approach zero indicate high sensitivity to Alstress (when RLAl6 5 0). RRG due to Al stress in Lerwas 47%, whereas RRG for Col was 71% (Fig. 2A).Individual RIL varied from 23% to 98% RRG. We alsoconsidered the simple difference in root growth D(D 5 RLcontrol 2 RLAl), because ratios can be prob-lematic for statistical analyses (Fig. 2B; Sokal, 1995).As D approaches zero, root growth occurs at thesame rate under both control and Al stress conditions(highly tolerant). As D approaches RLControl, root
Figure 1. Distribution of mean root lengthsamong RIL in the Ler 3 Col population. A, Daysix. Mean root lengths for each RIL are orga-nized into bins (0.5-mm increment) to show thedistribution within the population. Control-treated plants are shown with vertical gray bars,whereas Al-treated plants are shown with verti-cal black bars. Average root lengths for Ler (L)and Col (C), including 1 SD above and below themean, are given as horizontal bars. B, Day eight.
Quantitative Trait Locus Mapping of Al Tolerance Genes in Arabidopsis
Plant Physiol. Vol. 132, 2003 3 of 13 www.plant.org on March 2, 2014 - Published by www.plantphysiol.orgDownloaded from Copyright © 2003 American Society of Plant Biologists. All rights reserved.

growth occurs at very different rates (highly sensi-tive). Ler and Col were more similar with regards toAl tolerance when the parameter D6 was used (3.4and 2.5, respectively), but again, individual RIL var-ied from highly tolerant to highly sensitive (D6 of0.1–8.1). For each of the 10 variables or traits weconsidered, empirical significance thresholds weredetermined from 1,000 permutations (data notshown).
Composite interval mapping identified significantQTL for root growth with three of the 10 variables:RLAl6, RLAl8, and D6 (Fig. 3). No significant QTL werefound for growth under control conditions. The tworegions of the genome most strongly associated withAl tolerance were the north end of chromosome one(closest markers m488/apx1A) and the middle ofchromosome five (closest marker TSL). Both QTLwere identified as significant for the RLAl6 variable,
whereas QTL no. 1 (chromosome one) was alsoidentified by RLAl8 and D6. The closest linked mark-ers, LR, estimated additive effect and percent vari-ance explained for the significant QTL are listed in
Figure 3. Likelihood ratio (LR) plots for significant Al tolerance QTL.LR values for three traits plotted against a linear representation of theArabidopsis genome. A, RLAl6. B, RLAl8. C, D6.
Figure 2. Distribution of RRG estimates between RIL in the Ler 3 Colpopulation. A, RRG variable. Root growth inhibition was estimatedusing RRG for d 6: RLAl6/RLC6; RRG is a scaled variable and is ameasure of RRG. RRG values are expressed as percentage values andorganized into bins (5% increments) to show the distribution withinthe population. RRG values are shown for the Ler (L) and Col (C)parental varieties. B, D6 variable. Root growth inhibition was mea-sured by D6 5 RLC6 2 RLAl6. Also shown are D6 values for Ler (L) andCol (C).
Hoekenga et al.
4 of 13 Plant Physiol. Vol. 132, 2003 www.plant.org on March 2, 2014 - Published by www.plantphysiol.orgDownloaded from Copyright © 2003 American Society of Plant Biologists. All rights reserved.

Table I. In all cases, the alleles from the Col parentconferred greater tolerance.
Using marker regression analysis (MRA; Weller,1986), which does not control for factors segregatingat unlinked loci, additional QTL were identified thatsurpassed empirical significance thresholds (TableII). Although MRA typically makes fewer type IIerrors (false negative QTL), it also tends to makemore type I errors (false positive QTL). MRA sug-gests that there may be three (rather than one) QTLon chromosome five in the presence of Al. The pre-viously identified locus near marker TSL has a stron-ger effect (Table II, b1 value) on d 6, whereas asecond locus, near marker nga158, has a strongereffect on d 8. A third novel region of chromosomefive, near marker ATR3, confers a greater change inroot length between d 6 and d 8 in Al-treated plantsin Col relative to Ler. Also, a locus on chromosomefour near marker mi123 contributes to a larger differ-ence in tolerance under Al treatment in Col than inLer on both d 6 and 8. However, for this study, wewill rely upon the more conservative QTL estimatefrom the composite interval analysis.
Both the m488/apx1A and TSL regions on chromo-somes 1 and 5 were significant for trait RLAl6. Themean value of RLAl6 for each of the four two-locigenotypes is shown in Table III. A two-way ANOVAwas used to test for a significant interaction between
these two QTL. The results (Table IV) confirm thestatistical significance of the trend apparent in TableIII, whereby the gain in tolerance seen in the classcontaining both of the superior QTL alleles (Col, Col,or CC) is larger than would be expected based on theperformance of CL and LC relative to LL (most sen-sitive; Ler at both QTL). The adjusted r2 is 0.398 forthe joint model, whereas it is 0.260 and 0.196 for thesingle-classification ANOVAs including apx1A andTSL, respectively.
Physiological Analysis of the Al Tolerance QTL
We identified two significant QTL for Al tolerancein the Ler 3 Col RIL population. These major QTLapparently act together in the same pathway, basedon the evidence for epistasis, and together explainapproximately 40% of the variation in toleranceamong the RI lines. We attempted to determine thephysiological mechanisms by which the QTL condi-tion tolerance. This might reveal a phenotype moresuitable for the fine-mapping and eventual positionalcloning of the genes responsible for the QTL, if eachQTL conferred Al tolerance by distinct mechanisms.Because Al-activated root release of organic acids isthe best documented tolerance mechanism, we de-signed experiments to identify and quantify the com-
Table I. Significant QTL: results from composite interval analysisThe LR, additive effect, and proportion of the phenotypic variance explained by the QTL, conditioned
on the background markers, are given at the point for which the LR is highest within each region. Thelocation of each trait is indicated by the chromosome, the distance in cM from the first marker(position), and the name of the closest marker used in the analysis. LR maxima within 10 cM of a higherlocal LR maximum are not counted. The statistical significance of the LR is indicated by *, **, or ***,which denote a value in excess of the a 5 0.1, 0.05, or 0.01 critical value, respectively. A positiveadditive effect indicates a longer root length in individuals homozygous for the Col allele for the firstthree traits. Due to the nature of the fourth trait (D6), a negative additive effect indicates Col contributedthe superior allele.
Trait Chromosome cM Marker LR Additive Effect r2
RLA16 1 7.74 m488 36.03*** 0.52 0.32RLA16 5 37.75 TSL 19.98** 0.42 0.19RLA18 1 9.31 apx1A 34.40*** 0.59 0.31D6 1 9.31 apx1A 17.60* 20.70 0.16
Table II. Significant QTL: results from marker regression analysisThe LR and additive effect (bl) are given at the point for which LR is highest within each region.
Location and statistical significance are reported as in Table 1.
Trait Chromosome cM Marker LR b1
RLA16 1 7.74 m488 34.10*** 0.47RLA16 5 37.75 TSL 19.63*** 0.40RLA18 1 7.74 m488 33.88*** 0.57RLA18 4 75.65 mi123 12.48** 0.37RLA18 5 18.12 nga158 15.84** 0.41D6 1 11.35 ARR4 17.61*** 20.70D8 1 11.35 ARR4 16.35*** 20.72DA 5 118.44 ATR3 14.44** 0.19
Quantitative Trait Locus Mapping of Al Tolerance Genes in Arabidopsis
Plant Physiol. Vol. 132, 2003 5 of 13 www.plant.org on March 2, 2014 - Published by www.plantphysiol.orgDownloaded from Copyright © 2003 American Society of Plant Biologists. All rights reserved.

ponents of Arabidopsis root exudates to test the po-tential involvement of the QTL.
Previous studies have used high-pressure liquidchromatography (HPLC) for the analysis of root ex-udates (Pellet et al., 1995; Ryan et al., 1995; Larsen etal., 1998). To discriminate between inorganic andorganic anions, HPLC requires the use of a verysimple salt solution as a hydroponic growth mediumfor collection of root exudates. Arabidopsis is highlysensitive to hydroponic growth conditions; the rootsof seedlings neither grow well nor release substantialamounts of organic acids when grown in simple saltsolution (Larsen et al., 1998). Thus, a different ana-lytical technique, capillary electrophoresis, was em-ployed so that seedlings could be grown and rootexudates collected from a nutrient solution more op-timal for root growth. Using capillary electrophore-sis, organic anions (e.g. citrate and malate) releasedfrom the plant can be discriminated from inorganicanions (e.g. sulfate, phosphate, and nitrate) in nutri-ent solution (Pineros et al., 2002). Preliminary exper-iments demonstrated that Arabidopsis does alter thecomposition of root exudates in response to Al stressand that differences exist between Col and Ler con-sistent with the difference in tolerance (Fig. 4). A
representative electropherogram is shown, whichcontains four principal peaks (Fig. 4A). Both of themajor peaks derive from the nutrient solution. Theearly major peak (1) is composed of Cl2, NO3
2, andSO4
22 anions, all of which essentially comigrate. Thetrailing major peak (4) is composed of Homopipes, apH buffer that keeps the small volume of the exuda-tion solution in the relevant pH range to maintainAl31 toxicity during the exudation component of theexperiment. The early minor peak (2) is citrate andthe slightly later minor peak (3) is composed ofmalate and phosphate. Representative traces areshown for exudates collected from Col and Ler,grown in control and Al-treated conditions, with afocus on the citrate/malate/phosphate region (Fig. 4,B–E). Both ecotypes exhibit the same general re-sponse to Al stress—citrate release decreases whilemalate/phosphate release increases. However, themalate/phosphate peak for Col is approximatelyeight times as large as the one seen in Ler, indicatingthat Col releases more protective ligands in responseto Al stress than does Ler, which is consistent withthe difference in tolerance observed.
To test whether the two major Al tolerance QTLcondition organic acid release, 10 RIL for each of the
Table III. Interaction between QTL on chromosome 1 and 5 fortrait RLA16
Mean and SE of RLA16 for the six genotypic classes.
Markers apx1A (chromosome 1) and TSL (chromosome 5) wereused as factors in a two-way ANOVA for RLA16. Similar results wereobtained when marker m488 was used in place of apx1A. Thenumber of lines included in the analysis was 97, four lines lackedmarker because information for m488, apx1A, or TSL. The adjustedr2 is 0.398 for the joint model. DF, degrees of freedom. SS, sum ofsquares.
apx1A Genotype TSL Genotype Mean RLA16 SE
mm
Columbia Columbia 4.68 0.15Columbia Landsberg 3.71 0.14Landsberg Columbia 3.42 0.20Landsberg Landsberg 3.13 0.12Columbia (ecotype) 6.10 0.21Landsberg (ecotype) 3.00 0.13
Table IV. Analysis of interaction between QTL for trait RLA16
Markers apx1A (chromosome 1) and TSL (chromosome 5) wereused as factors in a two-way analysis of variance for RLA16. Similarresults were obtained when marker m488 was used in place ofapx1A. The number of lines included in the analysis was 97, becausefour lines lacked marker information for m488, apx1A, or BL. Theadjusted r2 is 0.398 for the joint model. DF, degrees of freedom. SS,sum of squares.
Factor DF SS F P
apx1A 1 17.49 35.21 ,0.0001TSL 1 8.02 16.14 0.0001apx1A * TSL 1 2.38 4.80 0.0309Error 93 46.18
Figure 4. Representative capillary electrophoresis traces for hydro-ponic media solutions. A, Representative complete electropherogramfor root exudates collected from Col seedlings grown under controlconditions. B, Col, control sample for time window 3.0 to 3.6 min,which brackets the elution of citrate (first peak) and malate/phos-phate (second peak). C, Col, Al treated, for 3.0- to 3.6-min elutionperiod. D, Ler, control, for 3.0- to 3.6-min elution period. E, Ler, Altreated, for 3.0- to 3.6-min elution period.
Hoekenga et al.
6 of 13 Plant Physiol. Vol. 132, 2003 www.plant.org on March 2, 2014 - Published by www.plantphysiol.orgDownloaded from Copyright © 2003 American Society of Plant Biologists. All rights reserved.

four genotypic classes at the two loci (Col, Col-CC;Col, Ler-CL; Ler, Col-LC; Ler, Ler-LL) were selectedto be representative of those genotypes. The obser-vations for each of the four genotypic classes werepooled to focus on the effects of the major QTL and torandomize the effects of the rest of the genome. Onelimitation of the capillary electrophoresis techniqueis that malate and phosphate comigrate due to simi-larities in size and charge density. Therefore, phos-phate levels were also determined using a spectro-photometric assay, and the joint malate/phosphatepeaks were deconvoluted accordingly (Baykov et al.,1988).
Al stress increased the release of malate from Ara-bidopsis roots (Fig. 5A). All of the genotypes tested(both parents and the four QTL classes) demon-strated approximately a 3-fold increase in malaterelease in the Al stress treatment (Fig. 5, black bars)compared with the control treatment (Fig. 5, graybars). However, the absolute magnitude of themalate flux varied according to genotype in a patternconsistent with the pattern of Al tolerance. The CC
RIL genotypes, as a class, released more malate thanthe other three genotypes, the CL and LC classeswere indistinguishable from each other, and the LLclass was equivalent to the Ler parent (Fig. 3A; TableV). An ANOVA confirmed that the six genotypicclasses (two parents and four QTL classes) differ inmalate release (F 5 15.96, P 5 5.7e-11). The almostperfect linear relationship (r 5 0.975) between malaterelease and root length under Al stress for the sixgenotypic classes is shown in Figure 6. This suggeststhat the two major Al tolerance QTL both affect tol-erance, as measured by root length, via regulation ofmalate release. Furthermore, the fact that the linearrelationship holds even with inclusion of the parentalgenotypes is suggestive evidence that the remaining(undetected) QTL may also act through this samemechanism.
What role do citrate and phosphate release play inAl tolerance in this cross? Al stress decreased therelease of citrate from Arabidopsis roots (Fig. 5B).Although differences existed between the genotypeclasses under control conditions, the six genotypes
Figure 5. Root organic ligand exudation by sixArabidopsis genotypes. A, Root malate exuda-tion. Mean malate release (picomoles of malateper plant per 2 d) from hydroponically grownArabidopsis in the presence (black) and absence(gray) of Al. Vertical error bars depict SE. Sixvarieties were tested: ecotypes Col and Ler andthe four QTL classes that derive from two QTLs(CC, CL, LC, and LL). B, Root citrate exudation.C, Root phosphate exudation.
Quantitative Trait Locus Mapping of Al Tolerance Genes in Arabidopsis
Plant Physiol. Vol. 132, 2003 7 of 13 www.plant.org on March 2, 2014 - Published by www.plantphysiol.orgDownloaded from Copyright © 2003 American Society of Plant Biologists. All rights reserved.
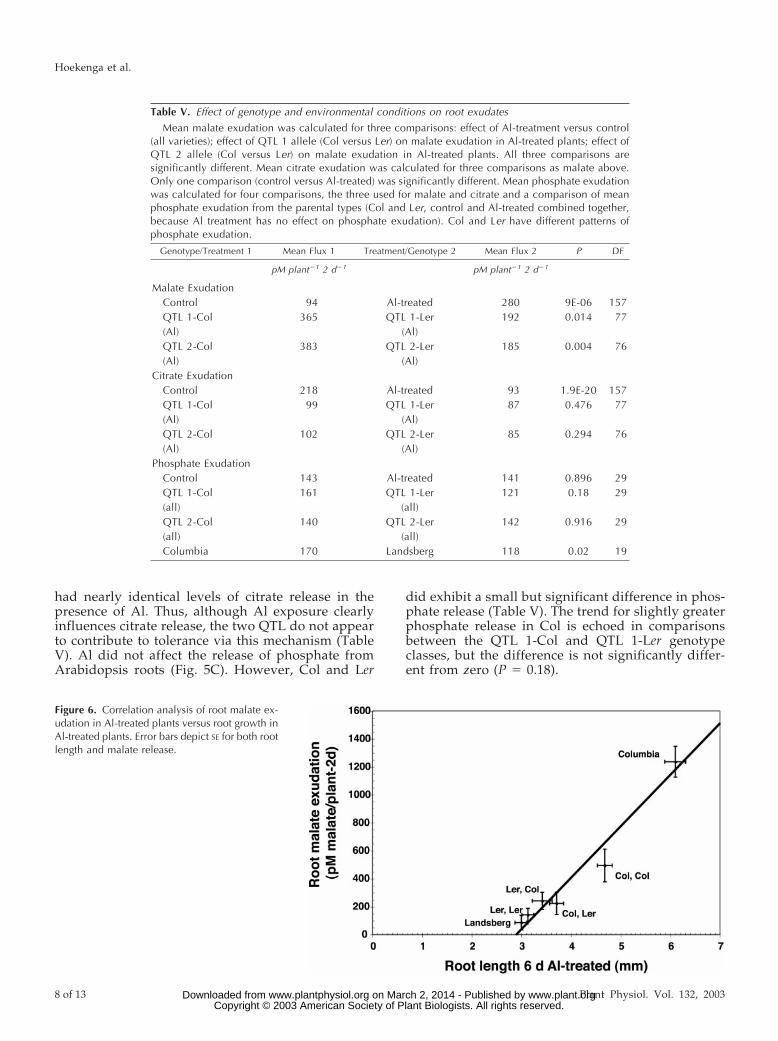
had nearly identical levels of citrate release in thepresence of Al. Thus, although Al exposure clearlyinfluences citrate release, the two QTL do not appearto contribute to tolerance via this mechanism (TableV). Al did not affect the release of phosphate fromArabidopsis roots (Fig. 5C). However, Col and Ler
did exhibit a small but significant difference in phos-phate release (Table V). The trend for slightly greaterphosphate release in Col is echoed in comparisonsbetween the QTL 1-Col and QTL 1-Ler genotypeclasses, but the difference is not significantly differ-ent from zero (P 5 0.18).
Figure 6. Correlation analysis of root malate ex-udation in Al-treated plants versus root growth inAl-treated plants. Error bars depict SE for both rootlength and malate release.
Table V. Effect of genotype and environmental conditions on root exudatesMean malate exudation was calculated for three comparisons: effect of Al-treatment versus control
(all varieties); effect of QTL 1 allele (Col versus Ler) on malate exudation in Al-treated plants; effect ofQTL 2 allele (Col versus Ler) on malate exudation in Al-treated plants. All three comparisons aresignificantly different. Mean citrate exudation was calculated for three comparisons as malate above.Only one comparison (control versus Al-treated) was significantly different. Mean phosphate exudationwas calculated for four comparisons, the three used for malate and citrate and a comparison of meanphosphate exudation from the parental types (Col and Ler, control and Al-treated combined together,because Al treatment has no effect on phosphate exudation). Col and Ler have different patterns ofphosphate exudation.
Genotype/Treatment 1 Mean Flux 1 Treatment/Genotype 2 Mean Flux 2 P DF
pM plant21 2 d21 pM plant21 2 d21
Malate ExudationControl 94 Al-treated 280 9E-06 157QTL 1-Col 365 QTL 1-Ler 192 0.014 77(Al) (Al)QTL 2-Col 383 QTL 2-Ler 185 0.004 76(Al) (Al)
Citrate ExudationControl 218 Al-treated 93 1.9E-20 157QTL 1-Col 99 QTL 1-Ler 87 0.476 77(Al) (Al)QTL 2-Col 102 QTL 2-Ler 85 0.294 76(Al) (Al)
Phosphate ExudationControl 143 Al-treated 141 0.896 29QTL 1-Col 161 QTL 1-Ler 121 0.18 29(all) (all)QTL 2-Col 140 QTL 2-Ler 142 0.916 29(all) (all)Columbia 170 Landsberg 118 0.02 19
Hoekenga et al.
8 of 13 Plant Physiol. Vol. 132, 2003 www.plant.org on March 2, 2014 - Published by www.plantphysiol.orgDownloaded from Copyright © 2003 American Society of Plant Biologists. All rights reserved.
Identification of Candidate Tolerance Genes
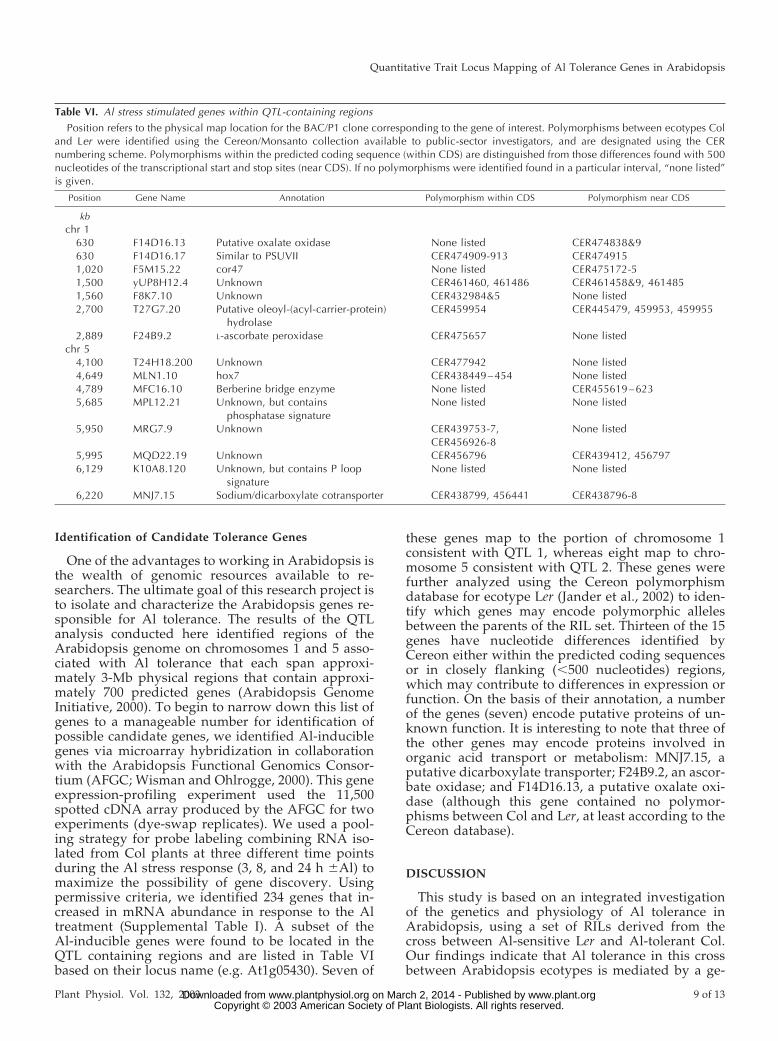
One of the advantages to working in Arabidopsis isthe wealth of genomic resources available to re-searchers. The ultimate goal of this research project isto isolate and characterize the Arabidopsis genes re-sponsible for Al tolerance. The results of the QTLanalysis conducted here identified regions of theArabidopsis genome on chromosomes 1 and 5 asso-ciated with Al tolerance that each span approxi-mately 3-Mb physical regions that contain approxi-mately 700 predicted genes (Arabidopsis GenomeInitiative, 2000). To begin to narrow down this list ofgenes to a manageable number for identification ofpossible candidate genes, we identified Al-induciblegenes via microarray hybridization in collaborationwith the Arabidopsis Functional Genomics Consor-tium (AFGC; Wisman and Ohlrogge, 2000). This geneexpression-profiling experiment used the 11,500spotted cDNA array produced by the AFGC for twoexperiments (dye-swap replicates). We used a pool-ing strategy for probe labeling combining RNA iso-lated from Col plants at three different time pointsduring the Al stress response (3, 8, and 24 h 6Al) tomaximize the possibility of gene discovery. Usingpermissive criteria, we identified 234 genes that in-creased in mRNA abundance in response to the Altreatment (Supplemental Table I). A subset of theAl-inducible genes were found to be located in theQTL containing regions and are listed in Table VIbased on their locus name (e.g. At1g05430). Seven of
these genes map to the portion of chromosome 1consistent with QTL 1, whereas eight map to chro-mosome 5 consistent with QTL 2. These genes werefurther analyzed using the Cereon polymorphismdatabase for ecotype Ler (Jander et al., 2002) to iden-tify which genes may encode polymorphic allelesbetween the parents of the RIL set. Thirteen of the 15genes have nucleotide differences identified byCereon either within the predicted coding sequencesor in closely flanking (,500 nucleotides) regions,which may contribute to differences in expression orfunction. On the basis of their annotation, a numberof the genes (seven) encode putative proteins of un-known function. It is interesting to note that three ofthe other genes may encode proteins involved inorganic acid transport or metabolism: MNJ7.15, aputative dicarboxylate transporter; F24B9.2, an ascor-bate oxidase; and F14D16.13, a putative oxalate oxi-dase (although this gene contained no polymor-phisms between Col and Ler, at least according to theCereon database).
DISCUSSION
This study is based on an integrated investigationof the genetics and physiology of Al tolerance inArabidopsis, using a set of RILs derived from thecross between Al-sensitive Ler and Al-tolerant Col.Our findings indicate that Al tolerance in this crossbetween Arabidopsis ecotypes is mediated by a ge-
Table VI. Al stress stimulated genes within QTL-containing regionsPosition refers to the physical map location for the BAC/P1 clone corresponding to the gene of interest. Polymorphisms between ecotypes Col
and Ler were identified using the Cereon/Monsanto collection available to public-sector investigators, and are designated using the CERnumbering scheme. Polymorphisms within the predicted coding sequence (within CDS) are distinguished from those differences found with 500nucleotides of the transcriptional start and stop sites (near CDS). If no polymorphisms were identified found in a particular interval, “none listed”is given.
Position Gene Name Annotation Polymorphism within CDS Polymorphism near CDS
kbchr 1
630 F14D16.13 Putative oxalate oxidase None listed CER474838&9630 F14D16.17 Similar to PSUVII CER474909-913 CER4749151,020 F5M15.22 cor47 None listed CER475172-51,500 yUP8H12.4 Unknown CER461460, 461486 CER461458&9, 4614851,560 F8K7.10 Unknown CER432984&5 None listed2,700 T27G7.20 Putative oleoyl-(acyl-carrier-protein)
hydrolaseCER459954 CER445479, 459953, 459955
2,889 F24B9.2 L-ascorbate peroxidase CER475657 None listedchr 5
4,100 T24H18.200 Unknown CER477942 None listed4,649 MLN1.10 hox7 CER438449–454 None listed4,789 MFC16.10 Berberine bridge enzyme None listed CER455619–6235,685 MPL12.21 Unknown, but contains
phosphatase signatureNone listed None listed
5,950 MRG7.9 Unknown CER439753-7,CER456926-8
None listed
5,995 MQD22.19 Unknown CER456796 CER439412, 4567976,129 K10A8.120 Unknown, but contains P loop
signatureNone listed None listed
6,220 MNJ7.15 Sodium/dicarboxylate cotransporter CER438799, 456441 CER438796-8
Quantitative Trait Locus Mapping of Al Tolerance Genes in Arabidopsis
Plant Physiol. Vol. 132, 2003 9 of 13 www.plant.org on March 2, 2014 - Published by www.plantphysiol.orgDownloaded from Copyright © 2003 American Society of Plant Biologists. All rights reserved.

netically complex but physiologically simple mecha-nism. Composite interval analysis identified two ma-jor loci for Al tolerance that interact to explainapproximately 40% of the variance observed. Thus,other loci of smaller effect appear to be segregating inthis population. Whereas other QTL were resolvedusing MRA, we have focused our attention on thosetwo loci identified by the more conservative method-ology. However, our findings also indicate that thedifference in Al tolerance is physiologically simplewhen considered at the whole-plant level, as onlyone mechanism—root malate release—is required toexplain 95% of the variance in root length among aselect sample of the RI lines.
The two Al tolerance QTL identified in this studyappear to affect constitutive and Al-activated rootexudation of malate, involving an Al tolerance mech-anism that appears to be similar in general to thatsuggested for wheat (Delhaize et al., 1993b; Pellet etal., 1995). Furthermore, the two QTL have a signifi-cant statistical interaction, which suggests that theymay affect malate release through a shared mecha-nistic pathway. The close correspondence betweenroot malate release and Al tolerance in the selectedRIL and the parental ecotypes (Fig. 6) has lead us topropose a model in which the extent of malate re-lease, controlled by multiple interacting genetic fac-tors, underlies nearly all of the difference in tolerancebetween these two ecotypes. It should be noted thatlinkage or pleiotropy could also be at work, but thefact that the two detected QTL and the collectiveaction of the residual QTL influence root malate re-lease in the same direction and with a magnitudeproportional to the observed differences in toleranceis strong evidence that the correlation is a causativeone. There is a high degree of agreement between thetwo measures of tolerance—Al-dependent inhibitionof root growth in a solid medium and Al-dependentrelease of malate in a liquid medium—despite thedramatic differences in growth environment, sug-gesting that Al tolerance is a highly penetrant phe-notype in Arabidopsis.
A recent report from Kobayashi and Koyama(2002) underscores the reproducibility of the Al tol-erance phenotype, because these investigators alsoused QTL mapping to identify genes important forAl tolerance in the same Ler 3 Col RIL set. The studyby Kobayashi and Koyama focused solely on QTLanalysis of root growth in Al-containing hydroponicmedia and did not attempt to elucidate the mecha-nisms underlying the QTLs. In that study, it wasreassuring to find that the factor on chromosome 1(QTL 1) was also identified as the major tolerancelocus. However, the remainder of the QTLs identifieddid not agree with the results presented in our inves-tigation. This is perhaps not surprising given thedifferences in growth conditions used in each study,which differed in pH (5.0 from Kobayashi andKoyama [2002] versus 4.2 in this study), Al level (as
estimated by GEOCHEM: 0.12 mm Al31 activity fromKobayashi and Koyama [2002] versus 12 mm Al31
activity in this study), and ionic strength of the me-dium (3.1 3 1024 from Kobayashi and Koyama [2002]versus 2.4 3 1022 in this study; Fujiwara et al., 1992;Parker et al., 1995). Statistical analyses and samplingapproaches differed between studies, which mayhave also contributed to the differences in conclu-sions. The robustness of QTL 1 identified in the twodifferent studies has given us further impetus tofocus on isolating the molecular determinant under-lying this QTL in ongoing research.
When an Al tolerance mechanism based on Al-activated root malate exudation is studied in detail, itis possible to see why such a trait could be expectedto be physiologically simple (employing a singlemechanism at the whole-plant level) but could beconditioned by a number of different loci. Al-activated malate release requires the participation ofat least three separate cellular processes: (a) percep-tion of toxic Al; (b) synthesis and possibly compart-mentation of malate in the cytosol; and, (c) malatetransport from the cytosol to the root cell apoplast.Each of the steps could also involve multiple compo-nents, including different enzymes, transporters, andmembrane-associated receptors and other possiblesignal transduction molecules. Hence, it is reasonableto speculate that the variation in Al tolerance seen inthese Arabidopsis genotypes involves a number ofgenes associated with different aspects of organicacid synthesis, transport, and Al perception, all ofwhich act on the same overall physiologicalmechanism.
It also is interesting to note that there is a strongcorrelation for constitutive and Al-activated rootmalate exudation with Al tolerance (see Fig. 5). Forexample, the Col ecotype, which is considerablymore tolerant than the next most Al-tolerant geno-type (CC RIL class), exhibits a 2-fold higher consti-tutive and Al-activated malate exudation comparedwith the CC RIL class, and a 7-fold higher constitu-tive and Al-activated malate release compared withthe most Al-sensitive genotype, the Ler ecotype.Hence, Al-activated malate exudation may not be asimportant as overall root malate release for Arabi-dopsis Al tolerance. One possible scenario to explainthese results would be that both Al-tolerant and-sensitive Arabidopsis genotypes contain the sameAl-sensing and malate transport machinery in theirroot-cell plasma membranes. On the basis of thephysiological findings presented here, this trans-porter would have some capacity to release malate inthe absence of Al, and this transport capacity wouldbe stimulated by exposure to Al. The difference in Altolerance would then be associated with a greaterexpression of these components in genotypes exhib-iting more Al tolerance. That is, the more Al-tolerantgenotypes would have a greater density of these key
Hoekenga et al.
10 of 13 Plant Physiol. Vol. 132, 2003 www.plant.org on March 2, 2014 - Published by www.plantphysiol.orgDownloaded from Copyright © 2003 American Society of Plant Biologists. All rights reserved.
components in their root cells, resulting in greaterconstitutive and Al-activated malate fluxes.
Support for some aspects of this speculative modelcomes from an electrophysiological study of the Al-activated malate transporter in wheat roots (Zhang etal., 2001). In that patch clamp study of the Al-activated malate transporter in protoplasts isolatedfrom root tips of Al-tolerant and -sensitive wheat, theauthors found that root tip cells from both the toler-ant and sensitive genotypes exhibited Al-activatedmalate transporter activity. These findings suggestthat in wheat as in Arabidopsis, the Al-sensitive ge-notypes also contain all or most of the molecularmachinery involved in Al tolerance.
How will we identify the different pieces of thismolecular machinery? On the basis of the QTL anal-ysis, we can locate two important factors (QTL 1 and2) to genomic regions containing hundreds of genes.The gene expression profiling experiments indicatethat only a small fraction of those genes increasemRNA levels during Al stress, and a majority ofthose genes do contain nucleotide polymorphismsbetween Col and Ler (Table IV). Fine-scale geneticmapping should eliminate most of these candidatetolerance genes, leaving a small number that willrequire verification using additional alleles (e.g.T-DNA knockouts, allele replacement, or overexpres-sion) and physiological assessment using both rootgrowth and malate release. Given the incompletegenome coverage of the AFGC array, it is very pos-sible that we have not yet identified the correct can-didate gene. However, this type of genomics-basedapproach is being integrated with ongoing positionalmapping to focus our attention on the portion of theArabidopsis genome that harbors the genes respon-sible for the Al tolerance QTL. Our understanding ofthe physiological basis for Al tolerance gained fromthis study facilitates this effort and should permit usto make better decisions in selecting candidate genesfor future analysis.
In summary, we have identified and characterizedtwo major loci that contribute to the Al tolerancedifferences observed between Col and Ler. Rootmalate exudation closely correlated with Al tolerancein this cross between Arabidopsis ecotypes; a similarcorrelation between Al tolerance and root malaterelease was previously observed in a survey of Al-tolerant and -sensitive wheat cultivars (Ryan et al.,1995). This suggests that information gained fromcloning and characterizing the genes that underliemalate release and Al tolerance in Arabidopsis willbe of immediate utility to crop improvement. Asmentioned previously, QTL mapping is the first steptoward the positional cloning of genes underlyingcomplex phenotypes (Frary et al., 2000; Yano et al.,2000; Jander et al., 2002). Positional cloning of thegenes responsible for the differences in Al toleranceand malate release is the obvious extension of thepresent research. Tight integration of physiological,
genetic, and genomic approaches has been an effi-cient and effective strategy to investigate the complexproblem of Al tolerance and should ultimately allowus to identify the molecular mechanisms responsiblefor this important trait.
MATERIALS AND METHODS
Plant Growth Experiments: Identification of QTL
The Ler 3 Col RIL collection was obtained from the Arabidopsis Biolog-ical Resource Center (Columbus, OH) as stock number CS1899. The corecollection of 100 RIL was used for our root growth experiment. Howeverline CL35 failed to germinate in sufficient numbers to include in thisanalysis. Plants were grown on solid (gellan gum), acidic pH media withand without Al for 8 d. Tolerance to Al stress was estimated by measuringprimary root length after 6 and 8 d of growth.
The solid media plates used a nutrient solution adapted from Larsen etal., 1996, which contained 0.2 mm KH2PO4, 3 mm MgSO4, 0.25 mm(NH4)2SO4, 3 mm Ca(NO3)2, 2 mm K2SO4, 1 mm MnSO4, 5 mm H3BO3, 0.05mm CuSO4, 0.2 mm ZnSO4, 0.02 NaMoO4, 0.1 mm CaCl2, 0.001 mm CoCl2, 1%(w/v) Suc, and 0.125% (w/v) gellan gum. The pH of the medium wasadjusted to 4.2 with the addition of 0.1 m HCl. The medium was autoclavedto sterilize the solution; 85 mL of media was dispensed per 25- 3 100-mmpetri dish under sterile conditions. Al was added through the use of asoaking solution identical to the nutrient solution, with the following mod-ifications: 0.1 mm KH2PO4, 1.1 mm K2SO4, and 1 mm AlCl3. Soak solutionwas applied to the plates for 2 d to allow equilibration (20 mL soak 85 mL21
media). If equilibrium was reached between the soak solution and themedium, we estimate that the Al activity was on the order of 12 to 15 mmAl31 using GEOCHEM to model the speciation chemistry (Parker et al.,1995). Plates were rinsed briefly with sterile Milli-Q grade water. Seeds weresurface sterilized (30% [v/v] bleach and 1% [v/v] Triton X-100; 15 min),resuspended in 0.1% (w/v) agar, and planted to the solid media plates.Plates were then placed at 4°C for 5 d to stratify the seeds to ensure robust,synchronous germination. Ten seeds were planted for each RIL per treat-ment, in triplicate. Plants were grown for 8 d at 20°C in continuous light (50mE m22s21) in a growth chamber.
Root length measurements were collected using an electronic digitalcaliper (Fowler ProMax, Kelley and Kelly Industrial Supply, Syracuse, NY)connected to a computer via an RS-232 cable using the OPTO-RS computerprogram (Fred Fowler Co., Newton, MA).
Statistical Methods
We performed QTL analysis using Qgene (Nelson, 1997) and QTL Car-tographer (Basten et al., 1999). The traits examined included the four rawvariables RLAl6, RLAl8, RLC6, and RLC8, where subscript Al indicates that Alwas added, C that it was not, and the subscripts 6 and 8 indicate the dayupon which the measurement was taken. In addition, we examined severaldifferent composite variables, including (a) the difference in root lengthbetween control and Al-treated plants at the two different time periods,D6 5 RLC6 2 RLAl6 and D8 5 RLC8 2 RLAl8; (b) the difference in root lengthbetween the two time periods for each Al treatment, DA 5 RLAl8 2 RLAl6
and DC 5 RLC8 2 RLC6; (c) the ratios describing the proportional differencein growth between treatments over the first 6 d, R1 5 (RLC6 2 RLAl6)/RLC6
and between the 6th and 8th d, R2 5 [(RLC8 2 RLAl8) 2 (RLC6 2 RLAl6)]/(RLC8 2 RLC6); and (d) percent RRG, which described the ratio between rootgrowth for Al-treated and control plants, on either d 6 or 8, RRG 5RLAl/RLC 3 100.
We chose markers from among the available “framework” markers so asto provide complete coverage of all five chromosomes at intervals of less than5 centiMorgans (cM), on average. We obtained genotypic data for the 99 lines,and map location data for 113 chosen markers, from the Nottingham Arabi-dopsis Stock Center Web site (http://nasc.nott.ac.uk/new_ri_map.html).
To map the QTL, we performed composite interval analysis (Zeng, 1994),which controls for the effects of unlinked QTL on the chromosomal regionbeing tested. This is important in an RIL population, in which substantialdeviations from Mendelian segregation have the potential to create spuriousassociations. We first performed regression analysis for each trait on each
Quantitative Trait Locus Mapping of Al Tolerance Genes in Arabidopsis
Plant Physiol. Vol. 132, 2003 11 of 13 www.plant.org on March 2, 2014 - Published by www.plantphysiol.orgDownloaded from Copyright © 2003 American Society of Plant Biologists. All rights reserved.
marker singly. Then, all markers from the chromosome under considerationgreater than 10 cM from the test position as well as the two markers fromeach chromosome with the highest single-marker regression F scores wereincluded as cofactors for composite interval analysis. A LR test statisticmeasuring the strength of support for a QTL at a given position wascalculated at 1- to 2-cM intervals along the length of each chromosome.
We used permutation tests to calculate appropriate experiment-wisesignificance levels for the LR statistic that would be robust to the non-normality in the data and correct for multiple comparisons (Churchill andDoerge, 1994). The trait values were shuffled among the genotype scores Ntimes, and interval and composite interval analysis was performed on eachof the shuffled datasets. The critical value of the LR statistic at anexperiment-wise significance level of a is the minimum value of the LRstatistic greater than N-aN of those observed among the permuted repli-cates. In our experiments, N 5 1,000 and a 5 0.05. For each QTL thatsurpasses the critical value, we have reported a, the estimated additiveeffect, and r2, the proportion of the phenotypic variation explained, condi-tioned on the selected background markers.
Pair wise epistatic interactions between QTL were tested by an ANOVA.The markers closest to each QTL LR peak were selected as factors for allpossible pair wise ANOVAs. A significant interaction effect between factorswas considered to be evidence for a statistical interaction between the QTLassociated with each marker. ANOVA was also used to test the correlationbetween QTL genotypes and patterns of organic acid release.
Broad sense heritability (hb2) was estimated from one way ANOVA of the
root length data at 6 d using the formula, hb2 5 sg
2/((se2/r) 1 sg
2), wheresg
2 is the variance between RIL, se2 is the variance within RIL, and r is the
average number of measurements per RIL.
Plant Growth Experiments: Assessment of QTL
Al-inducible release of Al-chelating ligands is the most common and bestunderstood protective mechanism in plants. Experiments were conducted totest whether the QTL cosegregated with patterns of ligand release thatwould correlate with tolerance. Seeds were weighed to estimate number (10mg 5 500 seeds), surface sterilized, and stratified as described above.Magenta GA-7 culture vessels (Sigma-Aldrich, St. Louis) were adapted forsterile hydroponic growth using 250-mm polypropylene mesh as substratefor plant growth (Small Parts, Miami Lakes, FL) and a support standconstructed from two notched rectangles of polycarbonate (Laird Plastics,Syracuse, NY). The hydroponic growth solution contained 0.2 mm KH2PO4,2 mm MgSO4, 0.25 mm (NH4)2SO4, 2 mm Ca(NO3)2, 2 mm K2SO4, 1 mmMnSO4, 5 mm H3BO3, 0.05 mm CuSO4, 0.2 mm ZnSO4, 0.02 NaMoO4, 0.1 mmCaCl2, 0.001 mm CoCl2, and 1% (w/v) Suc. Culture vessels were assembled,filled with 150 mL of media, and sterilized by autoclaving. Duplicate sterilevessels were used for each RIL for each condition (control and Al treated).Stratified seeds were planted to the polypropylene mesh cloth under sterileconditions; KH2PO4 was added at the time of planting to avoid precipitationduring autoclaving. Plants were grown for 6 d at 20°C in continuous light(50 mE m22 s21) in a growth chamber. After 6 d, a second, low-strengthnutrient solution was prepared for ligand exudation. This nutrient solutioncontained 275 mm MgCl2, 275 mm CaCl2, 275 mm KCl, 33.4 mm Ca(NO3)2, 33.4mm MgSO4, 16.7 mm K2SO4, 8.35 mm (NH4)2SO4, 3.0 mm Homopipes buffer,1% (w/v) Suc, and micronutrients identical to the prestress medium. AlCl3was added to the Al-treatment media (50 mm concentration and 25 mmactivity). Homopipes was used to buffer the pH of the nutrient solution at4.2. The 1Al nutrient solution was filter sterilized and dispensed into 25- 3100-mm petri dishes (20 mL). Plants were transferred into the 1Al media bytransferring the polypropylene mesh and seedlings under sterile conditions.After 48 h, the 1Al media was sampled and was subsequently analyzed fororganic ligands (organic acids and phosphate anions) by capillary electro-phoresis and spectrophotometry as described by Pineros et al. (2002). Or-ganic acid fluxes were standardized by the number of plant grown in eachMagenta box (picomoles per plant per 2 d). Due to the low ionic strength ofthe 1Al medium, samples did not require treatment by column chromatog-raphy to remove inorganic anions (primarily Cl2) that could interfere withligand determination via capillary electrophoresis.
Candidate Tolerance Gene Discovery
Microarray experiments were conducted in collaboration with the AFGCto identify genes regulated by Al stress. The AFGC generated microarrays
containing 11,500 spotted cDNAs for public consumption. Ecotype Colplants were grown in hydroponic culture as described for the organic acidquantitation, with the modification that upon transfer to pH-buffered treat-ment media that the plants were grown in a large (150 mL) rather than small(20 mL) volume. Three sets of plants were grown for the experiment: thoseharvested for root tissue 3, 8, and 24 h after transfer to fresh experimentalmedium (6 Al containing media). Total RNA was isolated using the TRIzolreagent (Invitrogen, Grand Island, NY) following standard protocols fromeach of the six groups of plants (three control and three Al treated).Poly(A1) RNA was isolated from total RNA using the Poly(A) Pure kit(Ambion, Austin, TX) following manufacturer’s instructions and was quan-titated using a spectrophotometer. Equal amounts of poly(A1) RNA werepooled from each time group to form a control pool and an Al-treated pool.Pooled poly(A1) RNA samples were sent to the AFGC (East Lansing, MI)for probe labeling, array hybridization, and scanning. Gene expressionpatterns were compared between 6 Al exposed plants to identify genesinfluenced by the Al treatment. All of the raw and processed data from theseexperiments can be accessed from the Stanford Microarray Database(http://smd.stanford.edu) filed under Kochian, as corresponding investi-gator. Individual array elements can also be queried through http://ww-w.Arabidopsis.org/tools/bulk/microarray/index.html. Results were ana-lyzed using simple Boolean strategies in a FileMaker database (v5 forMacintosh). Spots that met threshold requirements (signal .350 in everyprobe set) and reproducibility guidelines (Al-treated to control signal ratioequal to or greater than 1.5 in both replicates) were considered as candidateAl-inducible genes (see Supplemental Table I for complete list of genesalong with signal intensity data). The Cereon collection of nucleotide poly-morphisms between ecotypes Col and Ler was downloaded from http://www.Arabidopsis.org/cereon/index.html and compiled in a FileMaker da-tabase. The candidate Al-inducible genes were located on the physical mapusing locus alias (e.g. yUP8H12.4) and locus name (e.g. At1g05340). Genesthat fell within QTL containing regions were then inspected for polymor-phisms using the Cereon database.
ACKNOWLEDGMENTS
We acknowledge the technical assistance provided by Holly Manslank,William Shaben, Lydiah Kemunto Bosire, Elizabeth Ogilvie, and YasinSenbabaoglu (Cornell University); by the greenhouse staff of the BoyceThompson Institute for Plant Research; by the Arabidopsis Biological Re-source Center for seed stocks; by the Arabidopsis Functional GenomicsConsortium for the microarray experiments; and by the instructive discus-sions with Dr. Andrew Cary (Yale University) and Dr. Edward Buckler(North Carolina State University/U.S. Department of Agriculture-Agricultural Research Service).
Received March 5, 2003; returned for revision March 9, 2003; acceptedMarch 9, 2003.
LITERATURE CITED
Alonso-Blanco C, Koornneef M (2000) Naturally occurring variation inArabidopsis: an underexploited resource for plant genetics. Trends PlantSci 5: 22–29
Arabidopsis Genome Initiative (2000) Analysis of the genome sequence ofthe flowering plant Arabidopsis thaliana. Nature 408: 796–815
Basten CJ, Weir BS, Zeng ZB (1999) QTL Cartographer. Computer ProgramVersion 1.13. North Carolina State University, Raleigh, NC
Baykov AA, Evtushenko OA, Avaeva SM (1988) A malachite green proce-dure for orthophosphate determination and its use in alkalinephosphatase-based enzyme immunoassay. Anal Biochem 171: 266–270
Berzonsky WA (1992) The genomic inheritance of Al tolerance in ’Atlas 669wheat. Genome 35: 689–693
Burr B, Burr FA (1991) Recombinant inbreds for molecular mapping inmaize: theoretical and practical considerations. Trends Genet 7: 55–60
Camargo CEO (1981) Melhoramento do trigo: I. Hereditariedade do toler-ancia a toxicidade do aluminio. Bragantia 40: 33–45
Camargo CEO (1984) Melhoramento do trigo: VI. Hereditariedade de tol-erancia a tres concentracoes de aluminio em solucao nutritiva. Bragantia43: 279–291
Churchill G, Doerge RW (1994) Empirical threshold values for quantitativetrait mapping. Genetics 138: 963–971
Hoekenga et al.
12 of 13 Plant Physiol. Vol. 132, 2003 www.plant.org on March 2, 2014 - Published by www.plantphysiol.orgDownloaded from Copyright © 2003 American Society of Plant Biologists. All rights reserved.

Delhaize E, Craig S, Beaton CD, Bennet RJ, Jagadish VC, Randall PJ(1993a) Al tolerance in wheat (Triticum aestivum L.): I. Uptake and dis-tribution of Al in root apices. Plant Physiol 103: 685–693
Delhaize E, Ryan PR, Randall PJ (1993b) Al tolerance in wheat (Triticumaestivum L.): II. Al-stimulated excretion of malic acid from root apices.Plant Physiol 103: 695–702
Doerge RW (2002) Mapping and analysis of quantitative trait loci in exper-imental populations. Nat Rev Genet 3: 43–52
Foy CD (1988) Plant adaptation to acid, Al-toxic soils. Commun Soil SciPlant Anal 19: 959–987
Frary A, Nesbitt TC, Grandillo S, Knaap E, Cong B, Liu J, Meller J, ElberR, Alpert KB, Tanksley SD (2000) fw2.2: a quantitative trait locus key tothe evolution of tomato fruit size. Science 289: 85–88
Fujiwara T, Hirai YM, Chino M, Komeda Y, Naito S (1992) Effect of sulfurnutrition on expression of soybean seed storage protein genes in trans-genic petunia. Plant Physiol 99: 263–268
Jackson T, Reisenauer H (1984) Crop response to lime in western UnitedStates. In F Adams, ed, Soil Acidity and Liming. American Society ofAgronomy, Crop Science Society of America, Soil Science Society ofAmerica, Madison, WI, pp 333–347
Jander G, Norris SR, Rounsley SD, Bush DF, Levin IM, Last RL (2002)Arabidopsis map-based cloning in the post-genome era. Plant Physiol129: 440–450
Juenger T, Purugganan M, Mackay TF (2000) Quantitative trait loci forfloral morphology in Arabidopsis thaliana. Genetics 156: 1379–1392
Kerridge PC, Kronstad WE (1968) Evidence of genetic resistance to Altoxicity in wheat (Triticum aestivum Vill., Host). Crop Sci 60: 710–711
Kliebenstein D, Pedersen D, Barker B, Mitchell-Olds T (2002) Compara-tive analysis of quantitative trait loci controlling glucosinolates, myrosi-nase and insect resistance in Arabidopsis thaliana. Genetics 161: 325–332
Kobayashi Y, Koyama H (2002) QTL analysis of Al tolerance in recombinantinbred lines of Arabidopsis thaliana. Plant Cell Physiol 43: 1526–1533
Kochian LV (1995) Cellular mechanisms of Al toxicity and resistance inplants. Annu Rev Plant Physiol Plant Mol Biol 46: 237–260
Lambrix V, Reichelt M, Mitchell-Olds T, Kliebenstein DJ, Gershenzon J(2001) The Arabidopsis epithiospecifier protein promotes the hydrolysisof glucosinolates to nitriles and influences Trichoplusia in herbivory.Plant Cell 13: 2793–2807
Larsen PB, Degenhardt J, Tai CY, Stenzler LM, Howell SH, Kochian LV(1998) Al-resistant Arabidopsis mutants that exhibit altered patterns of Alaccumulation and organic acid release from roots. Plant Physiol 117: 9–18
Larsen PB, Tai CY, Kochian LV, Howell SH (1996) Arabidopsis mutantswith increased sensitivity to Al. Plant Physiol 110: 743–751
Lister C, Dean C (1993) Recombinant inbred lines for mapping RFLP andphenotypic markers in Arabidopsis thaliana. Plant J 4: 745–750
Lukowitz W, Gillmor CS, Scheible WR (2000) Positional cloning in Arabi-dopsis. Why it feels good to have a genome initiative working for you.Plant Physiol 123: 795–805
Magnavaca R, Gardner CO, Clark RB (1987) Inheritance of Al tolerance inmaize. In HW Gabelman, BC Loughman, eds, Genetic Aspects of PlantMineral Nutrition. Martinus Nijhoff, Dordrecht, The Netherlands, pp201–212
Miftahudin, Scoles G, Gustafson JP (2002) AFLP markers tightly linked tothe Al-tolerance gene Alt3 in rye (Secale cereale L.). Theor Appl Genet 104:626–631
Miyasaka SC, Buta JG, Howell RK, Foy CD (1991) Mechanisms of Altolerance in snapbeans: root exudation of citric acid. Plant Physiol 96:737–743
Nelson J (1997) QGene: software for marker-based genomic analysis andbreeding. Mol Breed 3: 229–235
Nguyen V, Burow M, Nguyen HT, Le B, Le T, Paterson A (2001) Molecularmapping of genes conferring Al tolerance in rice (Oryza sativa L.). TheorAppl Genet 102: 1002–1010
Nguyen VT, Nguyen BD, Sarkarung S, Martinez C, Paterson AH, NguyenHT (2002) Mapping of genes controlling Al tolerance in rice: comparisonof different genetic backgrounds. Mol Genet Genomics 267: 772–780
Parker D, Norvell W, Chaney R (1995) GEOCHEM-PC: a chemical specia-tion program for IBM and compatible personal computers. In R Loepper,ed, Chemical Equilibrium and Reaction Models, Vol 2. Soil Science Soci-ety of America, Madison, WI, pp 253–269
Pellet DM, Grunes DL, Kochian LV (1995) Organic acid exudation as anAl-tolerance mechanism in maize (Zea mays L.). Planta 196: 788–795
Perez-Perez JM, Serrano-Cartagena J, Micol JL (2002) Genetic analysis ofnatural variations in the architecture of Arabidopsis thaliana vegetativeleaves. Genetics 162: 893–915
Pineros MA, Magalhaes JV, Carvalho Alves VM, Kochian LV (2002) Thephysiology and biophysics of an Al tolerance mechanism based on rootcitrate exudation in maize. Plant Physiol 129: 1194–1206
Prioli AJ (1987) Analise genetica da tolerancia a toxidez do alumino emmilho (Zea mays L). PhD. Universidade Estadual de Campinas, Campi-nas, SP, Brazil
Quesada V, Garcia-Martinez S, Piqueras P, Ponce MR, Micol JL (2002)Genetic architecture of NaCl tolerance in Arabidopsis. Plant Physiol 130:951–963
Rao IM, Zeigler RS, Vera R, Sarkarung S (1993) Selection and breeding foracid-soil tolerance in crops. Bioscience 43: 454–465
Ryan PR, Delhaize E, Randall PJ (1995) Malate efflux from root apices andtolerance to Al are highly correlated in wheat. Aust J Plant Physiol 22:531–536
Sawazaki E, Furlani ER (1986) Genetica da tolerancia ao alumino emlinhagens de milho cateto. In XVI Congresso Nacional de Milho e Sorgo.Belo Horizonte, Brazil, pp 382–392
Silva IR, Smyth TJ, Raper CD, Carter TE, Rufty TW (2001) Differential Altolerance in soybean: an evaluation of the role of organic acids. PhysiolPlant 112: 200–210
Sokal RR (1995) Data in Biology. In RR Sokal, FJ Rohlf, eds, Biometry: ThePrinciples and Practice of Statistics in Biological Research. Freeman Pub-lishing, New York, pp 17–19
Tang Y, Sorrells ME, Kochian LV, Garvin DG (2000) Identification of RFLPmarkers linked to barley Al tolerance gene Alp. Crop Sci 40: 778–782
von Uexkull HR, Mutert E (1995) Global extent, development and economicimpact of acid soils. In RA Date, NJ Grundon, GE Raymet, ME Probert,eds, Plant-Soil Interactions at Low pH: Principles and Management.Kluwer Academic Publishers, Dordrecht, The Netherlands, pp 5–19
Weller JI (1986) Maximum likelihood techniques for the mapping andanalysis of quantitative trait loci with the aid of genetic markers. Biomet-rics 42: 627–640
Wisman E, Ohlrogge J (2000) Arabidopsis microarray service facilities.Plant Physiol 124: 1468–1471
Wood S, Sebastian K, Scherr S (2000) Soil Resource Condition. In PilotAnalysis of Global Ecosystems: Agroecosystems. International Food Pol-icy Research Institute and the World Resources Institute, Washington,DC, pp 45–54
Wu P, Liao C, Hu B, Yi K, Jin W, Ni J, He C (2000) QTLs and epistasis forAl tolerance in rice (Oryza sativa L.) at different seedling stages. TheorAppl Genet 100: 1295–1303
Yano M, Katayose Y, Ashikari M, Yamanouchi U, Monna L, Fuse T, BabaT, Yamamoto K, Umehara Y, Nagamura Y (2000) Hd1, a major photo-period sensitivity quantitative trait locus in rice, is closely related to theArabidopsis flowering time gene CONSTANS. Plant Cell 12: 2473–2484
Yanovsky JM, Casal JJ, Luppi JP (1997) The VLF loci, polymorphic betweenecotypes Landsberg erecta and Columbia, dissect two branches of phyto-chrome A signal transduction that correspond to very-low-fluence andhigh-irradiance responses. Plant J 12: 569–667
Zeng ZB (1994) Precision mapping of quantitative trait loci. Genetics 136:1457–1466
Zhang WH, Ryan PR, Tyerman SD (2001) Malate-permeable channels andcation channels activated by Al in the apical cells of wheat roots. PlantPhysiol 125: 1459–1472
Quantitative Trait Locus Mapping of Al Tolerance Genes in Arabidopsis
Plant Physiol. Vol. 132, 2003 13 of 13 www.plant.org on March 2, 2014 - Published by www.plantphysiol.orgDownloaded from Copyright © 2003 American Society of Plant Biologists. All rights reserved.
Copyright © 2022 FDOKUMEN