GABA and glutamate depolarize cortical progenitor cells and inhibit DNA synthesis
Upload
independentCategory
view
0download
0
Article
Expression Quantitative Trai
t Loci and ReceptorPharmacology Implicate Arg1 and the GABA-A Receptoras Therapeutic Targets in NeuroblastomaGraphical Abstract
Highlights
Arg1 and GABA gene expression correlates with neuroblastoma
formation in mice
GABA gene expression correlates with survival in human
neuroblastomas
Both activation of GABA-A and inhibition of ARG1 block the
growth of neuroblastoma cells
A benzodiazepine inhibits AKT and ERK and induces apoptosis
in neuroblastoma cells
Hackett et al., 2014, Cell Reports 9, 1034–1046November 6, 2014 ª2014 The Authorshttp://dx.doi.org/10.1016/j.celrep.2014.09.046
Authors
Christopher S. Hackett, David A. Quig-
ley, ..., QiWen Fan, William A. Weiss
[email protected] (Q.F.),[email protected] (W.A.W.)
In Brief
Neuroblastoma is a pediatric tumor of pe-
ripheral neural tissue. Hackett et al. now
link Arg1 and GABA with genetic suscep-
tibility to neuroblastoma formation in
mice. Expression of GABA genes corre-
lates with survival in human tumors.
GABA activation and ARG1 inhibition
block the growth of neuroblastoma cells.
These results identify therapeutic targets
in neuroblastoma and suggest a role for
these pathways in neural growth.
Accession Numbers
GSE59675

Cell Reports
Article
Expression Quantitative Trait Loci and ReceptorPharmacology Implicate Arg1 and the GABA-A Receptoras Therapeutic Targets in NeuroblastomaChristopher S. Hackett,1,2 David A. Quigley,3 Robyn A. Wong,2 Justin Chen,1,2 Christine Cheng,2 Young K. Song,4
Jun S. Wei,4 Ludmila Pawlikowska,5,6 Yun Bao,2 David D. Goldenberg,2 Kim Nguyen,2 W. Clay Gustafson,7
Sundari K. Rallapalli,8 Yoon-Jae Cho,9 James M. Cook,8 Serguei Kozlov,10 Jian-Hua Mao,11 Terry Van Dyke,10
Pui-Yan Kwok,6,12,13 Javed Khan,4 Allan Balmain,3 QiWen Fan,2,* and William A. Weiss2,7,14,*1Biomedical Sciences Graduate Program, University of California, San Francisco, San Francisco, CA 94143, USA2Department of Neurology, University of California, San Francisco, San Francisco, CA 94143, USA3Helen Diller Family Comprehensive Cancer Center, University of California, San Francisco, San Francisco, CA 94143, USA4Oncogenomics Section, Pediatric Oncology Branch, National Cancer Institute, Gaithersburg, MD 20877, USA5Department of Anesthesia, University of California, San Francisco, San Francisco, CA 94143, USA6Institute for Human Genetics, University of California, San Francisco, San Francisco, CA 94143, USA7Department of Pediatrics, University of California, San Francisco, San Francisco, CA 94143, USA8Departments of Chemistry and Biochemistry, University of Wisconsin-Milwaukee, Milwaukee, WI 53211, USA9Department of Neurology, Stanford University School of Medicine, Stanford, CA 94305, USA10Mouse Cancer Genetics Program, Center for Advanced Preclinical Research, National Cancer Institute, Frederick, MD 21702, USA11Department of Epidemiology and Biostatistics, University of California, San Francisco, San Francisco, CA 94143, USA12Department of Dermatology, University of California, San Francisco, San Francisco, CA 94143, USA13Cardiovascular Research Institute, University of California, San Francisco, San Francisco, CA 94143, USA14Department of Neurological Surgery, University of California, San Francisco, San Francisco, CA 94143, USA
*Correspondence: [email protected] (Q.F.), [email protected] (W.A.W.)
http://dx.doi.org/10.1016/j.celrep.2014.09.046
This is an open access article under the CC BY-NC-ND license (http://creativecommons.org/licenses/by-nc-nd/3.0/).
SUMMARY
The development of targeted therapeutics for neuro-blastoma, the third most common tumor in children,has been limited by a poor understanding of growthsignaling mechanisms unique to the peripheral nerveprecursors from which tumors arise. In this study,we combined genetics with gene-expression anal-ysis in the peripheral sympathetic nervous systemto implicate arginase 1 and GABA signaling intumor formation in vivo. In human neuroblastomacells, either blockade of ARG1 or benzodiazepine-mediated activation of GABA-A receptors inducedapoptosis and inhibited mitogenic signaling throughAKT and MAPK. These results suggest that ARG1and GABA influence both neural development andneuroblastoma and that benzodiazepines in clinicaluse may have potential applications for neuroblas-toma therapy.
INTRODUCTION
Neuroblastoma, a common and deadly pediatric tumor of the
peripheral nervous system, is derived from sympathetic neural
progenitors that normally differentiate into postmitotic neurons.
This tumor likely arises from disruption of growth pathways
specific to the neural lineage, as mutations in canonical growth
1034 Cell Reports 9, 1034–1046, November 6, 2014 ª2014 The Auth
pathways seen in epithelial, glial, and hematopoietic tumors
are rarely observed. Amplification of theMYCN proto-oncogene
is a hallmark of high-risk neuroblastoma (Brodeur et al., 1984;
Schwab et al., 1984), and a transgenic mouse model driven by
MYCN develops tumors with histological and genomic charac-
teristics of human neuroblastoma (Hackett et al., 2003; Weiss
et al., 1997). In this model, tumor incidence varies among mouse
strains, with the strain FVB/N showing complete resistance to
tumor formation.
In this study, we exploited this genetic variance to identify mo-
lecular pathways that drive neuroblastoma development. We
first identified tumor susceptibility loci through classical genetic
linkage mapping in genetically heterogeneous backcross mice.
We next analyzed gene expression as a function of genetic
variation to identify expression quantitative trait loci (eQTLs) in
sympathetic superior cervical ganglia (SCGs) in these mice.
We then used eQTLs localizing to tumor susceptibility loci to
identify candidate tumor susceptibility genes. Liver arginase
(Arg1), a component of both the urea cycle and the gamma-
amino butyric acid (GABA) biosynthetic pathway, was the
strongest eQTL at the most prominent tumor susceptibility
locus. Multiple genes and eQTLs involved in GABA neurotrans-
mitter signaling were located at secondary susceptibility loci,
providing an intriguing genetic link between this pathway and
neuroblastoma biology. We validated this link using compounds
targeting the ARG1-GABApathway in human neuroblastoma cell
lines. Nor-NOHA, an ARG1 inhibitor, inhibited the growth and
viability of cells. More strikingly, activation of GABA-A signaling
using a benzodiazepine derivative induced apoptosis and was
ors

associated with decreased activity of PI3K/AKT and MAPK
signaling pathways, both of which play a central role in cell
growth and survival. These data implicating arginine metabolism
and GABA signaling in the pathogenesis of neuroblastoma
present a combination of novel therapeutic targets. Additionally,
the demonstration that the neurotransmitter GABA inhibits the
growth of tumor cells derived from a neural lineage highlights
an emerging role for neurotransmitters in regulating develop-
ment of the peripheral nervous system.
RESULTS
The Penetrance of Neuroblastoma in TH-MYCN MiceIs Strain DependentTransgenic mice were generated on a Balb/c 3 C57B6/J back-
ground with �10% incidence of tumors. After two backcrosses
into strain FVB/NJ, tumor incidence decreased to zero (Fig-
ure S1A). Conversely, tumor incidence increased steadily with
each successive backcross into strain 129/SvJ, to �60%
(Chesler et al., 2007). The levels of transgene expression were
similar between strains (Figure S1B).
We crossed resistant transgenic FVB/NJ mice to susceptible
wild-type 129/SvJ. Four percent of F1 mice developed tumors,
suggesting that resistance was dominant. To generate a genet-
ically diverse population for linkage mapping, we backcrossed
transgenic F1 animals to wild-type 129/SvJ mice. The incidence
of tumors in the resulting N1 backcross generation was 38%
(n = 203), with an average survival (109 days) identical to that
of mice carrying the transgene in a pure 129/SvJ background
(Figure S1C; Chesler et al., 2007).
Linkage Analysis Identifies a Tumor SusceptibilityModifier on Chromosome 10To identify genomic loci associated with tumor susceptibility, we
genotyped 203 mice using a combination of microsatellite and
SNP markers (Table S1). Interval mapping for linkage to tumor
susceptibility produced a maximum LOD (log of odds) score
on chromosome 10 at marker RS36323433 (LOD = 4.1, signifi-
cant at a 5% genome-wide error rate). Interestingly, tumor
susceptibility was strongly influenced by gender. Sex as an inter-
acting covariate increased the LOD score to 4.9 (Figures 1A and
1B). This locus was significant in male mice (LOD = 4.3, n = 82),
but not in female mice. It may be relevant in this regard that neu-
roblastoma is slightly more prevalent in boys (1.3:1) than in girls
(Hale et al., 1994). Contrary to the expected allele segregation at
this locus, heterozygous mice were tumor prone (55%), whereas
mice homozygous for the 129/SvJ alleles were resistant (25%
incidence; Figures 1C and S1D). The absence of a single locus
at which an FVB/N allele conferred complete resistance to tumor
formation (a trait of FVB/N mice) suggested that the genetics un-
derlying patterns of resistance and susceptibility in pure inbred
strains is complex.
Since the segregation of genotypes with tumor susceptibility
at the chromosome 10 locus did not match the patterns of tumor
susceptibility in the parent strains, we next considered a more
complex genetic model to explain susceptibility. A two-QTL
test identified several loci that interacted with the chromosome
10 locus, with similar LOD scores (Figures 1D and 1E;
Cell R
Table S2). Interestingly, although all of these loci interacted
with the chromosome 10 locus, they did not interact with each
other.
eQTL Analysis Identifies Arg1 as a Candidate ModifierThe 95% confidence interval (CI) of the peak on chromosome 10
spanned 47 Mb and contained more than 281 genes, compli-
cating identification of candidates. Hypothesizing that suscepti-
bility to tumors may be governed by differential expression of
genes within this locus, we compared mRNA expression levels
in neural-crest-derived sympathetic SCGs from transgenic
129/SvJ and FVB/NJ male mice. We identified 9,819 genes
that were differentially expressed genome-wide between the
two strains (Figure S1C; Table S3), including 137 within the
95%CI for the chromosome 10 susceptibility locus (representing
almost half of all genes within the locus). Surprisingly, whenmale
and female 129/SvJ and FVB/NJ mice were compared, only six
genes were differentially expressed between sexes. With the
exception of a RIKEN clone on chromosome 2, all mapped to
either the X or Y chromosomes (Figure S1D; Table S3), excluding
gender-specific gene expression as a mechanism for the gender
effect at the chromosome 10 locus.
Gene-expression levels can be influenced by complex interac-
tions among cis- and trans-acting factors. Such factors can be
distinguished by identifying eQTLs, which involves generating
a genetically heterogeneous population (such as our backcross
population), measuring gene-expression levels, and treating
the expression level of each gene as a quantitative trait for sub-
sequent linkage mapping (Brem et al., 2002; Schadt et al., 2003).
Through this method, cis- and trans-acting alleles that influence
gene expression are decoupled from each other, and genes
whose differential expression is due to cis-acting factors at a
locus can be distinguished from genes under the control of
trans-acting factors at other loci. Genes with eQTLs overlapping
with QTLs for physiological phenotypes have been shown to
control these phenotypes (Schadt et al., 2003; Yang et al.,
2009). Therefore, we utilized this technique to identify eQTLs
within our chromosome 10 locus, as well as at the numerous
other secondary loci identified in the two-QTL tumor suscepti-
bility analysis.
We measured mRNA expression levels in 116 SCGs from the
backcross population and tested for linkage between gene-
expression levels and germline genetic variation. We identified
342 eQTLs acting both locally and on other chromosomes
(Table S4). Four eQTLs mapped to the susceptibility locus on
chromosome 10, withArg1 (liver arginase) showing the strongest
eQTL. When this measurement was refined by interval mapping,
Arg1 expression was linked to a QTL at chromosome 10 with a
LOD score of 18.2 (Figure 2A). Mice heterozygous at that locus
had almost 2-fold higher expression of Arg1 compared with
mice homozygous for the 129/SvJ allele (Figures 2B and S2A).
Of the four eQTLs that mapped to the locus, the Arg1 eQTL over-
lapped most directly and with the highest LOD score (Figures
S2B and S2C), making Arg1 our top candidate gene (Figure 2C;
Table 1). Notably, among 137 genes differentially expressed at
the chromosome 10 locus in parental strains, only four, including
Arg1, showed significant eQTL mapping to the locus (Table S4).
These data suggest that the differential expression of the other
eports 9, 1034–1046, November 6, 2014 ª2014 The Authors 1035

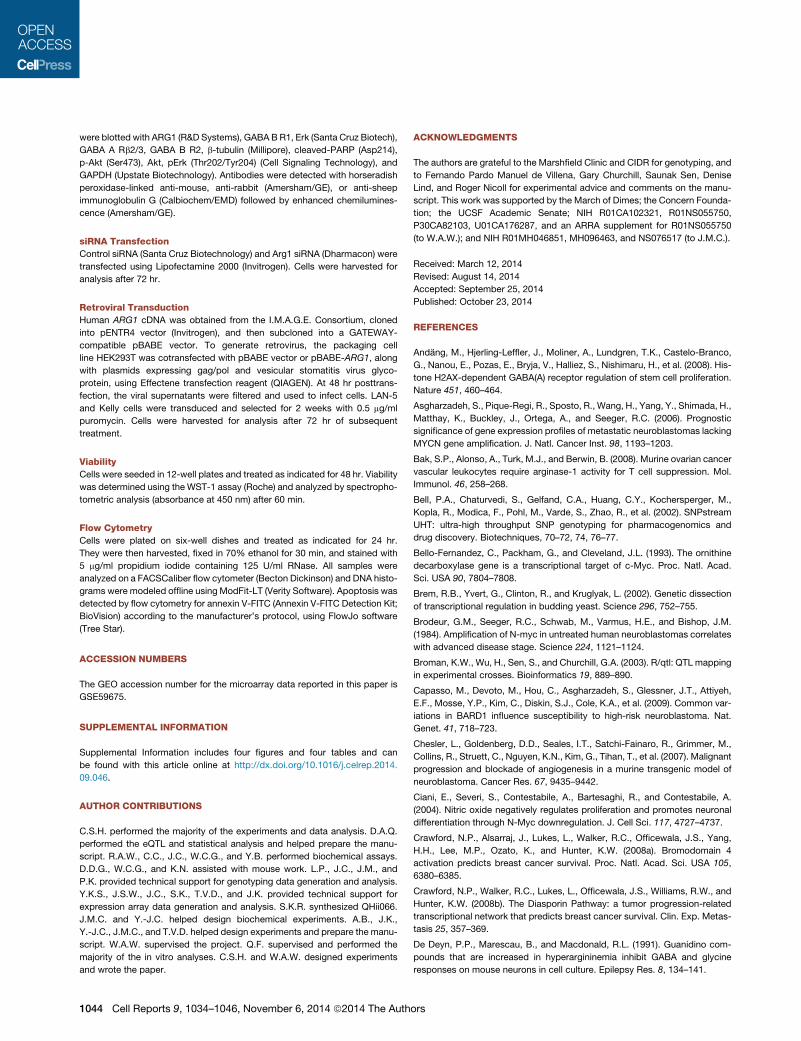
Figure 1. A Locus on Chromosome 10 and Multiple Secondary Loci Are Linked to Tumor Susceptibility
(A) A LOD plot for tumor susceptibility shows a single significant locus on chromosome 10. Horizontal line indicates 5% genome-wide significance threshold
(LOD = 3.58, 1,000 permutations).
(B) LOD plot of chromosome 10 only. Hash marks on the horizontal axis indicate marker positions. Horizontal line indicates 5% genome-wide significance
threshold (LOD = 3.58, 1,000 permutations).
(C) Effect plot for the marker closest to the maximum LOD score (RS36323433) showing incidence of tumors as a function of genotype.
(D) Two-QTL analysis using sex as an interacting covariate reveals that multiple secondary loci interact with the chromosome 10 locus. The top-left half shows the
results of the additive model, and the bottom-right half shows results of the ‘‘full’’ model. The bar on the right displays the correspondence between color on the
chart and LOD scores (the left side of the bar corresponds to the additive analysis on the top-left half of the plot, while the right side of the bar, with a different
scale, corresponds to the full model analysis on the bottom right). Locations of the maximum LOD scores are shown in Table S2.
(E) Circos plot illustrating the two-way interactions shown in (D). Pairs of loci with an LOD > 6 are connected.
See also Figure S1 and Table S1.
genes in the parents was due in part to trans-acting factors, illus-
trating the power of eQTL analysis for dissecting control of gene
expression at a genetic locus and filtering candidate genes.
eQTLs for GABA-Related Genes Map to SecondarySusceptibility LociWe next looked for eQTLs that mapped to secondary tumor sus-
ceptibility loci that interacted with the chromosome 10 locus. We
1036 Cell Reports 9, 1034–1046, November 6, 2014 ª2014 The Auth
noted eQTLs for genes related to GABA neurotransmitter
signaling at two of the loci (Table 1). Notably, a trans eQTL on
chromosome 2 controlled expression of the Gabra3 receptor
subunit on the X chromosome (Figures 3A–3C). This eQTL over-
lapped directly with the secondary susceptibility locus on chro-
mosome 2 (Figure S3A; Table 1). Mice harboring alleles resulting
in high Arg1 expression and low Gabra3 expression showed the
strongest susceptibility to tumors (Figure 3C). Similarly, an eQTL
ors

Figure 2. An eQTL for Arg1 Colocalizes with
the Tumor Susceptibility Locus on Chromo-
some 10
(A) Interval mapping for expression of Arg1, the
most significant eQTL in the chromosome 10
region, showing a LOD score of 18.2 on chromo-
some 10 centered at the physical location of the
Arg1 gene. Horizontal line indicates 5% genome-
wide significance threshold.
(B) Log2 Arg1 expression level as a function
of genotype at SNP RS29351336 on chromo-
some 10.
(C) A plot of LOD scores on chromosome 10 for
susceptibility (red line) and the Arg1 eQTL (orange
line) showing colocalization of the peaks.
See also Tables S3 and S4.
for the GABA transporter Slc6a1 (Figures 3D–3F) mapped to a
secondary susceptibility locus on chromosome 4 (Figure S3B;
Table 1), though the gene was on chromosome 6. We noted
that the differences in gene expression of Gabra3 and Slc6a1
were also apparent in the parental strains (Figures S3C and
S3D). The overlap of Gabra3, Slc6a1, and Arg1 eQTLs with pri-
mary and secondary susceptibility loci is illustrated genome-
wide in Figure 3G.
We next investigated secondary susceptibility loci that lacked
GABA-related eQTL candidates, and found several GABA-
related genes that mapped within 10 Mb of susceptibility peaks.
The locus on chromosome 1 (LOD 7.8) flanked by markers
RS5056599 (116 Mb) and D1MIT1001 (131 Mb, LOD 7.8) lies in
close proximity to Dbi (diazepam binding inhibitor, 122 Mb), a
gene that modulates GABA receptor activity (Gray et al., 1986).
Similarly, the locus on chromosome 9 centered near 117 Mb
(D9MIT201, LOD 7.9) is 4 Mb from the Trak1 gene, which
encodes a trafficking factor that modulates GABA receptor ho-
meostasis (Gilbert et al., 2006). The locus on chromosome 7
centered at 144 Mb (RS13479509, LOD 6.4) is 4 Mb from
ornithine aminotransferase (Oat), which converts ornithine to
Cell Reports 9, 1034–1046, N
glutamate (the substrate for GABA syn-
thesis). Finally, the locus on chromosome
17 centered near 35 Mb (D17MIT231,
LOD 6.7) is 2 Mb from the GABA-B recep-
tor 1. Altogether, at least six secondary
susceptibility loci colocalized with genes
in the GABA pathway or eQTLs that
controlled these genes (Table 1).
Expression ofGABAPathwayGenesIdentified by Linkage and eQTLAnalysis Predicts Survival inNeuroblastomaWe next investigated whether expression
of ARG1 and the GABA pathway genes
correlated with outcomes in human neu-
roblastoma. We analyzed a database
of gene-expression profiles of human
neuroblastoma samples (Asgharzadeh
et al., 2006; available at http://home.ccr.
cancer.gov/oncology/oncogenomics). Strikingly, all of the genes
in the GABA pathway that either mapped to tumor susceptibility
loci or were controlled by eQTLs at these loci showed a signifi-
cant correlation with survival (Figures 4A–4F). ARG1 did not
show a strong correlation with survival in human neuroblastomas
(Figure 4G). However, the population was relatively homoge-
neous with respect to ARG1 expression (Figure 4H), hindering
our ability to segregate tumors based on expression levels.
Inhibition of ARG1 Decreases the Viability of HumanNeuroblastoma CellsThe higher-expressing Arginase allele that confers tumor sus-
ceptibility is nested within an overall resistant genetic back-
ground in purebred mice (either FVB/NJ or FVB/NJ 3 129/SvJ
F1). The allelic variation in secondary loci (harboring components
of the GABA pathway) only showed an effect in combination with
alleles at other loci. This genetic complexity precluded validation
in vivo. Therefore, we used an in vitro approach to test whether
these biochemical pathways have relevance to human tumor
biology. Since little is known about the role of these pathways
in regulating cell growth and thus there is little basis for
ovember 6, 2014 ª2014 The Authors 1037

Table 1. Candidate Genes at Susceptibility Loci
Candidate eQTLs at Susceptibility Loci
Chr Susceptibility Locus (Mb) LOD eQTL Gene eQTL Locus (Mb) eQTL p Value Permutation p Value
10 28 5.0 Arg1 25 2.92 3 10�20 <0.001
2 166 7.0 Gabra3 178 5.57 3 10�34 <0.001
4 115 7.4 Slc6a1 129 2.81 3 10�05 0.001
Non-eQTL GABA Genes at Susceptibility Loci
Chr Susceptibility Locus (Mb) LOD Gene Gene Location (Mb)
1 131 7.8 Dbi 122
9 117 7.8 Trak1 121
17 35 6.9 Gabbr1 37
7 144 6.3 Oat 140
Gene Descriptions
Gene Location (chr) Description
Arg1 10 liver arginase
Gabra3 Xa GABA-A receptor, subunit alpha 3
Slc6a1 6a GABA transporter, removes GABA from
synaptic cleft
Dbi 1 diazepam binding inhibitor; modulates the
action of the GABA receptor
Trak1 9 trafficking protein, kinesin binding 1,
regulates GABA receptor
Gabbr1 17 GABA-B receptor, 1
Oat 7 ornithine aminotransferase (produces
glutamate, a GABA precursor)
Chr, chromosome.aControlled by trans eQTL.
identifying the specific downstream pathways involved, we
assessed the effect of compounds targeting this pathway on
overall growth and viability.
We detected ARG1 by western blot across a panel of human
neuroblastoma cell lines (Figure 5A). We treated two lines, Kelly
and CHP-126, with the reversible arginase inhibitor nor-NOHA
(N-Omega-hydroxy-nor-arginine) (Tenu et al., 1999) to test
whether inhibition of arginase could impair tumor growth. Viability
was decreased in CHP-126 and Kelly cells across a range of
doses from 1 mM to 100 mM (Figure 5B). Since nor-NOHA is not
a particularly potent inhibitor in neuroblastoma cell lines, we
next tested small interfering RNA (siRNA) against ARG1. ARG1
siRNA induced a significant decrease in growth, an increase in
the apoptotic markers Annexin V and cleaved PARP, and
reduced levels of phosphorylated AKT and ERK, both of which
are central components ofmitogenic signalingpathways (Figures
5C and S4B). We next tested whether overexpression of ARG1
had the opposite effect. While overexpression alone did not
produce a notable effect on growth, it did increase levels of
phosphorylated AKT and ERK, and partially rescued the inhibi-
tory effect of the benzodiazepine QHii066 (described below)
(Figures 5D and S4C). We conclude that ARG1 expression mod-
ulates viability and proliferation in human neuroblastoma cells.
GABA-A Activation Induces Apoptosis in NeuroblastomaWe next investigated the role of GABA signaling in the control
of cell growth and survival. GABA-A and GABA-B receptors
1038 Cell Reports 9, 1034–1046, November 6, 2014 ª2014 The Auth
were detected in all cell lines tested (Figures 5A and S4A). To
assess whether modulation of this pathway influenced cell
growth and survival, we treated cells with a potent and selec-
tive GABA-A receptor agonist, QHii066, a benzodiazepine
derivative (He et al., 2000; Huang et al., 2000). QHii066 slowed
cell growth and induced apoptosis in a dose-dependent
fashion in both LAN-5 (Figure 5E) and Kelly (Figure S4D). Immu-
noblotting revealed increased PARP cleavage and reduced the
abundance of phosphorylated AKT and ERK in cells treated
with QHii066. Flow cytometry demonstrated G0/G1 arrest (Fig-
ure S4E). These data suggest that specific activation of the
GABA-A receptor decreases cell viability, induces apoptosis,
and suppresses growth and survival signaling pathways in
neuroblastoma cell lines.
DISCUSSION
The pathways that regulate development of the peripheral ner-
vous system are distinct from those that control other cell types.
As a consequence, common genomic aberrations that drive
tumorigenesis in epithelial, hematopoietic, and glial tumors
rarely show abnormalities in neuroblastoma, a tumor of the sym-
pathetic peripheral nervous system. Genetic analysis in humans
and model systems has been key for identifying mechanisms
that drive the disease. Here, we used a genetically engineered
mouse model for neuroblastoma to uncover a signaling pathway
relevant to human disease.
ors

(legend on next page)
Cell Reports 9, 1034–1046, November 6, 2014 ª2014 The Authors 1039

Although the influence of strain background on tumor pene-
trance is frequently observed in mouse models of cancer, few
genes underlying this susceptibility have been identified (Craw-
ford et al., 2008a; Ewart-Toland et al., 2003; MacPhee et al.,
1995; Mao et al., 2006; Park et al., 2005; Wakabayashi et al.,
2007), mostly due to the limited resolution of quantitative trait
linkage mapping. Analysis of gene expression as a function of
genotype (i.e., treating gene-expression levels as heritable traits
and performing linkage analysis) has facilitated the identification
of genes underlying physiological variation (Brem et al., 2002;
Schadt et al., 2003; Yang et al., 2009). eQTL analysis has identi-
fied several genes that modify tumor susceptibility in mouse
models of cancer (Crawford et al., 2008b; La Merrill et al.,
2010; Quigley et al., 2009). In the current study, eQTL analysis
of the peripheral nervous system identified Arg1 as a candidate
neuroblastoma modifier gene at chromosome 10, as well as a
particularly prominent eQTL on chromosome 2 that governs
the expression of a GABA-A neurotransmitter receptor subunit
in trans on the X chromosome (a phenomenon that would have
been missed by conventional analysis of candidate genes at
the susceptibility loci). Numerous other susceptibility loci over-
lapped with other GABA-related genes, suggesting a mecha-
nism for the pattern of genetic linkage to tumor susceptibility,
and implicating an interaction between upregulation of arginase
activity and downregulation of GABA receptors as cooperating
mechanisms that promote susceptibility to tumors.
Although Arg1 is associated with the urea cycle in liver,
expression of Arg1 in sympathetic nerve ganglia (Yu et al.,
2003) that do not carry out the urea cycle suggested a role in
other biochemical pathways. In neurons, Arg1 is part of the
GABA synthesis pathway, which produces ornithine, a precursor
of glutamate and GABA. The biochemical link between Arg1 and
the GABA pathway potentially explains the unique genetic
pattern of several secondary loci interacting with a single gene/
locus. Only one cytoplasmic arginase gene exists (Arg1). Howev-
er, the GABA signaling pathway may be perturbed at numerous
genomic loci, including several components of the GABA-A
receptor, genes for which are dispersed throughout the genome.
Thus, in a genetic model involving perturbation of arginase and
GABA signaling, many GABA-related genes could interact with
the single Arg1 gene on chromosome 10 with similar effects
(disrupting two connected pathways), while GABA genes may
not interact with each other (as multiple disruptions would
have redundant effects on the same pathway). This model is
consistent with the pattern of genetic interactions we observed
in our system.
Figure 3. Secondary Susceptibility Loci Colocalize with eQTL for GAB
(A) A trans eQTL on chromosome 2 controls expression of the GABA-A receptor
(B) Gabra3 expression as a function of D2MIT148 genotype.
(C) Plot of tumor incidence as a function of genotypes at the chromosome 2 and
(D) Expression QTL for the Slc6a1 GABA transporter on chromosome 4 (LOD = 4
(E) Slc6a1 expression as a function of D4MIT203 genotype.
(F) Tumor incidence as a function of genotypes at loci on chromosomes 4 and 1
(G) Genome-wide plot of LOD scores for the Gabra3 (green), Slc6a1 (blue), and A
the combined effect of the peak of the chromosome 10 locus plus points across th
primary and secondary susceptibility loci. 2D plots for Gabra3 and Slc6a1 are sh
See also Figure S2 and Table S4.
1040 Cell Reports 9, 1034–1046, November 6, 2014 ª2014 The Auth
Several downstream outputs of the arginase pathway could
account for increased expression of Arg1 predisposing mice to
tumors. Arginase may act as an immunosuppressant (Bak
et al., 2008; Yachimovich-Cohen et al., 2010) or alter levels of ni-
tric oxide synthases (Ciani et al., 2004; Jenkins et al., 1995). It
may also alter levels of ornithine, the substrate for polyamine
synthesis, which has been linked to tumorigenesis (Gerner and
Meyskens, 2004) and neural proliferation (Huang et al., 2007).
The rate-limiting polyamine synthetic enzyme ornithine decar-
boxylase (ODC) is a well-established target for MYCN (Bello-
Fernandez et al., 1993). ODC inhibitors inhibit neuroblastoma
development in vitro and in TH-MYCN mice (Hogarty et al.,
2008; Koomoa et al., 2008), and are currently in clinical trials for
neuroblastoma (http://clinicaltrials.gov/show/NCT01586260).
Ornithine is also a substrate for synthesis of glutamate and
GABA. Notably, ornithine aminotransferase (Oat), which con-
verts ornithine to glutamate, maps to a susceptibility locus on
chromosome 7 (Table 1). Since GABA inhibits neuronal growth
and promotes differentiation (Andang et al., 2008), at least
one ultimate output of Arg1 activity (GABA) could inhibit both
the induction and further growth of tumors, driving selection
for secondary genetic lesions that disable this pathway.
Although Arg1 activity has not been studied extensively in can-
cer, inhibition of arginase has been shown to disrupt the growth
of breast cancer cells (Singh et al., 2000). Arginase expression
has also been linked to neuronal viability. Clinically, ARG1muta-
tions cause arginemia, which is characterized by neurodegener-
ation (OMIM 207800). Although it has been speculated that this
neurodegeneration is caused by hepatic production of neuro-
toxic metabolites (De Deyn et al., 1991; Deignan et al., 2008),
our data, coupled with the detection of Arg1 expression in neural
tissues (Yu et al., 2001, 2002, 2003), suggest that Arg1 may be
involved in growth and survival signaling in neuroblasts, and in-
hibition of Arg1 may have an intrinsic cytotoxic effect in neurons
and neuroblastoma cells.
The observation that mice with lower expression of GABA-A
receptor subunits are tumor prone is consistent with GABA’s
known role in neuronal cell growth and differentiation (Andang
et al., 2008; Le-Corronc et al., 2011), and suggests that the asso-
ciation of downregulation of GABA-A receptors with aggressive
human neuroblastomas has biological significance (Roberts
et al., 2004). However, since the receptor is formed as a pen-
tameric combination of 19 possible subunits with changing
expression patterns and biological roles (Le-Corronc et al.,
2011), testing this hypothesis is not straightforward. GABA
signaling negatively regulates the growth of neural crest
A-Related Genes
subunit 3 (Gabra3) on the X chromosome (arrow) (LOD = 30.9).
10 loci.
.1). The arrow indicates the physical location of Slc6a1 on chromosome 6.
0.
rg1 (orange) eQTLs, and tumor susceptibility for a single-locus model (red) and
e rest of the genome (gray), showing correspondence between eQTL peaks and
own in Figure S3.
ors

(legend on next page)
Cell Reports 9, 1034–1046, November 6, 2014 ª2014 The Authors 1041

stem cells (Andang et al., 2008). In our hands, neuroblastoma
cells expressing the GABA-A receptor showed decreased
viability, increased apoptosis, and diminished activity of mito-
genic signaling pathways in response to GABA-A activation,
supporting a role of GABA signaling in tumor cell growth and
survival.
Neuroblastoma is a common pediatric tumor with a unique
biology, making the development of novel targeted therapeutics
problematic. As a result, improvements in clinical outcomes
have beenmodest over the last several decades. Familial studies
have identified genes that drive neuroblastoma, such as ALK
(Janoueix-Lerosey et al., 2008; Mosse et al., 2008) and PHOX2B
(Mosse et al., 2004; Trochet et al., 2004), in a subset of human
cases. Conversely, high-powered genome-wide association
studies (Capasso et al., 2009; Diskin et al., 2012; Nguyen et al.,
2011; Wang et al., 2011) have succeeded in identifying
numerous genes that confer a slightly increased risk for the dis-
ease. However, the complexity of the disease has confounded
the search for druggable pathways. This complexity is illustrated
by the current study. We observed a stark variation in tumor
susceptibility between two closely related laboratory mouse
strains in a relatively tightly controlled model system. Although
it is seemingly straightforward, genetic analysis of this variation
revealed a strikingly complex system of genetic interactions
that required an intensive genomic analysis to decipher.
While aggregated genetic evidence implicated the GABA
pathway, none of the components were strong enough to be
detected alone without an additional genetic interaction, in a
well-controlled model system with limited genetic variability
compared with human studies. Although the current study was
successful in identifying a pharmacologically tractable pathway
for therapeutic intervention, it illustrates the difficulty of identi-
fying and characterizing the complex biochemical pathways
that influence tumor development.
Arginase inhibitors are under investigation for highly prevalent
diseases such as hypertension (Durante et al., 2007). Even more
encouragingly, QHii066, the GABA agonist used in this study, is
closely related to the benzodiazepine diazepam (Valium), with a
similar mechanism of action. The findings that GABA is impli-
cated in neuroblastoma growth and that a benzodiazepine
derivative can induce apoptosis raise the possibility that
numerous clinically approved drugs used in neurology and psy-
chology can also be used as chemotherapeutic agents. These
results also highlight a possible connection between the role of
neurotransmitters in nervous system development and the regu-
lation of neuroblastoma growth.
EXPERIMENTAL PROCEDURES
Mice
All mice were obtained from The Jackson Laboratory and were housed and
treated in accordance with UCSF IACUC guidelines. Backcross mice were
generated by crossing TH-MYCN transgenic FVB/N mice to wild-type
129/SvJ and subsequently crossing F1 offspring to wild-type 129/SvJ.
Figure 4. Expression of GABA Genes Correlates with Survival in Huma
(A–G) Survival curves based on the data set from Asgharzadeh et al. (2006) (availa
the GABA-B receptor, (B) DBI, (C) Trak1, (D) GABRA-3, (E) SLC6A1, (F) OAT, and
(H) Plot of ARG1 expression levels for all tumors arranged from highest to lowes
1042 Cell Reports 9, 1034–1046, November 6, 2014 ª2014 The Auth
Mice were observed for at least 1 year before they were considered tumor
free. Tumor-negative backcross mice were followed until 1 year of age (the
latest tumor was detected at 342 days). SCGs were surgically isolated and
snap-frozen in liquid nitrogen. SCGs were isolated from parental control
groups at 21 days.
Taqman Analysis of Transgene Expression
Taqman expression analysis was performed on six mice (three female and
threemale) from each strain. Proprietary assays for humanMYCN and controls
L18 and mGUS were obtained from Applied Biosystems. MYCN relative to
mGUS is shown in Figure S1B.
Genotyping
DNA was isolated from spleen tissue using a proteinase K lysis followed by
phenol chloroform extraction. Microsatellite marker genotyping was carried
out by the Marshfield Clinic (Marshfield, WI) and CIDR (Baltimore, MD). SNP
genotyping was performed using template-directed primer extension with
fluorescence polarization detection (FP-TDI [Hsu et al., 2001], Acycloprime
II; Perkin Elmer) and SNPStream (Bell et al., 2002) 48-plex (Beckman Coulter).
Markers and map positions are shown in Table S1. The marker set had an
average spacing of 8 Mb genome-wide (excluding the high density of markers
on chromosome 10).
Linkage Analysis
Interval mapping was performed using the R/qtl (Broman et al., 2003) package
in the R statistical language. Genotypes flagged as probable errors by R/qtl
were discarded. The genetic map positions were determined using the phys-
ical map positions (NCBI 37/mm9) followed by re-estimation of the map using
R/qtl, and likely mismapped markers were discarded. Linkage analysis was
performed on a 1 cM grid. Genome-wide significance thresholds were deter-
mined by running 1,000 permutations for each data set. Interval analysis was
performed using the binary mode of the ‘‘EM’’ model. All results reported as
significant were significant at a 5% genome-wide error rate, and 95% CIs
were determined using the lodint function in R/qtl. Genes within the CIs
were determined by counting all genes in the UCSC genome assembly map-
ping between markers flanking the 95% CI.
Expression Arrays
We isolated RNA fromSCGs using the RNeasy kit (QIAGEN) becausewe found
that the buffers in this kit were more effective at disrupting the ganglia than
Trizol. We used 1 mg of RNA as a starting template for the RiboMinus rRNA
subtraction (Invitrogen), followed by the ST labeling protocol (Affymetrix).
Labeled samples were hybridized to Affymetrix Mouse Exon 1.0 arrays. Array
quality control was performed using the Affymetrix Expression Console. Two-
way comparisons between homogeneous groups (e.g., male versus females
or 129/SvJ versus FVB/N males) were performed using the SAM package
(Tusher et al., 2001) with a 5% false discovery rate (FDR). Results are pre-
sented in Table S3 and plotted in Figures S1C and S1D.
eQTL Analysis
Arrays were normalized using RMA in the XPS package (http://www.
bioconductor.org/packages/2.6/bioc/html/xps.html). eQTLs were calculated
as described previously (Quigley et al., 2009). Briefly, linkage between gene
expression and loci was assessed by linear regression, and genome-wide
significance was assessed using a FDR-based method.
Cell Lines and Reagents
Neuroblastoma cell lines were obtained from ATCC. Cells were grown in RPMI
media with 10% fetal bovine serum and antibiotics, with the exception of
SK-N-BE(2) (Dulbecco’s modified Eagle’s medium [DMEM]/F12, 10% serum)
and IMR-32 (DMEM, 10% serum plus nonessential amino acids). Nor-NOHA
n Neuroblastomas
ble at http://home.ccr.cancer.gov/oncology/oncogenomics) are shown for (A)
(G) ARG1.
t along the x axis, showing relatively homogeneous expression levels.
ors

Figure 5. ARG1 Inhibition and GABA Activation Suppress Neuroblastoma Cell Growth and Survival
(A) Expression of ARG1, GABA-A, andGABA-B receptors in neuroblastoma cell lines. Cell lines (as indicated) were harvested, lysed, and analyzed bywestern blot
using the antisera indicated.
(B) WST-1 assay showing a dose-dependent decrease in viability following 72 hr treatment of neuroblastoma cells with varying doses of the ARG1 inhibitor
nor-NOHA.
(C) LAN5 cells were transfected with either control or ARG1 siRNA. Cell viability was measured by WST-1. Apoptosis was measured by flow cytometry for the
apoptotic marker annexin V. An aliquot of cells was analyzed by immunoblot using the antisera indicated.
(D) LAN-5-pBABE-vector and LAN-5-pBABE-ARG1 cells were treated with DMSO or with the GABA-A agonist QHii066. Cell viability, apoptosis, and protein
markers were measured as in (C).
(E) LAN-5 cells were treated with the GABA-A agonist QHii066 for 3 days. Cell viability, apoptosis, and protein markers were measured as in (C).
In (B)–(E), the data shown are mean ± SD of triplicate measurements. NS, not significant versus control/vehicle using Student’s t test; *p < 0.05, ***p < 0.001.
See also Figure S4.
was obtained from Bachem and dissolved in DMSO. QHii066 was synthesized
at the University of Wisconsin-Milwaukee as described previously (United
States Patent US 7,119,196B2).
Cell R
Western Blotting
Equal amounts of total protein were loaded for 4%–12% SDS-PAGE and
transferred to nitrocellulose membranes. After blocking, the membranes
eports 9, 1034–1046, November 6, 2014 ª2014 The Authors 1043
were blotted with ARG1 (R&D Systems), GABA B R1, Erk (Santa Cruz Biotech),
GABA A Rb2/3, GABA B R2, b-tubulin (Millipore), cleaved-PARP (Asp214),
p-Akt (Ser473), Akt, pErk (Thr202/Tyr204) (Cell Signaling Technology), and
GAPDH (Upstate Biotechnology). Antibodies were detected with horseradish
peroxidase-linked anti-mouse, anti-rabbit (Amersham/GE), or anti-sheep
immunoglobulin G (Calbiochem/EMD) followed by enhanced chemilumines-
cence (Amersham/GE).
siRNA Transfection
Control siRNA (Santa Cruz Biotechnology) and Arg1 siRNA (Dharmacon) were
transfected using Lipofectamine 2000 (Invitrogen). Cells were harvested for
analysis after 72 hr.
Retroviral Transduction
Human ARG1 cDNA was obtained from the I.M.A.G.E. Consortium, cloned
into pENTR4 vector (Invitrogen), and then subcloned into a GATEWAY-
compatible pBABE vector. To generate retrovirus, the packaging cell
line HEK293T was cotransfected with pBABE vector or pBABE-ARG1, along
with plasmids expressing gag/pol and vesicular stomatitis virus glyco-
protein, using Effectene transfection reagent (QIAGEN). At 48 hr posttrans-
fection, the viral supernatants were filtered and used to infect cells. LAN-5
and Kelly cells were transduced and selected for 2 weeks with 0.5 mg/ml
puromycin. Cells were harvested for analysis after 72 hr of subsequent
treatment.
Viability
Cells were seeded in 12-well plates and treated as indicated for 48 hr. Viability
was determined using the WST-1 assay (Roche) and analyzed by spectropho-
tometric analysis (absorbance at 450 nm) after 60 min.
Flow Cytometry
Cells were plated on six-well dishes and treated as indicated for 24 hr.
They were then harvested, fixed in 70% ethanol for 30 min, and stained with
5 mg/ml propidium iodide containing 125 U/ml RNase. All samples were
analyzed on a FACSCaliber flow cytometer (Becton Dickinson) and DNA histo-
grams were modeled offline using ModFit-LT (Verity Software). Apoptosis was
detected by flow cytometry for annexin V-FITC (Annexin V-FITC Detection Kit;
BioVision) according to the manufacturer’s protocol, using FlowJo software
(Tree Star).
ACCESSION NUMBERS
The GEO accession number for the microarray data reported in this paper is
GSE59675.
SUPPLEMENTAL INFORMATION
Supplemental Information includes four figures and four tables and can
be found with this article online at http://dx.doi.org/10.1016/j.celrep.2014.
09.046.
AUTHOR CONTRIBUTIONS
C.S.H. performed the majority of the experiments and data analysis. D.A.Q.
performed the eQTL and statistical analysis and helped prepare the manu-
script. R.A.W., C.C., J.C., W.C.G., and Y.B. performed biochemical assays.
D.D.G., W.C.G., and K.N. assisted with mouse work. L.P., J.C., J.M., and
P.K. provided technical support for genotyping data generation and analysis.
Y.K.S., J.S.W., J.C., S.K., T.V.D., and J.K. provided technical support for
expression array data generation and analysis. S.K.R. synthesized QHii066.
J.M.C. and Y.-J.C. helped design biochemical experiments. A.B., J.K.,
Y.-J.C., J.M.C., and T.V.D. helped design experiments and prepare the manu-
script. W.A.W. supervised the project. Q.F. supervised and performed the
majority of the in vitro analyses. C.S.H. and W.A.W. designed experiments
and wrote the paper.
1044 Cell Reports 9, 1034–1046, November 6, 2014 ª2014 The Auth
ACKNOWLEDGMENTS
The authors are grateful to the Marshfield Clinic and CIDR for genotyping, and
to Fernando Pardo Manuel de Villena, Gary Churchill, Saunak Sen, Denise
Lind, and Roger Nicoll for experimental advice and comments on the manu-
script. This work was supported by the March of Dimes; the Concern Founda-
tion; the UCSF Academic Senate; NIH R01CA102321, R01NS055750,
P30CA82103, U01CA176287, and an ARRA supplement for R01NS055750
(to W.A.W.); and NIH R01MH046851, MH096463, and NS076517 (to J.M.C.).
Received: March 12, 2014
Revised: August 14, 2014
Accepted: September 25, 2014
Published: October 23, 2014
REFERENCES
Andang, M., Hjerling-Leffler, J., Moliner, A., Lundgren, T.K., Castelo-Branco,
G., Nanou, E., Pozas, E., Bryja, V., Halliez, S., Nishimaru, H., et al. (2008). His-
tone H2AX-dependent GABA(A) receptor regulation of stem cell proliferation.
Nature 451, 460–464.
Asgharzadeh, S., Pique-Regi, R., Sposto, R., Wang, H., Yang, Y., Shimada, H.,
Matthay, K., Buckley, J., Ortega, A., and Seeger, R.C. (2006). Prognostic
significance of gene expression profiles of metastatic neuroblastomas lacking
MYCN gene amplification. J. Natl. Cancer Inst. 98, 1193–1203.
Bak, S.P., Alonso, A., Turk, M.J., and Berwin, B. (2008). Murine ovarian cancer
vascular leukocytes require arginase-1 activity for T cell suppression. Mol.
Immunol. 46, 258–268.
Bell, P.A., Chaturvedi, S., Gelfand, C.A., Huang, C.Y., Kochersperger, M.,
Kopla, R., Modica, F., Pohl, M., Varde, S., Zhao, R., et al. (2002). SNPstream
UHT: ultra-high throughput SNP genotyping for pharmacogenomics and
drug discovery. Biotechniques, 70–72, 74, 76–77.
Bello-Fernandez, C., Packham, G., and Cleveland, J.L. (1993). The ornithine
decarboxylase gene is a transcriptional target of c-Myc. Proc. Natl. Acad.
Sci. USA 90, 7804–7808.
Brem, R.B., Yvert, G., Clinton, R., and Kruglyak, L. (2002). Genetic dissection
of transcriptional regulation in budding yeast. Science 296, 752–755.
Brodeur, G.M., Seeger, R.C., Schwab, M., Varmus, H.E., and Bishop, J.M.
(1984). Amplification of N-myc in untreated human neuroblastomas correlates
with advanced disease stage. Science 224, 1121–1124.
Broman, K.W., Wu, H., Sen, S., and Churchill, G.A. (2003). R/qtl: QTL mapping
in experimental crosses. Bioinformatics 19, 889–890.
Capasso, M., Devoto, M., Hou, C., Asgharzadeh, S., Glessner, J.T., Attiyeh,
E.F., Mosse, Y.P., Kim, C., Diskin, S.J., Cole, K.A., et al. (2009). Common var-
iations in BARD1 influence susceptibility to high-risk neuroblastoma. Nat.
Genet. 41, 718–723.
Chesler, L., Goldenberg, D.D., Seales, I.T., Satchi-Fainaro, R., Grimmer, M.,
Collins, R., Struett, C., Nguyen, K.N., Kim, G., Tihan, T., et al. (2007). Malignant
progression and blockade of angiogenesis in a murine transgenic model of
neuroblastoma. Cancer Res. 67, 9435–9442.
Ciani, E., Severi, S., Contestabile, A., Bartesaghi, R., and Contestabile, A.
(2004). Nitric oxide negatively regulates proliferation and promotes neuronal
differentiation through N-Myc downregulation. J. Cell Sci. 117, 4727–4737.
Crawford, N.P., Alsarraj, J., Lukes, L., Walker, R.C., Officewala, J.S., Yang,
H.H., Lee, M.P., Ozato, K., and Hunter, K.W. (2008a). Bromodomain 4
activation predicts breast cancer survival. Proc. Natl. Acad. Sci. USA 105,
6380–6385.
Crawford, N.P., Walker, R.C., Lukes, L., Officewala, J.S., Williams, R.W., and
Hunter, K.W. (2008b). The Diasporin Pathway: a tumor progression-related
transcriptional network that predicts breast cancer survival. Clin. Exp. Metas-
tasis 25, 357–369.
De Deyn, P.P., Marescau, B., and Macdonald, R.L. (1991). Guanidino com-
pounds that are increased in hyperargininemia inhibit GABA and glycine
responses on mouse neurons in cell culture. Epilepsy Res. 8, 134–141.
ors

Deignan, J.L., Marescau, B., Livesay, J.C., Iyer, R.K., De Deyn, P.P., Ceder-
baum, S.D., and Grody, W.W. (2008). Increased plasma and tissue guanidino
compounds in a mouse model of hyperargininemia. Mol. Genet. Metab. 93,
172–178.
Diskin, S.J., Capasso, M., Schnepp, R.W., Cole, K.A., Attiyeh, E.F., Hou, C.,
Diamond, M., Carpenter, E.L., Winter, C., Lee, H., et al. (2012). Common
variation at 6q16 within HACE1 and LIN28B influences susceptibility to neuro-
blastoma. Nat. Genet. 44, 1126–1130.
Durante,W., Johnson, F.K., and Johnson, R.A. (2007). Arginase: a critical regu-
lator of nitric oxide synthesis and vascular function. Clin. Exp. Pharmacol.
Physiol. 34, 906–911.
Ewart-Toland, A., Briassouli, P., de Koning, J.P., Mao, J.H., Yuan, J., Chan, F.,
MacCarthy-Morrogh, L., Ponder, B.A., Nagase, H., Burn, J., et al. (2003). Iden-
tification of Stk6/STK15 as a candidate low-penetrance tumor-susceptibility
gene in mouse and human. Nat. Genet. 34, 403–412.
Gerner, E.W., and Meyskens, F.L., Jr. (2004). Polyamines and cancer: old mol-
ecules, new understanding. Nat. Rev. Cancer 4, 781–792.
Gilbert, S.L., Zhang, L., Forster, M.L., Anderson, J.R., Iwase, T., Soliven, B.,
Donahue, L.R., Sweet, H.O., Bronson, R.T., Davisson, M.T., et al. (2006).
Trak1 mutation disrupts GABA(A) receptor homeostasis in hypertonic mice.
Nat. Genet. 38, 245–250.
Gray, P.W., Glaister, D., Seeburg, P.H., Guidotti, A., and Costa, E. (1986).
Cloning and expression of cDNA for human diazepam binding inhibitor, a nat-
ural ligand of an allosteric regulatory site of the gamma-aminobutyric acid type
A receptor. Proc. Natl. Acad. Sci. USA 83, 7547–7551.
Hackett, C.S., Hodgson, J.G., Law, M.E., Fridlyand, J., Osoegawa, K., de
Jong, P.J., Nowak, N.J., Pinkel, D., Albertson, D.G., Jain, A., et al. (2003).
Genome-wide array CGH analysis of murine neuroblastoma reveals distinct
genomic aberrations which parallel those in human tumors. Cancer Res. 63,
5266–5273.
Hale, G., Gula, M.J., and Blatt, J. (1994). Impact of gender on the natural
history of neuroblastoma. Pediatr. Hematol. Oncol. 11, 91–97.
He, X., Huang, Q., Ma, C., Yu, S., McKernan, R., and Cook, J.M. (2000).
Pharmacophore/receptor models for GABA(A)/BzR alpha2beta3gamma2,
alpha3beta3gamma2 and alpha4beta3gamma2 recombinant subtypes.
Included volume analysis and comparison to alpha1beta3gamma2, alpha5-
beta3gamma2, and alpha6beta3gamma2 subtypes. Drug Des. Discov. 17,
131–171.
Hogarty, M.D., Norris, M.D., Davis, K., Liu, X., Evageliou, N.F., Hayes, C.S.,
Pawel, B., Guo, R., Zhao, H., Sekyere, E., et al. (2008). ODC1 is a critical
determinant of MYCN oncogenesis and a therapeutic target in neuroblastoma.
Cancer Res. 68, 9735–9745.
Hsu, T.M., Chen, X., Duan, S., Miller, R.D., and Kwok, P.Y. (2001). Universal
SNP genotyping assay with fluorescence polarization detection. Bio-
techniques 31, 560, 562, 564–568, passim.
Huang, Q., He, X., Ma, C., Liu, R., Yu, S., Dayer, C.A., Wenger, G.R.,
McKernan, R., and Cook, J.M. (2000). Pharmacophore/receptor models for
GABA(A)/BzR subtypes (alpha1beta3gamma2, alpha5beta3gamma2, and
alpha6beta3gamma2) via a comprehensive ligand-mapping approach.
J. Med. Chem. 43, 71–95.
Huang, Y., Higginson, D.S., Hester, L., Park, M.H., and Snyder, S.H. (2007).
Neuronal growth and survival mediated by eIF5A, a polyamine-modified
translation initiation factor. Proc. Natl. Acad. Sci. USA 104, 4194–4199.
Janoueix-Lerosey, I., Lequin, D., Brugieres, L., Ribeiro, A., de Pontual, L.,
Combaret, V., Raynal, V., Puisieux, A., Schleiermacher, G., Pierron, G., et al.
(2008). Somatic and germline activating mutations of the ALK kinase receptor
in neuroblastoma. Nature 455, 967–970.
Jenkins, D.C., Charles, I.G., Thomsen, L.L., Moss, D.W., Holmes, L.S., Baylis,
S.A., Rhodes, P., Westmore, K., Emson, P.C., and Moncada, S. (1995). Roles
of nitric oxide in tumor growth. Proc. Natl. Acad. Sci. USA 92, 4392–4396.
Koomoa, D.L., Yco, L.P., Borsics, T.,Wallick, C.J., andBachmann, A.S. (2008).
Ornithine decarboxylase inhibition by alpha-difluoromethylornithine activates
Cell R
opposing signaling pathways via phosphorylation of both Akt/protein kinase
B and p27Kip1 in neuroblastoma. Cancer Res. 68, 9825–9831.
La Merrill, M., Gordon, R.R., Hunter, K.W., Threadgill, D.W., and Pomp, D.
(2010). Dietary fat alters pulmonary metastasis of mammary cancers through
cancer autonomous and non-autonomous changes in gene expression. Clin.
Exp. Metastasis 27, 107–116.
Le-Corronc, H., Rigo, J.M., Branchereau, P., and Legendre, P. (2011).
GABA(A) receptor and glycine receptor activation by paracrine/autocrine
release of endogenous agonists: more than a simple communication pathway.
Mol. Neurobiol. 44, 28–52.
MacPhee, M., Chepenik, K.P., Liddell, R.A., Nelson, K.K., Siracusa, L.D., and
Buchberg, A.M. (1995). The secretory phospholipase A2 gene is a candidate
for the Mom1 locus, a major modifier of ApcMin-induced intestinal neoplasia.
Cell 81, 957–966.
Mao, J.H., Saunier, E.F., de Koning, J.P., McKinnon, M.M., Higgins, M.N.,
Nicklas, K., Yang, H.T., Balmain, A., and Akhurst, R.J. (2006). Genetic variants
of Tgfb1 act as context-dependent modifiers of mouse skin tumor susceptibil-
ity. Proc. Natl. Acad. Sci. USA 103, 8125–8130.
Mosse, Y.P., Laudenslager, M., Khazi, D., Carlisle, A.J., Winter, C.L., Rappa-
port, E., and Maris, J.M. (2004). Germline PHOX2B mutation in hereditary
neuroblastoma. Am. J. Hum. Genet. 75, 727–730.
Mosse,Y.P., Laudenslager,M.,Longo,L.,Cole,K.A.,Wood,A.,Attiyeh,E.F., La-
quaglia,M.J.,Sennett, R., Lynch, J.E.,Perri, P., et al. (2008). IdentificationofALK
as a major familial neuroblastoma predisposition gene. Nature 455, 930–935.
Nguyen, leB.,Diskin,S.J.,Capasso,M.,Wang,K.,Diamond,M.A.,Glessner, J.,
Kim, C., Attiyeh, E.F., Mosse, Y.P., Cole, K., et al. (2011). Phenotype restricted
genome-wide association study using a gene-centric approach identifies three
low-risk neuroblastoma susceptibility loci. PLoS Genet. 7, e1002026.
Park, Y.G., Zhao, X., Lesueur, F., Lowy, D.R., Lancaster, M., Pharoah, P., Qian,
X., and Hunter, K.W. (2005). Sipa1 is a candidate for underlying the metastasis
efficiency modifier locus Mtes1. Nat. Genet. 37, 1055–1062.
Quigley, D.A., To, M.D., Perez-Losada, J., Pelorosso, F.G., Mao, J.H., Nagase,
H., Ginzinger, D.G., and Balmain, A. (2009). Genetic architecture of mouse skin
inflammation and tumour susceptibility. Nature 458, 505–508.
Roberts, S.S., Mori, M., Pattee, P., Lapidus, J., Mathews, R., O’Malley, J.P.,
Hsieh, Y.C., Turner, M.A., Wang, Z., Tian, Q., et al. (2004). GABAergic system
gene expression predicts clinical outcome in patients with neuroblastoma.
J. Clin. Oncol. 22, 4127–4134.
Schadt, E.E., Monks, S.A., Drake, T.A., Lusis, A.J., Che, N., Colinayo, V., Ruff,
T.G., Milligan, S.B., Lamb, J.R., Cavet, G., et al. (2003). Genetics of gene
expression surveyed in maize, mouse and man. Nature 422, 297–302.
Schwab, M., Varmus, H.E., Bishop, J.M., Grzeschik, K.H., Naylor, S.L., Saka-
guchi, A.Y., Brodeur, G., and Trent, J. (1984). Chromosome localization in
normal human cells and neuroblastomas of a gene related to c-myc. Nature
308, 288–291.
Singh, R., Pervin, S., Karimi, A., Cederbaum, S., and Chaudhuri, G. (2000).
Arginase activity in human breast cancer cell lines: N(omega)-hydroxy-L-argi-
nine selectively inhibits cell proliferation and induces apoptosis in MDA-MB-
468 cells. Cancer Res. 60, 3305–3312.
Tenu, J.P., Lepoivre, M., Moali, C., Brollo, M., Mansuy, D., and Boucher, J.L.
(1999). Effects of the new arginase inhibitor N(omega)-hydroxy-nor-L-
arginine on NO synthase activity in murine macrophages. Nitric Oxide 3,
427–438.
Trochet, D., Bourdeaut, F., Janoueix-Lerosey, I., Deville, A., de Pontual, L.,
Schleiermacher, G., Coze, C., Philip, N., Frebourg, T., Munnich, A., et al.
(2004). Germline mutations of the paired-like homeobox 2B (PHOX2B) gene
in neuroblastoma. Am. J. Hum. Genet. 74, 761–764.
Tusher, V.G., Tibshirani, R., and Chu, G. (2001). Significance analysis of micro-
arrays applied to the ionizing radiation response. Proc. Natl. Acad. Sci. USA
98, 5116–5121.
Wakabayashi, Y., Mao, J.H., Brown, K., Girardi, M., and Balmain, A. (2007).
Promotion of Hras-induced squamous carcinomas by a polymorphic variant
of the Patched gene in FVB mice. Nature 445, 761–765.
eports 9, 1034–1046, November 6, 2014 ª2014 The Authors 1045

Wang, K., Diskin, S.J., Zhang, H., Attiyeh, E.F., Winter, C., Hou, C., Schnepp,
R.W., Diamond, M., Bosse, K., Mayes, P.A., et al. (2011). Integrative genomics
identifies LMO1 as a neuroblastoma oncogene. Nature 469, 216–220.
Weiss, W.A., Aldape, K., Mohapatra, G., Feuerstein, B.G., and Bishop, J.M.
(1997). Targeted expression of MYCN causes neuroblastoma in transgenic
mice. EMBO J. 16, 2985–2995.
Yachimovich-Cohen, N., Even-Ram, S., Shufaro, Y., Rachmilewitz, J., and
Reubinoff, B. (2010). Human embryonic stem cells suppress T cell responses
via arginase I-dependent mechanism. J. Immunol. 184, 1300–1308.
Yang, X., Deignan, J.L., Qi, H., Zhu, J., Qian, S., Zhong, J., Torosyan, G., Majid,
S., Falkard, B., Kleinhanz, R.R., et al. (2009). Validation of candidate causal
1046 Cell Reports 9, 1034–1046, November 6, 2014 ª2014 The Auth
genes for obesity that affect shared metabolic pathways and networks. Nat.
Genet. 41, 415–423.
Yu, H., Iyer, R.K., Kern, R.M., Rodriguez, W.I., Grody, W.W., and Cederbaum,
S.D. (2001). Expression of arginase isozymes inmouse brain. J. Neurosci. Res.
66, 406–422.
Yu, H., Iyer, R.K., Yoo, P.K., Kern, R.M., Grody, W.W., and Cederbaum, S.D.
(2002). Arginase expression in mouse embryonic development. Mech. Dev.
115, 151–155.
Yu, H., Yoo, P.K., Aguirre, C.C., Tsoa, R.W., Kern, R.M., Grody, W.W., Ceder-
baum, S.D., and Iyer, R.K. (2003). Widespread expression of arginase I in
mouse tissues. Biochemical and physiological implications. J. Histochem.
Cytochem. 51, 1151–1160.
ors
Copyright © 2022 FDOKUMEN


![Characterisation and partial purification of the GABA B receptor from the rat cerebellum using the novel antagonist [3H] CGP 62349](https://static.fdokumen.com/doc/165x107/63362dc6cd4bf2402c0b64b8/characterisation-and-partial-purification-of-the-gaba-b-receptor-from-the-rat-cerebellum.jpg)