Quantitative Resistance to Phytophthora infestans in Potato: A Case Study for QTL Mapping in an...
11
Copyright 0 1994 by the Genetics Society of America Quantitative Resistance to Phytophthora infestans in Potato: A Case Study for QTL Mapping in an Allogamous Plant Species C. Leonards-Schippers," W. Gieffers," R. Schiifer-Pregl,* E. Ritter,+ S. J. Knapp,: F. Salamini* and C. Gebhardt" *Max-Planck-Znstitut f u r Zuchtungsforschung, 0-50829 Koln, Germany, +Centra de Znvestigacion y Mejora Agraria (CZMA), Granja Modelo de Arkaute (Alava), E-01080 Vitoria-Gasteir, Spain, and fDepartment of Crop and Soil Science, Oregon StateUniversity,Cowallis, Oregon 97331 Manuscript received April 23, 1993 Accepted for publication January 8, 1994 ABSTRACT Phytophthora infestans is the most important fungal pathogen in the cultivated potato (Solanum tuberosum). Dominant, race-specific resistance alleles and quantitative resistance-the latter being more important for potato breeding- are found in the germplasm of cultivated and wildpotato species. Quan- titative trait loci (QTLs) for resistance to two races of P. infestans have been mapped in an F, progeny of a cross between non-inbred diploid potato parents with multiple alleles. Interval mapping methods based on highly informative restriction fragment length polymorphism markers revealed 11 chromosome segments on 9 potato chromosomes showing significant contrasts between marker genotypic classes. Whereas phenotypically no difference in quantitative resistance response was observed between the two fungal races, QTL mapping identified at least one race specific QT locus. Two QT regions coincided with two small segments on chromosomes Vand XZI to which the dominant alleles R1, conferring race specific resistance to P. infestans, Rxl and Rx2, both inducing extreme resistance to potato virus X, have been allocated inindependent mapping experiments. Some minor QTLs were correlated with genetic loci for specific proteins related to pathogenesis, the expression of which is induced after infection with P. infestans. T HE quantitative variation observed for the majority of phenotypic characters in plants is caused by poly- genic systems frequently interacting with the environ- ment (JOHANNSEN 1909; NILSSON-EHLE 1909). Genetic loci acting collectively on the expression of a trait have been termed quantitative trait loci, QTLs (GELDERMANN 1975). The quantitative effects of QTLs make them in- accessible to direct Mendelian analysis. However, when marker loci segregatingwith Mendelian ratios are linked to a QTL, the chromosomal position and the phenotypic contribution of the QTL can be determined (THODAY 1961). The approach is limited by the availability of a sufficient number of Mendelian markers. The advent of molecular markers, such as isoenzymes, and restriction fragment length polymorphism (RFLPs), greatly facili- tated the genetic analysis of QTLs, as these markers, par- ticularly RFLPs, are in most cases phenotypically neutral, numerous and environmentally independent. The pio- neering QTL mapping experiments in plants making use of molecular markers were performed in maize and tomato on F2 or backcross populations derived from pure lines (TANKSLEY et al. 1982; OSBORN et al. 1987; NIENHUIS et al. 1987;PATERSON et al. 1988; EDWARDS et al. 1987, 1992; STUBER et al. 1992). The cultivated potato (Solanumtuberosum ssp. tu- berosum) is a highly heterozygous tetraploid plant show- ing tetrasomic inheritance. When reduced to the dip- loid level, the potato is largely self-incompatible. Genetics 137: 67-77 (May, 1994) Moreover, the high genetic load present in this vegeta- tively reproduced species precludes the routine produc- tion of inbred lines and hence F, or backcrosses among them. Despite these limitations, we show in this study how the detection and mapping of QTLs is possible when segregating F, populations from crosses between heterozygous diploid potato lines, a detailed RFLP link- age map (GEBHARDT et al. 1991) and highly informative RFLP markers are available. The trait chosen was quantitative resistance to Phyto- phthora infestans, which is the most important fungal pathogen of the cultivated potato. Epidemics of P. in- festans cause heavy losses in yield. The fungus is cur- rently controlled by frequent applications of fungicides. However, this creates environmental concern and con- tributes to the emergence of resistant isolates (COHEN and REWENI 1983). Since the beginning of this century, much effort has been devoted to breeding for resistance to P. infestans (reviewed in WASTIE 1991). A number of dominant alleles conferring race-specific resistance con- trolled by single loci (R genes) have been introduced into cultivars from the wild species Solanum demissum. This type of resistance was overcome soon by new races of the fungus having virulence alleles compatible with the resistance alleles of the cultivars. Current breeding strategies concentrate,therefore, on improving hori- zontal, race-unspecific resistance which is polygenically inherited and for which selection is difficult (WASTIE
-
Upload
independent -
Category
Documents
-
view
1 -
download
0
Transcript of Quantitative Resistance to Phytophthora infestans in Potato: A Case Study for QTL Mapping in an...

Copyright 0 1994 by the Genetics Society of America
Quantitative Resistance to Phytophthora infestans in Potato: A Case Study for QTL Mapping in an Allogamous Plant Species
C. Leonards-Schippers," W. Gieffers," R. Schiifer-Pregl,* E. Ritter,+ S. J. Knapp,: F. Salamini* and C. Gebhardt"
*Max-Planck-Znstitut f u r Zuchtungsforschung, 0-50829 Koln, Germany, +Centra de Znvestigacion y Mejora Agraria (CZMA), Granja Modelo de Arkaute (Alava), E-01080 Vitoria-Gasteir, Spain, and fDepartment of Crop and Soil Science, Oregon
State University, Cowallis, Oregon 97331 Manuscript received April 23, 1993
Accepted for publication January 8, 1994
ABSTRACT Phytophthora infestans is the most important fungal pathogen in the cultivated potato (Solanum
tuberosum). Dominant, race-specific resistance alleles and quantitative resistance-the latter being more important for potato breeding- are found in the germplasm of cultivated and wild potato species. Quan- titative trait loci (QTLs) for resistance to two races of P . infestans have been mapped in an F, progeny of a cross between non-inbred diploid potato parents with multiple alleles. Interval mapping methods based on highly informative restriction fragment length polymorphism markers revealed 11 chromosome segments on 9 potato chromosomes showing significant contrasts between marker genotypic classes. Whereas phenotypically no difference in quantitative resistance response was observed between the two fungal races, QTL mapping identified at least one race specific QT locus. Two QT regions coincided with two small segments on chromosomes Vand XZI to which the dominant alleles R1, conferring race specific resistance to P. infestans, Rxl and Rx2, both inducing extreme resistance to potato virus X, have been allocated in independent mapping experiments. Some minor QTLs were correlated with genetic loci for specific proteins related to pathogenesis, the expression of which is induced after infection with P. infestans.
T HE quantitative variation observed for the majority of phenotypic characters in plants is caused by poly-
genic systems frequently interacting with the environ- ment (JOHANNSEN 1909; NILSSON-EHLE 1909). Genetic loci acting collectively on the expression of a trait have been termed quantitative trait loci, QTLs (GELDERMANN 1975). The quantitative effects of QTLs make them in- accessible to direct Mendelian analysis. However, when marker loci segregatingwith Mendelian ratios are linked to a QTL, the chromosomal position and the phenotypic contribution of the QTL can be determined (THODAY 1961). The approach is limited by the availability of a sufficient number of Mendelian markers. The advent of molecular markers, such as isoenzymes, and restriction fragment length polymorphism (RFLPs), greatly facili- tated the genetic analysis of QTLs, as these markers, par- ticularly RFLPs, are in most cases phenotypically neutral, numerous and environmentally independent. The pio- neering QTL mapping experiments in plants making use of molecular markers were performed in maize and tomato on F2 or backcross populations derived from pure lines (TANKSLEY et al. 1982; OSBORN et al . 1987; NIENHUIS et al. 1987; PATERSON et al. 1988; EDWARDS et al. 1987, 1992; STUBER et al. 1992).
The cultivated potato (Solanum tuberosum ssp. tu- berosum) is a highly heterozygous tetraploid plant show- ing tetrasomic inheritance. When reduced to the dip- loid level, the potato is largely self-incompatible.
Genetics 137: 67-77 (May, 1994)
Moreover, the high genetic load present in this vegeta- tively reproduced species precludes the routine produc- tion of inbred lines and hence F, or backcrosses among them. Despite these limitations, we show in this study how the detection and mapping of QTLs is possible when segregating F, populations from crosses between heterozygous diploid potato lines, a detailed RFLP link- age map (GEBHARDT et al . 1991) and highly informative RFLP markers are available.
The trait chosen was quantitative resistance to Phyto- phthora infestans, which is the most important fungal pathogen of the cultivated potato. Epidemics of P. in- festans cause heavy losses in yield. The fungus is cur- rently controlled by frequent applications of fungicides. However, this creates environmental concern and con- tributes to the emergence of resistant isolates (COHEN and REWENI 1983). Since the beginning of this century, much effort has been devoted to breeding for resistance to P. infestans (reviewed in WASTIE 1991). A number of dominant alleles conferring race-specific resistance con- trolled by single loci ( R genes) have been introduced into cultivars from the wild species Solanum demissum. This type of resistance was overcome soon by new races of the fungus having virulence alleles compatible with the resistance alleles of the cultivars. Current breeding strategies concentrate, therefore, on improving hori- zontal, race-unspecific resistance which is polygenically inherited and for which selection is difficult (WASTIE
68 C. Leonards-Schippers et al.
1991). The relationships between the genetic factors controlling qualitative and quantitative resistance to P. infestans are unknown.
The identification of the map positions and of RFLP marker probes linked to qualitative (LEONARDS~CHIPPERS et al. 1992) and quantitative resistance genes is, there- fore, an essential step toward identifying better breeding strategies for P. infestans resistance based on marker- assisted selection.
MATERIALS AND METHODS
Plant material: Crossing the diploid potato lines H82.368/3 (line 49 in GEBNARDT et al. 1989) as female parent and H80.696/4 (line 40, GEBHARDT et al. 1989 and BARONE et al. 1990) as male parent resulted in 197 F,,plants. H82.368/3 is referred to as P49 in this report and was hlghlyresistant to both P. infestans races 0 and 1 (mean percent infection 3.5 ? 3%) under the conditions of the infection test. H80.696/4 is re- ferred to as P40 and was susceptible to races 0 and 1 (mean percent infection 65 2 13%). Parents and progeny used for quantitative resistance tests to P. infestans were grown in a controlled environment chamber (BBC) at 17",14 hr light and between ca. 70 and 100% relative humidity.
For DNA extraction, ca. 10 g leaves and shoots were har- vested from plants grown in the greenhouse, frozen in liquid nitrogen, freeze dried and stored at -20".
P. infestuns races: P. infestans race 0 was used for the test series TOa and TOb. Race 0 was obtained originally from H. R. HOHL (University of Zurich, Switzerland). P. infestans race 1 was used in the test series Tla and Tlb. It was provided by B. SCHOBER (Biologische Bundesanstalt, Braunschweig, Germany). Both races were verified on the Netherlands dif- ferential test set kindly provided by L. J. TURKENSTEEN ( D L 0 Research Institute for Plant Protection, Wageningen, The Netherlands). P. infestans races were propagated as described in LEONARDS-SCHIPPERS et al. (1992).
Rm9 analysis: DNA extraction, restriction digests, electro- phoresis, blotting and hybridization procedures were as de- scribed previously (GEBHARDT et al. 1989; LEONARD~CHIPPERS et al. 1992). The restriction enzymes TaqI, RsaI and AluI (Boehringer Mannheim; GIBCO/BRL, Gaithersburg, Mary- land) were used according to the supplier's instructions. Fil- ters onto which restricted genomic DNA of parents and F, plants had been transferred were hybridized to the radiola- beled inserts of the plasmids of 102 RFLP marker clones map- ping to the 12 linkage groups of potato (GEBHARDT et al. 1991; unpublished results from this laboratory). CP and GP marker probes were derived from potato cDNA and genomic DNA, respectively. TG markers originated from genomic tomato DNA and were kindly provided by S. D. TANKSLEY (Cornel1 Uni- versity, Ithaca, New York). P-Gluc was mapped with a cDNA clone coding for 1,3-&lucanase of potato and was provided by E. KOMBRINK (MPI fur Zuchtungsforschung, Koln, Ger- many). PC1 16 and prpl were mapped with two cDNA clones of potato which had been identified by differentially screening (infected us. noninfected) a cDNA library of potato leaves in- fected with an incompatible race of P. infestans (TAYLOR et al. 1990). The WUNl locus is based on a cDNA clone of potato whose mRNA is induced after wounding (LOGEMANN et al. 1988).
Test for quantitative resistance to P. infestuns: A leaf disc bioassay was used (GIEFFERS et al. 1989; LEONARD~CHIPPERS et al. 1992) which was a modification of the leaf disc bioassay developed by HODGSON (1961). In each of four test series eight leaf discs per genotype were inoculated, each with three 10-pl
0% 100%
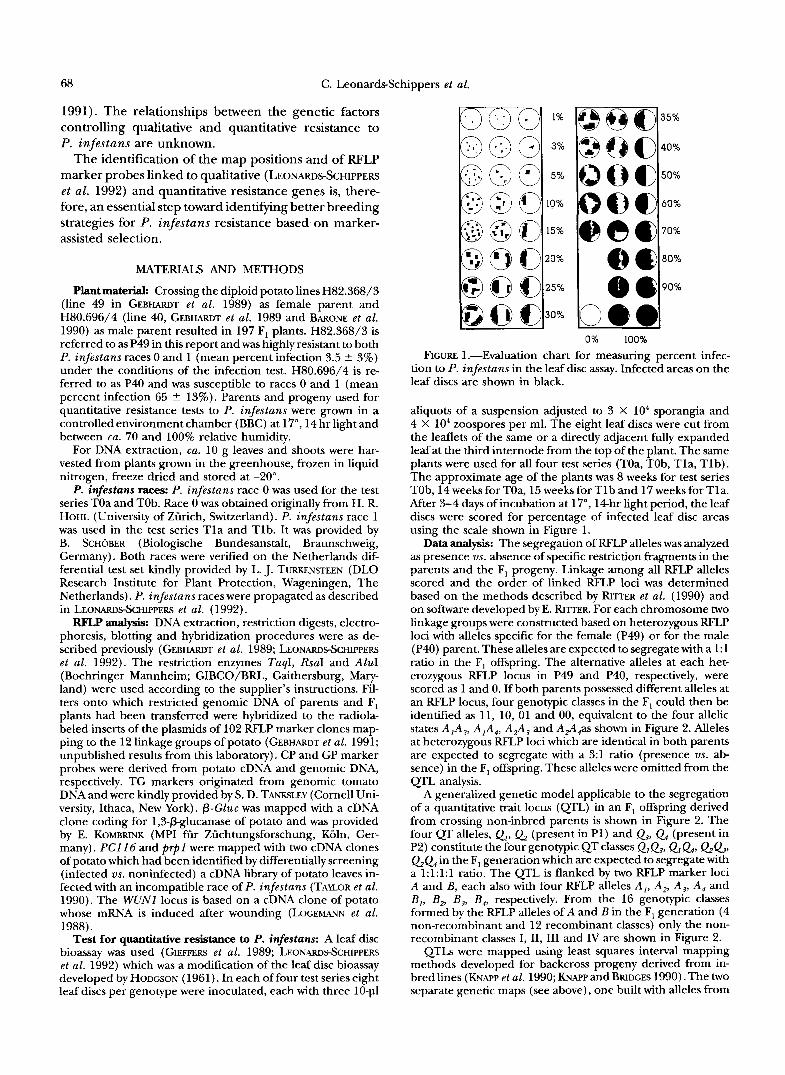
FIGURE 1.-Evaluation chart for measuring percent infec- tion to P. infestans in the leaf disc assay. Infected areas on the leaf discs are shown in black.
aliquots of a suspension adjusted to 3 X lo4 sporangia and 4 X lo4 zoospores per ml. The eight leaf discs were cut from the leaflets of the same or a directly adjacent fully expanded leaf at the third internode from the top of the plant. The same plants were used for all four test series (TOa, TOb, Tla, Tlb). The approximate age of the plants was 8 weeks for test series TOb, 14 weeks for TOa, 15 weeks for Tlb and 17 weeks for Tla. After 3-4 days of incubation at 17", 14hr light period, the leaf discs were scored for percentage of infected leaf disc areas using the scale shown in Figure 1.
Data analysis: The segregation of RFLP alleles was analyzed as presence us. absence of specific restriction fragments in the parents and the F, progeny. Linkage among all RFLP alleles scored and the order of linked RFLP loci was determined based on the methods described by RIITER et al. (1990) and on software developed by E. RITTER. For each chromosome two linkage groups were constructed based on heterozygous RFLP loci with alleles specific for the female (P49) or for the male (P40) parent. These alleles are expected to segregate with a 1:l ratio in the F, offspring. The alternative alleles at each het- erozygous RFLP locus in P49 and P40, respectively, were scored as 1 and 0. If both parents possessed different alleles at an RFLP locus, four genotypic classes in the F, could then be identified as 11, 10, 01 and 00, equivalent to the four allelic states A,A,, A,A,, A d , and AA,as shown in Figure 2. Alleles at heterozygous RFLP loci which are identical in both parents are expected to segregate with a 3:l ratio (presence us. ab- sence) in the F, offspring. These alleles were omitted from the QTL analysis.
A generalized genetic model applicable to the segregation of a quantitative trait locus (QTL) in an F, offspring derived from crossing non-inbred parents is shown in Figure 2. The four QT alleles, Q,, 42 (present in P1) and a, Q, (present in P2) constitute the four genotypic QT classes Q, Q3, Q, Q,, &a, (22% in the F, generation which are expected to segregate with a 1:l:l:l ratio. The QTL is flanked by two RFLP marker loci A and B, each also with four RFLP alleles A,, A,, A,, A, and B,, B,, B,, B,, respectively. From the 16 genotypic classes formed by the RFLP alleles of A and B in the F, generation (4 non-recombinant and 12 recombinant classes) only the non- recombinant classes I, 11, I11 and IV are shown in Figure 2.
QTLs were mapped using least squares interval mapping methods developed for backcross progeny derived from in- bred lines (KNMP et al. 1990; KNAPP and BRIDGES 1990). The two separate genetic maps (see above), one built with alleles from

QTL Mapping in Potato 69
Pl p2
1 : 1 : 1 : 1
(1) (11) (111) (W FIGURE 2."Genetic model for a QTL (4) flanked by the
marker loci A and Bin the heterozygous parents P1 and P2 and in the F, generation derived from them.
P1 (P49) and the other one with alleles from P2 (P40), are equivalent to reciprocal backcross maps. QTLs were interval- mapped separately in each of the two genetic maps. The hy- pothesis of no QTL was tested against the hypothesis of one QTL within each marker interval based on differences be- tween phenotypic means of marker genotypic classes.
The two non-recombinant marker genotypic classes of the backcross model (A,A,B,B, and A,A,B,B,) were substituted by the pooled marker genotypic classes I plus I1 and I11 plus IV (Figure 2) for marker intervals derived from P1 (P49). The two non-recombinant marker genotypic classes for marker in- tervals derived from P2 (P40) were formed by the pooled marker genotypic classes I plus I11 and I1 plus IV (Figure 2). The two recombinant marker genotypic classes of the back- cross model (A,A,B,B, and A A , B , B , ) were substituted ac- cordingly by the marker genotypic classes recombinant among the alleles A,, A,, B, and B, of the P1 parent and the marker genotypic classes recombinant among the alleles A,, A,, B3 and B, of the P2 parent, respectively. The QTL effects we estimated in each marker interval resulted, therefore, from the differ- ence between the QT alleles 4, and & of parent P1 in the presence of either Q, or rL, and, vice versa, from the difference between the QT alleles &and rL, of parent P2 in the presence of either Q, or &.
Parameters were estimated for the full model assuming one QTL between a pair of markers and the reduced model as- suming no QTL between the same pair of markers using least square methods in the NLIN procedure of the SAS/STAT soft- ware (KNAPP and BRIDGES 1990; SAS Institute Inc. 1989). The likelihood ratio L for testing the hypothesis of no QTL is
(SSE, - SSE,)/(d.f., - d.f.,) SSE,/d.f., L =
where SSE, and SSE, are the error sum of squares derived from the NLIN procedure for the full model and the reduced model, respectively, and d.f., and d.f., are the degrees of free- dom for the full model and the reduced model, respectively. d.f., and d.f., are given by N - PF and N - P,, where N is the number of valid observations and PF and PR are the numbers of the estimated parameters for the full model and the reduced model, respectively.
L is distributed as an F random variable, so that if L > Fu,d,f,N,d.f,F,O, where Fu,d,f,N,d.tF,;O is a critical value from the central Fdistribution and d.f., is d.f., - d.f.,, the hypothesis of no QTL can be rejected. The P value for a likelihood ratio
obtained is given by 1 - PROBF (L,d.f.,d.f.,O), where PROBF is an SAS function returning the probability that an observa- tion of an Fdistribution is less than or equal to L (SAS Institute Inc. 1990). The hypothesis of no QTL was rejected for P 5 0.05
The statistical software SPSS for Windows, version 5.0 (SPSS Inc. 1992) was used for the analysis of normal distributions and transformation of the quantitative resistance data. Analysis of variance was performed with the procedure ONEWAY of the same software. Paired t-tests were performed using SAS pro- grams (SAS Institute Inc. 1991).
(a 5 5 % ) .
RESULTS
Quantitative resistance to races 0 and 1 of P. infestans was determined in 197 F, plants. Four test series were performed on the parents and the F, progeny, two (TOa and TOb) with race 0 and two (Tla and Tlb) with race 1. Three additional datasets (TO, T1 and T01) were cre- ated by averaging the mean resistance values obtained for each genotype in test series TOa and TOb (TO), in Tla and Tlb (Tl) and in all four test series (T01). After the transformation
x' = arctan((x/llO)/vl - ((x/110) X (x/110)))
= arcsin(x/llO) with x = % infection
all datasets except the dataset TOb were normally dis- tributed according to the criteria of the Kolmogoroff- Smirnoff test (LILLIEFORS 1967; SACHS 1992). All seven distributions of transformed values exhibited negative skewness and also negative kurtosis ( SACHS 1992). The statistical parameters of the seven datasets are shown in Table 1 and the distributions of the combined datasets TO, T1, and TO1 are shown in Figure 3. The resistance levels of the parents P49 and P40 are also indicated in Table 1 and Figure 3. Whereas the resistant parent P49 was positioned at the left hand end of the distributions, the mean resistance of the susceptible parent P40 was close to the mean of the population. Based on the phe- notype of quantitative resistance to P. infestans, no dif- ference between race 1 and race 0 was observed.
The segregation of RFLP alleles was analyzed in 189 of the 197 F, individuals (8 were not available due to practical reasons) of the same population and in the parents P49 and P40. Southern blots were probed with a set of RFLP markers selected from the potato RFLP map (GEBHARDT et al. 1991; unpublished results from this laboratory). The markers were chosen according to equidistant map positions and informativity for both parents, taking into consideration the coverage of both parental genomes with RFLP marker loci. Two linkage maps were constructed: one with 77 RFLP alleles de- scending from P40 covering 1025 cM and another with 68 RFLP alleles descending from P49 and covering 1028 cM (Figure 4). The mean interval length was 14 cM. Thirty-four of 11 1 mapped loci (31 %) showed heterozy- gous RFLP alleles differing in both parents and allowed, therefore, the identification of the four possible geno-

70 C. Leonards-Schippers et al.
TABLE 1
Statistical parameters of transformed phenotypic values of the seven datasets in the parents P40, P49 and in the F, progeny
Parameter TOa TOb TO Tla Tlb T1 TO 1
Mean P40 0.720 0.478 0.594 0.591 0.555 0.581 0.588 Mean P49 0.077 0.035 0.056 0.044 0.039 0.042 Mean F, 0.642 0.638 0.639 0.645 0.659 0.652
0.049
Median 0.650 0.646
0.620 0.633 0.655 0.700 Standard deviation
0.693 0.271 0.286 0.224 0.305 0.275 0.249
0.654
Skewness 0.201
-0.258 -0.241 -0.151 -0.135 -0.234 Kurtosis
-0.283 -0.652
-0.182 -0.815 -0.533 -0.944 -0.756
Kolmogoroff-Smimoff level of significance >0.2 >0.2 >0.2 >0.2 >0.2 >0.2 -0.655
0.02 -0.597
P401
9 I’P49 P40 I o b 4 ] B
C 2 1
P49 P40 I C
. 0 0 1 1 * * l l l ~ . l ~ ~ l l p i , I ,
0 1 1 1 1 1 1 . . 1 1 ~ . , , , , . . 0 0 1 . 1 ~ I . 1 . l O i . 1 L I . , d , L , d ,
QT-value FIGURE 3.-Frequency distribution of quantitative resistance
to P. infestans in the F, progeny derived from the cross P49 X P40 in the combined data sets T1 (A), TO (B) and TO1 (C). Transformed (x’ = arcsin (x/110)) phenotypic values are shown on the x-axis. The positions of the mean resistance val- ues of the parents are indicated by arrows.
typic classes A,A,, A,A,, A d , and A d 4 in the F, popu- lation (see Figure 2). Each chromosome was covered by 2-10 marker intervals with the exception of chromo- some XIIof parent P49 for which no informative marker could be found. All 13 markers of chromosome XIZ tested appeared to have homozygous RFLP alleles for P49 whereas 11 heterozygous RFLP alleles from the same markers segregated for P40 (Figure 4) .
Incompatible S alleles at the S locus on chromosome I (GEBHARDT et al. 1991) were also active in the cross.
This was evident from the observation of strong devia- tions from the expected 1:l segregation ratios of the RFLP alleles descending from the male parent P40 on chromosome Z (data not shown).
The 1015 marker intervals (145 intervals for the two maps, multiplied by the 7 datasets) were tested for the presence of a QTL effect. Seventy intervals of those were significant at P 5 0.05. A QTL effect was detectable in most cases in at least two intervals adjacent to each other and several marker intervals appeared significant in more than one dataset. Taking this redundancy into ac- count, eight segments were identified on chromosomes 11,111, IV, V, VZ1, ZX, XZand XIIof the susceptible parent P40 and six segments on chromosomes 111, ZV, V, VIand VI1 of the highly resistant parent P49 (Figure 4), which showed QTL effects at various levels of significance.
With the exception of chromosomes ZV and V, on which both parents showed effects in similar chromo- somal segments, all QTL effects were detected in only one parent, preferentially in the susceptible parent P40 (Figure 4).
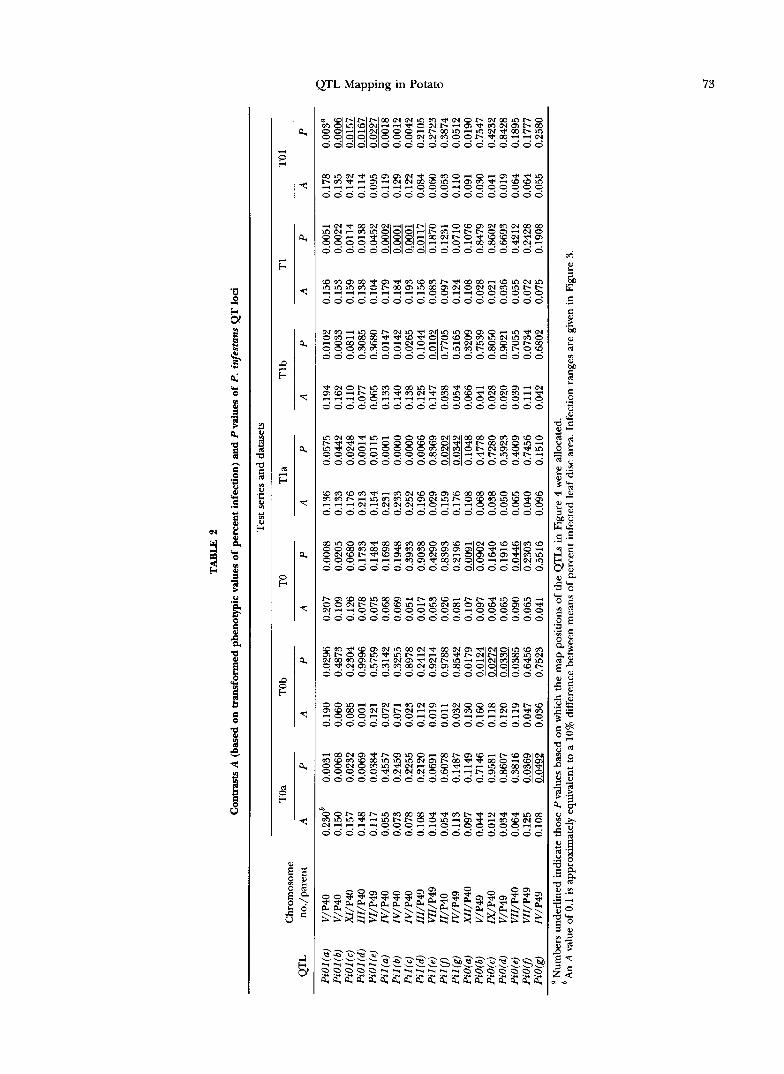
The chromosomal regions harboring QTLs were fur- ther characterized by defining 19 putative QT loci for P. infestans resistance (Pi loci, Figure 4, Table 2): Pi loci were allocated to the positions of maxima of the likeli- hood ratio curves within marker-brackets. In segments with significant consecutive marker intervals a Pi locus was assigned to the interval with the highest level of sig- nificance with the exception of two segments on chro- mosomes Wand Vof the P40 map comprising three and two intervals, respectively, of avery high (P< 0.001) level of significance. (GPlSO(a)-TG123-GP261 (a)-TG62 on chromosome ZV, GP186-GPZl-GP179 on chromosome V) . As the P values were very similar for these intervals, three and two, respectively, Pi loci were assigned to these regions (Pil(a), Pil(b), Pil(c) on chromosome IV, PiOl (a), PiOl (6) on chromosome V). These Pi “loci” in adjacent intervals can be due to a single locus having a strong QTL effect across several marker loci or due to an unknown number of linked QTLs. The Pi loci and the phenotypic contrasts A as well as the P values asso- ciated with them in the seven datasets are listed in Table 2. Three types of Pi loci were discriminated based on their significance across test series and fungal races. The

QTL Mapping in Potato 71
IV : 1 : I
I
t cp 51(d)
I1 WUN Ilb) b GP 1 0 1 Pi l (g)
PC 116
TG 123
GP 261(a)
TG 62 Pi O(R)
GP 16s GP 165 GP 274 GP 276 4 i
j t GP83 I CP 132
VI11 V GPldd i
VI
GP 186
CP 5Y.c) Pi O(b)
XI i t CPI
XI1
opm P IX X
047 _Ilj 1 CP 47
CP 59
CP Ios CP IO5
CP e(.)
GP 122
GPlw 1 GP 259
P 117
GP M
U? ““8 129 I 1 lOcM i GP 174(4)
FIGURE 4.-The map positions of P. infestans QT loci on the RFLP linkage groups derived from the parent P40 (open circles) and P49 (solid circles). Linkage group XI1 of P49 is missing as no informative markers were found (see text). Marker intervals having significant phenotypic effects are shown as rectangular areas, slashed for Pi01 loci, shaded for Pi1 loci and white for Pi0 loci. Neighboring intervals with decreased, but still significant Pvalues are shown as triangular areas. Arrows (thin, 0.05 < P< 0.01; medium, 0.01 > P > 0.001; thick, P < 0.001) indicate the positions of Pi loci within marker intervals based on the Pvalues underlined in Table 2.

72 C. Leonards-Schippers et al.
first type are the five race-unspecific PiOl loci (PiOI(a)- PiOl(e)): they are characterized as inducing significant phenotypic contrasts at P I: 0.05 in at least one test series with race 1 and race 0. The Pvalues in the TO1 dataset, combining all four test series, were below threshold ir- respective of whether or not all individual test series were significant. The strongest effect (P < 0.001) was found for PiOl (a ) and PiOl (b) in two consecutive in- tervals on chromosome V of parent P40.
The second type is represented by the seven Pi1 loci (Pi1 (a)-Pi1 (g) ). Effects are significant at P 5 0.05 in the two test series Tla and/or Tlb performed with race 1 or in the dataset T1 combined from them. Specificity for race 1 was particularly evident for the QTL effects with the highest significance in the whole dataset in three adjacent marker intervals on chromosome IVof parent P40 (Pil(a), Pil(b) and Pil(c)). Phenotypic contrasts caused by QT alleles of P49 in the same genomic region (Pi1 (g) and PiO(g) ) were also detectable, although at a low level of significance.
The third type are the seven QT loci named PiO(a)- PiO(g). The criterion for a Pi0 QT locus was a P value below 0.05 in the test series TOa and/or TOb performed with race 0 or in the combined dataset TO. The most significant PiO-QTL (PiO(a), P = 0.01) showing speci- ficity to race 0 was found on chromosome XII of P40 close to the marker CP60.
In 8 of 19 cases, a phenotypic effect was detectable in only one individual test series and not in any of the com- bined datasets (Pil(e)), Pil(fl, Pil(g), PiO(b), PiO(c), PiO(d), PiO(fl, PiO(g))). With the exception of Pi1 (e) which was significant at P = 0.01, levels of significance were low (0.01 < P < 0.05). Considering the large num- ber of tests performed, some of those phenotypic effects may have arisen by chance alone (false positives). Al- ternatively, they could also be the result of QTLs having small effects combined with race specificity or of par- ticular environmental or developmental conditions af- fecting resistance only during a singular test series.
The position of four QT loci (Pi1 (d) on chromosome 111, Pi1 (g) on chromosome IV, PiOl (c) on chromosome XI , PiO(a) on chromosome XII) was based on the high- est level of significance found in the “interval” ( r = 0.5) distal to the last marker of the linkage group. In three of the four cases also the adjacent internal interval showed significant phenotypic contrasts with the same or decreasing effect (Figure 4).
The traditional approach to QTL analysis is based on the detection of phenotypic contrasts between geno- typic classes at single marker loci, whereas the analysis presented in Figure 4 and Table 2 is based on one of the more recently developed flanking marker models (KNMP et al. 1990; LANDER and BOTSTEIN 1989). In the traditional approach, the recombination frequency be- tween a marker locus and a QTL is an unknown variable as compared to interval mapping of QTLs according to
KNMP et al. (1990), where the recombination frequen- cies rl and r2 of the QTL to the flanking markers are estimated.
To compare the two approaches, paired t-tests were performed to detect significant phenotypic contrasts be- tween the two alternative RFLP alleles at each RFLP lo- cus individually scored in the parents P40 and P49, re- spectively. At the 5% level of significance, essentially the marker loci in those chromosomal segments showed QTL effects which had been identified by using the in- terval mapping approach. Few additional marker loci were significant at 0.01 < P < 0.05 (data not shown).
The phenotypic contrasts based on which QTLs were mapped to potato chromosomes are the results of the action of up to four different alleles at any QT locus (Figure 2). The effects of individual QT alleles, domi- nance or additivity, are not revealed by the method used for identifymg the map positions. However, when the four marker genotype classes of an RFLP locus could be identified in the F, offspring, it was possible to examine phenotypic effects of allelic combinations at a linked QT locus.
Analysis of variance was performed between the phe- notypic means (transformed values) of the marker geno- type classes A,A,, A,A,, A d , and A d , at informative marker loci linked to the QTLs on chromosomes IZZ, IV, V, IX and XI (Table 3) . Significant differences (P 5 0.05) among classes were found for all marker loci ex- cept for GP259. When compared among each other and with the population mean, favorable as well as unfavor- able allelic combinations were identified. For example, the allelic combination A d , at the RFLP locus GP25 linked to PiOl (d) on chromosome III increased resis- tance (decreased % infection), whereas A,A, decreased it (increased % infection) with A,A, and A d , having no effect. The situation is best explained by additive effects without interaction in the F, of two positive alleles A , (P49) and A , (P40) and two negative alleles A , (P49) and A , (P40). The difference between the QT alleles of P49, evident in this analysis, appeared not to be signifi- cant with the interval mapping procedure described above. By comparing the phenotypic means at the linked marker loci on chromosome IV, a similar quali- tative relationship could be deduced for the whole chro- mosome segment harboring the highly significant QT loci Pil(a), Pil(6) and Pil(c).
In the QTL region on chromosome V, positive and negative QT alleles of P40 that are linked to the marker alleles A , and A,, respectively, appeared to be dominant to the QT alleles of P49. At the QT locus PiO(c) on c h r e mosome IX , the allele combination A,A, at the marker locus prpl decreased resistance compared to the popu- lation mean whereas the other three genotypes had no significant effect. Negative, heterozygous recessive QT alleles present in both parents may have caused the ob- served phenotype.
QTL Mapping in Potato
c a b b b m m m m m * m o b m ~ m b o m o m a m 3 - * o m t . 3 m * m m m b m a, 0 0 3 3 m 0 0 0 - t . m m - m m * m l - m 8 8 8 8 8 8 x 8 z z z 8 8 z x g z z 2 I I I I I
888888888?z8zzzzxzz I l l 1 cr;
- 0 b
m m m ~ m m m m * o m o ~ o ~ m w w m q t . m * - m H m m w a m - m m * - a a m z z z z 8 z z z 8 8 8 z 8 8 8 8 8 8 8
a, o o 3 3 w o o o 3 m m b o w a a m w m 3 m * w m m - - b o ~ o w m m m m m w m m 3 m m o o o 3 b m 3 t . b o m 3 m o
F w m m m * m * m w m b w m m 3 a m m m iil
’G s
2 I!
m m m m o b m m m m $ m o m m m m t . t . s c
q
~ ~ ~ ~ “ ~ ~ ~ ~ ~ ~ L r ? ~ ~ c q ~ I - ~ ~
.5 z z z z z z z z z g o z z 8 8 8 8 8 8
2 5
P
!i m m - m o t - m m * m m m m m o - m * m - o m o a ~ - m o - l - - m m o o o t . m a, o m ~ m m ~ w a w o o a o m m m m m o
‘G
0 0 0 0 0 0 0 0 0 0 0 0 0 0 0 0 0 0 0 1-
a;
z
f: b
$
1
q a m w a m m m w m * m m m * m o m a m it q o o m b b a a m - m m m o m a a m a *
g; s g z 8 8 8 8 8 8 8 8 8 z 8 8 8 8 8 8 i k z; b I 8E 0 0 0 H 3 - - m m * m m 0 - 3 o m m 4 ”
8 3 ” - o o m m m m * m m m m m m o $ 3 o m a r - * w m m o m m - o a m ~ m m a, 3 r r “ E &:
8 8
- 2 g g x 3 $ g g z g g g E g g g g s $ g i ’c:
8 3 2 ; .i g z p 8 ~ g ~ ~ x x z x ~ z ~ ~ ~ ~ ~ z g w m * m o 3 o o o o m m m o b m m * m a, 4 I d(t j m m ~ * m - o o ~ m m m w ~ o m m a o c 4 E
rr w m o b m m O a J m b m w a 3 m o m - m q
+ s .z 0 0 0 0 0 0 0 0 0 0 0 0 0 0 0 0 0 0 0 g m a - b a m * m m * m m a * m m m 3 *
1119911111999999919 2
I 1
0000000000000000000 I% ‘$1
t; 8xz$z%zwz$zz88888zz I l l
O b
Y rn b * * 3 3 o o o a a o * * b m m o m 3
z‘ct 3 %
111?1”””19?11999999
6*
E =
c .B
3 % c ) c I 0 0 0 0 0 0 0 0 0 0 0 0 0 0 0 0 0 0 0
m m o m ~ m m m m o m w ~ m
h z 0
b m a m m m m 3 b m w - b b * m o m i
s B
‘j: 5 ‘3
8 . m w m m b - m m * m l - m - 3 N m m * m g
m l - o m m * m b 3 3 m * b m t . m w m m a,
02 G * 0 0 0 0 0 0 0 0 0 0 0 0 0 0 0 0 0 0 0 9 % m a m o m t - t . m 3 - 3 m m a 3 m - * m 5 5 5 5 I E
% s 3 .e b El
o o m - - m - m m m ~ m o o m o m l - ~ U 0
q ”999199919991111199 P 3 e T
- m m m * b m m o - m b m a e b a m m a,
m a m w w m m m m m b w * * m o - w m o o m o m m * m - w o * H 3 m a m m * 88888xzzz8zzzzgv%88 I l # j
s a , p 9
% s 6 9 z z R i ? ~ ~ s 2 ? & f 2 ~ ~ $ i g 85 0000000000000000000 5 ;
2 .a 8 x 8 : 3E
.B &
h 0 aa\\,\\,&syy&zyz&&y zz 6 c 2 3 $ S 3 k k k % h . % k $ 2 3 3 3 3 ? a s 5 : 5 3
J ~ ~ ~ ~ ~ e * ””””” U - u u s b q u 4 ”1”- U P usG
q m - ” - o o o ~ ~ o ~ o o o o o ~ ~
gq g z
- 9 z g q 4 2 2 2 2 g gggggz ggggggz g s,
1.; $ 0 $ $ 9 $ $ $ 9 m w a a & & a L a = * a m % m $ m z z q
m 3
73

74 C. Leonarddchippers et al.
TABLE 3
Analysis of variance among phenotypic means (transformed values) of the four marker genotype classes at RFLF’ loci linked to P. infestans QTlrs
F, marker genotype classes
Chromo- Data- P49 P40 P49 P40 Locus some set A,A, A ,A,
GP25 III TO 1 0.714(49)a 0.631(36) - + /-
GPI 80(a)/PCl16’ IV T1 0.716 (64) 0.643(26) TGI 23 IV T1 0.736 (64) 0.568(25) GP261 (a) IV T1 0.730 (65) 0.573(26) TG62 IV T1 0.732 (56) 0.601(28)
- +/-
GPI 86 V TO 0.680 (35) 0.558(26) GP2 I V TO1 0.692 (37) 0.570(39) GPI 79 V TO1 0.654 (42) 0.602(28)
- +
PrP 1 I X TO 0.607 (48) 0.734(40) + /- -
GP25 9 XI TO1 0.654 (44) 0.560(18)
P49 P40 A d 3
0.652(38) + /-
0.668(47) 0.684(47) 0.671 (42) 0.683(41)
-/ +
0.674(43) 0.719(37) 0.725(37)
-
0.597(28) + /-
0.669(70)
P49 P40 A d ,
0.414 (9) +
0.520(29) 0.531 (28) 0.528(30) 0.509(29)
+ 0.416 (4) 0.598(42) 0.565(47)
+ 0.638(53)
+/-
0.582(26)
Population mean P
0.641 (180)
0.657(182) 0.657(182) 0.657(182) 0.657(182)
0.639(188) 0.631 (180) 0.641 (180)
0.639(188)
0.641(180)
0.0006
0.0122 0.0011 0.0013 0.001 1
0.0514 0.0050 0.0035
0.0402
0.1401 . . . . . . . .
a Numbers in parenthesis are numbers of observations. Missing values cause the differences between no. of observations for the population
’ The alleles A, and A, of P49 are from GPI 80(a) and alleles A, and A, of P40 are from PC1 16 in this case (see Figure 4). mean and the sum of observations for the genotype classes.
With the exception of the loci GP21 and GPl79, the frequencies of the marker genotype classes all deviated significantly ( P < 0.05) from the expected 1:l:l:l seg- regation ratio. The genotypic classes that increased sus- ceptibility were always in excess to those that increased resistance (Table 3). This was particularly evident for the positive allele combinations A& at the loci GP25 (chro- mosome ZIZ) and GPl86 (chromosome V) for which only 9 and 4 genotypes, respectively, were identified in the F, progeny as compared to the approximately 33 and 27 expected.
DISCUSSION
Mapping QTLs in F, progenies of non-inbred parents When a backcross derived from homozygous inbred par- ents is used in QTL analysis, phenotypic contrasts are formed between one homozygous and one heterozygous marker genotype class. In QTL experiments based on doubled haploid and homozygous inbred lines, respec- tively, the two classes being compared carry different alleles in the homozygous state. In the F, progeny used in this study, contrasts were formed between two het- erozygous marker genotype classes, each carrying one of the two alternative alleles of one parent and either one or the other allele of the second parent. The phenotypic contrasts observed resulted, therefore, from the differ- ence between the two alternative QT alleles of the first parent in the presence of the effects of the QT alleles in the second parent. Unlike in progenies derived from pure lines, the detection of QTLs in heterozygous F, progenies depends on the within parent variation of QT alleles.
We have chosen the 5% error probability level for accepting the hypothesis of a QTL being present in a marker interval. Although in total more than 1000 in- tervals have been tested, a large proportion of those was not independent as they were genetically linked. When intervals separated by 50 cM are considered indepen- dent and when the two parental maps are treated sepa- rately, we estimate that about 40 intervals within the 2000 cM scanned (cu. 1000 cM for each parent) were independent. When the four experiments performed (TOa, TOb, Tla and Tlb) were also considered inde- pendent (datasets TO, T1 and TO1 were not indepen- dent), approximately 160 (4 X 40) independent interval tests have been performed resulting in the identification of at least 13 QTL regions (19 Pi loci) on 13 different chromosomes (Figure 4). At the 5% level of significance, 8 of 160 tests may appear significant by chance alone (false positives, type I error). We point out, however, that the two QTL regions of the parent P40 on chromosomes ZV and V were significant at the 0.1% level. Two QTL regions of parent P49 that were significant only at the 5% level, were supported by the fact that they were located in the same segment of chromosomes Nand Vas the highly significant QTLs of P40. Three QTL repons could be de- tected at the l % (Pi01 (dl) and 5% (Pi01 (c), Pi01 (e)) level, respectively, in two experiments involving two different fungal races. Two further QTL regions (P i l (d ) , PiO(u)) that have been detected with only one race of the fungus, were significant at the 1% level. The remaining four QTL re- gions (Pzlv), PiO(c), PiO(e), P i O f l ) were of low significance and detectable in one experiment only. There is a high probability that at least one of those QTLs is a false positive.

QTL Mapping in Potato 75
The aim of our experiment was the identification of regions in the potato genome possibly involved in quan- titative resistance to P. infestans that can be tested for reproducibility and size of effects in different genetic backgrounds. Itwas, therefore, more important to avoid a type I1 error (discarding an existing difference based on its low significance) than a type I error (declaring a QTL which is a false positive). For this reason we have considered all chromosome segments significant at the 5% level or below that are reported in this paper as pos- sible targets for marker assisted selection experiments. The 5% level of significance was used by EDWARDS et al. (1992) for detecting QTLs in maize, whereas the more stringent 0.1 % level was chosen by PATERSON et al. (1988) and STUBER et al. (1992) for mapping QTLs in an in- terspecific cross of tomato and in highly heterotic prog- eny of maize inbreds, respectively.
The largest phenotypic contrasts in our F, progeny were found for the QT alleles of the susceptible parent P40 in the highly significant QTL regions ( P < 0.001) on chromosomes I V and V. Moreover, more QTL effects were found comparing alleles of P40 than comparing alleles of P49. Parent P40 was in interspecific hybrid be- tween S. tuberosum and the wild species Solanum spe- gazzinii with a high degree of heterozygosity (GEBHARDT et al. 1989). The hybrid nature of P40 may, in part, ex- plain its performance in this QTL analysis.
As highly informative marker loci were available that allowed the discrimination of four genotypic classes in the F, offspring, the relative quality of linked QT alleles and their allelic combinations could be evaluated. Com- binations of marker alleles have been detected in our experiment that increased or decreased resistance. This type of information can be used for marker assisted se- lection. Some of the more resistant genotypes were un- derrepresented in the F, population indicating a selec- tive disadvantage. This observation may explain- besides overdominance of susceptibility alleles-the shift of the phenotypic distribution in the F, toward susceptibility compared to the mid parent mean, which is a general observation in potato progenies segregating for field re- sistance to P. infestans [ROSS (1986) and references therein].
QTL mapping is often done by estimating differences between means of individual marker genotypes [for ex- ample, EDWARDS et al. (1987)l. This underestimates the effect of a QTL unless the QTL is very close to the marker locus. Interval mapping of QTLs provides in- formation on the genetic distance of the QTL from flanking markers. The recombination values between pairs of marker loci and a QTL have, however, an un- known variance (KNAPP et al. 1990). In our case applying to the same set of data the “traditional” approach, that is comparing mean values of marker genotype classes at single marker loci, led to the identification of the Same QTL regions for P. infestans resistance. STUBER et al.
(1992) obtained similar results using both methods of analysis in mapping QTLs in maize.
Race specificity of QTLS for P. infestans: Quantita- tive resistance to P. infestans is described as race- unspecific (VANDERPLANK 1984). In accordance with this, the phenotypic distribution of resistance in the F, was similar for the two fungal races tested (Figure 3). Dis- secting the distributions into QTLs revealed, however, differences between the races. In particular, the most significant QTL region ( P i l ( a ) , P i l ( b ) , P i l ( c ) ) involv- ing three marker intervals of P40 on chromosome ZV, was detected only with race 1. Neither of the parents P40 and P49 carried any R gene conferring race specific re- sistance, as both were susceptible, to different degrees, to race 0. Moreover, the dominant allele R l , inducing resistance to all fungal races not homozygous for the virulence allele v l , has been mapped to potato chro- mosome V (LEONARDS-SCHIPPERS et al. 1992). The race specificity associated with the QTL region on chromo- some ZVis, therefore, controlled by other genetic factors than the race specificity of the R l allele.
Race specificity may also be involved in the P. infes- tans QT loci Pi l (d ) -P i l (g ) and PiO(a)-PiO(g). Their effect appeared significant, however, only in one of four test series. Five of the seven Pi0 loci (PiO(a)-PiO(e)) were, for example, significant in the test TOb. The plants used in the bioassays of test TOb were 8 weeks old instead of 14-17 weeks as for tests TOa, Tla and Tlb. Plant age has been reported to affect the resistance level to P. infestans (HODGSON 1961). The loci PiO(b)-PiO(e) might, therefore, indicate the existence of QTLs for re- sistance depending, to some degree, on plant age.
Relationships between positions of QTLS for P. in- festans, R loci and loci involved in defense response: A QTL effect was detected in both parents in the interval formed by markers GP21 and G P l 7 9 on chromosome V (Pi01 (b) and PiO(d), Figure 4). To the same interval, the dominant, race-specific allele R1 has been mapped previously (LEONARDS-SCHIPPERS et al. 1992). Finding map positions for quantitative as well as qualitative re- sistance within the same short chromosome segment opens the possibility that the QTL and the R allele map at the same genetic locus. This hypothesis agrees well with the proposal of ROBERTSON (1985) suggesting that qualitative mutant phenotypes are the extreme allelic variants at a quantitative trait locus; a view which was supported by the experiments of B u m et al. (1991) and EDWARDS et al. (1992) which associated QTLs for plant height in maize with Mendelian loci affecting the same trait.
Two dominant alleles for extreme resistance ( R x ) to potato virus X also map at loci genetically linked to QTLs for resistance to P. infestans. Rx2 has been mapped close to GP21 on chromosome Vand, therefore, close to R1 whereas Rxl occupies a position on chromosome

76 C. Leonards-Schippers et al.
XII, 3 cM distal to CP60 (&ITER et al. 1991; LEONARDS- SCHIPPERS et al. 1992). Both map positions coincide closely with chromosome segments carrying the QTLs Pi01 (b), PiO(d) (chromosome V) and PiO(a) (chromo- some X U ) . The hypothesis that dominant alleles con- ferring resistance to different pathogens encode gene products of the same or of clusters of evolutionary re- lated loci (LEONARDS-SCHIPPERS et al. 1992) may, there- fore, be extended to alleles contributing to quantitative resistance.
Mapping to the same chromosome segments quanti- tative trait loci as well as specific functional genes in- volved in the disease response may indicate that those specific functional genes participate in the quantitative resistance response. Several associations of this type were identified in our QTL mapping experiment: The two loci PC1 16 on chromosome IV and prpl (=PI4 71 ) on chromosome IX (Figure 4 and GEBHARDT et al. 1991) encode genes that are differentially expressed after in- fection of potato leaves with P. infestans (TAYLOR et al. 1990). The PRF’l protein is coded by a small gene family (TAYLOR et al. 1990) and shows very similar induction kinetics of its mRNA as phenylalanine ammonia-lyase (PAL) and koumarate CoA ligase (4 CL) both ofwhich are enzymes of the general phenylpropanoid metabo- lism (FRITZEMEIER et al. 1987). A group of PAL loci is also located on chromosome IX in the segment bordered by loci GP190 and prpl (GEBHARDT et al. 1991). To the same segment the minor QT locus PiO(c) was allocated. PC1 16 on chromosome IVis localized within the highly significant chromosome segment in which both parents contributed QTL effects for Phytophthora resistance (Pil(a), Pil(b), Pil(e), Pil(g), PiO(g)). The genetic lo- cus 4CL mapping ea. 10 cM distal to GP226 on chro- mosome III (4CL(a) ; GEBHARDT et al. 1991) coincided with the region harboring the QT locus Pi1 (d).
Pathogenesis related genes like prpl, PAL and 4CL were found to be topographically related with loci con- ferring quantitative resistance to P. infestans. The ki- netics of their induction varies quantitatively after in- fection with the fungus (FRITZEMEIER et al. 1987; TAYLOR et al. 1990). Based on these observations, it seems con- ceivable that allelic variants of prpl, PAL and 4CL genes can cause differences in the quantitative resistance re- sponse to P. infestans.
The authors thank M. BENTER for technical assistance, F. FURKERT for help in preparing the figures and M. PASEMANN for typing the manuscript. S.J.K. acknowledges the support of a sabbatical by the “Alexander von Humboldt-Stiftung.” This work was supported by grant 1.10 of the Bundesministerium f ~ r Forschung und Technologie (BMFT).
LITERATURE CITED
BARONE, A,, E. RITTER, U. SCHACHTSCHABEL, T. DEBENER, F. SALAMINI et al., 1990 Localization by restriction fragment length polymorphism mapping in potato of a major dominant gene conferring resis- tance to the potato cyst nematode Globodera rostochiensis. Mol. Gen. Genet. 224: 177-182.
BEAVIS, W. D., D. GRANT, M. ~ E R T S E N and R. FINCHER, 1991 Quan- titative trait loci for plant height in four maize populations and
83: 141-145. their association with qualitative genetic loci. Theor. Appl. Genet.
COHEN, Y., and M. R E U ~ N I , 1983 Occurrence of metalaxyl- resistant isolates of Phytophthora infestans and of genes control- ling immunity in Solanum demissum derivatives. Euphytica 2:
EDWARDS, M. D., C. W. STUBER and J. F. WENDEL, 1987 Molecular- marker-facilitated investigations of quantitative-trait loci in maize. I. Numbers, genomic distribution and types of gene action. Genetics 116: 13-125.
EDWARDS, M. D., T. HELENTJARIS, S. WRIGHT and C. W. STUBER, 1992 Molecular-marker-facilitated investigations of quantitative trait loci in maize. 4. Analysis based on genome saturation with isozyme and restriction fragment length polymorphism markers. Theor. Appl. Genet. 83: 765-774.
FIUTZEMEIER, K-H., C. CRETIN, E. KOMBIUNK, F. ROHWER, J. TAYLOR et al., 1987 Transient induction of phenylalanine ammonia-lyase and koumarate: CoA ligase mRNAs in potato leaves infected with virulent or avirulent races of Phytophthora infestans. Plant Physiol. 85: 34-41.
GEBHARDT, C., E. RITTER, T. DEBENER, U. SCHACHTSCHABEL, B. WALKEMEIER et al., 1989 RFLP analysis and linkage mapping in Solanum tu- berosum. Theor. Appl. Genet. 7 8 65-75.
GEBHARDT, C., E. RITTER, A., BARONE, T. DEBENER, B. WALKEMEIER et al., 1991 RFLP maps of potato and their alignment with the home- ologous tomato genome. Theor. Appl. Genet. 83: 49-57.
GELDERMANN, H., 1975 Investigations on inheritance of quantitative characters in animals by gene markers. I. Methods. Theor. Appl. Genet. 46: 319-330.
GIEFFERS, W., V. H. PAUL and E. RITTER, 1989 Der EinfluP von Sauer- stoff und W-Licht auf die Konidienproduktion von Pseudos- porella herpotrichoides (Fron) Deighton, Merkmale zur Mor- phologie des Erregers und dessen Nachweis an Dikotyledonen. J. Phytopathol. 126: 115-132.
HODGSON, W. A., 1961 Laboratory testing of the potato for partial resistance to Phytophthora infestans. A m . Potato J. 3 8 259-264.
JOHANNSEN, W., 1909 Elemente der exakten Erblichkeitslehre. Fischer, Jena.
KNAPP, S. J., and W. C. BRIDGES, 1990 Programs for mapping quan- titative trait loci using flanking molecular markers and nonlinear models. J. Hered. 81: 234-235.
KNAPP, S. J., W. C. BRIDGES and D. BIRKES, 1990 Mapping quantitative trait loci using molecular marker linkage maps. Theor. Appl. Genet. 79 583-592.
LANDER, E. S., and D. BOTSTEIN, 1989 Mapping Mendelian factors underlying quantitative traits using RFLP linkage maps. Genetics
LEONARDS-SCHIPPERS, C., W. GIEFFERS, F. SALAMINI and C. GEBHARDT, 1992 The RI gene conferring race-specific resistance to Phyto- phthora infestans in potato is located on potato chromosome V. Mol. Gen. Genet. 233: 278-283.
LILLIEFORS, H. W., 1967 On the Kolmogoroff-Smirnoff test for nor- mality with mean and variance unknown. J. A m . hsoc . 62: 399-402.
LOGEMANN, J., J. E. MAYER, J. SCHELL and L. WILLMITZER, 1988 Differ- ential expression of genes in potato tubers after wounding. Proc. Natl. Acad. Sci. USA 8 5 1136-1140.
NIENHUIS, J., T. HELENTJARIS, M. SLOCUM, B. RIJGGERO and A. SCHAEFER, 1987 Restriction fragment length polymorphism analysis of loci associated with insect resistance in tomato. Crop Sci. 27: 797-803.
NILSSON-EHLE, H., 1909 Kreuzungsuntersuchungen an Ha& und Weizen. Lund.
OSBORN, T. C., D. C. ALEXANDER and J. F. FOBES, 1987 Identification of restriction fragment length polymorphisms linked to genes controlling soluble solids content in tomato fruit. Theor. APP. Genet. 73: 350-356.
PATERSON, A. H., E. S. LANDER, J. D. HEWTT, S. PETERSON, S. E. LINCOLN et al., 1988 Resolution of quantitative traits into Mendelian factors by using a complete linkage map of restriction fragment length polymorphisms. Nature 335: 721-726.
RITTER, E., C. GEBHARDT and F. SALAMINI, 1990 Estimation of recom- bination frequencies and construction of RFLP-linkage maps in plants from crosses between heterozygous parents. Genetics 125: 645-654.
173-240.
121: 185-199.

QTL Mapping in Potato 77
RI~TER, E., T. DEBENER, A. BARONE, F. SALAMINI and C. GEBHARDT, 1991 RFLP mapping on potato chromosomes of two genes con- trolling extreme resistance to potato virus X (PVX). Mol. Gen. Genet. 227: 81-85.
ROBERTSON, D. S., 1985 A possible technique for isolating genomic DNA for quantitative traits in plants. J. Theor. Biol. 117: 1-10,
Ross, H., 1986 Potato breeding-problems and perspectives. J. Plant Breed. Suppl. 13.
SACHS, L., 1992 Angewandte Statistik. Springer Verlag, Berlin. SAS INSTITUTE INC., 1989 SAS/STAT USERS GUIDE, VERSION 6, FOURTH
EDITION, VOL. 2. SAS INSTITUTE INC., CARY, N.C., 846 PP. SAS INSTITUTE INC., 1990 SAS LANGUAGE: REFERENCE, VERSION 6, FIRST
EDITION. SAS INSTITUTE INC., GUY, N.C., 1042 PP. SAS INSTITUTE INC., 1991 SAS LANGUAGE AND PROCEDURES: USAGE 2,
VERSION 6, FIRST EDITION. SAS INSTITUTE INC., CARY, N.C., 649 PP.
SPSS INC., 1992 SPSS BASE SYSTEM SYNTAX REFERENCE GUIDE, RELEASE 5.0, SPSS INC., 792 PP.
STUBER, C. W., S. E. LINCOLN, D. W. WOLFF, T. HELENTJARIS and E. S.
LANDER, 1992 Identification of genetic factors contributing to heterosis in a hybrid from two elite maize inbred lines using mo- lecular markers. Genetics 132: 823-839.
TANKSLEY, S. D., H. MEDINA-FILHO and C. M. RICK, 1982 Use of naturally-occurring enzyme variation to detect and map genes controlling quantitative traits in an interspecific backcross of to- mato. Heredity 49: 11-25.
TAYLOR, J. T., K. H. FRITZEMEIER, I. HAUSER, E., KOMBRINK, F. ROHWER et al., 1990 Structural analysis and activation by fungal infection of a gene encoding a pathogenesis-related protein in potato. Mol. Plant Microbe Interact. 3: 72-77.
THODAY, J. M., 1961 Location of polygenes. Nature 191: 368-370. VANDEWLANK, J. E., 1984 Disease Resistance in Plants, Ed. 2. Aca-
WASTIE, R. L., 1991 Breeding for resistance. Adv. Plant Pathol. 7: demic Press, Orlando, Fla.
193-223.
Communicating editor: W. G. HILL