Population dynamics and treatment strategies of Phytophthora ...
281
1 Population dynamics and treatment strategies of Phytophthora infestans (late blight) in the Mid-Hills of Nepal HEIKO APEL Institute of Geoecology, Technical University of Braunschweig, Langer Kamp 19c, 38106 Braunschweig, Germany MADHU SUDAN PAUDYAL Plant Protection Division, Department of Agriculture, Harihar Bhawan, Kathmandu, Nepal OTTO RICHTER Institute of Geoecology, Technical University of Braunschweig, Langer Kamp 19c, 38106 Braunschweig, Germany Abstract The fungus Phytophthora infestans is a major ubiquitous pest in solanaceous crops and causes great damages in the agricultural systems in Nepal. This is especially true in the cash crop orientated areas of the Mid-Hills and the Terai region, where potato and tomato cropping is a prominent income source of the rural population. This fact in combination with cheap and readily available pesticides is responsible for the frequent and perceived over-use of chemical plant protection agents. Based on this background a series of agronomic field trials in the Jhikhu-Khola watershed aiming at the optimisation of P. infestans treatment strategy was conducted. Within the field trials three different treatment strategies comprising both conventional and an alternative IPM approach were tested. Additionally a mathematical model for the simulation of the population dynamics of P. infestans was established, which is based on a universal epidemiological model with further specification for the late blight. The parameter estimation for the model was accomplished with uncontrolled field data. Using this model different treatment strategies were tested by introducing pesticide treatment strategies into the model. Based on both field trials and population dynamics simulation recommendations for an optimised conventional treatment strategy were developed. Landschaftsökologie und Umweltforschung 38 p. 1-12 Braunschweig 2002
-
Upload
khangminh22 -
Category
Documents
-
view
0 -
download
0
Transcript of Population dynamics and treatment strategies of Phytophthora ...

1
Population dynamics and treatment strategies of Phytophthora infestans (late blight) in the Mid-Hills of Nepal HEIKO APEL Institute of Geoecology, Technical University of Braunschweig, Langer Kamp 19c, 38106 Braunschweig, Germany MADHU SUDAN PAUDYAL Plant Protection Division, Department of Agriculture, Harihar Bhawan, Kathmandu, Nepal OTTO RICHTER Institute of Geoecology, Technical University of Braunschweig, Langer Kamp 19c, 38106 Braunschweig, Germany
Abstract
The fungus Phytophthora infestans is a major ubiquitous pest in solanaceous crops and causes
great damages in the agricultural systems in Nepal. This is especially true in the cash crop
orientated areas of the Mid-Hills and the Terai region, where potato and tomato cropping is a
prominent income source of the rural population. This fact in combination with cheap and
readily available pesticides is responsible for the frequent and perceived over-use of chemical
plant protection agents. Based on this background a series of agronomic field trials in the
Jhikhu-Khola watershed aiming at the optimisation of P. infestans treatment strategy was
conducted. Within the field trials three different treatment strategies comprising both
conventional and an alternative IPM approach were tested. Additionally a mathematical
model for the simulation of the population dynamics of P. infestans was established, which is
based on a universal epidemiological model with further specification for the late blight. The
parameter estimation for the model was accomplished with uncontrolled field data. Using this
model different treatment strategies were tested by introducing pesticide treatment strategies
into the model. Based on both field trials and population dynamics simulation
recommendations for an optimised conventional treatment strategy were developed.
Landschaftsökologie und Umweltforschung 38 p. 1-12 Braunschweig 2002

2
Introduction
This paper deals with the most prominent pest of solanaceous crops world-wide, the late
blight Phytophthora infestans and its population dynamics. This fungal disease is able to
destroy a crop completely and consequently causes serious economic damages or even
famines where potatoes are the main staple crop. This is historically documented as the
infamous famine in Ireland in the mid-1840s, which resulted in the large immigration wave to
America. Since then, the control of P. infestans has been a major issue in agricultural research
and production.
Nepal is no exception to that. Since the introduction of potato and tomato as valuable cash
crops, the control of late blight is the major concern of Nepali farmers. To a large extend the
control bases on chemicals, as documented in national pesticide consumption and import
statistics as well as in the surveys conducted in the investigation area, the Jhikhu-Khola
watershed (Kansakar, Khanal et al. 2001; Pujara and Khanal 2001), being one of the largest
production areas of potatoes and tomatoes for the Kathmandu valley.
Based on this background a series of agronomic field trials were conducted in co-operation
with the Plat Protection Division (PPD) of the Department of Agriculture (DOA). These trials
intented to investigate the reduction potential of and possible alternatives to the usual
chemical control measures.
In the trials the visible disease development of P. infestans as well as the control measures
were recorded. The results were statistically evaluated in order to compare the different
applied treatment strategies. Additionally a dynamic pest population model for P. infestans
was developed for the simulation of the disease epidemic and the effect of fungicide
treatment. This mathematical model was used to study the response of P. infestans epidemics
under the given geographic and climatic circumstances to different treatment strategies. Based
on these theoretical studies combined with the statistical evaluation of the field data
recommendations for fungicide application strategies were eventually derived.

3
Experimental design
For the field trials a representative plot on irrigated (khet) land was selected on the DOA
Horticulture Farm in Tamaghat. Three different treatment strategies were applied, namely the
“usual treatment” , “ reduced treatment” and “ IPM”. The usual treatment is an adoption of the
mean treatment strategy of the local farmers, which means that the protective fungicide
Mancozeb was non-discriminatory applied weekly and the systemic fungicide Metalaxyl
when necessary (cf. CEAPRED 2000). In the reduced treatment the same dose as in the usual
treatment was applied but at half frequency only. The IPM treatment is an Integrated Pest
Management strategy, using mainly biological and cultural pest management methods and
chemical pesticides just as the last resort to save the crop. The biological alternatives to
Mancozeb are the parasitic fungi Trichoderma viridae and Trichoderma harzianum, which
thrive on the expenses of other fungi like P. infestans.
The selected site was separated into 12 sub-plot of approximately equal size (45-50 m2). The
plots with the same treatment strategy were arranged in clusters, with 4 repetitions for each
strategy. Figure 1 shows the layout of the experimental plots. On this plot potatoes were
grown during the typical season for irrigated land, i.e. from November 1999 to February
2000. During this period a weekly pest assessment was done on 10 selected plants per plot.
The disease pressure was recorded as the visibly infected foliage area per plant in steps of 10
%. Besides this the dates and concentrations of treatment measures within the three treatment
strategies were also logged.
Fig. 1 Experimental fields on khet land (DOA Farm at Tamaghat)
0 4 8 12 Meters
Explanation of Field ID
K = Khet Fields, DOA Farm
1st Number = Pest Management 1 = usual treatment 2 = reduced pesticide dose 3 = IPM
2nd Number = Repetition
K34 K33 K32 K31
K24 K23 K22 K21
K11
K12K13K14
�
Trees

4
Dynamic population model
The population dynamics model of P. infestans bases on the approaches of van der Plank
(1963), who proposed that epidemics of plant diseases can be characterised by the three
factors latent period p, infectious period i and infection rate R. The latent period is the time
between the infection of plant tissue and the outbreak of lesions. The infectious period is the
timespan, in which the lesion sporulate, before the plant tissue finally dies. The original model
of van der Plank (1963) formulating the epidemic in terms of total infected plant tissue was
extended by Hau (1988) to a model describing all relevant stages (Uninfected U, Latent L,
Infected I, Dead A) as a set of Delay Differential Equations (DDEs):
( ) ( )tItURdt
dU ⋅⋅−= (1)
( ) ( ) ( ) ( )ptIptURtItURdt
dL −⋅−⋅−⋅⋅= (2)
( ) ( ) ( ) ( )����������������� �
� �
−−⋅−−⋅−−⋅−⋅= (3)
( ) ( )iptIiptURdt
dA −−⋅−−⋅= (4)
(1) – (4) are the base model used in this work, but for the description of the epidemic of P.
infestans it has to be extended. According to Hau (1988) citing van der Plank (1963) the
growth of infectious lesions is an important factor in Phytophthora epidemics. It is also known
that only the newly set lesions sporulate, but with a comparatively high intensity. Hau (1988)
introduced a linear lesion growth into the standard model, as well as sporulation functions in
order to distinguish an age dependent sporulation of the infectious plant material, but not
specifically for P. infestans epidemics. This has been done in this work by defining a
sporulation function, which allows only newly set lesions to sporulate and with a sporulation
intensity (sp_int) that is higher than the usual value of 1 used by Hau (1988). The sporulation
function was formulated as g(s,t), describing the sporulation intensity of lesion set at the time
s at runtime t. (5) shows the rectangular step function.

5
���
�
���
�
�
−≤+
+<−≤
<−≤
=
������
������� � ��� �
������
������ (5)
The sporulation functions were introduced into the model by expressing the infectious part in
integral form:
∫∫ ==−−−−−
−−
�
�
��
���
������
����������� ���
���������
�!"����"��� (6)
Finally the complete epidemiological model for P. infestans is written in a set of difference
equations (7) – (11), replacing the DDEs in (1) – (4) with appropriate formulations in
differences and writing the integrals in (6) as the equivalent sums (Hau 1988). This step
enables an explicit straight-forward solution of the model with negligible differences to the
numerical solution of the DDEs and, more important, it also enables the incorporation of
fungicide effects, which causes numerical problems in the solution of the DDEs.
( ) ( ) ( ) ( )ptFYt∆tFYt∆tLt∆tL −⋅−⋅+=+ (7)
( ) ( ) ( ) ( )
( ) ( ) ( )∑ ∑−
=
−
=
−⋅⋅+⋅−−⋅−−−⋅
⋅⋅+−⋅+=+
1t#
/i
1x
1t#
/i
1x
t∆xtUWt∆1pitFYt∆pt∆xtFY
tUWt∆ptFYt∆tIt∆tI
(8)
( ) ( ) ( ) ( )
−⋅⋅+⋅−−⋅+=+ ∑
−
=
$%&'(
$)t∆xtUWt∆1pitFYt∆tAt∆tA (9)
( ) ( ) ( ) ( )t∆tAt∆tIt∆tL1t∆tU +−+−+−=+ (10)
with
( ) ( )
( ) ( ) ( ) ( )
−−⋅
−⋅⋅+⋅−−⋅−−⋅⋅
⋅=
∑ ∑−
= =
1t*
/i
1x
x
1u
t,pt∆xtgt∆utUWt∆1pt∆xtIpt∆xtUR
tURtFY
(11)

6
Fungicide effects
Prior to a mathematical formulation of fungicide effects, the different modes of action have to
be described and categorised. The different fungicide effects can be divided into three main
classes (Gutsche 1988, Schepers and Bouma 1999):
� protective action: The spores are killed before germination/penetration.
� curative action: The fungicide is active during the post infection period (latent
period), but before lesions become visible.
� eradicant action: P. infestans is killed within sporulating lesions and thus preventing
further sporulation and lesion growth.
Figure 2 depicts these modes of action and their influence on the different stages of a late
blight epidemic. While the protective and curative action are quantitatively studied for
Mancozeb and Metalaxyl, the most prominent for this classes on the market (Gutsche, Burth
et al. 1994), the eradicant action is only qualitatively stated for Metalaxyl.
Susceptible
U
L a ten t
L
D ea d
AI n f ectio us
I
In f e c t i o n R
Eradicant action
C u rativ e action
L � � � �n � �
� � t
� W
Protective
a ction
Fig. 2 Different modes of fungicide action
The protective action is defined as a reduction of the infection rate R and the lesion growth
rate W. The curative action is considered as a reduction of latently infected to susceptible,
uninfected plant tissue. Finally the eradicant action is expressed as an immediate transition of
infectious lesions to dead plant material.

7
The time dependent fungicide effects are formulated according to Gutsche, Burth, et al.
(1994) with a maximum efficacy of 1, i.e. 100 %. The incorporation of the fungicide effects
into (7)–(11) was done according to the definitions above and are described in detail in Apel
(2002).
Results
Field experiments
The results of the field experiments are illustrated by Figure 3 in terms of mean relative
infection levels, whereas an infection level of 1 is equivalent to a real infestation of > 50 %
infected leaf area. It can be seen that the usual and reduced approach are equally effective in
controlling the disease. However, the IPM approach apparently failed. But this was caused by
the non-availability of the required biological agents and not by the efficacy of Trichoderma.
The agents were only available after the infestation reached a level at which a control, even
with chemicals was no longer possible. In consequence this means that the IPM data can be
regarded as a untreated control series, which was further used for the parameter estimation of
the population dynamics models (4.2).
�
��� �
��� �
��� �
��� �
�
� ��
�� ��
� ��
� � ��
� ��
� � ��
� � ��
�� � ��
� � ��
�
�
�
��
�
� �
date
rel.
infe
ctio
n
usual reduced IPM
Fig. 3 Normalised mean infection of P. infestans on potato at the different treatment strategies, Nov. 1999 – Feb. 2000; error bars indicate one standard deviation

8
The statistical significance of the influence of the treatments on the disease development were
tested with a Repeated Measures Analysis (Winer 1971). This showed that the treatments
have a highly significant influence on both the trend and level of the disease development and
hence corroborated the visual interpretation of the field results.
Population Dynamics
For the parameter estimation of the population dynamics model the “uncontrolled” IPM data
were used. In a first step the basic parameters p, i, and R were estimated with (1) – (4) on the
basis of the Least Squares criterion. In a second step the P. infestans specific parameters
sporulation intensity sp_int and lesion growth rate W were additionally estimated using the
same technique using equations (7) – (11) with a stepsize of ∆t = 1. This procedure resulted in
the parameter set listed in Table 1 with a good fit to the experimental data (R2 = 0.908744).
Figure 4 shows the model fit and the trajectories of all stages.
Table 1 Optimised parameter set for (7) – (11); initial infection y0 distributed equally to L
and I
p 3 W 0.326488
i 11 sp_int 3
R 0.333 y0 0.0073
� ��� ��� ��� ����� �
�� �
�� �
�� �
�� �
� ��
�� ��� � ��� ��� ��� ������
���
���
���
���
� �� �
��� ���
� �"! �$# %�& � '( ) � %�� �! �$# %�& � '� % ) �
Fig. 4 Phytophthora model (7) -(11) with optimised parameters: A: visible infection (L + I) and data, B: all stages

9
Fungicide application scenarios
According to the experimental design and the different modes of fungicide action different
treatment scenarios were calculated with the Phytophthora model (7) – (11) and the optimised
parameter set. For all the three modes of fungicide action associated to frequently used
fungicides on the market, scenarios were defined with two different application intervals, 7
and 14 days, and different application thresholds, depending on the infestation level. Figures 5
– 7 show the resulting calculated disease developments. ta in the legend gives the application
start in days equivalent to the defined thresholds of infestation levels of 0, 0.05, 0.1, 0.15 and
0.2 respectively.
Discussion and recommendation
The experimental comparison of different treatment strategies of P. infestans showed that a
reduced approach applying fungicides only half as often as it is usually practised in the
Jhikhu-Khola watershed is sufficient for the control of the disease. An assessment of the
efficacy of the IPM approach cannot be given with the present data, because the biological
control agents were not available on the Nepali market in time.
� ��� ��� ��� ������ �
���
��� �
���
��� �
��� �
� ��� ��� ��� ������ �
���
��� �
���
��� �
��� �
��������������� ���� � ����� ��������������� ������ ��� ��! ��������������� ���� � ���"� ��������������� ������ ���#��$ ���%������������ � �&�
'�( )+*
'�( )+*
,"-/.10�23054#4#6 79850":;7�<>=?4@05:%:BA�C�=
DE.10�2F054#4#6 79850":979<>=G4@0":%:%A5CH=
�����I�;�J�&��� ���� � �&��� �����I�;�J�&��� ���I�� � �&��! �����I�;�J�&��� ���� � �&�K� �����I�;�J�&��� ���I�� � �L��$ �����I�;�J�&���� � �1�
Fig. 5 Model response (visible infection) to the control of P. infestans with a protective fungicide (Mancozeb)

10
� ��� ��� ��� ������ �
��
��� �
��� �
��� �
��� �
� ��� �� ��� ������ �
���
��� �
��� �
��� �
��� �
�������������� ��� � ����� �������������� � ��� � ���! �������������� �"� � ���#� �������������� ����� � �$��% ��������������� � �&�
')( *,+
')( *,+
-�.0/�1�231�454�6 798�1#:�79;�<=451#:�:�>@?A<
BC/�1�231@4�4�6 7D8@1#:�79;�<E451�:�:,>�?A<
�@���A���)�&��� ��� � �&��� �@���A���)�&��� ������ � �&��! �@���A���)�&��� � �� � �&�#� �@���A���)�&��� ����� � �F� % �@���A���)�&���� � ���
Fig. 6 Model response (visible infection) to the control of P. infestans with a fungicide with curative and protective action (Metalaxyl + Mancozeb)
G H�G I�G J�G K�GGL G
G�L M
GL H
GL N
GL I
GL O
G H�G I�G J�G KAGG�L G
G�L M
G�L H
G�L N
G�L I
G�L O
P)Q RTS
P)Q RTS
U V�WYX�ZDV\[^]�_ `a�U b [c`�dU V�WYX�ZDV\[^]�_ e�dAaU b [^`�fU V�WYX�ZDV\[^]�_ e a�U b [c`#eU V�WYX�ZDV\[^]�_ ]dAaU b [5e gU V�WYX�ZDV\[^]�a�U b [^]
h#ikj&lm3ln5n�o p9q#l@rYp9s�t=n5l@r,r�u@v�t
wxj&l�m3l@nyn�o p�q@l�r�p9s�t=n5l�r�r�u@vAt
z {�|,}�~Y{)����� ���z � �^���z {�|,}�~Y{)����� ���A�z � �^��z {�|,}�~Y{)����� � ��z � �^�#�z {�|,}�~Y{)����� ��A�z � �5���z {�|,}�~Y{)������z � �&�
Fig. 7 Model response (visible infection) to the control of P. infestans with a fungicide with eradicant, curative and protective action (Metalaxyl + Mancozeb)

11
However, the consequently uncontrolled disease development served as a valuable data
source for the parameter estimation of a population dynamics model for P. infestans. With
these data site specific epidemiological parameters could be identified. The values stated in
Table 1 indicate that the latent and infectious period of Nepali tribes of P. infestans are of
comparable length to European tribes (Gutsche 1999).
The infection rate R however is almost three times higher under Nepali conditions indicating
either a higher aggressiveness of the local tribes or favourable climatic conditions or both.
However, while interpreting the parameter values it has to be kept in mind that these are
effective parameters, summarising not only disease specific effects, but also external
influences like climatic conditions and growth of the host plant. This has a significant
consequence on the validity of the model, viz. the estimated parameters: It is only valid for P.
infestans epidemics on potato under post-monsoon climate in the mid hills of Nepal. This is
also the reason why a reduction of the disease level cannot be simulated with this model. In
order to achieve this, the growth of the host plant, the recovery potential of the host plant in
the different phenological stage and the climatic influence have to be modelled explicitly.
However, the model can of course be used for the assessment of fungicide treatment strategies
under site specific conditions. The fungicide application scenarios corroborated the findings
of the field trials: A 14-day application interval of a protective fungicide (Mancozeb) can be
sufficient for the control of the late blight (cf. Figure 5).
But the model calculations revealed another important fact: the start of the applications. As
shown in Figures 5 – 7, an early application start is necessary to control the disease
effectively, even with a combined protective, curative and eradicant effect. Due to the
aggressiveness of the disease an effective control is hardly possible if the disease exceeds an
infestation levels above 0.2, equivalent to 10 % real infected leaf area, especially in the
reproductive stage of the host plant. In other words this means that the economic threshold
level for P. infestans treatments would be close to zero, especially under the low cost
conditions of pesticides in Nepal in comparison to the high market value of the crops.
From these findings two basic recommendations for the conventional treatment of P. infestans
in the Mid-Hills of Nepal can be derived:

12
1. For the control of P. infestans on potato in the winter season in the Mid-Hills of Nepal a
regularly application of Mancozeb at the recommended dose in 14 days intervals is sufficient.
The application should start within the first week after crop establishment.
2. In severe cases a Metalaxyl+Mancozeb fungicide formulation may be used to stop the
epidemic. In this case a weekly application frequency is recommended.
With this recommendation it is most likely that P. infestans is controlled sufficiently (i.e. not
completely eradicated) while keeping investments in chemical control low, improving the
economic benefit and reducing the environmental contamination risk.
References
Apel, H. (2002) Risk Assessment of Pesticides in the Mid-Hills of Nepal - Environmental
Fate and Population Dynamics Modelling. PhD Thesis, Nat. Sciences Faculty Technical University Braunschweig, 127pp.
CEAPRED (2000) Socioeconomic survey of the Jhikhu-Khola watershed. Center for Environmental and Agricultural Policy Research, Extension and Development (CEAPRED), unpubl. IPMS project report, Kathmandu, 47pp.
Gutsche, V. (1988) Die Entwicklung und Nutzung von Schaderregermodellen in Forschung und Praxis des Pflanzenschutzes. Dissertation Institut für Pflanzenschutzforschung Kleinmachnow, Akademie der Landwirtschaftswissenschaften der DDR, 147pp.
Gutsche, V. (1999) Das Modell SIMPHYT 3 zur Berechnung des witterungsbedingten Epidemiedruckes der Krautfäule der Kartoffel (Phytophtora infestans (Mont.) de Bary). Nachrichtenblatt des Deutschen Pflanzenschutzdienstes 51(7), 169-175
Gutsche, V., Burth, U., Lindner, K. & Stachewicz, H. (1994) Abbildung der Wirkung von Phytophthora-Fungiziden im Simulationsmodell, Nachrichtenblatt des Deutschen Pflanzenschutzdienstes 46(10), 224-230
Hau, B. (1988) Ein erweitertes analytisches Modell für Epidemien von Pflanzenkrankheiten. Habilitationsschrift, Fakultät für Agrarwissenschaften, Justus-Liebig-Universität Gießen, 168pp.
Kansakar, V. B. S., Khanal, N.R. & Ghimire, M. (2001) Use of insecticides in Nepal. In: Herrmann, A. & Schumann, S. (eds) Abstracts International Workshop on Environmental Risk Assessment of Pesticides and Integrated Pesticide Management in Developing Countries 6-9 November 2001, Kathmandu, Nepal. Landschaftsökologie und Umweltforschung 36, Braunschweig, 35
Pujara, D. S. & N. R. Khanal (2001) Use of pesticides in Jaishidi subcatchment, Khikhu Khola watershed, Middle Mountains of Nepal. In: Herrmann, A. & Schumann, S. (eds) Abstracts International Workshop on Environmental Risk Assessment of Pesticides and Integrated Pesticide Management in Developing Countries 6-9 November 2001, Kathmandu, Nepal. Landschaftsökologie und Umweltforschung 36, Braunschweig, 42
Schepers, H. and E. Bouma, (Eds.) (1999) PAV-Special Report no. 5. Lelystad, Applied Research for Arable Farming and Field Production of Vegetables, 289pp.
van der Plank, J. E. (1963), Plant Diseases: Epidemics and Control. Academic Press, 349pp. Winer, B. J. (1971) Statistical principles in experimental design. McGraw-Hill,. 907pp.

13
Environmental risk assessment of pesticide use based on the modelling of the environmental fate of pesticides in soil HEIKO APEL Institute of Geoecology, Technical University of Braunschweig, Langer Kamp 19c, 38106 Braunschweig, Germany MADHU SUDAN PAUDYAL Plant Protection Division, Department of Agriculture, HMG of Nepal, Babar Mahal, Kathmandu, Nepal OTTO RICHTER Institute of Geoecology, Technical University of Braunschweig, Langer Kamp 19c, 38106 Braunschweig, Germany
Abstract
Based on laboratory and field experiments the environmental fate of four selected pesticides
(Dimethoate, Fenvalerate, Malathion, and Metalaxyl) in the Jhikhu-Khola watershed, Nepal
was investigated, both on soils representative for irrigated (khet) and rainfed (bari) conditions.
The degradation, sorption, and transport behaviour were described with deterministic
mathematical models. Based on these models a risk assessment of the accumulation of the
pesticides in soil and groundwater was conducted. In order to achieve this standard, worst and
best case scenarios were developed. The framework and conditions for the scenarios were set
by the physical and socio-economic environment in the watershed, which was investigated by
a socio-economic survey. With this method it was possible to assess the risk of groundwater
contamination and residue formation in soil on a quantitative basis for parts of the watershed.
According to this the risks of severe, actual residue formation are very low, but chances for
long term residue accumulation are present. The likelihood of groundwater contamination is
also low, but more uncertainties remain as compared to residue formation, because the
transport mechanisms are not completely understood and because of insufficient data.
Introduction
The fate of pesticides in the environment knows many possible ways of degradation, transport
and accumulation, as shown in Figure 1.
Landschaftsökologie und Umweltforschung 38 p. 13-23 Braunschweig 2002

14
These numerous possibilities challenge every attempt of an environmental risk assessment of
pesticide use in general, because it is virtually impossible to describe or even quantify every
single dissemination pathway shown in Figure 1, even for a single pesticide. Nonetheless this
is exactly the aim of this paper. Taking an agriculturally intensively used watershed in the
Mid-Hills of Nepal, the Jhikhu-Khola watershed, as an example, a viable approach using
deterministic mathematical models and statistics is presented in the following chapters. ������������ �
������� �� � �������
��� ����� �� ! "
#�$ ��%'&�(� ��"*)+�-,.)/&�" � %��
0�%�1 $ " � 1 � 2 $ " � %��3�4�%�"*%���)/5,6% 78&9%�2�� " � %'�
:-��! � 1 " � $ " � %��# �-%�&���);2*� �'<�).2
===
> � %�" � $ ��2-!�%��-7 $ " � %���?�@A)CB�� $ � $ " � %��3D�-%�� <�,/" � %��8%�!E7A)." $.F % 1 � "*);2G ��2-%'��&�" � %��
H'I � �8,6%'��" $ ,."
JLK'M�N O�P QDR
ST�92 $ " <'� $ "�).�VU6%���)
W �-%'<����6X $ "�)+�
Fig. 1 Dissemination pathways of pesticides in the environment Methodology
Step 1: Selection of target compounds
If pesticide use in general has to be assessed, a selection of the pesticides used in the
investigation area has to be taken, which is representative for the whole range in use. The
criteria for the representativeness are:
• frequency and amount used
• pesticide classes
• physicochemical properties
In our case four pesticides were selected according to this criteria:
- Dimethoate organo-phosphorous insecticide, systemic action
- Fenvalerate insecticide, synthetic pyrethroid, contact action
- Malathion organo-phosphorous insecticide, contact action
- Metalaxyl fungicide, systemic action

15
These four compounds cover the range of pesticide classes used in the watershed, as well as a
wide range of physicochemical properties and consequently different assumed environmental
fates (cf. Table 1). Only the vapour pressures are in a comparable low range indicating a very
low tendency for volatilisation.
Table 1 Basic physicochemical properties and DT50-values of the selected pesticides. source (Tomlin 1994), ‡ different sources: a) (Di & Aylmore 1997), b) (Tomlin 1994), c) (EXTOXNET 1999), d) (ARS-USDA 1999), e) (Hornsby et al. 1996)
Dimethoate Fenvalerate Malathion Metalalxyl solubility [mg/l] †
238000 0.002 - 1 145 8400
vapour pressure [mPa] †
1.1 0.0192 5.3 0.75
Kow [ ] † 506 2.6*106 560 56.2 DT50 [d] ‡ 7a,e, 4-20c 35a, 75-80b,
88-287d 1a, 9 d, 1-25c
70a, 7-170c
Step 2: Problem definition
After the compound selection the actual environmental problem caused by the pesticides has
to be defined in order to design the appropriate experimental setup. The problem definition is
ruled by the environmental and agronomic setting. In our case the dominant land use types are
small scale terraces with and without irrigation. The irrigated terraces termed “khet land” are
level, bounded by earthen walls and irrigated by ponding water in the field with usually three
crops per year. On the contrary the rainfed terraces (“bari land”) are sloping without any
bounds with only two crops per year due to water shortage in the pre-monsoon season.
The climate is of monsoon type with rainfall concentrated on the months June – September,
limiting the number of crops grown on bari land. On both khet and bari land the seasons of
high pesticide input are before and after the monsoon, when vegetables are grown as cash
crops. Taking these facts into consideration, the most probable dissemination pathways were
identified leading to the following problem definition:
1. Probability of residue formation in soil on both khet and bari land.
2. Leaching to groundwater on khet land

16
Step 3: Laboratory experiments
The next step in the risk assessment comprises laboratory batch experiments for the detection
of the degradation and sorption behaviour of the selected compounds in soil taken from the
investigation area. In our case the experiments were conducted under varying temperatures
during and at three different soil humidity levels ranging from almost dry soil to saturation.
This experimental setup produced sufficient data for the detection of not only the degradation
and sorption process and parameters, but also for a temperature and humidity dependent
formulation of the degradation.
The mathematical model used for the description of the degradation and sorption was the one-
site kinetic sorption model (Richter 1996) as shown in equ. (1) – (2)
c)�
,T(k�
)ScK(���)c�
(dt
dD −−−= (1)
)ScK(���)S�(dt
dD −= (2)
with c = solute concentration, S = sorbed conc., α = sorption rate constant, ρ = soil bulk
density, θ = volumetric soil water content, KD = sorption equilibrium constant and k(T, θ ) =
temperature and water content dependent degradation rate. For the description of the
temperature and humidity response of the degradation different functions were used
depending on the data. The response functions are compiled in Richter (1996).
Step 4: Field experiments
Field experiments are necessary to verify the degradation and sorption rates identified in the
laboratory experiments and to investigate the transport mechanism in soil. For this purpose
Potassium Bromide KBr was used as a conservative tracer for the estimation of the transport
parameters additionally to the selected pesticides.
The mathematical model for our problem with ponding irrigation on khet land are stationary
convection-dispersion equations (CDEs) coupled with the degradation and sorption terms in
two domains (fast and slow), i.e. a preferential flow system was identified. The exchange
between the domains are formulated as 1st order processes, analogously to the sorption.
Detailed descriptions of the model can be found in van Genuchten & Wagenet (1989), Gerke

17
and van Genuchten (1993) and Apel (2002).
Step 5: Scenario definition
The overall aim of the scenario calculation is the quantification of uncertainty associated with
the transfer of the laboratory and local field experiments to a complete watershed. The
quantification of the variance of the parameters involved is prerequisite for a realistic and
comprehensible risk assessment. The number of parameters involved depends on the problem
definition. In our case the risk of residue formation was assessed by the variation of
application doses. The basis for the application variance was a representative survey of 200
households in the watershed (CEAPRED 2000). Additionally the annual variance of soil
temperatures was considered by using temperature dependent degradation rates and a
representative soil temperature variation for a complete year.
However, for the variance of the transport velocities necessary for the groundwater
contamination assessment no qualified data source was available. This was mainly caused by
the preferential flow regime identified in the field experiments, which cannot be estimated by
available data like soil type or grain size distribution. This means in consequence that all the
following scenarios and risk assessments apply for soils similar to the soils in the field trials
only.
The scenarios for the residue formation are defined as mean, worst and best case scenarios
under the following conditions and variations:
conditions:
- identified transport mechanism
- saturated water content, stationary flow
- representative soil temperature variation
- temperature/humidity response from batch experiments
variation:
- source: field survey (CEAPRED 2000)
- mean scenario: mean of all recorded doses & frequency, 25% applied to soil surface
- worst case: highest mean dose + 1.96 standard deviations, highest frequency, all to soil
surface
- best case: lowest mean dose - 1.96 standard deviations, lowest frequency, 10% to soil
surface
18
The application statistics are taken from the survey, whereas the part applied directly to the
soil surface are empirically assumed. The final risk assessment is consequently based on the
results of the scenario calculations and the underlying statistics.
Results
In this chapter the results for only one selected pesticide, Dimethoate, are presented
exemplarily for the complete assessment.
Laboratory batch experiments
0.00 5.00 10.00 15.00�������
0.00
200.00
400.00
600.00
800.00
1000.00
����� �� ������
20 Vol.% 40 Vol.% >50 Vol.%
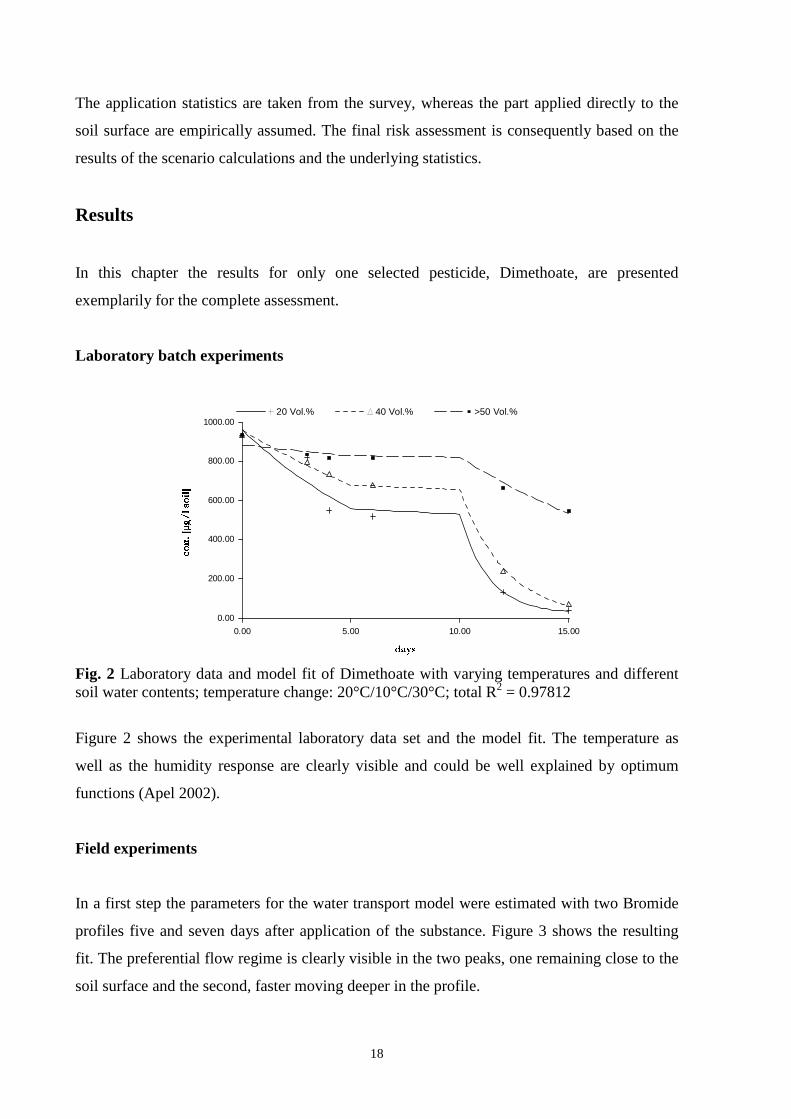
Fig. 2 Laboratory data and model fit of Dimethoate with varying temperatures and different soil water contents; temperature change: 20°C/10°C/30°C; total R2 = 0.97812
Figure 2 shows the experimental laboratory data set and the model fit. The temperature as
well as the humidity response are clearly visible and could be well explained by optimum
functions (Apel 2002).
Field experiments
In a first step the parameters for the water transport model were estimated with two Bromide
profiles five and seven days after application of the substance. Figure 3 shows the resulting
fit. The preferential flow regime is clearly visible in the two peaks, one remaining close to the
soil surface and the second, faster moving deeper in the profile.

19
120
100
80
60
40
20
00 5 10 15 20 25 30 35 40
��� ���������� � �
day 5
������ ���
��
120
100
80
60
40
20
00 5 10 15 20 25 30 35 40
��� ��� �"! #�$�% ! &
day 7
'�()*+ , -
./
Fig. 3 Model fit to Bromide profiles of field trial, overall R2 = 0.9671
The identified parameter values for the water transport were consequently used for the
transport model of the pesticides along with the degradation and sorption parameters
estimated in the laboratory experiments. In all cases this resulted in poor fits to the field
profiles. Hence further estimations of field degradation rates were necessary, which were
typically faster than the laboratory rates. Figure 4 shows the resulting model fit of this
procedure to the Dimethoate profiles. This fit shows that the assumed models for the
transport, degradation and sorption are able to sufficiently explain the fate of the substances in
soil. This is the prerequisite for the next step, the scenario calculation and the following
interpretation, the risk assessment.
Scenario calculations
The conditions and case variations for the scenarios are listed under Step 3 in chapter 2. The
use of the slower laboratory degradation rates are justified by the consideration of the annual
soil temperature variation and the conservative approach underlying the scenarios. The results

20
of the mean and worst case scenarios for Dimethoate are shown in Figure 5 and 6
respectively.
The results of the standard scenario show several remarkable facts. The seasonal temperature
variation is clearly visible in the degradation, respectively the residue formation within the
different cropping periods. The graph in Figure 5 containing the total substance in the
calculated profile of 1.2 m depth under 1 m2 shows a slow degradation of Dimethoate during
the winter (potato) season and consequently a comparatively large residue formation, while
the degradation during the summer and monsoon season increases to such an extent that
residues are reduced. Although there is a residue reduction during summer and monsoon, an
apparently substantial amount of substance is left in the soil column after one year.
At a first glance this appears to be alarming, but a look at the concentration profile of the last
day mitigates this impression. The concentration are comparatively low throughout the profile
and hardly analytically quantifiable, depending on the quantification limit established. The
dotted lines in the graphic indicate two different quantification limits. The higher limit is
obtained by recovery experiments through the complete analytical process with all partners
involved, the lower one taken from literature is derived by peak heights in the
chromatograms. This means that with the experimental quantification limit it would be hard to
detect the substance in quantifiable amounts after the three seasons and even with the lower
limit the concentration in the deeper profile are unlikely to detect. The consequence is that the
residue formation is probable, but in hardly detectable quantities.
There is also an amount of the substance leaving the profile, i.e. leaching to lower depths, as
the lower boundary graph shows. But again, the concentrations there are in a range difficult to
detect. An approximation of the substance outflow yields that about 5% of a single application
assumed in the scenario leave the soil column, posing no risk to groundwater contamination
due to dilution.
This situation is quite different in the worst case scenario. Here of course the residue
formation reaches a worrying quantity as well as the substance leaving the profile (cf. Figure
6). The last day profile shows clearly detectable and quantifiable concentration up to the
bottom of the profile and the amount leaving the profile is in the order of one standard
application. This case would pose a serious threat to the environment, especially the residue
formation. Fortunately this scenario is very unlikely as shown in the following chapter.

21
50
40
30
20
10
00 50 100 150 200 250 300 350 400
� ���� ����
� ������ µ������� � � �
�����!
50
40
30
20
10
00 10 20 30 40 50 60 70 80
"$#�%'&)(
* +,-. / 012
50
40
30
20
10
00 50 100 150 200 250
3�4�5!6
7 89:; < =>?
50
40
30
20
10
00 10 20 30 40 50 60
@BA�CED�D
F GHIJ K LMN
Fig. 4 Dimethoate profiles and model fit in field trial, total R2 = 0.793
O�PRQ STQ P Q PRUVSTQ P W X Y�Z
0 100 200 3000
2
4
6
8
0 100 200 3000
5000
10000
15000
20000
25000
120
100
80
60
40
20
00 5 10 15 20 25 30
[ \ ]!^�_�`a\cb�dBe�f _hg
ijki lm µ
no p qjrp s
t�u�v�w
x \ x f�[�y d{z�_|\�} y [ ^
~��R� �T� � � �R�V�|� � � � �|�
� j� �p ijki lm µ
ns
t�u�v�w
�����c���c� µ����� w � � � �
[ f�� x e�f�g�z�_|\�} y [ ^
� ����m i�s
Fig. 5 Results of the mean scenario calculation for Dimethoate; reference area: 1 m2, dotted lines in last day profile indicate quantification limits

22
0 100 200 3000
20
40
60
80
100
0 100 200 3000
50000
100000
150000
200000
250000
300000
120
100
80
60
40
20
00 50 100 150 200 250 300 350
� ���������� � ������
���� �� µ
�� � ���� �
���! �"
# � # ����$ �&%'�(�*) $ � �
+ �+ ,� ���� �� µ��
���! �"
-/.�0*-21*3 µ 4�576 " .�8 6 9
� �;: # � �2�<% �=�') $ � �
> ?@+A� �B�
Fig. 6 Results of the worst case scenario calculation for Dimethoate; reference area: 1 m2, dotted lines in last day profile indicate quantification limits
In contrast to this the best case scenario yields a non quantifiable residue situation, even with
the low quantification limit. Also the leached amount is of such a low quantity that it can be
neglected. However, the probability of this scenario is as low as the best case, since
equivalent assumptions were made.
Risk assessment and discussion
Prior to the evaluation of the risks associated with the single pesticides the probabilities of the
worst and best case scenarios have to be calculated. As mentioned before the definition of the
application doses is based on statistics derived from a representative survey in the
investigation area. For the worst case scenarios the highest mean application dose found on
the selected crops plus 1.96 standard deviations are taken. Under the normal distribution
assumption this means that the probability of a single application of a dose equal or higher as
a worst case dose is 2.5 %. This has to be corrected by the probability of the highest mean
dose used in the scenario. Under the assumption that all of the six recorded mean doses are
equally likely, this evaluates to 1/6, i.e. 16.6 %, because in the survey report (CEAPRED
2000) six mean doses are given for the three crops in the scenarios in two different areas of
the watershed. Consequently the final quantifiable probabilities of the worst and best cases are

23
0.416 % (Apel 2002).
The only unquantifiable factor remaining is the portion reaching the ground. For this only
qualitative statements can be given. While the assumption for the mean and best case may be
realistic for the mean and the cautious farmer, the “all to ground” assumption of the worst
case is quite unlikely to be found at every application date. This means that the probability of
the worst case is surely lower than the calculated 0.416 %, but to what extent cannot be
quantified with the information present. Taking these probabilities into account the
interpretation of all the scenarios for all four substances leads to the final risk assessment for
the watershed, which can be summarised with the following two points:
1. There is no acute risk of residue formation or groundwater or open water contamination
under the present situation.
2. There are chances of long term residue formation, especially with synthetic pyrethroids,
albeit of low probability (< 1%).
But again it has to be kept in mind this assessment refers to soils similar to the soil in the field
experiments only. This means that although this soil type is the most common, a complete risk
assessment for the whole watershed was not possible.
Based on this risk assessment and the underlying assumption four general recommendations
can be formulated in order to reduce the already low risks or to minimise the uncertainties still
present:
1. Improvement of the application techniques.
2. Increased control of the application doses.
3. Cautious use of synthetic pyrethroids.
4. Further research on different soils.66
References
Apel, H. (2002) Risk Assessment of Pesticides in the Mid-Hills of Nepal - Environmental Fate and Population Dynamics Modelling. PhD Thesis, Nat. Sciences Faculty Technical University Braunschweig, 127pp.
ARS-USDA (1999) Pesticide Properties Database; http://www.arsusda.gov/ppdb.html Environmental and Agricultural Policy Research, Extension and Development
CEAPRED (2000), Socioeconomic survey of the Jhikhu-Khola watershed. Center for Environmental and Agricultural Policy Research, Extension and Development (CEAPRED), unpubl. IPMS project report, Kathmandu, 47pp.

24
Di, H.J. and Aylmore, L.A.G. (1997), Modelling the probabilities of groundwater contamination by pesticides. Soil Sci. Soc. Amer. J. 61, 17-23
EXTOXNET (1999) The Extension Toxicology Network; http://ace.orst.edu/info/ extoxnet/ van Genuchten, M.T. and Wagenet, R.J. (1989) Two-site/two-region models for pesticide
transport and degradation. Soil Sci. Soc. Amer. J. 53, 1303-1310 Gerke, H.H. & van Genuchten, M.T. (1993) A dual-porosity model for simulating the
preferential movement of water and solutes in structured porous media. Wat. Resour. Res. 29(2), 305-319
Hornsby, A.G., Wauchope, R.D. & Herner, A.E. (1996) Pesticide Properties in the Environment. Springer, 227pp.
Richter, O., Diekkrüger, B. & Nörtershäuser, P. (1996) Environmental Fate of Pesticides - From the Laboratory to the Field Scale. VCH Verlagsgesellschaft, 281pp.
Tomlin, C. (1994), The Pesticide Manual incorporating The Agrochemicals Handbook. British Crop Protection Council, Surrey, UK, 1340

25
Financing the disposal of unwanted pesticides TERENCE J. CENTNER & LEWELL F. GUNTER Department of Agricultural and Applied Economics, University of Georgia, Athens, Georgia, USA 30602
Abstract
Significant quantities of unwanted pesticides are being retained by agricultural producers in
barns and other out buildings throughout the United States. USA state governments have
responded to the hazards posed by these pesticides by implementing programs to collect and
dispose of them. This paper discusses state’s experiences with different approaches to
pesticide collection and disposal. Alternative methods of funding pesticide collection and
disposal programs are presented, and efficiency and equity aspects of different funding
methods are discussed. Suggested characteristics of an effective response to the unwanted
pesticide problem include a permanent funding source, acceptance of pesticides from all small
businesses, and coordination of pesticide collections with household hazardous waste
programs.
Introduction
The problem of unwanted pesticides
Significant quantities of unwanted pesticides are being retained by agricultural producers in
barns and other out buildings throughout the United States. Some of these unwanted
pesticides are pesticides whose registrations were canceled or suspended by the
Environmental Protection Agency (EPA). Other unwanted pesticides were not used because
superior products replaced them. In some instances, producers changed crops or employed a
pesticide contractor and did not consume existing stocks. The Great Lakes regional EPA
office estimated that more than 13 million pounds of pesticides were stored in the six states of
that region (Jones 1993).
Landschaftsökologie und Umweltforschung 38 p. 25-35 Braunschweig 2002

26
Governments at all levels have expressed an interest in dealing with the potential problem
posed by stocks of unused pesticides. The EPA enacted a Universal Waste Rule to ease the
requirements for the safe disposal of unwanted pesticides and other common hazardous
wastes (Code of Federal Regulations, title 40, part 273, 1996). Many states have developed a
framework regulating the disposal of hazardous wastes through household and permanent
hazardous waste programs at local and county levels. An additional development at the state
level has been the creation of agricultural pesticide collection programs to provide a viable
disposal option for unwanted pesticides. Nearly every state has initiated a special agricultural
pesticide collection program to provide for the safe disposal of accumulated pesticides, and
nearly 10 million pounds of unwanted pesticides have been collected.
One impediment to the disposal of pesticides is cost. The lawful disposal of unwanted
pesticides pursuant to the Resource Conversation and Recovery Act (RCRA) is expensive
(U.S. Code 1994). Many persons have stored unwanted pesticides due to their unwillingness
to pay for their disposal. For governments, the funding of pesticide collection programs is a
limiting factor for the efforts provided by many states. Reported costs show that significant
amounts of money are needed to dispose of unwanted pesticides.
The high cost of unwanted pesticide disposal suggests that the availability of funding may be
critical to the removal of this environmental hazard. This paper focuses on costs of pesticide
collection and methods of funding collection programs. We begin by briefly discussing
federal provisions for the disposal of hazardous waste, since any collection efforts must
comply with these provisions. This is followed by a discussion of factors that affect the costs
of disposal. The third section uses results from a survey we conducted as the basis of a
discussion of state regulatory initiatives for pesticide disposal and approaches states have
taken to funding collection programs. The funding methods used by the states are then
compared and contrasted with respect to equity and efficiency considerations.
Federal provisions for the disposal of hazardous waste
The EPA delineates regulations that identify hazardous wastes and prescribes regulations that
espouse human and environmental safety under Subtitle C of the Resource Conservation and
Recovery Act (U.S. Code 1994). Detailed regulations for the disposal of hazardous wastes,
including pesticides to be disposed of or abandoned, have been set forth in Parts 260 through

27
272 of the Code of Federal Regulations (1996). Persons collecting wastes need an EPA
generator identification number. As hazardous waste generators, persons collecting wastes
must maintain a contingency plan, conduct employee training, prepare a manifest for each
shipment of collected materials, and use approved hazardous waste transporters to take the
materials to a designated hazardous waste treatment, storage, and disposal facility. These
provisions show a required infrastructure involving significant expenditures to deal with the
disposal of pesticides.
Relaxed regulations for universal hazardous wastes were prescribed in Part 273 of the Code of
Federal Regulations (1996) and the provisions are known as the Universal Waste Rule.
Universal hazardous wastes including pesticides, batteries, and thermostats are small qualities
of wastes held by many persons. Stocks of banned and unused pesticide products collected
and managed as part of a waste pesticide collection program qualify to be treated as universal
wastes. Under the relaxed rules of Part 273, persons managing agricultural pesticides with a
collection program qualify as handlers of universal wastes and have fewer burdensome
requirements than apply to generators under the Subtitle C requirements.
Costs of disposing of pesticides
When pesticides are abandoned or disposed of, rather than used for their intended purposes,
they are hazardous wastes, and they must be handled under federal hazardous waste
provisions. Besides costs of disposal, pesticide collection programs may incur special
expenses due to the type or condition of material or container. Aggregate disposal costs raise
questions concerning who should pay for the disposal of unwanted pesticides. Should owners
of particularly dangerous pesticides such as dioxins pay more due to higher disposal costs?
Who should pay the testing costs for an unknown pesticide? Should there be a fee for on-site
pickups or pesticides in deteriorated containers?
Not all pesticides cost the same to dispose of safely, and the disposal of some banned
pesticides has involved significant costs. Overall, states have not attempted to recapture these
expenses through participant charges. Indeed, some states have targeted banned pesticides due
to the greater threat they pose to the environment, though such pesticides often have greater
disposal costs. Given the age and storage conditions of unwanted pesticides, some pesticide
containers have lost their labels and their contents are unknown. A similar situation exists for
the on-site pickup of deteriorated containers. While a fee could be assigned to safety

28
inspections and on-site collections, states have absorbed the expenses of these measures as
part of the cost of removing stored pesticides.
Regulatory initiatives and funding options
Our examination of state pesticide collection efforts is based primarily on data collected in
1996 by the Michigan Department of Agriculture (Cubbage 1996) and a survey we sent to the
state lead agencies for pesticide regulation. The data compiled by the Michigan Department of
Agriculture summarizes several aspects of state pesticide collection efforts. For our survey,
each state was contacted and asked to supply additional information on their state pesticide
collection efforts. Follow-up phone calls were employed for over one-half of the states to
augment the reported information concerning safety features and the permanency of the state
collection efforts.
Our survey revealed that nearly one-half of the states have passed special legislation or a
designated state agency has enacted administrative regulations governing unwanted
pesticides. Survey responses about funding indicated that several states had instituted
programs to generate funds specifically for pesticide collection programs. Five different
methods have been used to raise such funds: (1) grants, (2) user fees, (3) state pesticide
registration fees, (4) taxing the sale of pesticides, and (5) surcharges or site taxes. Some states
employ more than one of these methods, as the use of one of these funding sources does not
preclude the use of another.
Grants
Some states have not assessed any charges against participants, relying on federal and state
monies to cover program costs. Grants for pesticide collection programs have come from the
EPA pursuant to programs under the Clean Water Act, the Federal Insecticide, Fungicide and
Rodenticide Act, and the Resource Conservation and Recovery Act (Beaver 1996, Jones
1993, Karnatz 1991,l Panter 1996, Tolar 1996, Vogel 1994). The U.S. Department of
Agriculture also has made monies available, and private companies have contributed funds in
some states (Karnatz 1991). Private contributions have also been made by pesticide retail
outlets through the provision of sites for the collections (Spitzmueller 1995). In other cases,
states have made special appropriations from general funds for collection programs.

29
The funding of many initial pesticide collection programs through federal grants has enabled
states to remove thousands of pounds of unwanted pesticides and dispose of them safely.
However, these efforts do not provide a basis for a pragmatic long-term response to the issue
of the safe disposal of unwanted pesticides due to the continued generation of such materials.
Moreover, applying for funding is time consuming and the management of short-term
individualized efforts may involve extra costs. Collection efforts dependent on largesse may
cause a state to forego the development of a more meaningful long-term collection program.
Therefore, while grants have been significant in addressing the environmental program of
accumulated pesticides, many states have arranged for additional funding.
User fees
An objective of some states is to have persons who own unwanted pesticides help pay
disposal costs through user fees. By adopting user fees, the pesticide disposal program does
not foster dependence on governmental benevolence for an expense connected with private
business activities. Conflicting concerns confront a user fee requirement. While user fees
make participants assume some responsibility for their unwanted pesticides, persons owning
unwanted pesticides may be less likely to participate when there is a fee. States intent on
requiring persons to help pay for the disposal of unwanted pesticides may discourage
participation so that significant quantities of unwanted pesticides remain in storage.
From an economic perspective, user fees may involve an inordinate amount of effort to raise
insignificant sums. Since user fees often do not cover the costs of disposal, provisions for
other sources of funds will be required. States organizing collection programs will need to
decide from their own experiences, needs and funding sources whether a user fee would be
appropriate.
State pesticide registration fees
A prevalent financing provision for states with established agricultural pesticide programs is
to use pesticide registration monies for collection programs. Separate from federal pesticide
registration fees under the Federal Insecticide, Fungicide, and Rodenticide Act, states are able

30
to charge an annual fee for the registration of each pesticide used in the state. Some states
specifically allocate part of the registration fee to cleanup and collection programs.
Regulatory provisions for minimum or maximum amounts that may be collected or used for
collection programs may also be important. The Michigan law provides for the suspension of
groundwater protection fees if the money in the fund exceeds $3,500,000 (Michigan
Compiled Laws Annotated 1996). In this manner, fees are discontinued if monies are not
needed for disposing of unwanted pesticides or funding environmental remedial projects. The
Michigan groundwater protection fee would be reinstated when the fund contained less than
$1,000,000 at the close of a succeeding fiscal year.
Pesticide and site taxes
Another funding possibility is a tax on pesticide products. Michigan has adopted a detailed
funding program that involves both registration monies and a tax on pesticides sold (Michigan
Compiled Laws Annotated 1996). There is a specialty pesticide groundwater protection fee of
$100 per product, with products excluding agricultural pesticides. Groundwater protection
fees for agricultural pesticides are 0.75% of wholesale value of the previous registration
year’s product sales or a minimum of $150. Monies are deposited into the freshwater
protection fund to be used for numerous purposes, including “pesticide pickup programs for
pesticides not currently registered for use” .
Some household hazardous waste programs use alternative surcharges and site taxes as a
means to help fund the collection of pesticides. Michigan has enacted provisions to allow
qualifying counties to impose a surcharge on households for waste disposal including
hazardous (Michigan Compiled Laws Annotated 1996). Households may be taxed $25 per
year for this service. Colorado enacted legislation for a site tax under which property owners
within the jurisdiction of the waste facility would be assessed a hazardous waste site tax
(Colorado Revised Statutes Annotated 1989). The funds raised from a site tax would be used
with other funds to pay for the cost of land, labor, equipment, and services needed for the
operation of the hazardous waste facility.

31
Efficiency and equity characteristics of funding sources
Although the funding methods described above have been implemented differently across
states, each funding approach is associated with certain characteristics with respect to its
impact on collection incentives and cost distribution. These characteristics are summarized in
table 1 which classifies equity and efficiency characteristics for each type of funding for two
objectives: the disposal of existing pesticide stocks and the disposal of pesticide stocks that
may be accumulated in the future. The equity rating is based on the “polluter-pays” principle
which is an application of conventional economic prescriptions to internalize negative
externalities by levying a fee or charge on firms or industries responsible for the pollution
(Runge 1994, p.70, 132). The potential efficiency rating is concerned with the potential of a
funding strategy to result in the “complete” disposal of stocks of unwanted stored pesticides.
Equity ratings in Table 1 range from lowest equity (1) to highest (3). An equity rating of 1
indicates that there is no linkage between the source of disposal funds and the ownership of
unwanted stored pesticides. An equity rating of 2 indicates a partial linkage between
ownership and disposal cost, and an equity ranking of 3 indicates that a high percentage of
disposal cost is borne by the owner of unwanted stored pesticides.
Potential efficiency indices in table 1 range from lowest efficiency (1) to highest (3). A
ranking of 1 indicates that the funding method provides a disincentive to pesticide disposal in
a voluntary program. An efficiency index of 2 indicates the absence of a disposal disincentive
associated with the funding method. An efficiency index of 3 indicates both the absence of
funding related disposal disincentives and the existence of incentives to reduce pesticide use.
Reducing pesticide use may lessen future disposal problems by reducing the quantities of
pesticides purchased.
Because the ability of a program to effect the complete disposal of unwanted pesticides is
influenced by more than the source of funding, Table 1 considers the potential efficiency of
each funding method. The level of disposal that is attained will be affected by both the size of
the pool of disposal funds and the specific characteristics of the disposal program.
Additionally, if participation in a disposal program is voluntary, the degree of disposal
attained by any program will depend on characteristics of owners of unwanted pesticides.
Some pesticide owners may want to be rid of stored pesticides to the extent that they would be

32
willing to pay some or all of the costs of disposal. Other owners may choose not to
participate, even in a no-fee disposal program, simply to avoid transactions costs (e.g. time
and paperwork) associated with the program.
Table 1 Efficiency and equity characteristics of funding methods
Existing Stocks
Future Stocks
Funding Method
Potential
Efficiency
Equity
Potential
Efficiency
Equity
Comments
Grants
2
1
2
1
uncertain sustainability
User fees
1
3
1
3
possible reduction in future accumulation
Registration fees
2
1
2
2
reduced pesticide use
Pesticide tax
2
1
3
2
reduced pesticide use
Site tax
2
1
2
1
Efficiency ratings: 1 - disincentive for disposal, 2 - no disincentive for disposal, 3 - no disincentive for disposal plus incentive for reduced accumulation. Equity ratings: 1 - no link between source of funds and ownership of unwanted pesticides, 2 - partial link between ownership and source of funds, 3 - strong link between ownership and source of funds.
The disposal of existing stocks of unwanted pesticides is distinguished from the disposal of
future pesticide stocks in Table 1 due to possible effects of the disposal-funding source on
pesticide accumulation. Since existing stocks are already in place, their accumulation cannot
be affected by the funding method used for a disposal program. The method of funding may,
however, affect future pesticide use, accumulation, and disposal costs. The highest efficiency
rating for disposal of existing stocks is therefore 2, since the source of funding cannot affect
accumulation of existing stocks. An efficiency rating of 3 is possible for the objective of
eliminating future unwanted stocks, since the funding method may affect future accumulation
as well as future disposal.
State or federal grants for the disposal of unwanted pesticide stocks were assigned efficiency
and equity ratings of 2 and 1, respectively, for both existing and future stock disposal. The
efficiency rating of 2 for existing stocks reflects the fact that grant funding imposes no
disincentives for disposal. The efficiency rating for grants is also 2 for future disposal because
grant funding provides no incentives to reduce future pesticide use. The equity rating of 1 for
both existing and future disposal under grant funding reflects the fact that grant funding is
supported by unspecified sources of state or federal dollars and is unrelated to ownership of
unwanted pesticides. A reliance on grants to fund pesticide disposal also raises questions

33
about sustainability of the disposal program over time, as this is not a continuous method of
raising funds, but is subject to periodic funding decisions by state or federal governments.
The use of user fees to finance disposal merits a 3 rating for equity in the disposal of both
existing and future pesticide stocks, because user fees are imposed directly on the owners of
these stocks. The efficiency rating of user fee financing is 1 for both existing and future
stocks, however, because the user fee creates a financial disincentive for owners of unwanted
pesticides to participate in a disposal program. A user fee program for disposal of future
stocks may reduce future pesticide use and accumulation, since the user knows he will pay for
disposal, but an efficiency rating of 1 was still assigned to user fee programs for future stocks
because, in a voluntary program, user fees still provide a disincentive for participation.
Registration fees, imposed on pesticide manufacturers, were assigned an efficiency rating of 2
for disposal of existing stocks because they do not create a barrier to participation.
Registration fees were also assigned an efficiency rating of 2 for disposal of future stocks,
because current fees on individual pesticides are too low to provide significant incentives for
reductions in future pesticide usage. If annual state pesticide registration fees were raised
sufficiently to increase the cost of purchasing pesticides, however, an efficiency rating of 3
for disposal of future stocks would be appropriate.
An equity rating of 1 was assigned to registration funding for disposal of existing stocks,
since the funds will come from current and future purchasers of pesticides rather than current
owners of unwanted pesticides. The equity rating increases to 2 for disposal of future stocks
because future owners of unwanted stocks will be a subset of current and future pesticide
purchasers. The equity rating is 2 rather than 3, however, because fees on purchasers who do
not accumulate unwanted pesticides will be subsidizing the disposal costs of purchasers who
do accumulate these stocks.
Pesticide tax funding for disposal was assigned an efficiency rating of 2 for disposal of
existing stocks, due to the absence of participation disincentives, and 3 for disposal of future
stocks. Pesticide taxes act to discourage future pesticide use as they reduce prices received by
pesticide producers and increase cost for pesticide users in accordance with pesticide supply
and demand elasticities (Gunter et. al. 1996). Pesticide taxes were assigned an equity rating of
1 for disposal of existing stocks, because costs are imposed on future pesticide users rather

34
than on owners of existing unwanted stocks. This rating was increased to 2 for disposal of
future stocks, because accumulators of future stocks would be subject to the tax when they
purchased pesticides.
Site taxes provide funds for disposal by imposing a cost on individuals residing within a
specific political boundary. Site taxes were assigned efficiency ratings of 2 for disposal of
both existing and future stocks, since they do not create participation disincentives, but neither
do they create disincentives for future accumulation. Site taxes were assigned equity ratings
of 1 for disposal of both existing and future stocks, since they are based on location rather
than on ownership of unwanted pesticides.
The five funding options discussed above represent options that have been used in the states,
as indicated by our survey results. In terms of cleaning up existing stocks of unwanted
pesticides, it should be noted that none of these options provides incentives for participating
in a collection program. At best, existing programs avoid disincentives to participation by not
charging owners of unwanted pesticide stocks for collection, and attract participants whose
utility from being rid of such stocks outweighs the effort required to participate. Greater
participation could likely be obtained by providing financial incentives for participation,
perhaps through a bounty on pesticides, which are brought in. Although this approach might
increase the collection of existing stocks, however, the problem of future accumulation of
unwanted stocks might be exacerbated, if pesticide users expect this type of program to be
available in the future. Additionally, the polluter-pays concept for assigning costs would be
reversed under a program of financial incentives for unwanted pesticide owners, and funding
requirements for collection programs would increase.
Concluding comments and implications
The continued storage of unwanted pesticides creates the risk of potential environmental
contamination by a natural disaster; a tornado or a flood could cause a stored pesticide to be
dispersed into the ground or water. Farm properties sold or inherited often mean that
pesticides are passed to persons who have not had training or experience in using them. In
many cases, persons possessing or inheriting pesticides lack knowledge of how to dispose of
them safely. The hazards created by unwanted pesticides have led states to provide for the

35
collection and proper disposal of unwanted pesticides as a precautionary measure that
safeguards citizens and natural resources.
States have found that multiple collections over a number of years are necessary to attain the
removal of most accumulated stocks of unwanted pesticides. Given differences in population,
amounts of accumulated pesticides, dangers posed by unwanted pesticides, and other
hazardous waste collection efforts, recommending a single strategy for all states is not
possible. Costs are an important consideration in pesticide collection efforts. In view of the
new Universal Waste Rule and its relaxed requirements concerning pesticide collections,
achieving lower collection costs should be possible. Once states have removed large
quantities of stored pesticides, they can probably forego participant registration and move to a
relaxed program where costs would be about $1 per pound.
If pesticide collection programs are to remain voluntary, states may want to consider different
programs for the disposal of existing and future unwanted pesticide stocks. It may be
necessary to give greater weight to efficiency considerations in facilitating the cleanup of
existing stocks, since a high rate of participation will be needed to accomplish a high level of
disposal. “Polluter-pays” considerations, which attempt to internalize the externality
associated with unwanted pesticides by charging pesticide producers and consumers for the
cost of collection programs, may be given greater emphasis in designing programs to reduce
future stocks of unwanted pesticides. Registration fees and pesticide taxes are attractive
funding sources for disposal of future stocks since they impose disposal costs on pesticide
manufacturers and users, may provide disincentives to future pesticide accumulation, and
avoid disincentives to participation in collection programs. An annual registration
fee/pesticide tax system also has the advantage of providing a continuing source of funds.
States with other hazardous waste collection programs may find that these programs can be
used with agricultural pesticide collections.
Descriptions of the approaches and experiences of the states in addressing the problem of
unwanted pesticides are useful in understanding many of the practical difficulties and
considerations associated with pesticide disposal. In some ways, the state efforts thus far can
be viewed as independent pilot or demonstration programs for pesticide disposal. Although
there are differences in the unwanted pesticide problem in each state, there are also many
similarities, which may permit states to benefit from the experiences of others.

36
The ability of states to improve their collection efforts by learning from each other’s
experiences would be greatly enhanced by improvements in data collected on unwanted
pesticide quantities and characteristics, pesticide collections, and on the characteristics of
collection programs. With such data, anecdotal and theoretical analysis of collection programs
may be supplemented with empirical studies of the effectiveness of different approaches.
Acknowledgement
This paper is based on our earlier article: Centner, Terence J. and Lewell Gunter (1999)
Financing the disposal of unwanted agricultural pesticides. Environment International 25,
635-646.

37
References
Beaver, B.A. (1996) Results of pesticide use collection programs. Proc. 1996 Illinois Pesticide
Conf., State of Illinois, Urbana-Campaign, Illinois, USA, 152-160 Code of Federal Regulations. (1996) Title 40, parts 260-273Colorado Revised Statutes Annotated. (1989) Section 25-15-213
Cubbage, C.P. (1996) State Agricultural Pesticide Collections Survey. Michigan Department of Agriculture, Lansing, Michigan, USA Federal Register. (1995) Vol. 60, pp. 25492-25539
Gunter, L.F., K.H. Jeong and F.C. White. (1996) Multiple policy goals in a trade model with explicit factor markets. Amer. J. Agricult. Economics 78, 313-330
Jones, M. (1993) Agricultural Clean Sweep: Waste Pesticide Removals 1988-1992. U.S. Environmental Protection Agency, Region 5, Chicago, Illinois, USA
Karnatz, A. (1991) Obsolete Pesticide Disposal Project. Vermont Department of Agriculture, Food & Markets, Montpelier, Vermont, USA
Michigan Compiled Laws Annotated. (1996) Sections 124.508a; 324.8716 New York State Department of Environmental Conservation (1993) Technical
Administrative Guidance Memorandum 2006. Division of Hazardous Substances Regulation, Albany, New York, USA
Panter, K.L. (1996) Northern Colorado Front Range Pesticide Recovery Program, Project Final Report. Colorado State University Cooperative Extension, Lakewood, Colorado, USA
Runge, C. Ford. (1994) Freer Trade, Protected Environment. Council on Foreign Relations Press, New York, USA
Spitzmueller, J. (1995) 1994 Report of Waste Pesticide Collection in Minnesota. Minnesota Department of Agriculture, St. Paul, Minnesota, USA
Tolar, B.R. (1996) Summary Report: ‘Georgia Clean Day ’95.’ Georgia Department of Agriculture, Atlanta, Georgia, USA
United States Code (1994) Title 42, sections 6921–6939e Vogel, S. (1995) Project Safe Send - A Report to the 1995 North Dakota Legislature on Waste
Pesticide Collection and Recycling of Pesticide Containers. North Dakota Department of Agriculture, Bismarck, North Dakota, USA

38
Collaborative project on environmental risks of pesticides and sustainable development of Integrated Pesticide Management System (IPMS) in Nepal considering socio-economic conditions ANDREAS HERRMANN & SYBILLE SCHUMANN Institute of Geoecology, Technical University Braunschweig, Langer Kamp 19c, 38106 Braunschweig, Germany
Abstract
The paper informs about some major structural and organisational issues of a collaborative
project on IPMS in Nepal, with the Kathmandu workshop on environmental risk assessment
of pesticides and IPM as a specific project component. Its strictly informal character is
thought to allow quick orientation about concept, organisation, partnerships, database, main
results and appropriate references. Articles which are included in this proceedings volume
will be directly referred to. Website indications of project partners may satisfy further
information needs.
Starting point
Pesticide misuse is an increasing problem in developing countries and, therefore, also in
Hindu Kush-Himalayan (HKH) region (Neupane 2002) and in Nepal (Baker & Gyawali 1994,
Dahal 1995, Kansakar et al. 2002, Palikhe 2002, Shrestha & Neupane 2002, Upadhyaya 2002,
Neupane 2002). It may causeyield reduction as a result of combined resistance, resurgence
and secondary pest outbreaks, and damages of environmental resources like water and soils,
and health problems which affect both farmers and consumers as well. To mitigate direct
impacts of pesticides and through food chain on man and the environment again and again the
same demands are being raised with respect to creating the political, scientific and educational
fundamentals, and to regulations considering political, economic, agronomic and socio-
economic aspects and practices.
Landschaftsökologie und Umweltforschung 38 p. 38-48 Braunschweig 2002

39
To investigate risks of pesticides in subtropical environment a collaborative research project
was started in 1999, and ends in 2002 (Herrmann 2001, Herrmann & Schumann 1999,
Schumann & Herrmann 2000; www.tu-bs.de/institute/igg/physhyd/index.html). The project is
funded by Volkswagen-Stiftung Foundation, Germany.
Research concept and project structure
The project aims at developing adequate, scientifically-based Integrated Pesticide
Management System (IPMS) for Nepal which could be applicable to whole HKH region. As
experimental example Jhikhu Khola catchment basin of 111.41 km² and 750-2100 m a.s.l.
was chosen which is located in the mid-hills of central Nepal in a market-near position at
Arniko highway at about 50 km east of Kathmandu (Fig. 1). The key tool of the project is data
base containing relevant environmental and socio-economic data (Fig. 2).
Reliable data are above all necessary with respect to development of model scenarios by
which alternative solutions of reduced pesticide applications can be developed and tested
considering official regulations and economic constraints with regard to sustainable
environmental protection. In this respect an appropriate concept will be elaborated for
cultivation of vegetables and grains in Nepal in cooperation with geographic, geo-ecologic
and agro-ecologic sciences in particular and with ecological chemistry, hydrology and
economics on the one hand, and with local authorities and stakeholders on the other hand. The
complex problem is met with a multilateral approach which consists of scientific (pesticidal
[Apel 2002, Apel et al 2002, Apel & Richter 2002, Khanal & Pujara 2002, Kreuzig & Bahadir
2002, Vinke et al. 2002] and environmental [Herrmann et al. 2001, Schumann 2002,
Schumann et al. 2001, 2002, Piepho 2002]) and socio-economic components (Herrmann et al.
2001, Wiebelt 2002, Shrestha & Neupane 2002, Ceapred 2000, 2001) (Fig. 2) to be worked at
in cooperation with local governmental, consulting and research institutions. The
organisational structure of the project of the project is shown in Fig. 3 together with main
fields of activity. Project partners are listed in the Annex.

40
Experimental design
Field experiments refer to both bari (rainfed) and khet (irrigated) land with the latter much
more affected by pesticide application. Flow paths, origin and age of surface and subsurface
waters which control transport and storage of pesticides within and pesticide export from the
agro-ecosystem are studied by using for instance environmental isotopes (Herrmann et al.
2001), and transport of water and pesticides is planned will be calculated for the study system
as a whole, and especially for specific compartments such as unsaturated soil zone (Schumann
2002) and aquifers with the help of appropriate mathematical models. Altogether there is an
urgent need for the evaluation of environmental hazards and risks of water-induced pesticide
pollution to demonstrate possible damages of the environment including man for different
pesticide application scenarios.
0 10 20 30 km
Experimental site
Fig. 1 Geographical situation of project’s experimental sites

41
Fig. 2 Summary of concept and contents of the research programme

42
GSF-HYDIsotope hydrology.Isotope tracerexperiments.
PHYSHYDProject leader
Hydrological-climatologicalmeasurements andmodelling.Soil andgroundwaterhydrology: flowand transport.Tracer experiments
AGROOEKModelling of pesticidedegradation.Environmental riskanalyses.Development of anexpert system forIntegrated PesticideManagment.
OEKOTOXResidue analyses ofpesticides.Interpretation ofanalytical results.Investigation ofdegradation & sorption.
ICIMODAdvice onecological andhydrologicalissues.Data transfer.
TU-BS
DHMHydrologicalmeasurements anddata.Water balances.
Pesticide analysespreparation laboratory.
IfWNational economy;Development ofcontrol strategies.
CEAPREDSocio-economic andagricultural surveys.
DOANepal Project Coordination
Collaboration insocio-economicsurvey.Plant protection andextension measures.IPM field experiments.
Environmental issues
Pest and Pesticide issues
Socio-economic issues
TUAssistance inenvironmentalfield survey.
Assistance in socio-economic surveys.
Fig. 3 Organisational and scientific project structure with
Selected results and conclusions
With respect to hydrology:
• For complex hydrological systems which are focussed as part of even more complex
environmental systems (as e.g. agro-ecosystems) multilateral Integrated Catchment
Approach (ICA) concepts seem to be indispensable and island solutions seem irrelevant.

43
• Under subtropical monsoon climate the input variations of stable isotopes can be big
enough to use their tracing ability and herewith connected modelling tools similar as for
the mid-latitudes.
• In irrigated environments, surface runoff processes dominate which are mainly
controlled through monsoon, and are modified by irrigation schemes. Hence mixing
isotopic effects of rain and irrigation water prevail hydrological khet systems thus
limiting reliable flood hydrograph separations.
• A most crucial task is the quantification of hydrological and hydraulic conditions of
water storage within the temporarily (at least partially) saturated upper soil zone and of
the vertical and lateral transfer through this zone. The study of preferential flow pattern
should be focussed in this context. However, this can be done with reasonable effort on
plot scale only.
With respect to pesticides:
• Preliminary results show, that actual environmental pollution through pesticide storage
in the top soil and their water-bound transport is less than expected from the observed
pesticide application quantities due to soil properties and climatic conditions. Next, a
concentration on pesticide transport within vadose zone and residue analysis in
harvested crop is needed.
• Health risks might still be through pesticide accumulation in the food chain and unsafe
application practices. For these the project could not account since these questions are
not within it‘s work-scope. Lacking precautions also comprise too short waiting periods
between pesticide application and crop consumption.
• Under field conditions target compounds compounds malathion, dimethoate, fenvalerate
and metalaxyl disappear faster than in the lab. During flooding field plots, substance are
transported to deeper soil layers up to 50 cm except malathion. Although concentrations
found after 2-3 weeks are rather low, long term accumulation and leaching cannot be
excluded if large amounts of pesticides are applied repeatedly. Especially for
fenvalerate a quantitative risk assessment is hard to make because of complex sorption

44
behaviour.
With respect to socio-economy:
• Feasibility of measures for environmental protection, hence of project results, is difficult
due to lack of money, resources and control instances and the relative economic
unimportance of pesticides.
• The regional infrastructure of the Nepali government on district scale serves as a good
basis to educate farmers about hazards and risks of pesticide use, and on proper choice
and use of pesticides.
Acknowledgement
Funding of the IPMS project by the Volkswagen-Stiftung Foundation is acknowledged with
appreciation.
References Apel, H. (2002) Risk Assessment of Pesticides in the Mid-Hills of Nepal - Environmental
Fate and Population Dynamics Modelling. Landschaftsökologie und Umweltforschung 41, Braunschweig (in print)
Apel, H., Paudyal, M.S. & Richter, O. (2002a) Environmental risk assessment and treatment strategies of pesticide use in the Jhikhu Khola watershed based on the modelling of the environmental fate of pesticides in soil. Extended Abstracts, Proc. Internat. Workshop on Environmental Risk Assessment of pesticides and Integrated Pesticide Management in Developing Countries, Kathmandu Nov. 2001. Landschaftsökologie und Umweltforschung 38, Braunschweig, 14-25
Apel, H., Paudyal, M.S. & Richter, O. (2002b) Population dynamics and treatment strategies of Phytophthora infestans (late blight) in the Mid-Hills of Nepal. Proc. Internat. Workshop on Environmental Risk Assessment of pesticides and Integrated Pesticide Management in Developing Countries, Kathmandu Nov. 2001. Landschaftsökologie und Umweltforschung 38, Braunschweig, 1-13
Baker, S.L. & Gyawali, B.K. (1994) Promoting Proper Pesticide Use in Nepal. HMG Ministry of Agriculture/Winrock Internat. Report Ser. 28, Kathmandu, 55pp.
CEAPRED (Center for Environmental and Agricultural Policy Research, Extension and Development) (2000) Baseline Survey of Pesticide Use at Jhikhu Khola Catchment Area. Unpubl. Report, Kathmandu, 48pp.
CEAPRED (Center for Environmental and Agricultural Policy Research, Extension and Development) (2001) Report on the Second Socio-economic Survey. Unpubl., Kathmandu, 12pp.

45
Dahal, L. (1995) A Study on Pesticide Pollution in Nepal. NPC/IUCN NCS National Conservation Strategy Implementation Project. Kathmandu, 124pp.
Herrmann, A. (2001) Probleme und Chancen eines multilateralen Forschungskonzepts zur Minderung der Pestizidbelastung der Umwelt durch ein Integriertes Pestizid-Management-System in Entwicklungsländern am Beispiel Nepals (Problems and chances of a multilateral research concept for mitigating environmental impact of pesticides by Integrated Pesticide Management System in developing countries using Nepal as example). In: H.-W. Rengeling & H. Hof (eds) Instrumente des Umweltschutzes im Wirkungsverbund. Interdisziplinäres Kolloquium, zugleich Siebte Osnabrücker Umweltgespräche. Nomos Verlagsges. Baden-Baden, 137-152
Herrmann, A. & Schumann, S. (1999) Ein Forschungsansatz zu Umweltrisiken von Pestiziden und der nachhaltigen Entwicklung eines Integrierten Pestizid-Management (IPM) unter Berücksichtigung der sozioökonomischen Verhältnisse in Nepal. Proc. GEOökon ’99 Umweltanalyse-Dynamik natürlicher und anthropogener Systeme und ihre Wechselwirkungen, Braunschweig Okt. 1999, Landschaftsökologie und Umweltforschung 33, Braunschweig, 235-245
Herrmann, A., Schumann, S., Neupane, F.P., Niraula, B.B., Wiebelt, M., Khanal, N.R., Pujara, D.S. & Upadhyay, B.P. (2001) Chances of Protecting Middle Mountains Environments in Central Nepal from Pesticide Misuse Considering Socio-Economic condiditions. Proc. Kathmandu Symp. on the Himalayan Environments: Mountain Sciences and Ecotourism/Biodiversity 24-26 Nov. 2000, 246-260
Kansakar, V.B.S, Khanal, N.R. & Ghimire, M. (2002) Use of insecticides in Nepal. Proc. Internat. Workshop on Environmental Risk Assessment of pesticides and Integrated Pesticide Management in Developing Countries, Kathmandu Nov. 2001. Landschaftsökologie und Umweltforschung 38, Braunschweig, 92-100
Kreuzig, R. & Bahadir, M. (2002) Pesticides in soils. Experimental design of laboratory, lysimeter and field studies. Proc. Internat. Workshop on Environmental Risk Assessment of pesticides and Integrated Pesticide Management in Developing Countries, Kathmandu Nov. 2001. Landschaftsökologie und Umweltforschung 38, Braunschweig, 101-112
Neupane, F.P. (2002) Synopsis of Use and Economic Value of Pesticides and Chances for Reduced Application Rates at Different Scales in Hindu Kush Region. CEAPRED, Kathmandu, 16pp.
Palikhe, B.R. (2002) Challenges and options of pesticide use: In the context of Nepal. Proc. Internat. Workshop on Environmental Risk Assessment of pesticides and Integrated Pesticide Management in Developing Countries, Kathmandu Nov. 2001. Landschaftsökologie und Umweltforschung 38, Braunschweig, 132-143
Piepho, B. (2002) Evaluation of simulated hydrological behaviour in a small catchment by using the model WaSiM. A case study within the IPMS Project in Nepal. Proc. Internat. Workshop on Environmental Risk Assessment of pesticides and Integrated Pesticide Management in Developing Countries, Kathmandu Nov. 2001. Landschaftsökologie und Umweltforschung 38, Braunschweig, 144-157
Pujara, D.S. & Khanal, N.R. (2002) Use of pesticides in Jaishidihi subcatchment, Jhikhu Khola watershed, middle mountain in Nepal. Proc. Internat. Workshop on Environmental Risk Assessment of pesticides and Integrated Pesticide Management in Developing Countries, Kathmandu Nov. 2001. Landschaftsökologie und Umweltforschung 38, Braunschweig, 170-179
Schumann, S. (2002) Fast estimation of pesticide risk potential on groundwater through the use of a dye tracing technique. Proc. Internat. Workshop on Environmental Risk Assessment of pesticides and Integrated Pesticide Management in Developing

46
Countries, Kathmandu Nov. 2001. Landschaftsökologie und Umweltforschung 38, Braunschweig, 180-190
Schumann, S. & Herrmann, A. (2000) Multilateral approach of an Integrated Pesticide Management System (IPMS) for sustainable agriculture in Nepal. Proc. Wageningen Conf. on Angricultural Effects on Ground and Surface Waters. Research and Policy at the Edge of Science and Society 1-4 Oct. 2000, Vol. Regional Scale Research
Schumann, S., Herrmann, A., Stichler, W. & Prajapati, S.B. (2001) Tracer hydrological investigations in a small irrigated agricultural basin in Nepal to evaluate environmental risks of pesticides. Proc. XXXI IAH Congress on New Approaches to Characterising Groundwater Flow Munich 10-14 Sept. 2001, Vol. 1, Balkema, 189-194
Schumann, S., Stichler, W. & Prajapati, S.B. (2002) Underground water passages and runoff formation pattern in a khet catchment. Proc. Internat. Workshop on Environmental Risk Assessment of pesticides and Integrated Pesticide Management in Developing Countries, Kathmandu Nov. 2001. Landschaftsökologie und Umweltforschung 38, Braunschweig, 191-204
Upadhyaya, N.S. (2002) Experiences of community IPM in Nepal. Proc. Internat. Workshop on Environmental Risk Assessment of pesticides and Integrated Pesticide Management in Developing Countries, Kathmandu Nov. 2001. Landschaftsökologie und Umweltforschung 38, Braunschweig, 256-264
Vinke, C., Kreuzig, R. & Bahadir, M. (2002) Analytical investigations on the fate of pesticides in soils of the Jhikhu Khola catchment. Proc. Internat. Workshop on Environmental Risk Assessment of pesticides and Integrated Pesticide Management in Developing Countries, Kathmandu Nov. 2001. Landschaftsökologie und Umweltforschung 38, Braunschweig, 265-275

47
Annex Project coordinator Project manager Prof. Dr. Andreas Herrmann Dipl.-Hyd. Sybille Schumann Institute of Geoecology Institute of Geoecology Dept. of Hydrology and Landscape Ecology Dept. of Hydrol. and Landscape Ecology Technical University Braunschweig Technical University Braunschweig Langer Kamp 19c Langer Kamp 19c D-38106 Braunschweig D-38106 Braunschweig E-mail: [email protected] E-mail: [email protected] Website: www.tu-bs.de/institute/igg/physhyd/ German partners: Prof. Dr. Dr.h.c. Ali Müfit Bahadir Institute of Ecological Chemistry and Waste Analytics Technical University Braunschweig E-mail: [email protected] Website: www.tu-bs.de/institute/oekochem/oekochem.html Prof. Dr. Otto Richter Institute of Geoecology Department of Environmental Systems Analyses Technical University Braunschweig E-mail: [email protected] Website: www.tu-bs.de/institute/igg/ag-aus/ Dipl.-Phys. Willibald Stichler Institute of Hydrology Research Centre for Environment and Health Munich-Neuherberg E-mail: [email protected] Website: www.gsf.de/Forschung/Institute/ifh.phtml Dr. Manfred Wiebelt c/o Institute of World Economics at Kiel University E-mail: [email protected] Website: www.uni-kiel.de/ifw/organetz.htm#Forschungsabteilung II: Partner institutions in Kathmandu, Nepal: Department of Hydrology and Meteorology A.P. Pokhrel, Director General E-mail: [email protected]

48
Department of Agriculture Plant Protection Directorate K.K. Shrestha, Director E-mail: [email protected] Center for Environmental and Agricultural Policy Research, Extension and Development (CEAPRED) Dr. H.K. Upadhyaya, Chairman E-mail: [email protected] Central Department of Geography, Tribhuvan University Prof. Dr. V.B.S. Kansakar E-mail: [email protected] International Centre for Integrated Mountain Development (ICIMOD) Dr. G. Campbell, Director General Website: www.icimod.org

49
Use and handling practices of pesticide in hybrid vegetables and maize seed productions in Bangladesh: A case study of BRAC contract farmers ZABED HOSSAIN & LAMMIA SHARMIN Research and Evaluation Division, BRAC, 75 Mohakhali, Dhaka 1212, Bangladesh SANZIDUR RAHMAN Food Consumption and Nutrition Division, International Food Policy Research Institute, Washington D.C., USA
Abstract
Composition of pesticides used for producing hybrid vegetables and maize seeds and farmers’
awareness on effects of pesticide use are examined using survey data from randomly selected
65 ‘contract seed growers’ in northwestern Bangladesh. Pesticide cost accounts for about 6%
of the gross value of output. Eighty-eight percent of farmers used pesticides at least once. In
most cases, actual application rate exceeded the recommended dose. Also, frequency of
pesticide use was alarming. Mean number of application is 3.1 times (range 1–10 times) in a
crop cycle. Although farmers seemed to be aware of health hazards associated with chemicals,
they also used banned pesticides. Among the pesticide users, 35% reported use of
organophosphates, ranked from extremely to highly hazardous by the World Health
Organization. Perceived positive effects of pesticides outweigh the harmful effects that need
to be properly evaluated. A major thrust for raising farmers’ awareness on effects of
pesticides use, expansion of the IPM practices, and undertaking policy advocacy to devise
pesticides regulation and effective implementation were suggested.
Introduction
Emergence of pest resistance to pesticides is one of the major negative aspects of pesticide
use and is compounded by a widespread assumption that chemicals are harmful to human
health and the environment. There is widespread acceptance that the modern agricultural
technologies are much more prone to insect, pest and disease infestations. Lichtenberg &
Nguyen (2001) mentioned that although the benefits of the use of pesticides to prevent crop
losses and increase foodgrain production is well recognized, its unwanted side effects on
Landschaftsökologie und Umweltforschung 38 p. 49-61 Braunschweig 2002

50
human health and environment have a major concern. Therefore, with the increased diffusion
of ‘green revolution’ technology in regions of Asia, Latin America and Africa, and the present
thrust in the promotion of ‘hybrid technology’ , pesticides have become and will continue to
be a major component of modern day agriculture.
Pesticide use in Bangladesh, negligible until the 1970s, has recorded a dramatic rise in recent
years. Rahman & Thapa (1999) reported that the use levels of pesticide increased from 2,200
metric tons in 1980-1982 to 6,500 metric tons in 1992-1994 and modern rice cultivation
increased from 29.3% of total rice area to 49.0% during the same period.
Motin (2000) found an alarming feature of pesticide use in Bangladesh where farmers are
reported to use some pesticides which are already banned worldwide including Bangladesh
Also, little is known about the knowledge and handling practices of pesticides of Bangladeshi
farmers. In general, most of the Bangladeshi farmers do not have any ‘ formal education’ and,
therefore, are not in a position to read the instructions (if any) on the containers to safeguard
from adverse health effects of pesticides, unless the existing agricultural extension network
makeup the deficiency.
The present study examines the composition and levels of pesticides used, handling practices
as well as assess the level of awareness on pesticide use by the farmers engaged in the
production of ‘hybrid vegetable and maize seeds’ in Bangladesh supported by BRAC, a
national non-government organization.
BRAC initiated a program to involve landless, marginal and small farmers by undertaking a
comprehensive agricultural developmental program in 1996. Its Agriculture Extension
Program aims to increase the nutritional and income status of the rural households by
increasing agricultural production through technology transfer, quality input supply and
sharing knowledge of better organizational and management practices with small and landless
farmers. It promotes and diffuses an estimated 81 types of modern and/or hybrid varieties of
field crops to its beneficiaries as well as marginal and small farmers. Between 1996 and 2000
approximately 100,000 women were trained as vegetable growers and at present BRAC
produces about 90% of the maize seeds and 35% of the vegetable seeds in Bangladesh as
mentioned in BRAC (2000).

51
Since ‘hybrid technologies’ are highly chemical input intensive, knowing the composition of
these chemicals and the handling practices adopted by the farmers can provide information on
its potential hazards and assist us in suggesting ways of improving the condition of these
programs. The study is expected to contribute to limited knowledge on the chemical use
aspects of BRAC’s agriculture development program. It is also expected that such study
would help devise more environment friendly rural development interventions.
Sources of data
The research was based on a survey conducted among the BRAC supported ‘contract hybrid
vegetable and maize seed producers’ including a survey of BRAC’s own ‘ foundation seed’
production farm located in Dinajpur district. A pre-tested structured questionnaire was
utilized. Although BRAC operates its various programs throughout Bangladesh, the hybrid
vegetable and maize seed production program is concentrated in specific regions of the
country where it is supported by its seed production farm in Dinajpur as well as its seed
processing center in Bogra district. Therefore, information on chemical use and handling
practices was collected at random from a total of 65 contract vegetable and maize seed
growers from 29 villages of 6 upazilas (sub-districts) of Dinajpur and Bogra. The
questionnaire was designed according to the level of the respondents’ understanding. Data
collection was conducted for a period of two weeks during March 27–April 10, 2000.
Results
Composition of pesticides
Pesticides used for agriculture may be broadly classified in four categories: (a)
organophosphate, (b) organochlorine, (c) carbamate, and (d) pyrothroid. According to WHO
(1984), pesticides of organophosphate and organochlorine group are highly hazardous for
human health.
Composition of pesticides used by BRAC contract farmers is presented in Table 1. A total of
27 brands of pesticides were used. Among these 27 brands, 11 are banned worldwide
including Bangladesh as mentioned by Motin (2000). An alarming 65.4% of farmers used
Darsban, a banned pesticide. Though no information on human health component was
collected in this study, one can get an indication of potential human health hazard by

52
observing the type and level of pesticides used. It is evident from Table 1 that
organophosphates are used by 35.4% of farmers followed by organochlorines (32%) and
pyrothroids (26.5%) that contains most of the banned pesticides. Carbamates are used by only
6.1% of farmers.
Table 1 Proportion of farmers using various pesticides for seed production
Pesticide group WHO chemical hazard category
Number of brands used
Percent of farmers using pesticides
Organophosphate IA, IB, II 11 35.4 Carbamate IA, IB, II, III 5 6.1 Organochlorine IB, II 5 32.0 Pyrothroid II 6 26.5 Total 27 100.0
Note: IA = extremely hazardous, likelihood to hospitalize or long term illness. IB = highly hazardous, likelihood to hospitalize or long term illness. II = moderately hazardous, likelihood for more than two days of sickness, need to see physicians III = slightly hazardous, likelihood for dizziness or vomiting or blurred vision or skin rash. Sources: WHO (1984); Field Survey (2000) Use level of pesticides
As pesticides are used with greater frequency, that is, as and when required, even the minimal
doses eventually add up to a large rate of application. Although the standard recommended
rate by BRAC staff (in verbis) is 4 ml and/or g per decimal (1 decimal=40.4686 square metre)
of land for each application, the average level of pesticide application by farmers seems
alarming estimated at 2.8 kg of active ingredients per ha (Table 2). The application rate was
highest for vegetables (3.4 kg of active ingredients per ha) followed by maize (3.1 kg of
active ingredients per ha). In other words, the cumulative application rises to 14 ml or g/dec in
vegetables and 13 ml or g/dec in maize seed production.
Cost of pesticide use is estimated at Tk. 1,331 per ha and the highest cost is in vegetables (Tk.
1,485 per ha) followed by maize (Tk. 1,223 per ha). The overall factor share of pesticides is
estimated at 6% of gross value of output and is highest in vegetables (7.4% of gross value of
output) (Table 2).
Table 2 Pesticide application rates and costs per hectare of vegetable and maize seed
production

53
Pesticide use rate (ml or g/ha)
Pesticide cost (Tk./ha)
Pesticide cost as share of gross value of
output (%)
Crop name Number of observa-tions Mean
value Standard deviation
Mean value
Standard deviation
Mean value
Standard deviation
Vegetables 66 3444.6 8830.3 1484.8 1505.3 7.4 14.0
Leafy vegetables 32 1400.1 1345.0 1060.9 1266.8 4.7 7.2 Maize 14 3116.8 3640.4 1222.6 964.0 2.2 4.7 All crops 112 2819.5 6967.2 1330.9 1385.8 6.0 11.6 Note: Considering the types of crops produced by these 65 farmers, the total number of observations stands at 112: leafy vegetables 32, vegetables 66, and maize 14, respectively.
1 US$=56.50 Tk as of November 15, 2001. Source: Field Survey (2000) The frequency of application varies widely ranging from 1 to 10 times in a single seed
production cycle. Also, frequency of pesticide use is highest in vegetables and leafy
vegetables (Table 3). Overall, 88% of all farmers used pesticides at least once in a crop
season, while the remaining 12% did not use any pesticides. In the case of vegetables, 94% of
farmers applied pesticides at least once and a substantial 14% of the farmers applied
pesticides more than five times. In the case of maize, however, 71% of farmers applied
pesticides only once in a crop season.
Table 3 Number of application of pesticides in a crop season
Percentage of farmers Number of applications of pesticides Leafy vegetables Vegetables Maize All crops Farmers applying pesticides 78.1 93.9 85.6 88.4 One time 6.3 10.6 71.4 17.0 Two times 18.8 22.7 7.1 19.6 Three times 31.3 18.2 0 19.6 Four times 12.5 21.2 0 16.1 Five times 6.3 7.6 0 6.3 More than five times 2.9 13.6 7.1 9.8 Farmers not applying pesticides 21.9 6.1 14.4 11.6 Total 100.0 100.0 100.0 100.0 Mean number of application 2.50 3.79 1.29 3.10 Standard deviation 2.05 3.52 1.44 3.08 Total number of observations 32 66 14 112 Source: Field Survey (2000)
The frequency and cumulative use of pesticides of various categories is alarmingly high in
BRAC ‘ foundation seed’ production farm at Dinajpur (Table 4). The net sown area of the
seed farm is approximately 2 ha where ‘ foundation seeds’ of a large variety of hybrid

54
vegetables for both summer (kharif) and winter (rabi) seasons are produced. Consequently,
the total amount of active ingredients of pesticides going to a limited soil area of only 2 ha
reaches an alarming level. Table 4 clearly reveals that this small plot ultimately received an
estimated total of 11.7 kg of organophosphates, 6.9 kg of carbamates, 6.8 kg of
organochlorines, and 3.8 kg of pyrothroids in active ingredients in a one-year crop cycle.
Among the individual crops, the highest amount of organophosphates and carbamates were
applied to okra. Also, the maximum amount of organochlorines and pyrothroids were applied
to tomato and bottle gourd respectively. Specifically, a total of 14 brands of pesticides were
used in this seed farm of which 7 are banned pesticides.
Table 4 Amount of pesticides used in BRAC foundation seed production farm, Dinajpur
Total amount of pesticides (active ingredient) used (g or ml) Crop name Area (ha) Organophosphate Carbamate Organochlorine Pyrethroid
Bean 0.14 420 0 0 840 Yardlong bean 0.08 160 0 160 00 Mungbean 0.10 400 0 0 0 Bottle gourd 0.20 0 200 200 1,600 Bitter gourd 0.12 0 0 240 960 Ridge gourd 0.12 240 0 360 120 Pumpkin 0.08 160 160 80 80 Ash gourd 0.10 200 0 300 100 Cucumber 0.05 160 20 200 40 Kangkong 0.02 80 0 0 40 Vatishak 0.10 600 0 0 0 Red amaranth 0.16 0 640 640 0 Amaranth 0.06 0 240 300 0 Tomato 1.34 0 2,640 2,640 0 Radish 0.16 960 0 160 0 Eggplant 0.30 2,400 0 1,500 0 Okra 1.48 5,856 2,928 0 0 Cauliflower 0.02 80 80 20 0 All crops 2.00 11,716 6,908 6,800 3,780 Note: The figures were obtained by calculating the actual application rate of 4 g/ml of active ingredient diluted in 1 litre of water per 1 decimal of land area times the frequency of application in individual crops over the total crop cycle. Source: Field Survey (2000)

55
Assessing farmers’ chemical handling practices To assess farmers’ chemical handling practices, a series of inter-related questions were asked.
Multiple responses were recorded in cases with open-ended questions meant for eliciting
reasons and sources of information. A test of association between responses and relevant
outcomes are conducted wherever applicable to facilitate inferences.
Twentyfour percent of farmers responded that they felt sick after handling chemicals,
displaying some common symptoms (Table 5). Of the total farmers, 17% reported that they
felt tired and weak after spraying pesticide in the crop field. A vomiting tendency and/or
headache as well as burning sensation in the eyes, chest, and lower knee were also reported.
Table 5 Symptoms of illness after handling pesticides as responded by farmers
Symptoms of illness after handling pesticides as responded by farmers Responses (%) Feeling sick 23.5
Tired/ feel weak 17.2 Vomiting tendency/ headache/ bodyache 4.9 Burning sensation in eyes/chest/lower knee 4.9 Loss of appetite 2.5 Did not feel sick 75.3
Non-response 1.2 Note: Multiple response meaning total will be more than 100. Source: Field Survey (2000)
When asked about what precautions were taken during pesticide application, 87% of farmers
reported that they covered their faces with a cloth or mask while a few (13%) mentioned the
use of caps or helmet and fewer still (5%) the use of hand-gloves made of polythene packets
(Table 6).
An expected negative association between farmers who reported to feel sick and the use of
mask and/or gloves was observed although the association was not significant. Correlation
coefficient between incidence of feeling sick and use of mask is estimated at r=-0.14 and with
use of gloves at r=-0.16. Another significant positive association was observed between use of
mask and gloves (r=0.22, p<0.05). It seems that farmers are increasingly realizing that some
precautions are necessary while applying pesticides.

56
Table 6 Precautions taken during pesticide application by contract seed farmers
Precautions taken during pesticide application Responses (%) Examples Cover the face with cloth/mask/eye-glasses etc. 86.7 Using cap/plastic helmet 12.5 Spraying in the direction of wind flow 6.2 Wearing polythene packets as hand-gloves 4.7 Wearing shirts 3.1 Spray pesticide during evening so as not to harm useful insects 3.1 Spray pesticide before meals 2.3 No precautions taken 13.3 Note: Multiple responses meaning total may exceed hundred. Source: Field Survey (2000)
Washing hands with soap and/or ashes after using chemicals is common as reported by 98%
of farmers. Also, a total of 88% of farmers reported that they are aware of the need to take
precautionary measures while handling pesticides. A significant positive association between
receiving information on precautionary measures in handling pesticides and use of mask was
observed (r=0.34, p<0.01) indicating that awareness raising campaign did have an influence
in the decision making process of the farmers.
BRAC staff was the main source of disseminating knowledge on handling chemicals reported
by 43% of farmers (Table 7). Further, written instruction in the bottle or leaflet served as an
important source (27%). Neighbors also served as a significant source (16%). Contribution of
government agricultural officials was not cited as having a role in disseminating information
on safety measures in handling chemicals.
Table 7 Sources of precautionary measures learned
Sources of precautionary measures learned Responses (%) BRAC staff 43.2 Written instruction in bottles/leaflet 27.1 From neighbours 16.0 Agricultural extension office 3.7 Chemical dealer 3.7 Block supervisor 2.4 Media (radio, TV) 1.2 Physicians 1.2 Note: Multiple response meaning total will be more than 100; Source: Field Survey (2000)

57
On the question of the timing of pesticide application, 68% of farmers responded that they
applied pesticides mainly in the afternoon, followed by late morning after breakfast (51%),
and before breakfast (21%). Only a few (6%) applied pesticide in the evening. A significant
positive association between applying pesticides in the morning, afternoon, and late evening
and incidence of sickness was observed for unknown reason. The estimated correlation
coefficient between sickness and application time during morning is r=0.28 (p<0.05),
afternoon is r=0.38 (p<0.01) and evening is r=0.34 (p<0.01), respectively. On the other hand
negative association was observed between incidence of sickness and application time in the
before breakfast and after breakfast applications although the values are not significant.
It was noted that most of the farmers (93%) stored the chemicals with some degree of caution
(Table 8). About 49% of farmers reported that they kept it in a safe place or specific location
at home. However, no clarification on what was meant by the term ‘safe place’ was given.
Only 25% of farmers emphasized that they kept pesticides out of the reach of children, which
indicates that the farmers are at least aware of the need to safeguard their children from
contact with harmful chemicals. Only 7% of farmers stated that they were not aware of the
need to take precaution in storing pesticides.
Table 8 Examples of storing chemicals as responded by farmers
Examples of storing chemicals as responded by farmers Responses (%) Examples 92.6
Keep in safe place at home/locked place/a specific place 49.4 Keep outside reach of children 24.7 Keep in secret place at home/in toilet 7.4 Keep in dry place at home 7.4 Keep anywhere in the home 3.7 Keep in polythene wrap 2.4 Non-response 7.4 Source: Field Survey (2000)
When asked about what to do with empty chemical containers, about 53% of farmers reported
that they buried the empty chemical cans/bottles after use (Table 9). Eleven percent of the
farmers stated that they cleaned it and ‘ re-used’ it for domestic purposes. The incidence of
‘ re-use’ raises an alarming issue of safety and also indicates the presence of unawareness
among farmers on the potential hazards of pesticide contamination. Also, another 11% of
farmers responded that they kept it anywhere at home indicating a total lack of caution in a
strict sense adding more doubt on their level of awareness of the chemical hazards that can be

58
caused by the indiscriminate storage of pesticides as well as empty containers. Few responded
that they threw their used cans/bottles in the river and/or any other body of water (5% of
farmers) and also in the woods (5% of farmers).
Table 9 Examples of disposing empty chemical cans as responded by farmers
Examples of disposing empty chemical cans as responded by farmers Responses (%) Examples 90.2 Bury in soil 53.1 Clean and re-use for other purpose 11.1
Keep anywhere at home 9.8 Throw in the woods 4.9 Throw in river/body of water 4.9 Wash and kids sell them 4.9 Keep in specific place 3.7 Non-response 9.8 Source: Field Survey (2000)
In response to the question, “what do they do with the crop residue left in the fields?” multiple
responses were received. About 70% of farmers mentioned that they used it as fuel, 15%
responded that they left it in the field, 18% used it to feed animals, and only 13% of farmers
used it as compost. This response pattern revealed that the dominant tendency was to utilize
the crop residue as fuel as well as animal feed. Crop residue that could not be used for fuel
and animal feed, was ultimately left in the field and was made compost to some extent as
explained by the farmers. In other words, the need for replenishing soil fertility by recycling
crop residue did not seem to be very strong. Also, a significant positive association between
the frequency of pesticide use and the utilization of crop residue as fuel was observed (r=0.21,
p<0.10). Furthermore, significant negative association among the competing uses of crop
residue was observed as expected. For example, correlation between use of crop residue as
compost and as fuel is estimated at r=-0.31 (p<0.01) and for feeding animals at r=-0.20
(p<0.10). This indicates that crop residue once used for fuel and/or feeding animals precludes
its availability to prepare compost that can ultimately help replenish the soil.
On the question of the existing pesticide use rate, about 77% of the farmers responded that
they use enough pesticides. Among the remaining 23%, 5% felt that they should use more (up
to 50% more than the existing rate) while 18% did not respond.

59
The perception of the farmers on the effect of pesticides (whether good or bad) was elicited
separately. First, farmers were asked to opine on any advantages of pesticide use. Once
completed, they were asked to opine on any disadvantages of pesticide use. Almost all of the
farmers (95%) considered that pesticide use has advantages. The range of such advantages is
elaborated in Table 10. The majority (85%) of the farmers opined that pesticide use increase
production. About one-third (31%) thought that it prevented insect and pest attack. Another
15% responded that pesticide use increased the quality of output. Only 3% of farmers opined
that there are no positive effects of pesticide use.
Table 10 Advantages of pesticide use as opined by farmers
Advantages of pesticide use in crops as opined by farmers Responses Advantages of pesticide use 92.7 Increases production 85.2 Inset and pests cannot do any harm 31.2 Improve quality of crop/seed 14.8 Reduces rot in crops 2.4 Non-use of pesticides damages production 2.4
Prevents dropping of flowers during crop growth stage 1.2 Prevents damage in leaf 1.2 No advantages 2.4
Non-response 4.9 Source: Field Survey (2000)
When farmers were asked next to opine on the disadvantages of pesticides use, 37% of them
provided a long list, which is elaborated on Table 11. Of the farmers, 49% considered that
there were no disadvantages of pesticide use. About 9% did not give any comment on whether
or not pesticides had disadvantages, implying 58% being naive about any disadvantages of
pesticides. Among the disadvantages, 10% of farmers thought that pesticides kill useful
insects and animals, such as, earthworm, honeybees and frogs that are good for crop
production. Adverse effect on human health (9%) emerged as the second important harmful
effect of pesticide use. Damages to crop (8%) as well as the reduction of soil fertility (7%)
also appeared among the adverse effects. About 5% opined that pesticides also kill birds that
come into contact with the crops.
A significant negative association was observed between responding farmers who mentioned
advantages and those who mentioned disadvantages of pesticides. The correlation coefficient

60
is estimated at r=-0.23 (p<0.05). Also, a weak but positive association was observed between
farmers reporting disadvantages of pesticides and the incidences of feeling sick after pesticide
application (r = 0.14, not significant).
When asked “how many days after using chemicals did you harvest your crops?” , only 5% of
farmers responded that they had harvested them within 5 days while the majority (95%)
harvested their crops from 7 days onward. The modal value of the number of days allowed to
consume vegetables and fruit after spraying pesticides came out to be 7 days (noted by 28%
of farmers) followed by 10 days (17%) and 15 days (9%), respectively. The implication is that
farmers are at least aware that they should not consume products immediately that were
sprayed with pesticides. A gestation period of 7 days or more allowed from time of pesticide
application to consumption of products seems reasonably safe.
Table 11 Disadvantages of pesticide use as opined by the farmers
Disadvantages of pesticides used as opined by the farmers Responses (%) Disadvantages of pesticide use 37.3 Useful insects and animals (honey-bee, frog, earthworm) die 9.9 Effects human health 8.6 Damages crop and flowering due to excessive use 7.8 Damages soil fertility/leads to increase in fertilizer doses 7.4 Birds die 4.9 Effects the environment/damages environmental balance 3.7 Poisons food 1.2 Reduces fish 1.2 Increases crop pests 1.2 If inhaled causes stomach pain 1.2
No disadvantages 49.4 Did not examine whether have any disadvantages 8.6 Non-response 3.7 Source: Field Survey (2000)
Conclusion
The present study revealed that ‘contract seed growers’ used substantial amount of pesticides
for boosting their vegetable and maize seed production. In most cases, the actual application
rate of these chemicals exceeded the recommended dose. Also, frequency of pesticide use, in
particular, was alarming in both the BRAC ‘ foundation seed’ production farm as well as in
the fields of ‘contract seed growers’ . On the other hand, although farmers seemed to be aware

61
of health hazards associated with chemicals, they used banned pesticides as these are the only
ones available in the market and are probably cheaper and show visible results. The belief that
pesticides have more positive effects than harmful effects needs to be properly evaluated as
this perception will boost pesticide application whenever their crops are infested with
insect/pest and/or disease.
Also the introduction of more environment friendly techniques for pest control such as IPM
(integrated pest management) technologies were virtually absent in BRAC’s agricultural
extension system. Results further revealed that even if BRAC wishes to introduce IPM, the
current set-up would not be able to provide this service, as there is no capacity for such
venture.
Based on these findings, the following recommendations deserve consideration: (i) promotion
of IPM technologies by building staff capacity as well as that of its beneficiaries, (ii)
introduce an intensive environmental awareness campaign among beneficiaries by first
building its own capacity in this regard, and (iii) promote policy advocacy to ensure effective
implementation of pesticide regulations by utilizing BRAC’s own human resources and
influencing other relevant agencies.
Acknowledgement
The research was conducted in the Research and Evaluation Division of BRAC. The authors
are grateful to Mr A. M. R. Chowdhury, Ph.D., Director Research, for giving his
encouragement in conducting the study.
References
BRAC (2000) BRAC Annual Report 2000. Dhaka Lichtenberg, E. & Nguyen, K.L.T. (2001) Pesticide productivity in green revolution rice
production: a case study of Vietnam. Paper at Meeting of the American Agricultural Economics Association, 5–8 August 2001, Chicago, USA
Motin, R. (2000) Stark realities of pesticide use. Dhaka Courier 16, 18–19 Rahman, S. & Thapa, G.B. (1999) Environmental impact of technological change in
Bangladesh agriculture: farmers’ perceptions and environmental evidence. Outlook on Agriculture 28 (3), 233–238
WHO (1984) Paraquat and Disquat: Environmental Health Criteria 38. Geneva

62
The impact of Integrated Pest Management program on pesticide demand for soybean farming in Yogyakarta, Indonesia IRHAM Department of Agricultural Socioeconomics, Faculty of Agriculture, Gadjah Mada University, Jl. Flora, Bulaksumur, Yogyakarta 55281, Indonesia JOKO MARIYONO Department of Agribusiness, Faculty of Agriculture, University of Gunung Kidul, Wonosari, Yogyakarta, Indonesia
Abstract
Externality impact of pesticide use on environment and human health has been well proved by
many researchers. In reducing such externality, the government of Indonesia waived subsidy
for pesticide and introduced Integrated Pest Management (IPM) technology in 1989. One of
the expected impacts of this policy is the reduction of pesticide demand. To see the impacts,
input demand model for pesticide in soybean farming is employed. The objectives are (1) to
estimate the demand of pesticide in soybean farming and (2) to analyze the impact of IPM
program on pesticide demand. For this purpose, secondary cross-section time series data from
1990 up to 1998 taken from respective offices in Yogyakarta province, Indonesia are used. By
using simultaneous and recursive equation models the impact of IPM program on the demand
for pesticide is estimated. The study found that the IPM program has been reduced
significantly the use of pesticides in soybean farming.
Introduction
Since early 1970s government of Indonesia has been inspired by green revolution
“movement” to increase agricultural production through intensification program. Intensive
agricultural technology characterized by the use of high-yielding variety with high use of
inputs including pesticides has been promoted. For this purpose government has spent 725
million USD to subsidize agricultural inputs for the farmers (Conway & Barbier 1990).
Around 40 percent out of 725 million dollars of the subsidy were used for pesticides (Table
1). As the Table shows, starting from 1975 the subsidy increased substantially up to 1985 and
Landschaftsökologie und Umweltforschung 38 p. 62-72 Braunschweig 2002

63
then gradually decreased afterwards until no subsidy was given in 1989. Distinctive negative
externalities caused by heavy use of pesticide particularly for the environment (Bond, 1996)
and human health (Kishi et al. 1995) is one of the important factors behind the reason why the
Indonesian government waived subsidy for pesticides and at the same time IPM program was
introduced (Rölling & Fliert 1994). One of the expected impacts of this policy is the reduction
of pesticide demand (World Bank 1993).
Table 1 Use of pesticides and pesticides subsidy
Year
N-Fertilizer
Use
Insecticide
Use
Insecticide
Subsidy
Year
N-Fertilizer
Use Insecticide Use
Insecticide
Subsidy
(100.000 ton) (1000 ton) (million US $) (100.000 ton) (1000 ton) (million US $)
1970 1.62 1.08 0 1980 7.87 6.37 37.6
1971 2.19 1.56 0 1981 9.46 8.94 101.5
1972 2.62 1.41 0 1982 10.60 11.25 162.4
1973 3.12 1.50 0 1983 9.86 14.26 135.9
1974 2.90 1.64 0 1984 11.37 14.12 127.5
1975 3.11 2.45 5.8 1985 11.17 15.19 147.0
1976 3.13 3.43 54.8 1986 11.48 17.65 146.8
1977 4.42 4.42 25.8 1987 12.39 17.94 117.8
1978 4.79 4.17 67.4 1988 12.52 16.36 97.2
1979 5.51 4.19 71.5 1989 13.01 12.44 0
Source: Useem et al. (1992).
Mass introduction of pesticides in the country at the beginning of the intensification program
was mainly because of strong and optimistic belief that using pesticides was considered the
most appropriate way to save the production from pest and disease attack. Therefore, training
on the application of pesticides to the farmers was done very intensively during the early stage
accompanied by large amount of input subsidy. However, the introduction of subsidy and
mass use of pesticides for a long period of time has led to a number of negative consequences.
One of the distinct behavioral consequences is that the farmers become too heavily dependent
on pesticides in protecting their crops (Barbier 1989). Continuous dependency on pesticides
has brought about adverse effects towards agricultural production. Firstly, it was found that
only 1% of the inputs was absorbed by the plants, while the rest was left to environment as
poisonous waste (Pimentel 1993). Secondly, it is not easy to change the farmers’ behavior in
using pesticide within a short period of time as has been experienced while introducing
Integrated Pest Management (IPM) program.

64
Having a strong claim about the superiority of the IPM technology it is assumed that if the
number of farmers who apply IPM technology increase, it is expected that in the long run the
use of pesticides will decrease without sacrificing the level of production (Useem et al. 1992).
Off course, the application of IPM technology is not the only factor causing a declining
tendency of pesticide use in Indonesia. Increase of the price of pesticide may also contribute
in such reduction. Theoretically, the effect of the price and IPM technology on pesticide use
(demand) and on soybean production will work simultaneously. The change in pesticide
demand and soybean production can be observed from the shift of pesticide demand curve.
Meanwhile, by introducing IPM program the change in pesticide demand is expected to shift
the supply curve of soybean rightward or at least the supply curve is unchanged due to the
effect of the IPM technology.
The objectives of the study are (1) to estimate demand of pesticide in soybean farming, (2) to
analyze the impact of IPM program on pesticide demand. For this purpose, secondary data
taken from provincial agricultural office, Yogyakarta statistical bureau, pest and diseases
monitoring office are used.
Regression analysis by using OLS (ordinary least squares) method is used to analyze the
factors affecting the demand for pesticides (e.g. pest attack) within the scope area studied. The
idea of the analysis is based on the fact that the nature of relationship between pesticide
demand and level of pest attack could be in two forms. One form is that pesticide demand will
increase when pest attack increase. This is mainly based on the pest control principle that
pesticide is used whenever pest attack exists (Rola & Pingali 1983). Second form could be
that the level of pest attack depends on the use of pesticide. This is also due to the fact that the
level of pest attack declines when the application of pesticide increases.
Pesticide demand has unique characteristics compared to that of other common agricultural
inputs such as labor, fertilizers, seeds, etc. First, pesticide is an input, which indirectly affect
the production. The direct impact of pesticide is to minimize the crop loss because of the pest
attack. Second, the effect of pesticide is uncertain because it depends on the nature of the pest
infestation (Horowitz & Lichtenberg 1994). An effective effect will be observed whenever
pest infestation exists. In other words, the use of pesticide will be ineffective whenever no
infestation exists. Based on the above argument, pesticide demand function should be
estimated in order to find the optimum level of potential production. Therefore, models need

65
to be developed in order to find the most appropriate demand function for soybean. Two
models are employed, namely simultaneous model and recursive model. By using
simultaneous and recursive equation models the impact of IPM program on the demand for
pesticide was analysed.
Study area
The study was conducted in Yogyakarta Province covering four districts namely Bantul
district, Gunung Kidul district, Kulon Progo district and Sleman district. Those four districts
are areas for the development of IPM program. Farmers Field School (FFS) training on IPM
experiment plots for pest monitoring, and application of IPM technology have been
disseminated in these areas.
Data
Secondary cross-section time series data are employed in this study. The data comprise four
districts and covers ten years period (from 1989 to 1998). The data were taken from a number
of sources such as Annual Report of Pest and Disease Monitoring and Forecasting of
Yogyakarta province, Annual Report of Provincial Agricultural Office, and statistical data
published by Provincial and District Statistical Offices. Types of data to be analyzed are
soybean production (ton), pesticide use in one year (l/ha), area planted of soybean (ha),
number of famers’ field school unit that has been implemented (IPM), average price of
soybean in one year (Rp/kg), average price of rice in one year (Rp/kg), average price of
pesticides in one year (Rp/l), and percentage of area affected by pest attack (%).
Method of analysis
Simultaneous demand function model
Simultaneous demand function is constructed based on the assumption that IPM technology
does not influence the production process so that the marginal product of pesticide is not
changed. Hence, IPM technology is only one of the alternatives of plant protection beside
pesticide application. In this case the use of pesticide (Xp) will be influenced by level of pest
attack (PA), price of pesticide (Pp), price of soybean (Ps), and planted area of soybean (As).

66
By using this assumption, it is expected that the level of pest attack (PA) will be affected not
only by use of pesticide (Xp) but also by IPM technology (IPM).
It is worth noting that price of fertilizers are not included in the model relied on the
assumption that fertilizers and pesticides are not substitutable inputs in protecting the plant.
Moreover, fertilizers and pesticide are also not complementary each other in the production
process. Based on the above idea two equation models are formulated as follow:
Xp = b20 + b21PA + b22Pp + b23Ps + b24As + u2 (1)
PA = a10 + a11Xp + a12 IPM + u1 (2)
By substituting equation (1) into (2) reduced form equation will be obtained. However, the
reduced form could not be used for the estimation since exogenous variable still exists. To
solve this problem two-step estimation is used. First step is to estimate the reduced form
equation as expressed in the following equation:
PA^ = φ10 + φ10IPM + φ11Pp + φ12Ps + φ13As (3)
Xp^ = φ20 + φ20IPM + φ21Pp + φ22Ps + φ23As (4)

67
Using the above equations, estimated value of (PA^) and (Xp^) that are independent each
other can be obtained. The next step is to estimate the ‘ independent’ demand function by
using the following equation:
Xp = d20 + d21PA^ + d22Pp + d23Ps + d24As + v2 (5)
PA = c10 + c11Xp^ + c12IPM + v1 (6)
The above equations indicate that IPM will reduce the pesticide use if the IPM technology
significantly reduces the pest attack level (c12 < 0), while the use of pesticide is determined by
pest attack (d21 > 0).
Recursive demand function model
Recursive demand model is based on the assumption that IPM technology is not only able to
control the pest but also affect the production process so that the marginal product of pesticide
is changed. In this case the use of pesticide (Xp) will be influenced by the level of pest attack
(PA), price of pesticide (Pp), price of soybean (Ps), and planted area of soybean (As). By
using this assumption, it is expected that IPM technology (IPM) determine both the level of
pest attack (PA) and the level of pesticide use (Xp). Then the following equations are
formulated:
PA = a10 + b11 IPM + u1 (7)
Xp = a20 + b21PA + c21IPM + c22Pp + c23Ps + c24As + u2 (8)
so that u1 and u2 are uncorrelated. By using recursive model the demand function (8) can be
directly estimated by using OLS (Gujarati, 1995).

68
Study results
Simultaneous pesticide demand function
Given the results of regression analysis as depicted in Table 2, the estimated value of pest
attack (PA^) and pesticide use (Xp^) for a given period of analysis and different district can
be obtained. Those estimated values, which has been free from endogenous effect, are then
used to estimate the relationship between pesticide use and pest attack. Such relationship is
indeed a demand function for pesticide since there are both pesticide price and rice price
variables.
The results of the estimation (Table 3) indicate that pest attack is significantly reduced by
pesticide application. Interestingly, IPM technology also has a significant effect in reducing
pest attack. It explains that IPM principle is implemented so that pest infestation could be
maintained at the low level and that the use of pesticide become considerably low as the
farmer delay the application of pesticide as they become the last alternative for crop
protection. The regression coefficient of pest attack that shows a considerably low value is
mainly because the pest attack itself is very low.
Table 2 Regression results of simultaneous demand function (first step)
Dependent Variables
Pest Attack Pesticide Use
Independent Variables
Coefficient t-value Coefficient t-value
IPM (number of FFS) -0.013ns -1.360 -2.895*** -5.001
Ratio of pesticide price to soybean price -0.416ns -0.287 -149.155* -1.767
Soybean area (ha) -8.629 E-05* -1.635 0.012*** 3.925
Intercept 11.732*** 1.259 1,607.06*** 2.960
R2 0.160 0.564
F-value 2.032* 13.780***
D-W 1.609 2.485
Note: *** significant at 1% ** significant at 5% * significant at 10%

69
Table 3 Regression results of pest attack vs. Table 4 Regression results of simultaneous demand pesticide use function (second step) Variables Coefficient t-value Variables Coefficient t-value
Pesticide Use (kg) -0.007* -1.432 Pest attack^ (%) 207.60*** 11.139
IPM (number of FFS) -0.027** -2.097 Price of pesticide (ratio) -47.343*** -5.091
Intercept 13.508*** 3.193 Soybean area (ha) 0.026*** 10.244
R2 0.165 Intercept -901.81*** -10.970
F-value 3.270** R2 0.537
D-W 1.879 F-value 10.477***
D-W 2.276
Note: *** significant at 1% ** significant at 5% *significant at 10% Note: *** significant at 1% ** significant at 5%
*significant at 10%
Table 4 shows that the increase of pesticide use is significantly caused by the increase in pest
attack. This is understandable because farmers will apply pesticide only when severe pest
infestation exists as in contrast to the “old notion” of the farmers that the application of
pesticide becomes a primary measure for crop protection regardless the level of pest
infestation.
From the relationship between pesticide use and pest attack (Table 3 and 4) it is fair to say
that the demand for pesticide in soybean farming could be explained by using simultaneous
demand function as the assumption that IPM technology is able to reduce pesticide use is
fulfilled. Table 3 tells that all variables included in the model can explain 53% of pesticide
demand variation. For IPM variable in particular, the regression result shows that the increase
in the number of IPM farmer’s field school in one unit will reduce the percentage of pest
attack. In turn, the reduction of pest attack will then reduce the amount of pesticide use. So,
by using simultaneous demand equation it is found that the IPM technology tends to indirectly
reduce the application of pesticide, as this technology is able to reduce the intensity of pest
attack. Price of pesticide significantly reduces the amount of pesticide use in soybean farming
as expected. However, the application of pesticide will increase as the planted area of soybean
increase.

70
Recursive pesticide demand function
Table 5 presents the results of pesticide demand estimation by using recursive demand
function. According to the model about 74% of pesticide demand can be explained by all
variables included in the model, which is considerably good. Each variable (price of pesticide,
level of pest attack, IPM technology, or planted area of soybean) significantly influence the
demand for pesticides.
Table 5 Regression results of recursive demand function
Variables Coefficient t-value
Ratio of pesticide price to soybean price - 220.43*** -3.706
Pest attack (%) 27.130*** 3.874
IPM (number of FFS) -2.599*** -6.161
Soybean area (ha) 0.040*** 8.513
Intercept 1,754.2*** 4.519
R2 0.739
F-value 23.010***
D-W 1.922
Note: *** significant at 1% ** significant at 5% * significant at 10%
Under ceteris paribus condition, the price of pesticide has a significant effect in reducing the
demand for pesticide. Since a ratio of price of pesticide to price of soybean is used in the
model, this result is theoretically justified. Assuming that the farmers are rational, as marginal
product of pesticide decline if the price of pesticide goes up it will be responded by reducing
the amount of pesticide used in farming when the marginal product of pesticide equals the
new value of the ratio between pesticide price and soybean price.
The level of pest attack shows a significant effect on the increase of pesticide demand. This is
still consistent with the IPM concept that pesticide will be applied when serious pest attacks
exist. The analysis by using recursive demand model has a consistent result with that of using
simultaneous demand model in term of the effect IPM on soybean demand. Dissemination of
IPM technology has significantly reduced the amount of pesticide use. It implies that the
introduction of IPM has a positive impact on pesticide use reduction in soybean farming. This
is interesting because although IPM Farmer’s Field School (FFS) for soybean cover only
small portion of the area, however FFS for rice has been widely adopted by most of the

71
farmers in this study area. In addition, rice farmers who joined FFS grow soybean too in their
land.
Conclusion
By using simultaneous demand equation it is found that the IPM technology indirectly reduce
the application of pesticide, as this technology is able to reduce the intensity of pest attack.
Price of pesticide significantly reduces the amount of pesticide use in soybean farming as
expected. However, the application of pesticide will increase as the planted area of soybean
increase.
The analysis by using recursive demand model has a consistent result with that of using
simultaneous demand model in term of the effect IPM on soybean demand. Dissemination of
IPM technology has significantly reduced the amount of pesticide use, which implies that the
introduction of IPM has a positive impact on pesticide use reduction in soybean farming.
Although IPM Farmer’s Field School (FFS) for soybean cover only small portion of the area,
however IPM FFS for rice has been widely adopted by most of the farmers in this study area
let alone rice farmers who joined FFS grow soybean too in their land.
The price of pesticide (a ratio of price of pesticide to price of soybean) has a significant effect
in reducing the demand for pesticide, which is theoretically justified. This means that as
marginal product of pesticide declines if the price of pesticide goes up it will be responded by
reducing the amount of pesticide used in farming when the marginal product of pesticide
equals the new value of the ratio between pesticide price and soybean price.
The study found that the IPM program has reduced significantly the use of pesticides in
soybean farming in Yogyakarta from 1990 up to 1998. The positive impact of IPM program
in reducing the pesticide demand is due to two important aspect of the program, namely the
elimination of pesticide subsidy and the introduction of IPM technology.

72
References
Barbier, E.B. (1989) Cash crops, food crops, and sustainability: the case of Indonesia. World
Development 17(6), 879-895 Bond, J.W. (1996) how EC and World Bank policies are destroying agriculture and the
environment. AgBé Publishing, Singapore Conway, G.R. & Barbier, E.B. (1990) After green revolution, sustainable agriculture for
development. Earthscan Publication, London Gujarati, D.N. (1995) Basic econometrics. 3rd Ed. McGraw-Hill, New York Horowitz, J.K. & Lichtenberg, E. (1994) Risk reducing and risk increasing effect of pesticide.
J. Agric. Econ. 45(1), 82-89 Kishi, M., Hirschhorn, N., Djayadisastra, M., Satterlee N. L., Strowman, S. & Dilts, R. (1995)
Relationship of pesticide spraying to signs and symptoms in Indonesian farmers. Scand. J. Work Environ. Health 21, 124-133
Pimentel, D., Acquay, H., Biltonen, M., Rice, P., Silva, M., Nelson, J., Lipner, V., Giordano, S., Horowitz, A. & D’Amore, M. (1993) Assessment of environmental and economic impacts of pesticide use. In: Pimentel, D. & Lehmann H. (eds) The pesticide question, environment, economics and ethics. Chapman & Hall, New York, 47-84
Rola, A.C. & Pingali, P. L. (1993) Pesticide, rice productivity, and farmers’ health, an economic assessment. IRRI, Manila
Rölling, N. & Fliert, E. (1994) Transforming extension for sustainable agriculture: the case of Integrated Pest Management in rice in Indonesia. Agricultural and Human Value 11(2/3), 96-108
Soenanto, F.N., (2000) Evaluasi kemajuan, perkembangan dalam pelatihan dan pengembangan PHT di Yogyakarta. (Presented at National Technical Meeting of Plant Protection, Semarang, Indonesia)
Useem, M., Setti, L., & Pincus, J. (1992) The science of Javanese management: organizational alignment in an Indonesian development programme. Public Administration and Development 12, 447-471
World Bank (1993) Staff appraisal report, Indonesia Integrated Pest Management Training Project. World Bank, Washington D.C.

73
Integrated Pest Management program, pesticide use and rice productivity: A case study in Yogyakarta, Indonesia IRHAM Department of Agricultural Socioeconomics, Faculty of Agriculture, Gadjah Mada University, Jl. Flora, Bulaksumur, Yogyakarta 55281, Indonesia
Abstract
IPM has been regarded as soft and friendly technology that provides not only financial
benefits received by the farmers but more importantly environmental benefits for the whole
society. Therefore, in view of sustainable development IPM program was introduced in 1989
as one of the important agricultural development strategy in Indonesia. The objectives of the
study are (a) to analyze the relationship between pest attack, pesticide use and crop loss, (b) to
study the impact of the IPM program on the use of pesticide, (c) to see the impact of the IPM
program on the rice productivity. Farm survey data of the consecutive seasons of the year
2000/2001 were collected through field survey conducted in two villages of Moyudan sub-
district in Yogyakarta province. For this purpose sixty rice farmers were interviewed. The
study noted three important findings. First, the farmers in Yogyakarta still apply pesticide as
an important measure of the crop protection. Second, the IPM program has successfully
reduced the application of pesticides. Third, the rice yield of the IPM-trained farmers is higher
than that of non IPM-trained farmers although statistically not significant.
Introduction
One of the key successes of the intensification program in Indonesia is the substantial increase
of rice production because of the increase in crop yield through intensive use of inputs
including chemical pesticides. The role of pesticides is to reduce the crop loss due to the pest
and disease attacks. For this purpose, mass introduction program of pesticides was done
intensively following the Green Revolution movement in Asia. Therefore, it is not surprising
that the application of pesticide during the period of 1970s and 1980s has increased
substantially contributed by incredible amount of subsidy (Irham & Mariyono 2002) which
leads to the fact that the farmers in Indonesia have been accustomed in using chemical
Landschaftsökologie und Umweltforschung 38 p. 73-81 Braunschweig 2002

74
pesticides.
The green revolution has changed the notion of the farmers in such a way that the application
of chemical pesticides in rice farming has been regarded as the best way to cope with the risk
of crop loss caused by pest and disease attacks. The existence of production risks in rice has
influenced the behavior of the farmers in deciding the inputs to be used and regarded pesticide
as a guarantee in securing their crop production. However, most of the researchers believe
that with indiscriminate use of pesticides and increasing application leads to a number of
consequences such as elimination of natural predators, resistance of pests on the pesticides,
frequent pest outbreaks, etc. so that crop losses increase (Saha et al. 1997; Harper &
Zilberman 1989; Zilberman & Castillo 1994).
Due to the serious problems caused by pesticides application, , IPM program was introduced
in order not only to reduce the amount of money spent for pesticides but also to save the
agricultural environment due to considerable negative effects (see Harper and Zilberman
1992; Crissman et al. 1994; Antle & Pingali 1994; Rola & Pingali 1993). In this case IPM has
been regarded as soft and environmentally friendly technology that derives other secondary
benefits ranging from financial benefits received by the farmers to important environmental
benefits for the society (Lazarus & Swanson 1983). Therefore, for the sake of sustainable
development IPM becomes one of the components of agricultural development strategy in
Indonesia that has been introduced in 1989.
Two questions can be raised regarding the role of the IPM program. First is whether the IPM
program has successfully reduced the use of chemical pesticides considering the
disadvantages of their application in agriculture. The study of Irham (2001) in Yogyakarta
indicated that the farmers still rely on pesticide in protecting their crops from pest attack no
matter if they are IPM-trained farmers or not. There is no significant difference in terms of
pesticide application per ha between IPM-trained and non IPM-trained farmers although the
dosage applied by both groups is much lower than the recommended one. It seems that the
principle of IPM has been widely adopted among the farmers in the study area even though
they are not formerly trained in IPM.
The second question is whether the farmers get incentives in adopting the IPM technology in
coping with the risk of crop loss. One of the incentives of using pesticide as the last choice in

75
protecting their crops is the guarantee of not loosing their crop yield. At least, the farmers can
maintain the current yield with lower costs for pesticide. Studies about the relationship
between IPM program and crop yield have been done by International Rice Research Institute
(IRRI) taking the case of the Philippines (Rola & Pingali 1993) and by SEARCA (1999) for
the case of Indonesia. One of the results was that the IPM-trained farmers produce higher
yields compared to those of non IPM-trained farmers. Beside the statistical weakness of both
studies, however, experience shows that it seems to be uneasy to change the attitude of the
farmers immediately after getting accustomed for more than twenty years of their dependence
on pesticides unless there is some incentive to change their habits as mentioned earlier. The
result of the study done by Irham (2001) has showed this tendency. Therefore, more studies
are needed to provide a better understanding on the impacts of the IPM program. This paper
aims at: (a) analyzing the relationship between pest attack, pesticide use and crop loss, (b) the
impact of the IPM program on the use of pesticide, (c) finding the impact of the IPM program
on the rice productivity.
Study area
Moyudan sub-district was selected as the study area. The sub-district constitutes one of the
rice production centers in Yogyakarta province where IPM program has been promoted
intensively by the distrct government of Sleman. The area is located in the north west of the
city of Yogyakarta. Farmers Field Schools (FFS) have been set up following the introduction
of the IPM program.
Data
Farm survey data of the consecutive seasons of the year 2000/2001 were collected through
field survey conducted in two villages of Moyudan sub-district. Sixty rice farmers were
interviewed during the survey. From the sixty interviewed farmers, thirty of them are IPM-
trained farmers while the rest of the samples are Non-IPM trained farmers.

76
Method of analysis
Cross-table analysis is primarily used to analyze the relationship between pest attack,
pesticide use, crop loss and yield of rice. In certain case, a simple statistical test is performed.
Using the farm survey data, a similar way of analysis is also carried out to see the impact of
IPM program on rice yield. To estimate the level and magnitude of relationship between
inputs and yield of rice a regression method is applied.
Yield function is developed in estimating the functional relationship. Pesticide input is used as
independent variable to know the effect of pesticide on rice yield. To detect the impact of the
IPM program on rice yield a dummy IPM is introduced into the model. The following is the
estimated model developed in this study.
ln Y = ln α + � βi ln Xi+ d1D-season1 + d2D- season 2 + d3DIPM + ε
where Y is yield of rice (kg/ha); X is rice input for i = 1, 2, ... 8; D-season1 and D-season2 are
dummy variables for rainy season and first dry season, respectively; DIPM is dummy IPM (1
for IPM-trained farmers, 0 for non IPM-trained farmers), α and β are coefficients of
regressions; and ε are error terms.
Study results
Application of the IPM technology
Before analyzing the impacts of IPM program on pesticide use and yield of rice,
understanding the implementation of the IPM technology by the farmers becomes necessary.
Table 1 shows that resistant varieties have been adopted either by IPM-trained farmers or non
IPM-trained farmers. Both groups of farmers have applied recommended technical culture
except for fertilizer application particularly KCl fertilizer. The IPM trained-farmers used
much more KCl compared to those of non IPM-trained farmers, which is statistically
significant (Table 2). Only few of non IPM-trained farmers use this fertilizer although it has a
significant effect in increasing rice productivity (Table 5). One of the possible reasons is that
the non IPM-trained farmers still think the necessity of using this fertilizer while its price is a
little bit higher compared to other type of fertilizers.

77
It is important to note that none of the farmers belong to both groups apply crop rotation
(Table 1). This becomes the main reason for the high possibility of pest and disease attacks to
exist in this area. The study found that during the last 5 years the farmers experienced serious
crop damage particularly from rat attack, which now becomes the top dangerous pest in
Yogyakarta province.
Table 1 Percentage of farmers who applied IPM technology
IPM-trained
farmer
Non IPM-trained
farmer
Types of Control Application
% %
1. Resistant variety
2. Technical culture
a. Land preparation
b. Sanitation
c. Land idling
d. Crop rotation
e. Planting period
f. Crop distance
g. Recommended fertilizing
3. Mechanical control (for Rat)
a. Collective killing (“gropyokan”)
b. Trapping (net)
c. Smoking
4. Chemical control
a. Pesticide
b. Non pesticide
5. Observation
a. Every 1-3 days
b. Every 4-7 days
c. Every > 7 days
Grand Average
100
100
100
100
0
100
100
83.3
100
56.7
66.7
100
53.3
80
20
0
72
100
00
66.7
100
0
100
100
10
100
20
23.3
100
0
53.3
33.3
13.3
53
Source: Farm Survey, 2001

78
Table 2 Level of pesticide application and use of other chemical inputs
Rainy Dry 1 Dry 2 One Year
Statistical
t-value
Types of Inputs
IPM-
trained
farmer
Non
IPM-
trained
farmer
IPM-
trained
farmer
Non
IPM-
trained
farmer
IPM-
trained
farmer
Non
IPM-
trained
farmer
IPM-
trained
farmer
Non
IPM-
trained
farmer
Granular pesticide (kg/ha)
Liquid pesticide (ml/ha)
Urea (kg/ha)
TSP (kg/ha)
KCL (kg/ha)
Seeds (kg/ha)
0.9
187.7
180.8
100.2
41.0
41.2
5.6
335.7
170.0
111.2
0.0
43.0
2.2
368.0
177.6
111.3
41.9
51.0
3.1
526.4
170.6
113.3
5.5
45.3
1.0
164.6
174.9
109.3
43.6
48.9
5.3
292.5
172.4
112.2
0.0
46.7
1.4
240.1
177.8
106.9
42.2
47.0
4.6
384.9
171.0
112.2
5.5
45.0
4.42***
21.65***
1.29ns
1.13ns
5.54***
1.30ns
Source: Farm Survey, 2001 Note: *** = significant at 1% level
The study also found that IPM-trained farmers applied more mechanical pest control
compared to that of non IPM-trained farmers particularly for rat control by using trap (net)
and sulphur smoke. IPM-trained farmers also apply non-pesticide material such as salt and
ashes although the effectiveness of such measures is still questionable.
One of the distinct different between both groups is that the IPM-trained farmers have better
observation on their crops condition compared to that of non IPM-trained farmers. This is one
of the successful achievements of the IPM Farmers Field School program in this study area.
The impact of IPM on pesticide use and rice yield
The study observed that the farmers in the study area still apply pesticide as an important
measure in protecting their crops. However, the success of IPM program in reducing the
application of pesticide is obvious. Table 2 proves that IPM-trained farmers apply pesticide
(both granular and liquid pesticides) much lower compared to that of non IPM-trained
farmers, and statistically significant.
Although both groups apply pesticide for their crop protection, their philosophy of using them
is different. Most of IPM-trained farmers use pesticides only when pest attack exists, and only
few of them use pesticide for preventive motive. This is understandable as they received the
IPM principle in the training school. On the other hand, most of the non IPM-trained farmers
regarded pesticide as a preventive measure regardless the level of pest attack although some
of them apply pesticides only when severe pest attack exist.

79
Table 3 Farmers reasons of using pesticides (%)
Types Reason IPM-trained farmer Non IPM-trained
farmer
Pest attack exist
Preventive motive
High yield motive
Neighbors’ influence
66.7
16.7
10.0
6.7
40.0
50.0
16.7
10.0
Source: Farm Survey, 2001
Table 4 Rice yield, pest attack and crop loss
Rainy Dry 1 Dry 2 One year
Items IPM-
trained
farmer
Non
IPM-
trained
farmer
IPM-
trained
farmer
Non
IPM-
trained
farmer
IPM-
trained
farmer
Non
IPM-
trained
farmer
IPM-
trained
farmer
Non
IPM-
trained
farmer
Rice yield (kg/ha)
Pest attack (%)
Crop loss (kg/ha)
3611
21.5
1848
3258
29.6
2276
3673
25.6
1749
3306
26.1
2228
3865
20.5
1469
3532
25.5
2002
3717
23.0
1688
3365
27.0
2169
Source: Farm Survey, 2000
The study found that pest attack experienced by IPM-trained farmers is lower than that of non
IPM-trained farmers. Although statistically insignificant, it proves that with a significant
difference in terms of pesticide used by the two groups, it is fair to say that higher application
of pesticide does not guarantee a lower pest attack (Table 4). It seems that the higher rate of
pesticide application tends to increase the level of pest attack instead. Although the crops loss
and rice yield between the IPM-trained and non IPM-trained farmers are not statistically
different, this study found that the rice yield of the IPM-trained farmers is still higher
compared with those of non IPM-trained farmers (Table 5). This finding suggest that IPM
program shows its superiority in reducing the application of pesticides with out sacrificing the
level of production in fact increase the production although statistically insignificant.
Table 5 Regression results of productivity function
Variables Estimated results

80
Coefficients t-value
Intercept
LnUrea
LnTSP
LnKCL
LnSeed
LnGranpest
LnLiqpest
LnLabor
LnPestattack
Dummy IPM
Dummy Season1
Dummy Season2
7.6131***
0.0158
-0.0046
0.0037*
0.0411
-0.0042*
0.0203
0.1001**
-0.0683***
0.0253
0.0154
0.0497*
14.732
0.212
-0.071
1.507
0.599
-1.371
0.925
2.112
-2.429
0.785
0.461
1.447
R2
F-value
0.1518
2.732***
Note : *** = Significant at 1 % ** = Significant at 5 % * = Significant at 10 %
Conclusion By using the farm survey data the study found that during the last 5 years the farmers
experienced severe crop damages mainly from rats attack as now become the most dangerous
pest in Yogyakarta province. The study also noted that more IPM-trained farmers have tried
to apply traditional non-pesticide pest control such as salt and ashes. One of the successful
achievements of the IPM program in the study area is that the IPM-trained farmers have better
observation on their crops condition compared to those of non IPM-trained farmers.
The study found that the farmers in the study area still apply pesticide as an important way of
crop protection. The IPM program has successfully reduced the application of pesticide in
Yogyakarta province. This result is consistent with the previous study conducted by Irham
(2000). Although the rice yield between the IPM-trained and non IPM-trained farmers are not
statistically different, the rice yield of the former farmers is higher than those of the latter
farmers.

81
References
Antle, J.M. & Capalbo, S.M. (1994) Pesticides, productivity, and farmer pealth: Implication
for regulatory Policy and agricultural research. Amer. J. Agric. Econ. 76, 598-602 Antle, J.M. & Pingali, P.L. (1994) Pesticides, productivity, and farmer health: A Philippines
case study. Amer. J. Agric. Econ. 76, 598-602 Barbier, E.B. (1989) Cash crops, food crops, and sustainability: The case of Indonesia. World
Development 17(6) 879-895 Chambers, R.G. & Lichtenberg, E. (1994) Simple econometrics of pesticide productivity.
Amer. Journal Agric. Econ. 76, 407-417 Conway, G.R. & Barbier, E.B. (1990) After green revolution, sustainable agriculture for
development. Earthscan Publication, London Crissman, C.C., Cole, D.C., & Carpio, F. (1994) Pesticide use and farm worker health in
Ecuadorian potato production. Amer. J. Agric. Econ. 76, 593-597 Fernandez-Cornejo, J. (1998) Environmental and economic, Consequences of technology and
adoption: IPM in Verticulture. Agricultural Economics 18: 145-155 Harper, C.R. & Zilberman, D. (1989) Pest externalities from agricultural inputs safety. Amer.
J. Agric. Econ.76, 694-702 Harper, C.R. & Zilberman, D. (1992) Pesticides and worker safety. Amer. J. Agric. Econ. 76,
68-92 Irham & Mariyono, J. (2002) The impact of Integrated Pest Management on pesticide demand
for soybean farming in Yogyakarta, Indonesia. In: Herrmann, A. & Schumann S. (eds) Proc. Int. Workshop on Environmental Risk Assessment of Pesticides and Integrated P 92esticide Management in Developing Countries 6-9 Nov. 2001 Kathmandu, Nepal. Landschaftsökologie und Umweltforschung 38, Braunschweig
Irham (2001) Impacts of IPM Program on rice production and income. In: Toward the harmonization between development and environmental conservation in biological production (Proceedings of the International Workshop, The University of Tokyo, Japan, February 21-23).
Lazarus W.F. & Swanson, E.R. (1983) Insecticide use and crop rotation under risk: Rootworm control in corn. Amer. J. Agric. Econ. 76, 738-747
Ministry of Agriculture (1996) IPM by farmers. World Food Summit, FAO-MOA, Republic of Indonesia
Rola, A.C. & Pingali, P.L. (1993) Pesticides, rice productivity, and farmer's health. International Rice Research Institute and World Resource Institute, Philippines. Washington D.C.
Saha, A., Shumway, C.R. & Havenner, A. (1997) The economics and econometrics of damage control. Amer. J. Agric. Econ. 79, 773-785
SEARCA (1999) Integrated Pest Management Training Project (Loan 3586-IND). Impact evaluation study (Final Report)
Widawsky, D.S., Rozelle, S., Jin, S. & Huang, J. (1998) Pesticide productivity, host-plant resistance and productivity in China. Agricultural Economics 19, 203-217
Zilberman, D. & Castillo, F. (1994) Economic and health consequences of pesticide use in developing country agriculture: Discussion. Amer. J. Agric. Econ. 76: 603-604.

82
Hydrological and meteorological components in the integrated pesticide management project at Jaisidhi Khola, Tinpiple SUNIL R. KANSAKAR, SHIVA B. PRAJAPATI & ADARSHA P. POKHREL Department of Hydrology and Meteorology, Babar Mahal, G.P.O. Box 406, Kathmandu, Nepal
Abstract
Study on hydrological and meteorological aspects of the research catchment at Jaishidi,
Tinpiple in Kabhre district is one of the major activities of the Integrated Pesticide
Management (IPM) project in Nepal. Pesticides used on crops and vegetables are washed by
rain. Part of the rainfall directly flows to rivers and part infiltrates into the soil to replenish the
soil moisture reservoir and some part may percolate the ground water also. In this way the
surface runoff and the groundwater is polluted by use of pesticides on crops and vegetables.
Hydrological and meteorological parameters of the study area are, therefore, collected
extensively to evaluate the level of pollution of topsoil, surface water and groundwater.
The primary aim of this paper is to characterize the climatological and hydrological
parameters of the Jaishidi catchment. The surface and groundwater of the Jaishidi catchment
having 111 ha are polluted in Bari land and Khet land. Stream flows are collected from
Jaishidi Khola and Khet stream at Tinpiple for comparing the surface water pollution from
Bari and Khet land respectively. Stream water and well water samples are collected from the
catchment at 5 and 16 sites respectively. Likewise, two full-fledged climatological stations,
one at Bari land and another at the Khet land are installed.
Farmers are using irrigated water diverted from the Danfe Khola, which flows in the adjacent
catchment, to fulfil the water for winter crops. Diverted flow from Danfe Khola to the Jaishidi
catchment is gauged and of considerable volume, which is contributing in pollution of topsoil
and subsurface water of the catchment. Farmers from the Jaishidi catchment and the
neighbouring area are using springs for drinking water and the local wells for domestic
purpose.
Landschaftsökologie und Umweltforschung 38 p. 82-89 Braunschweig 2002

83
Introduction
Integrated pesticide management in Nepal is implemented in two sub watersheds of Jhikhu
khola. Khet land and Bari land are two sub-watersheds, which cover 111 ha in total. It is a
research project primarily focused on study of effect of pesticides in the environment and
formulation of decision support system for pesticide reduction measures. The Department of
Hydrology and Meteorology (DHM) of His Majesty's Government of Nepal is responsible for
installation, observation, supervision and processing of hydro-meteorological data of the two
watersheds.
Objective
The main objective of the hydrological and meteorological component is to provide adequate
hydrological and climatological data for assessment of pesticides in surface and subsurface,
and provide the hydrological and climatological information of the study area to the users.
Hydrological and meteorological activities in the project
Dilution process of the surplus amount of excessively applied pesticide on agriculture during
winter occurs mainly during the monsoon (June-September). In dilution process, a part of
excessive pesticide is diluted with the surface runoff and a part percolates into shallow and
deep water tables. Therefore, for the study of surface and subsurface flow, which control
transport and storage of pesticides, field measurements and detailed study of hydrology and
meteorology of the study area are important.
Observation Network
Two hydrometric stations, one at Bari land (rainfed) sub-watershed and another at Khet land
(irrigated) sub-watershed were established to collect the hydrometric data. Each station
contains V- notch weir for flow measurement and staff gauges and pressure transducer for
water level recording. Khet land station has also a floater as an additional water level
recorder. A gauging station with weir and staff gauges was also established at an irrigation
channel, which diverts flow from the other watershed, the Danfe Khola. This channel is

84
intensively used for irrigation when the flow in the study watershed becomes almost nil. Flow
measurements have been carried out at Bari land and Khet land gauging sites during the
monsoon period of 1999 and 2000. Some flood events could not be measured as the floods
occurred during the nighttime. Mostly the big events occur during nighttime.
Two full-fledged climatological stations, one at the Bari land and another at the Khet land are
operated. It includes the parameters like air temperature at 2m height from ground level,
manual and automatic rain gauge, incoming solar radiation and net radiation, wind speed and
wind direction at 3 m from ground level, soil temperature at 5cm, 10cm, 20cm and 50 cm
depth and evaporation from class A pan. The frequency of visit to the climatic stations is
once a week in order to maintain the data logger smoothly and accurately running.
Replacement of Silica Gel, Batteries for data logger and EPROMS is usually done once a
month.
Stream water at 5 locations and well water samples at 16 locations are collected from the
catchment at Tinpiple to monitor the inter connection of water quality between the surface
and groundwater as well as degradation of water quality due to pesticide applied in crop
lands. Likewise 2 streams (Jhikhu Khola and Kubinde Khola) and 21 observation wells at
Tamaghat were monitored to find out quantity of pesticide infiltrated to ground water. The
frequency of observation in these sites is at least once a week. The volume of sampling is
normally 60ml or 125ml for weekly and 500ml in each quarter a year.
Data processing
High flow measurements and establishment of stage discharge relationship and calibration of
weirs are completed for the year 2000. Staff gauge data and water level chart have been
completely processed. Weekly weather reports from two climatic stations, Bari land and Khet
land, have also been processed. Similarly, details of information from the observation wells
have been prepared.
Insufficient data caused problem in establishing rating curves. Some peak flow measurement
could not be done as the flood event occurred during nighttime.
The rating curves are established with measured data and some theoretical coefficients.

85
Precipitation at KhetLand Year 2000
0
10
20
30
40
50
60
70
80
Jan Feb Mar Apr May Jun Jul Aug Sep Oct Nov Dec
Pre
cipi
tatio
n (m
m)
Precipitation at BariLandYear 2000
0
10
20
30
40
50
60
70
80
Jan Feb Mar Apr May Jun Jul Aug Sep Oct Nov Dec
Pre
cipi
tatio
n (m
m)
Fig. 1(a)
Fig. 1(b)
Findings
The following are the findings of the hydro-meteorological activities:
• The streams are non-perennial and flashy in nature.
• Because of the availability of less data statistical analysis was not possible. Limited
analysis could be done from the available data.
• Precipitation: The annual precipitation in Bari land is 1107 mm for the year 2000,
having a maximum intensity of 25.2 mm/hr on July 24 (Figure 1a.). Likewise annual
precipitation received in Khet land is 1170 mm with a maximum Intensity of 18.5
mm/hr July 21 (Figure 1b). The long-term average (1976 to 2000) precipitation at
Fig. 1 (a) Monthly precipitation of Khet land and (b) Bari land in 2000

86
Comparison with Longterm AveragePrecipitaion
0
50
100
150
200
250
300
350
400
Jan Feb Mar Apr May Jun Jul Aug Sep Oct Nov Dec
Pre
cipi
tatio
n (m
m)
Av_St1036Y2000 Bari
Y2000Khet
Evaporation at Khet land
Year 2000
0
5
10
15
20
25
Jan Feb Mar Apr May Jun Jul Aug Sep Oct Nov Dec
Eva
pora
tion
(mm
)
Fig. 2 Comparison of monthly precipitation in 2000 with longterm precipitation
Fig. 3 Evaporation at Khet land in 2000
Tamaghat Horticulture farm is 1276 mm (Figure 2) (DHM, 1982; 1984; 1986; 1988; 1992; 1997 and 1999).
• Evaporation: Total pan evaporation is 2120 mm in year 2000. (Fig.3)
• Air temperature: The year 2000 is less warm than the long-term average temperature
(Figure 4 (a) and 4 (b)).
The extreme temperatures in 2000 were:
Maximum = 35.3 oC (2 April)
Minimum = 2.2 oC (17 January)
The study area is warmer and dryer than the Kathmandu valley.

87
Mean Daily Air Temperature at KhetLand Year 2000
0
5
10
15
20
25
30
Jan Feb Mar Apr May Jun Jul Aug Sep Oct Nov Dec
Tem
pera
ture
(
o
C
Mean Monthly Temperature
0.0
5.0
10.0
15.0
20.0
25.0
30.0
Jan Feb Mar Apr May Jun Jul Aug Sep Oct Nov Dec
Tem
pera
ture
(
o C
Tamaghat 78-99Study Area00
Fig. 4 (a)
Fig. 4 (b)
Fig. 4 (a) Air temperature in 2000 and (b) Comparison of monthly air temperature in 2000
with longterm temperature at Tamaghat.

88
Fig. 5 (a) Flow at Khet land and Bari land in 2000 (b) Flow at irrigation channel in 2000
• Runoff at Khet land, Bari land and irrigation channel is presented in figure 5 (a) and 5
(b).
• The result shows that slow the dilution process last long the contaminants. Sampling
the surface runoff and gauging the flow in streams and irrigation channel help to find
water balance and periodic changes in water qualities.
Conclusions
The year 2000 is found to be climatologically representative.
The Rating Curve of the gauging sites should be improved in case of continuation of post
project monitoring activities.
Flow at Khet land and Bari landYear 2000
0
20
40
60
80
100
120
140
160
Jan Feb Mar Apr May Jun Jul Aug Sep Oct Nov Dec
Flo
w (
l/s)
Bari land
Khet land
Flow at Irrigation ChannelYear 2000
0
10
20
30
40
50
60
70
Jan Feb Mar Apr May Jun Jul Aug Sep Oct Nov Dec
Flo
w (
l/s)
Fig. 5 (a)
Fig. 5 (b)

89
Some hydrological event model can be run with the hydrological and climatological data
collected during research period.
Hydrological and climatological data are adequate for preliminary assessments of pesticides.
The findings of this paper can be used as supplementary information of hydrological and
meteorological phenomena for the farming purpose.
Acknowledgement
The firm commitment of DHM to conduct the hydrometeorological studies of IPM
watersheds would not have been possible without the support from IPM/Nepal staff. IPM
watershed manager Mrs. Sybille Schumann deserves special thanks for her efforts. We would
like to express our sincere thanks to the project coordinator Dr. A. Hermann.
This study has become a reality due to able guidance of the Director General of the
Department of Hydrology and Meteorology Mr. Adarsha P. Pokhrel. Likewise, Mr. Sunil R.
Kansakar has given big efforts in coordinating DHM/IPM in Nepal. Furthermore, untiring
efforts of Mr. Shiva B. Prajapati, Mr. Durga Ghimire and Mr. Kshitij Bhattari in obtaining
and entering data are highly appreciated. They all deserve special thanks.
References
DHM, 1982 Climatological Records of Nepal (1976-80), Department of Hydrology and Meteorology, Kathmandu, Nepal.
DHM, 1984 Climatological Records of Nepal (1981-82), Department of Hydrology and Meteorology, Kathmandu, Nepal.
DHM, 1986 Climatological Records of Nepal (1983-84), Department of Hydrology and Meteorology, Kathmandu, Nepal.
DHM, 1988 Climatological Records of Nepal (1985-86), Department of Hydrology and Meteorology, Kathmandu, Nepal.
DHM, 1992 Climatological Records of Nepal (1987-90), Department of Hydrology and Meteorology, Kathmandu, Nepal.
DHM, 1997 Climatological Records of Nepal (1991-94), Department of Hydrology and Meteorology, Kathmandu, Nepal.
DHM, 1999 Climatological Records of Nepal (1995-96), Department of Hydrology and Meteorology, Kathmandu, Nepal.

90
Use of insecticides in Nepal VIDYA BIR SINGH KANSAKAR, NARENDRA RAJ KHANAL & MOTILAL GHIMIRE Central Department of Geography, Tribhuvan University, Kathmandu, Nepal
Abstract
The use of insecticides has been increasing in Nepal. Present paper aims to assess the spatial
dimensions of the use pattern of insecticides in the country. This paper is based on available
secondary information. The results show that the use of insecticides varies with types of crop
grown, biophysical condition and access to service infrastructures such as roads and market
towns. The use of insecticides in terms of number of holdings is comparatively higher in
sugarcane, paddy and potato, in Tarai districts located in subtropical zone and the hills with
better access to market and other service infrastructures.
Introduction
Modern chemical pesticides were first introduced in Nepal in 1955. Though present use of
pesticides in Nepal is not so high as compared to other countries in Asia, it has been
increasing in recent decades (Dahal 1995). Chemical pesticides are used in Nepal for
agricultural crops to control vector diseases and also for domestic use to control household
pests. Sometimes, it is also used for fishing.
The use of pesticides in the country is likely to grow in the future. In order to meet increasing
food demand in the country, it is necessary to increase present level of production of
agricultural crops. To some extent, it is possible through the protection of plant and crops
from diseases and pests by using pesticides. But inappropriate use and handling of pesticides
without appropriate knowledge results in several human health and environmental problems.
Such problems have already been noticed in different parts of Nepal. Ignorance on selection,
storage and handling of pesticides among many of the farm families on the one hand and
tendency to use highly toxic pesticides for immediate effect on the other have exacerbated
Landschaftsökologie und Umweltforschung 38 p. 90-98 Braunschweig 2002

91
Fig. 1 Districts of Nepal by ecological zones
100 0 100 Kilometers
Nepal
28.00
30.00
86.00 88.00
80.00 82.00
84.00
88.0086.00
84.0082.0080.00
Dolpa
Humla
Mugu
Dang
Kailali
Doti
Gorkha
Bajhang
Jumla
Mustang
Rukum
Ilam
Kaski
Taplejung
Bajura
Rolpa
Surkhet
Myagdi
Sindhuli
Banke
Manang
Jajarkot
Chitwan
Salyan
Solukhumbu
Bara
Bardiya
Dolakha
Darchula
Jhapa
Palpa
Kalikot
Udaypur
Kavre
Morang
Parsa
Dhading
Baglung
Baitadi
Achham
Sankhuwasabha
Makwanpur
Dailekh
Lamjung
Bhojpur
Saptari
Khotang
Gulmi
Siraha
Rasuwa
Sarlahi
Tanahun
Nawalparasi
Sindhupalchok
Kapilbastu
Sunsari
Pyuthan
Kanchanpur
Nuwakot
Dhanusa
Syangja
Dadeldhura
Rupandehi
Ramechhap
PanchtharRautahat
MahottariDhankuta
Parbat
Okhaldhunga
Arghakhanchi
Terhathum
Lalitpur
KathmanduBhaktapur
LegendMountain DistrictHill DistrictTarai District
Physical Divisions
such problems (Klarman 1987, Dahal 1995). Moreover, inaccessibility and unavailability of
adequate service infrastructures such as health have caused poor response among affected
families to cope with the impacts of pesticides use. Proper understanding of the use of
pesticides at different spatial scale and planning and administrative units is necessary so that
immediate actions could be taken in problematic areas. It is in this context, present paper aims
to assess the use pattern of insecticides in Nepal.
Methods and materials
This paper is based on available secondary information on the use of insecticides in the
country. Central Bureau of Statistics (CBS), National Planning Commission, His Majesty
Government of Nepal has published data on National Sample Census of Agriculture carried
out in 1991/92. It contains district wise information on the number of holdings using different
types of agricultural inputs including insecticides. Number of household using insecticides
has been reported for major crops grown in the country. These include paddy, maize, wheat,
potato, vegetables and sugarcane. Based upon this information, spatial dimensions of the use
of insecticides in the country have been assessed and analysed.
Results and discussions
Nepal is divided into 75 administrative districts and three major ecological zones - Tarai, hills
and mountains. Tarai is the
northern extension of the Indo-
Gangetic plain, which is very
fertile and accessible as compared
to the hills and mountains. Large
areas in the hills and mountains are
still inaccessible and it takes more
than nine days walk to reach from
road heads and major market
centres. Though district boundary
does not exactly match with the
ecological boundary, the government has divided these districts into these three zones.
Government's definition has been followed in this paper. Fig. 1 shows the location of districts

92
N o n e B e l o w
- 3 3 - 1 0 1 0 - 1 5 1 5 - 3 6
9 0 0 9 0 K i l o m e t e r s
P e r c e n t a g e o f H o l d i n g s U s i n g I n s e c t i c i d e f o r P a d d y
M a p
N
by ecological zones.
Table 1 shows total number of reported holdings growing paddy and the number of holdings
using insecticides. Out of total holdings growing paddy, only 13.3 percent holdings use
insecticides in paddy crop. Percentage of holdings using insecticides decreases from Tarai in
the south to the hills and mountains in the north. It is 20.9 percent in the Tarai, 7.3 percent in
the hills and 1.4 percent in the mountains. District wise percentage of holdings using
insecticides in paddy is shown in Fig. 2. It shows that the percentage of holdings using
insecticides in paddy is comparatively very high in districts located in central Tarai and
Kathmandu valley, which are highly accessible to major market centres.
Table 1 Number and percentage of holdings using insecticides in paddy crop
Holdings reported Holding using
insecticides
Ecological
regions
Total number of
holding
Number Percent Number Percent
Mountain 211391 143165 67.7 2056 1.4
Hill 1407077 928529 66.0 68062 7.3
Tarai 1117618 953330 85.3 199302 20.9
Total 2736086 2025024 74.0 269420 13.3
Source: CBS (1994)
Fig. 2 Percentage of holdings using insecticides for growing paddy

93
N o n e B e l o w
1
1 - 3
3 - 1 0
1 0 - 3 0
9 0 0 9 0 K i l o m e t e r s
P e r c e n t a g e o f H o l d i n g s U s i n g I n s e c t i c i d e f o r M a i z e
M a p
N
Table 2 shows total number of reported holdings growing maize and the number of holdings
using insecticides. Percentage of holdings using insecticides in maize is very low. Only 2.5
percent of the total maize growing holdings use insecticides. This percentage is comparatively
very high in the Tarai (5.5 percent) as compared to hill (2.1 percent) and mountain (0.5
percent) districts. District wise percentage of holdings using insecticides is shown in Fig. 3. It
shows that the Tarai and hill districts located in central part of the country have comparatively
higher percentage of holdings using pesticides in maize.
Table 2 Number and percentage of holdings using insecticides in maize crop
Holdings reported Holding using
insecticides
Ecological
regions
Total number of
holding
Number Percent Number Percent
Mountain 211391 177391 83.9 875 0.5
Hill 1407077 1407077 100.0 32113 2.1
Tarai 1117618 355244 31.8 19374 5.5
Total 2736086 2081375 76.1 52362 2.5
Source: CBS (1994)
Fig. 3 Percentage of households using insecticides for growing maize

94
Below 11 - 55 - 1515 - 30
90 0 90 Kilometers
Percentage of Holdings Using Insecticide for Wheat
Map
N
Table 3 shows total number of reported holdings growing wheat and the number of holdings
using insecticides. About 5 percent holdings growing wheat use insecticides in the country. It
is higher in Tarai as compared to the hills and mountains. Fig. 4 shows the percentage of
holdings using insecticides in districts. Again the percentage of holdings using insecticides is
higher in the central part of the country.
Table 3 Number and percentage of holdings using insecticides in wheat crop
Holdings reported Holding using
insecticides
Ecological
regions
Total number of
holding
Number Percent Number Percent
Mountain 211391 155257 73.5 1152 0.7
Hill 1407077 784803 55.8 26899 3.4
Tarai 1117618 696426 62.3 55909 8.0
Total 2736086 1636486 59.8 83960 5.1
Source: CBS (1994)
Fig. 4 Percentage of households using pesticides fro growing wheat
Table 4 shows total number of reported holdings growing potato and the number of holdings
using insecticides. About 11 percent of the total holdings growing potato use insecticides and
its percentage is comparatively very high in the Tarai as compared to hill and mountain
districts.

95
9 0 0 9 0 K i l o m e t e r s
P e r c e n t a g e o f H o u s e h o l d
U s i n g I n s c t i c i d e f o r P o t a t o
M a p
N
B e l o w 1 1
- 5 5 - 1 0 1 0 - 1 5 1 5 - 6 0
Fig. 5 shows the percentage of holdings using insecticides in potato in different districts of
Nepal. It shows that the Tarai and the hill districts located in the central part of the country
have comparatively higher percentage of holdings using insecticides.
Table 4 Number and percentage of holdings using insecticides in potato crop
Holdings reported Holding using
insecticides
Ecological
regions
Total number of
holding
Number Percent Number Percent
Mountain 211391 91902 43.5 463 0.5
Hill 1407077 317406 22.6 24185 7.6
Tarai 1117618 326746 29.2 55214 16.9
Total 2736086 736054 26.9 79862 10.9
Source: CBS (1994)
Fig. 5 Percentage of households using pesticides for growing potato
Table 5 shows total number of reported holdings growing vegetables and the number of
holdings using insecticides. About 7 percent of the total holdings growing vegetables use
insecticides and its percentage is comparatively very high in the Tarai as compared to hill and
mountain districts. Fig. 6 shows the percentage of holdings using insecticides in vegetables in

96
Nonebelow 33- 55- 1515 - 33
90 0 90 Ki lome ters
Percentage of Holdings Using Insecticde in Vegetable Crops
Map
N
the districts of Nepal. It shows that the Tarai and the hill districts located in the central part of
the country have comparatively higher percentage of holdings using insecticides.
Table 5 Number and percentage of holdings using insecticides in vegetables
Holdings reported Holding using insecticides
Ecological
regions
Total number of
holding
Number Percent Number Percent
Mountain 211391 68578 32.4 416 0.6
Hill 1407077 377501 26.8 15740 4.2
Tarai 1117618 319976 28.6 38043 11.9
Total 2736086 766055 28.0 54199 7.1
Source: CBS (1994)
Fig. 6 Percentage of households using pesticides for growing crops
Table 6 shows total number of reported holdings growing sugarcane and the number of
holdings using insecticides. About 24 percent of the total holdings growing sugarcane use
insecticides. The percentage of holdings using insecticides is relatively high in Tarai in
comparison to hill and mountain districts. District wise percentage of holdings using
insecticides is given in Fig. 7. Again, the percentage of holdings using insecticides is higher in
the Tarai and hill districts in the central part of the country.

97
Figure 7
NoneBelow 55 - 1010 - 3030 - 100
90 0 90 Kilometers
Percentage of Holdings Using Insecticide for Sugarcane
Map
N
Table 6 Number and percentage of holdings using insecticides in sugarcane
Holdings reported Holding using insecticides
Ecological
regions
Total number of
holding
Number Percent Number Percent
Mountain 211391 2000 1.0 65 3.3
Hill 1407077 13178 0.9 216 1.6
Tarai 1117618 67411 6.0 19167 28.4
Total 2736086 82589 3.0 19448 23.6
Source: CBS (1994)
Fig. 7 Percentage of households using pesticides for growing sugarcane
Conclusion
This study shows that the use of insecticides in terms of the number of holdings is
comparatively high in crops like sugarcane (23.6 percent) followed by paddy (13.3 percent),
potato (10.9 percent) and vegetables (7.1 percent) in the country. The use of insecticides
seems to be more in the cash crops such as sugarcane, paddy, potato and vegetables. The
percentage of holdings using insecticides is comparatively high in central part of the country
including Kathmandu valley where access to road and market towns is easy. Very few

98
holdings are using insecticides in mountain districts. It is mainly due to the fact that these
districts are inaccessible and the occurrence of pests and diseases in high altitude area is
comparatively low. In the absence of information, it is not possible to discuss use intensity
and handling of insecticides and its impact in the country as a whole, and this is very essential
for the sustained economic and environmental development. However, studies carried out in
many parts of the country shows that many environment and health related problems have
already been noticed due to misuse of chemical insecticides in the country. Further works on
impact assessment are needed.
References Herrmann, A.R.E.W., Schumann, S.A., Neupane, F.P., Niraula, B.B., Wiebelt, M., Khanal,
N.R., Pujara, D.S. & Upadhyay, B.P. (2001) Chances of Protecting Middle Mountains Environments in Central Nepal from Pesticide Misuse Considering Socio-Economic Condition. In: Proc. Internat. Symp. on the Himalayan Environments: Mountain Sciences and Ecotourism/Biodiversity Kathmandu Nov. 2000 (T. Watanabe, S. Sicroff, N.R. Khanal and M.P. Gautam (eds)), Kathmandu, 246-260
Dahal, L. (1995) A Study on Pesticide Pollution in Nepal. Kathmandu: National Conservation Strategy Implementation Project, National Planning Commission, HMG Nepal, Kathmandu
Klarman, W.L. (1987) Pesticide Use in Nepal. ARPP Consultancy Report No. 9 submitted to Winrock International Institute for Agricultural Development, US Agency of International Development, Kathmandu
CBS (Central Bureau of Statistics) (1994) National Sample Census of Agriculture, Nepal, 1991/92. National Planning Commission, HMG Nepal, Kathmandu

99
Pesticides in soils - Exper imental design of laboratory, lysimeter and field studies ROBERT KREUZIG & MÜFIT BAHADIR Institute of Ecological Chemistry and Waste Analysis, Technical University Braunschweig, 38106 Braunschweig, Germany
Abstract
The application of plant protection products is inevitably accompanied by a temporary soil
contamination (Fig. 1). This impact on soil quality is only acceptable when pesticide residues
are subsequently eliminated by microbial and chemical degradation processes. Before
pesticides are frequently applied in agricultural production, their environmental fate and
behaviour have to be assessed in the frame of the registration procedure in Germany.
Considering the state of scientific knowledge, a risk/benefit analysis has to be performed
focused on a multistep control concept with sequential laboratory, lysimeter and field studies.
Furthermore, the same experimental approaches are consequently applied in post-registration
monitoring programmes to study long-term effects of pesticides applications.
Sorption
Sorption and degradation are the main concentration determining processes for pesticides in
soils (Kreuzig 1998). On the one hand, chemical and microbial degradation and
mineralisation lead to the elimination of parent compounds applied and corresponding
metabolites formed (BBA 1986a). On the other hand, sorption processes determine the
availability of these xenobiotics in the soil solution. Subsequently, pesticide residues
occurring in the soil solution may underly leaching and transport into deeper soil horizons and
into aquifers by saturated and unsaturated water flow, respectively. A relevant mobility of
pesticides could be given when the soil/water coefficients are Kd<5, KOC<300, the solubility is
>30 mg/L and the disappearance time of 50 % of the amount initially applied is DT50> 14
days (Fichter & Holden 1992).
Landschaftsökologie und Umweltforschung 38 p. 99-110 Braunschweig 2002

100
transport in the atmosphere
drift
application of pesticides
post applicative volatilisation
volatilisation from plant stands
interception in plant stands
soil contamination
volatilisation from soil surfaces
surface water contamination
sorption to soil matrix
leaching
plant uptake
ground water contamination
formation of metabolites
mineralisation
chemical/
microbial
degradation
foliar application
soil application wash off
photolysis
run off
Fig. 1 Fate and behaviour of pesticides in agro-ecosystems (Kreuzig 1998)
Kd and KOC values
Therefore, mobility and leaching of pesticides have to be assessed defining threshold values
for YES/NO decisions (Fig. 2). The basis of testing concept I is defined as DT50<20 days and
KOC>500 (Kloskowski et al. 1992a). This means that only compounds with high
disappearance rates and slight to high sorption tendencies can be directly registrated without
the performance of additional leaching tests. Particularly considering that high sorption
tendencies are attended by low pesticides concentrations in the soil solution, high KOC values
should exclude low DT50 values. According to this, both threshold values are closely
correlated to each other and nearly every pesiticide has to be tested.

101
Following the NO decision, pesticide concentration, environmentally and toxicologically
relevant concentrations, the latter ones are approximately matching PEC/PNEC approaches
(BBA 1998, Kratz et al. 2000), has to be assessed by the simulation of worst case scenario. In
principle, the pesticides concentration in the soil solution has to fall below the
environmentally and toxicologically relevant concentrations to impede adverse effects on
algae, bacteria, daphnia, fishes and higher plants as well as on man and domestic animals,
respectively. If a concentration of C>10 µg/L would be exceeded, lysimeter trails have
subsequently to be performed with special respect to ground water contamination (BBA
1990).
DT50 < 20 days KOC > 500
simulation of worst case scenario
C < 0.1 µg/L C/ERC < 1 C/TRC < 1
C > 10 µg/L
lysimeter trials
no registration
no registration registration
YES
YES
YES
YES
NO
NO
NO
NO
C < 0.1 µg/L C/ERC < 1 C/TRC < 1
C = concentration (~ PEC: predicted environmental concentration) ERC = environmentally relevant concentration (~ PNEC: predicted no effect concentration) TRC = toxicologically relevant concentration (~ PNEC) Fig. 2 Testing concept I on mobility and leaching of pesticides (Kloskowski et al. 1992a)

102
The experimental determination of Kd values according to the OECD guideline 106
"adsorption/desorption" shows substance and soil specific differences (OECD, 1981). For the
morpholine fungicides fenpropimorph and aldimorph and their primary metabolites
fenpropimorphic acid and aldimorph-C12-alcohol, Kd values illustrate higher sorption
tendencies for the alkyl substituted morpholine than for the phenyl substituted one and for
both metabolites in contrast to the parent compounds reflecting differences in polarity.
Particularly the Kd values of 0.5 and 1 for fenpropimorphic acid in silty sand and clayey silt
soil reveal high mobility and leaching potential (Stockmaier et al. 1996, Stockmaier et al.
1997).
Soil column experiments
As shown in Fig. 3, testing concept II is targeted on pesticides of higher persistence and
focused on soil column experiments under worst case conditions, i.e. disturbed soil sample
and saturated water flow (BBA 1986b). If the threshold value of DT90 > 100 days is exceeded
or not, amounts of 5 % or 10 % of the parent compound or corresponding metabolites,
respectively, are allowed to occur in the percolate. If these limits are exceeded, column tests
with "aged" residues have to be incorporated into this test scheme in order to control the
availibility reducing impact of sorption. If aged residues occur in the percolate in amounts of
>2 %, lysimeter trials have to be subsequently performed following testing concept I.
As examplified in the soil column experiment applying fenpropimorphic acid, the Kd value of
0.5 do not correspond to a significant percolate contamination. The application rate was
500 µg and 393 mL demineralised water were infiltrated simulating the precipitation of
200 mm. Nevertheless, only 0.1 % of the amount applied was determined in the percolate
(Stockmaier et al., 1996). The same result was given for fenpropimorph which was fortified in
a parallel experiment. Significant differences were found when the soil samples of the
columns were separated into 5-cm soil layers. While the parent compound was remained in
the superficial soil layer, the metabolite was distributed within the soil column with maximum
concentrations in the 15-20-cm layer. Despite of its high polarity and its low Kd value, the
infiltration rates were not high enough for its passage through the soil column and for the
percolate contamination.

103
Lysimeter and field studies
The same tendency was found when lysimeter trials were performed applying a 14C-labelled
fenpropimorph formulation (Ebing et al., 1994). Within a period of 56 days, the results of the
formation of metabolites and non-extractable residues under laboratory conditions could be
confirmed. However, no radioactivity was detected in the percolate although the lysimeters
were additionally sprinkled over a period of 4 years.
column experiments with "fresh" residues
DT90 > 100 days
> 10 % active substance
or metabolites in the percolate
lysimeter trials
follow testing concept I
registration
YES
YES
YES
NO
YES
NO
NO
column experiments with "aged" residues
> 2 % active substance
or metabolites in the percolate
> 5 % active substance
or metabolites in the percolate
NO
Fig. 3 Testing concept II on mobility and leaching of pesticides (Kloskowski et al. 1992a)
Finally, leaching potentials of fenpropimorph applied and fenpropimorphic acid formed were
investigated in field studies (Stockmaier et al. 1996). Soil samples taken in Ap horizons of 2
different investigation sites were characterised by grain size distribution as silty sand and

104
clayey silt soil. Since the polar metabolite only was found in the 0-5-cm layers,
fenpropimorph itself was transported into the 5-10-cm layer in the silt soil and into the 20-30-
cm layer of the less sorptive sand soil.
The comparison of the results achieved in laboratory, lysimeter and field studies indicates that
the exclusive determination of Kd values is not a sufficient criterion for the evaluation of
leaching and mobility. Particularly in the field study, very low concentrations of
fenpropimorphic acid have to be assumed due to the non-quantitative decomposition of the
parent compound and the simultaneous degradation of the metabolite. According to a limit of
determination of 10 µg/kg dry soil, these facts impede the investigation of the leaching
potential of this compound under field conditions. On the other hand, these studies show that
a compound with Kd > 50 and KOC>500 can be transported into soil layers, e.g. due to
preferential flow.
Degradation
The main aspect for the acceptance of a frequent pesticide application in agro-ecosystems is
based on the elimination of the compounds applied after they performed their targeted
biological efficacy (Fig. 4). In order to impede accumulation especially in soils as an
environmentally relevant sink, transport, and transformation systems, the use of persistent
compounds cannot be registrated today.
Disappearance of parent compounds applied
The threshold value of disqualifying pesticides is DT90 > 100 days (Kloskowski et al. 1992b).
Alternatively to this criterion, which is based on laboratory experiments, a DT90 < 1 year
under field conditions can be accepted when soil application rates are < 300 g active
substance/ha or foliar application rates are < 600 g active substance/ha. This testing concept is
mainly focused on the disappearance of the parent compound applied so that a differentiation
between sorption and degradation is not possible. As examplified in field studies with
fenpropimorph, only the residue analytical determination of main metabolites confirm that
degradation processes contribute to the elimination of the parent compound applied. In this
way, however, pesticides fate cannot be described in detail.

105
laboratory batch experiments: DT90 > 100 days
no registration, except
field studies: DT90 > 1 year
soil application rate > 300 g AS#/ha
or foliar application rate > 600 g AS#/ha
no registration registration
NO
NO
NO
YES
YES
YES
# AS = active substance Fig. 4 Testing concept on the disappearance of parent compounds applied (Kloskowski et al. 1992b)
Metabolic studies
Therefore, metabolic studies in the laboratory scale have to be performed using radiotracer
technique. The application of 14C-labelled compounds facilitates to set up detailed mass
balances especially considering mineralisation and the formation of extractable and non-
extractable residues. One threshold value defined in the registration procedure in Germany is
due to the occurrence of metabolites > 10 %. A positive finding requires further experimental
investigations on the environmental fate of the relevant metabolites, e.g. DT90 > 100 days. A
further exclusion criterion is the formation of non-extractale residues > 70 % in 100 days (Fig.
5).

106
laboratory batches: radiotracer studies on metabolic pathways
occurrence of metabolites C > 10 %
DT90 > 100 days
field studies:
residue analysis of parent compounds and metabolites for individual case decision
degradation experiments applying
metabolites
non-extractable residues
> 70 % in 100 days
no registration
registration
NO
NO
YES
NO
NO
YES
YES
YES
Fig. 5 Testing concept on the metabolic fate of pesticides with special consideration of non-extractable residues (Kloskowski et al. 1992b)
Laboratory batch experiments with 14C-labelled fenpropimorph confirm results of field
studies showing a rapid drop down of the parent compound. Obviously, this decrease cannot
be exclusively explained by the formation of the metabolites identified. Then, mineralisation
which increased to 49 % in 102 days implys the complexity of metabolic pathways and the
difficulties of their identification (Fig. 6). This is the same for the nature of non-extractable
residues. Until today, it is not possible in all cases to distinguish whether parent compounds
or metabolites or other products of decomposition are reversibly or irreversibly fixed in the
soil matrix. Therefore, this phenomenon can only be determined as a sum parameter of 14C-
carbon dioxide released during combustion. Nevertheless, a relevant formation of non-
extractable residues as it is assumed for the alkyl substituted morpholine fungicide aldimorph
may exclude the registration of a pesticide.

107
Fig. 6 Degradation of 14C-labelled fenpropimorph (FPM) in clayey silt with special consideration of mineralisation (MIN), corresponding metabolites (FPMA: fenpropimorphic acid, RCP I + II: morpholine ring cleavage products) and non-extractable residues (NER) (Kreuzig 1998)
Laboratory batch experiments with 14C-labelled fenpropimorph confirm results of field
studies showing a rapid drop down of the parent compound. Obviously, this decrease cannot
be exclusively explained by the formation of the metabolites identified. Then, mineralisation
which increased to 49 % in 102 days implys the complexity of metabolic pathways and the
difficulties of their identification (Fig. 6). This is the same for the nature of non-extractable
residues. Until today, it is not possible in all cases to distinguish whether parent compounds
or metabolites or other products of decomposition are reversibly or irreversibly fixed in the
soil matrix. Therefore, this phenomenon can only be determined as a sum parameter of 14C-
carbon dioxide released during combustion. Nevertheless, a relevant formation of non-
extractable residues as it is assumed for the alkyl substituted morpholine fungicide aldimorph
may exclude the registration of a pesticide.
The metabolic fate of the azol fungicide prochloraz in soil under laboratory and field
conditions significantly differs (Fig. 7). This imidazole derivative is revealed as a persistent
pesticide in the laboratory and batches on the microbial degradability have to be considered as
a worst case contemplation only (Höllrigl-Rosta et al. 1999). Thus, the registration of
prochloraz is justified by the rapid disappearance of the active substance applied and relevant
formation of corresponding metabolites in field trials (Fig. 8). As to enhance the state of
scientific knowledge, laboratory UV-irradition tests (λ ≥ 290 nm) on pesticides phototrans-
20 40 60 80 100
days after application
10
20
30
40
50
60
70
radioactivity [%]
FPM FPMA RCP I RCP II MIN NER

108
formation in soils should be supplementary incorporated into the multistep testing concept of
the German and European pesticide registration procedure (OECD 2002).
Fig. 7 Metabolic fate of the azol fungicide prochloraz (PCZ) in soil under laboratory conditions with special consideration of mineralisation (MIN), corresponding metabolites (PCZ-FH: formyl-urea, PCZ-H: urea) and non-extractable residues (NER) (Höllrigl-Rosta et al. 1999)
Fig. 8 Metabolic fate of the azol fungicide prochloraz (PCZ) and corresponding metabolites (PCZ-FH: formyl-urea, PCZ-H: urea) in soil under field conditions
50 100 150 200 250 300
days after application
20
40
60
80
100 radioactivity [%]
PCZ PCZ-FH PCZ-H MIN NER
10 20 30 40 50 60
days after application
50
100
150
concentration [µg/kg]
PCZ PCZ-FH PCZ-H

109
Conclusion and Outlook
Before the frequent application of pesticides in agro-ecosystems, their fate and behaviour
have to be evaluated according to a multistep testing concept which has to be defined by the
registration authorities. In all these tests, benefits and risks have to be assessed according to
the current state of scientific knowledge. Furthermore, the long-term effects of pesticides have
to be investigated in post-registration monitoring programmes. Particularly in these research
activities, investigation site specific and production system specific conditions (e.g. humide
climate in Germany, monsoon climate and ponding irrigation in Nepal) have to be considered.
The implementation of a national pesticide registration procedure will ensure the agricultural
production and enhance the chance for the export of products to the worldwide market.
However, regulation of pesticides also means the control of legislative measures, i.e.
analytical control of maximum residues levels of foods and feeds, compliance with waiting
times, application rates, and threshold values for personal and environmental protection. On
the other hand, pesticide research can become a pulse transmitter in environmental sciences
and management supporting consumer protection and sustainable development.
References
BBA (1986a) Fate of pesticides in soil - degradation, decomposition and metabolism.
Standard of the official pesticide registration (in German). Part IV, 4-1. Federal Research Centre for Agriculture and Forestry. ACO Druck, Braunschweig
BBA (1986b) Leaching and mobility of pesticides. Standard of the official pesticide registration (in German). Part IV, 4-2. Federal Research Centre for Agriculture and Forestry. ACO Druck, Braunschweig
BBA (1990) Lysimeter studies on pesticides leaching behaviour. Standard of the official pesticide registration (in German). Part IV, 4-3. Federal Research Centre for Agriculture and Forestry. ACO Druck, Braunschweig
BBA (1998) Data requirements and criteria for decision-making in the European Union and the Federal Republic of Germany for the authorization procedure of plant protection products. Fate and behaviour in soil, water, air/predicted environmental concentrations (PEC). Mitt. a.d. Biol. Bundesanst. 358, 54-62
Ebing, W., Forst, M., Kreuzig, R. & Schuphan, I. (1995) Investigations on degradation and leaching of fenpropimorph in lysimeter studies (in German). Nachrichtenbl. Dt. Pflanzenschutzdienst 47 (1), 5-9
Fichter, P.M. & Holden, P.W. (1992) A field study to meet United States Environmental Protection Agency regulatory for measurement of movement of pesticides to ground water. Proc. Brighton Crop Protect. Conf. Pests and Diseases 7C (15), 853-858
Höllrigl-Rosta, A., Kreuzig, R. & Bahadir, M. (1999) Investigations on the metabolic fate of prochloraz in soil under field and laboratory conditions. Pestic. Sci. 55 (5), 531-538

110
Kratz, W., Abbas, B. & Linke, I. (2000) Pharmaceutical residues in the environment (in German). UWSF - Z. Umweltchem. Ökotox. 12 (6), 343-349
Kloskowski, R., Nolting, H.-G. & Schinkel, K. (1992a) Release into the ground water. In: Assessment of pesticides in the official registration procedure (in German). Mitt. a. d. Biol. Bundesanst. 284, 66-70
Kloskowski, R., Nolting, H.-G. & Schinkel, K. (1992b) Fate in soil. In: Assessment of pesticides in the official registration procedure (in German). Mitt. a.d. Biol. Bundesanst. 284, 61-65
Kreuzig, R. (1998) Development of analytical methods for the differentiation of degradation and sorption as concentration determining processes for pesticides in soil (in German). Habilitationsschrift, Nat. Sci. Faculty Technical University Braunschweig (ISBN 3-89720-291-3)
OECD (1981b) Guideline for testing of chemicals. Adsorption/Desorption 106, 1-18 OECD (2002) Guideline for testing of chemicals. Phototransformation of chemicals on soil
surfaces. Draft document. Stockmaier, M., Kreuzig, R. & Bahadir, M. (1996) Investigations on the behaviour of fen-
propimorph and fenpropimorphic acid in soil. Pestic. Sci. 46, 361-367 Stockmaier, M., Kreuzig, R. und Bahadir, M. (1997) Laboratory and field studies on
degradability of the morpholine fungicide aldimorph (in German). Nachrichtenbl. Dt. Pflanzenschutzdienst 49 (1), 5-10

111
Brassica Amendments and Summer Irrigation: Soil Disinfestation Alternative to Methyl Bromide in Developing Countries SATISH LODHA, RITU MAWAR, SUNIL ISRAEL & M.P. SINGH Central Arid Zone Research Institute, Jodhpur, 342003, India
Abstract
At least ten fungal genera have been recognised playing a major role in the root disease
complex causing seed decay, damping off, root rot, seedling blight, collar-, crown-, foot-rots
and wilt. These pathogens cause severe damage, each having a wide host range covering all
groups of plants. Utilizing intense solar irradiation and high temperatures of hot arid region, a
novel non-chemical method of soil disinfestation was developed. In this method, brassica
residues (oil –cake/pod straw) are amended in soil and one irrigation is given during May-
June. These residues on decomposition release certain bio-toxic volatiles like allyl
isothiocynates (ATIC), which are lethal to germinating resting structures of soil-borne plant
pathogens. Prolonged exposure to dry summer heat exerted a weakening effect on surviving
propagules of Macrophomina phaseolina, a dry root rot pathogen and Fusarium oxysporum
causing wilt. This improved the efficiency of cruciferous residues and summer irrigation.
Significant reduction in dry root rot (M. phaseolina) on clusterbean and wilt (Fusarium
oxysporum f. sp. cumini) on cumin in the same field was recorded. This method of cultural
control has begun to find acceptance in the resource deficient farming community of Indian
desert.
Introduction Soil–borne plant pathogens like Fusarium, Pythium, Macrophomina, Sclerospora,
Ganoderma, etc. causes serious losses in many economically important crops and trees in
Indian arid region (Lodha et al. 1986). The population of these pathogens increases with the
increased years of cultivation of susceptible crops in the same piece of land. Use of resistant
varieties is the most practical way of managing these diseases, but in many crops, resistant
sources are not available. Soil solarization has been found to be an efficient method of
disinfesting soil from resting structures of many stub-born pathogens like Macrophomina and
Landschaftsökologie und Umweltforschung 38 p. 111-119 Braunschweig 2002

112
Fusarium (Lodha & Solanki 1992, Lodha 1995). However, it has not been found wider
acceptance under resource deficient farming community because of high cost involved in
mulching the infested soil with polyethylene sheet.
In recent years, considerable interest has been generated world wide on the use of cruciferous
residues which has been found to suppress certain soil-borne pathogens and root diseases
(Angus et al. 1994, Brown & Morra 1997, Muchlchen & Parke 1990). Crucifers like mustard,
cabbage, radish, cauliflower, etc. are characterized by high content of sulphur containing
compounds which when exposed to enzymatic decomposition can generate toxic volatile
compounds (Lewis & Papavizas, 1970 1971). A greater release of these volatiles was found at
high temperature (Gamliel & Stapleton 1993). Since intense solar irradiations and high
temperatures are characteristic features of hot arid region, efforts were made to ascertain
efficiency of cruciferous residues in control of two important soil-borne pathogens,
Macrophomina phaseolina and Fusarium oxysporum f. sp. cumini causing dry root rot in
legumes and wilt on cumin, respectively. Studies were also conducted to ascertain role of sub-
lethal heating exerting weakening effect on resting structures of pathogenic propagules.
Materials and methods
Experimental site
The experiments were conducted at the Central Research Farm of Central Arid Zone Research
Institute, Jodhpur, India. The soil of the experimental site was loamy sand formed by aeolian
activity. It has 85.0% sand, 8.9% clay, 5.5% silt, 0.031% total nitrogen, 0.25% organic
carbon, 9ppm available phosphorus, 8.1 pH, 0.88 dSm-1 electrical conductivity, 1.56 g cm-3
bulk density and 10% moisture holding capacity (MHC).
Pathogens and inoculum preparation
Macrophomina phaseolina (Tassi) Goid. and Fusarium oxysporum f. sp. cumini Prasad and
Patel, were used as test Pathogens throughout the course of this study. Virulent pathogenic
strains of M phaseolina and F. O. f. sp. cumini were isolated from the diseased roots of
clusterbean (Cyamopsis tetragonoloba (L.) Taub. and cumin (Cuminum cyminum L.),
respectively. These were separately multiplied in bulk on 5% corn meal:sand medium for 15
days at 30+2°C. The sclerotia of M. phaseolina and spores (conidia and chlamydospores) of

113
Fusarium so produced were passed through 300 mesh (53µm) sieve. The infested material left
on the sieve was first examined under the microscope to confirm that it contains only sclerotia
(Papavizas & Klag 1975) of M.phaseolina or chlamydospores of Fusarium and then mixed with
324 kg of the field soil to prepare M. phaseolina and Fusarium infested soil. The infested soil
was then left for 7-10 days in bright sun light for further stabilization before any use.
Effects of sub-lethal heating
The experiment in the year 1998, was arranged in two sets (A and B) of pits (30 x 30 cm)
wherein summer irrigation was applied in May - A or in June - B. These pits were dug in 4x3
m plots each 1m apart in an open field receiving bright sunlight atleast for 9-11 h a day.
On March 30, 9 kg of M phaseolina and Fusarium infested soil was filled up to surface level
in all the pits of sets A and B. Two 5 g sub-samples were taken soon after filling from each
pit for the estimation of viable propagules of each pathogen. The soil in pits of set A was
withdrawn and separately amended on April 30 with 1. Mustard residues - MR (0.18%), 2.
Mustard residues - MR (0.18%) + Mustard oil cake - MC (0.04%), 3. Mustard residues - MR
(0.18%) + Cauliflower residues – CR (0.04%), and 4. Mustard residues - MR (0.18%) +
Eruca residues – ER (0.04%), and than refilled in randomly selected pits. Pits filled only
with M phaseolina and Fusarium infested soil served as wet (SI) and dry (DS) non-amended
controls (5 and 6). Three pits for each treatment comprised three replications. On May 1, one
irrigation of 45 cm depth was applied by flooding to bring the soil to field capacity (10.4%
w/w or 0.003 MPa) in all the pits of set A except dry control. Soil from set B was withdrawn
from pits on May 31. These were also amended separately with aforesaid combination of
cruciferous residues except wet control. Irrigation was applied on June 1 in all the pits in the
manner described above.
Soil temperatures were recorded at 15 cm depth in one representative pit of all the treatments
from second day of irrigation (May 2 and June 2) till 15th of each month. Soil samples were
collected at a depth of 0-30 cm by a tube auger at 8 AM on July, 1 from each pit of all the
sets for estimating viable counts of M. phaseolina and Fusarium.

114
Integration of brassica amendments and summer irrigation
A field experiment was conducted to study the combined effects of cruciferous amendments
and summer irrigation on dry root rot intensity of cluster bean (July-Oct 2000) and wilt of
cumin (Nov.-March 2000-2001) in the same field. The experimental field had a previous
history of cultivation of legumes and cumin. Thus, native populations of both the pathogens
were present in the soil. To further confirm this, the soil samples were collected randomly
from this field using a 2.5 cm diameter soil auger and populations of M phaseolina and
Fusarium were determined. Experimental plots (4x3 m.) were arranged in a completely
randomized block design with four treatments: T1 – Mustard residues (MR 0.11% or 2.5 ton
ha-1) amendment in May + summer irrigation (SI), T2 – MR + mustard oil-cake (MC – 0.04%)
amendment + SI in July before sowing (NS), T3 – SI only and T4 – Control (without any
amendment or summer irrigation). Five replications were kept for each treatment.
Mustard residues at 3 kg plot-1 and mustard oil-cake at 600 g plot-1were amended in respective
plots (MR-T1, MR + MC-T2) on May 29-30, by uniformly mixing with a hand spade to a 0-30
cm soil depth. One summer irrigation of 45-cm depth was applied on June 1 by flooding to
bring the soil to field capacity (10.4% w/w or 0.003 Mpa) in all the plots.
Cluster bean cv.HG-75 crop was raised on July 15 in 2001, respectively, while cumin cv.RZ-
19 was sown in following winter seasons on Nov. 24 in 2001, adopting standard agronomic
practices. The incidence of dry root rot and wilt (% mortality) on respective crops were
recorded after the initiation of disease on four central rows (clusterbean) and 1 m2 area
(cumin) till harvest from each replication. Per cent mortality due to dry root rot on clusterbean
was calculated for each row and mean of four rows was considered as one estimation for each
replication.
Biological assays
The soil samples were air-dried and ground to pass through a 2 mm sieve for quantitative
estimation of microbes. The sclerotial population of M phaseolina was estimated by
sprinkling 50 mg of each soil sample on Chloroneb-Mercury-Rose bengal Agar (CMRA), a
highly selective medium (Meyer et al. 1973). The population of Fusarium was estimated by
serial dilution technique on modified peptone-PCNB medium (Papavizas 1967).

115
Statistical analysis
Data on disease indices were subjected to analysis of variance (ANOVA) and the treatment
means were compared by LSD (P=0.05). Data on percent mortality were converted to angular
transformed values before analysis.
Results
Soil temperature and survival of pathogenic propagules
Maximum temperature of dry soil (DS) during first fortnight of May reached 46 oC , but
remained below 43 oC in June during the same period. This could reduce only 11.3-15.0%
and 13.1-15.1% propagules of Macrophomina phaseolina and Fusarium, respectively. One
summer irrigation applied on May 1, significantly improved this reduction in the viable
propagules of both the pathogens. However, prolonged exposure for a period of 60 days to dry
heating prior to one summer irrigation on June 1, augmented reduction in propagules of both
the pathogens (Table 1). Amendment of soil with mustard residue alone or in combination
with either mustard oil-cake, Eruca or cauliflower augmented the efficiency of summer
irrigation by eliminating a sizable proportion of M. phaseolina and Fusarium propagules at 0-
30 cm depths, when the irrigation was applied either in May or in June. In amended
treatments, for the first 7 to 8 days soil temperatures were 0.5-5.0 oC higher than those
recorded in corresponding non-amended pits of different months. Combining cauliflower
residue (C) or mustard oil-cake (MC) with mustard residues (MR) significantly improved the
reduction compared to amendment of soil with mustard residues alone. Further sub-lethal
heating for 60 days was reflected in greater reduction in pathogenic propagules in all the
amended treatments. Maximum reduction in Fusarium propagules was achieved when
mustard oil-cake was combined with mustard residue (MR+MC). However, combination of
cauliflower with mustard residue (MR+C) appeared better in reducing viable propagules of M
phaseolina, but was significantly equal to that achieved with MR+MC. In general, extending
summer exposure time from 30 days to 60 days significantly improved the reduction in M
phaseolina propagules compared to Fusarium.

116
Table 1 Effect of sub-lethal heating, cruciferous amendments and summer irrigation on per cent reduction in Macrophomina phaseolina and Fusarium oxysporum propagules in soil at 30 cm depth after 30 (May) and 60 (June) days of summer exposure Treatment Dose
(%)
Macrophomina phaseolina
Sclerotia g-1 soil
May June
Fusarium oxysporum
(CFU g-1 soil)
May June
Mustard residue (MR)+ SI
0.18 67.4 (55.4)* 76.3 (58.4) 77.5 (62.5) 81.2 (65.0)
MR+Mustard oil-cake (MC) + SI
0.18 + 0.04
78.3 (62.3) 87.0 (69.1) 85.2 (68.5) 86.5 (69.5)
MR+ Eurca (E) + SI
0.18 + 0.04
69.2 (56.5) 78.6 (63.5) 74.1 (59.9) 75.5 (60.6)
MR+Cauliflower (C) +SI
0.18 + 0.04
81.0 (64.2) 87.9 (70.1) 80.7 (64.2) 82.5 (65.5)
Dry root rot incidence on clusterbean
The crop growing season (July-Oct, 2000) favoured the development of dry root rot after 40
days of sowing. All the amended plots were significantly superior in reducing the plant
mortality due to dry root rot compared to non-amended dry and irrigated plots. Least mortality
was recorded in the treatments where small dose of mustard oil-cake was supplemented with
mustard residues. However, it was significantly equal to that recorded with mustard residues
alone.
Wilt incidence on cumin
Table 2 Effect of cruciferous residues and summer irrigation on incidence of dry root rot of clusterbean and wilt of cumin
Amendments Dry root rot incidence (%) Wilt incidence (%)
MR+SI 5.60 (13.59)* 6.0 (14.1)
MR+MC+SI 4.33 (11.94) 5.1 (13.0)
SI 9.56 (18.00) 11.9 (19.9)
Non-amended 14.03 (21.71) 16.0 (23.4)
LSD (P=0.05) 4.03 3.09
* Angular transformed values

117
In case of cumin wilt, all the amended treatments and merely one summer irrigation were
significantly superior in reducing incidence of wilt on cumin compared to non-amended
control. Least wilt incidence was recorded in the treatment MR+MC+SI, but again it was
significantly equal to MR+SI.
Discussion
Sub-lethal heating achieved by prolonged exposure to natural solar heat in dry sandy soil was
found to augment the efficiency of cruciferous residues and summer irrigation in reducing the
viability of M. phaseolina and Fusarium oxysporum f. sp. cumini propagules. More than one
mechanism might have operated concurrently or in a sequence in eliminating the viable
propagules of M phaseolina and Fusarium from residues amended soil. Sub-lethal heating in
dry soil for 60 days (April 1 – June 1), though caused a marginal reduction in viability of
sclerotia and chlamydospores but exerted a weakening effect on the survived propagules. The
effect was evident by significantly higher reduction in both the pathogenic propagules merely
by irrigation in June compared to that given in May, though the prevailing soil temperatures
were high in May. Accelerated decomposition of cruciferous residues in moist soil at high
temperature in present study subsequent to pronounce weakening of viable propagules
facilitated the action of sulphur containing toxic volatiles and also enhanced microbial
antagonism as reported by other workers (Lewis & Papavizas 1970, Lifshitz et al. 1983).
Significant improvement in the reduction of M. phaseolina after 60 days compared to 30 days
summer exposure indicate that resting structures of M. phaseolina is relatively more heat
tolerant than those of Fusarium. Improvement in reduction by supplementing mustard oil-
cake with mustard pod residue could be due to presence of higher concentration of bio-toxic
volatiles and nitrogen (5%) in mustard oil-cake. Dramatic increase in antagonists by
incorporation of mustard oil-cake in sandy soil has also been reported by Sharma et al.
(1995). Organic amendments containing nitrogen have been shown to effectively control soil-
borne pathogens (Rodriguez-Kabana et al. 1990). The suppressive activity of Eruca sativa
with mustard pod residues can be considered as intermediate possibly due to its low
glucosinolates content (Lazzeri & Manici 2000).
The results of field study on clusterbean and cumin crops corroborated well with those
obtained from experiment on sub-lethal heating of M phaseolina and Fusarium propagules,
where efficiency of supplementing MC with MR was found better than MR alone. Mustard

118
oil-cake has been found to reduce population of M phaseolina (Sharma et al. 1995, Lodha et
al. 1997) and wilt of cumin (Champawat & Pathak 1988). In the results reported here, almost
similar success was achieved with reduced dose of these amendments.
An effort made in the present study led to the development of an Eco-friendly, viable and cost
effective technology. In our region, farmers are generally adopting wheat-mustard-cumin
rotation in winter season. Mustard residues are thus available in March-April. The technology
developed in this study requires application of these residues in May end or early June after
prolonged exposure to resting structures of pathogens during intense solar irradiation and
high temperatures which is incidentally a crop free period. More so, sufficient time remain
available for release of toxic volatiles before succeeding clusterbean crop growing in rainy
season.
Methyl bromide is presently in use to fumigate soil for disinfesting from soil-borne
pathogens. Its use in developing countries was an estimated 15500-17500 tonnes in 1996, or
about 25 percent of global consumption. The fumigant is extremely toxic, acting as a broad –
spectrum biocide that kills most living organisms exposed to it, besides a potent ozone
depleting substance (ODS). In 1995, parties to the Montreal Protocol agreed that developing
countries would freeze consumption of methyl bromide in 2002. Alternatives have been
identified and their commercial use documented for the vast majority of methyl bromide uses
(Anon 1996). However, certain alternatives were not cost-effective for their extensive use in
resource deficient community of the developing countries.
The present concept of combining of cruciferous residues with summer irrigation in a low
externally input technology for those regions where sufficient temperatures are available in a
crop free period. Testing of this method of disease control may require location specific fine
tuning before large scale adoption.
R e f e r e n c e s
Angus, J.F.,Gardner, P.A.,Kirkegaard, J.A. & Deshmarchebier, J.M. (1994) Biofumigation :
Iso-thiocyanates released from brassica root inhibit growth of the take all fungus. Plant and Soil 162, 107-112
Anonymous (1996) The technical and economic feasibility of replacing methyl bromide in developing countries, case studies. Friends of the Earth, USA, 173pp.

119
Brown, P.D. & Morra, M.J. (1997) Control of soil borne plant pests using glucosinolate containing plants. Advances in Agronomy 61, 167-231
Champawat, R.S. & Pathak, V.N. (1988) Role of nitrogen, phosphorus and potassium fertilizers and organic amendments in cumin (Cuminum cyminum) wilt incited by Fusarium oxysporum f. sp. cumini. Indian J. agri. Sci. 58, 728-730
Gamliel, A. & Stapleton, J.J. (1993) Characterization of antifungal volatile compounds evolved from solarized soil amended with cabbage residue. Phytopathology 83, 899-905
Lazzeri, L. & Manici, L.M. (2000) The glucosinolate - Myrosinase system: A natural and Practical tool for bio-fumigation. Acta Horti. 532, 89-95
Lewis, J.A. & Papavizas, G.C. (1970) Evolution of volatile sulfur containing compounds from decomposition of crucifers in soil. Soil Biol. Biochem. 2, 239-246
Lewi s, J.A. & Papavizas, G.C. (1971) Effect of sulfur containing volatile compounds and vapors from cabbage decomposition on Aphanomyces euteiches. Phytopathology 61, 208-214
Lifshitz, R., Tabachnik, M., Katan, J. & Chet, I. (1983) The effects of Sub-lethal heating on sclerotia of Sclerotium rolfsii: Can. J. Microbiol. 29, 1607-1610
Lodha, S. (1995) Soil solarization, summer irrigation and amendments for the control of Fusarium oxysporum f. sp cumini and Macrophomina phaseolina in arid soils. Crop Prot. 14, 215-219
Lodha, S. & Solanki, K.R. (1992) Influence of solar heating on the control of Macrophomina phaseolina and weeds in arid environment. Indian J. agric. Sci. 62, 838-843
Lodha, S., Gupta, G.K. & Singh, S. (1986) Crop disease situation and some new records in Indian arid zone. Ann. Arid Zone 25, 311-320
Lodha, S., Sharma, S.K., & Aggarwal, R.K. (1997) Natural and solar heating of irrigated soil amended with cruciferous residue and improved control of Macrophomina phaseolina. Plant pathol. 46, 186-190
Mayer, W.A., Sinclair, J.B. & Khare, M.N. (1973) Biology of Macrophomina phaseolina in soil studied with selective media. Phytopathology 63, 613-620
Muehlchen, A.M. & Parke, J.L.(1990) Evaluation of crucifer green manure for controlling Aphanomyces root rot of peas. Plant Dis. 74, 651-654
Papavizas, G.C. (1967) Evaluation of various media and anti microbial agents for isolation of Fusarium from soil. Phytopathology 57, 848-852
Papavizas, G.C., & Klag, N.G. (1975) Isolation and quantitative determination of Macrophomina phaseolina from soil. Phytopathology 65, 182-187
Rodriguez-Kabana, R., Boube, D and Young, R.W. (1990). Chitnous materials from blue crab for control of root knot nematode II. Effect of soybean meal. Nematropica 20, 153-168
Sharma, S.K., Aggarwal, R.K. & Lodha, S. (1995) Population changes of Macrophomina phaseolina and Fusarium oxysporum f.sp. cumini in the oil cake and crop residue amended sandy soils. Appl. Soil Eco. 2, 281-284

120
Biometeorological system BAHUS for predicting the occurrence of plant diseases and ensur ing their efficient control DRAGUTIN T. MIHAILOVIĆ Faculty of Agriculture, University of Novi Sad, Dositeja Obradovića Sq. 8, 21000 Novi Sad, Yugoslavia CIMSI-Center for Meteorology and Environmental Modelling, Dositeja Obradovića Sq. 5, University of Novi Sad, 21000 Novi Sad, Yugoslavia JOSEF EITZINGER Department of Agrometeorology, Institute for Meteorology and Physics (IMP), University of Agricultural Sciences (BOKU), Tuerkenschanzstrasse 18, A - 1180 Vienna, Austria IVAN KO Č I CIMSI-Center for Meteorology and Environmental Modelling, Dositeja Obradovića Sq. 5, University of Novi Sad, 21000 Novi Sad, Yugoslavia BRANISLAVA LALIĆ, IL IJA ARSENIĆ & JELICA BALAŽ Faculty of Agriculture, University of Novi Sad, Dositeja Obradovića Sq. 8, 21000 Novi Sad, Yugoslavia
Abstract
Recently, there has been an increasing demand for providing a high level of production of
wholesome plant food but without losing its quality from the consumer′s point of view. In this
regard, it is required to provide reliable information about occurrence of plant diseases so as
to ensure their efficient control. The reliability of this information increases substantially if
both the meteorological and the biological quantities, measured or modeled, are properly
integrated in a prognostic system. By joint efforts of the CIMSI-Center for Meteorology and
Environmental Modelling and the Institute for Plant Protection and Environment, Faculty of
Agriculture, University of Novi Sad, the biometeorological system BAHUS for predicting the
occurrence of the most frequent plant diseases has been developed. This system has been
developed in the Microsoft Fox Pro 2.6(X) following standards of analysis of large number of
data. It consists of two modules. The first one provides input for prediction in the form of the
measured or modeled meteorological and biological data, while the second module, on the
basis of available input data, selects the corresponding method for predicting the occurrence
of disease. Depending on the method selected, the meteorological data can be assimilated
either from weather station, atmospheric model or software packages LAPS (Land-Air
Parameterization Schemes providing 10 minutes prognostic values) and KARLOS (providing
Landschaftsökologie und Umweltforschung 38 p. 120-129 Braunschweig 2002

121
their climatological values) integrated in the system as a whole. The BAHUS has been
designed as an open system giving a wide range of possibilities for increasing its level of
sophistication.
Introduction
There are few plant diseases which are very destructive or difficult to control. Among them
we can single out the ones caused by the following bacteria: Erwinia amylovora, Plasmopara
viticola and Venturia inaequalis, which can kill blossoms, vegetative shoots, limbs, and whole
trees. Good control is costly and difficult because epidemics occur sporadically and because
our options for control lie mostly in cultural practices and the limited use of antibiotics. In
many cases anepidemics develop in several phases, each requiring different control measures
and not all phases occur every year. Since current diseases control programs rely on protective
measures, which must be taken before infections occure, it is necessary to receive complete
biometeorological information so it can be efficiently applied. This means that it is difficult to
develop a consistent and cost-effective diseases control programme without having a reliable
method for predicting the occurrence of infections.
A vast number of theoretical works and orchard data gathered, related to methods for
predicting the occurrence of the most frequent plant diseases, have been offered to the
scientific community starting with Mills (1955). Namely, he developed the method for
predicting the fire blight development on apple, closely relating its occurrence with
temperature and precipitation which was later significantly corrected by Powel (1965). In the
past two decades the knowledge about predicting the occurrence of the most frequent plant
diseases has become much better because of the development of models. These models
describe the interaction between the population of susceptible host plants and the population
of a pathogen strongly depending on meteorological conditions (Lightner & Steiner 1990,
Steighner & Lightner 1992, Thomson et al. 1982, Zoller & Sisevich 1979).
Since 1997 the principle structure of the biometerorological system BAHUS for predicting the
occurrence of the most frequent plant diseases has been developed by joint efforts of the
CIMSI-Center for Meteorology and Environmental Modelling and the Faculty of Agriculture,
University of Novi Sad. The essential characteristic of this predicting system is a unique
integration of meteorological information assimilated either as a measured variable or the one

122
simulated by the corresponding atmospheric model.
The biological and meteorological background
History of pathogens considered in the prognostic system
Symptoms of fire blight were first described over 200 years ago. It now occurs in at least 27
countries worldwide on four continents. The long distance spread of the bacterial pathogen,
Erwinia amylovora, into new areas occurs primarily via the movement of contaminated
planting stock, major storms and prevailing winds (Beer 1991). In many regions fire blight
appears suddenly and sporadicaly and there have been made large efforts in creating efficient
prognostic systems. Recently, it has been broadly accepted that efective blossom blight
protection is of prime importance for an effective management program.
Apple scab, caused by the bacterial pathogen Plasmopara viticola, is the most frequent as
well as the most harmful apple disease whose symptoms were described originally in Sweden
in 1819. The first management programs concerning this disease were designed at the
beginning of the 20th century. Mostly, they emphasized the protection in the period when
orchards are in bloom since it is the most sensitive phenological phase in apple growing
season. In these programmes, the commonly used method for primary infection prediction of
apple scab is the method based on air temperature and duration of leaf wetness (Kišpatić,
1972).
In 1878 downy mildew, caused by the bacterial pathogen Venturia inaequalis, was imported
from North America to France causing enormous losses. Now, it is present throughout
Europe. Because it is an outside imported disease, European grape sorts are extra susceptible
to downy mildew. For efficient control of this disease the crucial point is a precise prediction
of the beginning of infection as well as developing and duration of incubation period.
Principles of BAHUS system
In desining the BAHUS system we have been governed by principles which can be
summarized as follows: (i) condensed compilation of the available biological and
meteorological knowledge related to methods for predicting the occurrence of the most

123
frequent fruit and vine diseases; (ii) providing the biological information (observed or
measured in orchard) and meteorological variables (climatological, atmospheric or land
surface model outputs and instantaneously measured data), which cover the data required
domain needed for the corresponding method (iii) displaying the messages as highlight
outputs from one or more methods. Let us note that we rather use the term message instead of
forecast, since we do not operate with the time dependent equation describing development of
pathogens. However, as some meteorological variables come from integration of time
dependent partial diferential equations, we generally use the word forecast.
Methods used for disease prediction in BAHUS system
In science and practice of the plant protection community, a great number of methods
concerning the prediction of occurence of the foregoing diseases have circulated in the past
three decades. The methods that give satisfied results are based on remarkable author’s
empirical knowledge from the biological point of view which are for fire blight
comprehensively summarized in Panić & Arsenijević (1996). Using their sistematization as
well as methods for apple scabe and downy mildew described in Group of Authors (1983), we
have established the set of tables (Table 1-3), making the base for predicting the occurrence of
these diseases by the BAHUS system.
Input data for BAHUS system
Depending on the method selected, the following meteorological data are necessary for
predicting the occurrence of disease: maximum air temperature, Tmax, minimum air
temperature, Tmin, mean daily temperature, Td, and actual values of temperature, T, relative
humidity, R, precipitation, H and duration of leaf wetness, hl. The list of these meteorological
quantities and conditions as well as input biological conditions, needed for operating the
method in the BAHUS system, is given in Table 2.
There are two levels of data assimilation for supplying the system. The first one is provided
by the data measured at the weather station either from standard network or obtained from the
monitoring system located in orchard. However, since the meteorological data cannot be
always provided for predicting the occurrence of diseases at the huge orchard area, data
assimilation in the BAHUS system is provided by the second level so called prognostic level.

124
Table 1 Methods used for disease prediction in BAHUS system
Method Authors Source Pathogen
1. Degree-day Mills Mills (1955) Erwinia amylovora
2. Corrected Degree-day Powell Powel (1965) Erwinia amylovora
3. Degree-hour Zoller et Sisevich Zoller & Sisevich (1979) Erwinia amylovora
4. Billing’s original system Billing Billing (1980) Erwinia amylovora
5. Based on potential doubling and precipitation and humidity measuring Brulez et Zeller Brulez & Zeller (1981) Erwinia amylovora
6. Mean temperature prediction line Thomson et al. Thomson et al. (1982) Erwinia amylovora
7. Billing’s revised system Billing cit. Pani � & Arsenijevi � (1996)
Erwinia amylovora
8. Miller’s incubation method Miller cit. Group of Authors (1983) Plasmopara viticola
9. Shatschy’s incubation method Shatschy cit. Group of Authors (1983) Plasmopara viticola
10. Mersanin-Lipitskaya incubation method
Mersanin et Lipitskaya cit. Group of Authors (1983) Plasmopara viticola
11. Mills-Laplace’s method Mills et Laplace cit. Group of Authors (1983) Venturia inaequalis
For that purpose a land surface model LAPS (Land-Air Parameterisation Schemes) has been
integrated in BAHUS (Mihailović & Kallos 1997). This scheme comprehensively describes
the soil-plant-atmosphere interaction, handling the seven prognostic variables including the
leaf temperature and water amount retained at the leaf. This part of the system is presently in
the process of implementation in the non-hydrostatic atmospheric model SAM (Serbian
Atmospheric Model) (Janjić 1998) providing additional meteorological information. Such
structure of the BAHUS makes it is possible to predict the occurrence of a disease even in the
case of diagnostic methods like Mills-Laplace’s method (Group of Authors 1983). The
averages of recorded meteorological data, required by the corresponding method, are
calculated by the software package KARLOS (Koči et al. 1999) that is also integrated in the
system. This highly sophisticated tool gives a great number of useful agrometeorological
information which is the basis for giving the forecast.
Organizinig rules and output messages in BAHUS system
In order to make the output message, for making the decision support and employing the
appropriate technique, to be more instructive and concise (Travis & Latin 1991), as it is
offered by the method selected, the BAHUS system outputs are organised as it is shown in
Table 3.

125
Table 2 BAHUS system input meteorological and biological quantities and conditions. An asterisk indicates the parameter needed for the corresponding method
Monitoring Method Meteorological/climatological Biological
Quantities Conditions Conditions Tmax Tmin Td T R H hl
1. * Rainy Blooming 2. * * * Rainy or high level of humidity Early blooming 3. * * 4. * * 5. * Rainy and wet * Blooming
6. * Blooming 7. * * Rainy, dewy or fogy Blooming 8. * * * Rainy 9. * *
10. * * 11. * * Leaf wetness
Table 3 Organizinig rules and output messages for methods used in BAHUS system
Method Calculated quantity IF WHILE THEN 1. CDD 34≤CDD≤ 45 Precipitations during blooming Fire blight infection
2. CDD CDD = 18 and 21oC≤Tmax≤ 27oC
Period between the last frost and early blooming
Fire blight infection
3. CDH CDH≥83 Apply bactericide before the next rain
Td<18.9oC During three days Reset counting 4. PD 7≤PD≤8 and H≥2.5mm Infection risk PD≥9
5. PD R≥75% and H≥2.5mm Beginning of IP
6R
t36PD −≥
��
The end of IP
6. Td>(16.738-0.038DAY) Blooming and DAY in the
March 1-May 1 period Apply bactericide
7. IR 2≤IR≤3 Blooming Infection risk 8. c H≥10 mm and Td≥12oC Beginning of IP c≤2 The end of IP and applying of
bactericide 9. PIP PIP=100% The end of IP
10. SET SET ≥ 61 oC The end of IP 11. hl≥hl(Thl) Beginning of IP
The symbols introduced in this table have the meaning as follows: IP is the incubation period,
CDD is the cumulated degree-days, CDH is the cumulated degree-hours, PD is the potential
doubling, t is the number of days after the beginning of the incubation period, IR is the
infection risk, c is the number of days before the end of the incubation period, PIP is the part
of the incubation period, SET is the sum of effective temperatures, hl (Thl) is the calculated
duration of leaf wetness and Thl is the mean air temperature during the period of leaf wetness.
Also, a logical structure, presented in the table, is providing the message through organising

126
rules consisting of a condition or premise followed by a warning or conclusion (IF and
WHILE condition, THEN message).
Data management concepts in BAHUS System architecture
The BAHUS system is designed in FoxPro™ 2.6. This tool, useful for fully developing and
building an application, is a database management system (DBMS) which makes possible
organizing information in multiple tables and retrieving the data simultaneously from any of
the tables (Long, 1994). The BAHUS is a computer program that runs on IBM-PC and
compatible microcomputer systems and operates on multiple platforms, such as Windows and
MS-DOS. Microcomputer must have the following system components and capabilities to run
BAHUS: an 80386SX processor or higher, a mouse, 640K bytes of conventional RAM
memory, 8M of RAM if virtual memory is set to none, or 4M of RAM if virtual memory is
set to temporary or permanent, MS-DOS 6 or higher, Microsoft Windows 3.x or higher and
about 20M of hard disk space.
The schematic diagram of BAHUS system architecture is given in Fig. 1. It is composed of
several basic components grouped as user’s interface, relating tables (I/O data and meta data)
and data sources.
User ’s inter face
User’s interface relies on windows, menus, dialogs, mouse operations, buttons, check boxes,
radio buttons, and other functions to facilitate use of the BAHUS. The interface is non-
procedural and event-driven so it waits for user to tell it what to do next. It is designed for use
with a mouse or a standard keyboard. It is possible to use the arrow keys and keystroke
combinations on a keyboard for choosing objects and controls in the interface. Although
BAHUS does not require a mouse, we recommended it for its ease-of-use. With the click of a
button, a mouse can accomplish the equivalent of a single keystroke of many keystrokes on
the keyboard.

127
Fig. 1 Schematic diagram of BAHUS system architecture.
Relating tables
Following the theory of DBMS, tables are files simply because each table is stored in a
separate file, usually with .DBF extension. Databases are comprised of one or more such files.
Columns in FoxPro terminology are fields because they correspond to data entry fields in a
screen form. FoxPro refers to the rows of the table as records (Long 1994).
Relating model is in the centre of BAHUS system data flow. Relation, which is based on a
common reference point, such as field or record number, is a link between two open tables. In
a relation, one table is the parent table and the other is the child table. The parent table
controls the child so that when the record pointer is moved (select a record) in the parent
table, model automatically moves the record pointer to the first corresponding record in the
child table. The input data table is a table containing data described in subsection 2.4 while
the output data table is a temporary table including results obtained by the method chosen. For
example, each record in the input data table as well as in the table of validity contains a date
field. So, when a relation on the date field in the input data table is set, each valid record can
be selected in table of validity and then values, which are result of validation process over
values contained in the input data table, are seen. The BAHUS system is equiped with meta
tables including physical, meteorological and biological constants, numerical constants related
to a specific method, corresponding pattern and context sensitive help that provides all
necessary explanations.

128
Data sources
The fundamental philosophy of the BAHUS system data use is the assimilation of all
available data sets required by the method selected. Since the data come from sources using
different techiques for data gathering (meteorological and biological measurements and
observations organized manually or automatically and atmospheric or biological model
ouputs) we have employed already existing as well as originally developed procedures for
their further treatment.
It could be said that the best achievement of this system is the way of using data and methods
in predicting the occurrence of diseases. Their selection is directly conducted by an optimal
choice of data set and method which can be provided by the system.
References
Beer, S. V. (1991) Fire blight. Compendium of Apple and Pear Diseases. In: Jones, A.L. &
Aldwinckle, H.S. (eds), APS Press, St. Paul, 61-63 Billing, E. (1980) Fire blight in Kent, England in relation to weather (1955-1976). Ann. Appl.
Biol. 95, 341-364 Brulez, W. & Zeller, W. (1981) Seasonal shangesof epiphytic Erwinia amylovora on
ornamentals in realtion to weather conditions and the course of infection. Acta Horticulturae 117, 37-43
Group of Authors (1983) Handbook of Monitoring Extension in Plant Protection. In: Čamprag, D. (ed), Association of Yugoslav Societies for Plant Protection, 682 (in Serbian)
Janji ć , Z.I. (1998) Overview of the Project: New Mesoscale Numerical Model. Project F-18, "Physical-Mathematical Model for Meso Scale Processes", Serbian Academy of Sciences and Arts, December 7, Belgrade
Kišpati ć , J. (1972) Deseases of fruit and vine. University of Zagreb, Faculty of Agriculture, Zagreb, 164 (in Serbo-Croatian)
Koč i I., Mihailovi ć D.T. & Lali ć B. (1999) Software package “KARLOS” for calculating the meteorological elements and its application in agriculture. Papers of Research Institute for Field and Vegetable Crops 32, Novi Sad, 207-212
Lightner, G.W. & Steiner, P.W. (1990) Computerization of bloosom blight prediction model. Acta Horticulturae 273, 159-162
Long, J. (1994) FoxPro™ 2.6 For Windows™ Developer’s Guide Second Edition. Sams Publishing, 1380.
Mihailovi ć , D.T. & Kallos, G. (1997) A sensitivity study of coupled-vegetation boundary-layer scheme for use in the atmosferic modelling. Boundary Layer Meteorol. 82, 283-315
Mills, W.D. (1955) Fire blight development on apple in western New York. Plant Disease Reporter 39, 206-207

129
Panić, M. & Arsenijević, M. (1996) Bacterial blight of fruit and ornamental plants. Association for fruit and vegetable D.D. Belgrade & Faculty of Agriculture, Novi Sad, 403
Powel, D. (1965) Factor influencing the severity of fire blight infections on apple and pear. Michigan State Horticultural Society Annual Meeting 94, 1-7
Steighner, P.W. & Lightner, G.W. (1992) MARYBLYT: A Predictive Program for Forecasting Fire Blight Disease in Apples and Pears. University of Maryland
Thomson, S.W., Schroth, M.N., Moller, W.J. & Reil, W.O. (1982) A forecasting model for fire blight of pear. Plant Disease 66, 576-579
Travis, J.W. & Latin, R.X. (1991) Development, implementation, and adoption of expert systems in plant pathology. Annual Review of Phytopatology 29, 343-360
Zoller, B.G. & Sisevich, J. (1979) Blossom populations of Erwinia amilovora in pear orchards vs. accumulated degree hours over 18.3 Celsius, 1972-1976. Phytopatology 69, 1050

130
Challenges and options of pesticide use: In the context of Nepal B.R. PALIKHE Plant Protection Directorate, Department of Agriculture, Harihar Bhawan, G.P.O Box 1818, Lalitpur, Kathmandu, Nepal
Abstract
Pressure of growing population and lesser options have put enormous burden to meet food
needs. Food security is a major concern and challenge in Nepal, where the diverse agro-
climatic conditions necessitate different approaches to cultivation and crop protection. It is
estimated that Nepal losses around 35% of its crop due to pests and storage. The widespread
use and disposal of pesticides by farmers and the general public provide many possible
sources of pesticides in the environment. The indiscriminate use of chemical pesticides has
resulted in several problems such as pest resistance to pesticides, resurgence of pests, toxic
residues in food, water, air and soil, elimination of natural enemies and disruption of
ecosystem. In the Nepalese context, one of the issues is misuse and abuse of pesticides in the
commercial farmers. Most farmers' do not understand the nature of pesticides as insecticides
and fungicides as medicines rather than poisons. Due to ignorance, many accidental
poisonings occur annually. The implementation of awareness program on pesticide safe use
practices poses challenges and constraints. However, there is a need to uplift the awareness
level of the farmers. There is a trans-boundary issue, illegal import of pesticides and banned
pesticides over Nepal's boarder are found into local markets. Nepal has a pesticide disposal
problem. The best option for the sector is to adopt an optimal crop protection strategy. There
are great chances to find several plant species, which grow naturally in abundance and may
provide quite effective safe and economical bio-pesticides.
Introduction
Nepal's agriculture sector is the largest contributor engaging 90% of its total population. The
share of agriculture in the national GDP is 42%. Pesticides in agricultural sector were
introduced in Nepal in the early sixties. Since then their use in the sector has increased rapidly
Landschaftsökologie und Umweltforschung 38 p. 130-141 Braunschweig 2002

131
in the pretext of improving crop yields. Unfortunately throughout the world, overuse and
misuse of chemical pesticides in agriculture cause environmental and health damage and
Nepal is no exception. Infants and children may be more vulnerable to pesticide exposure.
The country is still struggling to be self- sufficient in food supply for her people. The state is
worsened by the fact that 35% of the produce goes to waste in pre and post harvest operations
due to insect pest attacks in the field and storage. If only these loses could be reduced, there
would be a considerable increase in availability of food, which could contribute significantly
to food security.
In the field of environmental protection, the risk of pollution caused by pesticides is a critical
problem in many countries. It is especially a major challenge to developing countries and
countries with economics in transition.
Pesticide management and registration system
To promote environmentally sound management of chemicals, Nepal has got a pesticide
registration scheme. The Pesticide Act, 1991 and the Pesticide Rule, 1993 cover measures to
regulate import, manufacture, sale, storage, transport, distribution and use of pesticides. It is
mandatory that any pesticide before distribution and importation should be first registered in
accordance with the registration procedure adopted by the Pesticide Board. Pesticides other
than notified ones are not to be imported, exported, produced, used or distributed. The
regulations also prohibit the sale of any pesticide, which is imported for scientific or research
purposes. HMG/N (His Majesty’s Government of Nepal) shall, on the recommendation of the
Board, publish the names of the registered pesticides in the Nepal Gazette. The licensing
control of hazardous chemicals prevents unauthorized persons from handling such chemicals.
Reseller License and Importer License issued are valid for two years and 5 years respectively.
The Board may cancel a license if the terms and conditions of that license are not followed.
The powers of Pesticide Inspectors are set out in the Pesticide Act/Regulations, which gives
power to the Board to prepare and enforce any guidelines on the matters relating to pesticides
for the effective implementation of the Act. Any control system, no matter how well crafted,
will not be effective without rigorous enforcement.

132
Prioritised challenges
There are many challenges associated with the use of pesticides, including those categorised
as Persistent Organic Pollutants (POPs). Collectively with the non-POPs pesticides, many of
which also share similar problems. However, depending upon the socio-economic situation,
the levels of industrialization and literacy and geographical features the challenges would
vary from one country to another.
Aggressive marketing strategies
Dealers take up intensive and aggressive marketing strategies to sell their products with the
perception that there are no other alternatives for farmers except the use of chemical
pesticides.
Misuse of pesticides
Regular misuse of pesticides, especially the broad spectrum used most in Nepal, cause pests
to adopt and become resistant to the pesticides. Most pesticides are then required at higher
doses to achieve the same level of control, though often these are not as effective. The high
dosage is very critical with pesticides. Many cases have been recorded in tomato cultivation.
Underdosing to save money will result in no control as a threshold dosage must be reached for
any mortality to occur.
It is a known fact that farmers do not follow the preharvest waiting period. They apply
pesticides near harvest time, some even dipping vegetables in pesticides before selling. Others
treat food grain with pesticides against storage pests. Many misuses have been reported by
Giri (1992), Baker and Gyawali (1994), Dahal (1995) generally from farmers who do not
realize the extent to which pesticides are poisonous and hazardous to humans and the nature.
The concept of chronic poisoning and health risks is not fully understood by farmers,
distributors and importers.
Studies have shown that over 60% farmers using pesticides for over five years wait less than
two weeks after spraying pesticides before harvesting the crop. The negative health effects of
pesticides, therefore is a serious problem requiring efforts to reduce pesticide misuse in Nepal.

133
The environmental costs of pesticide misuse are potentially huge. Endosulphan is a broad
spectrum and has been restricted in many countries to non-aquatic habitats as it is highly toxic
to fish. Farmers place pesticides into rivers and streams in order to catch fish.
Pattern of use
Farmers do not always know the active ingredient. Sometimes out dated pesticides are sold to
farmers. Farmers use a mixture of chemicals together therefore when incidents occur it is
difficult to specify the responsible chemical. Protective clothes are not available or not
suitable for hot climate.
Use of highly toxic pesticides
Many pesticides used by farmers were highly toxic posing health threats to users, livestocks,
as well as the environment.
Pesticide residues on food
There are numerous reports of excessive pesticide residues in food in Nepal. Annual Bulletins
from the Central Food Research Laboratory (CFRL) routinely detected residues from their
sampling program. From 1981 to 1986, the residues of organochlorine and organophosphate
insecticides were a more serious problem in cereal grains, legumes and vegetables but have
declined in recent times. Residues surpassing legal limits set by HMG/N by the Food
Standardization Committee were reported existing in the Annual Bulletins from 1992/1993
through 1995/96 such as tea (Malathion, DDT, BHC), grapes (methyl parathion), rice (BHC),
chickpea (DDT) and organophosphates on vegetables (greens, potato, cabbage, chickpea and
pumpkin).
Pesticides as medicines
Due to public perception, a large number of farmers still recognise pesticides as medicine, a
notion implanted in the mind of the farmers.

134
Resistance
There are two problems in vector control i.e. insecticide resistance and exophilic and or
exophagic vector behavior. Resistance to DDT was first reported in the 1960s. This resistance
spread rapidly demanding the use of alternate insecticides. The re-emergence of vector borne
diseases is likely to substantially increase the use of redial insecticide. The continued
dependence on insecticides may result in high levels of pollution of the bio-diversity with
adverse impact on health of the people. The challenge lies in initiating timely preventive
action in the introduction of alternative methods of disease vector control and selective and
absolutely essential use insecticides. Malathion spraying has also become problematical
because of high refusals due to pungent order, high cost and vector resistance. Resistance is a
big problem in both agriculture and public health.
Resurgence
Resurgence occurs because natural enemies of insect pests are more likely to receive toxic
levels, as they are more mobile and can pick up residues on the plant surface.
Pollution
Persistent pesticides create problems to environment. They pollute air, soil and water and they
are harmful to ecology of living organisms. In Nepal problems include pollution generated
during improper handling, storage, transport and accidents and environmental contamination
due to unsound disposal methods. Water pollution is the most serious environmental quality
issue in Nepal. Studies have shown that 52% of the respondents had no knowledge of the
environmental effects of chemical.
Alternatives
• Unaware of PIC & POPs pesticides;
• Not readily available;
• A comprehensive study is required on the existing alternatives;
• Alternatives to banned/restricted pesticides are very expensive - the ratio may be as
big as 1:4 DDT is observed to be the cheapest insecticide. The other substitute namely
malathion is four times more expensive & certain mosquitoes (A. culcifacies) have

135
developed resistance against malathion. But the malathion is much more safer
pesticide as comparing to DDT. There are problems associated with PIC and POPs
pesticides as well as alternative pesticides.
Illegal transboundary movement
The use of banned or restricted pesticide cannot be prevented effectively because of illegal
trans-boundary movement of pesticides. There is little or no information on such illegal
movements regarding the name, quantities of chemicals sold.
False advertisement
It should be unlawful to advertise false, misleading and deceptive information and not to
claim that any pesticide is safe, non-poisonous, non-injurious, or harmless.
Public awareness
Many farmers/workers are unaware of some of the properties of pesticides, in what conditions
they present danger and how to protect oneself from poisoning, The general belief seems to be
that if one doesnot die immediately then pesticides present no harm. There is widespread
ignorance of the existence of chronic pesticide poisoning. Concept of pesticide
resistance/resurgence are not understood by farmers. Importers/Resellers/Farmer refer to
pesticides as medicines rather than poisons.
Adulterated or substandard products
Adulterated or substandard products cannot be used. These unusable pesticides are all
classified as potential waste by FAO. Lower concentrations will result in lower efficacy and
thus waste of resources. Higher concentrations increase hazard and phytotoxicity. The most
common practice is sale of diluted pesticides at concentrations below the stated amount. The
result is non-control of target pests leading to resistance. Adulteration is more difficult to
detect without chemical analysis but there are reports of more expensive chemicals being
substituted by cheaper products.

136
Disposal of obsolete pesticides
Nepal's most prominent problem is its stockpiles of obsolete pesticides. The problem of
obsolete pesticide stocks is caused by purchasing more pesticides than are needed. If these
stocks are not used within 2 years they gradually become unusable due to deterioration in
storage. Any pesticide stockpiles are potentially hazardous. There is also a risk of severe
environmental impacts in the event of a flood, fire, earthquake & other natural disaster. It is
estimated that 74 tons of obsolete pesticides are stored in Nepal at the moment. This amount
of pesticide waste generated in Nepal over the last 3-4 decades is not enough for the cost
savings.
Risk-benefit analysis
There is a need for a thorough risk benefit analysis prior to registration of pesticides at
national level. Registration Office is now looking into this. Such studies would have to take
into consideration in both agriculture and health field. Lack of capacity is the serious problem
in this regard.
Local data
Local data are not available simply because not much research works have been done on toxic
chemical pesticides.
Experts
Nepal does not have competence and sufficient experts in the field of pesticides
toxicology/research.
IPM products
Very few IPM products such as pheromone traps and other bio-environmental safe
alternatives are available in the country at higher rates as these products are not classified as
agricultural products.

137
Post registration
Without a strong post registration surveillance, the legislation process would be rendered
inconsequential. The registrar's office is slowly looking into all this due to manpower
problem.
Product stewardship principles
The government needs to pledge "from cradle – to – grave product stewardship". Chemical
manufacturers and importers should be made responsible for cradle to grave cycle of their
products especially toxic chemical pesticides.
Cooperation
General lack of adequate co-operation among stakeholders in chemical management including
PIC procedure.
Infrastructural challenges
Lack of laboratory facilities to
• Pesticide quality residue analysis
• Toxicological analysis
Inadequate institutional development to handle all matters of pesticides like toxicological
aspects. Laboratory facilities are required to accomplish such tasks.
Challenges to implement the PIC
The implementation of PIC poses challenges and constraints in Nepal.
• Decision Guidance Document (DGDs) which is very technical.
• Local Data not available because not much research has been done on PIC chemicals
• Lack of adequate knowledge on Risk Assessment.
• Low awareness among stakeholders on chemical management issues and PIC
procedure.
In the Asian region agriculture is an important part of the economy. Where nations are not
separated by natural boundaries, there has traditionally been a free trade of various

138
commodities including pesticides and other agro-chemicals. It may be possible that there are
cases where chemicals covered under PIC which have been banned or severely restricted are
being exported to the country without complying with PIC procedures.
International agreements
International agreements related to the management of hazardous chemicals include
• The Stockholm Convention, 2001
• Rotterdam Convention on PIC, 1998
• FAO Code of Conduct on Distribution and Use of Pesticides, 1985
• London Guidelines for the Exchange of Information on Chemicals in International
Trade, 1987.
Implementation of these international agreements is hampered by factors such as expertise &
inadequate infrastructure.
Options
The possible options on alternatives to eliminate or reduce their use or dependence are
suggested as follows.
The IPM option (IPM already on the ground)
United Nations Conference on Environment and Development (UNCED) Agenda 21
emphasises IPM as the best tool for 21st century Plant Protection Services. It states that IPM
should be the guiding principle for pest control and that it is the best option for the future as it
guarantees yield, reduces costs, is environmental friendly and contributes to the sustainability
of agriculture.
Because of the serious and adverse effects of pesticides, various efforts have been made to
develop alternative approach aiming at eliminating or reducing their use or dependence. In
practice, several models exists and have been advocated:
• Integrated Pest Management
• Integrated Crop Management (ICM) Which emphasise "Judicious" as opposed to
"Indiscriminate" use of pesticides

139
• Low external Input Sustainable Agriculture (LEISA)
• Organic Agriculture (OA)
• Use of environmental friendly safer pesticides with low toxicity
Realizing its potentiality, HMG/Nepal has already given priority to create public mass
awareness and implemented effective IPM program through IPM Farmer Field School (FFS)
for proper, sound and judicious management of pesticides. Today, IPM is considered as
"National Pest Control Strategies" in Nepal. Presently, IPM provides the best option for rice
and vegetables (Tomato, cauliflower, potato) and is more widely adopted. IPM has been
widely accepted as the alternative to pesticide application, although IPM doesnot exclude the
use of pesticides. It advocates the judicious and prudent use of such chemicals. A novel
approach to meet this challenge, FFS had emerged in southeast Asia.
The IVM option
Vector control interventions that can be incorporated in an integrated approach include :
Environmental Management
• Environmental Modification (Irrigation schemes, Drainage Management & Road
Construction of housing development)
• Environmental Manipulation (recurrent activities to reduce environmental receptivity
often linked to operation and maintenance work)
• Zooprophylaxis (the use of cattle to divert zoophilic vector species away from biting
humans)
• Personal Protection (Mosquito nets, use of repellents)
Biological Control
• Use of predators/parasites (the use of larvivorous fish is the most common approach
and can be linked to fish culture for income generation.
• Use of bacterial toxins (Bacillus thuringiensis)
• The aim of the application of biological and environmental management methods is to
eliminate mosquito breeding. IVM strategies that use no insecticide at all can be
cheaper than spraying houses with DDT.

140
Chemical Control
Latest development is use of bed nets treated with synthetic pyrethroid, which is non-toxic
and biodegradable and does not accumulate in nature as DDT.
Citizen Awareness
An increasing number of farmers producing organic vegetables is an indication of the
expanding scope for IPM and citizen support.
Botanical Insecticides
Nepal is very rich in flora and there is a great scope for the development and use of botanical
pesticides. In recent years, neem (Azadirachta indica) is getting popularity as a source of
botanical pesticides which is highly eco-friendly. A number of world companies are engaged
in processing neem seeds for extracting azadirachtin, a lamanoid, which is valued as an
antifeedent chemical against a variety of insect pests.
There is also a variety of natural botanical pesticides available to farmers. In the past,
Nepalese farmers used these traditional methods of pest control and are still using them in
hilly areas. Botanical pesticides are easy to grow and use and their costs are often minimal or
free. Most botanical plants have low toxicity as compared to chemicals and their residues do
not pollute the environment. The most common pesticidal value of Nepal's indigenous plants
include Allium sativum (insect repellent), a leaf extract of Artemisia vulgaris (for caterpillars
& stored grain pests), Urtica dioica (stems and leaves for red ants and cutworms),
Zanthoxylum armatum's fruit (insect repellent for : stored grain pests), Acorus calamus (insect
repellent & contact poison) & Chenopodium botrys (insect repellent).
Prior Informed Consent
The PIC procedure provides important support to countries that do not have adequate
legislation to regulate and control import of chemicals. The procedure is also very useful in
that it provides for information exchange on specified chemicals which will assist the
government in making decisions. Chemicals should not be exported without the explicit
consent of the importing country.

141
Basel Convention
Products, the use of which is no longer permitted (banned, deregistered), are candidates for
disposal. Banned or deregistered products may be still usable in other countries where use is
still permitted. But due to the Basel Convention guidelines, the exporting country has to
receive permission from the importing country.
HMG/N has already ratified the Basel Convention on the control of the transboundary
movements of hazardous wastes and their control.
Conclusion and Recommendations
Farmers need to know what is the information printed on a pesticide label. Instructions written
on the label or an accompanying leaflet need to be followed to obtain the recommended
dosage. Farmers need to be reminded that pesticides are not the only control measures for pest
problems. The strengths of both Government and NGOs entities should be utilized in this
large endeavor. The government should foster IPM and remove taxes from IPM products.
This recommendation is in line with recent changes in government policy where IPM methods
are to be preferred over pesticide usage. There is a need for co-ordination and cooperation
among and between countries within the same region. UNEP and FAO could play the role as
a facilitator.

142
Evaluation of the hydrological behaviour in a small catchment by using the model WaSim. A case study within the IPMS-Project in Nepal BETTINA PIEPHO Institute of Geoecology, Department of Hydrology and Landscape Ecology, Braunschweig Technical University, Langer Kamp 19 c, 38106 Braunschweig, Germany
Abstract
This study presents a modular modelling system for simulating the hydrological behaviour of
a small catchment in the middle mountains of Nepal, right in the investigation area of a close
sub-unit of Jhikhu Khola catchment, 50 km east of Kathmandu. The model used is WaSim
(Water balance Simulation Model) which is a physically-based distributed hydrological
catchment simulation model with the ability to interface with GIS / ArcView. Within this
different complex modelling system it is possible to combine the different model
configurations in order to achieve an effective modelling structure with the best adaptation to
the treated problem and the actual data base. Aspects about surface runoff and water flow as
well as evaporation and soil water balance are described and finally be transformed into
thematic maps. This GIS maps will be used as a visual tool which facilitate the interpretation
of the regional physical conditions and gives a quantitative representation of short or long
term processes in the hydrological cycle.Data preparation and/or data pre-processing is an
imperative. Therefore some problems of data capture and parameter estimation are briefly
touched, which incorporates on the one hand the development of digital elevation model
(DEM) or the geo-referenced aerial photographs up to the derived land use map, and on the
other hand the importance of parameter determination with respect to soil properties and plant
physiology (LAI).
First results and validation calculations are also presented here. The range of precision and the
extent of different data bases for calculating the water balance of agricultural site depends on
actual boundary conditions in the project scale concepts. If data availability and data
requirements are all clarified, this type of hydrological catchment simulation model seems to
be a effective and practical tool in planning and decision making.
Landschaftsökologie und Umweltforschung 38 p. 142-155 Braunschweig 2002

143
Introduction
An attempt was made to apply a hydrological catchment simulation model to a small
watershed in Nepal. The chosen investigation area is a sub-unit within the Jhikhu Khola
catchment, 50 km east of Kathmandu. The catchment covers an area of ca 12.5 ha, the
elevation ranges from 750-2.100 m a.s.l.. The whole task is embedded in the integrated
pesticide management Project IPM (HERRMANN & SCHUMANN 1999), where the main goal is
to strive for a tenable make up environmental risk assessment relating to pesticides and
integrated pesticide management in developing countries.
This paper addresses one approach of the hydrologic component of the IPM project. The
study demonstrates a strategy to examine the hydrological behaviour of a representative
catchment with all relevant water fluxes within the studied system. Based on project
information main interest was to apply a physical-based distributed model built up by variable
modular structure. It provides an applicable conceptual framework with respect to the
physically based description and measurable dimensions. The model should have the ability
to interface with an Geographic Information System (GIS). The use of GIS facilitates visual
interpretation of prediction and subsequent recommendation. Recent progress and difficulties
concerning the input data uncertainties and their solving approaches will be discussed.
Scope and hypothesis setting
During the pre-project phase all kinds of considerations and investigations were made, and
following GTZ’s goal-oriented project planning matrix (ZOPP) a strategy was drawn up
which suited to the hydrologic interests, and denotes the course of examination. The synopsis
of the internal project design is illustrated in Table 1.
In section “Strategy” in Table 1, the method of working is sketched step by step. Reflections
are made in the following issue, how each activity steps take place.
The hypotheses is drawing up, that a well suited model will be required to be a practical tool
to simulate the behaviour of the target catchment. The assumption is made that on the basis of
a hydrological catchment simulation model it is possible to describe the major physical
processes in the individual parts of hydrological cycle.

144
Table 1 Synopsis of internal project design “Hydrology”
Why ? To strive for environmental risk assessment of pesticides and integrated pesticide management in developing countries
Primary aim
What ? To produce a knowledge-based rule and expert system available for tentative pesticide reduction measures (considering the national control mechanisms of local agronomic, socio-economic and
environmental boundary conditions)
Project over goal
Who ? Hydrology is able to achieve contribution to that issue internal project
What ? Realization of describing the major physical processes in the individual parts of hydrological cycle
project purpose
Which ? Importance of following external factors and boundaries: Security, logistic, facilities, collaboration, representative experiment field, suitable research methods, application of PC –tools is realistic,
extremely packed time frame
Important assumption
How ? Strategy: Hypothesis development
Stock-taking and evaluation of mandatory basis data (physical feature resources / basin characteristics) and model choice
Implementation of new In situ tests Pre-processing of grid maps and data sets
Process studies through the application of integrated components (GIS & Water Simulation Program)
Post-processing Application of Case study
Visualisation Consequences
objectively verifiable indicators
Where ? Identification and Evaluation: Allocation of experiment fields
Topographic -, geologic - and soil maps Literature survey
Assessment of existing environmental data Regular recording of meteorological data from climate station as
well as from the recording gauges, piezometers and other physical measurement equipment
Scientific studies and pure research (experiments and field tests)
means / sources of
verification
To whom ? Uses and Effects: Investigation could be a contribution to promote the ecological
awareness to all person affected To point out the relevant consequences and /or effects of ecological system (network) on local and regional scale and assess the influence of human intervention
Measures integrated environmental compatibility and sustainability in the developed guide-lines
expected results / output

145
Choice of model
In order to assess the suitability of a certain model structure to solve the particular problem, a
decision support system in form of a status–feasibility matrix was drafted. The objectives,
indicators and furthermore aspects were taken from the “Zopp” mentioned above. Table 2
shows the objectives (supposed be) and the targets with the actual conditions in the project
area. It serves as auxiliary line to delimit the formulation of question and likewise helps to
chose a suitable model configuration. Further it allows an evaluation of the final success. For
this project intention the preconditions were evaluated with the help of a suited questionnaire
from where the pertinent aspects were sketched and finally assembled. Each header of
categories in the table clip of actual conditions are composed, but actually they hide several
further reaching and/or important aspects. For example landscape complexity includes the
following aspects: geomorphologic feature, biotic complex and natural or human disturbance;
for hydrologic system: bucket system, linearity or non-linearity, homogeneity or
heterogeneity and open or closed;...and so on).
Table 2 Status-feasibility matrix
Supposed to be Objective (1) • To describe the major physical processes in the individual parts of hydrological cycle Process (2) • Water balance • Rainfall-runoff relationship Model set-up (3) • Temporal and spatial resolution (events and seasonal, grid scale not to small ) Model approach (5) • Physical based • Conceptual, modular and semi-distributed • Incorporated uncertainties
Actual conditions Landscape complexity • high Hydrologic system • non-linear, heterogen Signature • Regime curve (discharge), specific parameter, ... Dr iving forces (availability of rules, var iables and arguments..) • temperature, precipitation, humidity, wind, ... Boundar ies (6) • High uncertainties (time frame, acts of God...) Feasibility’s (4) • medium to limited (data capture) Means and facilities • high (logistic, measurement devices, lab,...)
Judgement High constraints
Parameterization and validation becomes tricky High uncertainties have to be taken into account
Challenge
Nos.: 1 purpose, 2 process, 3 spatial and temporal frame , 4 data availability, 5 requirements and 6 expenditure of energy]

146
At the beginning the operator defines the process that has to be described, and also assesses
the temporal and spatial scales which might be relevant.
The decision for a specific model set-up is therefore depending on the assessment which can
be seen in the status-feasibility matrix. The decision for a suitable simulation model is
consequently based on the principle selection criteria just stressed in Table 2 [see nos.(1)-(6)].
On this basis the target area is clearly seen, however, high general constraints cause
significant uncertainties that have to be considered during the model performance. The
interactions (causes and effects) between categories are assessed as not stable. Observations in
other studies show close interaction of non-linearities in a system and parameters variances.
Therefore parameter estimations and model validations are expected to be difficult. To
summarise, without additional disturbance due to the general constraints, it will be a challenge
to realise the task in time. The focus is the description of the run-off relationship within the
small catchment. The objective and inherent processes are consequently described.
In this study the parsimonious approach is pursued that model configuration must only be as
complex as needed to capture the appropriate signature that is given, because the scale frames
and actual boundary conditions emphasise that philosophy.
Therefore the use of a semi-distributed deterministic model with modular structure is
advisable, a combination of physically-based and conceptual approach allows to approximate
step by step the simulation progress. The advantage of models with a modular structure is
flexibility of model set-up dependent on the simulation objectives and data availability. Data
requirements for each simulation objective can be suited or minimised due to model set-up.
By gaining higher levels of knowledge, additional modules can be turned on, and the
formulation of question allows to get deeper in details.
Considering these aspects the water balance model-package WaSiM-ETH (WaSiM-ETH-
Zürich by SCHULLA & JASPER, 1999) was selected which serves various options to use with
module parts, algorithm and variable time scales.
According to the demand of the used modular codes a physically-based distributed code was
tested. The process description allows spatial discretisation. Processes such as surface runoff

147
and evaporation can be described, and results like soil water balance can be transferred into
thematic maps (GIS/ArcView).
Data capture
WaSiM-ETH model system basically needs two types of data sets for the internal simulation.
On the one hand the spatially distributed data sets are required, which are temporally invariant
and have to be transformed into grid information. Generally geographic data are used to
demonstrate the spatial feature of its ecosystem as well as to reproduce their inherent
conditions in any time clip (thematic maps). The digital elevation model (DEM) belongs to
this category, further land use, soil type or sub-information like hill slope etc., are included in
these data sets. On the other hand the programme system deals with temporal information,
which is collected during a certain time period. These input data sets belong to the
meteorological and hydrological quantity or measured units (e.g. precipitation, temperature or
discharge). In most cases the observation or recording take place only at few selected sites
(point supports).
We have to distinguish between capturing primary data sets and secondary data sets. The
primary or original data come directly from the object or its reproduction (image), the
secondary data sets are subject to different pre-processing methods in which the original data
are adapted indirectly to the model demand (see Tab. 3 ).
Status of data
Regarding to the primary spatial data sets, a most common method to get topographic maps
are the conventional survey methods and aerial photogrammetry or remote sensing techniques
are used to derive the DEM and land use grids. Field visits and sampling or inquiries
contribute to collect relevant information. For instance field measurements of plant phenology
are made on a horticulture farm to get detailed land use information. Soil types estimation was
covered via sampling and drilling, and denominated with geographic co-ordinates.

148
Table 3 Data requirements
Spatial Data Temporal data Pre-processing
Geographical data Climatological data Hydrological data � Primary data
• Digital topography (DEM)
• Soil data (kf-value, storage
capacity, soil type)
• Land use (crop type, fallow,
meadow forest,...)
� Secondary data
Spatial transformation
• Raster data (grid)
• All formats with same
dimension and size
Calculation
• Exposition
• Slope
• Flow direction
• Flow accumulation
• Flow net (river)
• Catchment boundary
• Topographic factor
• LAI
Parameter estimation
• Pedo-transfer function
� Primary data
• Station values with
different time resolution
modelling (temperature,
radiation, wind speed, humidity,
are pressure, sun shine duration)
� Secondary data
Temporal transformation
• Uniform format (equal time
steps)
Calculation
• IDW, regression or
Thiessen (geometric topologic),
temporal interpolation (statistical
method)
� Primary data
• Discharge data from
available gauges
� Secondary data
Temporal transformation
• Discharge per unit area
(l/s(km2)
• Discharge per unit area into
inverse discharge per unit area
Calculation
• Statistics (average + mean
value)
Parameterisation
• recession constants
Source of data supply from
several places
Converted data
Parameter estimation
Auxiliary tools (PC-programs an
GIS-application)
The secondary data are derived from the primary ones by using e.g. auxiliary computer
programs and incorporated sub-modules in the main model or with the help of GIS
applications. The format of spatial distributed data generally has grid size and has to be
transformed into BINARY - format, the internal language of the model run. As preconditions,
all spatial input data require an uniform grid size for processing, and all different thematic
coverages have to be congruent, so that one grid after the other (grid in row x1 followed by
grid in row xi) will be read against its grid template which makes calculation just possible. As
we will see later, a well-suitable grid size depends on the given size of the catchment area
under investigation where the authors of WaSiM-ETH recommend to generate 10 m grids size

149
for areas smaller than 1 km2 and 5 km2 grid size for areas bigger than 10.000 km2 (SCHULLA &
JASPER 1999).
In case of the required spatial data the initial requirement for input grids looks confidently
(see examples in Fig. 1).
Based on the DEM some information about slope, exposition and catchment boundaries or
flow time etc., with hydrological relevance is extracted and serves as important hydrologic
input data (SCHULLA 1997; QUINN ET AL. 1996 AND MOOR ET AL. 1993). In case of soil
properties a classification of the saturated hydraulic conductivity of the soil matrix was done
using pedo-transfer functions (SCHAAP 1999). The soil property information is saved in
special tables, so that Arc/View is able to load it up and read each location as a theme and
transforms it into grids. The land use data comes in fact from aerial photographs, but
secondary data were taken indirectly due to limited resources for field measurement.
Fig. 1 Examples of spatial data sets
According to the requirements of the temporal data sets, climatological and hydrological data
come to use. These temporal data types are variables and are the driving forces in the eco-
system and consequently in the model processing. They are obtained by permanent
registration from climate stations (humidity, temperature, radiation, wind speed, air pressure
etc.) or stream gauges (water level). Secondary data will be provided through transformation
using different statistical approaches. In most cases the required information must be
E x p 2 5 - 4 7
4 8 - 7 0
7 1 - 9 2
9 3 - 1 1 5
1 1 6 - 1 3 7
1 3 8 - 1 6 0
1 6 1 - 1 8 2
1 8 3 - 2 0 5
2 0 6 - 2 2 8
N o D a t a
B a r i - r i v e r . s h p
D e m 8 9 2 - 9 1 4
9 1 5 - 9 3 6
9 3 7 - 9 5 8
9 5 9 - 9 8 0
9 8 1 - 1 0 0 3
1 0 0 4 - 1 0 2 5
1 0 2 6 - 1 0 4 7
1 0 4 8 - 1 0 6 9
1 0 7 0 - 1 0 9 2
N o D a t a
B a r i - r i v e r . s h p
S l o p e 1 - 5
6 - 1 0
1 1 - 1 5
1 6 - 2 0
2 1 - 2 5
2 6 - 3 0
3 1 - 3 5
3 6 - 4 0
4 1 - 4 5
N o D a t a
B a r i - r i v e r . s h p
F l o w - t i m e 6 2 - 6 6 5
6 6 6 - 1 2 6 8
1 2 6 9 - 1 8 7 1
1 8 7 2 - 2 4 7 4
2 4 7 5 - 3 0 7 8
3 0 7 9 - 3 6 8 1
3 6 8 2 - 4 2 8 4
4 2 8 5 - 4 8 8 7
4 8 8 8 - 5 4 9 1
N o D a t a
B a r i - r i v e r . s h p
L a n d - u s e 4 5 6 7 8 N o D a t a
B a r i - r i v e r . s h p 1
2
3 5
4
S p a t a l D a t a
S e t s
( G r i d s i z e
1 0 m )
N 0 1 0 0 2 0 0 M e t e r s
1 D i g i t a l
T o p o g r a p h y
2 S l o p e
3 E x p o s i t i o n
4 L a n d - u s e
5 F l o w T i m e

150
transferred to another temporal scale. Statistics can be drawn up to transform the source data
into any required time steps (averages and mean values). Further the meteorological input
data, especially the temperature may be corrected by interpolation depending on the gradient
of the altitude and radiation.
Hydrological data are of high importance for the calibration process. A most essential
hydrological variable is in this context the measured discharge, which represents an integral
information about the catchment.
It emerges that high uncertainties arose just by capturing these temporal input data. Rebounds
were noted in the measurement facilities and devices. Apart from that, instability of political
situation caused an earlier ending of the measuring campaign. Therefore these boundary
conditions gave uncertainties due to the temporal input data, which are essential for the model
processing (driving forces or simulator). Further data treatment due to the cleaning and
proving of rugged data, took considerable expenditure, that was not expected. Because of
limited data availability or sometimes data inconsistency, only short sequences of rain events
could be used for model adaptation and calibration. The Figure 2 shows the actual stage of
data capture.
Fig. 2 Temporal data base: graph of periods of record
���������� ��� ��� ���
��� � ����������������������
��� � ������� ��!�"�#�$%�&('*),+"' -.&�)0/21%�&('*),+"'-�354(16%�&('�)7+"'893 :"12; 4=<()>&('
?.�!�@� ������AFor bari land
��� ������� �"�
��� � � ���B���"������ �����
�������
�������
� �����
��������������

151
Model set up and configuration
The model configuration is demonstrated in the model-set-up box in Table 4. This approach
tests the physically-based distributed code. The process descriptions allow spatial
discretisation. The model application is based on status of data as shown in Fig. 2. Up to now
the actual temporal project scale allows only to simulate short sequences (storm events),
which demands hourly or daily time intervals (see examples in Fig. 3).
According to the demand of the used module configuration (modular codes for unsaturated
soil with RICHARDs equation) this approach gives an acceptable representation of the system,
in particular with regard to single storm events. Each event requires new parameter adaptation
because of the non-linearity in the system and preferential flow. It is very uncertain to
simulate the behaviour of catchment response over a longer period like season. Nevertheless,
despite problems with the input data just discussed, and with scale complexity, non-linearity
and spatial variability, this type of hydrological catchment simulation model is tenable. How
well the model actually fitsthe observed behaviour of the system can be seen in an example of
model run in Fig. 3.
Minimal requirements of model components (modules) and input data due to the presented
model objectives were utilised, because model application is often restricted due to scarcity of
data.
Conclusion
The parameter adjustment requires a lot of expenditure. This is confirmed through the
permanent soil parameter adaptation during model processing, even though the first model run
was based on a minimal model set-up. The soil properties and consequently the runoff
conditions change after each rainfall event. It is assumed that the soil surface is full of macro-
pores, fissures and cracks which serve as preferential flow paths. Therefore each actual
surface runoff or overland flow is subject to changing conditions. The simulation results allow
the assumption, that the catchment system reacts in a non-linear way, but this has to be proved
with more model runs in detail. Actually the spatial scale has no great influence on runoff
calculation which can be demonstrated with the changing grid sizes of 2.5 m, 10 m or 20 m.

152
Table 4 Model-set-up box
Model configuration:
Geographic setting: Climate classification: subtropical, continental, semi-humid area [B2sh LAUER/FRANKENBERG] Lower Himalaya – middle mountains Location: Tinpiple valley; co-ordinates x 362822 and y 3.05635e+006 One small catchments, Catchment size 12,5 ha Elevation from 891 to 1092 m a.s.l. Land use rainfed Soil type: silt loam to clay loam Catchment orientation NW - SE Objectives: Flood hydrograph simulation (single event) Model set-up: 2 modules, 4R- grids, 3R input variables, 2 supplementary data sets, 14R parameters Model modules: Soil modules (RICHARDS-equation) and Routing module Model domain (resolution): General for all the formulation of questions scale alternatives Temporal scale : 1 h and 24 h; Spatial scale: 2.2 m with amount of grids and 10 m with amount of grids and 20 m with amount of grids Data sets of observation: Precipitation, Temperature, Humidity, Windspeed, Radiation Grid requirements: Digital elevation model, Land use grid, Zone-grid, Land use grid, Soil type grid
Parameter for:
ETP-module and interception-module are measured directly and taken from literature 9 Parameters
Soil-module indirect by fitting and by the use of pedo-transfer function and soil table 5 Parameters and indirect Routing-module by topographic survey (DHM) and PC-help tool “TANALYS” indirect Simulation periods: Tests ? 24.08.2000 [5:00h] – 26.08.2000 [12:00h] hourly 09.09.2000 [5:00h] – 10.09.2000 [12:00h] hourly 20.08.2000 [24:00] – 30.09.2000 [24:00h] hourly and daily other . . . Measurement for quality: Discharge from stream gauge

153
Fig. 3 Application examples of model approach with different time sequence
Discharge per unit area from 20.8.2000 - 30.9.2000
0
0.1
0.2
0.3
0.4
0.5
0 100 200 300 400 500 600 700 800 900 1000
Time interval , cum. (h)
Ru
no
ff (
mm
)
measured1.1;1.1;0.2;0.8;0.8 (0.3)0.01;0.01;0.1;0.8;0.8 (0.1)
D is c h a r g e p e r u n i t a r e a ( l /s ( k m ^ 2 ) f r o m 2 4 .0 8 .2 0 0 0 - 2 5 .0 8 .2 0 0 0
0
0 .1
0 .2
0 .3
0 .4
0 .5
0 .6
1 8 1 9 2 0 2 1 2 2 2 3 2 4 2 5 2 6 2 7 2 8
T im e in t e r v a l, c u m u la t iv e ( h )
Ru
no
ff (
mm
)
m e a s u r e d
c a lc u la te d ( 2 .5 m ^ 2 /6 0 m in )
c a lc u la te d ( 1 0 ^ 2 /6 0 m in )
c a lc u la te d ( 2 0 ^ 2 m /6 0 m in )
D is c h a r g e p e r u n i t a r e a ( l /s ( k m ^ 2 ) f r o m 9 .9 .2 0 0 0 - 1 0 .9 .2 0 0 0
0
0 .0 5
0 .1
0 .1 5
0 .2
0 .2 5
0 .3
0 .3 5
1 8 1 9 2 0 2 1 2 2 2 3 2 4 2 5
T im e in t e r v a l , c u m u la t iv e ( h )
Ru
no
ff (
mm
)
m e a s u r e d
c a lc u la te d ( 2 .5 m ^ 2 /6 0 m in )
c a lc u la te d ( 1 0 m ^ 2 /6 0 m in )
c a lc u la te d ( 2 0 m ^ 2 /6 0 /m in )

154
On the other hand, the application of different temporal resolution (hourly or daily) shows that
the chosen time scale cause relatively high sensitivity.
It can be expected, that the estimation of relevant parameters will be time consuming and
therefore the possibilities for the application of a very sophisticated model approach is
limited. Furthermore, the application of the chosen hydrologic model will make the use of
more stochastic approaches for assessing representative catchment parameters necessary.
With certain statistical approaches it is possible to regionalise physical properties of soils and
to quantify the influence of the uncertainties to the model results. We also assume that
alternatives in form of data linkages can be included (indirectly measured or literature data).
Due to given project circumstance, it seems to be more attractive to work with indirect
information, making the operator independent from local boundary conditions, rather then
capturing primary data. If irrigation could be neglected, then the top-approach could be used
as an indirect alternative.
Due to the limited time available and considering all problems which arise usually in remote
areas, parameter error results from an inability to represent area distributions on the basis of a
limited number of points measurements. These basic problems of data capture and parameter
up-scaling from site to field scale or the catchment scale are well known (see for example the
discussions of BEVEN 1996, REFSGAARD & ABBOT 1996, BLÖSCHL & SIVAPELAN 1995,
WOOD ET AL. 1990). There are many examples of such physically-based parameters, including
soil properties or soil hydraulic conductivity, canopy resistance and effective root zone depth,
plant density or vegetation cover. This creates the necessity to look for alternative strategies to
compensate information gaps with reasonable values to reach a certain kind of equivalence.
However, beside the actual constraints, unstable system conditions, high uncertainties and
considerable expenditure for pre-processing to provide and co-ordinate the rugged data until
they had an usable format ready for modelling), the results presented here are expected to be
refined and improved in the near future.

155
References
Beven, K.J. (2001) How far can we go in distributed hydrological modelling? Hydrology & Earth, SystemScience 5, 1-12
Beven, K.J. (1996) A discussion of distributed modelling. In: J.-C. Refsgaard & M.B. Abott (eds.) Distributed Hydrological Modelling. Kluwer, 255-278
Blöschl. G. & Sivapelan, M. (1995) Scale issurs in hydrological modelling: A review. Hydrological Processes 9, 251-290
Herrmann, A. & Schumann, S. (1999) Ein Forschungsansatz zu Umweltrisiken von Pestiziden und der nachhaltigen Entwicklung eines Integrierten Pestizid-Management (IPM) unter Berücksichtigung der sozioökonomischen Verhältnisse in Nepal. Proc. GEOökon ’99 Umweltanalyse-Dynamik natürlicher und anthropogener Systeme und ihre Wechselwirkungen, Braunschweig Okt. 1999,Landschaftsökologie und Umweltforschung 33, 235-245
Meijerink, A.M.J.; De Brower, H.A.M.; Mannaerts, C.M & Valenzuela, C.R., (1994) Introduction to the use of geographic information systems for practical hydrology. ITC / UNESCO Publication No 23, 146-182
Plate, E.J. & Duckstein, L. (1990) Stochastic aspects of water quality modeling for non-point sources. Proc. Internat. Conf. on Water Quality Modelling in Agricultural Non-Point Sources (ed. D.G. DeCoursey) USDA, Agriculture Research Service, ARS-81, Pt.2, 631-654
Schaap, M.G. (1999) Pedotransfer functions (PTFs) Rosetta Version 1.2 Schulla, J. & Jasper, K. (1999) Modellbeschreibung WaSiM-ETH. ETH Zürich, 180pp. Wood, E.F.; Sivaplan, M. & Beven, K. (1990) Similarity and scale in catchment storm
response. Review of Geophysics 28 (1), 1-18

156
A study on the impact of different plant extracts on the tomato fruit borer (Helicoverpa armigera) BANDANA PRAJAPATI-MERZ International Center for Integrated Mountain Development (ICIMOD), G.P.O. Box 3226, Kathmandu, Nepal NARAYAN P. BHANDARI Horticulture Centre, Panchkhal, Nepal
Abstract
In the Middle Mountains of Nepal with growing population pressure, the demand for food has
risen considerably. To meet with this demand, farmers who have easy access to markets and
favourable climatic conditions are turning towards commercial vegetable production. One of
the best examples for this is the Jhikhu Khola Watershed. The use of high doses of chemical
fertilizer and pesticide has become a common practice to maximize production, nowadays.
Pests develop resistance after repetitive use of chemical pesticides. Resistant individual pests
make up an increasingly large part of the pest population and pass on their resistance to future
generations. Farmers therefore are using stronger and stronger chemicals in higher doses,
which is having an adverse affect on the environment and ultimately on human health. Present
methods of applying chemical pesticides are also dangerous as farmers lack proper knowledge
about their application and their affect on human health and environment.
A long-term answer to pest resistance, ecosystem destruction, and environmental pollution
exists in natural alternatives to modern chemicals. An experiment was set-up to study the
impact of different plant extracts on the tomato fruit borer (Helicoverpa armigera). Three
different kinds of treatment were carried out using aqueous solution of Riccinus communis,
Artemisia vulgaris and mixture of four different plants extract (Riccinus communis, Artemisia
vulgaris, Melia azedarach and Vintex nigundo). The treated productions were compared with
an untreated control production.
The results were promising. Both the Riccinus communis and Artemisia vulgaris treated plots
had more than 100% production over the untreated control plot. Though the mixture of four
Landschaftsökologie und Umweltforschung 38 p. 156-167 Braunschweig 2002

157
different plants did not give comparative result to the Riccinus communis and Artemisia
vulgaris, still the production was 63% higher than the production of untreated plot.
The result of the experiment indicates that the Riccinus communis and the Artemisia vulgaris
aqueous solution can successfully replace chemical pesticides to control the invasion of fruit
borer on the tomato crop.
Introduction
The farmers of the Jhikhu Khola Watershed (JKW) are in commercial vegetable production,
mainly potatoes and tomatoes. This is due to its favourable climatic conditions and easy
access to the Kathmandu market. However, they face an accute problem of the tomato fruit
borer (Helicoverpa armigera) on their spring and pre-monsoon tomato crops. It has been
noticed that the farmers have been using a wide range of chemical pesticides (e.g. Nuvan,
Fanfan, Cypermethrin, Decis, Rogor etc.) in much greater doses and frequencies than
agronomically recommended in order to control the problem. This current practice is not only
harmful for the natural ecosystem but also for the environment, health and economy of the
local farmers.
Fig. 1 Jhikhu Khola Watershed
The tomato fruit borer is the larva of the Helicoverpa armigera moth of the family Noctuidae.
In warm humid places like the JKW it completes several life cycles per year. The moths are
very active during evening time and lay eggs on leaves of the tomato plants. The young larvae
feed upon the leaves, and as they grow they start to attack the young fruits. They bore holes
on the fruit surface and enter into the fruits. The invaded parts of the fruits start to decay. The
damaged fruits ripe early but are of no market value. The growing larvae are greenish in
Jhikhu Khola Watershed

158
colour with blackish spots on the dorsal surface while the mature ones are brownish. Besides
tomato the fruit borers attack various other plants such as capsicum, maize etc (Gyawali 1999,
Neupane 1989).
Fig. 2 Helicoverpa armigera
The People and Resource Dynamics of Mountain Watersheds in the Hindu Kush-Himalayas
Project (PARDYP) in collaboration with Horticulture Farm, HMG/ Department of
Agriculture, set up an experimental plot in the Horticulture Farm at Tamaghat in spring
season to study the impact of different plant extracts on the fruit borer of tomato crop. A local
tomato variety (Lapsi gede) which is very popular amongst the local farmers for the season
was selected for the study.
PARDYP is a watershed management 'research for development' project active in many
different fields of natural resource management in five watersheds across the Hindu Kush-
Himalayas with one watershed in China, India, Pakistan and two in Nepal. Important research
components of the project are hydro-meteorology and sediment, water chemistry,
rehabilitation of degraded land, erosion control, soil fertility, and agronomy. Overall
coordination, guidance and administration are provided by the International Farm for
Integrated Mountain Development (ICIMOD). Funding is received from the Swiss Agency
for Development and Cooperation (SDC), the International Development Research Farm
(IDRC) and ICIMOD.
Investigating alternative pest management systems is an important aspect of the agronomy
component that the project has introduced in the JKW, Nepal, beginning in 1998.

159
The Horticulture Farm is situated in Tamaghat, which is located at 860m asl on the valley
bottom of the JKW. Easy access to the Kathmandu market is provided through the Araniko
highway at a drive of 43 km. The average annual temperature ranges from minimum 50C to
maximum 330C with average annual rainfall of about 1200 mm (Merz et al. 2000). The farm
was established in 1975/76, under HMG/ Department of Agriculture on an area of 7.5
hectares. The farm is presently involved in the production of tropical fruit saplings, vegetable
seeds, and technology transfer, on the spot training and collaborative research with other
government agencies, NGOs and INGOs.
Aim
The main aim of this study is to recommend alternative measures to control the Helicoverpa
armigera of the spring and pre-monsoon tomato crops, using locally and easily available
natural resources.
Material and methods
In the following are the material and methods applied for the preparation of the field and for
the preparation, storing and application of natural pesticides.
Field preparation
Double spacing plots of 4 m * 1 m were prepared. The double spacing plots were prepared in
order to conserve soil moisture. Both organic and chemical fertilizers were applied at
different times (Table 1): 100 kg organic, 2 kg DAP, 1 kg Urea and 0.5 kg Potash. There were
20 plants on each plot.
Three different kinds of treated plots and one untreated control plot were prepared with 5
replica each. One plot was treated with aqueous extract of Artemisia vulgaris (below
Mugwort), another with aqueous extract of Riccinus communis ( below Castor) and the other
with aqueous extract of a mixture of 4 different plants: Mugwort, Castor, Vintex nigundo
(below Indian privat) and Melia azedarach (below Persian lilac). The concentration and the
part of the plant used are shown in Table 2.

160
Table 1 Record of fertilizer application
Basal dose Top dressing Total Applied Applied Applied Fertilizer Date
kg kg/ha Date
kg kg/ha kg kg/ha Compost 01-Feb 60 7500 27-Mar 40 5000 100 12500 Potash 01-Feb 0.5 62.5 27-Mar 0 0 0.5 62.5 DAP 01-Feb 1 125 27-Mar 1 125 2 250 Urea 01-Feb 0.5 62.5 27-Mar 0.5 62.5 1 125
Table 2 List of plant resources used
Botanical name Common name
Local name Part of the plant used
Concentration
Artemisia vulgaris Mugwort Titepati Leaves 10% Riccinus communis
Castor Andil Leaves 10%
Melia azedarach Persian lilac Bakaina Leaves 10% Vintex nigundo Indian privat Simali Leaves 10%
Selection of plants
Different plants for treatments were taken under consideration for their medical properties.
Finally four plants; Castor, Persian lilac, Mugwort and Indian privat were selected, as they are
abundant in the watershed. A brief medical properties of the selected plants are as below:
Castor (Riccinus communis)
"Nowadays known as Jatropa curcas. Curcas oil contains a toxin, curcasin. The albumen of
the kernel is a poison, toxalbumen cursin, most abundant in the embryo. Another poison, a
croton resin, occurs in the seeds and causes redness and pustular eruptions of the skin. The
plant is listed as a fish poison. Aqueous extracts of J. curcas leaves were effective in
controlling Sclerotium spp., an Azolla fungal pathogen.
The seed oil, extracts of J. curcas seeds and phorbol esters from the oil have been used to
control various pests, often with successful results. In Gabon, the seeds, ground and mixed
with palm oil, are used to kill rats. The oil has purgative properties, but seeds are poisonous;
even the remains from pressed seeds can be fatal" (ICRAF 1998).
Persian lilac (Melia azedarach)

161
"Aqueous and alcoholic extracts of leaves and seed reportedly control many insect, mite and
nematode pests. However, because they contain toxic components, care is needed in their use.
The fruit of M. azedarach is highly toxic to warm-blooded animals; the consumption of 6-8
fruit can cause nausea, spasms, and in children, even death.
Various parts of Melia azedarach have antihelmintic, antimalarial, cathartic, emetic and
emmenagogic properties and are also used to treat skin diseases. Dried ripe fruit is used as an
external parasiticide; some toxic components are found in the seed oil, the oral intake of
which may cause severe reactions and even death" (ICRAF 1998).
Mugwort (Artemisia vulgaris)
"The plant is described as having repellent and fumigant effect against insects due to satonin.
Horticulturists used the branches for safe package of fruit. Michael Grange and Saleem
Ahmed, 1987 have described the plant as having insecticidal effect upon flies, mosquitoes,
lice and cockroaches; antifeedant effect upon Leptinotarsa decemlineata, Phytadacta formica,
Pieris brassica and stored grain pests. Experiment on aqueous and alcoholic extract of plant
showed cidal effect upon different agricultural pests including Soyabean hairy catterpillars,
aphids and mealy bugs. Use of the plant extract in household pest like fleas also gave
satisfactory result.
The plant extract is also used as antihelminthic against roundworms, tape warms etc.
Externally, it is used in skin disease as antiseptic and detergent. Poultice of harb is applied to
gout and joint pain" (Vaidya 1998/99).
Indian privat (Vintex negundo)
"Leaves are used in books and clothes to protect from insects. The juice of leaves remove
worms, oil extracts are used in sinuses, wounds etc. The flower buds boiled in water are taken
to relieve pneumonia" (Vaidya 1998/99).
Extract preparation
One kilogram of aerial parts of the plants (see Table 2) were chopped and ground in a hand
grinder. The material was then soaked into one litre of cattle urine for at least 24 hours. The

162
solutions were stored in plastic buckets. Nine litres of water were added to one litre of the
solution before spraying.
To prepare fresh extract for each application is time consuming. Therefore 6 kg of each kinds
were chopped, ground and soaked in cattle urine. The prepared solutions were then kept in
different buckets and diluted according to need at the time of use. This storage method was
also useful for off-season application when the leaves of these plants could not be found.
Application of the pesticide
Right before plantation about 10g green bio mass of the chopped plant parts were applied in
the places where tomato plants were to be planted. After 45 days of plantation, the plants were
treated weekly by their respective extract for 10 weeks. As the adult moths of the tomato fruit
borer are very active during evening, the spraying was carried out during afternoon (around
4:00 p.m.) in order to keep the adult moths away.
Pest record
On each plot four sample plants were selected and marked. The sample plants were observed
carefully each week a day before application of the pesticide.
Results Input of water, chemical fertilizer and organic fertilizer in all plots was made uniformly.
However a distinct difference in flowering time (Table 3) and production (Table 4) between
treated and untreated control plots was noticed. All the plants in treated plots started flowering
after two months while it took another half a month more for the plants in untreated plots to
flower. This result clearly indicated that the plant extracts used as pesticide facilitated early
flowering and fruiting at the same time.
The pest (Helicoverpa armigera) was not noticed in any plot before the start of flowering.
After flowering (11th April) the pest started to appear and within about one and half months
time (23rdMay) it was seen on almost all plots (Table 5).

163
Table 3 Record of pesticide application Date Time Remarks 01-Feb Afternoon Soil treatment/ planting date 15-Mar Afternoon 22-Mar Afternoon 29-Mar Afternoon 05-Apr Afternoon All plants in treated plots starting to flower 12-Apr Afternoon 19-Apr Afternoon All plants in treated plots starting to fruit and control plot started
flowering 26-Apr Afternoon 03-May Afternoon Fruiting started in the control plot too 10-May Afternoon 17-May Afternoon 24-May Afternoon Table 4 Production
Production/plot (kg) Remarks Date Castor Mugwort Four mixed Control
15-May 2 2 1 17-May 5 4 4 19-May 10 12 10 8 22-May 13 12 9 7 28-May 21 18 16 8 01-June 10 13 10 5 02-June 5 05-June 4 7 4 5 Total production/20sq m 70 68 54 33 Production/ha 35000 34000 27000 16600 Production/ropani* 1750 1700 1350 825
Damaged fruits were not recorded
*Ropani is a local measurement for land in Nepal of 500sq m.
Table 5 Occurrence of pest
Date Mugwort Castor Mixed Control Remarks 04-Apr 0% 0% 0% 0% Flowering in treated plots 11-Apr 15% 15% 20% 20% 18-Apr 20% 15% 35% 25% Fruiting in treated plots/ Flowering in untreated
plots 25-Apr 40% 40% 40% 45% 02-May 35% 40% 55% 60% Fruiting in untreated plots 09-May 45% 45% 60% 65% 16-May 60% 60% 80% 75% 23-May 85% 80% 100% 100%
The tomatoes grown were used for the seed production by the Horticulture Farm, so the fruits
were harvested some days later than they would be for selling in the market for consumption.
Though the sample plants indicated almost 100% invasion of the pest by 23rd May and most of

164
the production was harvested from 22nd May to 01st June (Table 4), pest damage on the treated
plots were still negligible. This result indicates that the invasion of pest at later stage of
fruiting did not effect production, i.e. the young fruits are more vulnerable to the pest than the
mature ones.
Overall production has shown the best results from the plots that are treated by Castor extract.
It recorded 112% better result over the untreated control plots. The plots treated by Mugwort
have gives equally good results showing 106% better results than the control plots. Though
the plots that were treated by the extract of four mixed plants did not give as good results as
the former two, yet it was showing 63% more production than the control plots.
Fig. 4 Production record
01020304050607080
1
Pro
du
ctio
n/ 2
0 sq
m
Castor
Mugwort
Four mixed
Control
kg

165
Discussion
In comparison to treated plots the untreated plots showed very poor yield for clearly two
different reasons:
a) They started to flower and give fruits later than the treated plots, showing nutrient
deficiency.
b) By the time they started to fruit the sample plants were showing already 60% invasion of
the fruit borers in these plots (see Table 3 and 5). So the fruit borer damage was much
more in these plots than in any others.
Though the invasion started with the flowering on the treated plots, the pest started to show up
in the untreated plots, that had not yet flowered, at the same time (Table 5). So Helicoverpa
armigera moth started to get attracted by the flowering of the tomato plants and started to lay
eggs on the leaves of the plant irrespective of flowering or non-flowering.
The sample plants indicated 80% invasion in Castor plots, 85% in Mugwort plots, 100% in
the plots treated by the mixture of four different plants and 100% in untreated control plots by
23-May. But very little effect was noticed in treated plots in comparison to the control plots.
This is because by then about half the fruits were already harvested and the remaining half
was ready or nearly ready to harvest in the treated plots. While in untreated control plots the
fruits were still in the growing phase. Thus from 24th May the treatment was stopped as
almost all the crops in the treated plots were ready to be harvested.
The extract of the mixture of four different plants was taken under experimentation to see its
effectiveness in comparison to the individual extracts. If it had been equally effective as the
others, it would be more convenient for farmers to prepare the extract. But it was not giving
comparative result to the two other individual treatments, but in comparison to the untreated
control plots it was showing 63% better yield. Therefore this treatment should be extended for
some more times to study its effect in the coming years.
Though the untreated control plots were giving very poor yield (33 kg in 20 sq m, i.e. 16.5
t/ha or 825 kg per ropani), it was comparative to the average tomato production of the area.
The average tomato production under chemical treatment of the area for this season is about

166
881 kg per ropani or 17.6 t/ha (Prajapati-Merz, on preparation). This result clearly shows that
the chemical insecticides presently used in the JKW are loosing their effects on the tomato
fruit borer.
Conclusion
The Castor and Mugwort had given more than 100% better yield in comparison to the control
plots. With little effort environmentally friendly natural products can therefore replace the
harmful chemical insecticides currently used.
The plants used in this experiment are green manure and the cattle urine with its nitrogen
content also enhanced the net production of the treated plots.
The moth arrives with the flowering of the crop, an early plantation would escape the heavy
invasion. Plantation of tomato on ones plots after flowering in the neighboring plots can make
problematic for the use of any kind of control measures.
As the borers mostly attack the young fruits, better care should be given to the crop between
flowering time to the ripening of the fruit.
Both the Castor and Mugwort extracts gave very promising results for controlling tomato fruit
borer. But the farmers of this area are used to applying chemical pesticides, which are easily
available in the local market and take no time to prepare a desired solution. They can directly
put the chemicals into the sprayer along with water. Thus the main factor that prevents the
local farmers from adopting this technology is the lengthy processing method. In order to
make it adaptable further experimentation is needed to simplify the processing method. This
was tried in the present study by taking the extract of a mixture of four plants and preparing a
whole lot of extract at a time that was stored to be used according to need. A social awareness
program on the health hazards and non-effectiveness of chemical pesticide on pest after
repetitive use may also help the farmers to look for safe alternatives.
Further experimentation with natural pesticides will be carried out in order to see their effect
on late blight (Phythoptera infestans) of post monsoon tomato crops and bacterial wilt
(Ralstonia [Pseudomonas] solanacearum) of potato crops.

167
Acknowledgements
The presented study was carried out with the financial support of PARDYP which is funded
by the Swiss Agency for Development and Co-operation (SDC), the International
Development Research Farm (IDRC) and the International Farm for Integrated Mountain
Development (ICIMOD). (The authors highly acknowledge the support. We are grateful to
Richard Allen, former Project Co-ordinator PARDYP, P. B. Shah, Country Co-ordinator
PARDYP-Nepal and all colleagues of PARDYP-Nepal for providing a wonderful working
environment.) The authors also value, the facilities provided by the Horticulture Form,
Tamaghat. We are thankful to Laxmi Danuwar, AG, Horticulture Form, Tamaghat, for her
help in the field. A special thanks to P. B. Shah, Country Co-ordinator PARDYP-Nepal and
Juerg Merz, Research Associate/Hydrologist, PARDYP/University of Berne, for their
valuable advice and input on the preparation of this paper.
References Gyawali, B.K. (1999) Chinari Pustika. Jagadamba Press, Lalitpur ICRAF (1998) Agroforestry Database. Tree species reference and selection guide. CD ROM
Version 1.00, Kenya Merz, J., Dhakal, M.P. & Dangol, P.M. (2000) Comparison of Climatological Balance of the
Jhikhu Khola and Yarsha Khola Watersheds, Nepal. In: Allen, R., Schreir, H., Brown, S., Shah, P. B., The People and Resource Dynamics Project. The First Three year (1996 to 1999). Proceedings of the Final Workshop PARDYP Phase I, ICIMOD, Kathmandu
Neupane, F.P. (1989) Balibiruwaka shatruharu ra tinaka rokatham, Sajha Prakashan, Kathmandu
Vaidya, K. (1998/1999) Studies on pest and disease problem in Tamaghat and possible local resources for their solution. Annual Report PARDYP/ICIMOD, Kathmandu

168
Use of pesticides in Jaishidihi sub-catchment, Jhikhu Khola watershed, Middle Mountain in Nepal DAMMAR SINGH PUJARA & NARENDRA RAJ KHANAL Central Department of Geography, Tribhuvan University, Kathmandu, Nepal
Abstract
The traditional cropping pattern in Nepal particularly in accessible areas has been changing.
The increasing use of modern agricultural inputs and response to demand driven by market
towns with the improvement in road access have caused such changes. This paper discusses
the use of pesticides in changing context of cropping pattern in Jaishidihi sub-catchment. It is
found that the production of crops such as potato, tomato, bettergurd and chili has been
increasing in recent decades. The use intensity of pesticides in these crops is comparatively
high than in other traditional crops such as paddy and maize. Since per unit profit from these
crops is still higher and the cost of pesticide is lower, the use intensity of pesticides is likely to
increase in the future. People have already noticed different health problems due to
mishandling of pesticides in the study area. So, immediate actions to regulate the use of
pesticides are necessary for sustainable economic and environmental development of the area.
Background
Pesticide is one of the input factors used to increase agricultural productivity by protecting
plants and crops from pests and diseases. The use of pesticides varies with the types of land
and crops, access to market and socio-economic condition of the people. Excessive use and
inappropriate handling of pesticides cause damages of environmental resources and different
health related problems. Nepal has been experiencing various environmental and health
hazards due to misuse of pesticides (Klarman 1987, Baker & Gyawali 1994, Dahal 1995 ). It
is in this context that an assessment of the use of pesticide is necessary to develop strategies
for avoiding negative impact and sustainable development. This paper aims to assess the use
of pesticides in a small catchment from different perspectives.
Landschaftsökologie und Umweltforschung 38 p. 168-177 Braunschweig 2002

169
LEGEND
�� Settlement
Road
Feeder Road
Trail
River
Boundary
��
������
��
��
��
������
��
������ �� ��
��������
������
������������
����
������
�� ������
����
����������
����
Tinpiple
Jaishidihi
Thimkaldihi
Dhairenipakho
Jaygdelbensi
Ja is h idihi
K ho la
H allau nde K ho la
S imle Kho l
Dh aire ni
Kh
ol a
200 0 200 400 600 Meters
N
����� ��� ��� � ������� ����������
� � ��
� � � � � � ! � � � " # � � $ � % % &' ( ) � * � � � + , - � - + . / � 0 � 1 - 2 , .- + ! - 3 - + 4 5 � $ 5 � � � + 6 7 7 7 -
8:9;8;<= > ? @ A B C B D E
F # 5 G # � 4 # � H � IJ� $ � � " # � K
Nepal
100 0 100 200 Kilometers
Methods and materials
Jaishidihi sub-catchment of the Jhikhu Khola watershed in Kabre Palanchock district in the
Middle Mountains of Nepal was selected for the study (Figure 1) within the frame of a
collaborative project on risk assessment of pesticides by the Technical University of
Braunschweig, Germany. There are 120 households with a total population of 795 people in
this sub-catchment (CEAPRED 1999). Newar, Brahamin, Chhetri, Tamang and Kami are
major ethnic groups in the study area (Pujara 2000). This study is based on data collected
from randomly selected 30 households in Jaishidihi. It covers 128 plots with different land
types and crops owned by these 30 households. Data were collected by using structured
questionnaire and they are recalled and reported by the household heads during field work.
Fig. 1 Geographical situation of Jaishidihi watershed
Introduction to study area
Study area is located about 50 km east from Kathmandu. Arniko Highway (113 km) from
Kathmandu to Tibet, which was constructed in 1963, links the area. The altitude ranges from
860 m to 1120 m. Nearly 70 percent of the total area of Jaishidihi sub-catchment is under
cultivation followed by forest and plantation (10.2 percent), grazing (5.1 percent) and road
(2.1 percent) (Fig. 2). Irrigated khet land comprises about 31 percent of the total cultivated
land and the remaining 69 percent consist of rainfed bari land (Fig. 3).

170
� � � � � � � � � ��� � � � � �
��� ��������������� ������� !�#"$��%'&��)(*�,+-(.��(/+0(1 2 3 4
5 6 7 8 9 2 : 2 ; < = > = ; ? @ > A 2 B ; C < ? = ; D = E = ; F G : H G 3 8 : ; 4 I I I > J 8 : K L M C 2 N 2 O H : 2 P 1 2 3 2 Q N R G L P N 5 J J S
T U V U W XY Z [ \ ] ^ _ \ ` ab _ c \ ]T _ d a e [ ] a `f g _ aY _ d _ [f ] ^ ` c h i j g [ e ]b [ _ d \ _ \ ] g dY j _ j _ c _ i j _ cV j _ \ \ _
Figure 3
k l l l k l l m l l n o p o q r
s
tvu�wyx{z}|�~ �{|'w*�}~#�����'�#|0�.�������-�������������
� � � �
� � � � � � � � � � � � � � � � � � ¡ � ¢ � � � � £ � ¤ � � ¥ ¦ � § ¦ � � � � ¨ © © © � ª � � « ¬ ¢ � ® � ¯ § � � ° � � � � ± ® ² ¦ ¬ ° ® � ª ª ³
´ µ ¶ µ ·{¸¹ º » ¼ ½ ¾ ¿ À¸ Á  » Ã{» ½ ¾ ¿ ÀÄ Å ÃÆ» ½ ¾ ¿ À¹ º » ¼ Ç » È Å¸ Á  » Ã{» Ç » È ÅÄ Å ÃÆ» Ç » È ÅÉ ¾ » ¾ » È » Ç » È ÅÊ{À ¾ ¿ È Ë
Fig. 2 Landuse and landcover
Fig. 3 Agricultural landuse by landtype
Nearly, 70 percent of the total area of the watershed is under private ownership, 29 percent
under government and remaining 2 percent is guthi, which is religious trust (Fig. 4).
The size of land holding owned by these surveyed household ranges from 2.44 ropani to 48.98
ropani (19.6564 ropani = 1 hectare) and 70 percent households have less than one hectare of
land. The land is highly fragmented. The number of plot owned by the farm household ranges
from one to ten with an average of 4.27 plots, and these plots are located within 1.5 km
distance from the house. Major cereal crops grown in the area are rice, maize, and wheat.

171
� � � � � � � � � ��� � � � � �
Ag r i c u l t u r a l L a n d u s e b y L a n d t y p e
�� ��
� ��� � � � � � � ��� � � � ��� ��� � � � !���"� � # � $�� � % & � ' & � � � ( ) ) ) � * � � + , - !� . � / ' � � 0 �� 1� 2 .�3 & , 0 .�� * * 4
5 61716!8:9;=< > ? @�A B C9�D E > FG>!@1A B CH I F">!@:A B C;=< > ? J�> K I9�D E > FG> J�> K IH I F"> J�> K IL A > A > K > J1> K IM1C A B K N
Fig. 4 Agricultural landuse by landtype
Table 1 Number of plots and area under different cropping pattern in khet land
Plots Area Cropping Pattern
Number Percent Ropani Percent
Rice-potato-maize 51 73.9 166.5 75.3
Rice- potato-tomato 6 8.7 8.4 3.8
Rice-potato-maize+tomato 3 4.4 17.5 7.9
Rice-potato+wheat-maize 2 2.9 8.5 3.8
Rice-wheat-fallow 2 2.9 5.3 2.4
Rice-potato-bittergurd 1 1.5 1.5 0.7
Rice-potato-chilli 1 1.5 1.5 0.7
Rice-potato-tomato+fallow 1 1.5 5.1 2.3
Rice-potato-fallow 1 1.5 5.3 2.4
Rice-fallow-fallow 1 1.5 1.8 0.8
Total 69 100.0 221.3 100.0
Source: Household Survey, 1999
People have started to grow cash crops such as potato, tomato, bittergurd, chili and other
vegetables with the improvement in access to market towns after the construction of Arniko
Highway and introduction of modern agricultural inputs such as chemical fertilizer. At present
there are more than 10 different cropping patterns dominated by rice-potato-maize in khet

172
Jan Feb Mar Apr May Jun Jul Aug Sep Oct Nov DecKhetPaddyPotatoMaizeTomatoWheatBittergurdChilliBariMaizeTomatoBittergurdPotatoWheatMustardChilli
LegendSeedingTransplantingWeedingPesticide useHarvesting
Table 2 Number of plots and area under different cropping pattern in bari land
Plots Area Cropping Pattern
Number Percent Ropani Percent
Maize-fallow-fallow 25 42.3 98.1 40.6
Maize-tomato-fallow 9 15.2 25.0 10.4
Maize-wheat-fallow 5 8.5 20.4 8.4
Maize-tomato+fallow-fallow 4 6.8 26.1 10.8
Maize-potato-fallow 2 3.4 6.4 2.7
Maize-tomato+wheat-fallow 2 3.4 4.8 2.0
Maize+bittergurd-tomato-fallow 1 1.7 3.5 1.5
Maize+tomato+chilli-wheat+potato-fallow 1 1.7 16.1 6.7
Maize-mustard+tomato-fallow 1 1.7 2.4 1.0
Maize-mustard-fallow 1 1.7 4.0 1.7
Maize+bittergurd-fallow-fallow 1 1.7 1.5 0.6
Maize+tomato-fallow-fallow 1 1.7 23.2 9.6
Maize-chilli-fallow 1 1.7 6.3 2.6
Others 5 8.5 3.7 1.5
Total 59 100.0 241.5 100.0
Source: Household Survey, 1999
Fig. 5 Cropping pattern in sample households

173
land and more than 13 cropping patterns dominated by maize in bari land (Table 1 and 2 and
Fig. 5).
Use of pesticides
Pesticides are used for protection of plants and crops from diseases and pests. Modern
chemical pesticides were used in this area in late 1950s for the eradication of malaria by the
government. But the use of pesticides for the protection of plants and crops by local farmers
in the area started since 1983/84. The use of pesticides has been increasing with the increase
in area under cash crops. Local people perceive that more input of pesticides gives more
output of crops without paying adequate attention on the negative impact on environment and
health.
Both dust and liquid pesticides are used in this area. Pesticides are used in almost all the cash
crops in the area. Fig. 5 shows the calendar of crops grown in the area and the timing of the
use of pesticides. Pesticides are used in almost all the area under potato, tomato and bittergurd
cultivation. Present survey shows that pesticides are used in 34.3 percent of the total area
under chili and only 11 percent area under paddy cultivation (Table 3 ).
Table 3 Area covered by pesticides use (area in ropani) (19.6564 ropani = 1 ha)
Crops Total area under crops Area under pesticides use Percent in total area
Rice 221.3 24.7 11.2
Potato 223.7 223.7 100.0
Maize 397.6 0.0 0.0
Tomato 63.9 63.9 100.0
Wheat 53.7 0.0 0.0
Mustard 5.3 0.0 0.0
Bittergurd 7.5 7.5 100.0
Chilli 11.8 4.0 34.3
Source: Household Survey, 1999
Commonly used dust pesticides in the study area are indofil–45, diathim-45 and Malathion.
Similarly, nuvan, rogar, fen-fen, metacid, bavistan, hinosan and dursban are other liquid
pesticides used in this area. Table 4 shows the use intensity of dust pesticides calculated on

174
Figure 6
Use intensity of dust pesticides
0200400600800
1000
Pad
dy
Pot
ato
Mai
ze
Tom
ato
Whe
at
Mus
tard
Bitt
ergu
rd
Chi
lli
Crops
Gra
m/r
op
ani
KhetBari
the basis of quantity of pesticides used and actual area under pesticides use. It shows that the
use intensity of dust pesticides is comparatively high in khet and in cash crops such as potato
and tomato than in bari and other food crops (Fig. 6).
Table 4 Use intensity of dust pesticides by land type and crops (gram/ropani)
Land types Crops
Khet (irrigated land) Bari (rainfed cultivated land)
Paddy 46 0
Potato 917 532
Maize 0 0
Tomato 575 447
Wheat 0 0
Mustard 0 0
Bittergurd 0 83
Chilli 0 0
Source: Household Survey, 1999
Fig.6 Average application rates for dust pesticides
Table 5 shows the use intensity of liquid pesticides in the area. Again the use intensity is high
in khet and in high value cash crops such as tomato.

175
Table 5 Use intensity of liquid pesticides by land type and crops (ml/ropani)
Land types Crops
Khet (irrigated land) Bari (rainfed cultivated land)
Paddy 5 0
Potato 20 88
Maize 0 0
Tomato 258 121
Wheat 0 0
Mustard 0 0
Bittergurd 0 75
Chilli 0 50
Source: Household Survey, 1999
Per household per year use of pesticides in value in Nepalese Rupees is very high in potato
followed by tomato and paddy (Table 6). Per household money value of pesticide used in
potato ranges from Rs. 232 to Rs. 2149 depending upon the size of the farm with an average
of Rs. 755. It ranges from Rs. 64 to Rs. 1130 with an average of Rs. 418 in tomato and from
Rs. 26 to Rs. 496 with an average of Rs. 186 in paddy. Average per household money value is
less than Rs. 100 in other crops.
Table 6 Per household expenditure on pesticides in a year in Nepalese Rupees
Crops Minimum Maximum Average
Rice 26 496 186
Potato 232 2149 755
Maize 0 0 0
Tomato 64 1130 418
Wheat 0 0 0
Mustard 0 0 0
Bittergurd 42 178 97
Chilli 33 33 33
Source: Household Survey, 1999
Table 7 shows per ropani input, output, benefit and benefit cost-ratio of different crops grown
in the area. Per ropani benefit-cost ratio of chili, bittergurd, tomato, paddy and potato is high
as compared to other crops grown in the area. In other words, one unit input in monetary

176
value gives 3.06 unit output in chili, 2.65 in bettergurd, 2.59 in tomato, 2.52 in paddy and
1.90 in potato.
Table 7 Input, output and benefit from different crops grown (Nepalese rupees per ropani)
Crops Input Output Benefit Benefit/ cost ratio
Paddy 1163 2935 1772 2.52
Potato 3393 6456 3063 1.90
Maize 520 731 211 1.41
Tomato 1441 3727 2286 2.59
Wheat 485 706 220 1.45
Mustard 278 324 46 1.17
Bittergurd 1028 2729 1700 2.65
Chilli 530 1623 1093 3.06
Source: Household Survey, 1999
Conclusion
Per land unit profit from potato, tomato, bittergurd and chili in which pesticides are used
intensively is higher than other crops grown in the area, and at the same time the cost of
pesticides in terms of income from crops is lower. In economic term, additional use of
chemical pesticides in these crops is still profitable. So, the use intensity is likely to increase
in the future. But people in this area have already been experiencing several health problems
such as headache, nasal bleeding, vomiting, neck and eye pains, body ache, dizziness and
other respiratory and skin problems due to mishandling of pesticides. It is in this context,
immediate actions to regulate the use of pesticides are needed. Emphasis should be given on
awareness creation by providing training on proper handling of pesticides. People should be
encouraged to adopt integrated pesticide management technique by utilizing locally available
organic materials.

177
Acknowledgements
Field work for this study was supported by collaborative project on Environmental Risks of
Pesticides and Development of an Integrated Pesticide Management System (IPMS) in Nepal
Considering Socio-economic Condition. The authors gratefully acknowledge the financial
support for fieldwork from the project and other support from team members of the project as
well as the local people who provided information. The authors are also thankful to Prof. Dr.
A. Herrmann and S. A. Schumann for their valuable comments and suggestions.
References
Baker, S. L.& Gyawali, B. K. (1994) Promoting Proper Pesticide Use in Nepal. Research
Report Series No. 28. Winrock International and Ministry of Agriculture, HMG, Kathmandu
CEAPRED (1999) Baseline Survey of Pesticides Use at Jhikhu Khola Catchment Area. Draft Report submitted to the Institute for Geography and Geoecology, Department of Physical Geography and Hydrology, Technical University of Braunschweig, Germany
Dahal, L. (1995) A Study on Pesticide Pollution in Nepal. Kathmandu: National Conservation Strategy Implementation Project, National Planning Commission, HMG, Kathmandu.
Herrmann, A.R.E.W., Schumann, S.A., Neupane, F.P., Niraula, B.B., Wiebelt, M., Khanal, N.R, Pujara, D.S. & Upadhyay, B.P. (2001) Chances of Protecting Middle Mountains Environments in Central Nepal from Pesticide Misuse Considering Socio-Economic Condition. In: T. Watanabe, S. Sicroff, N. R. Khanal & M. P. Gautam (eds). Proc. Internat. Symp. on the Himalayan Environments: Mountain Sciences and Ecotourism/Biodiversity, Kathmandu Nov. 2000, 246-260.
Klarman, W.L. (1987) Pesticide Use in Nepal. ARPP Consultancy Report No. 9 submitted to Winrock International Institute for Agricultural Development, US Agency of International Development, Kathmandu
Pujara D.S. (2000) Spatial Structure of Agricultural Landuse and its Performance in the Middle Hills of Nepal: A Case Study of Jaishidihi Watershed, Kabhre Palanchock District. Unpublished MA Dissertation, Central Department of Geography, TU, Kirtipur, Kathmandu

178
Fast estimation of pesticide risk potential on groundwater through the use of a dye tracing technique S. SCHUMANN Institute of Geoecology, Department of Hydrology and Landscape Ecology, Technical University Braunschweig, Langer Kamp 19c, 38106 Braunschweig, Germany
Abstract
Within the frame of the Research Project on IPMS Nepal (Herrmann, & Schumann 1999) a
series of dye tracing experiments was carried out, in order to identify preferential flow paths
from ponded agricultural fields towards groundwater and to estimate the transport of
pesticides along these paths.
The experiments were performed on the Nepalese governmental Horticulture Farm
Thamaghat in Jhikhu Khola Catchment (JKC), Kabhre District. There, the soil substrate is
loamy. A perched, isolated groundwater table establishes during monsoon time in a depth of
about 2,30 m below surface. This hydrogeologic situation is representative for khet areas
under cultivation in the JKC. As common within the whole area, the experimental fields were
terraced and ponding irrigation was used.
As a tracing substance the food-colour dye Vitasin Blue AE 90 was applied in combination
with a pesticide mix of Malathion, Metalaxyl, Dimethoate und Fenvalerate.
Results of the experiments are shown, and conclusions drawn on the usefulness of this type of
experiments for a first estimation of groundwater contamination risks through pesticide use in
agricultural activities.
Introduction
Application of pesticides in agricultural areas generally comes along with a potential risk of
groundwater contamination through the applied pesticides and their derivatives. In most
developing countries, little is known about the present state of groundwater contamination or
Landschaftsökologie und Umweltforschung 38 p. 178-189 Braunschweig 2002

179
possible risks. In Nepal, being one of these countries, an interdisciplinary research project on
environmental risks of pesticides (Environmental risks of pesticides and sustainable
development of integrated pesticide management for mountain areas of developing countries
considering socio-economic conditions and taking Middle Mountains, Central Nepal as an
example) was set up under the sponsorship of Volkswagen Stiftung Foundation (Herrmann &
Schumann 2001). Investigating the risk of a groundwater pollution was one aim within the
project's framework.
The project's field site was situated at approximately 50 km east of Kathmandu, at Tinpiple
and Tamaghat in Kabhre district, latter shown in Figure 1. Since the area is linked to
Kathmandu through the Arniko highway market orientated crops are grown, mainly rice,
potatoes and maize on khet (irrigated) land and tomatoes and maize on bari (rainfed) land.
The use of pesticides in Nepal has reached within the last decades a worrying level (Baker &
Gyawali, 1995) and a survey in the project area carried out by CEAPRED has shown high
application rates, more especially in khet, being among the highest in Nepal (CEAPRED
2000).
Fig. 1 Geographical situation of pilot test plots. Tinpiple is situated approximately 4 km from Tamaghat
0 10 20 30 km
Thamaghat:HorticultureFarm Panchkal

180
Despite high and very frequent pesticides application rates, samples of groundwater taken
during the project duration did not show contamination through recent applications. The
vadose zone showed a quasi non-detectable presence of pesticides. Possible reasons for the
non-detection of pesticides in the groundwater could be: (a) volatilisation of pesticides, (b) all
pesticides accumulate within the first few centimetres of soil, (c) the mean transit times
through the vadose zone are high, or (e) the pesticides are subject to such dilution in the
aquifer that they fall under limit of detection.
Hydrology and formulation of the problem
The hydrological regime of the area is controlled by monsoon with an average precipitation of
1276 mm for 1976-2000 at Tamaghat (Kansakar et al 2002). Monsoon, including pre-
monsoon, lasts roughly from April to September with it’s maximum normally in July.
Irrigation pattern is also controlled by monsoon since reservoirs do not exist.
A simplified hydrological model as valid for water-bound pesticide transport in khet is shown
in Fig. 2. Spraying of pesticides takes place such that amounts of the chemicals reach the soil
surface, i.e. the upper limit of the vadose zone. The soil substrate (at the site under
investigation) is loamy, with 45% sand, 37% silt and 18% clay in the first 20 cm. Organic
carbon amounts to about 1%. With depth soil composition varies between sand fraction by
40-58%, silt by 30-37% and clay by 12-22%, sand always dominating the substrate. When the
lands are irrigated, here always with the system of ponding irrigation, infiltration starts. The
infiltration flux (Q0’) is controlled through matrix flow and flow following preferential flow
paths. Infiltration determined with a double-ring-infiltrometre, shows rates as high as 150
mm/h during the first 5 minutes. It stabilises at 2 mm/h after 3.5 hours and drops finally to 0.6
mm/h after 22.5 hours. The classical sampling methods for pesticides in the vadose zone
consists of sampling with a N-min drill at depths until 90 cm below surface. Results of blank
samples which were taken in the area showed no presence of pesticides; samples taken during
monitoring after known application rates showed often pesticide concentrations close to
determination limit and of unusual distribution pattern (Vinke, 2002 personal
communication). During degradation experiments at the field site uncommon distribution
pattern with soil depth occurred (Interim Report 2001).

181
The phreatic zone of the area consists firstly of perched, isolated, aquifers which depend in
their thickness and spatial extension mainly on monsoon and irrigation pattern. The perched
aquifers may dry out completely during dry season, and be recharged again during wet season
and/or irrigation (Schumann et al. 2002). Therefore, the flux Q0’ ’ must be active during
Fig. 2 Simplified hydrological model of khet land as relevant for pesticide transport under ponding irrigation
INPUT
INTERCEPTIONVOLATILE LOSSES
QIRR
QIRR (IMP)
QR
ET IL
P PESTICIDE
IS
PONDIRR
EQO
QOI
SSZpor PFP USZpor PFP
QOII
AQUpor(frac) TEMP - FREE
AQUpor(frac) PER - CONF
QOIV
QOIII
PONDINGIRRIGATION WATER
VADOSE ZONESOIL WATER
PHREATIC ZONEtemporary, free GW
PHREATIC ZONEpermanent, confined GW
EXPORT
QIRR
QD
QIRRI
QSSZ
QUSZ
QPFP
QAQU
QAQUI QR
AQUpor(frac) Aquifer, porous (fractured) QAQU Groundwater FlowCONF Confined (AQU) QD Surface RunoffE Evaporation QFP Flux from Preferential Flow PathET Evapotranspiration QIRR Irrigation WaterFREE Free (AQU) QIRR(IMP) Irrigation Water Channel, importedGW Groundwater QM Flow by matric suctionIL Interception Loss QO Infiltration\Seepage FluxIS Interception Storage QR River WaterP Precipitation QSSZ Flux from Saturated Soil ZonePESTICIDE Pesticide Application QUSZ Flux from Unsaturated Soil ZonePER Permanent (AQU) SSZpor Saturated Soil ZonePFP Preferential Flow Paths TEMP Temporary (AQU)PONDIRR Irrigation Water, ponded USZpor Unsaturated Soil Zone
QM

182
irrigation recharging the aquifer. Below the perched, isolated aquifers a second, permanent
and confined aquifer lies. Classical sampling for pesticides in the phreatic zone is done by
sample withdrawal through wells or piezometres.
Since no pesticides could be detected in the aquifer and results of pesticide detection in the
soil were dissatisfying, a study on the vadose zone was set up, aiming on the quantification of
the infiltration flux into the vadose zone (Q0II) and from the vadose zone into the groundwater
(Q0III), and on the description of transport and transit flow paths and accumulation sites for
water and pesticides within the soil.
Experimental set-up
In principle, the set-up of the experiment aimed on a visualisation of flow pattern in the
ground and a sampling for pesticides along the visualised flow paths as well as in no-flow
sectors.
Visualisation was attained by the use of a dye tracer, Vitasin Blue FCF 90. The colour index
(C.I.) of the substance is 42090, it’s aqueous solubility is greater than 50 kgÿm-3 (Clariant
Fig. 3 Experimental set-up at tracer experimental site 1 at Tamaghat Horticulture Farm. Section for sampling after 3 and 14 days, and after 3 month respectively
3. Ponding
4. Sampling with Nmin-sampler
2. Application of dissolvedVitasin Blue FCF (blue)
1. Spraying of:Malathion,Meatlaxyl,DimethoateFenvalerate
5. Vertical transection ofthe vadose zone with aimon sampling
PONDIRR
SSZpor PFP USZpor PFP
AQUpor(frac) TEMP - FREE
QOIII
PONDINGIRRIGATION WATER
VADOSE ZONESOIL WATER
PHREATIC ZONE temporary,free GW

183
1999). According to a study by Flury & Flühler (1995) the adsorption coefficient (K) ranges
from 0.16 to 5.95 dm3ÿkg-1. K varies in the lower values for CaCO3-free soils. The soil found
at the experimental site was carbonate-free.
The experimental set-up is shown in Fig. 3, with running-phases indicated. For the
experiment, four experimental plots (2x1 metres) were prepared with Nepalese workers as
common for rice production. Then, in step 1 the four target compounds (Vinke et.al. 2002)
Malathion, Dimethoate, Fenvalerate and Metalaxyl were sprayed onto the top soil, using
common concentrations. They were equal to the concentrations applied during the
degradation experiments mentioned before. Thereafter, dissolved Vitasin Blue was applied
using a watering can aiming on a concentration of 8gÿl-1 after ponding the plots with 10 cm
water column (step 3).
After a waiting period of three and 14 days and three month respectively steps 4 and 5 were
carried out. Step 4 consisted of conservative sampling for pesticides with the N-min drill at
three places within the test plots, while step 5 included cutting a section at the centre part of
the test plots. This vertical section had a width of 1 m and a depth of up to 2.60 m. Besides
Fig. 4 Application of Vitasin Blue and ponding at experimental site

184
photographing, samples for pesticides and Vitasin Blue were taken along and besides the
indicated flow pattern.
The experiment was run on the grounds of Horticulture Farm, Thamaghat.
Fig. 4 shows the application of Vitasin Blue and ponding, Fig. 5 the sections after 3 days in
the part of conservative standardised sampling using a N-min drill.
Results and discussion
Here, the results valid for the first experimental plot shall be presented. Sampling for the plot
took place three days after the application of pesticides and Vitasin Blue. Field situation of the
section for the first 1.20 metre below surface is presented in Fig. 6. Here, bold outlined labels
indicate samples for pesticides and Vitasin Blue, and labels without margin samples for
Vitasin Blue only. In Table 1 the results for the pesticide concentrations of Fenvalerate,
Metalaxyl and Dimethoate are shown in µgÿkg-1. Generally the sample number increases with
depth in the soil profile.
Fig. 5 Sections after 3 days. View of standardised sampling technique holes (N-min drill)

185
It is remarkable that in great depths (2.20 and 2.40 m below surface) strong Vitasin Blue
concentrations were observed, and come together with concentrations of Metalaxyl and
Dimethoate. At 2.40 m also a non-quantifiable amount of Fenvalerate was detected.
Dimethoate and Metalaxyl appear in quantifiable amounts in the uplifted groundwater. This
Fig. 6 Selective sampling at a section up to a depth of 120 cm, three days after application. Numbers with margins stand for sampling for pesticides and Vitasin Blue, without margin for sampling for Vitasin Blue only. Dark soil parts indicate the presence of Vitasin Blue. Sample 12 (cf. Table 1) was taken at a blue spot in a depth of 2.40 m below surface
O 12: 2,40 m b.s.

186
groundwater corresponds to the water of the perched, isolated, aquifer which depends on
irrigation pattern. Accordingly, the flux Q0III
must have been active during the experiment
recharging the aquifer and transporting pesticides. Transport pattern do not exactly
correspond to water solubility, since after Vinke et al (2002) Metalaxyl (with 8 mg/l) is less
soluble than Dimethoate (with 25 g/l). However, Metalaxyl has proved to be more persistent
than Dimethoate (28:8 DT50 under laboratory conditions) and it could be, that degradation had
already diminished the amounts of Dimethoate under detection limits (samples 8, 9, 10) or
below quantification limit (sample 12). The lower concentrations of Dimethoate than
Metalaxyl in the upper two samples (1 and 2) support the assumption that degradation had
already started, i.e. especially that directly after spraying the concentration of Metalaxyl was
about 1/6 of the concentration of Dimethoate in the top soil.
The relations between Vitasin Blue and the pesticides in the 12 samples are shown in Fig. 7.
Fits are not too bad and show for Metalaxyl the best correspondence. Dimethoate, since
Tab. 1 Concentrations (µgÿkg-1) of pesticides in 12 soil samples, three days after application following selective sampling. Residue analysis by Bajrachaya K. & Vinke C.
Sample Fenvalerate Metalaxyl Dimethoateµg/kg µg/kg µg/kg
1 53 62 132 14 29 213 n.q. n.q. n.q.4 n.d. n.q. n.d.5 n.d. n.d. n.d.6 n.d. n.q. n.q.7 n.d. n.q. n.q.8 n.d. n.q. n.d.9 n.d. n.q. n.d.
10 n.d. n.q. n.d.11 n.d. 11 1112 n.q. 14 n.q.
[ng/L] [ng/L] [ng/L]uplifted GW n.d. 1 4
n.d.: not detectablen.q.: not possible to be quantified
Solubility +

187
already quite degraded shows the worst relation. In the section cut 14 days after application
the correspondence from Vitasin Blue to Metalaxyl is no longer given (not shown) since
degradation had also here too strong influences. Hence, no conclusions should be drawn from
Vitasin Blue concentrations to pesticide concentrations. For this detailed studies on
correspondence under different conditions, and specific for each pesticide would need to be
carried out.
However, selective sampling along flow pattern allows pesticide tracking. This has also been
shown by Reichenberger et al (2001) for pesticide tracking in Brasilian Oxisols using Vitasin
Blue as tracing substance.
Analysis of the samples taken by the N-min drill show for Fenvalerate and Metalaxyl
quantifiable amounts only up to 5 cm below surface and a non-quantifiable amount up to 20
cm. For Dimethoate only a non-quantifiable amount in the first 5 cm. In Fig. 5 can be seen
that the N-min drill did not remarkably hit the blue parts of soil where, according to the
selective sampling technique, the transported pesticides are found. Depths greater than 90 cm,
where high concentrations of pesticides still occur are not captured at all.
Conclusion
The presented experimental set-up discloses a rather fast and easily carried out first indication
for possible pesticide transport through the vadose zone. It furthermore reveals flow pattern,
-100
10203040506070
0.00 20.00 40.00 60.00
Vitasin Blau (mg/l)
Pes
tici
de
con
cen
trat
ion
(µµ µµg
/kg
)Dimethoate
Metalaxyl
Fenvalerate
Linear(Dimethoate)
Linear (Metalaxyl)
Linear(Fenvalerate)
Fig. 7 Relation between Vistasin Blue concentration and pesticide concentrations three days after application. A linear fit was applied

188
and allows indication for presence and importance of preferential flow in the substrate.
However, repetitions of sections longer than 14 days after application are not useful since
then degradation or leaching of pesticides might prevail. This, of course depends on applied
pesticides. Furthermore, pesticides seem to be transported mainly through preferential flow
paths, which are predominantly active after dry periods, when soils are dry, and become less
active with growing water content (Schumann et al 2002). Also Flury et al. (1995) observed a
slower transport of herbizides with growing soil water content in loamy soils as then matrix
flow outweighs preferential flow.
The method is extremely useful if depth of water table below surface is small. Using the
method might save one from carrying out medium-term observations concerning groundwater
pollution without results. It furthermore could explain pesticide whereabouts if balancing of
pesticides in field trials fails. The easy set-up for the method and the possibility that soil
samples can be deep frozen and then be transported to a pesticide analysis laboratory makes
the method useful for remote areas, developing countries or countries without a pesticide
laboratory.
The method should follow a first sample survey for pesticides in groundwater wells.
The method, at present state, does not allow a quantification of water flux or pesticide
transport. It is not possible to draw from Vitasin Blue concentrations to pesticide
concentrations. Further detailed studies should follow in order to refine the method and hence
enable the quantification of water-bound transport. The use of bromide could be helpful in
this context since it allows a quantification of water flux.
Acknowledgement
Funding of the work by Volkswagen Stiftung is highly appreciated.
Thanks deserve all Nepalese workers for physical strength and K. Bajrachaya and C. Vinke
for analysis of the pesticide samples.

189
References
Baker, S. L. & Gyawali, B. K. (1994) Promoting Proper Pesticide Use in Nepal. HMG Ministry of Agriculture (Nepal)/Winrock Internat. Report Series, 28, Kathmandu, Nepal
Clariant (1999) Sicherheitsdatenblätter gemäss 91/155/EWG Vitasin Blue AE 90. CEAPRED (2000) Socio-economic survey of the Jhikhu-Khola watershed. Unpublished
report. IPMS-Project Nepal, CEAPRED, Kathmandu Flury, M., Leuenberger, J., Studer B. & Flühler H. (1995) Transport of anions and herbicides
in a loamy and a sandy field soil. Water Resources Research 31 (4), 823-835 Flury, M. & Flühler H. (1995) Tracer Characteristics of Brilliant Blue FCF. Soil Science
Society of America Journal 59 (1), 22-27 Herrmann, A. & Schumann, S. (2002) Collaborative project on environmental risk of
pesticides and development of an Integrated Pesticide Management System (IPMS) in Nepal considering socio-economic conditions: status and perspectives. Proc. Internat. Workshop on Environmental Risk Assessment of pesticides and Integrated Pesticide Management in Developing Countries, Kathmandu Nov. 2001. Landschaftsökologie und Umweltforschung 38, Braunschweig, 38-48
Herrmann, A. & Schumann, S. (1999) Ein Forschungsansatz zu Umweltrisiken von Pestiziden und der nachhaltigen Entwicklung eines Integrierten Pestizid-Management (IPM) unter Berücksichtigung der sozioökonomischen Verhältnisse in Nepal. In: Proc. Braunschweig Congress GEOöKon ’99 14-16 Oct. 1999 (ed. by M. Flake, R. Seppelt & D. Söndgerath), Landschaftsökologie und Umweltforschung 33, Braunschweig, 235-245
Interim Report 1 January 2000-31 December 2000 (2001) Environmental risks of pesticides and sustainable development of integrated pesticide management for mountain areas of developing countries considering socio-economic conditions and taking Middle Mountains, Central Nepal as an example. Unpublished report, Institute of Geoecology, Technical University Braunschweig
Kansakar, S., Prajapati, S. & Pokhrel A. (2002) Hydrological and Meteorological Components in the Integrated Pesticide Management Project at Jaisidhi Khola, Tinpiple. Proc. Internat. Workshop on Environmental Risk Assessment of pesticides and Integrated Pesticide Management in Developing Countries, Kathmandu Nov. 2001. Landschaftsökologie und Umweltforschung 38, Braunschweig
Reichenberger, S., Amelung, W., Laabs, V., Pinto, A., Totsche, K.U. & Zech, W. (2001) Pesticide displacement along preferential flow pathways in a Brazilian Oxisol. Geoderma (in print)
Schumann, S., Stichler, W. & Prajapati, S.B. (2002) Underground water passages and runoff formation pattern in an irrigated khet catchment. Proc. Internat. Workshop on Environmental Risk Assessment of pesticides and Integrated Pesticide Management in Developing Countries, Kathmandu Nov. 2001. Landschaftsökologie und Umweltforschung 38, Braunschweig,. 190-204
Vinke, C., Kreuzig, R. & Bahadir, M. (2002) Analytical investigations on the fate of pesticides in soils of the Jhikhu Khola catchment. Proc. Internat. Workshop on Environmental Risk Assessment of pesticides and Integrated Pesticide Management in Developing Countries, Kathmandu Nov. 2001. Landschaftsökologie und Umweltforschung 38, Braunschweig, 265-275
Vinke, C. (2002) Personal communication

190
Underground water passages and runoff formation pattern in an irrigated khet catchment SYBILLE SCHUMANN Institute of Geoecology, Department of Hydrology and Landscape Ecology, Technical University Braunschweig, Langer Kamp 19c, D-38106 Braunschweig, Germany WILLIBALD STICHLER Institute of Hydrology, Research Centre for Environment and Health (GSF), Ingolstädter Landstr. 1, D-85764 Neuherberg, Germany SHIVA BHAKTA PRAJAPATI Department of Hydrology and Meterology, Babar Mahal, G.P.O. Box 406, Kathmandu, Nepal
Abstract
Since early 1999, within the frame of the Research Project on IPMS Nepal, monitoring for
groundwater levels and environmental isotopes is carried out for three distinct hydrological
systems. The monitoring is combined with artificial tracing experiments. All three catchments
are located at 50 km east of Kathmandu and are built up of loamy and sandy substrates and
their hydrological regimes are controlled by monsoon climate and distinct irrigation pattern.
Here, results on the hydrology of one sample-catchment, khet, focussing on water passages
and runoff-formation shall be presented. In the khet catchment intensive ponding irrigation
takes place during the cultivation of rice, and channel irrigation during the cultivation of
potatoes and tomatoes.
Discharge reactions in the catchment are fast and event water consists mainly of direct run-
off. Discharge concentration times are around one hour.
It can be confirmed that the turnover of underground water is minimal and hence transport of
solutes through the unsaturated zone also. Fast mass transport takes place through preferential
flow paths followed up by slow mass transport through matrix flow. However, transport
quantity and velocity depend on antecedent soil moisture where lower soil moistures favour
faster and greater mass transport.
Landschaftsökologie und Umweltforschung 38 p. 190-204 Braunschweig 2002

191
Introduction
With the main aim on getting to know more about environmental risks of pesticides in
agricultural market-oriented areas of Nepal, an interdisciplinary research project
(Environmental risks of pesticides and sustainable development of Integrated Pesticide
Management System (IPMS) for mountain areas of developing countries considering socio-
economic conditions and taking Middle Mountains, Central Nepal as an example) was set up
in 1998 sponsored by the Volkswagen Stiftung Foundation (Herrmann & Schumann 1999,
2002).
As the project’s field sites and therefore pilot area for the study, two catchments and one
control area were chosen, all situated in Kabhre district within the Jhikhu-Kola catchment at
approximately 50 km east of Kathmandu. One catchment, the khet catchment represents
agricultural activities under irrigated conditions (ponding and channel irrigation) while the
other catchment, bari, represents rain-fed cultivation. Both areas belong administratively to
Tinpiple, which is shown in Fig. 1.
Fig. 1 Geographical situation of the khet-catchment, approximately 50 km east of Kathmandu.
0 10 20 30 km
Tinpiple :
Khet-catchment

192
In order to specify on risks of pesticides for the environment and to develop a sustainable
pesticide management system, a quantification of water-bound pesticide transport is worth
striving for besides other results. Hence a hydrological study was set up to evaluate and to
quantify the turnover of water in the terraced agro-ecosystems and to use this as the necessary
basis for the transport estimation. Here, results of the hydrological study concerning runoff
formation pattern and underground water movement for the khet catchment will be presented.
Measuring network and hydrological study
The study area lies in the middle mountains of Nepal and the hydrological regime of the area
is controlled by monsoon. The average annual precipitation (years 1976-2000) for the station
Tamaghat, also situated in Jhikhu-Kola catchment, amounts to 1276 mm (Kansakar et al
2002). In the year 2000 the annual precipitation in khet, measured using a full automatic rain
gauge, reached 1170 mm. Precipitation pattern is shown in Fig. 5 on daily basis.
Fig. 2 Simplified topographic map of Tinpiple khet basin with measuring network.
A lt itu d e :
86 6 - 8 8 788 7 - 9 0 790 7 - 9 2 892 8 - 9 4 994 9 - 9 7 077 0 - 9 9 099 0 - 1 0 10
K he t M o d e ll in g A re a
Le g e n d :
��
��
�
�
�
��
Iso to p e S am p l e
S oi l M o is tu re ( TD R )
G ro u n d wa te r W el l
C l im a tic S ta t io n
D isch a r g e W e ir
S oi l S u c tio n C a n d l e
�
���
�
����
Pre c ip ita ti on
W in d V eloc i ty
N e t R a dia t ion
Ev ap ora t ion P an
G lo bal R a d ia t ion
Soi l Te m pe ratu res
A ir T e m p. + H u m idit y
P re c ip ita ti on (D a ily )
N PM C
36 3 6 6 3
36 3 6 6 3
36 3 6 6 6
36 3 6 6 6
3056
727 3056727
3056
730 3056730
������ �
�
� ��� �����
� � � � � � � �� � � ��� � � � � � � �� � � � � � � � �� � � � � � � � � � � � � � �� � � � � � � � � � �� � � � � � � � �� � � � � � � � � �� � � � � � � � � �� � � � � � � � �� � � � � � � �� � � � � � �� � � � � � � �� � � � � � � �� � � � � � � � � � �� � � � � � � �� � � � � � �� � � � � � �� � � � � � � � �� � � � � � �� � � � � � � � �� � � � � � � � � �� � � � � � � � � � � � � � � � � � �� � � � � ��� � � � �� � � � �� � � � � � �� � � � � � � �� � � � � � � � � �� � � � � � � � � � � � � �� � � � � � � � �� � � � � � � � � � �� � � � � � � � � � � � � �� � � ��� � � � � � � � � � �� � ��� � � � � � � � �� � � � � � � � � � � � � � � �� � � � � � � � � � � � � � � � �� � � � � � � � � � � � � � � � � � � � �� � � � � � � � � � �� � � � � � � � ��� �� � � � � � ��� � �� � � � � � ��� � �� � � � ��� � �� � � � � � �� � �� � �� � � �� � � �� � � �� � � � � � �� � � � � � � �� � � � � � � �� � � � � � �� � � � � �� � � � � � �� � � �� � � � �� � � � �� � � � � �� � � � �� � � � �� � � � � � � �� � � � � � � � � � � � � � � � � � � �� �� �� � �� �� �� �� �� �� �� �� �� � �� �� �� �� ��� �� �� ��� �� �� �� �� �� �� �� �� �� �� �� �� �� � �� �� �� �� �� �� �� �� �� �� �� �� �� �� �
NP Gi
NP NC
Ra dia tio nPre ci pita tio nWi nd Ve lo cityNe t R ad iat ion
Ev ap ora tio n P a n
So il T em pe ra tu resTh erm o -hy gr o-G ra phPre ci pita tio n (D aily )
NP BDNP BFNP BBNP BENP BANP BC NP GS
NP GgNP GG
NP GiNP GI
NP GK
NP G ENP G TNP G RNP G Y
NP G X
NP G D
NP G d
NP G H
N PG g
N PG iN PG I
N PG K
N PA C
N PA E
N PG U
N PG V
N PG D
N PG d
N PG H
N PA K
N PA D
36 3 2 5 0
36 3 2 5 0
36 3 5 0 0
36 3 5 0 0
36 3 7 5 0
36 3 7 5 0
36 4 0 0 0
36 4 0 0 0
3056
750 3056750
C lim at ic S ta t io nTra c er E x pe rim e nta l
S ite
���� ��������
��
�� ���� �� ��
��
��
�� ���� �� ������ ��������
N PG T N PG RN PG Y
N PM A
N PG E
N PG X
N PG SN PB D
N PB FN PB E
N PB BN PB A
N PB C
364 006
364 006
364 008
364 008
364 010
364 010305
671
6 30567
16
305
671
8 30567
18
305
672
0 30567
20

193
Irrigation in khet follows the water availability of the area, i.e. since no reservoirs exist,
irrigation reaches it’s maximum during monsoon and is nil in the month before pre-monsoon.
Accordingly the agricultural activity is set with its highlight from July to October with the
growth of rice, followed by potatoes (channel irrigation) and then February to June with
maize.
INPUT
INTERCEPTIONVOLATILE LOSSES
QIRR
QIRR (IMP)
QR
ET IL
P
IS
POND IRR
EQO
QOI
SSZ por PFP USZ por PFP
QOII
AQU por(frac) TEMP - FREE
AQU por(frac) PER - CONF
QOIV
QOIII
PONDINGIRRIGATION WATER
VADOSE ZONESOIL WATER
PHREATIC ZONEtemporary, free GW
PHREATIC ZONEpermanent, confined GW
EXPORT
QIRR
QD
QIRRI
QSSZ
QUSZ
QPFP
QAQU
QAQU I Q R
AQU por(frac) Aquifer, porous ( fractured) QAQU Groundwater FlowCONF Confined (AQU) QD Surface RunoffE Evaporation QFP Flux from Preferential Flow PathET Evapotranspiration Q IRR Irrigation WaterFREE Free (AQU) Q IRR(IMP) Irrigation Water Channel, importedGW Groundwater QM Flow by matric suctionIL Interception Loss QO Infiltration\Seepage FluxIS Interception Storage QR River WaterP Precipitation QSSZ Flux from Saturated Soil ZonePESTICIDE Pesticide Application QUSZ Flux from Unsaturated Soil ZonePER Permanent (AQU) SSZ por Saturated Soil ZonePFP Preferential Flow Paths TEMP Temporary (AQU)POND IRR Irrigation Water, ponded USZ por Unsaturated Soil Zone
QM
Fig. 3 Conceptual hydrological model as valid for khet.

194
In order to study the hydrological system a measuring network for climatic parameters,
groundwater levels and discharge was set up on catchment scale. Furthermore, a measuring
network was arranged on plot scale focussing on vertical transport processes. Here, tracer
studies were carried out and were monitored by piezometres and soil suction candles. Soil
moisture, using the Time Domain Reflectors method (TDR) was also monitored. The latter
plot is termed tracer experimental site (TES). The complete measuring network for khet is
shown in Fig. 2, based on a simplified topographic map. Besides physical data collection
water samples of precipitation, discharge and groundwater were taken and analysed for stable
isotopes oxygen-18 (18O) and deuterium (2H) in order to quantify the turnover of water in the
catchment. The sampling sites for isotopes are also indicated in Fig. 2.
The most important water fluxes of the khet catchment are, according to findings of the
hydrological study, representable in a conceptual hydrological model as shown in Fig. 3.
Fig. 4 shows the discharge at station NPAK (outlet weir) in combination with precipitation at
station NPNC. Both time series have an hourly resolution and are plotted for the period
Fig. 4 Hourly discharge (l/s) at catchment outlet (NPAK) vs. hourly precipitation (mm) at khet climatic station (NPNC).
Date
17.7.00 24.7.00 31.7.00 7.8.00 14.8.00 21.8.00 28.8.00 4.9.00
17.7.00 24.7.00 31.7.00 7.8.00 14.8.00 21.8.00 28.8.00 4.9.00
Hou
rly P
reci
pita
tion
[mm
]
0
2
4
6
8
10
12
14
16
18
20
Hou
rly D
isch
arge
[l/s
]
0
100
200
300
400
500
600
700
Precipitation NPNC (mm)Discharge NPAK (l/s)

195
17.07.00 to 07.09.00, i.e. for mid-monsoon 2000. Cross-correlations for the same period
regarding discharge (dependent) on precipitation (independent) show the maximum
correlation of 0.7 at a time lag of one hour and 0.6 at a time lag of two hours. Thereafter the
dependence decreases rapidly. With nil hours time lag the correlation coefficient equals to
0.4. The runoff formation in the khet-stream is therefore highly dependent on precipitation
pattern, and reaction time is around one hour to the less. This is typically either for irrigated
systems since here the pre-event antecedent soil moisture is generally high, or typically for
systems with low infiltration capacities. Latter differ in khet following data from double-ring
infiltrometre experiments between 3 and 0.01 mm/h, and constancy is reached after maximal
30 minutes.
Fig. 5 Groundwater tables (in metres below surface) of selected piezometres (NPG*) in combination with daily precipitation (mm) at khet climatic station NPNC. In the legend the depth of well filter in metres below surface is indicated.
Date
1.9.99 1.11.99 1.1.00 1.3.00 1.5.00 1.7.00 1.9.00 1.11.00 1.1.01 1.3.01 1.5.01 1.7.01
Dai
ly p
reci
pita
tion
[mm
]
0
10
20
30
40
50
60
70
80
90
100
110
120
Wat
er ta
ble
[m b
elow
sur
face
]
-3.0
-2.5
-2.0
-1.5
-1.0
-0.5
0.0
0.5
NPNC (mm/day) NPGD (3.35-4.45 m b.s.) NPGG (3.55-4.10 m b.s.) NPGI (2.05-3.15 m b.s.) NPGK (1.80-2.55 m b.s.) NPGH (1.25-2.35 m b.s.) NPGR (1.55-2.05 m b.s.) NPGT (0.45-0.95 m b.s.) NPGY (0.5-1.0 m b.s.) Land surface

196
Reactions on groundwater levels on daily precipitation are shown in Fig. 5. Wells NPGD to
NPGH were monitored with weekly resolution while NPGR to NPGY were subject to
measurements every three days. The following deserves attention:
• General trend of high water tables July to October. Drop of water tables from October
onwards with a minimum in April. Thereafter increasing water tables until July.
• A general reaction of all wells on monsoon with a time lag of approximately six weeks,
differing slightly for the wells. Groundwater levels increase by 1 metre in average. After
end of monsoon the water levels decrease again in all wells, delayed by approximately
four weeks.
• Well NPGH (filter section 1.25 – 2.35 m below surface) shows very strong reactions. It
falls dry during the dry period and increases in water level by two meters following
monsoon 2000. NPGT (filter section 0.45 – 0.95 m) reacts accordingly. It falls dry during
the dry period and reacts onto monsoon with an increase in water table by one metre
standing under such pressure that the groundwater level rises above land surface.
• During dry season some fast reacting wells show rises in water tables, which are
independent from precipitation, but appear similarly to the rise in the follow up of
monsoon (NPGD, NPGH). Wells show fast, short term water level rises more especially
during dry season and lessened during wet times. These reactions must be due to
irrigation.
The annual groundwater variations with time delayed monsoon reaction as well as the
observed short-term reactions on heavy storm events and irrigation may be due to a
compression of the capillary fringe, mass transport or the combination of both. It should be
noted, that reaction times are so short that mass transport under these circumstances should be
caused by movement through preferential flow paths.
Isotope studies on catchment scale
In order to get results on hydrological turnover in khet, isotopic studies were carried out. The
isotopic background of a hydrological system is defined by the 18O:16O and 2H:1H ratios
related to an international standard V-SMOW and expressed as the deviation δ [‰] from the
standard (Moser & Rauert 1980). The δ values are found to be quite stable in groundwater and

197
vary in precipitation according to the origin of the precipitation. Hence, the isotopic content of
discharge varies according to the ratio of base flow to direct runoff.
Fig. 6 shows the Global Meteoric Water Line (GMWL) as well as the Local Meteoric Water
Line (for climatic station NPNC) and the water line for the groundwater samples (NPG*).
With a slope below 8 both local dependencies indicate evaporation influence. It can be well
noted that the groundwater data is clustered while discharge and precipitation data are spread
δ18O [‰]
-20 -10 0 10
δ2 H [‰
]
-200
-150
-100
-50
0
50
100
NPNC (18O) vs NPNC (2H) NPNC Meteoric Water Line (f(x)=7.87x+7.00)NPAK (18O) vs NPAK (2H) NPG* (18O) vs NPG* (2H)NPG* Water Line (f(x)=7.28-0.05)Global Meteoric Water Line (f(x)=8x+10)
Fig 6 δ2H to δ18O relation for precipitation (NPNC), discharge at outlet (NPAK) and groundwater (NPG*, several piezometres) in khet catchment. The Global Meteoric Water Line and the Local Meteoric Water Line (NPNC) as well as the Water Line for Groundwater are also shown.

198
thus indicating higher variations. This is followed up by Figure 7, which shows the isotopic
variation δ18O variations in discharge and groundwater. The isotopic variation in δ2H follows
the same course (not shown).
Attention should also be paid to the following: The 18O contents of precipitation are high
during pre-monsoon and change to lower values with the central monsoon precipitation
events. This can be attributed to dominant isotopically heavy tropical oceanic air moisture that
precipitates at the beginning during less intensive and persistent rain events, followed by more
heavy rain showers out of isotopically lighter continental air masses during high monsoon.
From the isotopic evaluation the following results can be drawn: The discharge reacts
isotopically on every precipitation event, which stands for a high proportion of direct runoff
Fig 7 δ18O values for precipitation (NPNC), discharge (NPAK) and groundwater (NPG*; several piezometres) from 01.07.99 to 01.08.01. Daily precipitation sums (mm) are also shown.
Date
01.07.99 01.11.99 01.03.00 01.07.00 01.11.00 01.03.01 01.07.01
Pre
cipi
tatio
n [m
m]
0
10
20
30
40
50
60
70
80
90
100
δ18O
[‰] N
PA
K, N
PN
C a
nd N
PG
*
-20
-15
-10
-5
0
Precipitation NPBC (mm)NPAK (18O)NPGD (18O) NPGG (18O) NPGH (18O) NPGI (18O) NPGK (18O) NPGR (18O) NPGT (18O) NPGY (18O) NPNC (18O)

199
in the discharge at the khet catchment outlet. In groundwater samples an isotopic change can
only be noted after strong precipitation events like on 20.10.99 with 82mm WC, and during
irrigation events, i.e. for NPGD in January 2000. A combination of pressure transmission and
mass transport must be responsible for groundwater level rises.
Tracer studies on plot scale
For the tracer studies on plot scale, two experiments with deuterium (2H) are presented in Fig.
8 showing the tracer avulsion (in δ2H [‰]) in soil water samples at different depths. Both
experiments took place on the same plot and with an identical application quantity. It is
important to note that the times for tracer injection are different. One was started at mid-
Date
01.09.99 01.01.00 01.05.00 01.09.00 01.01.01
δ2 H [‰
]
-100
0
100
200
300
400
500
NPBA - 15 cm NPBB - 30 cm NPBC - 60 cm NPBD - 100 cm NPBE - 130 cm NPBF - 160 cm
Mid-MonsoonInjection: 03.09.99
Beginning of MonsoonInjection: 16.07.00
Fig 8 Deuterium (δ2H [‰]) breakthrough curves for tracer experiments started at plot scale in khet catchment. The first experiment was started on 03.09.99 in mid-monsoon, while the second was started on 16.07.00 at the beginning of monsoon 2000. In both experiments one litre of 86% D2O was applied, and the test plot thereafter ponded as under rice cultivation.

200
monsoon 1999 with an accordingly high antecedent soil moisture (~40 vol%). The second one
was started at the beginning of monsoon 2000 with little antecedent soil moisture (~20 vol%).
In both experiments the tracer was applied first, thereafter the plot was ponded similar to
conditions during rice cultivation.
Fig 9 Deuterium (δ2H [‰]) breakthrough curves at plot scale for the experiment started at the beginning of monsoon 2000. Shown are deuterium concentrations in soil water samples extracted through soil suction candles. The experiment was combined with application of a pesticide-mix of Dimethoate, Metalaxyl and Fenvalerate. Sampling took place at four times. Results for the pesticide concentrations [ng/l] are shown in the lower plots for soil suction candles installed at 15 and 160 cm below surface.
Date
24.07 21.08 18.09 16.10 13.11 10.07.00 07.08.00 04.09.00 02.10.00 30.10.00
δ2 H [‰
]
-100
0
100
200
300
400
500
NPBA - 15 cm NPBB - 30 cm NPBC - 60 cm NPBD - 100 cm NPBE - 130 cm NPBF - 160 cm
Beginning of MonsoonInjection: 16.07.00
Date
01.08.00 01.10.00
δ2 H [‰
]
-100
0
100
200
300
400
500
0
50
100
150
200
NPBA - 15 cm Dimethoate Metalaxyl Fenvalerate
Date
01.08.00 01.10.00
-50
-45
-40
-35
-30
-25
-20
Con
c. P
SM
[ng/
l]
0
5
10
15
20
25
30
35
NPBF - 160 cm Dimethoate Metalaxyl Fenvalerate

201
Here three results should be noted. When the experimental start-off falls under dry conditions
the transport process is faster than under constantly wet conditions. Furthermore the
maximum concentrations reaching down into the soil are higher and total mass transport into
the deeper soil greater. All breakthrough curves in depths greater than 15 cm indicate a matrix
flow with velocities of about 10-20 mm per day. During wet conditions most tracer substance
gets stuck within the first 15 cm.
The second experiment (year 2000) was combined with the application of a pesticide mix of
Malathion, Metalaxyl, Dimethoate and Fenvalerate. Results of the deuterium breakthrough in
combination with pesticide appearance are shown in Fig. 9 for soil water at 15 cm and 160
cm. Due to restriction in the number of analysable pesticide samples only four sampling times
could be realised. The results do not allow any conclusion on the correspondence of
deuterium breakthrough curves with pesticide breakthrough curves. However, they clearly
indicate that pesticides, more especially Dimethoate and Metalaxyl are transported with water
fluxes into the soil. Malathion has not been detected at all in the collected soil water samples.
Fig. 10 Deuterium (δ2H [‰]) breakthrough curves at plot scale for the experiment started at the beginning of monsoon 2000. Shown are deuterium concentrations in groundwater samples (NPG*) taken through scooping. In the legend the depth of well filter in metre below surface is indicated.
Beginning of MonsoonInjection: 16.07.00
Date
24.07 21.08 18.09 16.10 13.11 10.07.00 07.08.00 04.09.00 02.10.00 30.10.00 27.11.00
δ2 H [‰
]
-200
0
200
400
600
800
1000
1200
NPGE (2.55-3.05 m b.s.) NPGR (1.55-2.05 m b.s.) NPGS (2.10-2.60 m b.s.) NPGT (0.45-0.95 m b.s.) NPGX (0.95-1.45 m b.s.) NPGY (0.5-1.0 m b.s.)
Beginning of MonsoonInjection: 16.07.00

202
This corresponds to the findings by Vinke et al. (2002), that Malathion disappears most
rapidly. Interesting is also the behaviour of Fenvalerate which does not appear in any depth at
any sampling date except on 26.11.01, i.e. after 4 month in 160 cm.
Fig. 10 shows the deuterium breakthrough curves (in δ2H [‰]) for the piezometre (NPGR,
NPGT, NPGX and NPGY) on the test plot and for piezometres located topographically above
(NPGE) and below (NPGS) the test plot. Samples were taken by scooping every three days.
Reaction in NPGT and NPGR are within one day (sampling on 17.07.00) while in NPGY and
NPGX reaction takes place within two to three days (sampling on 20.07.00 shows deuterium,
while sampling on 07.07.00 shows none). Deuterium loss from the piezometres with time
shows an exponential course, indicating less dilution in piezometre NPGR (filter depth 1.55-
2.05 metre) than in the surface close piezometres NPGT,-X and –Y. The piezometres above
and below the test plot do not show changes in deuterium concentrations.
Sampling for pesticides in the same piezometres show on 17.07.00 in NPGT,-X and-Y
considerable Dimethoate and Metalaxyl concentrations and low concentrations on Malathion
and Fenvalerate. Unfortunately NPGR was not sampled. Until 22.09.00 Dimethoate is
detectable in all four piezometres, and on 26.11.00 only Dimethoate can be detected in
NPGR. The observed fast reactions in highly elevated deuterium and in raised pesticide
concentrations can only be explained with transport through preferential flow paths, which
were active during the beginning of the experiment. Comparable active preferential flow paths
and transport of water and pesticides within three days down to groundwater level has also
been shown for similar conditions by Schumann (2002). In latter experiments, which took
place at the control area of the project, water flow was visualized by a dye tracer (Vitasin
Blue FCF 90) and sampling took place along the flow paths down to the uplifted groundwater
table at 2.40 m below surface.

203
Conclusion
The hydrological investigations show that the turnover of subsurface water in khet land is
slow. On precipitation events a fast discharge reaction of time lag around one hour occurs,
formed mainly by direct flow, exporting most of the event water immediately from the
catchment. Groundwater table reactions are, to a vast extend, caused by pressure transmission
effects. However, during strong precipitation events and regular ponding irrigation mass
transport occurs also. Latter is faster and total mass transport greater, the lower the antecedent
soil moisture is.
It seems that the first transport processes under low antecedent soil moisture occur through
preferential flow paths until soil swelling closes them up. Thereafter, and under high
antecedent soil moistures mass transport occurs under matrix flow with seepage velocities of
about 10-20 mm per day. Pesticides have proven to fall relevantly under the occurring mass
transport. This result is in line with the findings of Schumann (2002) and Apel (2002).
However, mass transport is so small that under the given circumstances the risk of
groundwater pollution through pesticides can be estimated as little.
Acknowledgement
Funding of the work by Volkswagen Stiftung is highly appreciated. Thanks deserve Mrs. K.
Bajrachaya for pesticide sample preparation work and Mrs. C. Vinke for analysis.

204
References
Apel, H. (2002) Risk Assessment of Pesticides in the Mid-Hills of Nepal - Environmental Fate and Population Dynamics Modelling. PhD Thesis, Nat. Sciences Faculty Technical University Braunschweig, 127pp. (Landschaftsökologie und Umweltforschung 41, Braunschweig)
Herrmann, A. & Schumann, S. (1999) Ein Forschungsansatz zu Umweltrisiken von Pestiziden und der nachhaltigen Entwicklung eines Integrierten Pestizid-Management (IPM) unter Berücksichtigung der sozioökonomischen Verhältnisse in Nepal (Research concept for environmental risks of pesticides and sustainable development of an IPM considering socio-economic conditions in Nepal) . In: Umweltanalyse – Dynamik natürlicher und anthropogener Systeme und ihre Wechselwirkungen (Proc. Braunschweig Congress GEOöKon ’99 14-16 Oct. 1999. Landschaftsökologie und Umweltforschung 33, Braunschweig, 235-245
Herrmann, A. & Schumann, S. (2002) Collaborative project on environmental risks of pesticides and sustainable development of Integrated Pesticide Management System (IPMS) in Nepal considering socio-economic conditions Proc. Internat. Workshop on Environmental Risk Assessment of pesticides and Integrated Pesticide Management in Developing Countries, Kathmandu Nov. 2001. Landschaftsökologie und Umweltforschung 38, Braunschweig, 38-48
Kansakar, S., Prajapati, S. & Pokhrel, A. (2002) Hydrological and meteorological components in the Integrated Pesticide Management Project at Jaisidhi Khola, Tinpiple. Proc. Internat. Workshop on Environmental Risk Assessment of pesticides and Integrated Pesticide Management in Developing Countries, Kathmandu Nov. 2001. Landschaftsökologie und Umweltforschung 38, Braunschweig, 82-89
Moser, H. & Rauert, W. (eds) Isotopenmethoden in der Hydrologie (Isotope methods in hydrology). Gebr. Borntraeger, 400pp.
Schumann, S. Fast estimation of pesticide risk potential on groundwater through the use of a dye tracing technique. Proc. Internat. Workshop on Environmental Risk Assessment of pesticides and Integrated Pesticide Management in Developing Countries, Kathmandu Nov. 2001. Landschaftsökologie und Umweltforschung 38, Braunschweig, 178-189
Schumann, S., Herrmann, A., Stichler, W. & Prajapati, S.B. (2001) Tracer hydrological investigations in a small irrigated agricultural basin in Nepal to evaluate environmental risks of pesticides. Proc. XXXI IAH Congress on New Approaches to Characterising Groundwater Flow Munich 10-14 Sept. 2001, Vol. 1, Balkema, 189-194
Vinke, C., Kreuzig, R. & Bahadir, M. (2002) Analytical investigations on the fate of pesticides in soils of the Jhikhu Khola catchment. Proc. Internat. Workshop on Environmental Risk Assessment of pesticides and Integrated Pesticide Management in Developing Countries, Kathmandu Nov. 2001. Landschaftsökologie und Umweltforschung 38, Braunschweig, 265-275

205
Socio-economic contexts on pesticide use in Nepal PURNA LAL SHRESTHA & FANINDRA PRASAD NEUPANE Center for Environmental and Agricultural Policy Research, Extension and Development (CEAPRED), Shantibasti, Lalitpur District, Nepal
Abstract
Two socio-economic surveys were conducted in Jhiku Khola Watershed (JKW) area in
Kabhrepalanchok district of Nepal for understanding the general socio-economics, farming
systems and pesticide use in agriculture. An average household owns 0.60 ha of land. Most of
the households depend on agriculture for their livelihood and use pesticides for protecting
their crops from various pest attacks. Rice, maize, wheat and mustard are treated 1 - 3 times
per crop cycle whereas potato, tomato, cabbage, bittergourd and cucumber are treated 2 - 15
times. Farmers have low knowledge on pesticides and their uses, as a result, general
precautionary measures are also lacking. The enforcement of pesticide regulation is very poor.
The share of pesticides in the cost of production of various crops grown ranges from 0 %
(wheat) to 8.41 % (bittergourd). This share being moderate and economically justifiable has
stimulated the farmers to use pesticides without thinking their negative impact on human
health and the environment. Increasing the awareness of farmers and enforcement of pesticide
regulations are needed to improve the situation.
Introduction
Nepal with an area of 147181 square kilometer is a country inhabited by 23.2 million people.
Agriculture still plays an important role in its national rural economy with its contribution to
Gross Domestic Product going down to 38 percent. The 2001 National Census (CBS, 2001)
has put the percentage of population dependent on agriculture and living in the rural area at 76
and 84, respectively. Furthermore, commercialization of agriculture is central to accelerated
economic growth and poverty reduction in a country like Nepal, which is an overwhelmingly
rural and agrarian economy. However, commercialization entails high input high-value
commodities based intensification of agriculture, which often leads to increased use of
pesticides. Inappropriate and excess use of chemical pesticides could have hazardous impact
Landschaftsökologie und Umweltforschung 38 p. 205-223 Braunschweig 2002

206
on human being, livestock and environment. Therefore, it is important that effective and
ecologically sound crop protection programs that combine various alternative pest control
measures, including mechanical, biological and chemical methods, should be implemented to
minimize harmful effects of toxic pesticides. Chemical pesticides should be used only as a last
resort. This requires promotion of appropriate crop protection technology and pest
management strategy, and increased awareness of the farmers.
In this context, a research project entitled "Environmental Risks of Pesticides and Sustainable
Development of Integrated Pesticide Management (IPM) for Mountain Areas of Developing
Countries considering Socio-economic Conditions and taking Middle Mountains, Central
Nepal as an example (DEVELOP IPM NEPAL)" (Herrmann, 1997) was implemented by
CEAPRED in collaboration with the Technical University of Braunschweig (TUBS),
Germany, in JKW area [Ward No. 4, 5, 6 and 9 of Panchkhal Village Development
Committee (VDC)] of Kabhrepalanchok district of Nepal. The objectives of the research
project were to understand the general socio-economics, farming systems and use of
pesticides in agriculture at the research site. Two socio-economic surveys were conducted in
connection (the first during May – September 1999 and the second during 4 – 13 March
2001).
Methodology
Selection of sample site
Since JKW area was chosen as the experimental site, the site for the survey was pre-
determined. The collaborating institutions (CEAPRED and TUBS) agreed that a total of 200
households in the JKW area would suffice to generate the required information. Hence a
sample size of 200 was fixed. For this purpose, JKW area was divided into Lower Catchment
Area (LCA) comprising Ward No. 4, 5 and 6 and Upper Catchment Area (UCA) comprising
Ward No. 9 of Panchkhal VDC to account for the ecological/environmental diversity of the
area. Since the site selection for the first survey was purposive, this study site may not
represent the mid-hills of Nepal. However, it represents the numerous micro-ecological belts
with JKW characteristics in the region.

207
Training of technical staff
The first survey was carried out by the technical staff of District Agriculture Development
Office (DADO) Kabhrepalanchok. They were given a four-day training by a Socio-economist
of CEAPRED. The second survey was conducted by CEAPRED technical staff. They were
also oriented to conduct the survey to solicit quality information.
Selection of sample farmers/households
A total of 200 randomly selected households (10 % of the total households based on the
voters' list provided by the Panchkhal VDC and Ward Offices) were interviewed during the
first survey using pre-tested structured questionnaire. Accordingly, 200 households [(80 in the
LCA (3 in Ward No. 4, 20 in Ward No. 5 and 57 in Ward No. 6) and 120 in the UCA (Ward
No. 9)] of Panchkhal VDC were interviewed during the first survey. Landless households
were not included in the sample.
Sample households selected for the first survey and their land holdings formed the basis for
the selection of farmers for the second survey. Two hundred farmers interviewed during the
first survey were classified into small, medium and large farmers using National Planning
Commission norms. The TUBS and CEAPRED agreed to conduct second socio-economic
survey of 50 (25 %) of 200 farmers. Fifty households were selected using Probability
Proportional to Size (PPS) technique to represent VDC Ward as well as different categories of
farmers from among the 200 farmers interviewed during the first survey. As in the first
survey, farmers interviewed in the LCA and UCA during the second survey constituted 40 %
and 60 % of the total (50). Accordingly, catchment area-wise/Ward-wise and strata-wise
number of farmers interviewed during the second survey is given in the Table below.
Results
Households and population
The number of households surveyed during the first survey comprised 1320 persons. This
translated into a family size of 6.6 persons per household. At the aggregate level, there are
more female than male (97.3 male per 100 female). However, sex ratio is more unbalanced in

208
LCA (93.4 male for every 100 female).
Caste-ethnicity and population
Brahmin and Chhetri constituted 40 percent of sampled households. Newar was the second
dominant group accounting for 23 percent of households surveyed, but is predominant in the
UCA. Occupational castes (Kami, Damai and Sarki) constitute the third largest caste-ethnic
group in the area. Together they share a little more than 14 percent of the sample population
but are confined to the UCA. In the LCA, Danuwar is the second largest caste-ethnic group
after Brahmin and Chhetri. Other caste people residing in the area are Tamang and Sanyasi.
Distribution of population by age
The sample populations have been grouped into three classes: less than 15 years, 15 - 59 years
and 60 years and above. The percentages of economically active population (15 - 59 years)
for the LCA and UCA are 55.9 and 53.4 respectively. Younger age population (less than 15
years) does not vary across the settings but the UCA has slightly higher percentage of female
children (40.7 %) than is the case for the LCA (37.3 %). However, the percentage of elderly
population (aged 60 and above) is more in the LCA (7.9 %) than in the UCA (5.9 %).
Education
Illiterate population is higher in the UCA (34.6 %) than in the LCA (21.4%). In both LCA and
UCA, female illiteracy is significantly higher than the male. Likewise, educational attainment
of the population is higher in the LCA than in the UCA. For all categories of educational
attainment, male educational attainment is higher than female.
Households and landholdings
In rural Nepal, land continues to be the major source of income and employment. Often, the
quality of land (irrigated vs. unirrigated), type of land (lowland vs. upland), and accessibility
(road head vs. others) are major determinants of a household’s social and economic status in
the community. Based on the distribution of landholdings, farm households have been

209
categorized into Marginal (< 0.5 ha), Small (0.5 - 1.5 ha), Medium (1.5 - 2.5 ha) and Large
(2.5 - 4 ha).
Of the 200 respondents, more than 93.5 (187) % are small and marginal farmers. A little more
than half are marginal farmers (103) with an average land holding of 0.26 ha. In the surveyed
area, 52 % of households own only 22.5 % of land. In contrast, less than 7 % of households
own about 24 % of land indicating rather skewed distribution of productive resource. The
average size of landholding for JKW area is 0.60 hectare. The average land holding of a
household is 0.78 ha in the LCA while it is 0.49 ha in the UCA.
There is more low land (Khet) in the LCA than in the UCA. Again, the holdings are not in one
location, but scattered in a number of small parcels ranging from 3 to 5, which take an
average time of 20 - 27 minutes to reach the farthest parcel from the homestead.
Farming systems
Some of the characteristics of Nepalese farming systems are as follows: a) Mixed farming
consisting of crops and livestock, b) subsistence farming characterized by smallholdings and
low productivity, c) agricultural production dominated by cereal crops for food security, d)
mostly rain fed farming, e) labour-intensive farming, f) agriculture not providing full time
employment to the people thus paving way for seasonal migration in search of employment,
g) lack of institutional credit and organized market in the rural areas h) lack of network of
roads in the rural areas.
The project site can be considered as one of the most privileged sites representing the ideal
situation of Nepalese farming systems.
Land types
In the hilly regions of Nepal, the agricultural land is broadly classified into two categories,
'Khet' and 'Bari'. 'Khet' refers to land which is usually lowland and suitable for rice cultivation
under puddling condition while 'Bari' refers to the upland which is usually not suitable for rice
cultivation under puddling condition but suitable for cultivation of several other crops. 'Pakho'

210
is marginally uncultivated land used for animal grazing and 'Ban' means forest. Some farmers
also have forest in their personal land.
Major crops grown in the project area
The major crops grown in both UCA and LCA are rice, maize, potato, wheat and tomato. The
other crops grown in the area are mustard, cabbage, cucumber, bittergourd, chilli, brinjal and
radish. The cropping intensities in Khet land in the LCA and UCA are 250 % and 243 %,
respectively whereas in Bari, these figures are 126 % and 134 %, respectively.
Cropping patterns
There are three distinct cropping seasons in the project area: Summer or Monsoon (June -
October), Winter (November - February) and Spring (March - May). In Khet, the dominant
crop during monsoon is rice followed by potato, wheat, vegetables and mustard during winter
and summer seasons. In Bari, the dominant crops during monsoon are maize and tomato
followed by wheat, mustard, potato and vegetable crops during winter and summer seasons.
Irrigation
The major source of irrigation in the UCA Khet is Jhikhu Khola and its tributaries and for the
LCA Khet is Jhikhu Khola and groundwater (lifted with either motor pumps or rower pumps).
About 96 % of LCA farmers and 76% of UCA farmers irrigate their land from the Jhikhu
Khola stream. About 48 % of LCA farmers and only 3 % of UCA farmers also use water
pumps to lift groundwater for irrigating their crops. Water tariff is being paid by 55 % of LCA
farmers and 23 % of UCA farmers, respectively.
Livestock holding
Livestock is an integral part of Nepalese farming system. The major animals raised by the
farmers are cattle, buffalo, goat, sheep, pig and poultry. Cattle are raised for milk and draught
power, buffaloes for milk and meat and poultry birds for meat and egg.

211
Pesticide use
During the green revolution time (mid 1960s and 1970s) in India, the Nepalese farmers also
started the use of improved seed, chemical fertilizer and pesticides to grow more food. All of
these inputs except some seed are being imported from other countries.
The use of pesticides in Nepal started in the early 1950s when DDT was extensively used in
the Terai and Inner Terai area for eradicating Malaria disease transmitted by mosquitoes
(Anopheles spp.). Of course, DDT was not much used in agricultural crops. Parathion was
imported in large quantity followed by endirin, BHC, chlordane, aldrin and dieldrin during the
1950s and 1960s. Nepalese farmers have a preference for highly toxic insecticides with broad-
spectrum activity, which result in immediate knockdown of pests (Neupane, 1995). All
chlorinated hydrocarbons except endosulfan, phosphamidon and parathion among the
organophosphates and organomurcury chloride have been banned, but methyl parathion is still
in use, being one of the most popular insecticides (DOPP, 2001).
A long list of pesticides has been approved by the Directorate of Plant Protection (DOPP)
under the Department of Agriculture (DOA) of His Majesty's Government of Nepal for
various crops (DOPP, 2001). The Pesticide Act was enacted in 1991 and the Regulations
approved in 1993 (DOPP, 2001). Due to lack of enforcement of legislation, there have been
several misuses of pesticides. For example, anybody can sell, buy and use toxic chemicals;
there is no mechanism for consumer safety (the pesticide residues on marketable crop
produce); the expiry dates of pesticides and the quality of imported as well as locally
produced chemical is unchecked. There have been some pesticides imported from India,
which are of doubtful quality. In the past, the major bulk of pesticides were marketed by the
Agricultural Inputs Corporation, but currently it is handled by private dealers. There are many
dealers of various pesticides in the country. Since Nepal has an open border with India, it is
very difficult to estimate the exact quantity of pesticides imported into the country. However,
the DOPP has reported the following pesticide import figures, (in terms of active ingredients),
for the year 1997: insecticides - 33356 kg, fungicides/bactericides - 15577 kg, herbicides -
6748 kg and rodenticides - 400 kg (unpublished data). The national average consumption of
pesticides is very negligible (142g active ingredient/hectare) (Dahal, 1995).
The pesticide application equipment, mostly sprayers (hand compression and knapsack type)
are also imported from India by many of the pesticide dealers.

212
Vegetable production has become very popular in many parts of Nepal, especially near the
highway corridors. Farmers have started treating high value vegetable crops with pesticides
very frequently. In many places farmers apply pesticides in a routine manner, without
considering the waiting period, residue on the treated stuff, human health and the environment
as a whole. Panchkhal VDC is very popular pocket for growing different vegetable crops,
which are sold at high prices in Kathmandu and other nearby towns. Many people who are
concerned about the abuse of pesticides, are frightened to consume the crops (especially
vegetables) grown in Panchkhal area. Since there is very limited facility for pesticide residue
analysis in the country, it is difficult to judge the amount of pesticide residue present in the
plants, soil and water around the treated area. In this context the present collaborative research
has aimed at studying pesticide management aspects in the Hindu-Kush Mountain Region,
taking Nepal as a representative site.
Pesticides used in the project area
The following pesticides are used by the farmers of the project area for controlling various
pests on different crops: Insecticides (aluminum phosphide, chlorpyriphos, dichlorvos,
dimethoate, fenvalerate, malathion and methyl parathion), Fungicides (carbendazim,
edifenphos, mancozeb and metalaxyl.
Broad use of pesticides in agriculture
In the research site, farmers use pesticides mostly on standing crops in the field. All LCA
farmers and 97 % of UCA farmers have been found using pesticides on their crops. Cereals
and grain legumes are stored for several months. The grains are used both as seed and food.
About 20 % of LCA farmers have been found treating the seed with pesticide and none of the
UCA farmers did so. In both the areas, farmers treated the grains meant for human and animal
consumption.
Priority crops for pesticide use
In the study area, farmers use pesticides mainly on the following crops for controlling various
insect pests (Neupane, 2002) and diseases (Shrestha, 1996): potato, tomato, rice, cauliflower,
brinjal (eggplant), chilli, beans, gourds, wheat and mustard. In UCA and LCA, potato, tomato

213
and rice are the important crops followed by different vegetable crops in terms of pesticide
use.
Use of pesticides in stored commodities
The major stored commodities in the research site are cereal grains (rice and wheat), which
are kept for 3 - 6 months. Very few farmers (6 %) applied following insecticides on cereal
grains: aluminium phosphide (Celphos tablets), malathion (dust) and dichlorvos (Nuvan EC).
The latter two insecticides are not recommended by DOPP for direct use in grains in the
storage.
Use of pesticides in field crops
Crop-wise use of pesticides and their frequencies of application/ (FA) on a crop for one
season have been presented below.
Lower catchment area
Rice (i) Insecticides: dichlorvos, dimethoate, fenvalerate and methyl parathion. These are
used against chewing and sucking insects. Dichlorvos is very low persistent insecticide and
not desirable to be used on rice. FA: 2 - 3 times. (ii) Fungicides: carbendazim and
edifenphos. These are used against fungal diseases such as rice blast and brown spot. FA: 1 -
2 times.
Maize (i) Insecticide: chlorpyrifos. It is used against soil and foliage insects. FA: 1 time.
Potato (i) Insecticides: dichlorvos, dimethoate, fenvalerate and methyl parathion. Here again,
dichlorvos is not a proper choice. FA: 8 - 12 times. (ii) Fungicides: mancozeb and a mixture
of metalaxyl and mancozeb (Krilaxyl). These are used mainly against the late blight of potato.
FA: 9 times.
Tomato (i) Insecticides: dichlorvos, dimethoate, fenvalerate and methyl parathion. FA: 7 - 15
times. (ii) Fungicides: carbendazim, mancozeb and Krilaxyl. These are used against the late
blight. FA: 4 - 11 times.

214
Cabbage and Cauliflower (i) Insecticides: dichlorvos and fenvalerate. FA: 2 - 4 times. (ii)
Fungicide: mancozeb. FA: 7 times.
Bittergourd (i) Insecticides: dichlorvos, dimethoate, fenvalerate and methyl parathion. FA: 5 -
13 times. (ii) Fungicide: mancozeb. FA: 14 times.
Chilli and Capsicum (i) Insecticides: dichlorvos, dimethoate and fenvalerate. FA: 5 - 11
times. (ii) Fungicide: mancozeb. FA: 8 times.
Cucumber (i) Insecticides: dichlorvos, dimethoate and fenvalerate. FA: 2 - 9 times. (ii)
Fungicides: mancozeb and Krilaxyl. FA: 12 times.
Brinjal (i) Insecticides: dichlorvos, fenvalerate and methyl parathion. FA: 2 - 9 times. (ii)
Fungicides: mancozeb and Krilaxyl. FA: 2 - 4 times.
Beans (i) Insecticides: dimethoate. FA: 5 times. (ii) Fungicide: mancozeb. FA: 5 times.
Upper catchment area
Rice (i) Insecticides: dichlorvos, fenvalerate, malathion, dimethoate and methyl parathion.
FA: 2 - 4 times.
(ii) Fungicide: edifenphos. FA: 2 times
Wheat (i) Insecticide: malathion. It is used for controlling the pests of stored wheat grains.
FA: 1 time.
Potato (i) Insecticide: dichlorvos, dimethoate, fenvalerate and methyl parathion. FA: 6 - 8
times. (ii) Fungicides: mancozeb and Krilaxyl. FA: 8 times.
Tomato (i) Insecticides: dichlorvos, dimethoate and fenvalerate. FA: 10 times. (ii) Fungicides:
mancozeb and Krilaxyl. FA: 10 times.
Bittergourd (i) Insecticides: dichlorvos and fenvalerate. FA: 6-7 times. (ii) Fungicide:
mancozeb. FA: 8 times.

215
Chilli and Capsicum (i) Insecticides: dichlorvos and fenvalerate. FA: 7 times. (ii) Fungicide:
mancozeb. FA: 8 times.
Brinjal (i) Insecticide: fenvalerate FA: 6 times. (ii) Fungicide: mancozeb. FA: 6 times.
Mustard (i) Insecticide: fenvalerate. FA: 2 times. (ii) Fungicide: mancozeb. FA: 1 time.
The rate of pesticides per application used on various crops in LCA and UCA has been found
to be normal when compared with the rate of application used in United States of America
(Thomson, 1998, 2000).
Criteria for pesticide application
For the application of pesticides on the crops, farmers usually take presence of pests or their
damage symptoms or both into consideration. Some farmers also use pesticides even without
noticing the above criteria. In case of rice 31.2 % of the households considered the presence
of pests and 36.2 % considered the damaged symptoms while 2.5 % considered both in the
LCA. While in the UCA, only 4.1 % of the households considered pests and 23.3 %
considered damage symptoms. In case of potato 87.5 % of the households considered
damaged symptoms. This is particularly true because of potato late blight caused by a fungus
(Phytophthora infestans), which cannot be seen by naked eyes. Hence, farmers have to rely on
damage symptoms. In most of the crops farmers rely on at least two criteria listed above.
Waiting period
Waiting period can be defined as the period between the last application of pesticide on a crop
and the date of its harvest. Generally, during this period the pesticide residue on or in the
treated stuff / plants is dissipated and such stuff is usually harmless to human and animal
consumption. Now the problem in developing countries including Nepal is that farmers
usually do not maintain the recommended waiting period prescribed for different pesticides.
This has compelled people to consume agricultural products containing illegal amount of
pesticide residues and suffer from various ailments.

216
The research site is important vegetable growing pocket and a lot of vegetables are sold in
Kathmandu and other surrounding areas. The vegetable growers of this area also have not
maintained the recommended waiting periods for various pesticides. The waiting periods of
mancozeb, fenvalerate, matalaxyl + mancozeb (Krilaxyl), dimethoate and methyl parathion
are too short in both UCA and LCA. It means that vegetables grown in these areas are not safe
for human consumption.
Use of right dosage of pesticides
About 24 % of respondents took the advice of agricultural technicians (Agricultural Officers,
Junior Technicians, Junior Technical Assistants of DADO, Kabhrepalanchok and technical
staff of CEAPRED), 11 % decided on their own and 65 % either decided on their own or took
the advice of the agricultural technicians in the LCA whereas in the UCA 89 % took the
advice of the technicians.
Change in pesticide types
Little changes have been seen on pesticide types in the research site. In the LCA, 27 % of the
respondents have switched over to other types of pesticides from the regularly used ones. In
the UCA, only 8 % of the respondents did so. The reasons for the changes were agricultural
technicians' advice, unavailability of the regularly used pesticides and pesticide dealers'
advice.
Know-how about pesticides use
Know-how about pesticides (such as their types, method of dilution and application, residue
problems, expiry dates, precautionary measurers etc.) was low among the farmers. In LCA,
only 41 % of the male and 23 % of the female had knowledge on the above areas while it was
so only with 32 % of male and 8 % of female in UCA.
Other pest control practices
Only 12 farmers have reported using the following means than synthetic insecticides for
controlling pests on vegetable crops such as tomato, potato, cauliflower, pea, bean, mustard,
gourds and other vegetables:
Botanicals: Azadirachta indica (Neem), Artemisia vulgaris (Mug-wort), Capsicum frutescens
(Chilli), Allium sativum (Garlic), Nicotiana spp. (Tobacco) and wood ash.

217
Miscellaneous: Cow urine, Soap and Light-trap.
Cow urine alone (diluted with water) or in combination with crude water extracts of the above
botanicals (especially their leaves, fruits and bulbs) are applied on the plant foliage. Farmers
believe that this treatment protects the crops from the damage from various insects and
diseases. But published data that confirm farmers' believes are lacking.
Pesticide appliances
In Nepal, pesticides are applied using very simple manual appliances such as sprayers and
dusters. The hand compression (usually 9-litre capacity) and the knapsack sprayer (16-litre
capacity) are very commonly used. In the absence of a sprayer, locally made brooms are used.
Similarly, in the absence of a duster, pesticide dust is spread over plants and soil surface by
hand.
Both men and women are involved in pesticide application. In rare cases, even children are
involved. About 45.6 % male and 24.7 % female are engaged in pesticide application in the
LCA. Similarly, 36.5 % of male and 14.4 % of the female are engaged in pesticide application
in the UCA.
About 91 % and 57 % of LCA and UCA households own sprayers. Farmers, who do not own
sprayers, borrow from their neighbors by paying Rs. 40/day (LCA) and Rs. 23/day (UCA),
respectively.
Marketing of pesticides
In the LCA, farmers buy pesticides from the following retailers in order of priority: agro-vet
shop, local agro-shop, Agricultural Input Corporation (AIC) dealers and farmers'
cooperatives. Similarly, in the UCA, farmers buy pesticides from local agro-shop, agro-vet
shop and AIC dealers.
Pesticidal hazards to human being and environment
Hazards to users:
In the LCA, 94 % of the users did not feel any side effect of pesticides whereas 6 % felt some
effects. Similarly, in the UCA, 33.6 % of the respondents did not respond to the side effects of

218
pesticides. About 38 % of the respondents did not experience any side effect whereas 28.3 %
of the respondents did experience side effects.
Hazards to general public and environment:
Pesticides applied on the field also have some side effect on general public and the
environment. About 85 % and 67 % of the respondents in LCA and UCA , respectively, were
aware of pesticide hazards to general public health and the environment.
Use of protective measures
LCA:
A majority of users (85 %) washed their hands with soap, very few (5 %) used gloves; boot;
mouth and nose cover; about 19 % used gloves and mouth and nose cover.
UCA:
A majority of users (90 %) washed their hands with soap and 5 % used mouth and nose cover.
Farmers' training on pesticide management
Training of farmers on pesticide management is very important. But it is being neglected by
the concerned agencies. Only two LCA male farmers have received a very short training on
IPM.
Availability of pesticides
Around 90 % of the households of UCA and LCA stated that pesticides were available in the
market whenever they needed. Very few (7 %) commented that they were not available when
they required them.
Storage of pesticides by farmers
Generally, farmers buy pesticides before they use while others buy them when needed. In the
first case, farmers have to store the pesticides at their residences for some time. In the LCA,
40 % and in the UCA 25 % of the households stored pesticides.
Annual expenditure
Farmers' annual expenditure is grouped into seven categories, namely, foodstuff, education,
health, livestock raising, transportation, fuel, festivals and clothing. Average annual

219
expenditure of UCA farmers (Rs. 53809) is less than that of LCA farmers (Rs. 63077). (Table
5).
Income and Expenditure
Income of farmers in the project area is categorized into two: farm income (Value of
Production minus Cost of Production) and Income (Farm Income plus Off-farm Income).
Table 6 shows that average farm income of UCA farmers (Rs. 66621) is much less than that
of LCA farmers (Rs. 145603). This is so because they apply more purchased inputs and
produce more in terms of quantity than that of UCA farmers. Similarly, average income of
UCA farmers is less (Rs. 108253) than that of LCA farmers (Rs. 190093). Average
expenditure (value of home consumption plus annual expenditure) of UCA farmers, which
stands at Rs. 103324, is less than that of LCA farmers (Rs. 137573). Thus there is a big
difference between the average income of UCA and LCA farmers. Average surplus (excess of
income over expenditure) per UCA farmer/household (Rs. 4928) is very low as compared to
the same of LCA farmer/household (Rs. 52520).
Table 1 Value of production (NRS)
UCA LCA
20
Small
Farmers
8
Medium
Farmers
2 Large
Farmers
Total
(30)
9 Small
Farmers
8
Medium
Farmers
3 Large
Farmers
Total
(20)
Value of
Production
983022 668766 467015 211880
3
1155021 1291520 655622 310216
3
Average 49151 83596 233508 70627 128335 161440 218541 155108
Table 2 Cost of production (NRS)
UCA LCA
20
Small
Farmers
8
Medium
Farmers
2 Large
Farmer
s
Total
(30)
9 Small
Farmer
s
8
Medium
Farmers
3 Large
Farmers
Total
(20)
Cost of
Production
68696 39891 11578 120165 68307 82614 39191 190112
Average 3435 4986 5789 4006 7590 10327 13064 9506

220
Table 3 Off-farm Income (NRS)
UCA LCA
20
Small
Farmers
8
Medium
Farmers
2 Large
Farmer
s
Total
(30)
9 Small
Farmer
s
8
Medium
Farmers
3 Large
Farmers
Total
(20)
Off-farm
Income
856946 372200 19800 1248946 160000 99800 630000 889800
Average 42847 46525 9900 41632 17778 12475 210000 44490
Table 4 Value of home consumption (NRS)
UCA LCA
20
Small
Farmers
8
Medium
Farmers
2 Large
Farmer
s
Total
(30)
9 Small
Farmer
s
8
Medium
Farmers
3 Large
Farmers
Total
(20)
Home
Consumption
885993 437167 162296 1485456 457621 610350 421938 148990
9
Average 44230 54646 81148 49515 50847 76294 140646 74495
Table 5 Annual expenditure (NRS)
UCA LCA
20
Small
Farmers
8
Medium
Farmers
2 Large
Farmer
s
Total
(30)
9 Small
Farmer
s
8
Medium
Farmers
3 Large
Farmers
Total
(20)
Annual
Expenditure
879887 478792 255596 1614275 442876 467289 351380 126154
5
Average 43994 59849 127798 53809 49208 58411 117127 63077

221
Table 6 Income and expenditure of UCA and LCA farmers (NRS)
UCA LCA
20
Small
Farmers
8
Medium
Farmers
2 Large
Farmer
s
Total
(30)
9 Small
Farmer
s
8
Medium
Farmers
3 Large
Farmers
Total
(20)
Income 1771272 1001075 475237 3247584
124671
4
1308707 124643
1
380185
2
Value of
Production
983022 668766 467015 2118803 115502
1
1291520 655622 310216
3
Minus Cost of
Production
68696 39891 11578 120165 68307 82614 39191 190112
Farm Income 914326 628875 455437 1998638 108671
4
1208906 616431 291205
2
Plus Off-farm
Income
856946 372200 19800 1248946 160000 99800 630000 889800
Expenditure 1765880 915959 417892 3099731 900497 1077639 773318 275145
4
Value of Home
Consumption
885993 437167 162296 1485456 457621 610350 421938 148990
9
Plus Annual
Expenditure
879887 478792 255596 1614275 442876 467289 351380 126154
5
Surplus (Income
- Expenditure)
5392 85116 57345 147853 346217 231068 473113 105039
8
Surplus/Househ
old
270 10640 28673 4928 38469 28883 157704 52520

222
Conclusion
Farmers in the research site have started growing high value crops such as vegetables in place
of traditionally grown cereals. They do not like to take any kind of risk such as pest damage in
these crops. Hence they have started using pesticides lavishly. The other reasons for high use
of pesticides are their cheapness and very low share in the total cost of production of the
crops. The farmers have very low knowledge on pesticides and the pesticide regulations have
not been enforced properly. For improving this situation, the awareness of the farmers needs
to be raised towards pesticides, their alternatives and IPM and enforcing the regulation by the
government as well as several developmental agencies.
Acknowledgement
This study is a part of the research project entitled "DEVELOP IPM NEPAL" implemented
by CEAPRED in collaboration with the TUBS, Germany. Prof. Dr. A. Herrmann, Team
Leader of the project deserves appreciation for his collaborative role.
References
CBS (2001) National Census Report. National Planning Commission, Central Bureau of Statistics, Kathmandu, Nepal. (Unpublished)
Dahal, L. (1995) A Study on Pesticide Pollution in Nepal. National Conservation Society Implementation Project, Kathmandu
DOPP (2001) Jibanashak Bisadi Ain, 2048, Jibanashak Bisadi Niyamawali, 2050 Ra Panjikrit Bisadiharuko Adhyawadhik Suchi (Pesticide Act 1991, Pesticide Regulations 1993 and Updated List of Registered Pesticides). Plant Protection Directorate (PPD), Department of Agriculture, HMG, Nepal
Herrmann, A. (1997) Environmental Risks of Pesticides and Sustainable Development of IPM (Integrated Pesticide Management) for Mountain Areas of Developing Countries Considering Socio-Economic Conditions and Taking Middle Mountains, Central Nepal as an Example (DEVELOP IPM NEPAL). Project Proposal, Institute for Geography and Geoecology, Department for Physical Geography and Hydrology, Technical University of Braunschweig, Germany
Neupane, F. P. (1995) Country profile: Agricultural entomology in Nepal. Rev. Agric. Entomol 83 (12), 1291-1304
Neupane, F. P. (2002) Balibiruwaka Shatruharu Ra Tinko Roktham (Crop Pests and Their Control), Sajha, Prakashan, Pulchok, Lalitpur.
Shrestha, K. (1996) Nepalma Tarkari Balika Mukhya Rogharu (Major Diseases of Vegetable Crops in Nepal), Department of Agriculture. Vegetable Development Division, Khumaltar, Lalitpur

223
Thomson, W.T. (1998) Agricultural Chemicals, Book I Insecticides. Thomson Publications, Frenso, CA 93791, USA
Thomson, W.T. (2000) Agricultural Chemicals. Book IV Fungicides. Thomson Publications, Frenso, CA 93791, USA

224
Modeling overland flow and sediment discharge from agricultural lands on Himalayan foot hills under monsoon conditions AMANJOT SINGH Department of Soil and Water Engineering, Punjab Agricultural University, Ludhiana - 141004, India
Abstract
Modeling of overland flow and sediment discharge is a complex process and the procedure
differs under different hydrological conditions. Simulation for the Himalayan foothills under
monsoon type of climatic conditions requires quantification and interpretation of overland
flow and sediment discharge from all the storms of monsoon season, individually and
integrally, for small land holdings under the local agricultural practices followed in this
region. A physically based distributed numerical model suits well these types of
agrohydrological conditions to generate discharge hydrograph and sedimentograph for each
storm and integrated simulation graphs for a particular duration. A combination of finite
element and finite difference solution for irregular spatial integration and temporal
integration, respectively, suits well for modeling under these conditions.
Introduction
The modeling of surface runoff and sediment discharge from the agricultural watersheds
started in mid 20th century with the development of rational formula (Ramser 1972) and US
soil conservation services method (Anonymous 1969) for runoff estimation and universal soil
loss equation (Wischmeier & Smith 1965) for soil loss quantification. These equations are
widely used even today especially for ungauged watersheds. Since these equations were
developed on more of empirical estimations of the involved parameters, there had been scope
for the improvement of the estimation procedures of these processes. The development in
technology led to better understanding of the physical behavior of the parameters involved in
estimation of overland flow and sediment discharge and as a result, more physically based
models came up (e.g. CREAMS: Knisel 1980; WEPP: Nearing et al. 1989, Hairsine & Rose
1992a, 1992b; EUROSEM: Morgan et al. 1998; etc.). Simultaneously, the invention of the
Landschaftsökologie und Umweltforschung 38 p. 224-235 Braunschweig 2002

225
fast computation machines complemented the development of the modeling techniques and
allowed the use of complex numerical methods for the solution of the governing partial
differential equations, reducing the assumptions of homogeneity for otherwise heterogeneous
system. Moreover, the stress now is being given on the development of physically based
distributed dynamic models to incorporate maximum possible available information for
achieving more realistic results. Developing WEPP model (Nearing et al. 1989) and
EROSEM model (Morgan et al. 1998) researchers have tried to lay down norms for modeling
concepts of 21st century. These models suit best the watersheds under uniformly distributed
rainfall over the entire year (WEPP) and single storm analysis under European conditions
(EUROSEM).
The agroclimatic pattern of the Himalayan foothills differs from the agroclimatic behavior of
the western countries because of monsoon type of climatic season. Most of the rainfall is
received in a span of four months (June to Sept.) (Fig. 1) and rest of the months remain dry.
The monsoon rains are normally of high intensity and short duration and erratic both in time
and space. Therefore, the modeling process for these types of conditions should simulate
fluctuations in the overland flow and sediment discharge within one storm span and should
continue at least for entire monsoon season or crop season to reflect the scenario for a given
span of time. Moreover, since the land holdings of the farmers in these watersheds are either
small to marginal (<5 ha), focus needs to be given to simulation situations for small
watersheds with provision of integration to the higher scales.
0
50
100
150
200
250
300
350
400
Jan Feb Mar Apr May Jun Jul Aug Sep Oct Nov Dec
Months
Rai
nfa
ll (m
m)
Fig. 1 Monthly rainfall fluctuation in Himalayan foothills

226
Fig. 2 Profile of processes involved in overland flow and sediment discharge simulation
Profile of process
The overland flow and sediment discharge modeling procedures for the arable Himalayan
foothills need to have a complex structure involving number of sub-processes in the
heterogeneous system. The profile of the processes involved in overland flow and sediment
discharge modeling has been presented in Fig. 2.
Rainfall Excess
Vadoze Zone M odule
O verland Flow Routing
Overland Sediment Routing
Channel Flow Routing
Channel Sediment Routing
Rainfall - Soil Parameters - ET - Crop Parameters
Interception Depression Storage
Surface Gradient Roughness coefficient
Lateral Sediment Inflow
Lateral Inflow
These processes can be simulated by different modeling techniques viz. stochastic modeling,
lumped modeling, distributed modeling etc. Since, at present time, physical basis of these
processes has been well understood, the physically based distributed numerical models are
preferred over other models.
Broadly, the modeling of overland flow and sediment discharge involves simulation of vadoze
zone moisture dynamics for the estimation of infiltration rate, overland flow routing and
overland sediment routing. Depending upon the applicability of the model and availability of
data, a vadoze zone model may simulate infiltration using simple Philip equation (Philip
1957), moderate Green and Ampt equation (Mein & Larson 1973) or complex mixed form of
1, 2 or 3 dimensional Richards equation (Celia et al. 1990). The 2-D Richards equation (Eq.
1) is recommended for distributed soil water dynamics in vadoze zone. The equation needs a
crop growth model for sink term calculation, which further needs estimation of

227
evapotranspiration using some standard site feasible method. The unsaturated soil parameters
may be calculated using concepts given by van-Genuchten (van Genuchten 1987). This
approach is preferred for its wide acceptance for estimation of unsaturated soil parameters.
ttzS
z
hhK
zx
hhK
x zx ∂∂=−
−∂∂
∂∂+
∂∂
∂∂ θ
),(1)()( (1)
where, h is hydraulic head (m), t is time (s), x is the horizontal space coordinate (m), z is the
vertical space coordinate (m) (positive upwards), θ is the volumetric moisture content (m3⋅m-
3), Kx is the hydraulic conductivity in x-direction (m⋅s-1), Kz is the hydraulic conductivity in z-
direction (m⋅s-1), S is the source/sink term for root extraction and evaporation (m3⋅m-3⋅s-1).
The numerical solution of the Saint-Venant equations (Huggins 1982) (Eq. 2 to 4) routes the
overland flow and give distributed output. The solution of these equations using kinematic
wave approximations (Lighthill & Whilhan 1955), assuming gravity forces equaling frictional
forces, is recommended for routing of overland flow because of the shallow depth of the
overland water.
qy
hV
x
hV
t
h yx =∂
∂+
∂∂
+∂∂
(2)
0=
−+∂∂+
∂∂
+∂
∂+
∂∂
oxfxx
yx
xx SS
x
hg
y
VV
x
VV
t
V (3)
0=
−+
∂∂+
∂∂
+∂
∂+
∂∂
oyfyy
yy
xy SS
y
hg
y
VV
x
VV
t
V (4)
where, Vx and Vy are the local depth-averaged velocities (m⋅s-1), h is the local vertical depth
(m), q is the lateral inflow (m2⋅s-1), g is the gravity constant, x and y are the space coordinates,
t is the time (sec), Sox and Sfx (resp⋅Soy and Sfy) are the ground slopes and the friction slopes in
the x and y directions, respectively.
Sediment routing involves solution of 1 or 2 dimensional continuity equation for sediment
routing (Eq. 5 and 6) considering lateral flow of sediment from rill and interrill areas.
LRIyx
s DDDy
g
x
g
t
hc =+=∂
∂+
∂∂
+∂
∂ρ (5)

228
or
Lysxss D
y
VA
x
VA
t
A =∂
∂+
∂∂+
∂∂
(6)
where, h is the water depth (m), c is the sediment concentration (m3⋅m-3), ρs is the mass
density of the sediment particle (kg⋅m-3), t is the time (s), gx/gy is the sediment transport rate in
x/y direction (kg⋅m-1⋅s-1) and is equal to As⋅Vx/As⋅Vy,⋅Vx and Vy is the flow velocity in x and y
direction (m⋅s-1), respectively, As = ρs⋅c⋅h is the mass of sediment under movement per unit
area (kg⋅m-2), ρs is the particle density (kg⋅m-3), DI is the delivery rate of sediment from
interrill areas (kg⋅m-2⋅s-1), +ve for detachment and –ve for deposition, DR is the delivery rate
of sediment from rill areas (kg⋅m-2⋅s-1), +ve for detachment and –ve for deposition, DL is the
lateral inflow rate of the sediment per unit length per unit width of flow regime (kg⋅m-2⋅s-1).
The interrill sediment movement, detachment of soil particles by raindrop impact and
transportation of sediment by rainfall distributed sheet flow, may be estimated using relation
given by Foster (1982) (Eq. 7).
DI = (COFI) Cf Kf Ib(2.96 S0
0.79 + 0.56) (7)
where, DI is the delivery rate of sediment from interrill areas (kg⋅m-2⋅s-1), COFI is the
coefficient for interrill erosion obtained through calibration, Kf is the soil erodibility factor of
the USLE for interrill erosion, kg⋅h⋅N-1⋅m-2, Cf is the crop management factor of USLE, I is
the rainfall intensity (mm⋅h-1), b is an exponent of rainfall intensity depending upon clay
content of the soil (b=2.0), S0 is the sin of bed slope angle (θ) = sin(θ).
The rill sediment movement and sediment movement in the small channels, may be estimated
using the equation (Eq. 8 to 10) given by Nearing (1989). The erosion/deposition of the
sediment may be assessed using transportation equation given by Yalin (Foster & Meyer
1972) or by Bagnold (Bagnold 1977).
Case 1
Tc > G (Entrainment Case)
i) τ > τcr

229
)1(D Cc
R T
GD −= (8)
ii) τ < τcr (No entrainment and no deposition)
DR = 0 (9)
Case 2
Tc < G (Deposition Case)
)(q
V 0.5 f GTD cR −= (10)
where, DR is the rill detachment rate (kg⋅m-2⋅s-1), Dc is detachment capacity by rill flow (kg⋅s-
1⋅m-2) and is equal to COFR Kf Cf (τ-τcr) (Foster 1992), COFR is the coefficient for rrill
erosion obtained through calibration, τ is the average shear stress in the flow (N⋅m-2) is equal
to γh S0, γ sp. weight of water (N⋅m-2⋅s-1), τcr is the critical shear stress of the soil (N⋅m-2), h is
the hydraulic head (m), q is the flow discharge per unit width (m2⋅s-1), Vf is the effective fall
velocity of the particle (m⋅s-1) equal to gd2(ρs-ρw)/(18µ), g is acceleration due to gravity (m⋅s-
2), d is the particle diameter (m), ρs is the grain density (kg⋅m-3), ρw is the density of water
(kg⋅m-3), and µ is the dynamic viscosity of water (Kg⋅m-⋅.s-1), Tc is transport capacity of water
(kg⋅s-1⋅m-1) and G is sediment load (kg⋅s-1⋅m-1).
The analytical solution of the governing partial differential equations is difficult in
heterogeneous natural systems. Numerical solution for such problem is preferred over the
simplified analytical solution. The most widely used techniques for numerical solution are
finite element techniques and finite difference techniques. The finite element technique fits
better the irregular spatial boundaries of the watershed, whereas use of finite difference
method optimizes the integration in time scale. Therefore, a combination of two approaches
with finite element technique for spatial integration and finite difference for temporal
integration are used for finding the solution.
The simulation process needs to continue for multiple storm sessions, which may run for
number of days. Therefore, initial conditions are given as the starter of the program and
thereafter, the model simulates the initial conditions for the subsequent storms. The model
needs the daily input parameters viz. evapotranspiration parameters, plant growth parameters
etc. and extract the information at suitable time increment. The flow chart of the programming

230
Fig. 3 Profile of processes involved in overland flow and sediment discharge simulation
procedure for simulation and output of overland hydrograph and sedimentographs has been
presented in Fig. 3.
Time Increment t = t + ∆∆∆∆t
INPUT (One Time) Spatial Discretization, Soil data, Initial data
INPUT (Daily) And Daily Parameter Cal. (e.g. ET, Root Depth etc.)
Sediment Load (Qs) and Transport Capacity (Tc) Calculations
Sink Term Calculation
Infiltration + Soil Moisture Dynamics Calculations
Rainfall Excess Estimation
Surface Hydraulic Calculations
Hydrograph and Sedimentograph
Tc > Qs
Entrainment Deposition
ττττ > ττττcr
No Entrainment
No
Yes No Yes
Yes Last Time Step
No
End
Same day
No
Yes
Model sensitivity and output inferences
For model to give its best performance in the field, especially under rapidly changing
boundary conditions like that on the Himalayan foothills under monsoon type climate,
sensitivity evaluation of the involved parameters is required. It has been seen that the vadoze
zone model and subsequently the overland flow model and sediment discharge model are
highly sensitive to the initial moisture content input of the soil. Model results for initial
moisture content (IMC) changing from –25 to –300 cm have been presented in Fig. 4a to 4c
for infiltration rate, overland flow and sediment discharge. For a storm of 92 cm/day intensity
over a period of 60 min, basal infiltration rate is reached within first 10 min of storm for
initially nearing saturation soil conditions (IMC = -25 cm). Whereas, infiltration rate starts
decreasing at lower rates and at delayed time for initially dry soil conditions and whole of the

231
0
10
20
30
40
50
60
70
80
90
100
0 10 20 30 40 50 60
Time (min)
Infi
ltra
tion
(cm
/day
)IMC= -25
IMC= -50
IMC= -75
IMC= -100
IMC= -200
IMC= -300
0
5
10
15
20
25
30
35
40
45
0 10 20 30 40 50 60 70Time (min)
Run
off
(cm
/day
)
IMC= -25
IMC= -50
IMC= -75
IMC= -100
IMC= -200
IMC= -300
Fig. 4b Variation in runoff rate with change in infiltration rate due to change in initial moisture content (cm)
Fig. 4a Variation in infiltration rate with change in infiltration rate due to change in initial moisture content (cm)
0
0,5
1
1,5
2
2,5
3
0 20 40 60 80
Time (min)
Sedi
. Dis
c. (
kg/m
/hr)
IMC= -25
IMC= -50
IMC= -75
IMC= -100
IMC= -200
Fig. 4c Variation in sediment discharge rate with change in infiltration rate due to change in initial moisture content (cm)

232
rain infiltrates into the soil under very dry conditions (IMC < -300 cm). The change in
infiltration rate directly affects the rate of overland flow and sediment discharge.
No overland flow could be seen for initially very dry moisture conditions (IMC <300 cm)
whereas, initially wet condition resulted in early and higher peak. Similarly, the change in
slope from 1% to 10% has not much affect on the peak overland flow but sediment peak
increases with the increase in slope. This is largely due to the fact that detachment by rainfall
dominates for slopes less than 3% and detachment by overland flow dominate the steeper
slopes (Fig. 5a and 5b).
05
101520253035404550
0 20 40 60 80 100Time (min)
Run
off
(cm
/day
)
S = 1%
S = 2.5%
S = 5%
S = 10%
0
0,2
0,4
0,6
0,8
1
1,2
1,4
0 20 40 60 80 100Time (min)
Sedi
. Dis
c. (
kg/m
/hr)
S = 1%
S = 2.5%
S = 5%
S = 10%
As far as roughness coefficient is concerned (Fig 6a and 6b), there is not much change in the
peak of overland flow but gradient to peak and after peak is sharper for smooth surfaces.
Fig. 5b Variation in sediment discharge with change in slope
Fig. 5a Variation in runoff with change in slope

233
Whereas, increase in roughness increases the peak sediment discharge and total sediment
load. This is due to the fact that shear stress of water is directly proportional to the depth of
flow and therefore, any increase in depth of flow increases sediment detachment.
05
101520253035404550
0 20 40 60 80 100Time (min)
Run
off
(cm
/day
)
n = 0.01
n = 0.05
n = 0.1
n = 0.25
0
0,1
0,2
0,3
0,4
0,5
0,6
0,7
0,8
0,9
0 20 40 60 80 100Time (min)
Sedi
. Dis
c. (
kg/m
/hr)
n = 0.01n = 0.05n = 0.1n = 0.25
The storm type largely affects the overland and sediment discharge. The two types of storms,
delayed and advanced front (Fig 7a and 7b) analysed for their affect on infiltration rate,
overland flow and sediment discharge reflect that delayed front storm produces higher peaks
and volume of overland flow and sediment discharge. In the advanced front storm, most of the
rain gets infiltrated in the soil because of higher initial infiltration rates and there is less
overland flow. Since the rainfall intensity decreases with the advancing time, both peak and
Fig. 6b Variation in sediment discharge with change roughness coefficient
Fig. 6a Variation in runoff rate with change roughness coefficient

234
volume of overland flow and sediment discharge decrease. Whereas in delayed front, the
infiltration rate reaches basal infiltration rate during the period when rainfall intensity is low,
therefore, with the advancing storm period, both the overland and sediment peak and volume
increase.
0
50
100
150
200
250
0 100 200 300 400Time (min)
Rai
nfal
l, R
unof
f, I
nfilt
ratio
n (c
m/d
ay)
-0,1
0
0,1
0,2
0,3
0,4
0,5
0,6
0,7
0,8
Sed
i. D
isc.
(kg
/m/h
r)
Rainfall Intensity Infil. Rate Flow Vel. Sedi. Disc.
0
20
40
60
80
100
120
140
160
180
200
0 50 100 150 200 250
Time (min)
Rai
nfal
l, R
unof
f, I
nfilt
ratio
n (c
m/d
ay)
0
0,5
1
1,5
2
2,5
3
3,5
4
Sed
i. D
isc.
(kg
/m/h
r)
Rainfall Intensity Infil. Rate Flow Vel. Sedi. Disc.
Fig. 7a Rainfall, infiltration, runoff and sediment discharge for advanced front
Fig.7b Rainfall, infiltration, runoff and sediment discharge delayed front

235
References
Anonymous (1969) Engineering Hand Book of Soil Conservation. USDA, Washington D.C.Bagnold, R.A. (1977) Bed load transport by natural rivers. Water Resour. Res. 13, 303-311
Celia, M.A., Bouloutas, E.T. & Zarba, R.L. (1990) A general mass-conservation numerical solution for the unsaturated flow equation. Water Resour. Res. 26, 1483-1496
Foster, G.R. (1982) Modeling the erosion process. In: Haan, C.T, Johnson, H.P. & Brakensiek, D.L. (eds) Hydrologic Modeling of Small Watersheds. Monogr. Ser., vol. 5, American Society of Agricultural Engineers, St. Joseph, Mich., 297-380
Foster, G.R. & Meyer, L.D. (1972) Transport of soil particles by shallow flow. Trans. of ASAE 15, 99-102
Hairsine, P.B. & Rose, C.W. (1992a) Modeling water erosion due to overland flow using physical principles: I. Sheet Flow. Water Resour. Res. 28, 237-243
Hairsine, P.B. & Rose, C.W. (1992b) Modeling water erosion due to overland flow using physical principles: II. Rill Flow. Water Resour. Res. 28, 245-250
Huggins, L.F. (1982) Surface runoff, storage and routing. In: Haan, C.T., Johnson, H.P. & Brakensiek, D.L. (eds) Hydrologic Modeling of Small Watersheds, Monogr. Ser., vol. 5, American Society of Agricultural Engineers, St. Joseph, Mich., 169-225
Knisel, W.G. (1980) CREAMS: A field scale model for chemical, runoff and erosion from agricultural management systems. Conserv. Res. Rep. 26, USDA, Washington D.C.
Lighthill, M.J. & Whitham, G.B. (1955) On kinematic waves-I flood movement in long rivers. Proc. Royal Soc. London, vol. 229
Mein, R.G. & Larson, C.L. (1973) Modelling infiltration during a steady rain. Water Resour. Res. 9, 384-394
Morgan, R.P.C., Quinton, J.N., Smith, R.E., Govers, G., Poesen, J.W.A., Auerswald, K., Chisci, G., Torri, D., Styczen, M.E. & Folly, A.J.V. (1998) The European soil erosion model (EUROSEM): documentation and user guide. Silsoe College, Cranfield University
Nearing, M.A., Foster, G.R., Lane, L.J. & Finkner, S.C. (1989) A process-based soil erosion model for USDA- Water Erosion Prediction Project technology. Trans. ASAE 32, 1587-1593
Philip, J.R. (1957) The theory of infiltration. 1. The infiltration equation and its solution. Soil Sci. 83, 345-347
Ramser, C.E. (1972) Runoff from small agricultural areas. J. Agric. Research. 34(9), 797-823
van Genuchten, M.T. (1987) A numerical model for water and solute movement in and below the root zone. Research Rep. No 121, US Salinity Laboratory, USDA, ARS, Riverside, California
Wischmeier, W.H. & Smith, D.D. (1965) Predicting rainfall-erosion losses from cropland east of the Rocky Mountains. Agr. Handbook No. 282, USDA, Washington D.C.

236
Impact of indiscriminate use of pesticides in a chilli-growing belt M.P. SINGH Central Arid Zone Research Institute, Jodhpur - 342003, India
Abstract
The chilli (Capsicum annuum L.) crop occupied an important position in the cropping pattern
of the irrigated tracts in Indian province of Rajasthan. In Jodhpur district, the local cultivar
Mathania of chilli, widely acclaimed for its relatively mild pungency with deep red colour,
made it the most coveted commodity among the consumers. Being a cash crop, it received
more than its due share of irrigation, fertilizers and growth hormones. The resultant plant
growth invited a variety of pests and diseases, inflicting heavy losses. 'Head binding', caused
by a complex of mites, jassids and thrips was a feature common to all the chilli cultivating
fields, which occupied large acreage in clusters. This necessitated use of pesticides, which
worked orderly for some time. Some insecticides imparted lustre to the fruit. Fruit borers
warranted preventive sprays, as did vectors of viral diseases in apprehension of their
appearance. All the popular and new brands of organophosphates, carbamates and synthetic
pyrethroids were tried, with no regard to consumer health. Warnings by a section of scientific
community against injudicious use of pesticides went unheeded, as most of the cultivators
were illiterate, or occupied by the immediate gains before them. Unscrupulous pesticide
vendors, whom peasants relied for advice, made huge profits. With passage of time, pesticides
lost their effectiveness. Increased dosages were used to get desired results and interval
between two sprays was shortened, followed by combination of more than one insecticide, all
adding to the cost of cultivation. Soon the pesticides lost their effectiveness, the pests having
developed resistance against them. Chilli cultivation is no more a highly remunerative
proposition in this area. The growers now are abandoning its cultivation, a situation created
by their own ignorance or neglect or avarice. The area under chilli has constricted
considerably since.
Landschaftsökologie und Umweltforschung 38 p. 236-244 Braunschweig 2002

237
Introduction
The chilli (Capsicum annuum L.) is an important cash crop of South Asia. It is an essential
ingredient of most regional recipes. In addition to its prime use as spice, it is also used in
green state as a vegetable either alone or in combination with other vegetables; made into
pickles for subsequent consumption and used in the preparation of a variety of edible
products. Recently, the demand of chilli has escalated in the wake of introduction of newer
products like chilli sauce and others by multi-national corporations (Anonymous 1999).
Growing demand inland and overseas made cultivation of chilli highly profitable. A cluster of
villages in Jodhpur district of Rajasthan State in India produced a local land race Mathania
that fetched high price in the market. However, insect pests and diseases inflict great injury to
the plants, cutting into profit margins. This led to use of toxic chemicals for protecting the
crop from pests. All the popular and new brands of organophosphates, carbamates and
synthetic pyrethroids were tried, which worked orderly for some time. Later, the pesticides
lost their effectiveness due to development of resistance in the pests.
Genesis of the problem
Being a cash crop, chilli received more than its due share of irrigation, fertilizers and growth
hormones. The resultant rich plant growth invited a variety of pests and diseases, inflicting
heavy losses. The cultivators resorted to application of pesticides, that being the quickest
method of getting rid of the pests. Cultivation of chilli being labour intensive, manual work
was often got done by the farm owners through entering into partnership of person(s)
providing labour force. Alternatively, the tenancy system followed in this part of the world
was that the landowners gave their land for cultivation to a tenant for a definite term for a
certain consideration. The tenant was to bear the expense of cultivation and in turn often
engaged labour to carry out various field operations. Plant protection operations were left for
them to be carried out in the field. The labour engaged was mostly unskilled. The cultivators
relied heavily on the advice of pesticide vendors who promoted their sales at the hands of
these little literate or mostly ignorant buyers. They used the formulations sold by the vendors
as suggested by them.
When a certain dose of chemical proved ineffective, it was increased. Then mixtures of
pesticides were used. Interval between two sprays was shortened. Warnings by a section of

238
scientific community against injudicious use of pesticides went unheeded, as most of the
cultivators were illiterate, or occupied by the immediate gains before them. Finally, these
treatments also lost their effectiveness. It is assumed that the indiscriminate use of pesticides
resulted in development of resistance in pests to these chemicals.
Another factor responsible for quick development of resistance in pests against the pesticides
was faulty method of application of pesticides. High volume spraying was done mostly with
the help of knap sack or foot sprayers. Spray operations were carried out by the labour
engaged by the tenants or landowners. These workers were not trained for preparing spray
solutions of proper concentrations and for carrying out correct spray operations. The
equipment used for spraying was not properly maintained and did not discharge the droplets
of minute size. At times the workers let loose the nozzles to finish the spray fluid quickly.
Also, nozzles were kept too near the plant surface, letting the spray fluid spill to ground,
rather than sticking on the substrate. This led to, in addition to wastage of the spray fluid, in
application of sub lethal doses of the applied pesticide, which in turn facilitated quick
development of resistance in pests. No systematic studies have so far been conducted about
the level of resistance in pests in these areas and as such no data in support are being
presented.
Yet another factor contributing to development of resistance was availability of food for the
pests all around. Large area was under chilli cultivation in this traditionally chilli growing
belt. Not all fields were protected under pesticides at any particular point of time. This
provided conditions conducive for the multiplication of the pests in one field and migration to
others.
Pests and pesticides
The chilli crop suffers the injury of a number of insect (Table 1) and nematode pests, 'Head
binding', caused by a complex of mites, aphids, jassids and thrips is a feature common to all
the chilli cultivating fields. The sucked portions remain shrunk while the unaffected portions
grow normally, imparting the leaves a curly or uneven shape. The leaves, especially the
younger ones, acquire rosette appearance. Affected plants bear fewer flowers and yield is
reduced. As a result of feeding activity of these sap sucking pests, the plants are devitalized
and remain stunted in growth. Besides, some of these pests also transmit viral diseases in

239
chilli. The initial symptoms of insect injury and viral diseases are often undiscernible. Attack
at fruit bearing stage reduces the size of fruit and hence the yield.
Fruit borer damage is quite common in chillies. Affected fruits are rendered unmarketable.
Fruit borers also pave the way for fruit rotting, through providing entry point for the fungus.
The Jodhpur area being predominantly sandy and arid, termite attack is quite common,
especially when interval between irrigation is longer. The crop soon after transplanting suffers
the injury of white grubs, the larvae of Scarabaeid beetles, which feed on the growing roots.
The root knot disease induced by the nematode Meloidogyne incognita in chillies is also a
limiting factor in successful cultivation of this crop, as heavy dose of nematicide is required to
overcome this problem.
Table 1 Common insect pests on chilli in western Rajasthan
Pest Injury
Aphis craccivora Koch
Aphis gossypii Glover
Myzus persicae Sulz
Devitalize plants by sucking sap, transmit viral
diseases
Scirtothrips dorsalis Hood
Thrips tabaci Lin.
Lacerate plant tissue, lick sap
Polyphagotarsonemus latus (Banks) Suck sap, deform leaves
Microtermes sp
Odontotermes sp
Hollow out the roots
Anomala sp
Lachnosterna sp.
Damage roots
Helicoverpa armigera (Hubner)
Spodoptera exigua (Hubner)
Bore into pods, stem
The insecticides more commonly used in chilli around Jodhpur have been listed in Table 2.
The list however, is not exhaustive, as a large number of brands with different compositions
have been in use. As many as 12 sprays or more are applied, the flowering and bearing time
included. Little or no attention is normally paid to consequent residues on fruits and waiting
periods are not observed strictly, owing mostly to ignorance or to negligence. At times
insecticides were used as these imparted lustre to the fruit. Studies on insecticidal residue
in/on chilli fruits in the local market (Saxena et al; 1990) need to be conducted in this region
to know the level of residues on such fruits.

240
Table 2 Insecticides more commonly used in chillies
Insecticide (alone or in
combination)
Used against Dosages
Acephate aphids, mites, thrips 0.05-0.75%
Aldicarb* white grubs, nematodes 0.5 kg a.i.ha-1
Carbaryl fruit borer 0.1- 0.2%
Carbofuran white grubs, nematodes, mites, thrips 0.5 kg a.i.ha-1
Carbosulfan aphids, mites, thrips 0.04%
Chlorpyriphos termites 3-4 l ha-1
Cypermethrin jassids, mites, thrips, fruit borer 0.001-0.002%
Dimethoate aphids, jassids, mites, thrips 0.03%
Malathion fruit borer 0.1-0.2%
Methyl demeton aphids, jassids, mites, thrips 0.25%
Monocrotophos aphids, jassids, mites, thrips 0.04-0.08%
Phorate white grubs 25 kg ha-1
Phosalone fruit borer 0.1%
Quinalphos aphids, jassids, mites, thrips, fruit borer 0.025-0.04%
Triazophos aphids, jassids, mites, thrips, fruit borer 0.04%
*discontinued later
Current status
There exist opportunities for tapping the growing market of chilli. At the same time
limitations exist for increasing the production, largely because of the losses due to pests and
diseases. India is the largest producer of chilli in the world. Although its domestic
consumption is very high, it still exports chilli to about a hundred countries. There is vast
potential to further promote the export, as there is a growing global demand for the product. A
large number of varieties and land races exist here. Information about production, acreage
and productivity of chillies in respect of Rajasthan State and Jodhpur district in the nineties is
presented in Tables 3 and 4 (Anonymous 1997).
The Mathania variety cultivated around Jodhpur district in arid zone of north-western India
was highly valued for its deep red colour when ripe and powdered, thick pulp and suitability to
prepare Mirchi Bada, a very popular and famous edible item locally. However, the variety
being susceptible to pests and diseases and development of resistance in the wake of
indiscriminate use of pesticides, the growers abandoned cultivation of this variety. To cater to
the demand of local market, they resorted to other varieties like Raipur and others.

241
Table 3 Chilli production in Rajasthan
Year Area (ha) Production (t) Productivity (q ha-1)
1993-94 49,200 46,900 9.53
1994-95 36,500 39,400 10.79
1995-96 38,500 37,200 9.66
1996-97 52,200 58,800 11.26
Thus the area lost one of its prize possession, the Mathania variety. The growers now are
constrained to abandon its cultivation, a situation created by their own ignorance or neglect or
avarice. The area under chilli in the traditional belt has constricted considerably, but chilli
cultivation is being undertaken in newer previously unirrigated areas around, where
underground water has been tapped recently.
Table 4 Chilli production in Jodhpur district
Year Area (ha) Production (q) Productivity (q ha-1)
1991-92 11,973 1,19,230 9.96
1992-93 13,764 1,50,740 10.95
1993-94 13,533 1,21,790 9.00
1994-95 13,240 1,19,160 9.00
1995-96 12,580 1,25,460 9.97
What next
Production of chillies in this belt has been quite rewarding for the cultivators. Having enjoyed
good economic returns, there is reluctance to adopt to lesser remunerative crops. However, it
will be in greater interest of the cultivators to part with this crop for some time and resort to
other crops. Potential exists for production of other crops like castor, isabgol, methi, coriander
etc, which could also be quite rewarding. These crops could be raised with much less quantity
of water than required for chillies, thereby providing opportunities to occupy larger area, and
thus compensating in part the returns. Cumin cultivation though risky, is far more
remunerative. Should they stick to chilli cultivation, other means of crop protection should be
adopted and use of chemicals should be minimized.

242
Alternatives available
In order to strike a balance between the opportunities available for marketing of chilli and the
threats posed by the pests, IPM strategies need to be devised. The chemical means was the
quickest, effective and least labour intensive. Now that the limitations of this method as a
result of abuse of chemicals have come to the fore, it would be prudent to look for the
alternatives available, even if these are less effective and comparatively slow acting.
Biopesticides offer an effective means for management of some of the pests of chilli. NPV
formulations are available for Heliothis and Spodoptera species (Dhandapani & Jayaraj 1989;
Somasekhar et al. 1993). Bacterial formulations could also be used (Mathur et al. 1996). A
number of plant extracts have been found effective against the sucking pests
(Chandrasekharan & Veeravel 1998, Palaniswamy & Ragini 2000) though the concentrations
to be used could be higher and these may have to be used more frequently. For cultivators
already applying so many sprays of chemicals on chilli, this may not be any additional
burden. The advantage of clean environment and hazard free fruit for consumers will be a
bonus. Neem (Azadirachta indica) and Tumba (Citrullus colocynthis) cakes could be used for
the soil pests. Apart from providing protection from pests, these cakes when decomposed
serve as manure, supplying nutrients to the crop. Use of natural enemies could be made
against some pests (Balasubramanian et al. 1989). Table 5 below presents some alternatives
available for chilli crop.
Cultivators recognize the usefulness of marigold to suppress root knots induced by the
nematodes and have begun raising this plant in chilli fields. Marigold also fetches them
additional income through sale of flowers. Inter cropping with castor has proved beneficial in
reducing the level of pest injury to chilli, besides protecting the crop from cold winds during
frost. Work on barrier crops in chilli (Nelson & Natarajan, 1994) needs to be undertaken
under arid conditions of Jodhpur with locally available vegetation.
Efforts were initiated to develop lines acceptable to the local cultivators who prefer blood red
colored and pungent variety. The newly developed variety RCH-1 is becoming popular
among the cultivators in areas around Jodhpur, as it has good yield potential besides the
coveted qualities. Judicious use of highly toxic chemicals, efforts and co-operation of farmers
may help restore the glory of this once famous chilli growing tract.

243
Table 5 Alternatives to synthetic insecticides for chilli pests
Target pest Tool
Biopesticides
Helicoverpa armigera
Spodoptera spp
Nuclear polyhedrosis virus, Bacillus
thuringiensis var kurstaki
Attractants
Helicoverpa armigera
Spodoptera spp
Pheromone traps
Natural enemies
Polyphagotarsonemus sp Amblyseius ovalis
Helicoverpa armigera Campoletis chlorideae, Delta sp,
Chrysoperla carnea, Trichogramma
pretiosum
Tolerant / Resistant lines
Aphids and mites Jwala
Aphids Pant C-1
Polyphagotarsonemus sp GPC 77, GPC 80, KDSC 5-3-27, Jwala
Scirtothrips dorsalis Phule Sai (GCH-8), G-4, ACS-92-4, GPC
77, GPC 80, KDSC 5-3-27
Cucumber mosaic virus PSP111, Pusa Jwala, K-2, Jawahar Mirch,
X 235, Muslawad, MS 13,
Bhagyalakshmia, Punjab Lal, Perennial,
Plant Extracts
Aphids Garlic extract, Neem extract
Mites Adathoda vasica, Vitex negundo, Azarichta
indica, Aristilochia bracteata, Lippia
nodiflora, Argemone mexicana, Aloe sp
Thrips Azadirachtin
References
Anonymous (1999) Chillies. In: Singhal, V. (ed) Indian Agriculture. Indian Economic Data
Research Centre, New Delhi, 420-425 Anonymous (1997) Vital Agriculture Statistics 1996-97. Directorate of Agriculture,
Government of Rajasthan, Jaipur, 117pp. Balasubramanian, S. Arora, R.S. & Pawar, A.D. (1989) Biological control of Heliothis
armigera (Hubn) using Trichogramma pretiosum Riley and nuclear polyhedrosis virus in Sriganganagar district in Rajasthan. Plant Protection Bulletin (Faridabad) 41 (3-4), 1-9

244
Chandrasekharan, M. & Veeravel, R. (1998) Field evaluation of plant products against chilli thrips, Scirtothrips dorsalis. Madras Agricultural Journal 85(2), 120-122
Dhandapani, N & Jayaraj, S. (1989) Efficacy of nuclear polyhedrosis virus formulation for the control of Spodoptera litura (Fab.) on chillies. J. Biological Control 3(1), 47-49
Mathur, N.M., Qureshi, O.G., Gupta, H.C. & Srivastava, R.C. (1996) Field evaluation of Bacillus thuriengiensis var kurstaki for the management of Helicoverpa armigera Hubner on tomato in Rajasthan. Pest Management and Economic Zoology 4(1-2), 51-53
Nelson, S.J. & Natarajan, S. (1994) Influence of barrier crops on pests of chilli under semi-dry condition. South Indian Horticulture 42(6), 390-392
Palaniswamy, S. & Ragini, JC. (2000) Influence of certain plant extracts on yellow mite Polyphagotarsonemus latus (Banks) on chillies. Insect Environment 6(1), 25-26
Saxena, R.C., Srivastava, R.P., Singh, R. & Srivastava, A.K. (1990) Studies on residues of insecticides in/on locally marketed fruits and vegetables. Indian Journal of Entomology 52(2), 258-264.
Somasekhar, S., Jayapragasam, M. & Rabindra, R.J. (1993) Characterization of five Indian isolates of the nuclear polyhedrosis virus of Helicoverpa armigera. Phytoparasitica 21(4), 333-337

245
The Stockholm convention on persistent organic pollutants (POPs) and UNEP activities on POPs pesticides AGNETA SUNDÉN BYLEHN UNEP Chemicals, United Nations Environment Programme, 11-13 Chemin des Anémones, 1279 Châtelaine, Geneva, Switzerland
Abstract
Persistent organic pesticides are part of a larger group of chemicals known as Persistent
Organic Pollutants or POPs, which also includes industrial chemicals and unwanted by-
products such as dioxins that are formed during incomplete combustion processes. POPs
persist for long periods in the environment as they resist, to varying degrees, chemical,
biological and photochemical degradation (1). Furthermore, POPs bio-accumulate in fatty
tissues due to their lipophilic characteristics, and bio-magnify through the food-chain causing
adverse effects to health and the environment as critical concentrations build up in living
organisms. During the last two decades much attention has been given to this group of
substances at the international level after it became apparent that they are transported through
the environment across borders. Individual countries alone are unable to control the
environmental pollution from such border crossing substances, and critical concentrations
have been reached in some regions even in places where they have never been produced nor
used. Negotiations of a global legally binding instrument to reduce and / or eliminate releases
of POPs was started under the auspices of UNEP in 1998. In May 2001 over 120 countries
agreed and adopted this global treaty, now named the Stockholm Convention on Persistent
Organic Pollutants (3). Several other international agreements and activities also address
POPs, notably the Regional Convention on Long-Range Transboundary Air Pollution
(LRTAP) of the UN Economic Commission for Europe (UNECE) (2), the Global Programme
of Action for the Protection of the Marine Environment from Land-based Activities (GPA) (4)
and a number of regional seas agreements.
Landschaftsökologie und Umweltforschung 38 p. 245-249 Braunschweig 2002

246
Persistent organic pesticides under the Stockholm Convention
There are presently twelve POPs covered by the Stockholm Convention of which nine are
pesticides. The twelve substances are all chlorinated hydrocarbons and constitute an initial list
of POPs, which can be expected to increase in the future since the Convention contains a
procedure and criteria for adding new POPs as candidates for international action. The
pesticides are: aldrin, camphechlor(toxaphene), chlordane, DDT, dieldrin, endrin, heptachlor,
hexachlorobenzene (HCB) (also an industrial chemical and unwanted by-product) and mirex.
Parties can make proposals for adding new POPs to the Stockholm Convention once it has
entered into force, which it does when fifty countries have ratified it. Proposals must contain
information for both the chemical and its transformation products relating to the screening
criteria that concern persistence, bio-accumulation, potential for long-range environmental
transport and adverse effects. A POPs Review Committee will review this and other
information received from Parties, and will make recommendations to the Conference of
Parties that then decides whether to list the chemical in the Convention.
Pesticides scheduled for elimination and restriction under the Stockholm
Convention
All POPs pesticides except DDT, have been scheduled for elimination under the Stockholm
Convention, meaning that each Party to the Convention shall eliminate their intentional
production and use. There are, however, some uses for which it has proven difficult to
immediately switch to alternative chemicals or other approaches.
DDT is scheduled for restriction and its production and use for disease vector control is
considered an acceptable purpose under the Convention. Parties can produce and /or use DDT
for disease vector control when no locally safe, effective and affordable alternatives are
available, but production and use of DDT must be notified in a public DDT Register. Each
Party that uses DDT must provide information every three years on amounts and conditions of
use and the relevance of its use in their disease management strategy. Parties will also be
encouraged to develop an action plan inter alia to ensure that DDT use is restricted to disease
vector control; and to implement suitable alternative products, methods or strategies,
including resistance management strategies to ensure the continued effectiveness of such

247
alternatives. The Conference of Parties in consultation with the World Health Organization
will evaluate the continued need for DDT for disease vector control at least every three years.
By May 2001 32 countries had indicated the need to use DDT for disease vector control.
For other pesticides, except endrin and camphechlor (toxaphene), and for other uses of DDT,
Parties may register for specific exemptions that are identified for each pesticide in Annexes
A and B to the Convention. Termite control is the most apparent exemption, which is listed
for three pesticides, namely chlordane, heptachlor and mirex. By May 2001 there were 11
countries that had indicated the need for one of these as termiticide. Exemptions also include
for chlordane the use as an additive in plywood adhesives and for heptachlor the use in wood
treatment, and four countries have made such requests.
The Convention also provides for general exemptions that apply to all intentionally produced
POPs including exemptions concerning use for laboratory scale research and reference
standards, unintentional trace contaminants in products and articles, and constituents of
articles manufactured or already in use before or on the date of entry into force.
In addition to these provisions to eliminate or to restrict the production and use, there are also
provisions limiting the trade of intentionally produced POPs to environmentally sound
disposal or to Parties that have registered specific exemptions or acceptable purposes. Export
to non-Parties can only take place for the same exemptions/ urposes under certain conditions
and accountability requirements. Another set of control provisions concern the identification
and environmentally sound management of POPs in stockpiles and wastes. Parties must not
allow recovery, recycling, reclamation, direct reuse or alternative uses of POPs and must not
transport these materials across international boundaries without taking into account
international rules (e.g. the Basel Convention).
Parties must further develop strategies for identifying contaminated sites and ensure that
remediation is made in an environmentally sound manner. Developing countries and countries
with economies in transition will need technical and financial assistance and new and
additional financial resources will be provided by developed countries to meet agreed
incremental implementation costs. The Global Environment Facility has been identified as the
principal entity of the interim financial mechanism to handle funding of capacity building and
other related activities. Parties are required to develop plans for implementing the obligations

248
of the treaty and GEF eligible countries can receive support for these and similar enabling
activities.
UNEP activities related to POPs pesticides and alternative approaches for
pest and vector management
From the above it is obvious that the major issues regarding the elimination of pesticides in
the present list of POPs concern the use of DDT for disease vector control, in particular
malaria mosquitoes, and the use of chlordane, heptachlor and mirex for control of termites. In
efforts to eliminate these, governments should seek alternative approaches that are
sustainable. In particular, it will be important to ensure that these pesticides are not simply
replaced by other pesticides, but that the principles of integrated pest and vector management
(IPM and IVM) are adopted. Several problems are associated with pesticides, e.g. ecological
failures, secondary pest infestations, health concerns, and, not the least, the development of
resistance in pests and vectors to pesticides. Such problems have led to the promotion of IPM
and IVM, which constitute ecologically based control systems that combine different
techniques e.g. crop rotation, biological control, environmental management, screening, and
as a last resort, pesticides. Such approaches help cut external or indirect costs of pesticides
that may be quite high including health effects, environmental damages, loss of biodiversity,
and costs for regulation and monitoring. Such integrated approaches will also help preserve
the efficacy of pesticides for situations when they are absolutely needed.
It will further be extremely important to ensure that the alternative strategies used will not be
compromised by measures in other sectors, as has happened when, for example, resistance has
developed in disease vectors where the same or similar insecticides are used in agriculture or,
environmental modifications have created breeding grounds for malaria mosquitoes. In its
efforts to assist countries find more sustainable solutions to POPs, UNEP jointly with World
Health Organization (WHO) and the Food and Agriculture Organization of the United
Nations (FAO), is promoting close collaboration between sectors in order to identify and
implement opportunities that can bring mutual benefits (5). Such solutions must be based on
the local conditions and can be best sustained through active community participation.
Structures established under one sector such as Farmer Field Schools may, for example, very
well serve purposes of public health and the environment. The interrelationship between
environment, agriculture and health is hence key for identifying sustainable strategies that

249
effectively and efficiently will protect agriculture from pests, communities from diseases like
malaria and ecosystems from persistent pesticides.
References
Ritter, L., Solomon, K.R. & Forget, J. (1995) Persistent Organic Pollutants – An Assessment
Report on DDT-Aldrin–Dieldrin–Endrin–Chlordane–Heptachlor–Hexachlorobenze ne–Mirex–Toxaphene–Polychlorinated biphenyls–Dioxins and Furans; prepared for the International Programme on Chemical Saftey (IPCS) within the framework of the Inter.Organization Programme for the Sound Management of Chemicals (IOMC), WHO, Geneva
http://www.chem.unep.ch/pops/ http://gpanews.unep.org/ UNEP/FAO/WHO (2001) Workshop on Sustainable Approaches for Pest and Vector
Management and Opportunities for Collaboration in Replacing POPs Pesticides, UNEP, Geneva

250
The dynamics of herbicides in the water environment of Uzbekistan R.V. TORYANIKOVA, T.A. KARASEVA, O.A. LUTSENKO & E. NISHONOV Central Asian Hydrometeorological Research Institute, 72, K. Makhsumov Street, Tashkent 700052, Republic of Uzbekistan
Abstract
The processes of accumulation, detoxification and degradation of herbicides: propanyl, 3,4-
DCA and saturn were investigated in laboratory and field conditions. The laboratory
experiments were conducted in simulated microecosystems. The dynamics of herbicides
contents was investigated in two rice systems in the field conditions. These systems were
located in the Syrdarya and Chirchik River Valley and also in the reservoirs on the Southern
part of the Aral Sea. There were absent propanyl and 3,4-DCA in the Syrdarya and Chirchik
River waters practically. And, saturn was present in all reservoirs on the Southern part of the
Aral Sea. The investigation results allow to suppose that contamination of the Uzbekistan’s
reservoirs with propanyl and its metabolite 3,4-DCA did not occur. Saturn can be saved in the
reservoirs for the long time, therefore it can be transferred in long distances.
Introduction
Rice-growing is one of the most developed agricultural branches in Uzbekistan. The effective
development of this branch bases on use of many fertilizers and pesticides. Among of them
the herbicides is the most dangerous for the water ecosystems because of its high dozes use
and its higher stability in the environment.
The irrigation conditions in a rice field promotes to toxicants transfer into a drainage system
with consequent their washout of the rice field limits. Herbicides residues can migrate for
long distances with discharge and drainage waters and they accumulate in bed sediments,
water plants and biota.
Landschaftsökologie und Umweltforschung 38 p. 250-255 Braunschweig 2002

251
The purpose of our work was the research of accumulation, detoxification and distribution
processes in the system of water – water plant and bed sediments in the laboratory and field
conditions.
Investigation objects
The analysis of herbicides range and use volumes in rice-growing of Uzbekistan has shown
that their average quantity changed from 1.0 up to 18.44 kg/ha. In Tashkent (18.44 kg/ha),
Syrdarya (15.1 kg/ha), Surkhandarya (15.1 kg/ha) Provinces and the Republic of
Karakalpakstan (14.5 kg/ha) the herbicides were used most intensively, while propanyl use in
the most cases.
Saturn is the most toxic herbicide, it more toxic in twice than propanyl, in three times than
ordran, 20 times than 2,4-D and 2M-4X, and 500 times than basagran (Shilenko 1981).
Moreover, saturn is more persistent substance saved in irrigated soils of rice-growing fields
for long time (degradation period is 418 days) (Aleshin & Shilenko 1988).
Methods of investigations
Microecosystems were simulated in laboratory conditions. In this case, the aquariums by
volume of 15 cubic decimeters were used. The bed sediments, water plants and water of the
Syrdarya River (mineralization in 980 µg/dm3, pH=7.8) were put into the aquariums. Natural
conditions imitated with artificial lighting and aeration. Water temperature in the aquariums
was 21-23°C.
It is well known that the rice irrigation system water contains some quantity of propanyl
metabolite-3,4-dichlorineaniline always. Therefore, investigations of this substance
degradation processes in the water environment it was interesting. This problem was solved
by creation of three model microecosystems: propanyl was added to A aquarium; 3,4-DCA to
B aquarium; mixture of propanyl and 3,4-DCA to C aquarium, and saturn was added to D
aquarium.
The dynamics of herbicides contents was investigated in two rice systems in the field
conditions. These systems were located in the Syrdarya and Chirchik River Valley and also in

252
the reservoirs on the Southern part of the Aral Sea. Samples of water, bed sediments and
water plants were sampled and analyzed from the rice fields, discharge and drainage systems,
irrigation canals and Syrdarya and Chirchik rivers in summer season May to August, i.e.
during irrigation and discharges of water from the rice fields. Thus, we tried to trace
herbicides residue migration from the rice fields to the rivers. Determination of herbicides in
water, water plants and bed sediments was conducted in accordance to the methods which
were developed by Toryanikova et al. (1990, 1992).
Results
The results of longtime multifactor model experiment testified that the semi-decay period of
propanyl was 6-10 days in conditions of good insolation, intensive filtration and temperature
of 230C. In general, the processes of propanyl disappeararing from water, water plant and bed
sediments has the exponential character (Fig.1). Probably, the actual reaction of propanyl
degradation in the water environment is hydrolyze to 3,4-DCA, which is increase and reach of
the maximum in 6-10 days. The time of 3,4-DCA disappearing is higher too. The period of
semi-decay is 10-20 days in various options of the experiment (see Fig.1). The 3,4-DCA
degradation to 3,4-dichorineacetaniline (3,4-DCAA) found during laboratory investigations
too. 3,4-DCAA substance identified by gas-liquid chromatography and chromatomass-
spectrometry methods.
1 2 4 6 8 1 0 2 0 3 0
T i m e , d a y sPr o p a n y l i n w a t e rP r o p a n y l i n w a t e r p l a n t sPr o p a n y l i n b o t t o m s e d i m e n t sPr o p a n y l i n w a t e r3 , 4 - D C A i n w a t e r p l a n t s3 , 4 - D C A i n b o t t o m s e d i m e n t s
0 , 0 0 1
0 , 0 1 0
0 , 1 0 0
1 , 0 0 0
C , m g/c ub d m (k g )
Fig. 1 Propanyl and 3,4-DCA contents in water environment

253
Fig. 2 Saturn dynamic contents in water environment
Saturn is more persistence in model micro-ecosystems conditions. If propanyl and 3,4-DCA
are absent in water and water plants to 30-40 days observation practically, then high contents
of saturn is observed in water ecosystem after 5 months (Fig.2). Unfortunately, the water
plants were not survive even in the lighted and rich with oxygen aquariums not longer than a
month. However, indexes of a curve which is indicative of saturn intensive accumulation with
water plants, and its identity with a type of herbicide accumulation in bed sediments allow to
suppose about saturn high stability in water plants too.
By the field experiment is shown that the propanyl contents has changed from 0.001 up to
0.014 µg/dm3 for its standard consumption of 6-10 dm3/ha in water of the rice fields; and 0.5-
0.8 µg/kg in bed sediments. As a rule, its metabolite 3,4-DCA contents is higher in 10 times in
water and 2-3 times in bed sediments. The saturn contents (its standard consumption of 8-10
dm3/ha) reached up to 0.03 µg/ dm3 in water; and 8,5-9,0 µg/kg (maximal contents of 28.8
µg/kg) in bed sediments.
The herbicides contents in discharge and drainage water systems was C propanyl = 0.001-0.009
µg/dm3; С 3,4-DCA = 0.001-0.08 µg /dm3; and Csaturn = 0.003-0.075 µg /dm3.
The propanyl contents did not exceed the maximum-permissible concentration in a mouth of a
drainage system (Shuruzyak and Myrzachul Main Drain) which is running into the Syrdarya
River.
0
0 ,1
0 ,2
0 ,3
0 ,4
0 2 4 9 1 3 2 0 3 0 6 0 1 5 0d a y s
m g /d m 3 ( m g /k g )
in w a te r
in w a te r p la n ts
in b e d s e d im e n ts

254
Propanyl and 3,4-DCA did not find out in the water of Syrdarya and Chirchik Rivers
practically. Saturn was present in the most reservoirs of the Southern part of the Aral Sea, in
bed sediments its contents reached up to 6.5 µg/kg (maximum), average content was 1.25
µg/kg (Figs.1,2,3).
Fig. 3 Propanyl and 3,4-DCA contents in bottom sediments
Propanyl and its metabolite 3,4-DCA contents in the water environment objects of the
investigated rice water systems is different. However, the identical tendency of herbicide
contents was observed in moving off from the rice fields. Seasonal dynamics of rice
herbicides in bed sediments testifies about their maximal contents in summer (Fig.3). As a
rule, propanyl and its metabolite 3,4-DCA are absent in early spring and late autumn. Because
of high stability, saturn is saved in bed sediments of the reservoirs during an year.
Conclusion
The conducted investigations have allowed to conclude that absolute contamination of the
reservoirs with propanyl and its metabolite 3,4-DCA does not occur. Saturn can be saved in
the reservoirs for the long time, therefore it can be transferred in long distances.
References
Shilenko, Y.V. (1981) To ecological and toxicological assessment of herbicides used in rice-
growing. Bulletin of VNIIRice 30, 59-62, Moscow Aleshin E.P. & Shilenko, Y.V. (1988) Ecological problems of rice-growing. Bull.
Agricultural Sciences 11, 50-55
1
2
3
4
56
7
1
23
4
56 7
12
3
4
5
67
1
2
3
4
5
6
70
0 ,1
0 ,2
0 ,3
0 ,4
0 ,5
0 ,6
1 2 3 4 5 6 7
S a m p le s ite s
m g /c m 3 (m g /k g )
P ro p a n y l (M a y )P ro p a n y l (A u g u s t)3 ,4 -D C A (M a y )3 ,4 -D C A (A u g u s t)

255
Guideline 52.24.68-88. (1990) The methodical instructions on determination of the propanyl and its metabolite 3,4-dichlorineanilinecontents in surface waters. Tashkent, Uzbekistan
Guideline 4600430.10-92 (1992) The methodical instructions. A technique of determination of propanyl and saturn mass contents in bed sediments by GLC-method. Tashkent, Uzbekistan.

256
Experience ofcommunity IPM in Nepal NALINI SINGH UPADHYAYA Plant Protection Directorate, Department of Agriculture, Harihar Bhawan, G.P.O Box 1818, Lalitpur, Kathmandu, Nepal
Abstract
Integrated Pest Management (IPM), is a combination of management strategies that farmers
use to minimize the impact of pest and diseases on their crop. The emphasis of an IPM farmer
field school approach is a sustainable production through the conservation of natural bio-
diversity in the field. Nepal started this approach in 1997 and its success with farmers was so
immense, that community IPM was introduced in 2000. Farmers developed personal and
organizational capacities so they became trainers, planners and researchers to carry out
different IPM activities for their communities. Nepalese farmers have become better
managers, they have increased their yields, safeguard their health and protect the environment
14000 farmers have gone through farmer field school (40 % are women and 10 % are
illiterate).
Introduction
Nepal is an agricultural country and about 81 % of the country’s 22 million people depend on
the agriculture for subsistence. The share of agriculture in the national GDP is 40 %. Major
crops of Nepal are rice, wheat, maize, vegetables, potatoes and fruits. One of the main
constraints to increase agricultural production is yield losses due to diseases, insects,
pathogens, weeds, nematodes, mites, rodents and birds. An estimate annual yield loss is about
35 % of the total production. To reduce this loss farmers use synthetic pesticides, which are
expensive, cause negative environmental consequences and are health hazardous to the
growers and consumers. Integrated pest management (IPM) is a priority activity in line with
the government’s policy for reducing pesticides and increasing food production, food security
and sustainable agriculture.
Landschaftsökologie und Umweltforschung 38 p. 256-264 Braunschweig 2002

257
To minimize these economic losses, the farmers themselves are empowered to make their
own decisions in applying crop management strategies. These are based on their own analysis
of the agro-ecosystem and their knowledge generated by conducting studies in their own field.
The farmer’s field school (FFS) is a model of a non-formal education process of learning by
experiments and discovery and has proven to be very effective. This approach emphasized the
need for farmers participating in the farmer field school to understand the rice eco system.
The curriculum includes crop physiology, agronomy, identification of natural enemies, pests
and diseases, health risks to pesticides and group dynamics. The principle of IPM emphasized
in the FFS are; 1. Grow healthy crop, 2.Visit field regularly, 3.Identify and conserve natural
enemies and 4.During this process farmers become experts in their field management.
Facilitating farmers to understand biological control through field investigation are the key to
successful implementation of Integrated Pest Management.
IPM helps farmers to raise their crops yield and increases their income by improve returns on
investment. In Nepal program carried out by FAO for Community IPM in Asia, the
GCP/RAS/172/NOR has shown that IPM trained farmers increase their rice yield by about 15
to 25 % and reduce the use of pesticides by about 40 %.
Pest management practices and their problems in Nepal
In Nepal, chemical control has been the primary method of pest control in the past since its
introduction in 1950s. Pesticides are commonly used to control various economically relevant
pests and diseases. The consumption of pesticides per unit area is estimated to be 142 g/ha.
Some of the reasons for the increase of consumption of pesticides over the years are:
a. an increase in area and intensity of various vegetables (especially off season)
b. an increase in area under high yielding varieties of rice, for which farmers use high
inputs
c. sales promotion activities of pesticide dealers have motivated a large number of
farmers to use pesticide indiscriminately without caring for the bad effects on the non-
target species and the environment
d. excessive use of pesticides by farmers out of ignorance
At present 255 trade names have been registered in Nepal. In 2000, 108 mt active ingredients

258
pesticides were used. All these are imported. Although pesticide use in Nepal is very low
compared to neighbouring countries (India use annually 320 g /ha) the misuse of pesticides
has been a problem.
Need for Integrated Pest Management in Nepal
Considering the fact that:
a. Nepal needs to increase its crop productivity in a sustainable way.
b. Pests continue to cause serious crop losses.
c. Use of pesticides is the main method of pest control. Such continued heavy use of
chemicals leads to serious environmental and human health problem, pest resurgence,
new pest problems, development of resistance.
d. Farmers are often ignorant of pesticide use and need to be educated.
There is a real need for an alternative strategy, IPM therefore is considered to be the
alternative strategy.
National IPM Programme
The National IPM Program aims to make integrated pest management in major rice-vegetable
growing areas in Nepal and is based on field works and total participation of the farmers and
farming communities. The practice of IPM among farmers is achieved through direct training
in Season-long Farmers Field Schools (FFSs). Farmers are empowered to make their own
decisions in applying crop management strategies based on their own analysis of agro-
ecosystem and their knowledge generated by conducting studies in their own field. FFS
models of non-formal education process of learning by experiments and discovery has been
very effective. As the National IPM Program enters its 4th year of implementation, it now
aims at institutionalizing IPM support and activities at the field, district, regional and national
levels.
Major thrust are focused on:
A. Core Training Activities

259
1. Training of IPM Trainers (ToT)
An IPM training of trainers course is a season-long (16–18 weeks) training on IPM for
Assistant Plant Protection Officer and Assistant Extension Officers who are responsible for
conducting Farmer Field School at the district level.
2. I P M F a r m e r F i e l d S c h o o l ( F F S )
IPM Farmer Field School is a season-long training on IPM for farmers, facilitated by trained
IPM trainers (Assistant Plant Protection Officer APPO). Each FFS comprise of twenty five to
thirty farmers.
B. Follow-up Program Activities
1. This activity comprises refresher training to IPM trainers to strengthen technical,
management and facilitation skill.
2. Activities aimed to establish IPM communities through farmers' societies, farmers to
farmers training, farmers' participatory planning, implementation and farmers' science.
C. Horizontal and Vertical Linkages
Coordinated efforts are made to share the experiences and jointly plan and implement the
program. Linkages are made with government institutions (National Agricultural Research
Council NARC; Institute of Animal and Agriculture Science IAAS, Commodity Divisions)
and NGOs.
D. Focus on Development of IPM in Other Crops
Focus on development of IPM in other crops like potato, vegetable, fruits, tea and cotton is
felt.

260
IPM Activities
Initial activities
- Before Nepal's participation in the Technical Cooperation Project (TCP) 1997 the
program interventions were made with a concept of promoting the integrated use of
different pest control methods to avoid or minimize pesticide use.
- Program coverage included the use of diseases or pest tolerant varieties, use of biological
control of certain economic pests such as fruit flies in citrus and cucurbits, lepidopterous
pests in cotton and tomato and wooly aphid in apple and botanical pesticides extracted
from plant species such as Azodiracta indica, Acurus calamus, Zanthoxylum alatum.
- These interventions made before 1997 makes it clear that pesticide reduction strategy,
guided basically the Nepalese IPM Program rather than application of ecological
principles.
- It was the implementation of TCP project in rice in 1997 which brought Nepal into new
paradigm of the discovery based, participatory and farmer – based educational process
founded on the sound principles of agro-ecosystem analysis by farmers for decision
making on pest management strategy promoted through season long Farmer's Field
School.
Table 1 Different IPM Activities 1998-1999
Year Training of trainers for Officers
Number of Field Schools
Number of Farmers Trained
1998 1 / 35 35 875 1999 1 / 35 68 1700 2 / 70 103 2575
Current IPM Activities
The current phase of Regional Community IPM Program began in January 2000. The
beginning of new millennium is also the start of Community IPM in Nepal. Two year's
experience showed that the Rice IPM Farmers Field School is only the beginning, the entry
point, for a longer term process while farmers develop the personal and organizational
capacities necessary for sustaining agricultural and community development. Activities have
started which give focus on:

261
• Farmer as IPM Trainers (Farmer ToT, Farmer FFS)
Farmers have proven to be able and responsible trainers as these farmer trainers gain skill and
experience; they become an important resource for their community.
• Farmers as Planners
Alumni farmers develop local plan for deepening and disseminating IPM in their
communities.
• Farmers as Researchers
Farmers master basic scientific principles and learn to design studies and organize local
research geared to adverse their specific local problems and conditions.
• Farmers as Organizers
Graduates from FFS create forums and local organization for the exchange of information,
and for the discussion of study results work plans. Arrange for publication of leaflets, radio
program etc.
Three new programs as follow-up activities are introduced:
1. Participatory Planning and Implementation
This is a five session planning activity where FFS graduate farmers participate to do bottom-
up planning to solve the agriculture related location-specific problems encountered during
conducting FFS. After they have prioritized the activities they plan to implement most in the
following season by themselves.
2. Farmer to Farmer FFS The FFS graduate farmers receive 10 days Training of Trainers so that they themselves can organize and conduct season long FFS for their neighbors and communities with the financial assistance from various sources at the local level. 3. Farmer Studies Farmers master basic scientific principles and learn to design studies and organize local research geared to address their specific local problem. Farmers develop their scientific attitude and master basic scientific methods. They learn to design, conduct, analyze and interpret their own field research.

262
All these activities justify the goal of community IPM to institutionalize IPM at the local level
by putting farmers in control of the process of planning and implementation of their own IPM
Program.
Table 2 Different IPM Activities 2000-2001
Year ToT / Officers
ToT / Junior
Technicians
ToT / Farmers
Number of Field
Schools
Number of Farmers Trained
2000 6 / 156 89 2225 2001 1 / 35 1 / 35 206 5150
1 / 35 1 / 35 6 / 156 103 7375
Future Plans and Priorities
Based on the review of the present status of IPM in the country, efforts are be made to sustain
IPM in Nepal through governments and NGOs. In the nearby future emphasis will be given to
the following activities:
1. improved monitoring of field activities 2. expand the number of farmer trainers 3. strengthening of farmers trainers associations 4. improve and broaden skills of farmer trainers (training, facilitation skills, farmer
studies, participatory planning) 5. develop a vegetable IPM Program in the districts 6. strengthen NGO/GO collaboration 7. improve publicity of project activities, raise farmer and consumer awareness 8. increase gender sensitivity among IPM trainers and farmers 9. expand the IPM curriculum with post-harvest exercises 10. strengthening linkages with national scientists and other the institutions involved in
research and development of sustainable agriculture, 11. search for ways to secure further funding for the National IPM Program.
2002 and beyond
Although the IPM Program in Nepal has made tremendous progress since its launch in 1997,
it is still vulnerable and needs further support in order to sustain the activities. HMG/N will
increasingly take over the responsibilities to organise and fund district IPM activities but
financial and technical support will be needed for another 4-5 years to come, to:

263
1. improve the monitoring system
2. strengthen collaboration with NGOs
3. develop farmer trainers skills
4. build up farmers IPM organisations
5. strengthen links with research institutions
Broaden and sustain the IPM approach (different crops, related sectors, institutional
development).
Lesson learned
By December 2001, the National IPM Program in Nepal has trained over 121 trainers-of-
trainers, and more than 14000 farmers in the main rice growing districts. But so far, high
quality replication still remains a challenge. Main point that emerged out of the experience
includes:
• Introducing IPM cannot be compared to transfer of technology by experts to non-
experts. It requires facilitation of a learning process, and not adoption of a single
innovation. This means a paradigm change with respect to extension approach.
• The IPM Farmer Field School is a process, not a body of knowledge. The critical issue
in training is discovery learning focused on the ecology of the rice field, which can be
learned by observation, if the process is good. This makes the Farmer Field School
easy to be replicated.
• Training of IPM trainers requires the same learning process as farmers (season-long,
discovery-learning, field based). Learning IPM is directly related to daily farming
experiences and problems. It takes time and practice IPM trainers to acquire sufficient
knowledge and skills.
• Through their intensive IPM training, assistant plant protection officers became
committed to IPM and to the facilitation approach of training. This commitment could
sustain because of their position within the structure of the Department of Agriculture.
For farmers, season-long IPM training in Field Schools and ten-day training-of-
trainers appears to be enough to become good IPM trainers, since commitment and
communication skills usually exist among farmer trainers.

264
• Farmers are considered the best candidates to be the primary IPM trainers for farmers
in the future. The IPM Program is then to support farmer-conducted Field Schools
with funds and in the future APPOs will no longer able to do the field work which is
expanding, but they will be capable to do planning and monitoring of IPM activities at
a higher level.
• Several issues of primary concern include maintenance of training quality,
institutionalization, and task distribution of government officials or NGO staff who are
inevitably involved.
Conclusion
IPM is a program that is particularly suited to poor farmers because it does not require the use
of external resources and is compatible with the integrated farming systems associated with
poor subsistence farmers. It can increase agricultural productivity, reduce production risks,
increase farmer's income, improve their health, protect their environment and over all
empower the farmers, therefore it has become a successful and popular program in Nepal.

265
Analytical investigations on the fate of pesticides in soils of the Jhikku Khola catchment CLAUDIA VINKE, ROBERT KREUZIG & MÜFIT BAHADIR Institute of Ecological Chemistry and Waste Analysis, Technical University of Braunschweig, Hagenring 30, 38106 Braunschweig, Germany
Abstract
Investigations on conventional and integrated pesticide applications and their impact on soil
quality were performed at Jhikku Khola catchment. The experimental design was based on
laboratory batch experiments for data gathering on degradation and sorption as concentration
determining processes for pesticides under defined laboratory conditions. The target
compounds malathion, dimethoate, fenvalerate and metalaxyl were applied to khet and bari
soil, and batches were incubated at 20°C and 30 C in the dark. Soil samples were adjusted to
15 % moisture corresponding to approximately 40% of maximum water capacity. Further
batches were additionally performed under ponding conditions. In most experiments carried
out, the disappearance of the pesticides were mainly depending on soil moisture and
incubation temperature. The fungicide metalaxyl was found to be the most persistent
compound while the organophosphorous insecticide malathion disappeared most rapidly.
Model field studies were carried out at khet and bari investigation sites in order to validate
results of the laboratory experiments, as well. On khet land, higher disappearance rates were
determined for the target compounds emphasizing the significance of leaching under ponding
irrigation. The transport of metalaxyl and dimethoate into deeper soil layers was directly
corresponding to their water solubility whereas a transport by preferential flow had to be
assumed for the low water soluble fenvalerate.
Introduction In Nepal as in many other developing countries, the use of pesticides has increased during the
last decades to a worrying level leading yield reduction due to resistance, resurgence and
secondary pest outbreaks (Baker & Gyawali 1995). Therefore, the joint research project
Landschaftsökologie und Umweltforschung 38 p. 265-275 Braunschweig 2002

266
“Environmental risks of pesticides and sustainable development of integrated pesticide
management for mountain areas of developing countries considering socio-economic
conditions and taking Middle Mountains, Central Nepal as an example” (IPMS Project) has
been established in 1999. One of the main objectives has been the data gathering on Nepalese
farming practices and the assessment of their impacts on the environment. The research
activities were carried out in the Kabhrepanalchok district approximately 50km east from
Kathmandu as an example for an agricultural area with one of the highest pesticide
application rates in Nepal (CEAPRED 2000).
Within this project, fate and behaviour of pesticides in soils were investigated by the Institute
of Ecological Chemistry and Waste Analysis. According to application amounts and
frequencies at bari and khet investigation sites, 4 target compounds were selected: the
organophosphorous insecticides malathion and dimethoate, the pyrethroid fenvalerate and the
fungicide metalaxyl. Their chemical structures are illustrated in Fig. 1. As to generate a
thorough data basis, laboratory batch experiments were performed particularly regarding the
dependence of degradation processes on soil inherent moisture and incubation temperature.
Consequently, the results of these experiments were validated in field studies with
supplementary consideration of leaching processes under ponding conditions.
Fig. 1 Chemical structures of the target compounds malathion, dimethoate, metalaxyl and fenvalerate
OP
SO
S
OO
OO
OP
SN
S
OO
O
ClO
N
O
O
O
OO
N
malathion dimethoate
fenvalerate
metalaxyl

267
Experimental design
Laboratory experiments
The laboratory batch experiments were conducted with bari and khet soils concerning rain fed
and irrigated land, respectively. Selected physico-chemical properties of both soils are listed
in Table 1 indicating only little differences. The first series of batch experiments were
performed according to standard degradation experiments at 20 °C and 15 % soil moisture
under aerobic conditions in the dark (BBA 1986). Application rates of the target compounds
were due to good agricultural practice. Incubation periods were 0, 3, 7, 14, 28, 56 and 102
days. Taking the particular Nepalese climate and cropping systems into account, higher
temperature (30°C) and ponding conditions were additionally realized. Supplementary,
microbial activity and redox potentials were determined for each batch series.
Table 1 Physico-chemical properties of bari and khet soil
soil sand [%] silt [%] clay [%] Corg [%] PH
bari 54 32 13 1 5,0
khet 51 35 14 1 5,3
Field studies
From September 1999 until June 2001, conventional and integrated pesticide applications
were monitored at both investigation sites. In order to identify the impact on soil quality, plant
protection products containing the 4 target compounds were directly applied to fallow soil
surfaces in special model field studies. On bari land, one experiment was carried out after the
monsoon season to study the disappearance of the target compounds under rain fed irrigation,
only. Samples were taken from the superficial soil layer (0-5 cm) within 17 days after
application.
With special respect to the transport of pesticides into deeper soil layers under water ponding
conditions, 2 field trials were carried out on khet land, one after the dry season and another
after monsoon. Directly after pesticide applications, the field plots were ponded. Ponding
height was approximately 10 cm. In the first trial, samples were taken from the 0-5, 5-10,
10-20 and 20-30-cm soil layers. Sampling was conducted 0, 2, 4, 8, 14, 28 and 56 days after

268
the application. In the second trial, sampling activities were focused on 0-5, 5-10, 10-20, 20-
30, 30-40 and 40-50-cm soil layers and 0, 5, 7, 13 and 33 day intervals.
Target compound analysis
The analytical procedures followed multimethods usually applied in pesticide analysis (DFG
1991, Steinwandter 1989), which are described in detail by Kreuzig (1998). Field moist soil
samples were slurry extracted over night using an acetone/water mixture (2:1). The slurries
were subsequently submitted to a liquid/liquid partition with cyclohexane. After phase
separation and extract drying, gel permeation chromatographic clean up followed. Finally, the
target compounds were determined by gas chromatography using an electron capture and a
nitrogen/phosphorous specific detector. Limits of determination were 10 µg/kg dry soil.
Results and discussion
Degradation under standard laboratory conditions
The laboratory batch experiments under aerobic conditions which are predominantly
representative for terrestrical topsoils showed different disappearance times of the target
compounds applied. In both soils, malathion was found to be the least persistent pesticide
under investigation. Fig. 2 illustrates the results for bari soil. Within 14 days after application,
residues decreased from approximately 700 µg/kg to 10 µg/kg soil and DT50 values calculated
were ≤ 2 days. An intermediate persistence was revealed for dimethoate and fenvalerate. DT50
were 5 and 16 days. In contrast, the degradation of metalaxyl is characterized by a significant
lag phase within 14 days after application. Then, concentrations continuously dropped down
from 498 to 177 µg/kg bari soil.
Variation of test conditions
In supplementary batches, incubation temperature was adjusted to 30 °C and ponding
conditions were simulated. The disappearance of malathion was again too rapid to show any
dependence on the test conditions modified. Therefore, no accumulation under field
conditions could be derived from these laboratory tests

269
Fig.2 Disappearance of the target compounds in bari soil under standard laboratory conditions at 20°C and 15% soil moisture
In contrast, relevant differences were still determined for dimethoate (Fig. 3). On the one
hand, the temperature increase from 20 to 30°C corresponded with a faster degradation due to
the enhancement of soil inherent microbial activity. Whereas the residues in the experiment
with 15 % moisture and ponding at 20 C decreased from 486 µg/kg to 33 µg/kg and from 720
µg/kg to 48 µg/kg khet soil, respectively, dimethoate disappeared during 28 days in the
studies performed at 30°C. Thus, DT50 values dropped down from 8 to 2 days at 15%
moisture and from 14 to 4 days under ponding conditions. On the other hand, water ponding
led to a change from aerobic to anaerobic conditions during a few hours. According to this,
dimethoate disappeared slowly.
Particularly under ponding conditions at 20 C, the microbial degradability of fenvalerate is
definitely decelerated and a relevant persistence is revealed by the extended lag phase of 48
days (Fig 4). Then, residues disappeared until the end of the incubation period. According to
the other batches, differences are not ermerged very clearly and DT50 values ranged from 17
to 37 days.
0
100
200
300
400
500
600
700
800
0 20 40 60 80 100
days after application
concentration [µg/kg]
malathion dimethoate fenvalerate metalaxyl

270
Fig.3 Disappearance of dimethoate in khet soil under laboratory conditions at 20 C and 30 C with 15% soil moisture and water ponding
Fig. 4 Disappearance of fenvalerate in khet soil under laboratory conditions at 20 °C and 30 °C with 15 % soil moisture and water ponding
Nearly the same tendency was found for metalaxyl. At 15% soil moisture, this fungicide
continuously disappeared and, within 102 days, the residues fell under the determination limit.
Under ponding conditions, metalaxyl was identified to be the most persistent compound under
0
100
200
300
400
500
600
700
800
0 20 40 60 80 100days after application
concentration [µg/kg]
20 °C - 15 % water 30 °C - 15 % water 20 °C - ponding 30 °C - ponding
0
100
200
300
400
500
600
700
800
0 20 40 60 80 100days after application
concentration [µg/kg]
20 °C - 15 % water 30 °C - 15 % water 20 °C - ponding 30 °C - ponding

271
investigation although shorter lag phases occurred. Already after 56 days, concentrations were
132 µg/kg at 20°C and 12 µg/kg dry soil at 30°C. Thus, DT50 values varied between 8 and
47 days. At the end of the incubation period, no residues were detetectable.
0
1000
2000
3000
4000
5000
6000
0 2 4 6 8 10 12 14 16 18days after application
concentration [µg/kg]
malathion dimethoate fenvalerate metalaxyl
Fig. 5 Disappearance of the target compounds in bari soil under rain fed conditions after monsoon
Degradation under field conditions
Field studies performed at bari and khet investigation sites gave a similar impression on the
degradability of the target compounds. As it is examplified in Fig. 5, the concentrations of the
pesticides applied on bari dropped down rapidly within 17 days, e.g. the concentration of
dimethoate decreased from 5425 µg/kg to 23 µg/kg khet soil. The lag phases were reduced
and DT50 values listed in Table 2 were definitely below those of the laboratory trials. In total,
they met the lower range of the literature data (Perkow 1999, EXTOXNET 2000). Thus, no
long-term accumulation in soil is revealed under Nepalese field conditions. In order to
transfer results from laboratory to field approaches, varying soil temperatures and moisture
contents, differences in the microbial activity and the impact of photochemical processes have
to be additionally taken into account for an environmentally relevant risk assessment.

272
Table 2 DT50 values [days] of the target compounds in soils under standard laboratory and field conditions compared to literature data
pesticide DT50 lab
khet soil
DT50 lab
bari soil
DT50 field
bari soil
DT50
literature
malathion 0.2 2 1 1 – 251
dimethoate 8 5 2 4 – 201, 2
fenvalerate 17 16 7 15 – 902
metalaxyl 28 47 4 2 – 562 1: Perkow, 1999; 2:EXTOXNET, 2000
0
500
1000
1500
2000
2500
3000
0 2 4 8 14 28days after application
concentration [µg/kg]
20 - 30 cm10 - 20 cm5 - 10 cm0 - 5 cm Fig. 6 Degradation and transport of dimethoate in khet soil under ponding irrigation after dry season
Leaching under ponding conditions
Particularly under ponding conditions at khet site, leaching has to be considered as a second
concentration determining process for pesticides in soils. The significance of this approach
was still confirmed for dimethoate although this insecticide underlay a rapid degradation from
2736 µg/kg to 1055 µg/kg within 2 days after application (Fig. 6). Due to its high polarity and
water solubility of 25 g/L, dimethoate was distributed already in the topsoil down to 30 cm.
The same situation was given 8 days after application. Subsequently, residues markedly

273
drecreased according to the compound specific degradability. Furthermore, leaching into
deeper soil layers could not be excluded.
0
100
200
300
400
500
600
700
800
900
0 2 4 8 14 28days after application
concentration [µg/kg]
20 - 30 cm10 - 20 cm5 - 10 cm0 - 5 cm Fig. 7 Degradation and transport of metalaxyl in khet soil under ponding irrigation after dry season
Due to the higher persistence of metalaxyl, leaching tendencies could even be investigated
after the dry period in more detail. Directly after the application, residues only were found in
the 0-5-cm soil layer (Fig. 7). Here, concentrations of 774 µg/kg continuously decreased to
191 µg/kg within 28 days. In the other soil layers, the distribution consecutively moved on.
Due to its water solubility (8 mg/L) and its persistence, highest concentrations occurred in the
20-30-cm layer after 14 days. Due to degradation and leaching into subsoil, residues finally
fell under the determination limits. In the next monitoring period after monsoon, sampling
was continued down to 50-cm soil depth in order to investigate the transport into deeper soil
layers. In this investigation period, however, the disappearance of metalaxyl was highly
enhanced (Fig. 8). Thus, only little concentrations of 90 µg/kg and 43 µg/kg dry soil,
respectively, were already found in the in the 0-5-cm and 5-10-cm soil layers after 5 days.
Contrary to this, the subsoil was not significantly polluted. Therefore, leaching tendencies of
the first period could not be confirmed. This special situation may be caused in a water regime
changed by the monsoon period from unsaturated to saturated water flow conditions or the

274
formation of preferential water pathways, which are possibly combined with an enhanced
microbial activity resulting in higher degradability.
0
100
200
300
400
500
600
700
800
900
0 5 7 13 33days after application
concentration [µg/kg]
40 - 50 cm30 - 40 cm20 - 30 cm10 - 20 cm5 - 10 cm0 - 5 cm
Fig. 8 Degradation and transport of metalaxyl in khet soil under ponding irrigation after monsoon
Conclusion
These research activities on pesticide fate and behaviour in soils emphasized the necessity of
investigation site specific monitoring programmes with special respect on climate and
cropping system. According to this fact, a multistep control concept have to be applied on the
basis of standard and specialised laboratory test systems as well as on long-term field studies
in order to establish a pesticide registration procedure in Nepal.
References
Baker, S. L. & Gyawali, B. K. (1994) Promoting Proper Pesticide Use in Nepal. HMG
Ministry of Agriculture (Nepal)/Winrock Internat. Report Ser. 28, Kathmandu, Nepal BBA (1986) Fate of pesticides in soil – degradation, decomposition, metabolism. Standard of
the official pesticides registration (in German). Part IV, 4-1, Federal Research Center for Agriculture and Forestry, ACO Druck, Braunschweig
CEAPRED (2000) Socio-economic survey of the Jhikhu-Khola watershed. Center for Environmental and Agricultural Policy Research, Extension and Development (CEAPRED). Unpubl. IPMS Project Report, Kathmandu, 48pp.

275
DFG Pesticide Commision (1991) Multimethod S 19, manual of pesticide residue analysis (in German). 1-11 Lfg., VCH, Weinheim
EXTOXNET (2000) Data bank (http://ace.orst.edu/info/extoxnet) Kreuzig, R. (1998) Development of analytical methods for the differentiation of degradation
and sorption as concentration determining processes of pesticides in soils (in German). Habilitation dissertation, Natural Sci. Faculty, Technical University of Braunschweig (ISBN: 3-89720-291-3)
Perkow, W. (1999) Active ingredients of pesticides (in German). Paul Parey Verlag, Berlin Steinwandter, H. (1989) Contributions to the on-line method for extraction and isolation of
pesticide residues and industrial chemicals. Fresenius Z. Anal. Chem. 332, 752-754

276

277
Conclusions and Recommendations
of the
International Workshop on Environmental Risk Assessment
of Pesticides and Integrated Pesticide Management in Developing Countries
Kathmandu, Nepal, 6-9 November 2001
compiled by A. HERRMANN After three days of presentations and discussion, delegates tackled key issues which had arisen during the workshop. The conclusions and recommendations for improving the utility and effectiveness of future research and extension including education and training were prepared by three working groups. They relate to a number of key issues which were identified during the workshop, and condensed with the following items: • Pesticide issues • Environmental issues • IPM, risk assessment, pesticide regulation Each item was dealt with by a working group. Based on deficits defined by the working groups and on respective recommendations, a number of general recommendations was concluded, and approved by the workshop participants during the closing plenary session of the workshop. The following compilation comprises the recommendations separately for the three main issues and finally for the whole pesticide topic in general. With respect to pesticides it is recommended: • To promote the foundation of an independent non-governmental international organisation
(similar to ICIMOD) for pesticide education, training and transfer issues taking e.g. care of
(i) practical education and training of plant protection officers and farmers with
special demonstration plots. The cooperation with NGOs, schools and universities (for research) is desirable.
(ii) existing farmers field schools which should expand in number. Special demonstration sites would support education and training of farmers in proper pesticide application. Teaching experts would get their own education at the institution to be founded.
• To encourage governments to establish liaison institutions for affected ministries and
authorities to allow

278
(i) better coordination of measures with respect to the impact of pesticides for agriculture, consumption, environment and health;
(ii) putting new tax on new pesticides in the market to use the tax income for proper pesticide disposal.
• To encourage governments to ensure
(i) continuity of governmental staff experts on pesticides and IPM; (ii) to establish two laboratories for (a) pesticide quality and residue analysis, and (b)
monitoring purposes which are independent from each other; (iii) starting international cooperation for knowledge transfer in the fields of residue
analysis and concentration limits, e.g. with the EU; (iv) introduction of licensing pesticide traders, and their punishing for selling banned
pesticides; (v) pesticides being correctly contained and labelled (vi) safety practices in working with pesticides to be regulated and supervised.
With respect to environmental issues it is recommended: • To promote the ecological awareness to all persons and institutions affected by means of
(i) increasing the level of knowledge of farmers and consumers on pesticides; (ii) implementing monitoring networks.
• To point out relevant consequences and/or effects of ecological systems on local and
regional scales and to promote
(i) interdisciplinary research including medicine, agro-ecology, geo-ecology, hydrology, meteorology/climatology, soil science, socio-economy etc.;
(ii) development of adequate monitoring authorities, systems and networks. • To develop guidelines for measures of integrated environmental compatibility and
sustainability for governmental authorities which consider
(i) sophisticated prognostic models; (ii) international project-oriented cooperation and technical and scientific knowledge
exchange. With respect to risk assessment of pesticides, pesticide regulation and Integrated Pesticide Management (IPM) it is recommended: • To promote risk perception and awareness of pesticides, risk assessment and risk
reduction requiring
(i) knowledge of possible risks at all levels concerned (farmers, traders, extension officers, regulation authorities)
(ii) local infrastructure for residue and exposure analyses (iii) appropriate techniques (for risk assessment) (iv) external technical assistance (e.g. laboratory installation and control)

279
(v) strong pesticide regulation and registration according to risk assessed (vi) alternative solutions (e.g. IPM)
To build risk assessment capacities by establishing laboratory facilities and knowledge transfer with competent national and international partners and raising efforts for an international harmonisation of pesticide regulation and trade e.g. within SAARC countries including
(i) harmonisation of trade regulations and prohibition of export of banned compounds;
(ii) subsidy cancellation of pesticides and tax harmonisation. • To put IPM on the priority list of agricultural policies with adequate IPM implementation
strategy considering
(i) governmental and NGO capacity building for education at root level (through e.g.
farmers field schools) by staff training through experts and staff expansion;
(ii) crop pattern regulations by law and subsidies; (iii) creating incentives for better adoption of IPM method.
General recommendations
In general it is recommended: • To improve capacity building (formal and informal) and training on plant protection and
the environment for all persons affected (farmers, consumers, traders, experts, extension workers, regulatory people).
• To promote research and combination of knowledge and experience on all scales (village,
district, region, nation). • To establish adequate monitoring and control instances and networks, including laboratory
and data processing facilities and modelling techniques. • To attribute first priority to IPM in all fields of agriculture with all consequences,
including policy support. • To facilitate proper coordination of adequate measures among relevant institutions. • To promote and survey strict application of international conventions towards pesticide
industry to produce more environmentally-friendly products e.g. in line with IPM regulations.
The recommendations shall be broadly disseminated among workshop participants, governmental authorities, extension staff, the scientific community and affected NGOs, INGOs and international governmental bodies.

280
Authors Index APEL, H................................................................................................................... 1/ 14 ARSENI � , I.............................................................................................................. 120 BAHADIR, M........................................................................................................... 99/265 BALAŽ, J................................................................................................................. 120 BHANDARI, N.P..................................................................................................... 156 CENTNER, T.J......................................................................................................... 26 EITZINGER, J.......................................................................................................... 120 GHIMIRE, M............................................................................................................ 90 GUNTER, L.F.......................................................................................................... 26 HERRMANN, A....................................................................................................... 38 HOSSAIN, Z............................................................................................................. 49 IRHAM..................................................................................................................... 62/73 ISRAEL, S................................................................................................................ 111 KANSAKAR, S.R.................................................................................................... 82 KANSAKAR, V.B.S................................................................................................ 90 KARASEVA, T.A.................................................................................................... 250 KHANAL, N.R....................................................................................................… 90/168 KO� I, I..................................................................................................................... 120 KREUZIG, R............................................................................................................ 99/265

281
LALI � , B..............................................................................................................…. 120 LODHA S................................................................................................................. 111 LUTSENKO, � .� .................................................................................................... 250 MARIYONO, J......................................................................................................... 62 MAWAR, R.............................................................................................................. 111 MIHAILOVIC, D.T.................................................................................................. 120 NEUPANE, F.P.....................................................................…................................ 205 NISHONOV, B.E................................................................................................…. 250 PALIKHE, B.R......................................................................................................... 130 PAUDYAL, M.S………………………………………………………………….. 1/ 14 PIEPHO, B................................................................................................................ 142 POKHREL, A.P........................................................................................................ 82 PRAJAPATI, S.B.................................................................................................… 82 PRAJAPATI-MERZ, B.........................................................................................… 156 PUJARA, D.S........................................................................................................... 168 RICHTER, O............................................................................................................ 1/ 14 RAHMAN, S............................................................................................................ 49 SCHUMANN, S...................................................................................................... 38/178/190 SHARMIN, L........................................................................................................... 49 SHRESTHA, P.L...................................................................................................... 205 SINGH, A................................................................................................................. 224 SINGH, M.P............................................................................................................. 236 STICHLER, W......................................................................................................... 190 SUNDEN-BYLEHN, A............................................................................................ 245 TORYANIKOVA, R.V.........................................................................................… 250 UPADHYAYA, N.S.................................................................................................. 256 VINKE, C................................................................................................................. 265