Centre for Population Annual Population Statement 2020
103
POPULATION STATEMENT CENTRE FOR POPULATION December 2020
-
Upload
khangminh22 -
Category
Documents
-
view
0 -
download
0
Transcript of Centre for Population Annual Population Statement 2020

POPULATION STATEMENT CENTRE FOR POPULATION
December 2020

ii | Centre for Population
© Commonwealth of Australia 2020
ISBN 978-1-925832-23-5
This publication is available for your use under a Creative Commons Attribution 3.0 Australia licence, with the
exception of the Commonwealth Coat of Arms, the Treasury logo, photographs, images, signatures and where
otherwise stated. The full licence terms are available from http://creativecommons.org/licenses/by/3.0/au/legalcode.
Use of Treasury material under a Creative Commons Attribution 3.0 Australia licence requires you to attribute
the work (but not in any way that suggests that the Treasury endorses you or your use of the work).
Treasury material used ‘as supplied’.
Provided you have not modified or transformed Treasury material in any way including, for example, by
changing the Treasury text; calculating percentage changes; graphing or charting data; or deriving new
statistics from published Treasury statistics — then Treasury prefers the following attribution:
Source: Centre for Population 2020, Population Statement, the Australian Government, Canberra.
Derivative material
If you have modified or transformed Treasury material, or derived new material from those of the Treasury in
any way, then Treasury prefers the following attribution:
Based on Centre for Population analysis / data.
Use of the Coat of Arms
The terms under which the Coat of Arms can be used are set out on the Department of the Prime Minister and
Cabinet website (see www.pmc.gov.au/government/commonwealth-coat-arms).
Other uses
Enquiries regarding this licence and any other use of this document are welcome at:
Manager
Media and Speeches Unit
The Treasury
Langton Crescent
Parkes ACT 2600
Email: [email protected]

Centre for Population | iii
CONTENTS
Contents.......................................................................................................................................................... iii
From the Minister for Population, Cities and Urban Infrastructure .................................................................. 1
From the Executive Director of the Centre for Population ................................................................................ 2
Summary .......................................................................................................................................................... 3
1. How our population has changed (1988-89 to 2018-19)....................................................................... 8
1.1 Overview of the last 30 years ..................................................................................................................... 8
1.2 National population .................................................................................................................................. 11
1.2.1 Natural increase ............................................................................................................................... 13
1.2.2 Net overseas migration .................................................................................................................... 19
1.2.3 Net internal migration ...................................................................................................................... 21
1.3 State and territory populations ................................................................................................................ 25
1.4 Capital city and rest-of-state populations ................................................................................................. 36
2. Our future population (2019-20 to 2030-31) ...................................................................................... 46
2.1 Overview of the next 10 years .................................................................................................................. 46
2.2 National population .................................................................................................................................. 49
2.2.1 Natural increase ............................................................................................................................... 52
2.2.2 Net overseas migration .................................................................................................................... 55
2.2.3 Net internal migration ...................................................................................................................... 58
2.3 State and territory populations ................................................................................................................ 60
2.4 Capital city and rest-of-state populations ................................................................................................. 71
3. Technical appendix ............................................................................................................................ 78
3.1 Methodology ............................................................................................................................................. 78
3.1.1 Population projections ..................................................................................................................... 78
3.1.2 Net overseas migration forecasts .................................................................................................... 79
3.2 Assumptions .............................................................................................................................................. 80
3.2.1 Fertility ............................................................................................................................................. 80
3.2.2 Mortality........................................................................................................................................... 81
3.2.3 Net overseas migration .................................................................................................................... 82
3.2.4 Net internal migration ...................................................................................................................... 85
3.3 Limitations and uncertainty ...................................................................................................................... 88
Glossary ......................................................................................................................................................... 91
Notes ................................................................................................................................................................ 91
Definitions ........................................................................................................................................................ 92
References ..................................................................................................................................................... 95


From the Minister for Population, Cities and Urban Infrastructure
Centre for Population | 1
FROM THE MINISTER FOR POPULATION, C ITIES AND URBAN INFRASTRUCTURE
The Hon Alan Tudge MP
Minister for Population, Cities and Urban Infrastructure
Acting Minister for Immigration, Citizenship, Migrant Services and Multicultural Affairs
In 2019, the Australian Government created the Centre for Population to provide a single point of analysis to assess, monitor and project changes to the population. The Government also committed to publishing an annual Population Statement containing the Centre’s analysis.
This is the first such Statement, providing a major analytical contribution and a foundation for further analysis.
The Statement includes a discussion of how our population has changed and how it is expected to change in the future spanning states and territories, capital cities and regions, by age and gender.
In 2020, the Population Statement has a timely focus on the consequences of the COVID-19 pandemic. We all know the health and economic consequences of the pandemic, but the impact on our population has been equally extraordinary. This year, for example, we expect to see the slowest population growth since World War I. This has largely been due to closing the international borders and the resultant change in net overseas migration from averaging over 200,000 per annum for the last decade to negative 72,000 this year.
The pandemic has also had an impact on internal migration between states and will contribute to a lower fertility rate.
This Population Statement provides the transparent and meaningful analysis needed to help build a clear evidence basis and further inform policy. At this time of heightened uncertainty, we need high quality data and research to support decision-making as we navigate through the recovery and beyond.
Developed in consultation with the states and territories, local government, expert working groups and academics, the Statement delivers on the commitment made by government leaders when they agreed on the National Population and Planning Framework in February this year.
This Statement presents the analysis and projections needed to inform long-term policy challenges raised by demographic change and the short-term challenges we face in our recovery from the pandemic. Some of these challenges are more acute as a result of the COVID-19 pandemic which has rapidly changed our overseas migration levels and limited the ways people have been able to move domestically.
As we better understand trends in our population, we can better answer future population challenges. It will inform decisions on infrastructure, services and housing that support growth, as well as help us better understand and analyse population distribution across the country.
Australia has a diverse and growing national population with many local and regional success stories.
Understanding these stories and recognising the vastly different dynamics of Australia’s states and territories,
cities and regions is vital to effectively plan for the future.

Population statement
2 | Centre for Population
FROM THE EXECUTIVE D IRECTOR OF THE CENTRE FOR POPULATION
Victoria Anderson
Executive Director
Centre for Population
This Population Statement is the first in an annual series that will provide a comprehensive national picture of
how the Australian population has changed and how we expect it to change in the future.
The Statement analyses the last 30 years of population history in Australia, starting just before the recession of
the early 1990s. This analysis is focused on informing projections of the future population to the end of the
decade with reference to the main components of population change — overseas migration, natural increase
and internal migration. Future population statements will update this work annually and provide further
insights into what has changed from the previous year.
The Centre houses a dedicated team of population, policy and data analysts whose role is to analyse population
dynamics, understand past trends and project future changes.
The Centre also plays an important role in enriching the population evidence base with timely insights into the
impacts of the COVID-19 pandemic, including commissioning and publishing papers on Recent Impacts on
Australia’s Population: A Quick Guide, A Projection of Australia’s Future Fertility Rates, and work underway on
other population research topics.
Most recently, the Centre funded the Australian Bureau of Statistics to release early provisional Regional
Internal Migration Estimates in November 2020, which provides an early look at the impacts of COVID-19 on
people’s decisions to move around Australia.
Transparency and openness to scrutiny are also necessary if the Centre is to advance the quality and reliability
of population analysis available to governments and the public. In compiling this first Population Statement,
the Centre has drawn upon external input and expertise from a number of academics and population experts.
The Centre is working with other Australian Government departments and agencies, all states and territories,
and the Australian Local Government Association to share information, leverage collective expertise, and
compile accurate data and informed insights — all of which have informed this Statement.
The challenges of 2020 have and will continue to cause an environment of uncertainty for those wanting to
understand and predict population dynamics.
This heightened level of uncertainty makes the projections in this Statement sensitive to new data — especially
data clarifying the early known effects of COVID-19, the effects of any new COVID-19 outbreaks, as well as the
decisions made and restrictions imposed by governments to help manage the pandemic. The Statement,
therefore, plays an important role in pulling together the available information at a point in time, and clearly
setting out how it is used to inform population projections.
I look forward to engaging with our stakeholders on this first annual Population Statement and thank those
involved in its preparation.

Population statement
Centre for Population | 3
SUMMARY
The National Population and Planning Framework tasks the Centre for Population to prepare an annual
Population Statement as part of national efforts to increase understanding about populations, population
change and its implications for all levels of government.
COVID-19 will likely have an impact on Australia’s future population of a magnitude not seen for several
generations. Consequently, the Statement comes at a time when there is a real need for good quality and
coherent population projections built on transparent assumptions.
To estimate future population, it is necessary to look back and understand historical population trends and
then apply judgment about the extent to which past trends should be applied to future projections.
Part I of the Statement looks back over the last 30 years of official population statistics, which are complete
across national, state and territory, and capital city and rest-of-state aggregations to 30 June 2019. The analysis
extends back to 1988-89, just prior to Australia’s last recession in the early 1990s.
Australia’s population was 25.4 million at 30 June 2019, having grown around 1.4 per cent a year on average
since it was 16.8 million at 30 June 1989. Australia’s population growth over the last decade has been
1.6 per cent a year. This is higher than the long-run average annual rate of 1.4 per cent since 1971 when the
Australian Bureau of Statistics estimated resident population series begins. Around two-thirds of Australia’s
population live in the 8 capital cities with the share increasing from 65 per cent at 30 June 1988 to 68 per cent
at 30 June 2019. Over this period, most capital cities grew faster than the rest-of-state areas.
Part II of the Statement provides the Centre’s best estimates of future population (the central case scenario)
with projections commencing from 2019-20 and extending just beyond the end of the decade to 2030-31. The
onset of COVID-19 is expected to dominate estimates of future population in the near term, particularly
through its impact on net overseas migration. However, longer-term trends will continue to play out; such as
the ongoing decline in the fertility rate and slowdown in the number of people who make interstate or
intrastate moves.
In the central case, Australia’s population is projected to increase to 28.8 million by 30 June 2031. While this
reflects population growth of around 1.1 per cent a year on average, population growth is projected to
commence at just 0.2 per cent in 2020-21 and then 0.4 per cent in 2021-22. It is then projected to increase to
1.3 per cent by 2023-24 before declining slightly to 1.2 per cent from 2029-30.
The projected slowdown in population growth at the end of the decade reflects Australia’s ageing population
and is consistent with the experience of other developed countries. Since the late 1970s, Australia’s fertility
rate has been below the replacement rate of 2.1 babies per woman. Australia’s fertility rate of 1.66 last
observed in 2018-19 is already the lowest on record. It is assumed to fall further in future as Australian families
continue to have children later in life and have fewer children overall when they do.
The strong migration Australia has historically attracted has slowed population ageing. Over the last decade,
net overseas migration has contributed around 0.9 percentage points a year on average to Australia’s average
annual population growth of 1.6 per cent. Australia’s population growth over the last decade from net overseas
migration alone is more than the total population growth of many developed countries. It is 1.5 times the OECD
average population growth over the same period. The policy emphasis on skilled migration since the mid-1990s
has led to the selection of migrants who are younger, on average, than the resident population and of an age
when they are more likely to have children. This has contributed to births remaining relatively stable despite
falling fertility rates.

Population statement
4 | Centre for Population
Migration has slowed, but not halted or reversed, the ageing of Australia’s population. The share of people
aged 65 and over increased from 11 per cent on 30 June 1989 to 16 per cent by 30 June 2019. This is projected
to rise further to 20 per cent by 30 June 2031. Population ageing has been slower in the capital cities compared
to the rest-of-state areas, even though fertility rates are lower and life expectancies are generally higher in the
capital cities. Several factors have contributed to the younger age structures of capital cities, including a net
outflow of young people from regional areas to capital cities (Bourne, Houghton, How, Achurch, & Beaton,
2020), higher levels of overseas migration into capital cities, and older adults migrating to coastal areas (Bureau
of Infrastructure, Transport and Regional Economics, 2011). However, the Regional Australia Institute has
found that despite the net loss of younger people from regions, there is also a sizeable flow of young people
migrating from capital cities to rest-of-state areas, and between regions (Bourne, Houghton, How, Achurch, &
Beaton, 2020).
Given the importance of net overseas migration to the size and composition of the population, it should come
as no surprise the major effect of COVID-19 on population growth will be its impact on net overseas migration.
Australia is forecast to record the first net outflow of migrants from Australia since the end of World War II. In
the central case, arrivals are assumed to be restricted while onshore migrants on temporary visas are assumed
to depart as normal. For a short period, natural increase is projected to be the main driver of population
growth and will account for more than 60 per cent of Australia’s population growth for the first time since the
1990s.
To a lesser extent, COVID-19 is also expected to affect household decisions about family size and moving house
— between and within states and territories. This is not expected to be due to health implications of COVID-19,
but rather to the economic uncertainty associated with the pandemic and activity restrictions introduced to
limit its spread.
Historically, the level of internal migration and families’ decisions about children have been influenced by the
economic cycle. People are more likely to make an internal move during good times; for example, when they
can find a job at their desired destination. They are less likely to move during times of economic uncertainty.
Some families are likely to delay decisions to have children during times of economic uncertainty and, instead,
wait to have children as the economy stabilises and future prospects become more certain.
As a result of activity restrictions and economic uncertainty associated with the pandemic, the fertility rate and
the proportion of the population migrating internally are expected to fall in the immediate term and then
recover as the effects of COVID-19 lessen. While the expected level is temporarily lower due to COVID-19,
internal migration and fertility were already at historically low levels and would have been projected to decline
even in the absence of COVID-19.
Future population growth at every geographic level analysed is projected to slow in the near term and then
recover. This recovery is not to the growth rates observed in the lead-up to the onset of the pandemic in
2018-19, but instead to the estimated growth rates that would have occurred in the absence of COVID-19. This
reflects the expected trend that population growth will slow gradually over time as future fertility declines and
fixed future net overseas migration contributes less to annual population growth. Faster growth during and
following the recovery is also not expected to be high enough to compensate for the slow growth expected in
the near term.
Taken together, this means that future population across all geographic levels analysed is projected to be
smaller than it would have been in the absence of COVID-19. Australia’s population is estimated to be around
4 per cent smaller (1.1 million fewer people) by 30 June 2031 than it would have been in the absence of
COVID-19.
Sydney is projected to grow to around 6.0 million by 30 June 2031. Despite the immediate effects of COVID-19,
Melbourne is projected to overtake Sydney to become Australia’s largest city in 2026-27, growing to an
Population statement
Centre for Population | 5
estimated 6.2 million by 30 June 2031. Given that capital cities receive the majority of net overseas migration,
the absolute and proportional effects of COVID-19 are projected to be felt more in the capital cities. Following
the recovery, capital cities are then projected to return to higher rates of growth than the rest-of-state areas in
each state, with the share of population living in capital cities rising in every state and territory. The population
share in cities is projected to increase from 68 per cent last observed at 30 June 2019 to 69 per cent by 30 June
2031. The Government has a number of initiatives in place to support population growth in the regions and
some early indicators suggest that COVID-19 may be disrupting the historically observed patterns of overseas
and internal migrant settlement — at least in the short term. It remains to be seen how this may play out in the
future.
The ways in which the COVID-19 pandemic will shape our future are still uncertain. The projections in this first
Population Statement, as with all projections, rely heavily on the assumptions underpinning them. A number of
factors influence these projections of future population; primarily domestic and global economic conditions
and the timing of decisions to impose or remove restrictions on domestic and international borders. It has,
therefore, been important to apply expertise and judgment in estimating the effects of the pandemic on future
population in a rapidly changing environment.
Given the uncertainties and the importance of timely and well-informed estimates of future population, this
Statement contains 2 counterfactual scenarios: one estimates future population where the COVID-19 pandemic
never occurred (‘pre-COVID-19 scenario’) and the other estimates future population based on ongoing
restrictions and localised outbreaks (‘extended restrictions scenario’).
The pre-COVID-19 scenario allows separation of the likely effects of the pandemic on the future population
from trends that were apparent prior to the outbreak. This scenario is based on pre-COVID-19 assumptions.
When compared to the central case, it informs estimates of the impact of COVID-19 on the size and distribution
of the population. Australia’s total population is projected to be 29.9 million by 30 June 2031 in the
pre-COVID-19 scenario, reaching 28.8 million roughly 3 years earlier (by 30 June 2028) than is projected in the
central case.
The extended restrictions scenario projects what the future population might look like if some of the
restrictions to manage the pandemic are extended beyond those in the central case by a further 12 months.
This scenario shows how changes, even relatively minor ones, to the assumptions in the central case could
affect the national population. Under the extended restrictions scenario, it is estimated that future population
would reach around 28.5 million by 30 June 2031, needing roughly another year to reach the 28.8 million
projected under the central case.
Part III of the Statement provides a guide to the forecasts and projections in this Statement and details the
assumptions and methodology applied. Because of the changing nature of decision-making to manage the
pandemic, new information can have a meaningful impact on the projections in this Statement. The
introduction and release of new data will shed further light on short-term trends.
Population projections underpin economic and fiscal forecasts, policy decisions and program design and
implementation across all levels of government. Regularly updated and transparent estimates of the future
population, along with comprehensive analysis of past trends, will complement historical data from the
Australian Bureau of Statistics and provide a better foundation for policy decisions that guide Australia’s
economic recovery.
Data for the projections in the Statement are available to compare and download at www.population.gov.au.


Part I — How our population has changed (1988-89 to 2018-19)
Centre for Population | 7
PART I — HOW OUR POPULATION HAS
CHANGED (1988-89 TO 2018-19)

Part I — How our population has changed (1988-89 to 2018-19)
8 | Centre for Population
1. HOW OUR POPULATION HAS CHANGED (1988-89 TO 2018-19)
1.1 OVERVIEW OF THE LAST 30 YEARS
The impact of COVID-19 on Australia’s future population will be of a magnitude not seen for several
generations. To inform projections of future population, Part I of the Statement analyses in detail the
population trends from the last 30 years of official population statistics.
The Australian Bureau of Statistics’ estimates of population, with detail down to the capital city and
rest-of-state level, are available to 30 June 2019. The analysis in this section goes back to 1988-89, just prior
to Australia’s last recession in the early 1990s.
The size and distribution of the population is affected by the components of population change. At the
national level, these components are natural increase (births minus deaths) and net overseas migration. Net
interstate migration is a third component for analysis at the state and territory level, and net intrastate
migration is a fourth component of change at the capital city and rest-of-state level. Part I of the Statement
explores in detail these drivers of the size and distribution of the national population, for the states and
territories (‘the states’),1 and then for capital cities and rest-of-state areas.
Main points:
• Australia’s population grew at an average rate of 1.4 per cent a year since the start of the estimated
resident population series in 30 June 1971. Growth over the last decade ran slightly higher at
1.6 per cent a year on average.
• In recent years, natural increase added around 150,000 people a year to the Australian population.
Over the last 30 years, the total fertility rate fell from 1.84 babies per woman in 1988-89 to 1.66 in
2018-19. Life expectancies at birth increased and are some of the best in the world. Despite these
improvements, the number of deaths has grown faster than the number of births. As a result, natural
increase has become smaller as a proportion of the population.
• Over the same period, net overseas migration has been the main driver of Australia’s population
growth. Natural increase was briefly the main driver of population growth during the early 1990s
recession, but net overseas migration has consistently contributed more to population growth since
2005-06.
• Net overseas migration has not only contributed to population growth directly, but has also lifted
natural increase and helped to maintain the number of births a year even though the fertility rate has
fallen over time. This is because migrants coming to Australia have been younger on average than the
resident population and more likely to arrive at an age when they may have children.
• The intake of migrants who are younger on average than the resident population has helped to slow,
but not reverse, population ageing.
• The composition of migrants to Australia has changed over time as policy settings shifted to target
skilled migration over family reunion, as well as allowing for an increased flow of temporary migrants
who are in Australia for an extended period but do not intend to settle here. For example:
1 Throughout the Statement, references to the ‘states’ or ‘each state’ includes the Northern Territory and the Australian
Capital Territory.

Part I — How our population has changed (1988-89 to 2018-19)
Centre for Population | 9
– the permanent skilled intake today is almost 5 times greater than in 1996, while the family intake
is only 60 per cent of the peak that occurred in the late 1980s
– the annual net flow of students, temporary skilled workers, working holiday makers and other
temporary migrants has increased from 82,000 in 2004-05 to 189,000 in 2018-19.
• Australia’s population has grown older over time. The share of people aged 65 and over increased
from 11 per cent on 30 June 1989 to 16 per cent by 30 June 2019. The median age increased from
32 to 37 years over the same period.
• Population growth in Australia has varied widely across cities and regions and has been largely shaped
by the flow of net overseas migration and net internal migration. While the contribution to growth
from natural increase has varied across parts of the country, it has been stable over time, albeit
declining gradually.
• Australia has high rates of internal migration compared to other countries (Australian Bureau of
Statistics, Population Shift: Understanding Internal Migration in Australia, 2018), although the rate of
internal migration (the number of people who move as a proportion of the total population) has been
declining over time.
• The level of internal migration — inter- and intra-state — tends to follow the economic cycle as people
are more likely to move in good economic times and are less willing to take chances in times of
recession or uncertainty.
• The geographic pattern of interstate migration, or the direction in which it flows, has varied across the
states over the last 30 years. In this period, New South Wales and South Australia have typically had a
net loss of people to other states, while Queensland has typically had a net gain. Where the pattern of
interstate migration has changed, it can partly be attributed to a change in the relative economic
prospects of a state. This was observed in Western Australia and the Northern Territory, which are
linked to employment opportunities such as the mining and resource cycle, and also in Victoria over
the last few decades and Tasmania in recent years.
• The geographic distribution of net overseas migration and internal migration has also changed the
distribution of the population around the country over time.
• Historically, the capital cities have attracted a larger share of net overseas migration than the
rest-of-state areas. Given overseas migrants tend to be, on average, younger than the overall
population of Australia, capital city populations tend to be younger and also age more slowly relative
to the rest-of-state areas. The difference in ageing is also driven by internal migration into capital cities
of younger people from the rest-of-state areas (Bureau of Infrastructure, Transport and Regional
Economics, 2011). This is despite fertility rates generally being higher and life expectancies being lower
in rest-of-state areas (Australian Bureau of Statistics, Births, Australia, 2019; Australian Bureau of
Statistics, 2016-18 Life Tables, 2019).
• Overseas migrants contributed 26 per cent of the population growth in the rest-of-state areas of
Australia between 1996 and 2016. In certain regions, migrants contributed more than 50 per cent of
the population growth (The Treasury and the Department of Home Affairs, 2018).
• Just over two-thirds of the overall population lives in capital cities and cities have grown faster than
the rest-of-state areas in almost every state. At 30 June 2001, 85 per cent of the overall population
lived within 50 km of the coast. By 30 June 2019, that share had increased to 87 per cent, equating to
over 22 million people (Australian Bureau of Statistics, Regional population, 2018-19, 2020).

Part I — How our population has changed (1988-89 to 2018-19)
10 | Centre for Population
A SNAPSHOT OF OUR CURRENT POPULATION, 30 JUNE 2019
Note: The population data is taken from the release for the March 2020 reference period for the states and from the
2018-19 reference period for capital cities and rest-of-state populations.
Source: (Australian Bureau of Statistics, Regional population, 2018-19, 2020; Australian Bureau of Statistics, National, state
and territory population, March 2020, 2020)

Part I — How our population has changed (1988-89 to 2018-19)
Centre for Population | 11
1.2 NATIONAL POPULATION
Australia’s average annual growth rate over the last 30 years has been 1.4 per cent per year. This has
fluctuated from as low as 0.9 per cent in 1992-93 (during a recession) to as high as 2.1 per cent in 2008-09
around the time of the Global Financial Crisis (see Chart 1). The contributions from each of the national
components of change — natural increase and net overseas migration — have varied over this period. Both
have led to Australia having high population growth compared to other developed countries, most recently
with Australia’s population growth for the calendar year 2019 having been almost 3 times the OECD average
(see Box 1 and Table 1).
Chart 1. COMPONENTS OF POPULAT ION CHANGE , AUSTRALIA , 1988-89 TO 2018-19
Note: The intercensal difference shown in Chart 1, and also further down in the state charts, is caused by differences in
population estimates between successive censuses, post-enumeration surveys, and the administrative data sources used for
quarterly updates, which cannot be attributed to a particular source. More information and the Australian Bureau of
Statistics official definition can be found in the Glossary.
Source: (Australian Bureau of Statistics, National, state and territory population, March 2020, 2020)
The pace and composition of population change has varied across different parts of Australia. This is discussed
further in the sections on the populations of states, and of capital cities and rest-of-state areas below. There
are also differences between the rates of population change for the Aboriginal and Torres Strait Islander
population compared to the overall population (see Box 1).
BOX 1. AUSTRALIA’S POPULATION IN A GLOBAL CONTEXT
Australia’s population growth rate is higher than that of most developed countries. In 2019 it was
1.5 per cent; higher than the OECD average of 0.5 per cent. This growth was largely driven by net overseas
migration. In the 5 years between 1 July 2014 and 30 June 2019, net overseas migration directly contributed
60 per cent of Australia’s population growth. This net overseas migration also led to a greater number of
births than would otherwise have been the case, as migrants have been younger on average than the
resident population and, therefore, more likely on average to have children than the resident population.
-0.5
0.0
0.5
1.0
1.5
2.0
2.5
-0.5
0.0
0.5
1.0
1.5
2.0
2.5
1988-89 1993-94 1998-99 2003-04 2008-09 2013-14 2018-19
Population growth
Net overseas migration
Natural increase
Per cent Per cent
Intercensal difference

Part I — How our population has changed (1988-89 to 2018-19)
12 | Centre for Population
While fertility rates remain high in developing countries, women globally are having fewer children. The
world’s total fertility rate is projected to drop below 2.10 babies per woman after 2065, after which the
global population will start to decline (United Nations, 2019). Australia’s total fertility rate in 2018 of
1.74 babies per woman was slightly higher than the OECD average of 1.69. For calendar year 2018,
Australia’s total fertility rate was higher than that of Italy, Japan, Canada, New Zealand, USA, Germany and
Brazil, but lower than France. Australia and other developed countries have generally experienced declines
in fertility since the end of the baby boom of the mid-1960s (The World Bank, World Development
Indicators, 2020).
In 2018, Australia’s life expectancy at birth for men and women was ranked 12 in the world (The World Bank,
World Development Indicators, 2020).
Table 1. INTERNATIONAL POPULAT ION COMPARISONS , SELECTED COUNTRIES COUNTRY POPULATION GROWTH
(2019) FERTILITY (CHILDREN
PER WOMAN, 2018) FEMALE LIFE
EXPECTANCY AT BIRTH
(YEARS, 2018)
MALE LIFE
EXPECTANCY AT BIRTH
(YEARS, 2018)
AUSTRALIA 1.5 1.74 84.9 80.7
NEW ZEALAND 1.6 1.71 83.6 80.2
G7 COUNTRIES
CANADA 1.4 1.50 84.1 79.9
USA 0.5 1.73 81.1 76.1
UK 0.6 1.68 83.1 79.5
JAPAN -0.2 1.42 87.3 81.3
GERMANY 0.3 1.57 83.3 78.6
FRANCE 0.1 1.88 85.9 79.7
ITALY -0.2 1.29 85.6 81.2
BRAZIL, RUSSIA, INDIA AND CHINA (BRICS)
BRAZIL 0.8 1.73 79.4 72.0
RUSSIA -0.1 1.57 77.8 67.8
INDIA 1.0 2.22 70.7 68.2
CHINA 0.4 1.69 79.1 74.5
OECD MEMBERS 0.5 1.69 82.8 77.5
WORLD 1.1 2.41 74.9 70.4
Source: (The World Bank, World Bank Open Data, 2020)
Part I — How our population has changed (1988-89 to 2018-19)
Centre for Population | 13
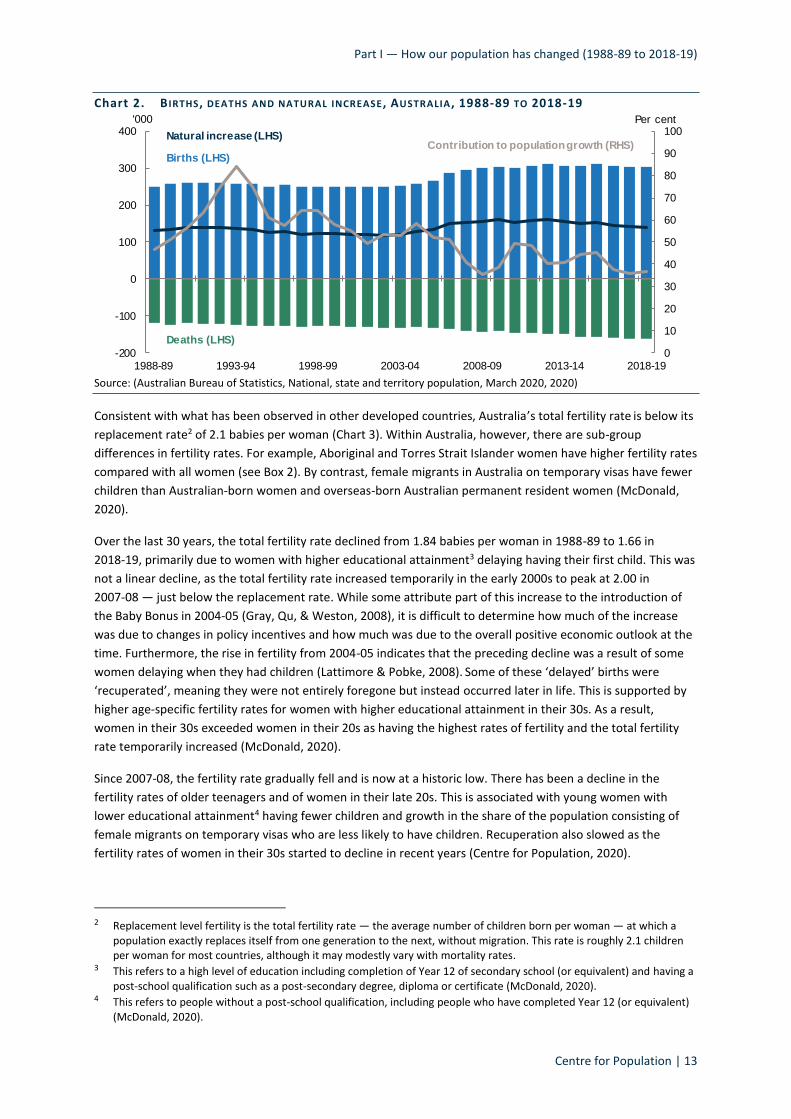
Chart 2. B IRTHS , DEATHS AND NATURAL INCREASE , AUSTRALIA , 1988-89 TO 2018-19
Source: (Australian Bureau of Statistics, National, state and territory population, March 2020, 2020)
Consistent with what has been observed in other developed countries, Australia’s total fertility rate is below its
replacement rate2 of 2.1 babies per woman (Chart 3). Within Australia, however, there are sub-group
differences in fertility rates. For example, Aboriginal and Torres Strait Islander women have higher fertility rates
compared with all women (see Box 2). By contrast, female migrants in Australia on temporary visas have fewer
children than Australian-born women and overseas-born Australian permanent resident women (McDonald,
2020).
Over the last 30 years, the total fertility rate declined from 1.84 babies per woman in 1988-89 to 1.66 in
2018-19, primarily due to women with higher educational attainment3 delaying having their first child. This was
not a linear decline, as the total fertility rate increased temporarily in the early 2000s to peak at 2.00 in
2007-08 — just below the replacement rate. While some attribute part of this increase to the introduction of
the Baby Bonus in 2004-05 (Gray, Qu, & Weston, 2008), it is difficult to determine how much of the increase
was due to changes in policy incentives and how much was due to the overall positive economic outlook at the
time. Furthermore, the rise in fertility from 2004-05 indicates that the preceding decline was a result of some
women delaying when they had children (Lattimore & Pobke, 2008). Some of these ‘delayed’ births were
‘recuperated’, meaning they were not entirely foregone but instead occurred later in life. This is supported by
higher age‐specific fertility rates for women with higher educational attainment in their 30s. As a result,
women in their 30s exceeded women in their 20s as having the highest rates of fertility and the total fertility
rate temporarily increased (McDonald, 2020).
Since 2007-08, the fertility rate gradually fell and is now at a historic low. There has been a decline in the
fertility rates of older teenagers and of women in their late 20s. This is associated with young women with
lower educational attainment4 having fewer children and growth in the share of the population consisting of
female migrants on temporary visas who are less likely to have children. Recuperation also slowed as the
fertility rates of women in their 30s started to decline in recent years (Centre for Population, 2020).
2 Replacement level fertility is the total fertility rate — the average number of children born per woman — at which a
population exactly replaces itself from one generation to the next, without migration. This rate is roughly 2.1 children per woman for most countries, although it may modestly vary with mortality rates.
3 This refers to a high level of education including completion of Year 12 of secondary school (or equivalent) and having a post-school qualification such as a post-secondary degree, diploma or certificate (McDonald, 2020).
4 This refers to people without a post-school qualification, including people who have completed Year 12 (or equivalent) (McDonald, 2020).
0
10
20
30
40
50
60
70
80
90
100
-200
-100
0
100
200
300
400
1988-89 1993-94 1998-99 2003-04 2008-09 2013-14 2018-19
Per cent'000
Natural increase (LHS)
Births (LHS)
Deaths (LHS)
Contribution to population growth (RHS)

Part I — How our population has changed (1988-89 to 2018-19)
14 | Centre for Population
1.2.1 NATURAL INCREASE
In recent years, natural increase has added around 150,000 people annually to the Australian population, the
difference between approximately 300,000 births a year and around 150,000 deaths each year (see Chart 2).
Although the level of natural increase rose over the last 30 years, natural increase became smaller as a
proportion of the population.
In part, this is because deaths rose more quickly than births due to population ageing. Population ageing in
Australia is part of a longer-term trend with baby boomers and post-WWII migrants transitioning to ages
65 and above. The share of the population aged 65 and over increased from 11 per cent in June 1989 to
16 per cent in June 2019 (Australian Bureau of Statistics, National, state and territory population, March 2020,
2020) (also see Box 3).
The declining contribution of natural increase to population growth is also partly due to falling fertility rates as
families, over time, have chosen to have children later in life and have fewer children when they do (McDonald,
2020). The long-term decline in the fertility rate has led to fewer births than otherwise. It has also been due to
a smaller proportion of the population being at child-bearing ages. In the absence of significant net overseas
migration to Australia recently, natural increase would have been even lower. Migration has increased the
proportion of the population likely to have children and, therefore, kept the number of births relatively stable
in Australia despite falling fertility rates.
Chart 3. TOTAL FERTILITY RATE DECOMPOSED INTO BABIES PER WOMAN WITHIN 5 YEAR AGE BRACKETS ,
AUSTRALIA , 1988-89 TO 2018-19
Source: (Centre for Population, 2020)
Australia’s female and male life expectancies at birth are some of the best in the world at 84.9 years for women
and 80.7 years for men, based on the Australian Bureau of Statistics’ 2016-18 Life Tables. Over the past decade,
life expectancy at birth increased by 1.5 years for men and 1.2 years for women. This reduced the gap in life
expectancies between men and women from 6.4 years in 1988 to 4.2 years in 2016-18 (Australian Bureau of
Statistics, 2016-18 Life Tables, 2019). While life expectancy at birth has improved over time, over recent years
it has done so at a decreasing rate (Chart 4). Over the last 30 years, life expectancies improved at an average
annual rate of 0.3 per cent for men and 0.2 per cent for women. By comparison, these average annual rates
were lower over the last 5 years — improving by 0.2 per cent for men and 0.1 per cent for women.
Public health efforts, improvements to medicine and access to treatment as well as improved workplace and
road safety (such as the use of seat belts) have contributed to declining mortality. In particular, the widespread
0.0
0.5
1.0
1.5
2.0
0.0
0.5
1.0
1.5
2.0
1988-89 1993-94 1998-99 2003-04 2008-09 2013-14 2018-19
Babies per womanBabies per woman
15 - 19 20 - 24 25 - 29 30 - 34 35 - 39 40 - 44 45 - 49 TFR

Part I — How our population has changed (1988-89 to 2018-19)
Centre for Population | 15
availability of heart by-pass surgery and reduction in smoking have been major contributors to rising life
expectancies in Australia.
With the exception of those aged over 100 years, mortality rates at all other ages improved on average over
the last 30 years. Substantial improvements have been seen for childhood mortality for boys and girls (with
average annual improvements of around 3.5 per cent per year for mortality rates for children under 5 years
old). As with fertility, there are sub-group differences in mortality, with Aboriginal and Torres Strait Islander
Australians having lower life expectancies compared with non-Indigenous Australians (see Box 2).
Not only have annualised rates of mortality improvement slowed in the most recent 5 year period, in some
cases mortality rates have worsened, particularly for men aged 40 to 49 years. In this sub-group, there have
been significant increases in the number of deaths from accidental poisoning.5 Over 2016-18, the age-specific
mortality rate per 100,000 population due to accidental poisoning was 17.8 for men and 7.5 for women.
Five years earlier, over 2011-13, the comparable rates were 11.5 for men and 5.3 for women (Australian
Institute of Health and Welfare, General Record of Incidence of Mortality Books 2018, 2020).
Chart 4. L IFE EXPECTANCY AT BI RTH FOR MALES AND FEMALES , 1990-92 TO 2016-18
Source: (Australian Bureau of Statistics, 2016-18 Life Tables, 2019; Australian Bureau of Statistics, Historical population,
2016, 2019)
Higher rates of mortality improvement at ages 60 to 80 are related to changes in the main causes of death.
Coronary heart disease is currently, and has long been, the primary leading cause of death in Australia (Chart
5), although advances in public health systems and medical treatments have greatly reduced the death rate
associated with the disease. A combination of factors, including population ageing and improvements in the
treatment of other diseases, has led to an increased number of people dying from dementia.6 There are
differences between men and women in the leading cause of death in Australia, with coronary heart disease
being the leading cause of death for men and dementia being the leading cause of death for women (Australian
Institute of Health and Welfare, General Record of Incidence of Mortality Books 2018, 2020).
5 ‘Accidental poisoning’ includes deaths from: accidental overdose of drug, wrong drug given or taken in error, and drug
taken inadvertently, accidents in the use of drugs, medicaments and biological substances in medical and surgical procedures (self-inflicted) poisoning, when not specified whether accidental or with intent to harm.
6 Some of this increase is also attributable to how dementia deaths have been recorded on medical certificates in recent years.
68
70
72
74
76
78
80
82
84
86
68
70
72
74
76
78
80
82
84
86
1990-92 1996-98 2003-05 2010-12 2016-18
YearsYears
Males
Females

Part I — How our population has changed (1988-89 to 2018-19)
16 | Centre for Population
Chart 5. AGE STANDARDISED DEAT HS, LEADING CAUSES , MEN (LHS) AND WOMEN (RHS) 1988-89 TO
2017-18
Source: (Australian Institute of Health and Welfare, General Record of Incidence of Mortality Excel workbooks, 2020;
Australian Institute of Health and Welfare, General Record of Incidence of Mortality Books 2018, 2020)
BOX 2. ABORIGINAL AND TORRES STRAIT ISLANDER AUSTRALIANS
In 2016, there were 798,400 Aboriginal and Torres Strait Islander peoples in Australia, representing around
3 per cent of the total Australian population at the time (Australian Bureau of Statistics, 2019). Between
2006 and 2016, the Aboriginal and Torres Strait Islander population increased by 2.2 per cent (from 640,000
people) per year on average, compared with 1.6 per cent for the total Australian population. The Australian
Bureau of Statistics produces population estimates and projections of the Aboriginal and Torres Strait
Islander population, while the Census is the primary source of data for measuring changes in the population.
While three-quarters of the Aboriginal and Torres Strait Islander population lived in New South Wales,
Queensland and Western Australia, the Northern Territory had the highest proportion of its population
represented by Aboriginal and Torres Strait Islander peoples (30 per cent compared with 3 per cent for
Australia overall). More Aboriginal and Torres Strait Islander Australians lived outside the major cities7
(63 per cent) compared to the non-Indigenous population (28 per cent) (Australian Bureau of Statistics,
Estimates of Aboriginal and Torres Strait Islander Australians, 2018).
7 Major cities here refers to the Australian Bureau Statistics remoteness area classification, not the Greater Capital City
Statistical Area classification.
0
50
100
150
200
250
300
350
0
50
100
150
200
250
300
350
1988-89 1996-97 2003-04 2010-11 2017-18
Deaths per 100,000
Deaths per 100,000
Coronary heart disease
Lung cancer
Dementia
Cerebrovascular disease
Chronic obstructive pulmonary disease
0
50
100
150
200
250
300
350
0
50
100
150
200
250
300
350
1988-89 1996-97 2003-04 2010-11 2017-18
Deaths per 100,000
Deaths per 100,000
Dementia
Coronary heart disease
Cerebrovascular disease
Lung cancer
Chronic obstructive pulmonarydisease
Part I — How our population has changed (1988-89 to 2018-19)
Centre for Population | 17
Components of change in the Aboriginal and Torres Strait Islander population
Between the 2011 and 2016 censuses, the number of Aboriginal and Torres Strait Islander people in
Australia increased by 18.4 per cent (100,800 people) (Australian Bureau of Statistics, Census of Population
and Housing: Understanding the Increase in Aboriginal and Torres Strait Islander Counts, 2018). Most
(79,300 or 79 per cent) of the increase in the Census counts of Aboriginal and Torres Strait Islander people
between 2011 and 2016 can be explained by births, deaths and migration. The remaining 21 per cent
(21,500) of the increase is non-demographic change (that is, change not explained by births, deaths or
migration).
Unlike measurements of the total population, measurement of the Aboriginal and Torres Strait Islander
population relies on individuals identifying as an Aboriginal and/or Torres Strait Islander person. Changes in
self-identification can lead to changes in the population that cannot be explained by demographic factors.
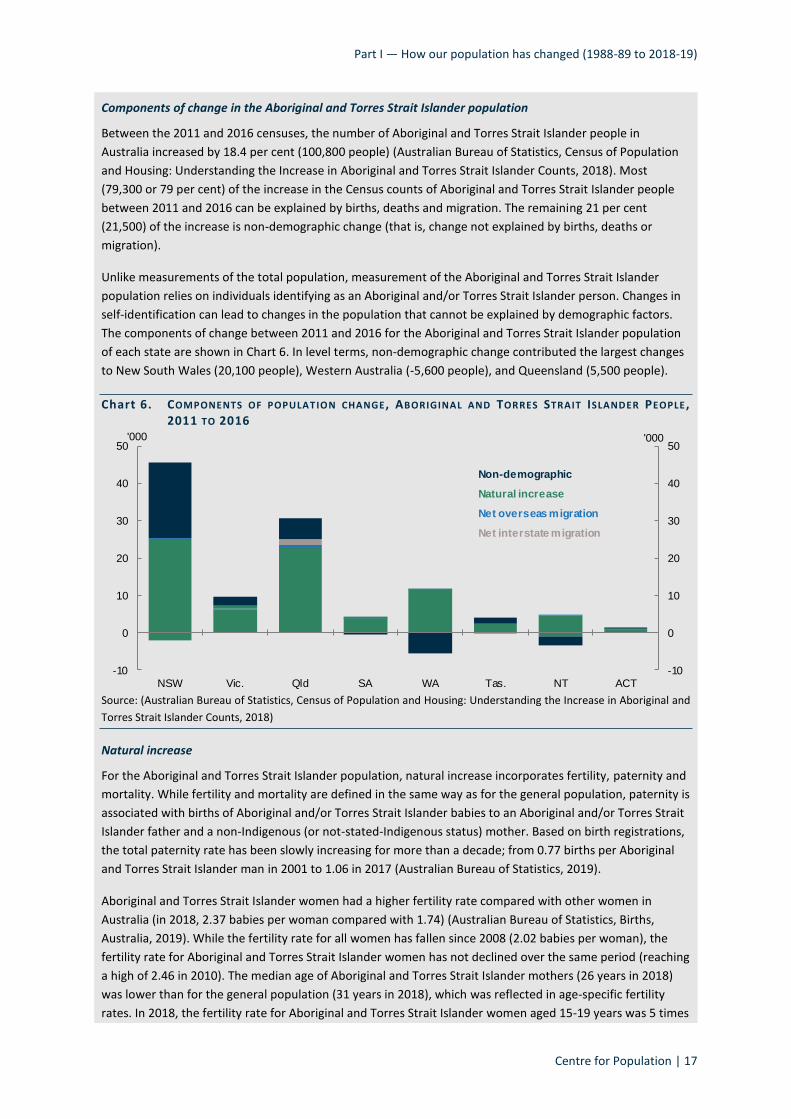
The components of change between 2011 and 2016 for the Aboriginal and Torres Strait Islander population
of each state are shown in Chart 6. In level terms, non-demographic change contributed the largest changes
to New South Wales (20,100 people), Western Australia (-5,600 people), and Queensland (5,500 people).
Chart 6. COMPONENTS OF POPULATION CHANGE , ABORIGINAL AND TORRES STRAIT ISLANDER PEOPLE ,
2011 TO 2016
Source: (Australian Bureau of Statistics, Census of Population and Housing: Understanding the Increase in Aboriginal and
Torres Strait Islander Counts, 2018)
Natural increase
For the Aboriginal and Torres Strait Islander population, natural increase incorporates fertility, paternity and
mortality. While fertility and mortality are defined in the same way as for the general population, paternity is
associated with births of Aboriginal and/or Torres Strait Islander babies to an Aboriginal and/or Torres Strait
Islander father and a non-Indigenous (or not-stated-Indigenous status) mother. Based on birth registrations,
the total paternity rate has been slowly increasing for more than a decade; from 0.77 births per Aboriginal
and Torres Strait Islander man in 2001 to 1.06 in 2017 (Australian Bureau of Statistics, 2019).
Aboriginal and Torres Strait Islander women had a higher fertility rate compared with other women in
Australia (in 2018, 2.37 babies per woman compared with 1.74) (Australian Bureau of Statistics, Births,
Australia, 2019). While the fertility rate for all women has fallen since 2008 (2.02 babies per woman), the
fertility rate for Aboriginal and Torres Strait Islander women has not declined over the same period (reaching
a high of 2.46 in 2010). The median age of Aboriginal and Torres Strait Islander mothers (26 years in 2018)
was lower than for the general population (31 years in 2018), which was reflected in age-specific fertility
rates. In 2018, the fertility rate for Aboriginal and Torres Strait Islander women aged 15-19 years was 5 times
-10
0
10
20
30
40
50
-10
0
10
20
30
40
50
NSW Vic. Qld SA WA Tas. NT ACT
'000'000
Natural increase
Net overseas migration
Net interstate migration
Non-demographic

Part I — How our population has changed (1988-89 to 2018-19)
18 | Centre for Population
the teenage fertility rate for all women (48 and 10 births per 1,000 women respectively). The fertility rate for
Aboriginal and Torres Strait Islander women aged 20-24 years was 3 times the fertility rate for all women of
the same age (130 and 43 respectively). Conversely, the fertility rate for all women aged 40-44 years was
1.5 times the fertility rate for Aboriginal and Torres Strait Islander women of the same age (16 and
11 respectively) (Australian Bureau of Statistics, Births, Australia, 2019).
Aboriginal and Torres Strait Islander peoples experience higher mortality rates than non-Indigenous
Australians across all age groups and for all major causes of death. The median age at death for Aboriginal
and Torres Strait Islander people in 2019 was 60 years (up from 56 years in 2010), compared with 82 years
for non-Indigenous people (up from 81 years a decade ago) (Australian Bureau of Statistics, Deaths,
Australia, 2020). Age-specific death rates for Aboriginal and Torres Strait Islander peoples were higher in all
age groups than those for non-Indigenous people, but declined in most age groups (with the exception of
75 years and over), compared with a decade ago. The differences in age-specific death rates between
Aboriginal and Torres Strait Islander people and non-Indigenous people were highest in the broader 25-54
years age group.
Life expectancy for the Aboriginal and Torres Strait Islander population between 2015 and 2017 was
estimated at 8.6 years lower than that of the non-Indigenous population. For men, this was 71.6 years
compared with 80.2. For women, life expectancy was 7.8 years lower at 75.6 years compared with
83.4 (Australian Institute of Health and Welfare, Deaths in Australia, 2020). There has been a clear
distinction between life expectancy for Aboriginal and Torres Strait Islander Australians living in remote
areas compared to other parts of Australia. This is in contrast to non-Indigenous Australians, where life
expectancy is broadly similar across remoteness categories. Life expectancy for Aboriginal and Torres Strait
Islander Australians living in remote areas has been significantly lower than life expectancy for those living in
regional areas and major cities (Australian Bureau of Statistics, 2018). In 2015-2017, life expectancy for
Aboriginal and Torres Strait Islander men living in remote and very remote areas combined was estimated to
be 6.2 years lower than that of Aboriginal and Torres Strait Islander men living in major cities (65.9 years
compared with 72.1 years). The equivalent comparison for Aboriginal and Torres Strait Islander women was
6.9 years lower (69.6 years compared with 76.5 years).
The leading cause of death for Aboriginal and Torres Strait Islander men and Aboriginal and Torres Strait
Islander women in 2019 was Ischaemic heart disease (Australian Bureau of Statistics, Causes of Death,
Australia, 2020). Intentional self-harm was the second leading cause for Aboriginal and Torres Strait Islander
men, but was ranked seventh for Aboriginal and Torres Strait Islander women. Chronic lower respiratory
disease was the second leading cause for Aboriginal and Torres Strait Islander women and ranked third for
Aboriginal and Torres Strait Islander men. Diabetes was the third leading cause for Aboriginal and Torres
Strait Islander women, and the fifth for Aboriginal and Torres Strait Islander men. Dementia, including
Alzheimer disease, was the sixth ranked cause among women and ranked twelfth for men (Australian Bureau
of Statistics, Causes of Death, Australia, 2020).
Net overseas migration
Net overseas migration is not a significant contributor to changes in the Aboriginal and Torres Strait Islander
population. According to the 2016 Census, there were 1,970 Aboriginal and Torres Strait Islander people
resident in Australia in 2016 who lived overseas in 2011. Slightly fewer numbers of Aboriginal and Torres
Strait Islander people resident in 2011 also lived overseas in 2006 (1,380 people) (Australian Bureau of
Statistics, 2019). This level of overseas immigration was small, and the scale of net overseas migration would
also be further reduced by overseas emigration.

Part I — How our population has changed (1988-89 to 2018-19)
Centre for Population | 19
Net internal migration
In 2016, the Aboriginal and Torres Strait Islander population had a higher rate of mobility than the
non-Indigenous population (Australian Bureau of Statistics, Population Shift: Understanding Internal
Migration in Australia, 2018). In the 2016 Census, around 18 per cent of Aboriginal and Torres Strait Islander
people changed address in the year prior to the Census, based on age-standardised rates, compared with
15 per cent for the non-Indigenous population.
The Census question related to ‘place of usual residence 5 years ago’ shows the number of Aboriginal and
Torres Strait Islander people who changed their state or territory of usual residence. Between the 2011 and
2016 censuses the number was 25,960. Between the 2006 and 2011 censuses the number was 21,340 and
between the 2001 and 2006 censuses the number was 18,440.
Between the 2011 and 2016 censuses, the Australian Capital Territory, Victoria, South Australia, Queensland
and Western Australia recorded a net gain in Aboriginal and Torres Strait Islander residents from interstate
migration. While most rates of net gain remained largely similar for these states over the 2006 to 2011
intercensal period, the Australian Capital Territory recorded a net gain of 20 per cent between 2011 and
2016 compared with 11 per cent between 2006 and 2011. The Northern Territory, Tasmania and New South
Wales experienced net loss from interstate migration between 2011 and 2016. The net loss was highest in
New South Wales (around 2,000 people).
Projections
Population projections of the Aboriginal and Torres Strait Islander population are produced by the Australian
Bureau of Statistics every 5 years. The most recent projections were produced following the 2016 Census,
which projected the Aboriginal and Torres Strait Islander population to increase to between 1,055,000
people (low series) and 1,100,000 people (high series) by 2031. These projections represent an average
annual growth rate of between 1.9 per cent and 2.2 per cent per year.
There is currently little information available about the population impacts of COVID-19 on the Aboriginal
and Torres Strait Islander population and no official population projections have been produced to consider
any effects. The 2021 Census is an opportunity for these considerations to be better understood.
1.2.2 NET OVERSEAS MIGRATION
Since the early 2000s, net overseas migration — the difference between the inflow of immigrants to Australia
and the outflow of emigrants from Australia — has been the main driver of Australia’s population growth (see
Chart 7). ‘Migration’ for the purposes of estimating the resident population is not the same as the numbers of
overseas arrivals and departures and is also not necessarily the same as someone’s citizenship or residency
status. Rather, someone is counted as an immigrant to Australia if they arrive and then remain in Australia for
12 months out of a 16-month period (and the same is true of emigrants).
The contribution of net overseas migration to Australia’s population growth has been trending upwards over
the past 30 years from around 56 per cent in the late 1980s to being consistently above 60 per cent since
2016-17. It fluctuated substantially over time due to varying economic conditions and policy settings, from a
low of 19 per cent in the recession of the early 1990s as fewer people entered the country to a high of
68 per cent in 2008-09. The recent high was due to policy changes around pathways from temporary residency
to permanent residence that led to rapid growth in enrolments in the vocational and higher education sectors
(Australian National Audit Office, 2011). Policy measures introduced in late 2009 to improve the integrity of
student visas resulted in a rapid decline in international student enrolments and student net overseas
migration levels fell sharply.

Part I — How our population has changed (1988-89 to 2018-19)
20 | Centre for Population
Consequently, from 2009-10, the contribution of net overseas migration to population growth increased from
58 per cent to 63 per cent. This has been driven by 2 things: a 13 per cent fall in the level of natural increase
over this period and a 22 per cent rise in the level of migration.
Chart 7. NET OVERSEAS MIGRATION, 1988-89 TO 2018-198
Source: (Australian Bureau of Statistics, National, state and territory population, March 2020, 2020)
The Australian Government directly influences the size and composition of net overseas migration through its
migration policies. A core policy element is the permanent migration program of skilled and family migrants.
This program underpins the level of migration to Australia through time as temporary migrants, with the
exception of New Zealanders,9 must eventually transition to permanent residents to remain in Australia or
depart Australia at some point. However, the influence of the permanent migration program on arrivals in any
given year is smaller than the program size in that year. This is because many of those who are granted a
permanent visa are already onshore and have previously been counted as an arriving migrant. For much of the
last decade, around 50 per cent of the permanent migration program intake has been from temporary migrants
already residing in Australia, although the share has been slowly rising in recent years (Chart 8).
The number of places in the permanent program in 1988-89 was 123,900. This level was reduced in response to
the recession in the early 1990s and subsequent slow recovery, dropping to 61,500 by 1993-94. By 2012-13, the
program size had increased to 190,000. Since 2017-18, the program intake has been around 160,000 and the
permanent migration planning level was subsequently reset to 160,000 for the following 4 years in 2018-19.
Temporary migrants have also contributed to the growth in migration — much more so this century than
previously. Australia’s education institutions have benefited from the rapid growth in demand from students
from middle-income countries seeking education at highly ranked universities around the world, predominantly
in English-speaking countries. As a result, the net flow of international students to Australia increased threefold
between 2013 and 2019, although the growth has slowed rapidly from 2018. Students from China, India, Nepal,
Vietnam and Brazil accounted for almost 60 per cent of the 664,200 international students in Australia in 2020
(Department of Education, Skills and Employment, 2020).
8 The Australian Bureau of Statistics (ABS) changed their measure of net overseas migration in 2006, which increased the
reported level of net overseas migration. In comparing the new and former definitions for the 3 years to September 2006, the ABS estimated that the current approach (the 12/16 rule) resulted in net overseas migration being 25 per cent higher on average compared to the previous method for that period (Sánchez & Andrews, 2011).
9 There is free movement of Australian and New Zealand citizens between both countries under the 1973 Trans-Tasman
Travel Arrangement. This Arrangement allows individuals to work and reside in either country without the need to seek authority from the relevant government through a visa application.
0
10
20
30
40
50
60
70
80
-400
-300
-200
-100
0
100
200
300
400
500
600
1988-89 1993-94 1998-99 2003-04 2008-09 2013-14 2018-19
Per cent'000
Arrivals (LHS)
Departures (LHS)
Contribution of NOM to population growth (RHS)
Net overseas migration (LHS)

Part I — How our population has changed (1988-89 to 2018-19)
Centre for Population | 21
The contribution of temporary skilled migrants, New Zealanders and working holiday makers to population
growth has declined in recent years. This contrasts with their relatively strong contribution during the
construction cycle of the mining boom. Since the end of that cycle in around 2013, the number of migrants on
temporary skilled visas in Australia has fallen by more than a quarter.
Chart 8. NET OVERSEAS MIGRATION BY VISA GROUP, 2008-09 TO 2018-19
Note: Quarterly data presented on a year-ending basis. Number of visas is based on the visa type at the time of a traveller’s
arrival or departure. Care should be taken attributing net flows to specific groups of migrants as transfers to other visa types
while onshore are not captured; for example, some international students transfer to other temporary visas including skilled
visas while onshore. ‘Other’ includes visitors, temporary and unclassified visas (missing administrative visa information).
‘Permanent resident’ includes skilled, family and humanitarian categories.
Source: Centre for Population calculations based on unreleased Department of Home Affairs data
Immigrants recorded on ‘Visitor’ visas have had an increasing role in migration arrivals over the past decade.
These are migrants who likely first travel to Australia on a visitor visa but primarily consist of students, skilled
workers and partners, who subsequently transition to these visa categories.
As a category, Australian citizens have been net emigrants over the 30-year period analysed, meaning that
more Australian citizens departed than arrived in most years. As Australian emigrants are generally departing
for work opportunities, the levels of departures and arrivals fluctuate in response to global economic
conditions. During the Global Financial Crisis in 2007 to 2009, the number of Australian citizens departing fell
sharply while the number returning rose. Similarly, recent data suggests that Australian citizens previously
resident overseas are returning to Australia in greater numbers in response to the COVID-19 pandemic.
1.2.3 NET INTERNAL MIGRATION
Australia has a mobile population and one of the highest rates of internal migration in the world. According to
OECD analysis of Household, Income and Labour Dynamics in Australia survey data (Sánchez & Andrews, 2011),
Australia had the second highest residential mobility rate among OECD countries with 24 per cent of people
having changed residence in the last 2 years (Iceland has 29 per cent).10 However, in Australia and other
countries around the world, there has been a long-term decline in internal migration as a proportion of the
total population (Chart 9). Research indicates that this is largely behavioural and is partly due to people
10 This analysis includes moves by people who moved to a different address within the same capital city or rest-of-state
area.
-200
-150
-100
-50
0
50
100
150
200
250
300
350
-200
-150
-100
-50
0
50
100
150
200
250
300
350
2008-09 2010-11 2012-13 2014-15 2016-17 2018-19
'000'000
Australian
New Zealander
Skilled (temp)
Working holiday maker
Other
Permanent resident
Student
Net overseas migration (total)

Part I — How our population has changed (1988-89 to 2018-19)
22 | Centre for Population
choosing to stay or feeling unable to leave a place (University of Queensland, unpublished). Alongside this
long-term decline, the rate of interstate migration — or the number of people who move as a proportion of the
total population — has fallen in response to recessions and economic shocks.
Chart 9. ANNUAL INTERSTATE MIGRATION RATE , 1973-74 TO 2018-19
Source: (Australian Bureau of Statistics, National, state and territory population, March 2020, 2020; Australian Bureau of
Statistics, Historical population, 2016, 2019)
Geographic patterns of internal migration in Australia have seen a long-term trend away from inland regional
areas. The result is a concentration of people in capital cities and coastal areas. Centralisation of the population
in these areas has been driven by improved access to economic opportunities, amenities, goods and services
and economic restructuring (Bureau of Infrastructure, Transport and Regional Economics, 2014).
Internal migration is typically triggered by life events, many of which occur in early adulthood. As a result,
young people aged in their 20s have historically been the most mobile population group (Chart 10). This age
typically coincides with life events such as undertaking higher education, entry into the labour force and
starting a family.
Chart 10. D ISTRIBUTION OF PEOPLE WHO MOVED IN THE PREVIOUS YEAR , BY AGE IN 2016
Note: This analysis includes moves by people who moved to a different address within the same capital city or rest-of-state
area.
Source: (Australian Bureau of Statistics, Census of Population and Housing, 2016, 2017)
1.0
1.5
2.0
2.5
1.0
1.5
2.0
2.5
1973-74 1978-79 1983-84 1988-89 1993-94 1998-99 2003-04 2008-09 2013-14 2018-19
Per centPer cent
1974recession
1982-83recession
1991-92recession
2007-09GFC
0.0
0.5
1.0
1.5
2.0
2.5
3.0
3.5
0.0
0.5
1.0
1.5
2.0
2.5
3.0
3.5
1 5 10 15 20 25 30 35 40 45 50 55 60 65 70 75 80 85 90 95 100+
Per centPer cent

Part I — How our population has changed (1988-89 to 2018-19)
Centre for Population | 23
BOX 3. POPULATION AGEING — 1988-89 TO 2018-19
Australia’s overall population has been growing older over time, with the share of people aged 65 and over
roughly doubling between 30 June 1946 and 30 June 2019 (Australian Bureau of Statistics, Historical
population, 2016, 2019). Australia’s population ageing has been driven by low fertility and increasing life
expectancy, which have led to a growing proportion of older people in the population each year.
The ageing of Australia’s population has been slowed down by our migration program which brought young
adults into Australia (The Treasury and the Department of Home Affairs, 2018). In 2015-16, around 84 per
cent of migrants arriving in Australia were aged under 40, compared to only 54 per cent of the resident
population (The Treasury and the Department of Home Affairs, 2018). Migration also improved Australia’s
labour force participation rate given younger age groups tend to have higher participation rates than older
age groups.
Since 30 June 1989, the median age of people in Australia increased from 32 to 37 years. The share of people
aged 65 and over increased from 11.0 to 15.9 per cent and the dependency ratio11 decreased from 2.02 to
1.89. The populations of New South Wales, Victoria, Queensland and Western Australia experienced similar
patterns of ageing.
As at 30 June 2019, the Northern Territory had the youngest population with a median age of 33 years,
8.0 per cent of its population aged 65 and over, and a dependency ratio of 2.40. This was due to the higher
proportion of Aboriginal and Torres Strait Islander people in the Northern Territory who, on average, had a
younger median age than the non-Indigenous population (Australian Institute of Health and Welfare, Profile
of Indigenous Australians, 2019). Since 30 June 1989, the median age in the Northern Territory increased by
6.7 years and the proportion of people aged 65 and over increased by 5.4 percentage points. These changes
are the result of the Northern Territory’s total fertility rate and increasing life expectancy. However, the
Northern Territory is the only state in Australia to have its dependency ratio increase since 30 June 1989,
from 2.24 to 2.40.
The Australian Capital Territory had Australia’s second youngest population at 30 June 2019 with a median
age of 35 years, 13.0 per cent of people aged 65 and over and dependency ratio of 2.12. Its younger age
structure reflected the number of young adults who move to the Australian Capital Territory for education
or employment (Australian Bureau of Statistics, Regional population by age and sex, 2020), and its smaller
cohort of older residents. However, similar to the Northern Territory, since 30 June 1989 its median age
increased by 6.4 years, the share of people aged 65 and over increased by 7.2 percentage points, while its
dependency ratio decreased by 0.22.
Tasmania had Australia’s oldest population at 30 June 2019. Between 30 June 1989 and 2019, Tasmania’s
median age increased from 32 to 42 years, its share of people aged 65 and over increased from 11.6 to
20.1 per cent and its dependency ratio decreased from 1.87 to 1.65. Its median age increase of 10.4 years
was nearly double the increase for all of Australia in the same period. Tasmania’s ageing population was
partially due to young Tasmanians pursuing education and employment opportunities interstate and older
Australians moving into Tasmania (Australian Bureau of Statistics, Regional population by age and sex, 2020).
South Australia had Australia’s oldest population in 30 June 1989, but now has the second oldest. Since
30 June 1989, its median age increased from 33 to 40 years, its share of people aged 65 and over increased
from 12.5 to 18.7 per cent and its dependency ratio decreased from 2.00 to 1.75.

Part I — How our population has changed (1988-89 to 2018-19)
24 | Centre for Population
Within each state, the ageing of the population has been significantly more pronounced in the rest-of-state
areas, despite these areas having higher fertility rates and lower life expectancies than the capital cities. The
Regional Australia Institute has reported that between 2011 and 2016 there was a net outflow of young
people from rest-of-state areas to capital cities (Bourne, Houghton, How, Achurch, & Beaton, 2020). Other
factors that contributed to the younger age structures of capital cities included higher levels of overseas
migration into capital cities, and older adults migrating to coastal areas (Bureau of Infrastructure, Transport
and Regional Economics, 2011). Chart 11 shows that the age group of 55 to 59 is the largest age group in the
rest-of-state areas.
Chart 11. AGE STRUCTURE , GREATER CAPITAL CIT IES AND REST OF AUSTRALIA , 30 JUNE 2001 AND 2019
Note: Consistent data for capital cities and rest-of-states is only available from 2001.
Source: (Australian Bureau of Statistics, Regional population by age and sex, 2020)
11 The dependency ratio refers to the number of people of traditional working-age (15-64) for every person aged under 15
and 65 and over. The old age dependency ratio refers only to the number of people of traditional working-age (15-64) for every person aged 65 and over.
0200400600800 0 200 400 600 800
0–4
5–9
10–14
15–19
20–24
25–29
30–34
35–39
40–44
45–49
50–54
55–59
60–64
65–69
70–74
75-79
80-84
85-8985+
Males
Total Population ('000)
Females
0100200300400 0 100 200 300 400
0–4
5–9
10–14
15–19
20–24
25–29
30–34
35–39
40–44
45–49
50–54
55–59
60–64
65–69
70–74
75-79
80-84
85-89
Females
Rest of AustraliaGreater Capital Cities
Total Population ('000)
Males
85+30 June 2019
30 June 2001
30 June 2019
30 June 2001

Part I — How our population has changed (1988-89 to 2018-19)
Centre for Population | 25
1.3 STATE AND TERRITORY P OPULATIONS
Population growth rates across states have varied over time, generally driven by much the same natural
increase and net overseas migration trends that have affected national population growth, but also by net
interstate migration. In 1988-89, Queensland and Western Australia were the fastest growing states with
annual growth rates of 3.2 per cent and 2.8 per cent respectively, while South Australia and Tasmania were the
slowest growing, with rates of around 1.0 per cent. By 2018-19, Victoria and Queensland were the fastest
growing states (2.1 per cent and 1.7 per cent respectively). By contrast, the Northern Territory’s population
growth declined by 0.4 per cent and South Australia’s annual rate of population growth was just 0.9 per cent
(see Chart 12).
With very few exceptions, trends in natural increase across states followed national patterns while levels have
varied. Mortality rates and life expectancies at birth have steadily improved over time in line with the national
trend. The Northern Territory was the exception, having a higher contribution from natural increase compared
to other states, and with lower life expectancy at birth than the national average despite improvements over
time, due to Aboriginal and Torres Strait Islander people comprising a relatively larger share of the territory’s
population compared with other states (see Box 2).
Chart 12. COMPARISON OF HISTORI CAL STATE POPULATION GROWTH RATES , 1988-89 TO 2018-19
Source: (Australian Bureau of Statistics, National, state and territory population, March 2020, 2020)
-0.5
0.0
0.5
1.0
1.5
2.0
2.5
3.0
3.5
-0.5
0.0
0.5
1.0
1.5
2.0
2.5
3.0
3.5
1988-89 1993-94 1998-99 2003-04 2008-09 2013-14 2018-19
Per centPer cent
AUS
NSW
Vic.Qld
SA
-0.5
0.0
0.5
1.0
1.5
2.0
2.5
3.0
3.5
-0.5
0.0
0.5
1.0
1.5
2.0
2.5
3.0
3.5
1988-89 1993-94 1998-99 2003-04 2008-09 2013-14 2018-19
Per centPer cent
AUS
WA
Tas.
NT
ACT

Part I — How our population has changed (1988-89 to 2018-19)
26 | Centre for Population
Most of the variation in rates of population growth across the states has been driven by overseas and
interstate arrivals and departures rather than differences in natural increase. Historically, around 64 per cent of
net overseas migration has gone to New South Wales and Victoria (see Chart 13). Net overseas migration
contributed relatively strongly to population growth in Western Australia, New South Wales and Victoria in the
late 2000s. However, in line with the rise and fall of the mining cycle, overseas migration to Western Australia
fell steeply between 2011-12 and 2016-17. Smaller states, such as South Australia, Tasmania, the Australian
Capital Territory and the Northern Territory, experienced low but relatively steady levels of overseas migration
over the last 30 years.
Chart 13. SHARE OF NATIONAL NET OVERSEAS MIGRATION IN EACH STATE , 1988-89 TO 2018-19
Source: (Australian Bureau of Statistics, National, state and territory population, March 2020, 2020)
Interstate migration patterns have fluctuated for most states in line with changes in economic conditions and
opportunities (Chart 14). Most states experienced relatively higher net inflows of interstate migrants during
periods of lower unemployment in their states and relatively higher net outflows during times of higher
unemployment in their states (University of Queensland, unpublished; Reserve Bank of Australia, 1998).
0
10
20
30
40
50
0
10
20
30
40
50
1988-89 1998-99 2008-09 2018-19
Per cent Per cent
NSW
Vic.
Qld
SA
-5
0
5
10
15
20
25
-5
0
5
10
15
20
25
1988-89 1998-99 2008-09 2018-19
Per cent Per cent
WA
Tas.NT
ACT

Part I — How our population has changed (1988-89 to 2018-19)
Centre for Population | 27
Chart 14. NET INTERSTATE MIGRATION BY STATE , 1988-89 TO 2018-19
Source: (Australian Bureau of Statistics, National, state and territory population, March 2020, 2020)
New South Wales
Chart 15. POPULATION CHANGE IN NEW SOUTH WALES , 1988-89 TO 2018-19
Source: (Australian Bureau of Statistics, National, state and territory population, March 2020, 2020)
Population growth in New South Wales averaged 1.5 per cent over the last 5 years, compared to 1.2 per cent at
the start of the 30-year period. Growth was as high as 1.8 per cent in 2016-17 and as low as 0.5 per cent in
2003-04.
New South Wales has had consistent net losses of people through interstate migration with a 10-year average
net interstate loss of around 14,000 people between 2009-10 and 2018-19. Historically, people have typically
moved from New South Wales to Queensland. In the quarter to June 2019, around 44 per cent of people who
left New South Wales moved to Queensland. However, in the same quarter around 38 per cent of inflows into
New South Wales came from Queensland, which partially offset the losses.
Chart 15 shows that population growth in New South Wales is primarily driven by the growth in net overseas
migration. New South Wales has historically had the largest share of overseas migration to Australia. There has
also been substantial variation in year-to-year overseas migration largely driven by varying flows of student
-40
-20
0
20
40
60
-40
-20
0
20
40
60
1988-89 1998-99 2008-09 2018-19
NSW
Vic.
Qld
SA
'000 '000
-15
-10
-5
0
5
10
-15
-10
-5
0
5
10
1988-89 1998-99 2008-09 2018-19
Tas.NT
ACT
WA
'000 '000
-50
-25
0
25
50
75
100
125
150
-50
-25
0
25
50
75
100
125
150
1988-89 1993-94 1998-99 2003-04 2008-09 2013-14 2018-19
Total population growth
Natural increase
Net overseas migration
Net interstate migration
'000 '000
Intercensal difference

Part I — How our population has changed (1988-89 to 2018-19)
28 | Centre for Population
arrivals. Following policy changes to improve the integrity of the student visa processes in 2009, student
numbers declined before rising in late 2013. After reaching a peak level of 105,500 in 2016-17, net overseas
migration to New South Wales declined as student numbers began to fall again (Australian Bureau of Statistics,
Migration, Australia 2018-19, 2020).
Although the total fertility rate in New South Wales has declined, it was higher than the Australian average (at
1.70 in 2018-19 compared with 1.66 for Australia) and births in 2018-19 were at record levels. Life expectancy
at birth in New South Wales has been similar to the national average, as were the leading causes of death
(coronary heart disease for men and dementia for women).
Victoria
Chart 16. POPULATION CHANGE IN V ICTORIA , 1988-89 TO 2018-19
Source: (Australian Bureau of Statistics, National, state and territory population, March 2020, 2020)
Recently, Victoria has been one of the fastest growing states, in spite of its population growth slowing after
2015-16. Annual population growth has averaged 2.3 per cent over the last 5 years, compared to 1.4 per cent
for 1988-89. Growth was as high as 2.5 per cent in 2015-16 and as low as 0.2 per cent in 1993-94 (Chart 16).
The Victorian share of Australia’s net overseas migration, historically the second largest after New South Wales,
has risen steeply over the last 7 years to match that of New South Wales at 35 per cent in 2018-19. As a result,
population growth in Victoria has been primarily driven by net overseas migration. This remained strong post
the Global Financial Crisis in 2007-09 due to increases in student arrivals and temporary migration.
Interstate migration to and from Victoria has varied. Victoria was significantly affected by the 1991-92
recession following the collapse of its state bank and the decline of some manufacturing industries, along with
significant reforms to the Victorian public service. Manufacturing underpinned the state’s economy, accounting
for 20 per cent of Victoria’s Gross State Product in 1989-90. (Australian Bureau of Statistics, Australian
Economic Indicators, 1992; O'Neil & Kaye, 2016). As a result there was a large outflow of people in the 1990s.
Victoria lost 0.7 per cent of the population in 1993-94, the financial year with its lowest net interstate
migration rate. Victoria’s interstate migration patterns changed in the mid-1990s. Departures decreased from a
high of 82,000 in 1992-93 to 60,000 in 2009-10. Arrivals increased in almost the same period from a low of
47,000 in 1993-94 to 64,000 in 2009-10. Since 2009-10, both arrivals and departures have increased.
Victoria’s natural increase has remained steady over the last 30 years. While life expectancies have been higher
in Victoria compared with the national average, the total fertility rate has been lower. The leading causes of
death in Victoria were the same as those for Australia overall.
-40
-20
0
20
40
60
80
100
120
140
160
-40
-20
0
20
40
60
80
100
120
140
160
1988-89 1993-94 1998-99 2003-04 2008-09 2013-14 2018-19
Total population growth
Natural increase
Net overseas migration
Net interstate migration
'000 '000
Intercensal difference
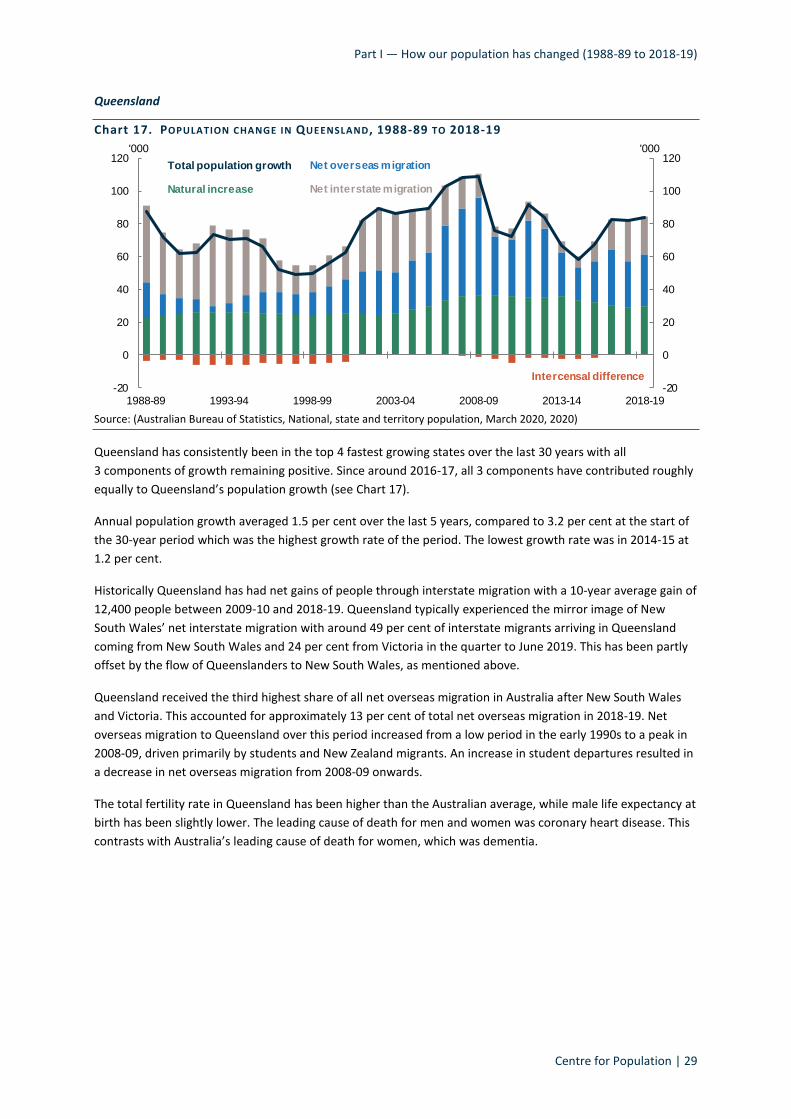
Part I — How our population has changed (1988-89 to 2018-19)
Centre for Population | 29
Queensland
Chart 17. POPULATION CHANGE IN QUEENSLAND , 1988-89 TO 2018-19
Source: (Australian Bureau of Statistics, National, state and territory population, March 2020, 2020)
Queensland has consistently been in the top 4 fastest growing states over the last 30 years with all
3 components of growth remaining positive. Since around 2016-17, all 3 components have contributed roughly
equally to Queensland’s population growth (see Chart 17).
Annual population growth averaged 1.5 per cent over the last 5 years, compared to 3.2 per cent at the start of
the 30-year period which was the highest growth rate of the period. The lowest growth rate was in 2014-15 at
1.2 per cent.
Historically Queensland has had net gains of people through interstate migration with a 10-year average gain of
12,400 people between 2009-10 and 2018-19. Queensland typically experienced the mirror image of New
South Wales’ net interstate migration with around 49 per cent of interstate migrants arriving in Queensland
coming from New South Wales and 24 per cent from Victoria in the quarter to June 2019. This has been partly
offset by the flow of Queenslanders to New South Wales, as mentioned above.
Queensland received the third highest share of all net overseas migration in Australia after New South Wales
and Victoria. This accounted for approximately 13 per cent of total net overseas migration in 2018-19. Net
overseas migration to Queensland over this period increased from a low period in the early 1990s to a peak in
2008-09, driven primarily by students and New Zealand migrants. An increase in student departures resulted in
a decrease in net overseas migration from 2008-09 onwards.
The total fertility rate in Queensland has been higher than the Australian average, while male life expectancy at
birth has been slightly lower. The leading cause of death for men and women was coronary heart disease. This
contrasts with Australia’s leading cause of death for women, which was dementia.
-20
0
20
40
60
80
100
120
-20
0
20
40
60
80
100
120
1988-89 1993-94 1998-99 2003-04 2008-09 2013-14 2018-19
Total population growth
Natural increase
Net overseas migration
Net interstate migration
'000 '000
Intercensal difference
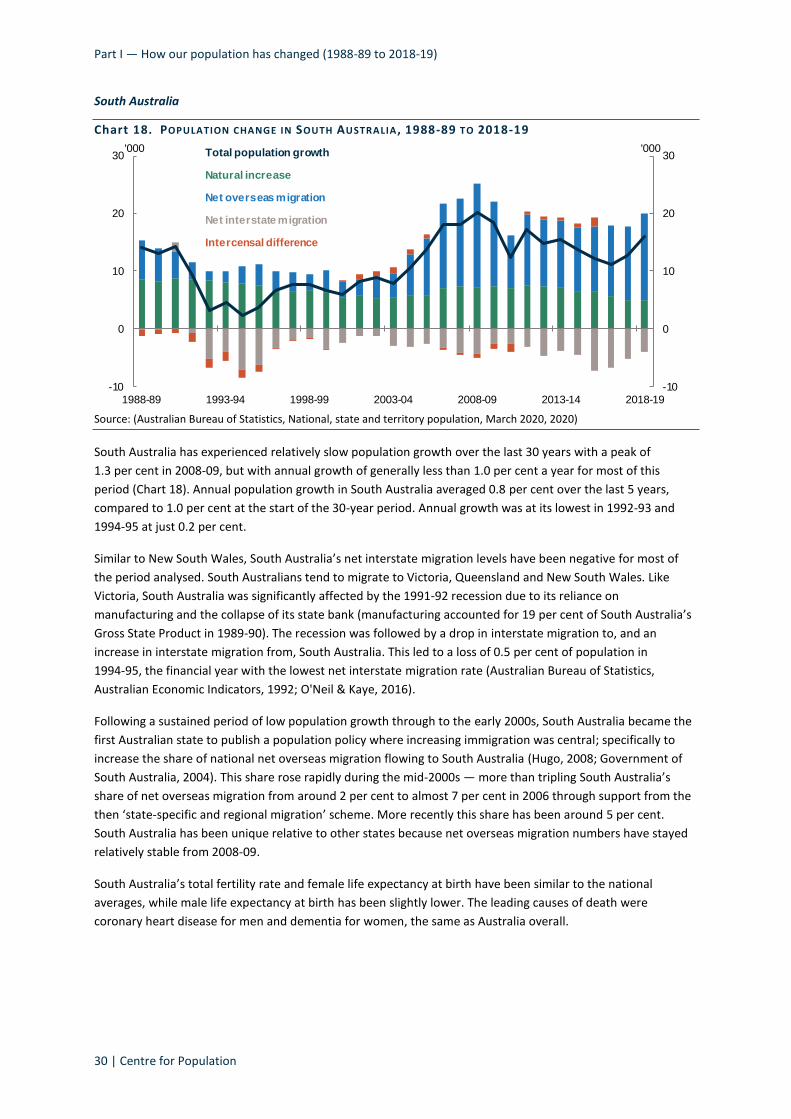
Part I — How our population has changed (1988-89 to 2018-19)
30 | Centre for Population
South Australia
Chart 18. POPULATION CHANGE IN SOUTH AUSTRALIA , 1988-89 TO 2018-19
Source: (Australian Bureau of Statistics, National, state and territory population, March 2020, 2020)
South Australia has experienced relatively slow population growth over the last 30 years with a peak of
1.3 per cent in 2008-09, but with annual growth of generally less than 1.0 per cent a year for most of this
period (Chart 18). Annual population growth in South Australia averaged 0.8 per cent over the last 5 years,
compared to 1.0 per cent at the start of the 30-year period. Annual growth was at its lowest in 1992-93 and
1994-95 at just 0.2 per cent.
Similar to New South Wales, South Australia’s net interstate migration levels have been negative for most of
the period analysed. South Australians tend to migrate to Victoria, Queensland and New South Wales. Like
Victoria, South Australia was significantly affected by the 1991-92 recession due to its reliance on
manufacturing and the collapse of its state bank (manufacturing accounted for 19 per cent of South Australia’s
Gross State Product in 1989-90). The recession was followed by a drop in interstate migration to, and an
increase in interstate migration from, South Australia. This led to a loss of 0.5 per cent of population in
1994-95, the financial year with the lowest net interstate migration rate (Australian Bureau of Statistics,
Australian Economic Indicators, 1992; O'Neil & Kaye, 2016).
Following a sustained period of low population growth through to the early 2000s, South Australia became the
first Australian state to publish a population policy where increasing immigration was central; specifically to
increase the share of national net overseas migration flowing to South Australia (Hugo, 2008; Government of
South Australia, 2004). This share rose rapidly during the mid-2000s — more than tripling South Australia’s
share of net overseas migration from around 2 per cent to almost 7 per cent in 2006 through support from the
then ‘state-specific and regional migration’ scheme. More recently this share has been around 5 per cent.
South Australia has been unique relative to other states because net overseas migration numbers have stayed
relatively stable from 2008-09.
South Australia’s total fertility rate and female life expectancy at birth have been similar to the national
averages, while male life expectancy at birth has been slightly lower. The leading causes of death were
coronary heart disease for men and dementia for women, the same as Australia overall.
-10
0
10
20
30
-10
0
10
20
30
1988-89 1993-94 1998-99 2003-04 2008-09 2013-14 2018-19
Total population growth
Natural increase
Net overseas migration
Net interstate migration
'000 '000
Intercensal difference

Part I — How our population has changed (1988-89 to 2018-19)
Centre for Population | 31
Western Australia
Chart 19. POPULATION CHANGE IN WESTERN AUSTRALIA , 1988-89 TO 2018-19
Source: (Australian Bureau of Statistics, National, state and territory population, March 2020, 2020)
Population growth in Western Australia has varied over the last 30 years, experiencing peaks and troughs as
economic conditions change (see Chart 19). Annual population growth averaged 0.8 per cent over the last
5 years, compared to 2.8 per cent at the start of the 30-year period. Growth was as high as 3.2 per cent in
2008-09 and as low as 0.6 per cent in 2015-16.
Western Australia experienced net inflows of people from overseas and interstate between 2003-04 and
2012-13 followed by lower net overseas migration and net outflows of people interstate thereafter, aligning
with the mining construction cycle (Australian Bureau of Statistics, Migration, Australia 2018-19, 2020;
Department of Treasury and Finance, Western Australia, 2006).
Over this period, overseas migration arrivals into Western Australia peaked at 78,000 people in 2011-12 before
falling. Overseas migration departures were increasing until 2013-14, after which they began to decline. In net
terms, migration into Western Australia fell from 50,800 people in 2011-12 to 12,000 in 2017-18, before
rebounding to almost 16,000 people in 2018-19. Consequently, Western Australia’s share of total net overseas
migration in Australia fell significantly from 18 per cent in 2012-13 to 7 per cent in 2018-19. This can be
attributed to a decrease in skilled migration and the number of working holiday makers and New Zealand
migrants arriving in Australia from 2012-13 onwards.
The total fertility rate in Western Australia has been higher than the Australian average, while life expectancies
at birth have been similar. The leading cause of death for men and women in the state was coronary heart
disease. This contrasts with Australia’s leading cause of deaths for women, which was dementia.
-20
0
20
40
60
80
100
-20
0
20
40
60
80
100
1988-89 1993-94 1998-99 2003-04 2008-09 2013-14 2018-19
'000'000Total population growth
Natural Increase
Net overseas migration
Net interstate migration
Intercensal difference

Part I — How our population has changed (1988-89 to 2018-19)
32 | Centre for Population
Tasmania
Chart 20. POPULATION CHANGE IN TASMANIA , 1988-89 TO 2018-19
Source: (Australian Bureau of Statistics, National, state and territory population, March 2020, 2020)
Along with South Australia, Tasmania has had long periods of population growth below 1.0 per cent over the
last 30 years. This has increased over the last 5 years due to higher inflows of international students and skilled
migrants. Annual population growth averaged 0.8 per cent over the last 5 years, compared to 0.9 per cent at
the start of the 30-year period. Growth was as high as 1.5 per cent in 1989-90 and as low as -0.3 per cent in
1997-98 (see Chart 20).
Although not traditionally a large contributor to Tasmania’s population growth, net overseas migration has
been steadily increasing in the state since 2003-04. A steady growth in student arrivals combined with an
increase in humanitarian migration and some temporary migration has driven this trend.
Net interstate migration to and from Tasmania has waxed and waned over the last 30 years in line with
economic conditions (see Box 4).
Fertility in younger age groups (20 to 29 years) has been higher compared to the national average. Tasmania
experienced an increase in fertility among women aged 20 to 24 in the mid-2000s. Life expectancy at birth in
Tasmania has been consistently lower than the Australian average over the past few decades. There was
evidence of this gap widening over recent years with a difference of 1.5 years for men and 1.7 years for women
in 2016-18. The leading causes of death in Tasmania were coronary heart disease for men and dementia for
women, the same as Australia overall.
-4
-2
0
2
4
6
8
-4
-2
0
2
4
6
8
1988-89 1993-94 1998-99 2003-04 2008-09 2013-14 2018-19
Total population growth
Natural increase
Net overseas migration
Net interstate migration
'000 '000
Intercensal difference

Part I — How our population has changed (1988-89 to 2018-19)
Centre for Population | 33
BOX 4. NET INTERSTATE MIGRATION AND TASMANIA
Tasmania has experienced net interstate migration gains in the past 5 years, from 2014-15 to 2018-19, adding
around 1,400 people per year. This reversed the trend of the previous 5-year period when Tasmania averaged
a net loss of 600 people per year. The reversal likely reflects, in part, the strengthening economic conditions
over the period with the unemployment rate in Tasmania trending down toward the national average (see
Chart 21). At the same time, high housing costs in large population centres on the mainland made Tasmania
an attractive and affordable destination, even as house prices have risen in Hobart (Australian Bureau of
Statistics, Residential Property Price Indexes: Eight Capital Cities 2020).
The gap between state and national unemployment rates has tracked closely with patterns in net interstate
migration. During the 1990s, Tasmania experienced large and persistent net outflows of residents coinciding
with high unemployment following the early 1990s’ recession. As economic conditions strengthened through
the 2000s, the flow of interstate migration reversed with net inflows in most years.
Chart 21. NET INTERSTATE MIGRA TION AND UNEMPLOYMENT IN TASMANIA , 1988-89 TO 2018-19
Note: a negative unemployment rate differential indicates that the Tasmanian unemployment rate is higher than the
Australian unemployment rate.
Source: (Australian Bureau of Statistics, Labour Force, Australia, 2020; Australian Bureau of Statistics, National, state and
territory population, March 2020, 2020)
-4
-2
0
2
4
-4
-2
0
2
4
1988-89 1993-94 1998-99 2003-04 2008-09 2013-14 2018-19
Percentage points'000 people
Net interstate migration (LHS)
Difference between Australian and Tasmanianunemployment rate (RHS)

Part I — How our population has changed (1988-89 to 2018-19)
34 | Centre for Population
Northern Territory
Chart 22. POPULATION CHANGE IN NORTHERN TERRITORY , 1988-89 TO 2018-19
Source: (Australian Bureau of Statistics, National, state and territory population, March 2020, 2020)
Annual population growth in the Northern Territory averaged 0.3 per cent over the last 5 years, compared to
1.4 per cent at the start of the 30-year period. Growth was as high as 2.9 per cent in 2007-08 and as low
as -0.4 per cent in 2018-19 (see Chart 22).12
Over this period, overseas migration has been a consistent net contributor to the Northern Territory’s
population growth. This is despite almost one-for-one arrivals and departures in the early 1990s and again in
the early 2000s. The increase in net overseas migration until 2006-07 was driven primarily by temporary skilled
workers and working holiday makers. Net overseas migration spiked to a high of around 4,400 people in
2012-13 but has since fallen, corresponding with the end of the mining boom (Australian Bureau of Statistics,
Migration, Australia 2018-19, 2020). Downward trends in net overseas migration have been driven by a
decrease in arrivals and an increase in the departures of temporary skilled workers.
Conversely, interstate migration has generally recorded a net outflow of people from the Northern Territory for
the majority of the last 30 years. Most net interstate migration losses have been to the big 3 east coast states
— Queensland, New South Wales and Victoria, followed closely by outflows to South Australia and Western
Australia. The Northern Territory had high in-migration and out-migration flows relative to other states,
resulting in high population turnover through interstate migration.
The Northern Territory had the highest fertility rate and lowest life expectancies at birth of all Australian states.
In the Northern Territory, fertility rates have been notably higher for teenagers and women aged 20-24 years
compared with the rest of Australia. Life expectancy at birth has been lower than the Australian average over
the last 30 years and the gap varied over that time. The leading cause of death for women was diabetes, which
differed from Australia’s leading cause of death for women (dementia). The leading cause of death for men was
coronary heart disease, which was the same nationally.
12 The Northern Territory has a small population with a large proportion of Aboriginal and Torres Strait Islander people,
many living in remote locations. These 2 factors mean that projecting the territory’s population and its components for a period of any more than a few years is subject to significant and compounding error. This is evidenced by the relatively high intercensal difference observed in the Northern Territory population estimates and in the significant differences between projections and outcomes (see Part III).
-6
-4
-2
0
2
4
6
8
-6
-4
-2
0
2
4
6
8
1988-89 1993-94 1998-99 2003-04 2008-09 2013-14 2018-19
Total population growth
Natural increase
Net overseas migration
Net interstate migration
'000 '000
Intercensal difference

Part I — How our population has changed (1988-89 to 2018-19)
Centre for Population | 35
Australian Capital Territory
Chart 23. POPULATION CHANGE IN AUSTRALIAN CAPITAL TERRITORY , 1988-89 TO 2018-19
Source: (Australian Bureau of Statistics, National, state and territory population, March 2020, 2020)
Annual population growth in the Australian Capital Territory averaged 1.9 per cent over the last 5 years
compared to 1.6 per cent at the start of the 30-year period. Growth was as high as 2.5 per cent in 1990-91 and
as low as 0.3 per cent in 1996-97 and 1997-98.
Net overseas migration has grown to become a key driver of population growth in the Australian Capital
Territory. This is related to the growth of international students coming to Australia, including to universities in
Canberra. For much of the past decade, increases in the number of student arrivals accounted for the
overwhelming majority of the total increase in arrivals into the Territory (Australian Bureau of Statistics,
Migration, Australia 2018-19, 2020). The Australian Capital Territory was the only state or territory to
experience net outflows of overseas migrants in some of the last 30 years (see Chart 23).
While net interstate migration has not been a key driver of growth in the Australian Capital Territory, the flows
of interstate migration are notable. Similar to the Northern Territory, the Australian Capital Territory had
relatively large flows of people in and out compared to other states. This was due in part to the proximity of
other major population centres within New South Wales and the short-distance moves being classified as
interstate moves.
The Australian Capital Territory had the lowest total fertility rate of all the states, at 1.54 babies per woman in
2018-19. Life expectancy at birth has been higher than the Australian average over the last 30 years, but the
gap has narrowed since 2011-13. The leading causes of death were coronary heart disease for men and
dementia for women, the same as Australia overall.
-4
-2
0
2
4
6
8
10
-4
-2
0
2
4
6
8
10
1988-89 1993-94 1998-99 2003-04 2008-09 2013-14 2018-19
Total population growth
Natural increase
Net overseas migration
Net interstate migration
'000 '000
Intercensal difference

Part I — How our population has changed (1988-89 to 2018-19)
36 | Centre for Population
1.4 CAPITAL CITY AND REST -OF-STATE POPULATIONS
The last 30 years have seen capital cities13 on average grow faster than rest-of-state areas. In recent years, this
has mainly been due to higher inflows of overseas migration to the capital cities than to the rest-of-state areas.
Capital cities generally have lower fertility rates and higher life expectancies than rest-of-state areas, but are
younger (see Box 3). This is because cities have attracted a greater share of net overseas migration and the age
composition of net internal migration has also reflected younger people moving to cities from rest-of-state
areas (Regional Australia Institute, 2020).
With the exception of Darwin, growth rates in the capital cities have been consistently positive since 2000-01.
Darwin recorded negative growth in 2002-03 and more recently in 2017-18 and 2018-19 (Chart 24). All cities
have experienced variation in their growth rates over time, but growth in Perth and Darwin has been more
varied than other cities. Darwin has reported the highest and the lowest growth over the past 20 years,
primarily due to the highly cyclical nature of economic activity in the Northern Territory.
Chart 24. RATES OF POPULATION GROWTH IN CAPITAL CITIES , 2001-02 TO 2018-19
Source: (Australian Bureau of Statistics, Regional population, 2018-19, 2020)
Growth rates in the capital cities have typically been higher than growth rates in the rest-of-state areas since
2000-01 (see Chart 24 and Chart 25). As with Darwin and Perth, population growth in the rest-of-state areas in
Western Australia and the Northern Territory has moved in line with the economic cycle and has varied more
over time than in other states. The rest-of-state areas in Tasmania have also experienced varied growth with
population decline from 2011-12 to 2015-16. Population growth across different parts of each rest-of-state
area varies as well, with population having largely grown faster in towns or regions that are close to capital
cities (see Box 5).
Current sustained higher growth in the capital cities compared to rest-of-state areas has led to each capital city,
apart from Darwin, being at its largest share of the state or territory’s population on record. Since 1988-89,
Perth, Melbourne and Adelaide have consistently increased their share of the state’s population. In 2018-19,
Perth had 80 per cent of its state population, Melbourne had 77 per cent and Adelaide had 78 per cent. Sydney
increased its share of the New South Wales population over the period after experiencing small reductions
13 This Statement defines capital cities using the Australian Bureau of Statistics definition of Greater Capital City Statistical
Areas (GCCSA) — see the Glossary for more information.
-1
0
1
2
3
4
5
-1
0
1
2
3
4
5
2001-02 2005-06 2009-10 2013-14 2018-19
Per centPer cent
Brisbane Melbourne
Adelaide
Sydney
-1
0
1
2
3
4
5
-1
0
1
2
3
4
5
2001-02 2005-06 2009-10 2013-14 2018-19
Per centPer cent
Perth
Darwin
Hobart
ACT

Part I — How our population has changed (1988-89 to 2018-19)
Centre for Population | 37
until 1994-95. Brisbane grew from 48 to 49 per cent of the Queensland population. Overall, from 1988-89 to
2018-19, capital cities increased from 65 per cent of Australia’s population to 68 per cent (Australian Bureau of
Statistics, Regional population, 2018-19, 2020).
Chart 25. RATES OF POPULATION GROWTH REST-OF-STATES , 2001-02 TO 2018-19
Source: (Australian Bureau of Statistics, Regional population, 2018-19, 2020)
Net overseas migration has been the major contributor to population growth in capital city and rest-of-state
areas (see Chart 26 and Chart 27). Net overseas migration contributed 1.2 percentage points of the 1.8 per cent
growth in capital cities in 2018-19 and half the 1.0 per cent growth in the rest-of-states.
Natural increase has contributed positively to population growth around Australia — particularly in Perth and
in the rest of the Northern Territory where it has been the largest contributor to population growth. The
contribution of net internal migration varied across capital cities and rest-of-state areas. Rest-of-states
generally gained more people through net internal migration than did capital cities overall (15,000 people).
Chart 26. COMPONENTS OF CHANGE IN CAPITAL C ITIES , 2018-19
Source: (Australian Bureau of Statistics, Regional population, 2018-19, 2020)
-2
-1
0
1
2
3
-2
-1
0
1
2
3
2001-02 2005-06 2009-10 2013-14 2018-19
Per centPer cent
Rest of QldRest of Vic.
Rest of SA
Rest of NSW
-2
-1
0
1
2
3
-2
-1
0
1
2
3
2001-02 2005-06 2009-10 2013-14 2018-19
Per centPer cent
Rest of WA
Rest of NT
Rest of Tas.
-40
-20
0
20
40
60
80
100
120
140
-40
-20
0
20
40
60
80
100
120
140
Sydney Melbourne Brisbane Adelaide Perth Hobart Darwin ACT
'000'000
Natural increase
Net overseas migration
Net internal migration
Population growth
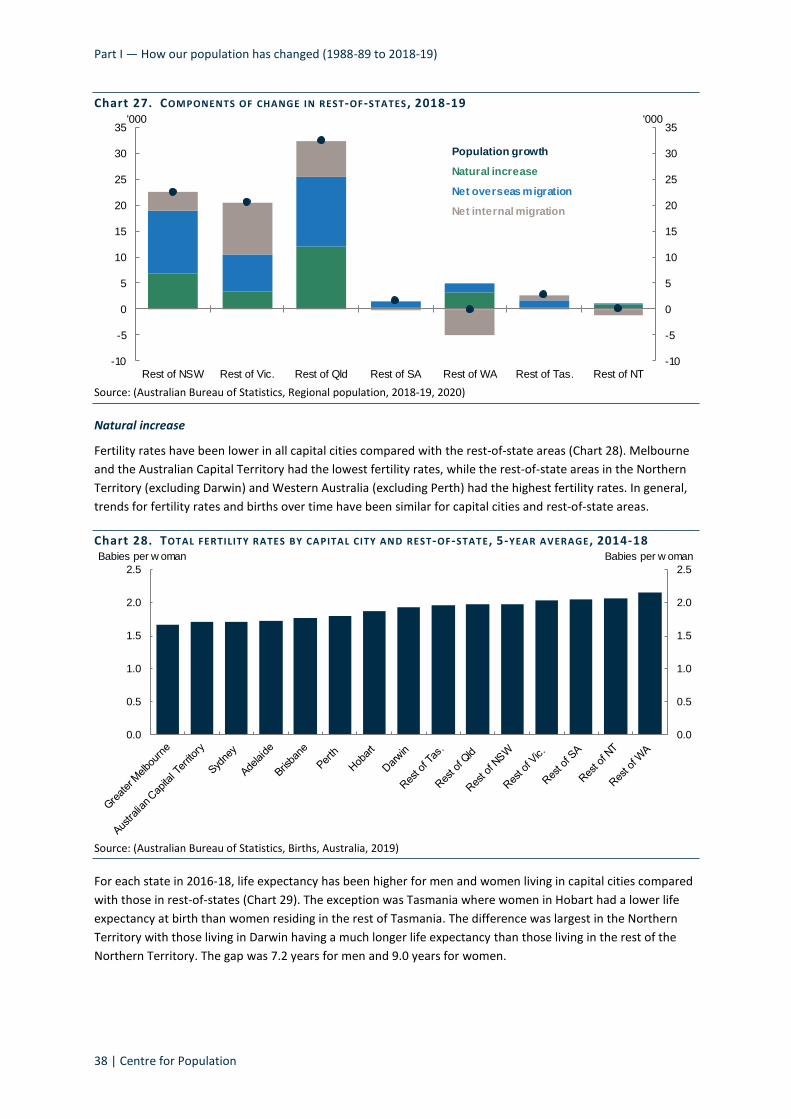
Part I — How our population has changed (1988-89 to 2018-19)
38 | Centre for Population
Chart 27. COMPONENTS OF CHANGE IN REST-OF-STATES , 2018-19
Source: (Australian Bureau of Statistics, Regional population, 2018-19, 2020)
Natural increase
Fertility rates have been lower in all capital cities compared with the rest-of-state areas (Chart 28). Melbourne
and the Australian Capital Territory had the lowest fertility rates, while the rest-of-state areas in the Northern
Territory (excluding Darwin) and Western Australia (excluding Perth) had the highest fertility rates. In general,
trends for fertility rates and births over time have been similar for capital cities and rest-of-state areas.
Chart 28. TOTAL FERTILITY RATES BY CAPITAL CITY AND REST-OF-STATE , 5-YEAR AVERAGE , 2014-18
Source: (Australian Bureau of Statistics, Births, Australia, 2019)
For each state in 2016-18, life expectancy has been higher for men and women living in capital cities compared
with those in rest-of-states (Chart 29). The exception was Tasmania where women in Hobart had a lower life
expectancy at birth than women residing in the rest of Tasmania. The difference was largest in the Northern
Territory with those living in Darwin having a much longer life expectancy than those living in the rest of the
Northern Territory. The gap was 7.2 years for men and 9.0 years for women.
-10
-5
0
5
10
15
20
25
30
35
-10
-5
0
5
10
15
20
25
30
35
Rest of NSW Rest of Vic. Rest of Qld Rest of SA Rest of WA Rest of Tas. Rest of NT
'000'000
Natural increase
Net overseas migration
Net internal migration
Population growth
0.0
0.5
1.0
1.5
2.0
2.5
0.0
0.5
1.0
1.5
2.0
2.5
Babies per w omanBabies per w oman

Part I — How our population has changed (1988-89 to 2018-19)
Centre for Population | 39
Chart 29. L IFE EXPECTANCY AT BI RTH BY CAPITAL CITY AND REST-OF-STATE , 2016-18
Source: (Australian Bureau of Statistics, 2016-18 Life Tables, 2019)
Across the capital cities and rest-of-states, life expectancy at birth increased over the period 2010-12 to
2016-18. However, in Western Australia, the Northern Territory and Tasmania life expectancy for men living in
the rest-of-state areas has plateaued in recent years. Women living in Hobart have had a smaller improvement
in life expectancy since 2010-12 than those living in the rest of Tasmania.
Net overseas migration
In 2018-19, Australia’s 3 largest cities (Sydney, Melbourne and Brisbane) accounted for 71 per cent of total net
overseas migration. Net overseas migration has been higher in the capital cities than in the rest-of-states for all
states. While most overseas migration arrivals have flowed to the capital cities, migrants who have settled in
the rest-of-states have made up a significant share of the population growth to these areas (Chart 30).
Chart 30. NET OVERSEAS MIGRATION BY CAPITAL CITY AND REST -OF-STATE , 2016-17 TO 2018-19
Note: There are only 3 years of data on net overseas migration by region. The charts above use an average of the available
data.
Source: (Australian Bureau of Statistics, Net internal and overseas migration estimates by region (SA2 and above) and age,
2016-17 onwards, 2020)
65
70
75
80
85
90
65
70
75
80
85
90S
ydney
Rest
of N
SW
Melb
ourn
e
Rest
of V
ic.
Brisb
ane
Rest
of Q
ld
Adela
ide
Rest
of S
A
Pert
h
Rest
of W
A
Hobart
Rest
of Tas.
Darw
in
Rest
of N
T
AU
STR
ALIA
N C
AP
ITA
LT
ER
RIT
OR
Y
NEW SOUTHWALES
VICTORIA QUEENSLAND SOUTHAUSTRALIA
WESTERNAUSTRALIA
TASMANIA NORTHERNTERRITORY
.
YearsYears Males Females
0
10
20
30
40
50
60
70
80
90
0
10
20
30
40
50
60
70
80
90
NSW Vic. Qld SA
'000'000
Capital city
Rest-of-state
0
2
4
6
8
10
12
14
0
2
4
6
8
10
12
14
WA ACT Tas. NT
'000'000
Capital city
Rest-of-state

Part I — How our population has changed (1988-89 to 2018-19)
40 | Centre for Population
While not analysed in detail in the Statement, components of population change can vary considerably within
the rest-of-state areas. For example, the contribution of net overseas migration to population growth in the
rest-of-states has been focused on a handful of regional centres outside the capital city, such as Wollongong
and Newcastle in New South Wales, and the Gold Coast and Sunshine Coast in Queensland.
Net internal migration
Net internal migration has been more varied among capital cities and rest-of-state areas than the other
components of population change. Among the capital cities, Sydney historically experienced a net loss of
people through internal migration (-25,600 in 2018-19), while Melbourne and Brisbane experienced strong net
gains in internal migration in recent years (2,300 and 15,900, respectively, in 2018-19) (see Chart 31).
Chart 31. NET INTERNAL MIGRATION , CAPITAL CITIES , 2006-07 TO 2018-19
Note: Net internal migration shown above is the net migration to or from any other capital city or rest-of-state area.
Source: (Australian Bureau of Statistics, Regional Internal Migration Estimates by Region (SA3 and above), Age and Sex,
2006-07 to 2015-16; Regional Internal Migration Estimates by region (SA2 and above) and age, 2016-17 onwards, n.d.)
The rest of New South Wales has typically gained people through internal migration. This is similar to the rest
of Victoria, Queensland and, in recent years, the rest of Tasmania. The rest of Western Australia has
experienced a net loss of people through internal migration since 2013-14 after a period of net gains, reflecting
the mining construction cycle (see Chart 32).
Analysis by the Regional Australia Institute found that between the 2011 and 2016 Censuses around 1.2 million
people moved to or moved within rest-of-state areas outside the capital cities (Regional Australia Institute,
2020). The report found that between 2011 and 2016 rest-of-state areas had a net gain of 65,200 people
through internal migration. The same areas had a net gain of 70,500 people between 2006 and 2011.
-30
-20
-10
0
10
20
-30
-20
-10
0
10
20
2006-07 2009-10 2012-13 2015-16 2018-19
'000'000
Sydney
Melbourne
Brisbane
Adelaide
-10
-5
0
5
10
15
-10
-5
0
5
10
15
2006-07 2009-10 2012-13 2015-16 2018-19
'000'000
Perth
Hobart
Darwin
ACT

Part I — How our population has changed (1988-89 to 2018-19)
Centre for Population | 41
Chart 32. NET INTERNAL MIGRATION, REST-OF-STATES , 2006-07 TO 2018-19
Note: Net internal migration above is the net migration to or from any other capital city or rest-of-state area.
Source: (Australian Bureau of Statistics, Regional Internal Migration Estimates by Region (SA3 and above), Age and Sex,
2006-07 to 2015-16; Regional Internal Migration Estimates by region (SA2 and above) and age, 2016-17 onwards, n.d.)
Younger people have been the most mobile group (see Chart 33). In 2018-19, the most common destinations
for people aged 15-24 years were the inner-city areas in Melbourne, Sydney and Brisbane. The most common
destinations for people aged 65 and over were areas on the south-east coast of Queensland.
Chart 33. NET INTERNAL MIGRATION BY AGE , CAPITAL CITIES AND REST-OF-STATES , 2018-19
Source: (Australian Bureau of Statistics, Net internal and overseas migration estimates by region (SA2 and above) and age,
2016-17 onwards, 2020)
-2
0
2
4
6
8
10
12
14
16
-2
0
2
4
6
8
10
12
14
16
2006-07 2009-10 2012-13 2015-16 2018-19
'000'000
Rest of NSW
Rest of Vic.
Rest of Qld
Rest of SA
-6
-5
-4
-3
-2
-1
0
1
2
-6
-5
-4
-3
-2
-1
0
1
2
2006-07 2009-10 2012-13 2015-16 2018-19
'000'000
Rest of WA
Rest of Tas.
Rest of NT
-30
-25
-20
-15
-10
-5
0
5
10
15
20
-30
-25
-20
-15
-10
-5
0
5
10
15
20'000'000
0 - 14
15 - 24
25 - 44
45 - 64
65 and over

Part I — How our population has changed (1988-89 to 2018-19)
42 | Centre for Population
BOX 5. CHARACTERISTICS OF FAST-GROWING AREAS
Growth rates in the rest-of-state areas have been highly variable. Over the last decade, the Significant Urban
Area (SUA)14 with the highest growth was Yanchep in Western Australia (Australian Bureau of Statistics,
Regional population, 2018-19, 2020). Yanchep has been designated by Western Australia for future urban
development and the City of Wanneroo anticipates it will become its largest urban centre (City of
Wanneroo, 2019). Yanchep had an average annual population growth rate of 9.8 per cent. The area with the
lowest average annual growth was Mount Isa with a rate of -1.4 per cent. Chart 34 shows the 10 fastest
growing SUAs, excluding capital city SUAs, over the last decade. Note some of these SUAs are included in the
Greater Capital Cities Statistical Areas definition (Yanchep, Melton, Bacchus Marsh and Gisborne-Macedon).
Chart 34. FASTEST GROWING SIGNI FICANT URBAN AREAS , 10-YEAR AVERAGE GROWTH
Source: (Australian Bureau of Statistics, Regional population, 2018-19, 2020)
The fastest growing areas are quite diverse. They have very different population sizes (ranging from
693,700 in the Gold Coast/Tweed region to 12,500 in Mudgee), different median ages (ranging from 33 in
Melton to 44 on the Sunshine Coast in 2018) (Australian Bureau of Statistics, Regional Statistics, ASGS 2016,
2011-2019, 2020) and different unemployment rates (ranging from 2.6 per cent in Gisborne-Macedon and
12.2 per cent in Melton) (National Skills Commission, 2020). However, there are aspects in which they are
similar.
While the fastest growing areas are spread across Australia, 6 out of the 10 areas are within 100 km of a
capital city. The main exceptions to this are Busselton (222 km) and Mudgee (266 km). The Sunshine Coast
and Warragul-Drouin are also exceptions but are very close to 100 km from their capital cities (106 and
104 kms respectively).
14 Significant Urban Areas (SUAs) are a statistical geographic area assembled by the Australian Bureau of Statistics from
existing SA2 areas. They are classified as significant urban towns or cities of 10,000 people or more (Australian Bureau of Statistics, 2017).
0
2
4
6
8
10
12
0
2
4
6
8
10
12
1.Yanchep
(WA)
2.Melton(Vic.)
3.Warragul -
Drouin(Vic.)
4.BacchusMarsh(Vic.)
5.Busselton
(WA)
6.Sunshine
Coast(Qld)
7.Geelong
(Vic.)
8.Gold
Coast -TweedHeads(Qld)
9.Gisborne -Macedon
(Vic.)
10.Mudgee(NSW)
Per centPer cent
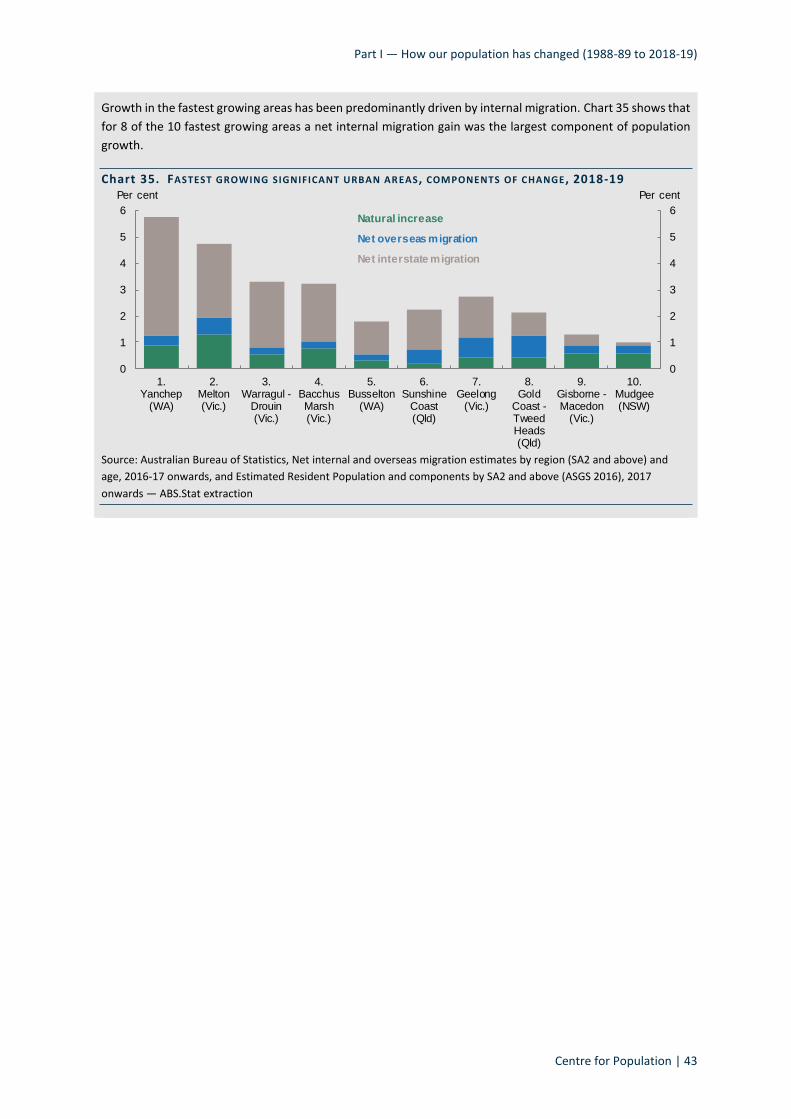
Part I — How our population has changed (1988-89 to 2018-19)
Centre for Population | 43
Growth in the fastest growing areas has been predominantly driven by internal migration. Chart 35 shows that
for 8 of the 10 fastest growing areas a net internal migration gain was the largest component of population
growth.
Chart 35. FASTEST GROWING SIGNIFICANT URBAN AR EAS , COMPONENTS OF CHANGE , 2018-19
Source: Australian Bureau of Statistics, Net internal and overseas migration estimates by region (SA2 and above) and
age, 2016-17 onwards, and Estimated Resident Population and components by SA2 and above (ASGS 2016), 2017
onwards — ABS.Stat extraction
0
1
2
3
4
5
6
0
1
2
3
4
5
6
1.Yanchep
(WA)
2.Melton(Vic.)
3.Warragul -
Drouin(Vic.)
4.BacchusMarsh(Vic.)
5.Busselton
(WA)
6.Sunshine
Coast(Qld)
7.Geelong
(Vic.)
8.Gold
Coast -TweedHeads(Qld)
9.Gisborne -Macedon
(Vic.)
10.Mudgee(NSW)
Per centPer cent
Net interstate migration
Net overseas migration
Natural increase


Part II — Our future population (2019-20 to 2030-31)
Centre for Population | 45
PART II — OUR FUTURE POPULATION (2019-20
TO 2030-31)

Part II — Our future population (2019-20 to 2030-31)
46 | Centre for Population
2. OUR FUTURE POPULATION (2019-20 TO 2030-31)
2.1 OVERVIEW OF THE NEXT 10 YEARS
Part II contains the Australian Government’s first detailed, nationally consistent population projections that
take account of COVID-19. It sets out the Centre for Population’s best estimates of Australia’s future
population, projected out to 30 June 2031. This is the ‘central case’.
Given that official population statistics, including at the national level, have almost a 6-month lag, the
starting population for these projections is Australia’s population as at 30 June 2019. Thus, the first
projection year is 2019-20. The projections run out to 30 June 2031, which is consistent with the
medium-term time horizon referred to in the Australian Government’s annual Budget.
Estimates of future population are inherently uncertain and judgment is applied to impose reasonable
assumptions (see Part III). Future estimates are more variable given the uncertainty associated with
COVID-19 as well as the nature and duration of measures intended to contain it in Australia and the rest of
the world.
In addition to the Centre’s best judgment of Australia’s future population (the central case), 2 projection
scenarios are explored:
• a ‘pre-COVID-19’ projection scenario that estimates what the future population may have been in the
absence of COVID-19. This approach allows separation of the likely effects of COVID-19 on the future
population from trends that were apparent irrespective of the pandemic, and
• an ‘extended restrictions’ projection scenario that estimates what the future population may be if the
economic and activity restrictions to manage COVID-19 extend beyond those in the central case by a
further 12 months. This approach shows how a change to the assumptions in the central case, which
itself is highly sensitive to assumptions, could affect the national population.
The assumptions for all of the projection scenarios are detailed in full in Part III.
The central case and pre-COVID-19 scenario projections of population growth, and the likely drivers of the
size and distribution of population, have been prepared at the national, state and territory (‘state’),15 and
capital cities and rest-of-state geography levels.
Main findings:
• Future population growth is projected to remain positive but slow over the next few years, falling from
1.5 per cent last observed in 2018-19 to 1.2 per cent in 2019-20, and then to 0.2 per cent in 2020-21,
which would make it the lowest annual rate of growth since zero per cent recorded in 1916-17.
• Natural increase is projected to drive all of Australia’s population growth in 2020-21 and 2021-22, with
net overseas migration forecast to be the largest contributor to population growth again by 2023-24. Net
overseas migration remains essential for long-run population growth. Without net overseas migration,
and with fertility remaining below replacement rates, Australia’s population growth would turn negative
within one generation.
– Measures to limit the spread of COVID-19 are the primary drivers of the slower growth with travel
restrictions and uncertainty due to health risks expected to result in net overseas migration falling
15 Throughout the Statement, references to the ‘states’ or ‘each state’ includes the Northern Territory and the Australian
Capital Territory.

Part II — Our future population (2019-20 to 2030-31)
Centre for Population | 47
from around 154,000 people in 2019-20 to around -72,000 people in 2020-21, and then to
around -22,000 people in 2021-22. By the end of the forecast period in 2023-24, net overseas
migration is still not expected to return to pre-COVID-19 levels.
– Once the effects of the international travel restrictions subside, migration flows of permanent
residents, Australian citizens and temporary migrants are assumed to gradually increase to flows
reflecting pre-COVID-19 behaviours. By 2028-29, net overseas migration is assumed to reach
235,000 per year and is assumed to remain at this level thereafter.
– The contribution of natural increase to population growth is expected to decline from around
139,000 people in 2019-20 to 112,000 people in 2030-31.
– Lower future fertility is assumed to contribute to slower growth as people delay decisions to have
children and the total fertility rate falls from 1.69 babies per woman in 2019-20 to 1.58 in 2021-22. It
is then assumed to rise to 1.69 by 2023-24, as most families are assumed to subsequently have the
babies they delayed. From then on, the total fertility rate is assumed to decline to and then stabilise
at 1.62 babies per woman by 2030-31.
– Life expectancies are projected to continue to increase over the projection period, and life
expectancy at birth is projected to increase from 80.7 years for men and 84.9 years for women in
2016-18 to 83.1 years for men and 86.5 years for women in 2030-31.
• Australia’s population is projected to continue to age, and at a faster rate than in the absence of
COVID-19. Between 2019-20 and 2030-31, the median age is projected to increase from 37 to 40 years,
older than the pre-COVID-19 estimate of 39 years.
• Future rates of population growth are projected to vary across Australia. In the short term, population
growth for all areas analysed is projected to slow in the near term, with some areas returning to long-run
trends more quickly than others.
– The number of people migrating interstate is projected to fall by 12 per cent in 2020-21, which would
make for the lowest rate of interstate migration as a proportion of the population on record. From
2023-24, the level of interstate and intrastate migration are assumed to return to the 20-year
average.
– While Victoria is the hardest hit state due to the pandemic’s effect on net overseas migration and net
interstate migration, its population growth is projected to return to the highest of the states from
2022-23 onward.
– The Northern Territory is projected to remain the slowest growing state until 2030-31 with annual
growth rising from a low of -1.4 per cent in 2019-20 to just under 0.7 per cent by the end of 2030-31.
– Capital cities are projected to continue growing faster than rest-of-state areas. Melbourne is
projected to overtake Sydney to become Australia’s largest city in 2026-27, growing to an estimated
population of 6.2 million by 30 June 2031, compared to 6.0 million in Sydney.
: As the populations of the capital cities are projected to continue to grow faster than the
rest-of-state areas, the share of the population living in capital cities is projected to increase in all
states over the projection period.
: Some of the rest-of-state areas are projected to become entirely reliant on overseas and internal
migration for future population growth. Natural increase is projected to become negative, as

Part II — Our future population (2019-20 to 2030-31)
48 | Centre for Population
future deaths overtake future births, from 2019-20 in the rest of South Australia, 2020-21 in the
rest of Tasmania, and 2029-30 in the rest of New South Wales.
• Australia’s future population growth and distribution have already been heavily influenced by the effects
of the COVID-19 pandemic and this is expected to continue over the next 2 years. Even following a
recovery, the effects of COVID-19 are projected to be long-lasting.
– Australia’s population is estimated to be around 4 per cent smaller (1.1 million fewer people) by
30 June 2031 than it would have been in the absence of COVID-19.
– The population is projected to reach 28.8 million by 30 June 2031 under the central case — 3 years
later than estimated in the pre-COVID-19 projection scenario under which Australia’s population is
estimated to reach 29.9 million by 30 June 2031.
– Under the extended restrictions scenario, Australia’s population is projected to be around
28.5 million by 30 June 2031, needing roughly another year to reach the 28.8 million under the
central case.
• The projected duration and magnitude of the pandemic’s impact on population growth is strongly related
to the relative significance of net overseas migration to different parts of the country.
– Capital cities are projected to bear the heaviest brunt from the pandemic, absolutely and
proportionally. The total population across all capital cities is estimated to be around 5 per cent
smaller by 30 June 2031 than in the absence of the pandemic. By contrast, the rest-of-states are
estimated to be around 2 per cent smaller than they would have been in the absence of the
pandemic.
• The likely impacts of the pandemic on population change are largely informed by the analysis of
long-term trends and historic patterns summarised in Part I and reflect the information available at a
point in time. The projections are also informed by incomplete, early indicators for 2019-20 such as
overseas arrivals and departures, provisional mortality statistics, and the official estimated resident
population statistics released in September 2020.
– To help with the availability of more timely information, the Centre for Population funded the
Australian Bureau of Statistics’ release of early provisional Regional Migration Estimates in November
2020, which provides an early look at the impacts of COVID-19 on how people are deciding to move
around Australia. The first quarterly release shows a drop in overall interstate migration in 2019-20,
consistent with projection assumptions.
The projection approach, assumptions and data used are detailed in Part III.

Part II — Our future population (2019-20 to 2030-31)
Centre for Population | 49
2.2 NATIONAL POPULATION
Australia’s population growth is projected to slow to its lowest rate in over 100 years, falling from 1.2 per cent
in 2019-20 to 0.2 per cent in 2020-21 and 0.4 per cent in 2021-22 (see Table 2). This slower growth is a result of
existing trends combined with the effects of the COVID-19 pandemic, although the latter dominates in the near
term. Annual growth is projected to increase to around 1.3 per cent by 2023-24 and then slow to around
1.2 per cent by the end of the projection period.
Measures to limit the spread of the virus, such as restrictions applied to international borders and travel, are
assumed to result in net overseas migration falling from 154,000 people in 2019-20 to -72,000 people in
2020-21, and then to -22,000 people in 2021-22. This comes on top of a lower assumed total fertility rate of
1.58 babies per woman in 2021-22 (a fall from what is already the lowest fertility rate recorded for Australia),
as some families are expected to delay having children as a result of the pandemic.
Despite the assumed drop in the fertility rate, natural increase is projected to contribute all of Australia’s
population growth in 2020-21 and 2021-22 (see Chart 36). Net overseas migration is forecast to again be the
largest contributor to population growth by 2023-24, even though levels of net overseas migration are forecast
to still be below pre-COVID-19 levels. Net overseas migration is assumed to increase from 201,000 in 2023-24
to the long-run assumption of 235,000 by 2028-29 and remain at that level thereafter (discussed further in
Part III).
In the long run, net overseas migration is essential for population growth. Assuming future fertility remains
below replacement rates, Australia’s population growth would turn negative within one generation in the
absence of net overseas migration. This is because net overseas migration not only contributes directly to
population growth when it occurs, but because migrants also contribute to future natural increase by having
children after they arrive.
Chart 36. PROJECTED POPULATION GROWTH AND COMPONENTS , AUSTRALIA , 2018-19 TO 2030-31
Source: (Australian Bureau of Statistics, National, state and territory population, March 2020, 2020), Centre for Population
projections
As projected population movements are dominated by the likely effects of the pandemic in the near term it is
helpful to isolate its effects from longer-term trends. To do this, population projections under the central case
are compared against a pre-COVID-19 projection scenario. Even in the absence of COVID-19, the rate of
population growth would have been projected to slow from 1.5 per cent in 2018-19 to 1.3 per cent in 2030-31
reflecting the long-run decline in the fertility rate. At a national level, the main differences in growth rates
-0.5
0.0
0.5
1.0
1.5
2.0
-0.5
0.0
0.5
1.0
1.5
2.0
2018-19 2019-20 2020-21 2021-22 2022-23 2023-24 2024-25 2025-26 2026-27 2027-28 2028-29 2029-30 2030-31
Per centPer cent
Natural increase Net overseas migration
Population growth
Population growth (Pre-COVID-19)
Forecasts Projections

Part II — Our future population (2019-20 to 2030-31)
50 | Centre for Population
between the 2 scenarios are projected to occur over the next 5 years from changes to net overseas migration
and fertility.
Australia’s population is expected to be smaller by 30 June 2031 in the central case compared to the
pre-COVID-19 projections (see Chart 37). While the rate of population growth under the central case converges
to the growth rate in the pre-COVID-19 scenario, population in the central case is projected to reach
28.8 million by 30 June 2031, 3 years later than under the pre-COVID-19 projection scenario.
In addition to the central case and the pre-COVID-19 scenario, the Centre has modelled an ‘extended
restrictions’ scenario (see Box 6) at the national level. This scenario explores the possible population effects of
extending the economic and activity restrictions to manage the pandemic beyond those in the central case by a
further 12 months. Under the extended restrictions scenario, Australia’s population is projected to reach
28.5 million by 30 June 2031 — about one year later than in the central case, and about 4 years later than in
the pre-COVID-19 projection. Scenario assumptions are summarised in Box 6 and detailed in Part III.
Chart 37. POPULATION PROJECTIONS, AUSTRALIA , 2018-19 TO 2030-31
Source: (Australian Bureau of Statistics, National, state and territory population, March 2020, 2020), Centre for Population
projections
The main effect of the extended restrictions on Australia’s population is expected to occur through net
overseas migration. Under this scenario, net overseas migration is forecast to remain negative for a third
consecutive year due to continued departures and a lack of arrivals to replenish those departures. The
extended restrictions scenario is also expected to have a further impact on the fertility rate, associated with
prolonged economic uncertainty.
Under the extended restrictions scenario, population growth is still expected to fall to a low of 0.2 per cent in
2020-21; however, it reaches just 0.3 per cent in 2021-22 compared to 0.4 per cent in the central case, and
climbs to 0.4 per cent in 2022-23 compared to 0.9 per cent in the central case (see Chart 38). Overall, the total
population projected for 30 June 2031 ranges from 28.5 million people under the extended restrictions
scenario to 29.9 million people under the pre-COVID-19 projections.
23
24
25
26
27
28
29
30
31
23
24
25
26
27
28
29
30
31
2018-19 2020-21 2022-23 2024-25 2026-27 2028-29 2030-31
MillionMillion
Central
Pre-COVID-19
Extended restrictions
ProjectionsForecasts

Part II — Our future population (2019-20 to 2030-31)
Centre for Population | 51
Chart 38. POPULATION GROWTH , AUSTRALIA , 2018-19 TO 2030-31
Source: (Australian Bureau of Statistics, National, state and territory population, March 2020, 2020), Centre for Population
projections
Table 2. SUMMARY OF POPULATION PROJECTIONS 2019-20 2020-21 2021-22 2022-23 2023-24 2030-31
CENTRAL CASE
Population at start of year (m) 25.4 25.7 25.7 25.8 26.0 28.4 Births (‘000s) 310 301 296 302 310 317 Deaths (‘000s) 171 174 176 178 181 205 Natural Increase (‘000s)
139 128 120 124 129 112
Arrivals (‘000s) 435 123 232 361 519 594 Departures (‘000s) 280 195 254 265 318 359 Net Overseas Migration (‘000s)
154 -72 -22 96 201 235
Population at end of year (m) 25.7 25.7 25.8 26.0 26.4 28.8 Population Growth (%) 1.2 0.2 0.4 0.9 1.3 1.2
PRE-COVID-19 SCENARIO
Population at end of year (m) 25.7 26.1 26.5 26.9 27.3 29.9 Population Growth (%) 1.5 1.5 1.5 1.4 1.4 1.3
EXTENDED RESTRICTIONS SCENARIO
Population at end of year (m) 25.7 25.7 25.8 25.9 26.1 28.5 Population Growth (%) 1.1 0.2 0.3 0.4 1.1 1.2
Source: Centre for Population projections
BOX 6. SCENARIO ANALYSIS
The effects of COVID-19 on Australia’s long-term future population growth are extremely uncertain and
dependent on a range of factors, including but not limited to: the ongoing management of COVID-19 cases in
Australia, the delivery of a vaccine, the requirement for ongoing quarantine measures, international travel
restrictions and the recovery of the economy.
0.0
0.5
1.0
1.5
2.0
0.0
0.5
1.0
1.5
2.0
2018-19 2020-21 2022-23 2024-25 2026-27 2028-29 2030-31
Per centPer cent
Pre-COVID-19
Extended restrictions
Central
ProjectionsForecasts
Part II — Our future population (2019-20 to 2030-31)
52 | Centre for Population
The assumptions applied to develop projections under the central case are consistent with the assumptions
used in Budget 2020-21:
• It is assumed that over the forecast period material localised outbreaks of COVID-19 occur but are largely
contained. A population‑wide Australian COVID-19 vaccination program is assumed to be fully in place by
late 2021. General social distancing restrictions are assumed to continue until a vaccine is fully available.
• It is assumed that state border restrictions currently in place are lifted by the end of 2020, except for
Western Australia which is assumed to open from 1 April 2021.16 Inbound and outbound international
travel are assumed to remain low through the latter part of 2021.
To explore the range of possible impacts on population due to COVID-19, 2 scenarios have been modelled in
addition to the central projections.
• The pre-COVID-19 projection scenario estimates what the future population may have been in the
absence of COVID-19. This approach allows separation of the likely effects of COVID-19 on the future
population from trends that were apparent irrespective of the pandemic.
• The extended restrictions projection scenario estimates what the future population may be if the
economic and activity restrictions to manage COVID-19 extend beyond those in the central case by a
further 12 months. This approach shows how a change to the assumptions in the central case, which
itself is highly sensitive to assumptions, could affect the national population. The extended restrictions
are assumed to give rise to a similar level of economic upheaval and uncertainty as that observed in
Australia’s initial wave of infections and the second outbreak in Victoria. This scenario assumes that
inbound and outbound international travel restrictions remain in place until late 2022, which could be
due to one of the following:
– rolling outbreaks of the virus in Australia necessitating the reimposition of severe containment
measures
– a delay in the availability and/or roll out of a population-wide COVID 19 vaccination program.
A summary of assumptions for each population component under each scenario is outlined in Part III.
2.2.1 NATURAL INCREASE
Consistent with the observed long-run trend, natural increase in the central projections is estimated to decline
over the projection period from around 139,000 people in 2019-20 to around 112,000 in 2030-31. This decline
is the result of a smaller increase in the number of babies being born compared to the rise in the number of
annual deaths due to an older population. A gradual decline is also assumed to occur in the pre-COVID-19
projections as the total fertility rate is assumed to decline in the long run even without the pandemic (see Chart
39).
The total fertility rate is assumed to fall from 1.69 babies per woman in 2019-20 to 1.58 in 2021-22 as a result
of some families delaying when they have a child. This delay is assumed to be short-lived with around 4 out of
every 5 babies who would have been born in this period projected to be born within 10 years. The total fertility
rate is, therefore, projected to recover to 1.69 babies per woman in 2023-24 before gradually declining to
1.62 in 2030-31. This longer-term decline reflects the trend of families tending to have children later and having
fewer children when they do (McDonald, 2020), and is also reflected in the pre-COVID-19 projection scenario.
16 This assumption does not materially impact the projections, but has been retained for consistency with Budget.

Part II — Our future population (2019-20 to 2030-31)
Centre for Population | 53
Overall, it is estimated there will be around 245,000 fewer births by 2030-31 under the central case compared
to the pre-COVID-19 projection scenario. This is due not only to a lower assumed fertility rate, but also to there
being a smaller population of potential parents as the inflow of migrants slows.
Chart 39. NATURAL INCREASE AND COMPONENTS , AUSTRALIA , 2018-19 TO 2030-31
Source: (Australian Bureau of Statistics, National, state and territory population, March 2020, 2020), Centre for Population
projections
Life expectancies are projected to continue to increase over time as age-specific mortality rates are assumed to
continue to improve. Over the projection period, mortality rates are generally assumed to improve at the same
annual rates observed in the last 30 years over all ages and sexes. Life expectancy at birth is projected to
increase from 80.7 years for men and 84.9 years for women in 2016-18 to 83.1 years for men and 86.5 years for
women in 2030-31.
There have been around 28,000 confirmed cases of COVID-19 in Australia and, at the time of publication, just
over 900 deaths attributed to it (Department of Health, 2020). Provisional Australian Bureau of Statistics
mortality data shows that the number of doctor-certified deaths between January and July 2020 was slightly
higher than the number of doctor-certified deaths on average between January and July in the previous 5 years
(Australian Bureau of Statistics, Provisional Mortality Statistics Jan-July, 2020). In particular, compared with the
January-July average over the previous 5 years, aggregate doctor-certified deaths between January and July in
2020 were slightly higher for men aged 65 years and over. Deaths due to COVID-19 have been reported in
those aged in their 20s to their 100s, but the majority of deaths have been reported in people aged 70 years
and over (Department of Health, 2020).
The Australian Institute of Health and Welfare modelled what might have happened in Australia if infection
rates as high as those in the UK, Canada and Sweden were experienced here in the first 4 months of the
pandemic. If these rates were applied to the Australian population, it is estimated there could have been
between 4,800 and 14,400 deaths due to COVID-19 in the first 4 months of the pandemic (Australian Institute
of Health and Welfare, Australia’s Health 2020 Data Insights, 2020). Other research has found that had
Australia experienced the high mortality observed in England and Wales there would have been 19,400 ‘excess
deaths’ in 2019-20 (Wilson, Temple, & Charles-Edwards, 2020).17
To put this in context, there would need to be around 25,000 additional deaths from COVID-19 (or a
15 per cent annual increase in deaths) to reduce Australia’s annual rate of population growth by 0.1 percentage
17 Excess deaths refers to the number of deaths from all causes during a crisis above and beyond what would have been
expected under ‘normal’ conditions.
-300
-200
-100
0
100
200
300
400
-300
-200
-100
0
100
200
300
400
2018-19 2019-20 2020-21 2021-22 2022-23 2023-24 2024-25 2025-26 2026-27 2027-28 2028-29 2029-30 2030-31
'000'000
Births
DeathsNatural increase Natural increase (Pre-COVID-19)
ProjectionsForecasts

Part II — Our future population (2019-20 to 2030-31)
54 | Centre for Population
points. Based on the evidence to date, COVID-19 is not currently expected to significantly affect future
mortality or rates of improvement at the aggregate level. This may change depending, for example, on the
potential for future outbreaks, the effects of people deferring medical treatment and the unknown long-term
health outcomes for survivors of the virus.
Lower future fertility and higher future life expectancies lead to further population ageing (see Box 7). Towards
the end of the projection period, the level of net overseas migration is assumed to remain flat, meaning that it
will contribute proportionally less population growth in later years. This also contributes to projected
population ageing.
BOX 7. POPULATION AGEING — 2019-20 TO 2030-31
Between 30 June 2019 and 2031, the median age in Australia is projected to increase from around 37 to
40 years. The proportion of people aged 65 and over is projected to increase from 15.9 to 19.5 per cent, and
the dependency ratio18 is projected to change from 1.89 to 1.75. This deterioration is projected to come as
the youngest of the baby boomer generation turn 65 by 30 June 2031.
Compared to the central case, and in the absence of COVID-19, the median age is projected to increase to
around 39 years, the proportion of the population age 65 and over is projected to increase to 18.8 per cent,
and the dependency ratio is projected to fall to 1.78.
COVID-19 will contribute to the faster ageing of Australia’s population as some families put off having
children and fewer young migrants enter Australia in the short term due to international border restrictions.
Once these restrictions are lifted, the resumption of overseas migration will again help to slow the rate of
population ageing. Without overseas migration, labour force growth in Australia would become negative by
2050 (Chomik, Piggott, & McDonald, 2017), and overall population growth would decline within a
generation.
By 30 June 2031, the future populations in New South Wales, Victoria, Western Australia and Queensland
are projected to have similar median ages (between 39 and 40 years), shares of people aged 65 and over
(between 18.0 and 20.2 per cent) and dependency ratios (between 1.69 and 1.87) as those for Australia
generally (40 years, 19.5 per cent and 1.75 respectively).
The Northern Territory is projected to remain Australia’s youngest state at 30 June 2031, with its median age
projected to be 36 years, its share of population aged 65 and over to be 11.8 per cent and its dependency
ratio to be 2.36. The projected ageing of the Northern Territory’s population is partially due to its increasing
life expectancy and declining fertility rate. The Australian Capital Territory’s population is projected to
remain Australia’s second youngest state at 30 June 2031. Its median age is projected to be 38 years, the
share of its people aged 65 and over 16.4 per cent and its dependency ratio 2.01.
18 The dependency ratio refers to the number of people of traditional working-age (15-64) for every person
aged under 15 and 65 and over. The old age dependency ratio refers only to the number of people of traditional working-age (15-64) for every person aged 65 and over.
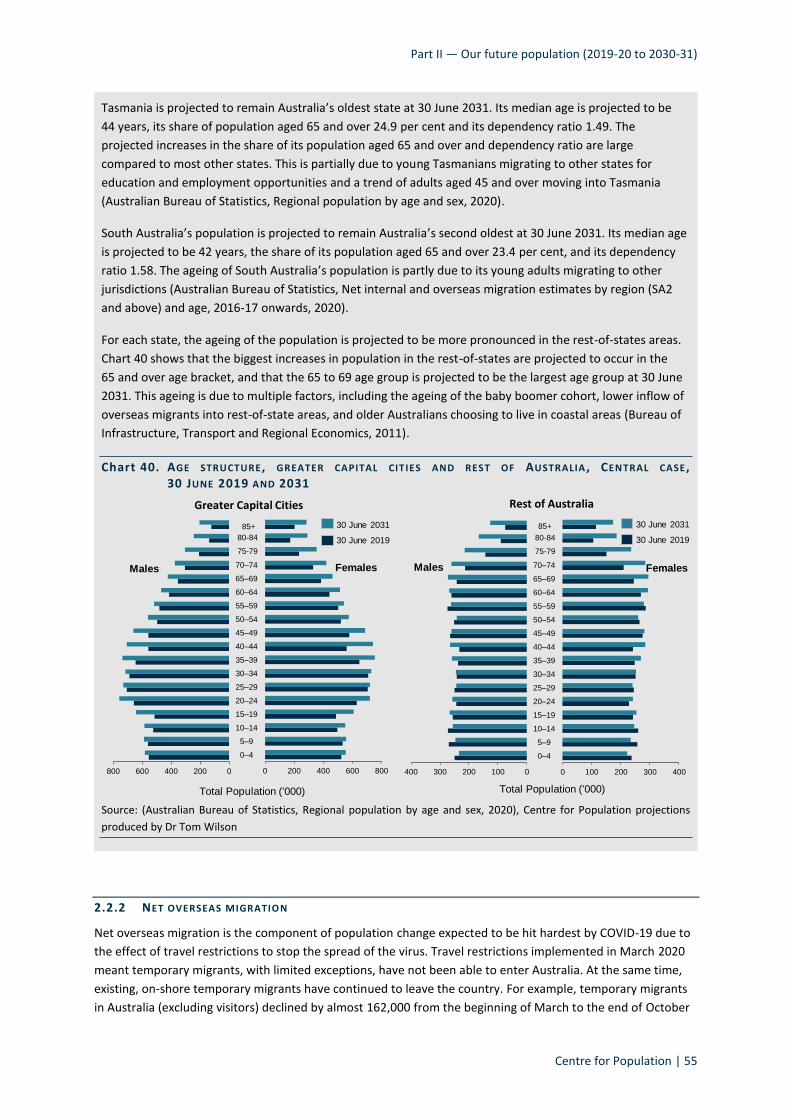
Part II — Our future population (2019-20 to 2030-31)
Centre for Population | 55
Tasmania is projected to remain Australia’s oldest state at 30 June 2031. Its median age is projected to be
44 years, its share of population aged 65 and over 24.9 per cent and its dependency ratio 1.49. The
projected increases in the share of its population aged 65 and over and dependency ratio are large
compared to most other states. This is partially due to young Tasmanians migrating to other states for
education and employment opportunities and a trend of adults aged 45 and over moving into Tasmania
(Australian Bureau of Statistics, Regional population by age and sex, 2020).
South Australia’s population is projected to remain Australia’s second oldest at 30 June 2031. Its median age
is projected to be 42 years, the share of its population aged 65 and over 23.4 per cent, and its dependency
ratio 1.58. The ageing of South Australia’s population is partly due to its young adults migrating to other
jurisdictions (Australian Bureau of Statistics, Net internal and overseas migration estimates by region (SA2
and above) and age, 2016-17 onwards, 2020).
For each state, the ageing of the population is projected to be more pronounced in the rest-of-states areas.
Chart 40 shows that the biggest increases in population in the rest-of-states are projected to occur in the
65 and over age bracket, and that the 65 to 69 age group is projected to be the largest age group at 30 June
2031. This ageing is due to multiple factors, including the ageing of the baby boomer cohort, lower inflow of
overseas migrants into rest-of-state areas, and older Australians choosing to live in coastal areas (Bureau of
Infrastructure, Transport and Regional Economics, 2011).
Chart 40. AGE STRUCTURE , GREATER CAPITAL CIT IES AND REST OF AUSTRALIA , CENTRAL CASE ,
30 JUNE 2019 AND 2031
Source: (Australian Bureau of Statistics, Regional population by age and sex, 2020), Centre for Population projections
produced by Dr Tom Wilson
2.2.2 NET OVERSEAS MIGRATION
Net overseas migration is the component of population change expected to be hit hardest by COVID-19 due to
the effect of travel restrictions to stop the spread of the virus. Travel restrictions implemented in March 2020
meant temporary migrants, with limited exceptions, have not been able to enter Australia. At the same time,
existing, on-shore temporary migrants have continued to leave the country. For example, temporary migrants
in Australia (excluding visitors) declined by almost 162,000 from the beginning of March to the end of October
0200400600800 0 200 400 600 800
0–4
5–9
10–14
15–19
20–24
25–29
30–34
35–39
40–44
45–49
50–54
55–59
60–64
65–69
70–74
75-79
80-84
85-89 30 June 2031
30 June 2019
Males
Total Population ('000)
Females
0100200300400 0 100 200 300 400
0–4
5–9
10–14
15–19
20–24
25–29
30–34
35–39
40–44
45–49
50–54
55–59
60–64
65–69
70–74
75-79
80-84
85-89
Females
30 June 2031
30 June 2019
Rest of AustraliaGreater Capital Cities
Total Population ('000)
Males
85+ 85+

Part II — Our future population (2019-20 to 2030-31)
56 | Centre for Population
2020 following the closure of international borders on 20 March 2020. This is in stark contrast to the previous
9 years when the change in the number of temporary migrants in Australia from the beginning of March to the
end of October was always positive, with an average increase of 38,000 people.
Inbound and outbound international travel is assumed to remain low through to the end of 2021. A
population-wide COVID-19 vaccination program is assumed to be in place by that time. That is, the vaccine
program is in place enough to allow for relatively free movement of people (no assumptions are made about
vaccination coverage rates). As international borders reopen, behavioural responses to COVID-19 and softer
labour markets domestically and globally are anticipated to affect potential migrants’ decisions about
emigrating to or from Australia (see Part III for more details).
Forecasts and projections have been prepared by incorporating assumptions about these behavioural
responses to the pre-COVID-19 scenario where the COVID-19 pandemic is assumed not to have occurred (see
Part III for a description of the pre-COVID-19 scenario). Table 3 summarises the effect of assumptions and
reflects differing behaviours among migrant groups. For example, migrants arriving to join the Australian
labour market are assumed to have a higher likelihood of returning to pre-COVID-19 behaviours within the
forecast period than students or working holiday makers who have more options, such as to defer or undertake
alternative activities in their home country or elsewhere. The assumptions relating to permanent arrivals
reflect the current permanent migration program settings which are expected to result in a relatively high
proportion of onshore visa grants.
Table 3. LEVEL OF OVERSEAS ARRIVALS AND DEPARTU RES RELATIVE TO PRE-COVID-19 SCENARIO (%) FINANCIAL YEAR ALL TEMPORARY
ARRIVALS
NZ ARRIVALS PERM. ARRIVALS PERM. DEPARTURES
2020–21 4 25 20 0
2021–22 20 100 50 50
2022–23 61 100 65 75
2023-24 91 100 100 100
Note: Australian citizen departures are included in permanent departures. Australian citizen arrivals are not included in
permanent arrivals as these are assumed to be the same as in the pre-COVID-19 scenario. Similarly, departures by
temporary migrants are assumed to be the same as in the pre-COVID-19 scenario.
Source: Centre for Population forecasts and projections
The effect of travel restrictions in the March and June quarters of 2020 is forecast to lead to net overseas
migration falling from 240,000 in 2018-19 to 154,000 in 2019-20 (Chart 41). This is expected to occur for a
number of reasons and provides insights into forecasts further out.
While the international border was closed to most temporary migrants for less than one full quarter, net
overseas migration in 2019-20 for all temporary migrants is forecast to be almost half the size it was in
2018-19. The departure of existing, on-shore temporary migrants discussed above is expected to have a large
downward effect on net overseas migration numbers.
Australian citizens are forecast to return to Australia in record numbers in 2019-20 and few departures are
anticipated. The lower departures recorded to March 2020 are considered to be influenced by those who
departed in 2019 returning earlier than they anticipated due to the pandemic. As Australian citizens are
forecast to be net immigrants rather than emigrants over the entire forecast period, this keeps the level of net
overseas migration (and hence population growth) higher than it otherwise would be. This record flow is not

Part II — Our future population (2019-20 to 2030-31)
Centre for Population | 57
expected to offset the flow of temporary migrants leaving Australia. Finally, the number of permanent resident
arrivals is expected to have declined significantly since March 2020 relative to 2018-19.
In 2020-21, with only very low levels of temporary migrants expected to be in demand to address priority skills
shortages in the health, construction and software development sectors, all temporary migrant groups are
forecast to be net emigrants. This would be the first time that more people have left Australia than arrived in
75 years — since just after World War II.
Chart 41. NET OVERSEAS MIGRATION FORECASTS AND PROJECTIONS , 2007-08 TO 2030-31
Note: Net overseas migration forecasts are based on the same assumptions as at Budget 2020-21. Quarterly data presented
on a year-ending basis. Number of visas is based on the visa type at the time of a traveller’s arrival or departure. Transfers
to other visa types while onshore are not captured, for example, some international students transfer to skilled visas or
permanent visas while onshore. ‘Other’ includes visitors, temporary and unclassified visa (missing administrative visa
information). ‘All permanents’ includes skilled, family and humanitarian categories.19
Source: Centre for Population calculations based on unreleased Department of Home Affairs data, Centre for Population
forecasts and projections
As travel restrictions are assumed to ease during 2021-22, temporary migrants are forecast to begin returning,
although with arrivals forecast to be lower than 30 per cent of pre-COVID-19 levels, while departures of
temporary migrants continue as normal. As a result, net flows for all temporary migrants, with the exception of
New Zealanders, are forecast to remain negative and reduce population growth. With weak labour markets
globally, emigration rates of Australian citizens and permanent residents are expected to remain depressed
with Australian citizens continuing to arrive in larger numbers than depart the country. Overall, net overseas
migration is forecast to be -22,000 in 2021-22.
Over the remainder of the forecast period — with increasing arrivals of students, temporary skilled workers
and other temporary migrants — net overseas migration is forecast to increase to 201,000 by 2023-24. Net
overseas migration is not expected to return to pre-COVID-19 levels by the end of the forecast period (2023-24)
due to reduced demand from international students and a soft labour market leading to lower demand for
skilled migrants and working holiday experiences.
19 The visa composition in the transition from the end of the forecast period, 2023-24, to the long-run net overseas
migration assumption, cannot be fully identified. The orange bars in the projection period reflect both that the 2023-24 starting point is only one of many possible forecast outcomes, and that the long-run assumption incorporates temporary migrants that transition to permanent residents into the permanent resident component. It is not possible to compare net overseas migration components in the long-run assumption with the history and forecast elements.
-200
-150
-100
-50
0
50
100
150
200
250
300
350
-200
-150
-100
-50
0
50
100
150
200
250
300
350
2007-08 2010-11 2012-13 2015-16 2017-18 2020-21 2022-23 2025-26 2027-28 2030-31
'000'000
Australian
New Zealander
All temporary visas and other
Permanent visas
Net overseas migration (total)
Forecasts Projections
All visa types

Part II — Our future population (2019-20 to 2030-31)
58 | Centre for Population
Once the effects of COVID-19 international travel restrictions subside, migration flows of permanent residents,
Australian citizens and temporary migrants are assumed to gradually increase to flows reflecting pre-COVID-19
behaviours. By 2028-29, net overseas migration is assumed to reach the long-run assumption of 235,000 per
year and is assumed to remain at this level thereafter. The long-run assumption is discussed in more detail in
Part III.
Compared to the pre-COVID-19 scenario, the central scenario for net overseas migration estimates that
between 2019-20 and 2028-29, there will be 1.1 million fewer immigrants and almost 250,000 fewer emigrants
as a result of the pandemic. Equivalently, the direct contribution to population growth from net overseas
migration in the central scenario is 900,000 fewer people when compared to the pre-COVID-19 scenario.
All forecasts have varying levels of uncertainty around them. The unknown behavioural responses to changing
health and economic conditions have lowered the predictability of future migration patterns significantly. The
forecasts of future net overseas migration remain highly dependent on assumptions made about the spread of
the virus, the duration of the mitigation measures here and abroad, and the behavioural responses by
would-be migrants to evolving economic conditions.
2.2.3 NET INTERNAL MIGRATION
The COVID-19 pandemic is expected to reduce the number of internal moves in the short term, due to
economic uncertainty and restrictions such as hard border closures. Impacts in the longer term are less clear,
but can be expected to be driven by the relative economic conditions of different parts of the country; such as,
gross state product, unemployment, house prices and people’s assessment of the net benefit they will have
from moving. This includes the non-financial benefits such as family, social connections and lifestyle (Australian
Bureau of Statistics, Reflecting Australia - Stories from the Census, 2016, 2018).
As decisions about internal migration reflect multiple social and economic considerations for an individual and
the relative economic prospects of different locations, forecasting or projecting internal migration is very
difficult. The onset of the COVID-19 pandemic further compounds this uncertainty as its impacts have not been
evenly distributed across the country. Victoria has experienced greater social and economic impacts due to its
second outbreak and resulting lockdown. This can be expected to lead to a short-term increase in
out-migration from Victoria, and Greater Melbourne in particular, relative to other states. Further, a short-term
increase in net migration from the cities to rest-of-state areas can be expected within each state, except for the
Northern Territory (University of Queensland, unpublished).
In projecting future net internal migration, it is assumed that the level of net internal migration — the number
of people who move — falls as a result of the pandemic and the associated economic and activity restrictions.
The level of interstate migration is projected to fall by 12 per cent in 2020-21 compared to 2019-20, which will
be the largest year-on-year drop in interstate migration in around 40 years and lead to the lowest rate of
interstate migration as a proportion of the population on record. This is because there is assumed to be a
15 per cent drop in 2020-21 across all states and territories, except for Victoria which is assumed to have fewer
people arriving and more people leaving. This reflects the direct impacts of the COVID-19 pandemic (such as
hard border closures) and indirect impacts (such as the resulting economic recession), in addition to historically
low levels of interstate migration in Australia. The level of interstate migration is assumed to return to the
20-year average from 2023-24, along with an increase in the proportion of the population that moves (see
Chart 42).
The geographic pattern of future net internal migration is already difficult to predict and COVID-19 has further
added to this uncertainty. As a result, the patterns of net interstate migration are assumed to reflect the
direction of interstate migration in recent years, before returning to the average allocation for the last 20 years
from 2023-24 onward. This means that states like Tasmania and Western Australia, which have experienced
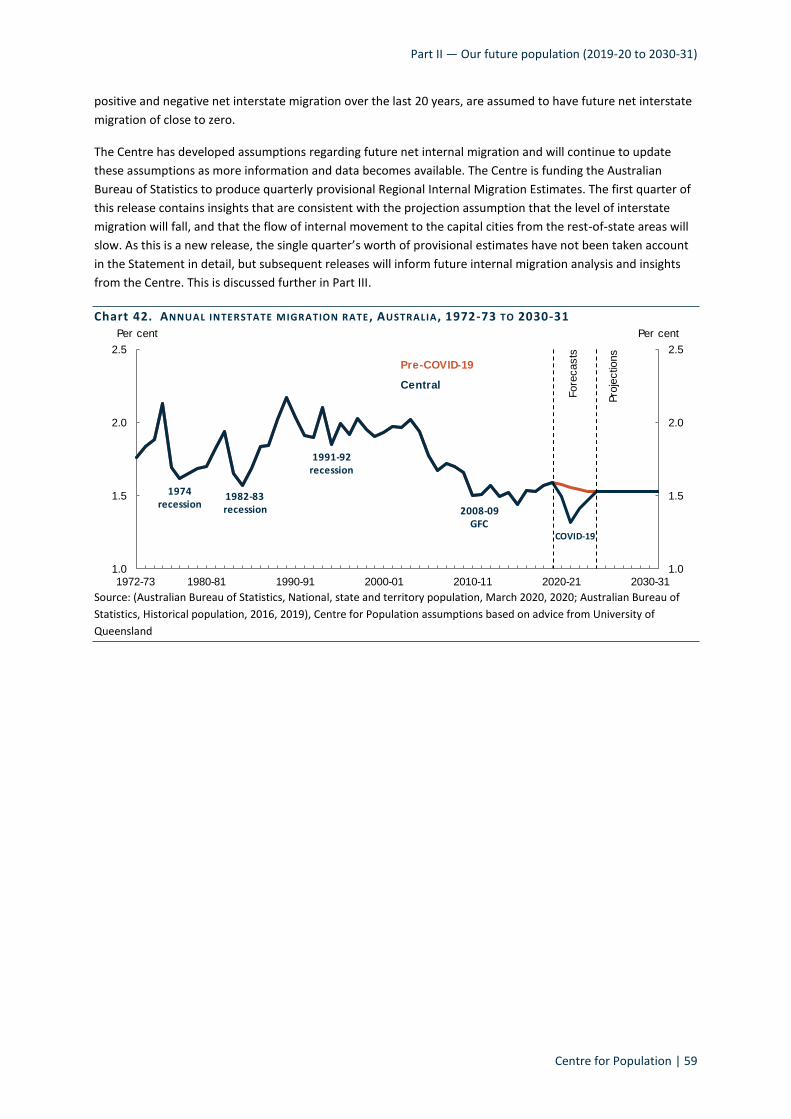
Part II — Our future population (2019-20 to 2030-31)
Centre for Population | 59
positive and negative net interstate migration over the last 20 years, are assumed to have future net interstate
migration of close to zero.
The Centre has developed assumptions regarding future net internal migration and will continue to update
these assumptions as more information and data becomes available. The Centre is funding the Australian
Bureau of Statistics to produce quarterly provisional Regional Internal Migration Estimates. The first quarter of
this release contains insights that are consistent with the projection assumption that the level of interstate
migration will fall, and that the flow of internal movement to the capital cities from the rest-of-state areas will
slow. As this is a new release, the single quarter’s worth of provisional estimates have not been taken account
in the Statement in detail, but subsequent releases will inform future internal migration analysis and insights
from the Centre. This is discussed further in Part III.
Chart 42. ANNUAL INTERSTATE MIGRATION RATE , AUSTRALIA , 1972-73 TO 2030-31
Source: (Australian Bureau of Statistics, National, state and territory population, March 2020, 2020; Australian Bureau of
Statistics, Historical population, 2016, 2019), Centre for Population assumptions based on advice from University of
Queensland
1.0
1.5
2.0
2.5
1.0
1.5
2.0
2.5
1972-73 1980-81 1990-91 2000-01 2010-11 2020-21 2030-31
Per centPer cent
Pre-COVID-19
Central
Fore
casts
Pro
jectio
ns
1974 recession
1982-83recession
1991-92 recession
2008-09GFC
COVID-19

Part II — Our future population (2019-20 to 2030-31)
60 | Centre for Population
2.3 STATE AND TERRITORY POPU LATIONS
Consistent with historical trends and the projections of Australia’s overall population growth, net overseas
migration and net interstate migration are expected to continue to have the greatest impact on driving
differences in state population growth over time. By contrast, natural increase is projected to remain relatively
stable and does not drive substantial changes in population growth over time, although it does vary across
different parts of Australia.
The distribution of migrants is strongly affected by the composition of migrant classes (such as international
students, New Zealanders and working holiday makers) across states and territories, which in turn is driven by
differing economic opportunities. For example, New South Wales and Victoria have historically had a larger
share of temporary student migrants and the Northern Territory has historically attracted working holiday
makers.
Due to the impacts of the COVID-19 pandemic on international movements, states and territories that have
historically gained a large proportion of their growth from overseas migrants are forecast to experience a
relatively larger fall in their population growth (Chart 43). The level of migrants forecast to flow to states and
territories reflects the underlying trends in current arrival and departure patterns as well as the composition of
migrants. Despite the impacts of COVID-19 on net overseas migration, the increasing share of net overseas
migration accounted for in Victoria, and underway for much of the last decade, is projected to continue. By
2030-31, Victoria’s share of net overseas migration is projected to increase to 38 per cent while New South
Wales share is projected to decline to 31 per cent. In 2018-19, these 2 state’s shares were almost identical.
Chart 43. NET OVERSEAS MIGRATION BY STATE , 2018-19 TO 2030-31
Source: (Australian Bureau of Statistics, National, state and territory population, March 2020, 2020), Centre for Population
forecasts and projections
Additionally, levels of interstate migration in most states and territories are expected to be lower than in the
pre-COVID-19 scenario due to the economic effects of the pandemic (Chart 44). In the forecast period, and in
net terms, fewer people are expected to leave states that usually experience net interstate migration losses,
and fewer people are expected to arrive in states that usually experience net interstate migration gains.
-40
-20
0
20
40
60
80
100
-40
-20
0
20
40
60
80
100
2018-19 2021-22 2024-25 2027-28 2030-31
'000'000
NSW
Vic.
Qld
SA
Forecasts Projections
-5
0
5
10
15
20
25
30
-5
0
5
10
15
20
25
30
2018-19 2021-22 2024-25 2027-28 2030-31
'000'000
WA
Tas.
ACT
NT
Forecasts Projections

Part II — Our future population (2019-20 to 2030-31)
Centre for Population | 61
Chart 44. NET INTERSTATE MIGRATION BY STATE , CENTRAL CASE , 2018-19 TO 2030-31
Source: (Australian Bureau of Statistics, National, state and territory population, March 2020, 2020), Centre for Population
assumptions based on advice from University of Queensland
In the short term, all states and territories are projected to experience an immediate drop in population growth
(Chart 45). By the end of the medium term, growth rates for the states under the central case are projected to
converge close to growth rates under pre-COVID-19 projections. While Victoria is the hardest hit state due to
the pandemic’s effect on net overseas migration and net interstate migration, population growth is projected
to rebound and result in Victoria having the fastest growing population by 2022-23. The Northern Territory is
projected to remain the slowest growing state until 2030-31 with annual growth rising from a low
of -1.4 per cent in 2019-20 to just under 0.7 per cent by the end of the medium term.
-30
-20
-10
0
10
20
30
-30
-20
-10
0
10
20
30
2018-19 2021-22 2024-25 2027-28 2030-31
Qld
Vic.
NSW
SA
Forecasts Projections
'000 '000
-8
-6
-4
-2
0
2
4
-8
-6
-4
-2
0
2
4
2018-19 2021-22 2024-25 2027-28 2030-31
ACT
WA
Tas.
NT
Forecasts Projections
'000 '000
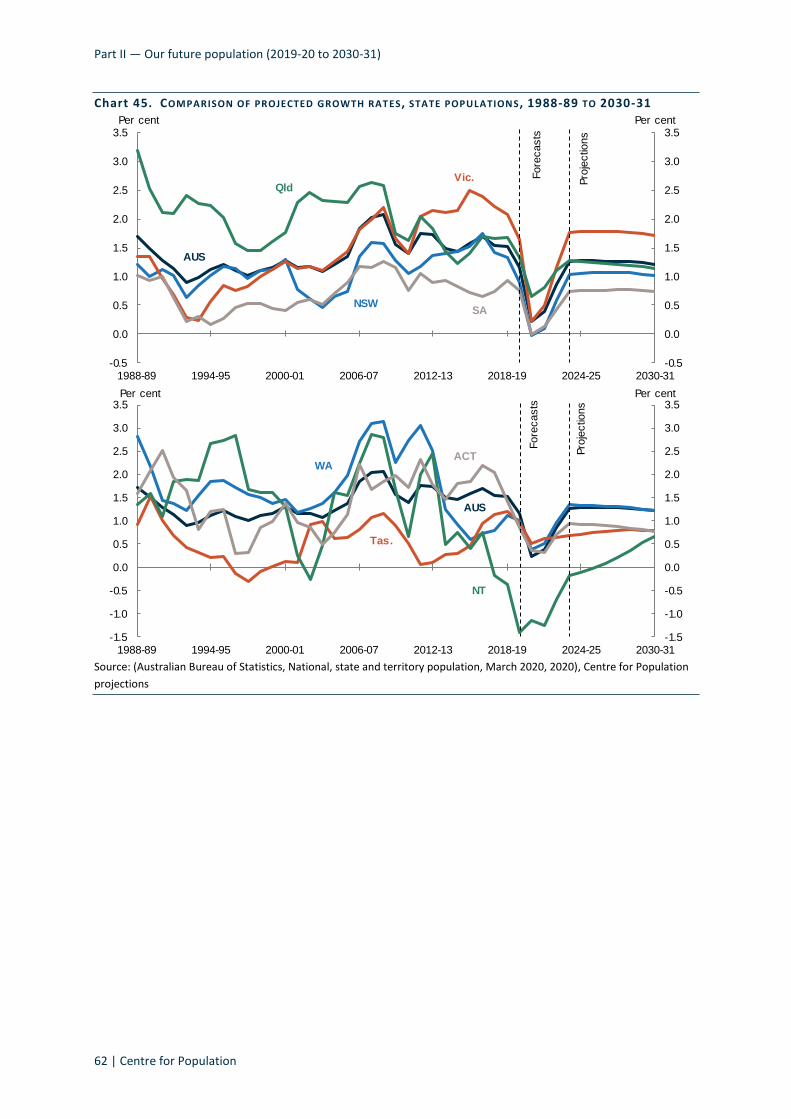
Part II — Our future population (2019-20 to 2030-31)
62 | Centre for Population
Chart 45. COMPARISON OF PROJECTED GROWTH RATES, STATE POPULATIONS, 1988-89 TO 2030-31
Source: (Australian Bureau of Statistics, National, state and territory population, March 2020, 2020), Centre for Population
projections
-0.5
0.0
0.5
1.0
1.5
2.0
2.5
3.0
3.5
-0.5
0.0
0.5
1.0
1.5
2.0
2.5
3.0
3.5
1988-89 1994-95 2000-01 2006-07 2012-13 2018-19 2024-25 2030-31
Per centPer cent
AUS
NSW
Vic.Qld
SA
Fore
casts
Pro
jectio
ns
-1.5
-1.0
-0.5
0.0
0.5
1.0
1.5
2.0
2.5
3.0
3.5
-1.5
-1.0
-0.5
0.0
0.5
1.0
1.5
2.0
2.5
3.0
3.5
1988-89 1994-95 2000-01 2006-07 2012-13 2018-19 2024-25 2030-31
Per centPer cent
AUS
WA
Tas.
NT
ACT
Fore
casts
Pro
jectio
ns

Part II — Our future population (2019-20 to 2030-31)
Centre for Population | 63
New South Wales
Chart 46. FUTURE POPULATION GROWTH AND COMPONENTS , NEW SOUTH WALES , 2018-19 TO 2030-31
Source: (Australian Bureau of Statistics, National, state and territory population, March 2020, 2020), Centre for Population
projections
New South Wales is projected to remain the largest state, growing from 8.1 million in June 2019 to 8.9 million
by June 2031. As the largest state, population growth reflects national trends and is projected to fall from
1.3 per cent in 2018-19 to a low of zero per cent in 2020-21 before recovering to 1.0 per cent by 2023-24 (see
Chart 46). Population growth in the state is projected to hold this growth rate to 2030-31. Overall, the New
South Wales population is estimated to be 4 per cent (377,100 people) smaller by the end of 2030-31
compared to pre-COVID-19 projections.
Over the projection period, 13,500 fewer people are assumed to leave New South Wales through net interstate
migration when compared to the pre-COVID-19 scenario. Net interstate migration for the state is assumed to
experience its smallest net loss in 2020-21 with approximately 14,300 people leaving in net terms, before
returning to the 20-year average of -18,500 from 2023-24 onward. The 20-year average reflects the fact that
New South Wales has consistently had net losses of interstate migrants over the past 20 years.
Consistent with national forecasts, New South Wales is projected to have 2 consecutive years of negative net
overseas migration in 2020-21 and 2021-22. Fewer migrant arrivals, coupled with the departure of onshore
migrants on temporary visas, are expected to result in zero growth for the state in 2020-21. A return to positive
net overseas migration after international borders reopen is forecast, expected to be driven by a recovery in
arrivals from students and people on temporary visas. From 2023-24, net overseas migration in New South
Wales is expected to approach pre-COVID-19 trends.
-0.5
0.0
0.5
1.0
1.5
2.0
-0.5
0.0
0.5
1.0
1.5
2.0
2018-19 2019-20 2020-21 2021-22 2022-23 2023-24 2024-25 2025-26 2026-27 2027-28 2028-29 2029-30 2030-31
Per centPer cent
Natural increase
Net overseas migration
Net interstate migration
Population growth
Population growth(Pre-COVID-19)
Forecasts Projections

Part II — Our future population (2019-20 to 2030-31)
64 | Centre for Population
Victoria
Chart 47. FUTURE POPULATION GROWTH AND COMPONENTS , V ICTORIA , 2018-19 TO 2030-31
Source: (Australian Bureau of Statistics, National, state and territory population, March 2020, 2020), Centre for Population
projections
Victoria’s population is projected to increase from 6.6 million at 30 June 2019 to reach 7.9 million by
30 June 2031. Population growth in Victoria is projected to decline from 2.1 per cent in 2018-19 to 0.2 per cent
in 2020-21 (see Chart 47). As travel restrictions ease and the economy recovers, Victoria’s population growth is
projected to recover to 0.5 per cent in 2021-22 and then to 1.8 per cent in 2023-24. The state’s population
growth rate in a pre-COVID-19 scenario is projected to have been around 2 per cent until 2023-24 before
gradually declining. As a result, Victoria’s population is expected to be 5.0 per cent (411,700 people) smaller by
30 June 2031, compared to pre-COVID-19 projections.
Over the projection period, Victoria is assumed to gain 23,600 fewer people through net interstate migration
when compared to the pre-COVID-19 scenario. Travel and activity restrictions in the state are assumed to
further reduce net interstate migration in the short term such that in 2020-21 and 2021-22, net interstate
migration is projected to be negative for the first time since 2007-08. A return to the 20-year average (a gain of
5,000 people each year) is assumed from 2023-24. It is smaller than net interstate migration in recent years
because the 20-year average includes the net losses of migrants from Victoria in the 1990s.
More overseas migrants are forecast to leave Victoria than arrive in 2020-21 and 2021-22, resulting in negative
net overseas migration. The departure of international students and temporary migrants is projected to
dampen population growth in the state. However, the trend is forecast to reverse from 2022-23, with a sharp
increase in net overseas migration driven by students and permanent migrants forecast to lift Victoria’s
population growth significantly. Population growth in Victoria is, thus, projected to recover to what it is
expected to have been without the pandemic, faster than other states and territories.
-0.5
0.0
0.5
1.0
1.5
2.0
2.5
-0.5
0.0
0.5
1.0
1.5
2.0
2.5
2018-19 2019-20 2020-21 2021-22 2022-23 2023-24 2024-25 2025-26 2026-27 2027-28 2028-29 2029-30 2030-31
Per centPer cent
Natural increase
Net overseas migration
Net interstate migration
Population growth
Population growth(Pre-COVID-19)
Forecasts Projections
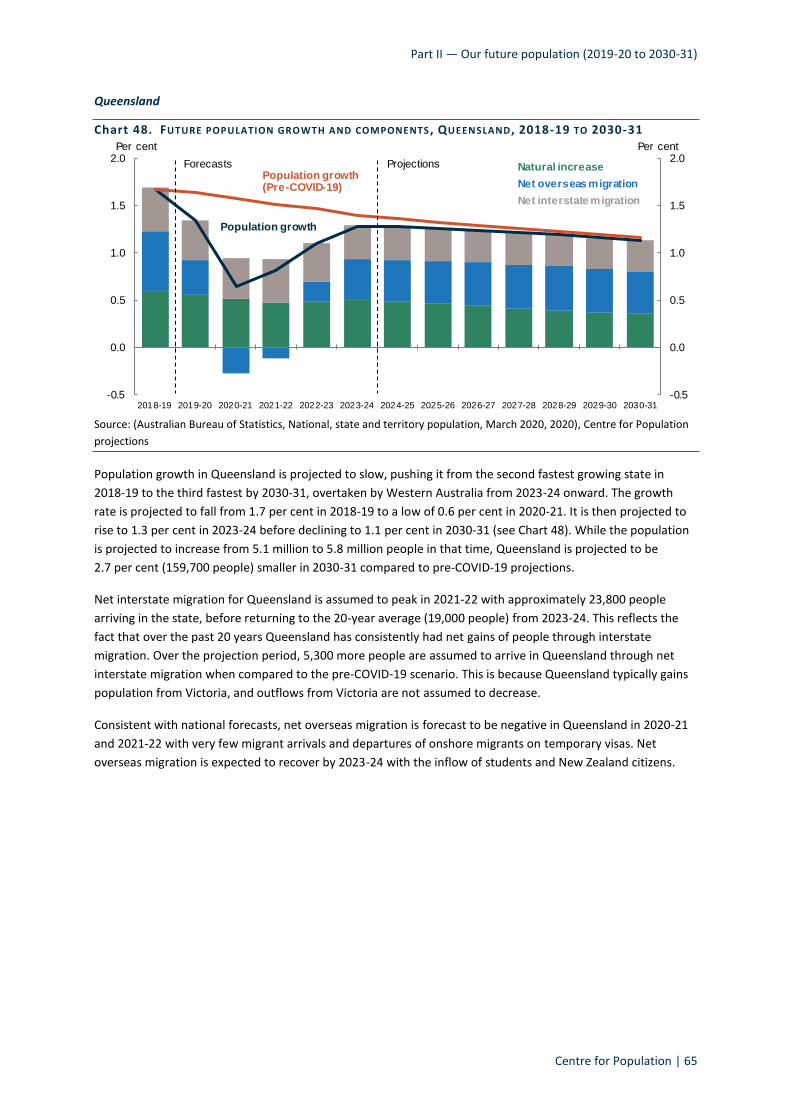
Part II — Our future population (2019-20 to 2030-31)
Centre for Population | 65
Queensland
Chart 48. FUTURE POPULATION GROWTH AND COMPONENTS , QUEENSLAND , 2018-19 TO 2030-31
Source: (Australian Bureau of Statistics, National, state and territory population, March 2020, 2020), Centre for Population
projections
Population growth in Queensland is projected to slow, pushing it from the second fastest growing state in
2018-19 to the third fastest by 2030-31, overtaken by Western Australia from 2023-24 onward. The growth
rate is projected to fall from 1.7 per cent in 2018-19 to a low of 0.6 per cent in 2020-21. It is then projected to
rise to 1.3 per cent in 2023-24 before declining to 1.1 per cent in 2030-31 (see Chart 48). While the population
is projected to increase from 5.1 million to 5.8 million people in that time, Queensland is projected to be
2.7 per cent (159,700 people) smaller in 2030-31 compared to pre-COVID-19 projections.
Net interstate migration for Queensland is assumed to peak in 2021-22 with approximately 23,800 people
arriving in the state, before returning to the 20-year average (19,000 people) from 2023-24. This reflects the
fact that over the past 20 years Queensland has consistently had net gains of people through interstate
migration. Over the projection period, 5,300 more people are assumed to arrive in Queensland through net
interstate migration when compared to the pre-COVID-19 scenario. This is because Queensland typically gains
population from Victoria, and outflows from Victoria are not assumed to decrease.
Consistent with national forecasts, net overseas migration is forecast to be negative in Queensland in 2020-21
and 2021-22 with very few migrant arrivals and departures of onshore migrants on temporary visas. Net
overseas migration is expected to recover by 2023-24 with the inflow of students and New Zealand citizens.
-0.5
0.0
0.5
1.0
1.5
2.0
-0.5
0.0
0.5
1.0
1.5
2.0
2018-19 2019-20 2020-21 2021-22 2022-23 2023-24 2024-25 2025-26 2026-27 2027-28 2028-29 2029-30 2030-31
Per centPer cent
Natural increase
Net overseas migration
Net interstate migration
Population growth
Population growth(Pre-COVID-19)
Forecasts Projections

Part II — Our future population (2019-20 to 2030-31)
66 | Centre for Population
South Australia
Chart 49. FUTURE POPULATION GROWTH AND COMPONENTS , SOUTH AUSTRALIA , 2018-19 TO 2030-31
Source: (Australian Bureau of Statistics, National, state and territory population, March 2020, 2020), Centre for Population
projections
In addition to being one of the smaller states, South Australia has one of the lower projected growth rates,
growing from 1.8 million as at 30 June 2019 to reach 1.9 million by 30 June 2031. Under the central case, South
Australia’s population growth is not projected to reach 1.0 per cent in the projection period, instead falling to
zero per cent in 2020-21, then recovering from 2021-22 onwards to reach 0.7 per cent by 2030-31 (see Chart
49). It is estimated that South Australia’s population growth rate would have reached 1.0 per cent for the first
time since 2011-12 in the absence of COVID-19. South Australia’s population is projected to be 3 per cent, or
58,500 people, smaller by 30 June 2031 compared to pre-COVID-19 projections.
South Australia is assumed to experience a net interstate loss of people in 2020-21 with approximately
2,200 people leaving the state. Net interstate migration then returns to the 20-year average of a net outflow of
3,600 from 2023-24. This 20-year average reflects that South Australia has had consistent net losses of people
through interstate migration over the past 20 years. Over the projection period, 3,900 fewer people are
assumed to leave South Australia through net interstate migration when compared to the pre-COVID-19
scenario.
Net overseas migration is forecast to be negative in South Australia only in 2020-21. The composition of South
Australia’s migrant flows is more diversified than that of the larger states — albeit with less gains due to
smaller international student demand. Consequently, South Australia is not expected to experience as deep or
as prolonged a period of negative net overseas migration compared to other states. The state is projected to
recover quickly as international borders reopen and temporary and permanent migrants begin arriving from
2021-22.
-0.5
0.0
0.5
1.0
1.5
-0.5
0.0
0.5
1.0
1.5
2018-19 2019-20 2020-21 2021-22 2022-23 2023-24 2024-25 2025-26 2026-27 2027-28 2028-29 2029-30 2030-31
Per centPer cent
Natural increase
Net overseas migration
Net interstate migration
Population growth
Population growth(Pre-COVID-19)
Forecasts Projections

Part II — Our future population (2019-20 to 2030-31)
Centre for Population | 67
Western Australia
Chart 50. FUTURE POPULATION GROWTH AND COMPONENTS , WESTERN AUSTRALIA , 2018-19 TO 2030-31
Source: (Australian Bureau of Statistics, National, state and territory population, March 2020, 2020), Centre for Population
projections
Western Australia’s population growth is strongly influenced by net overseas migration and is projected to fall
from 1.1 per cent in 2018-19 to a low of 0.4 per cent in 2020-21. It is then projected to rise to 1.3 per cent by
2023-24, before declining to 1.2 per cent by 2030-31 (see Chart 50). While the population is projected to grow
from 2.6 million in 2019 to 3.0 million over the projection period, it is estimated to be 3 per cent
(93,700 people) smaller by 30 June 2031 compared to pre-COVID-19 projections.
Net interstate migration in Western Australia has historically tracked alongside economic cycles. Consistent
with the long-run assumption applied across all states, future net interstate migration is assumed to return to
the 20-year average of losing 530 people a year from 2023-24 onward. The 20-year average takes into account
the variation in Western Australia’s interstate migration over the past 20 years, which has aligned with
economic performance and opportunities in the past. Over the projection period, 2,200 more people are
assumed to leave Western Australia through net interstate migration when compared to the pre-COVID-19
scenario.
Population growth after 2023-24 is mostly driven by natural increase and net overseas migration. Western
Australia is expected to recover quickly from one year of negative net overseas migration in 2020-21. This is
driven by strong expected growth in the number of temporary and skilled migrants arriving into the state. Like
South Australia, Western Australia is not expected to experience as sharp a drop in net overseas migration as
some states, primarily due to the smaller contribution of international students to migration flows in the state.
-0.5
0.0
0.5
1.0
1.5
2.0
-0.5
0.0
0.5
1.0
1.5
2.0
2018-19 2019-20 2020-21 2021-22 2022-23 2023-24 2024-25 2025-26 2026-27 2027-28 2028-29 2029-30 2030-31
Per centPer cent
Natural increase
Net overseas migration
Net interstate migration
Population growth
Population growth(Pre-COVID-19)
Forecasts Projections

Part II — Our future population (2019-20 to 2030-31)
68 | Centre for Population
Tasmania
Chart 51. FUTURE POPULATION GROWTH AND COMPONENTS , TASMANIA , 2018-19 TO 2030-31
Source: (Australian Bureau of Statistics, National, state and territory population, March 2020, 2020), Centre for Population
projections
While Tasmania’s population is projected to grow from 534,600 at 30 June 2019 to 583,400 by 30 June 2031, it
is estimated to be 2 per cent (13,600 people) smaller by 30 June 2031 compared to pre-COVID-19 projections.
Growth is projected to fall to 0.5 per cent in 2020-21, and then gradually recover to, and then remain at,
0.8 per cent by 2026-27 (see Chart 51).
In recent years, Tasmania has gained people through net interstate migration. Net interstate migration in the
state is assumed to peak in 2021-22 at approximately 2,300 people before returning to the 20-year average of
around zero people from 2023-24 onward. The long-run net interstate migration assumption is not based on
expectations of Tasmania’s future relative economic performance, but on the 20-year average flow of net
interstate migration, consistent with assumptions for other states. Tasmania’s interstate migration patterns
have varied between net inflow and net outflow over the last 20 years, which is why the assumed level of net
interstate migration is smaller than has been seen in recent years. Over the projection period, Tasmania is
assumed to gain 3,500 more people through net interstate migration than in the pre-COVID-19 scenario. This is
because Tasmania typically gains population from Victoria, and outflows from Victoria are not assumed to
decrease.
Tasmania’s total fertility rate is projected to fall to 1.65 babies per woman by 2030-31. Declining fertility rates
in the state are projected to result in deaths surpassing births in 2030-31, leading natural increase to detract
from the state’s population growth. Natural increase in the rest of Tasmania is projected to be negative from
2020-21 onwards and eventually counter the positive natural increase projected for Hobart.
Net overseas migration is projected to be the primary driver of population growth in Tasmania from 2022-23.
Unlike the rest of Australia, the state is not expected to experience negative net overseas migration as a result
of the pandemic. This is because the Tasmania has a more diverse flow of migrants and the contribution from
temporary migrants overall is relatively smaller when compared to other states. Net overseas migration is
expected to recover from a low of close to zero in 2020-21 to 3,100 in 2023-24, driven by the return of
Australian citizens and temporary migrants.
-0.5
0.0
0.5
1.0
1.5
-0.5
0.0
0.5
1.0
1.5
2018-19 2019-20 2020-21 2021-22 2022-23 2023-24 2024-25 2025-26 2026-27 2027-28 2028-29 2029-30 2030-31
Per centPer cent
Natural increase
Net overseas migration
Net interstate migration
Population growth
Population growth(Pre-COVID-19)
Forecasts Projections

Part II — Our future population (2019-20 to 2030-31)
Centre for Population | 69
Northern Territory
Chart 52. FUTURE POPULATION GROWTH AN D COMPONENTS , NORTHERN TERRITORY , 2018-19 TO 2030-31
Source: (Australian Bureau of Statistics, National, state and territory population, March 2020, 2020), Centre for Population
projections
Population growth in the Northern Territory is projected to fall from -0.4 per cent in 2018-19 to a low
of -1.4 per cent in 2019-20 before gradually increasing to 0.7 per cent in 2030-31 (see Chart 52). The Territory’s
population is projected to fall from 246,100 as at 30 June 2019 to 238,900 by 30 June 2031, and to be
4 per cent (8,800 people) smaller by 30 June 2031 compared to pre-COVID-19 projections. Even in the absence
of COVID-19, the state’s population is estimated to hold roughly stable, growing to reach 247,600 by
30 June 2031, or around 1,500 people higher than at the beginning of the projection period.
The Territory has the smallest population of all the states, with the largest share of Aboriginal and Torres Strait
Island residents who disproportionately live in remote locations. These 2 factors combined mean that
projecting the Territory’s future population and its components of change are inherently more challenging
(Table 7 in Part III shows that there is a much greater likelihood that actual outcomes are significantly different
from forecasts, even when they are prepared using best practice principles).
Net interstate migration to the Northern Territory has fluctuated in line with the mining and construction cycle,
and is expected to do so in future. However, the Territory has generally had a net outflow of interstate
movements, including in the most recent years. This loss is assumed to continue and to be 3,300 people in
2021-22 before returning to the 20-year average consistent with the assumptions for all other states.
The long-run net interstate migration assumption means a net outflow of 1,400 people from the Territory from
2023-24 onwards. The projected result is driven from 2018-19, the financial year where the Territory had its
lowest net interstate migration. Over the projection period, a total of 1,400 more people are assumed to leave
the Northern Territory through net interstate migration when compared to the pre-COVID-19 scenario.
The departure of working holiday makers and temporary skilled migrants, combined with lower migrant
arrivals, is expected to result in a prolonged period of negative net overseas migration in the
Northern Territory. Migrant arrivals are projected to recover from 800 in 2020-21 to 3,800 in 2023-24, but
migrant departures are expected to increase from 2,700 in 2020-21 to 4,800 in 2023-24.
-2.5
-2.0
-1.5
-1.0
-0.5
0.0
0.5
1.0
1.5
2.0
-2.5
-2.0
-1.5
-1.0
-0.5
0.0
0.5
1.0
1.5
2.0
2018-19 2019-20 2020-21 2021-22 2022-23 2023-24 2024-25 2025-26 2026-27 2027-28 2028-29 2029-30 2030-31
Per centPer cent
Natural increase
Net overseas migration
Net interstate migration
Population growth
Population growth(Pre-COVID-19)
Forecasts Projections

Part II — Our future population (2019-20 to 2030-31)
70 | Centre for Population
Australian Capital Territory
Chart 53. FUTURE POPULATION GROWTH AND COMPONENTS , AUSTRALIAN CAPITAL TERRITORY , 2018-19 TO
2030-31
Source: (Australian Bureau of Statistics, National, state and territory population, March 2020, 2020), Centre for Population
projections
The Australian Capital Territory’s population growth is projected to fall from 1.4 per cent in 2018-19 to a low of
0.3 per cent in 2021-22 before recovering to around 0.9 per cent growth in 2023-24 (see Chart 53). While the
Territory’s population is projected to grow from 426,300 at 30 June 2019 to 466,900 by 30 June 2031, it is
estimated to be 3 per cent (13,600 people) smaller by 30 June 2031 compared to pre-COVID-19 projections.
Net interstate migration to the Australia Capital Territory has fluctuated throughout history, with the Territory
recording a loss in people in 2018-19 following 3 years of gains (where, similar to the Northern Territory, small
changes can heavily influence projection assumptions). A peak gain of approximately 370 people is assumed in
2021-22 before the Territory returns to the 20-year average of 155 people in 2023-24. This takes into account
that the interstate migration for the Australian Capital Territory has varied over the past 20 years and does not
just reflect the net losses of people through interstate migration that has been seen in recent years. Over the
projection period, the Australian Capital Territory is assumed to gain 870 more people through net interstate
migration when compared to the pre-COVID-19 scenario.
The effects of negative net overseas migration are expected to detract more from the Australian Capital
Territory’s population growth in 2021-22 compared to 2020-21. Net overseas migration in the Territory has
historically been fuelled by strong growth in the higher education sector. A halt in migrant arrivals and a
pronounced increase in departures by students is expected to lead to negative net overseas migration in
2020-21 and 2021-22. Given the reliance on international students, net overseas migration in the Territory is
not expected to recover to pre-COVID-19 levels by 2030-31, as the international student flows to Australia are
assumed not to have fully recovered by then (see Part III).
-0.5
0.0
0.5
1.0
1.5
-0.5
0.0
0.5
1.0
1.5
2018-19 2019-20 2020-21 2021-22 2022-23 2023-24 2024-25 2025-26 2026-27 2027-28 2028-29 2029-30 2030-31
Per centPer cent
Natural increase
Net overseas migration
Net interstate migration
Population growth
Population growth(Pre-COVID-19)
Forecasts Projections

Part II — Our future population (2019-20 to 2030-31)
Centre for Population | 71
2.4 CAPITAL CITY AND REST -OF-STATE POPULATIONS
Over two-thirds of Australian residents live in capital cities and capital cities receive the vast majority of net
overseas migration. As a result, the effects of the COVID-19 pandemic are estimated to be more pronounced in
capital cities than in the rest-of-state areas of Australia. Capital cities are also projected to recover to a higher
growth rate than rest-of-state areas, driven primarily by the forecast recovery in net overseas migration (see
Chart 54, Chart 55, Chart 56 and Box 8).
Chart 54. POPULATION GROWTH IN CAPITAL CITIES AND R EST-OF-STATES , SCENARIOS , 2018-19 TO 2030-31
Source: (Australian Bureau of Statistics, Regional population, 2018-19, 2020), Centre for Population projections produced by
Dr Tom Wilson
Melbourne and Sydney are projected to experience the largest population decrease as a result of the pandemic
with an estimated 390,000 and 340,000 fewer people respectively by 30 June 2031 compared to pre-COVID-19
projections. Despite the immediate impacts of COVID-19, Melbourne is projected to overtake Sydney to
become the largest city in 2026-27, with a population of 6.2 million by 30 June 2031 compared to Sydney’s
6.0 million (see Chart 55). Within the forecast period, Sydney’s population is projected to fall by 0.2 per cent in
2020-21, followed by no growth in 2021-22, whereas Melbourne’s population continues to grow, albeit at a
slower rate than in the absence of COVID-19.
Over the medium term, Melbourne is projected to grow at around 2.0 per cent a year on average from 2023-24
to 2030-31, compared to around 1.3 per cent a year on average for Sydney over the same period. Both cities
are projected to continue to have net outflows of interstate migration, but Melbourne’s is projected to be
smaller than Sydney’s (a net outflow of around 1,500 from Melbourne from 2023-24 onward, compared to a
net outflow of 23,000 from Sydney). Further, Melbourne’s future net overseas migration is projected to be
around 140,000 higher than Sydney’s over the same period. Reflecting trends that have been underway for
several years, Victoria’s share of Australia’s net overseas migration is projected to increase (to 38 per cent by
2030-31), while New South Wales’ share is projected to fall (to 31 per cent by 2030-31). The growing share of
net overseas migration also contributes to Melbourne’s faster population growth through higher births.
0.0
0.5
1.0
1.5
2.0
0.0
0.5
1.0
1.5
2.0
2018-19 2021-22 2024-25 2027-28 2030-31
Per centPer cent
Central
Pre-COVID-19
Capital cities
Forecasts Projections
0.0
0.5
1.0
1.5
2.0
0.0
0.5
1.0
1.5
2.0
2018-19 2021-22 2024-25 2027-28 2030-31
Per centPer cent
Central
Pre-COVID-19
Rest-of-state
Forecasts Projections

Part II — Our future population (2019-20 to 2030-31)
72 | Centre for Population
BOX 8. MIGRATION BETWEEN CAPITAL CITIES AND REGIONAL AREAS
Regional rest-of-state areas have historically grown at slower rates than capital cities. A large part of this
difference has been driven by the settlement patterns of overseas migrants, with 84 per cent of net overseas
migrants going to capital cities in the year to June 2019 (Australian Bureau of Statistics, Regional population,
2018-19, 2020). In the past, internal migration patterns have also seen a movement of people away from
inland regional areas to coastal areas and capital cities (Bureau of Infrastructure, Transport and Regional
Economics, 2014).
The Government has implemented a number of policies to grow regional towns and economies, and
encourage people to live in regional areas. Prior to the COVID-19 pandemic the Government’s Planning for
Australia’s future population outlined a number of policy initiatives targeted towards supporting growth in
regional areas. This included:
• introducing 2 new regional visas and increasing the number of regional visas to 25,000 places
• expanding the use of Designated Area Migration Agreements, to allow employers in designated regions
to sponsor skilled workers for occupations not available under standard visa arrangements
• allowing international students studying at regional universities to access an additional year in Australia
on a post-study work visa, and establishing the $94 million Destination Australia scholarship program
• announcing a faster rail plan that will enable people to live in regional centres while being able to easily
commute daily to larger employment markets
• investing around $100 billion in road, rail and air infrastructure across the country over the decade
including investing in congestion-busting infrastructure through the $4 billion Urban Congestion Fund
• engaging with state and territory governments through Regional Deals.
It is expected that COVID-19 will temporarily affect the historical settlement patterns of overseas migration
and internal migration. With net overseas migration effectively on hold in the short term, changes in the
population distribution will be driven mainly by internal migration.
It is projected that in each state there will be a short-term shift of internal migration away from capital cities
toward regional areas due to the pandemic. Recent early insights from the provisional Regional Internal
Migration estimates released by the Australian Bureau of Statistics in November 2020 show the early
impacts of COVID-19 on migration between capital cities and regions. They show that capital cities had a net
loss of 10,500 people to regional areas in the quarter to June 2020, the largest net quarterly move to the
regions on record. This is more than double the average observed over the last 10 years. Over the year to
June 2020, regions outside the capital cities had a net gain of 30,100 people, compared with 23,800 in the
year to June 2019. This was almost 60 per cent higher than the average over the 10 prior years.
The projections also show that capital cities will recover to higher growth rates than rest-of-state areas in
the future (see Chart 57 and Chart 58). These projections are conservative as they are based on historical
patterns of net overseas migration and internal migration. There has been much anecdotal discussion in the
public domain that COVID-19 may disrupt these traditional patterns, with many workplaces offering greater
flexibility to work remotely, creating opportunities for people in cities to move to regional areas.
The Government is providing support to the regions and industries most affected by the impacts of the
pandemic, including a $1 billion COVID-19 Relief and Recovery Fund announced in March 2020.

Part II — Our future population (2019-20 to 2030-31)
Centre for Population | 73
In addition, the Government has announced a package of measures to the value of over $550 million over
4 years from 2020-21 to support regional Australia to recover from the impacts of COVID-19 and recent
natural disasters, build resilience to future economic shocks and support long-term economic growth. This
will be followed by $16.6 million in 2024-25, and $16.1 million per year ongoing.
The effect of COVID-19 on settlement patterns will remain a close watch-point over the coming months to
determine whether the pandemic has disrupted historical patterns.
Chart 55. TOTAL POPULATION , CAPITAL CITIES , CENTRAL CASE , 2018-19 TO 2030-31
Source: (Australian Bureau of Statistics, Regional population, 2018-19, 2020), Centre for Population projections produced by
Dr Tom Wilson
Chart 56. TOTAL POPULATION , REST-OF-STATES , CENTRAL CASE , 2018-19 TO 2030-31
Source: (Australian Bureau of Statistics, Regional population, 2018-19, 2020), Centre for Population projections produced by
Dr Tom Wilson
0
1
2
3
4
5
6
7
0
1
2
3
4
5
6
7
2018-19 2021-22 2024-25 2027-28 2030-31
MillionMillion
Sydney
Melbourne
Brisbane
Adelaide
Forecasts Projections
500
1,000
1,500
2,000
2,500
500
1,000
1,500
2,000
2,500
2018-19 2021-22 2024-25 2027-28 2030-31
Hobart Darwin
ACT
Forecasts Projections
Perth
'000 '000
0
1
2
3
4
0
1
2
3
4
2018-19 2021-22 2024-25 2027-28 2030-31
MillionMillion
Rest of NSW
Rest of Vic.
Rest of Qld
Rest of SA
Forecasts Projections
0
100
200
300
400
500
600
0
100
200
300
400
500
600
2018-19 2021-22 2024-25 2027-28 2030-31
Rest of Tas.
Rest of NT
Forecasts Projections
Rest of WA
'000 '000

Part II — Our future population (2019-20 to 2030-31)
74 | Centre for Population
Sydney’s population is projected to decline by 0.2 per cent in 2020-21 as a result of the pandemic, returning to
positive growth of 0.6 per cent in 2022-23. Despite an intense short-term shock, growth rates in Melbourne are
projected to recover by 2023-24 and be the highest of all capital cities over the rest of the projection period
(see Chart 57).
Chart 57. RATES OF POPULATION GROWTH, CAPITAL CITIES , CENTRAL CASE , 2018-19 TO 2030-31
Source: (Australian Bureau of Statistics, Regional population, 2018-19, 2020), Centre for Population projections produced by
Dr Tom Wilson
Chart 58. RATES OF POPULATION GROWTH, REST-OF-STATES , CENTRAL CASE , 2018-19 TO 2030-31
Source: (Australian Bureau of Statistics, Regional population, 2018-19, 2020), Centre for Population projections produced by
Dr Tom Wilson
The capital city population of each state is projected to hold the majority of each of that state’s population by
30 June 2031, with the exception of Hobart, which is nevertheless projected to contain around 47 per cent of
Tasmania’s population. This is based on the assumption that the capital cities will continue to grow faster than
the rest-of-state areas, although it remains to be seen whether COVID-19 will significantly alter this pattern.
Over the projection period, Perth and Hobart are estimated to experience the largest increases to their share of
-2.0
-1.5
-1.0
-0.5
0.0
0.5
1.0
1.5
2.0
2.5
-2.0
-1.5
-1.0
-0.5
0.0
0.5
1.0
1.5
2.0
2.5
2018-19 2021-22 2024-25 2027-28 2030-31
Sydney
MelbourneBrisbane
Adelaide
Forecasts Projections
Per cent Per cent
-2.0
-1.5
-1.0
-0.5
0.0
0.5
1.0
1.5
2.0
2.5
-2.0
-1.5
-1.0
-0.5
0.0
0.5
1.0
1.5
2.0
2.5
2018-19 2021-22 2024-25 2027-28 2030-31
Perth
Hobart
Darwin
ACT
Forecasts Projections
Per cent Per cent
-1.0
-0.5
0.0
0.5
1.0
1.5
-1.0
-0.5
0.0
0.5
1.0
1.5
2018-19 2021-22 2024-25 2027-28 2030-31
Rest of NSW
Rest of Vic.
Rest of Qld
Rest of SA
Forecasts Projections
Per cent Per cent
-1.0
-0.5
0.0
0.5
1.0
1.5
-1.0
-0.5
0.0
0.5
1.0
1.5
2018-19 2021-22 2024-25 2027-28 2030-31
Rest of WA
Rest of Tas.
Rest of NT
Forecasts Projections
Per cent Per cent

Part II — Our future population (2019-20 to 2030-31)
Centre for Population | 75
state population, increasing by around 2 percentage points each. The smallest projected increase over this
period is for Darwin, where the share is projected to drop slightly during the start of the projection period, but
then increase between 2023-24 and 2030-31 to return to the 2018-19 share by the end of the projection
period.
Natural increase
The contribution of natural increase to population growth is projected to be larger in the capital cities
compared to rest-of-state areas, even though fertility rates are lower in capital cities. This is because
populations in the rest-of-state areas are currently older than, and projected to age faster than, capital cities.
The populations in the rest-of-state areas of South Australia and in Tasmania are projected to experience
negative natural increase in the first few years of the projection period. Negative natural increase is also
projected to occur in the rest-of-state areas of New South Wales by 2029-30.
Over the projection period, fertility rates are assumed to remain lower in all of the capital cities compared with
rest-of-state areas. Life expectancies at birth are generally projected to remain higher for individuals living in
capital cities across the projection period. The gap between life expectancies between capital cities and
rest-of-states is projected to be largest in the Northern Territory and smallest in Queensland and Tasmania. In
Queensland, Gold Coast and Sunshine Coast are classified as outside of the capital city, yet are more similar to
Brisbane than the rest of Queensland. Given the large population size of these areas, they are likely to
influence comparisons between Brisbane and the rest of Queensland.
Net overseas migration
As around 4 out of every 5 migrants settle in Australia’s largest cities, the forecast outflow of migrants from
Australia is expected to affect the major cities most. The greatest change within capital cities is expected in the
inner city and on the urban fringes as this is where migrants tend to settle. The CBD and large universities
attract skilled workers and students to the inner city while the availability of housing in new suburbs on the
urban fringe attracts migrant families.
While net overseas migration is a smaller component of population growth in the rest-of-state areas,
international border restrictions are expected to manifest in a smaller number of temporary migrants arriving
into these areas, such as skilled workers and students in regional universities. Migration supports labour needs
in regional areas, particularly in seasonal industries. Businesses in regional areas struggle to fill local jobs as
working-age Australians move into urban areas for study and work.
Net internal migration
Future internal migration within states at the capital city and rest-of-state area level is assumed to align with
assumed future interstate migration trends (see Chart 59 and Chart 60). Within each state, the COVID-19
pandemic is assumed to shift migration away from the capital cities in the short term. This change in pattern is
linked to economic differences between capital cities and rest-of-state areas such as unemployment and house
prices. Increased prevalence of teleworking may also contribute to migration toward rest-of-state areas
(University of Queensland, unpublished).
Victoria, and Melbourne in particular, is assumed to see a greater decline in internal migration compared to
other states due to the pandemic. The short-term effects in Melbourne are significant, with Melbourne
assumed to lose approximately 12,000 people in 2020-21 and in 2021-22. Over the projection period,
Melbourne is assumed to lose 31,000 more people than under the pre-COVID-19 scenario.
Compared to the pre-COVID-19 scenario, Sydney, Adelaide, and rest-of-state areas in South Australia, Tasmania
and the Northern Territory are assumed to lose fewer people through net internal migration over the
projection period. Brisbane, Perth, Hobart, the Australian Capital Territory, and the rest-of-state areas in New

Part II — Our future population (2019-20 to 2030-31)
76 | Centre for Population
South Wales and Victoria are assumed to gain more people. The rest of Queensland is assumed to gain fewer
people. Melbourne, Darwin and the rest of Western Australia are assumed to lose more people through net
internal migration over the projection period.
As the economy recovers, internal migration is assumed to return to the 10-year average for each capital city
and rest-of-state area. This maintains Sydney as the capital city with the lowest level of net internal migration
(-23,000 people per year) and the rest-of-state in Queensland with the highest level of net internal migration
(10,800 people per year). Strong net internal migration in the rest-of-state in Queensland has been driven by
high growth in coastal areas such as the Gold Coast and the Sunshine Coast.
Chart 59. NET INTERNAL MIGRATION, CENTRAL CASE , CAPITAL CITIES , 2018-19 TO 2030-31
Source: (Australian Bureau of Statistics, Regional population, 2018-19, 2020), Centre for Population projections produced by
Dr Tom Wilson
Chart 60. NET INTERNAL MIGRATION, CENTRAL CASE , REST-OF-STATES, 2018-19 TO 2030-31
Source: (Australian Bureau of Statistics, Regional population, 2018-19, 2020) Centre for Population projections produced by
Dr Tom Wilson
-30
-20
-10
0
10
20
-30
-20
-10
0
10
20
2018-19 2021-22 2024-25 2027-28 2030-31
Sydney
Melbourne
Brisbane
Adelaide
Forecasts Projections
'000 '000
-4
-3
-2
-1
0
1
2
-4
-3
-2
-1
0
1
2
2018-19 2021-22 2024-25 2027-28 2030-31
Perth
Hobart
Darwin
ACT
Forecasts Projections'000 '000
-2
0
2
4
6
8
10
12
-2
0
2
4
6
8
10
12
2018-19 2021-22 2024-25 2027-28 2030-31
Rest of NSW
Rest of Vic.
Rest of Qld
Rest of SA
Forecasts Projections
'000 '000
-6
-5
-4
-3
-2
-1
0
1
2
-6
-5
-4
-3
-2
-1
0
1
2
2018-19 2021-22 2024-25 2027-28 2030-31
Rest of WA
Rest of Tas.
Rest of NT
Forecasts Projections
'000 '000

Part III — Technical appendix
Centre for Population | 77
PART III — TECHNICAL APPENDIX

Part III — Technical appendix
78 | Centre for Population
3. TECHNICAL APPENDIX
The National Population and Planning Framework tasks the Centre for Population to prepare an annual
Population Statement as part of national efforts to increase understanding about populations, population
change and the implications for all levels of government.
The best way for the analysis and estimates in the Population Statement to serve the information needs of
users is when methodology and assumptions are transparent, and when projections are regularly updated,
including by taking account of new data or other information as it becomes available.
Part III details the approach and assumptions used to estimate future population, and the associated
limitations, for the central case and the 2 further scenarios. New information has become available as the
Statement has been prepared, and we have noted where this has been able to be reflected and where it has
not.
3.1 METHODOLOGY
3.1.1 POPULATION PROJECTIONS
The population projections in this Statement are produced at the national, state and territory and capital city
and rest-of-state geographic levels. A top-down approach is used to provide consistency across the projections
at different geographic levels. That is, the capital city and rest-of-state projections are constrained to the state
projections, which are in turn constrained to the national projections.
The national and state and territory (‘state’20) level projections are produced by the Centre for Population. The
capital city and rest-of-state projections are based on the Greater Capital City Statistical Area (GCCSA)
definitions and are produced by Dr Tom Wilson using a specially adapted version of the National, State and
Sub-state Population Projection Program (NASPOPP) which constrains to the Centre for Population’s
projections at the national and state level. The projection frameworks used are bi-regional, meaning they
capture internal movements in and out of each jurisdiction (e.g. NSW to all other jurisdictions; all other
jurisdictions to NSW), but do not include specific origin-destination migration flows.
The projections are produced on a financial year basis. The starting point for projections is the Estimated
Resident Population at 30 June 2019, which provides the most complete detail across the specified geographic
levels. The projections are produced out to 30 June 2031. The first year is 2019-20 and the final year is 2030-31.
The projections are produced using the cohort-component method. That is, age-specific inputs for fertility,
mortality, net overseas and internal migration are applied to a base population to calculate the next year’s
population. This process is repeated until the end of the projection horizon. These projections occur for each
single year (0-100+) of age and sex.
Births are determined by applying age-specific fertility rate assumptions to the female population aged 15-49.
Deaths are determined by applying age and sex-specific mortality rate assumptions to the population at each
single year of age and sex. Below the national level, the total number of births and deaths for states and
sub-states are constrained to the total number of births and deaths at the national level.
Overseas arrivals and departures are forecast independently of the projection model (see section below) and
added to the population as counts of people. The projections assume that the age and sex distribution of
20 Throughout the Statement, references to the ‘states’ or ‘each state’ includes the Northern Territory and the Australian
Capital Territory.

Part III — Technical appendix
Centre for Population | 79
forecast overseas arrivals and departures reflects the 5-year historical average distribution from 2012-13 to
2017-18.
Assumptions about aggregate internal migration are based on advice from the Queensland Centre of
Population Research at University of Queensland. The age and sex of arrivals and departures are determined by
applying age- and sex-specific internal migration rates to the base populations of each location, constraining
the totals to the aggregate internal migration assumptions.
3.1.2 NET OVERSEAS MIGRATION FORECASTS
The net overseas migration forecasting framework disaggregates the hierarchy in the data according to
direction of flow (arrivals or departures), the type of visa and the geographical flows of those visa types.
Forecasts are prepared at all levels of the hierarchy — from the lowest level of disaggregation (such as student
arrivals into New South Wales) to all student arrivals (and all arrivals in a state) to all migrant arrivals.
Exploiting this hierarchical structure allows forecasts across all levels to be ‘optimally combined’ such that
forecasts across the sub-totals and totals match the sum of the components at each level of the hierarchy. At
the same time, the optimal combination of forecasts, defined as the smallest adjustments (in a statistical
sense) to the independent forecasts necessary to ensure they all add up, is also achieved. This provides the
lowest forecast error when compared to other approaches to forecasting hierarchical data (Pangeagiotelis,
2020). In effect, the framework takes account of information regarding flows of components at lower levels,
and also reduces volatility by appropriately incorporating the information and the smoothing effect of
aggregates further up the hierarchy.
Forecasts are prepared for the period 2019-20 to 2023-24. These then transition to a long-run net overseas
migration assumption of 235,000 people by 2028-29, after which net overseas migration remains flat.
The net overseas migration forecasts are produced for a pre-COVID-19 scenario and then adjusted to reflect
judgment of likely flows given information available to date (described in Section 3.2.3 Net Overseas Migration
assumptions).

Part III — Technical appendix
80 | Centre for Population
3.2 ASSUMPTIONS
3.2.1 FERTILITY
Future fertility rates by single year of age of mother used in the national and state population projections are
taken from projections by Professor Peter McDonald (McDonald, 2020) and are summarised in Table 4 (see
also Chart 61).
• The central projections at the national and state level use the ‘likely COVID-19’ fertility projections, while
the pre-COVID-19 scenario uses the ‘no COVID-19’ fertility projections. A full description of the approach
taken and judgments applied at the national and state level is available in A Projection of Australia’s
Future Fertility Rates (2020).
• The central and pre-COVID-19 projections for capital cities and rest-of-state areas assume that the recent
ratio (2013 to 2017) of location-specific fertility rates to the national total fertility rate remains constant
from 30 June 2023 onwards, and are gradually phased toward these ratios from 30 June 2019. The
fertility rates for these areas are also constrained to the state fertility rates.
• The extended restrictions COVID-19 scenario uses the ‘severe COVID-19’ fertility projections from the
paper.
• The approach used to develop capital city and rest-of-state assumptions for the pre-COVID-19 and
extended restrictions scenarios is the same as in the central scenario.
Table 4. FERTILITY ASSUMPTIONS CENTRAL CASE PRE-COVID-19 SCENARIO EXTENDED RESTRICTIONS SCENARIO
The total fertility rate is assumed to
fall from 1.70 babies per woman in
2017-18 to 1.58 in 2021-22 as a
result of uncertainty among young
people that leads to them deferring
when they have children. The total
fertility rate is then assumed to
temporarily rise to 1.69 babies per
woman in 2023-24 as 80 per cent of
delayed births are ‘recuperated’,
and then decline to and settle at
1.62 from 2030-31 onward.
The total fertility rate is assumed to
gradually decline from 1.70 babies
in 2017-18 to 1.62 babies per
woman in 2030-31. The decline is
assumed to occur evenly across the
period.
State relativities to the national
total fertility rate are assumed to
remain constant.
The total fertility rate is
assumed to fall from
1.70 babies per woman in
2017-18 to 1.50 babies per
woman in 2021-22. The total
fertility rate is then assumed to
temporarily rise to 1.70 in
2023-24, before eventually
declining to 1.62 babies per
woman, as per the central
case.

Part III — Technical appendix
Centre for Population | 81
Chart 61. TOTAL FERTILITY RATE — CENTRAL, PRE-COVID-19 AND EXTENDED RESTRICTIONS SCENARIOS
Source: (Australian Bureau of Statistics, National, state and territory population, March 2020, 2020), Centre for Population
assumptions based on advice from Prof. Peter McDonald
3.2.2 MORTALITY
For national mortality, the mortality rates from the Australian Bureau of Statistics’ 2016-18 national life tables
(by single year of age and sex) have been used with allowance for future improvement by applying the
Australian Government Actuary’s (AGA) improvement factors to these mortality rates.
For state mortality, the same approach has been used, but with the Australian Bureau of Statistics 2016-18
state life tables. Projected deaths by state are constrained to projected deaths at the national level.
For GCCSAs, abridged life tables were constructed by Dr Tom Wilson based on Australian Bureau of Statistics
deaths and ERP data from 1988 to 2017. The approach for future mortality rates assumes that the average
differential between life expectancy at birth for the GCCSA and national life expectancy over the period 1988 to
2017 would apply from 30 June 2027 onwards. For the period between 30 June 2019 and 30 June 2027, the
differential is interpolated from recent values to the long-term average.
Future improvements in life expectancy are based on improved age-specific mortality probabilities (or qx
values21). The improvement factors are provided by the Australian Government Actuary and assume the trend
of the past 3 decades for men and women will persist out to 2030-31 (see Chart 62). In estimating the
improvement factors, the Australian Government Actuary applies the following constraints:
• female mortality rates are always lower than those for males (except at very old ages, where they are
presently higher)
• no mortality deterioration is assumed at very old ages (although deterioration has been historically
observed in the available data, applying this constraint ensures a continuation of the historical trend of
improving life expectancies)
• no mortality improvement is assumed for centenarians or supercentenarians (this is based on the very
small sample sizes available to assess historical trends).
21 qx refers to the probability of a person aged exactly x dying before reaching age x + 1
1.4
1.5
1.6
1.7
1.8
1.4
1.5
1.6
1.7
1.8
2018-19 2020-21 2022-23 2024-25 2026-27 2028-29 2030-31
Pre-COVID-19
Central
Extended restrictions
Projections
Babies per w oman Babies per w oman
Forecasts

Part III — Technical appendix
82 | Centre for Population
Chart 62. IMPROVEMENT TO MORTALITY OVER TIME , MALES (LHS) AND FEMALES (RHS)
Source: (Australian Government Actuary, 2019)
The national improvement factors are applied to the state life tables to estimate future mortality probabilities
for states and territories. This means the relative differences in mortality outcomes across states and territories
will remain constant over the period to 2030-31 — in other words no state or territory will experience
convergence to, or divergence from, the national trend.
The same future mortality probabilities are used in all 3 scenarios. Despite the uncertainty around the effects
of the pandemic on mortality in Australia, the early indicators to date suggest these effects have not been large
enough to warrant a change to already uncertain assumptions.
3.2.3 NET OVERSEAS MIGRATION
Over the forecast period (2019-20 to 2023-24), estimates of future net overseas migration are based on the
assumption that international arrivals and departures remain low through to late 2021. Even after international
borders reopen, net overseas migration is not expected to return to levels consistent with pre-COVID-19
patterns inside the forecast period, as it is assumed that:
• economic conditions in source countries of international students leads to reduced demand
• a softer labour market in coming years reduces the demand for skilled migrants
• demand for extended travel, such as working holiday experiences, remains low
• departures by Australian citizens and permanent residents to take up jobs abroad is lower, reflecting the
reduced labour market opportunities in other countries or concerns over health risks.
Given the uncertainty and upheaval associated with COVID-19 and the nature and duration of measures taken
to contain its spread at home and abroad, estimates of future net overseas migration are heavily
assumption-based.
Long-run net overseas migration assumption
The long-run net overseas migration assumption at the national level is 235,000 people per year. This reflects
the contributions of 4 distinct migration groupings that cover all arrivals and departures through time:
-6
-5
-4
-3
-2
-1
0
1
2
-6
-5
-4
-3
-2
-1
0
1
20 10 20 30 40 50 60 70 80 90 100
Annual percentage
change in
qx
Annual percentage
change in
qx
25 year trend
125 year trend
5 year crude rate
Age
-6
-5
-4
-3
-2
-1
0
1
2
-6
-5
-4
-3
-2
-1
0
1
20 10 20 30 40 50 60 70 80 90 100
Annual percentage
change in
qx
Annual percentage
change in
qx
25 year trend
125 year trend
5 year crude rate
Age

Part III — Technical appendix
Centre for Population | 83
• the contribution of the Government’s planning levels of the permanent and humanitarian migration
programs to immigrant arrivals, which accounts for all permanent migrant arrivals — whether they arrive
in Australia as a permanent or as temporary migrant who transitions to a permanent resident
• the flows of arriving and departing temporary migrants who reside in Australia for several years but never
transition to permanent residents
• the flows of departing and returning Australia citizens
• the number of permanent residents who subsequently emigrate.
A diverse set of factors determines how long immigrants and emigrants stay in or out of Australia, including
education and employment opportunities or family connections. Since 2003-04, 7.8 million people have been
counted into or out of the population as immigrants or emigrants. Some 70 per cent have done this only once,
and 27 per cent twice. A relatively small number have done this 3 or more times.
After accounting for the flow of temporary migrants who transition to permanent residents, it is estimated that
there is an average annual net inward flow of temporary migrants of 66,000 people since 2004-05. This
represents students, temporary skilled workers, working holiday makers and New Zealanders who often spend
between 1 and 8 years in Australia (and longer in some cases) before permanently departing Australia.
Australian citizens are usually net emigrants, with an average of around 15,000 more departures than there are
arrivals since 2004-05. It is estimated that some 20,000 permanent residents emigrate each year on average
over the same period.
The permanent and humanitarian components of the long-run net overseas migration assumption are
determined by planning levels set by the Australian Government. Between 2020-21 and 2022-23, the planning
level for the permanent program is 160,000 and from 2023-24 it is 190,000.22 From 2020-21, the humanitarian
program level is set at an ongoing level of 13,750 places.23 Consistent with Government decision-making
processes to date, planning levels and the composition of the future migration program are expected to
continue to be reviewed annually.
The long-run net overseas migration assumption is the summation of those components — the planning levels,
temporary flows, along with Australian and permanent resident emigrants — to be 235,000. With government
planning levels accounting for the largest component to the long-run assumption, it is highly sensitive to any
future decisions by the Australian Government to increase or decrease the planning levels for the migration
program. This use of the program levels in the assumption also incorporates those migrants who first enter
Australia as temporary residents and subsequently transition to permanent residency.
The level of projected long-run arrivals and departures to 2030-31 is determined by adjusting the national
trends from the central case reference case from 2023-24 onwards through a steady growth assumption to
achieve a level of 235,000 net overseas migration by 2028-29.
State arrivals and departures to 2028-29 reflect trends in the historical and forecast data (from differing visa
group compositional effects) that aggregate to a national net overseas migration level of 235,000 by 2028-29.
State net overseas migration shares are held constant to 2030-31.
22 This is consistent with the Government’s decision, announced in Budget 2019-20, to cut the permanent program by
120,000 over 4 years. 23 Announced in Budget 2020-21.

Part III — Technical appendix
84 | Centre for Population
Within states, the contribution to capital city and rest-of-state areas was prepared by using the average share
observed from 2016-17 to 2018-19 (the only data available at the GCCSA level is for this limited period). These
intra-state shares are assumed to be invariant throughout the forecast and projection horizon.
NET OVERSEAS MIGRATION SCENARIOS
Pre-COVID-19 scenario
The pre-COVID-19 scenario uses the forecasting framework described above to produce forecasts commencing
31 December 2018, drawing on unpublished Home Affairs net overseas migration data provided in June 2020.
This is to avoid the revisions to Australian Bureau of Statistics net overseas migration data relating to 2019.
These revisions are increasingly reflecting impacts of COVID-19 on previous preliminary net overseas migration
estimates. In aggregate, the pre-COVID-19 scenario forecasts that net overseas migration will decline slowly to
237,000 by 2023-24, primarily driven by a slow decline in student and temporary skilled migration arrivals. That
decline is extended to the long-run net overseas migration assumption described above. Although aggregate
net overseas migration is relatively stable, forecasts at the state or individual visa level show much larger
variation. Net overseas migration levels under the 3 scenarios are compared in Chart 63.
Central case assumptions
The central case applies assumptions to the pre-COVID-19 scenario case reflecting travel restrictions and
assumed behaviours discussed earlier. Table 3 in Part II reflects these assumptions by migrant type.
Extended restrictions scenario assumptions
Under the extended restrictions scenario, international borders are assumed to remain effectively closed until
the end of 2022. The migration assumptions relative to the pre-COVID-19 scenario for 2020-21 are extended
for an extra year to 2021-22, with recovery beginning in 2022-23. As a result, the proportion of net overseas
migration is expected to converge with the reference case one year delayed, hitting the long-run net overseas
migration assumption by 2029-30. Table 5 reflects these assumptions by migrant type.
Chart 63. NET OVERSEAS MIGRATION — CENTRAL , PRE-COVID-19 AND EXTENDED RESTRICTIONS SCENARIOS
Source: (Australian Bureau of Statistics, National, state and territory population, March 2020, 2020), Centre for Population
forecasts and projections
-100
-50
0
50
100
150
200
250
300
350
-100
-50
0
50
100
150
200
250
300
350
2018-19 2020-21 2022-23 2024-25 2026-27 2028-29 2030-31
'000'000
Pre-COVID-19
Extended restrictionsCentral
Forecasts Projections

Part III — Technical appendix
Centre for Population | 85
Table 5. LEVEL OF OVERSEAS ARRIVALS AND DEPARTURES IN THE EXTENDED RESTRICTIONS SCENARIO
RELATIVE TO PRE-COVID-19 SCENARIO (%)
FINANCIAL YEAR ALL TEMPORARY
ARRIVALS
NZ ARRIVALS PERM. ARRIVALS PERM. DEPARTURES
2020–21 4 25 0 20
2021–22 4 25 0 20
2022–23 20 100 50 50
2023-24 61 100 75 65
2024-25 91 100 100 100
Note: Australian citizen departures are included in permanent departures. Australian citizen arrivals are not included in
permanent arrivals as these are assumed to be the same as in the pre-COVID-19 scenario. Similarly, departures by
temporary migrants are assumed to be the same as in the pre-COVID-19 scenario.
Source: Centre for Population forecasts and projections
3.2.4 NET INTERNAL MIGRATION
Assumptions for internal migration at the state, capital city and rest-of-state levels were developed based on
historical trends, modelling and expert analysis of COVID-19 effects. More detail on the assumptions will be
provided in a Centre for Population research paper prepared by the Queensland Centre for Population
Research at the University of Queensland (University of Queensland, unpublished).
Assumptions were formed for the 3 main dimensions of internal migration:
• Level: how many people move
• Patterns: where people move to and from
• Composition: who is moving (including their basic demographic characteristics such as age).
A summary of the internal migration assumptions is provided in Table 6.
Table 6. SUMMARY OF INTERNAL M IGRATION ASSUMPTIONS FOR CENTRAL CASE DIMENSION 2019-20 2020-21 2021-22 AND BEYOND
Level Decline of 5 per cent from
the previous year
Decline of 15 per cent from
the previous year
Increase of 8 per cent from
the previous year, followed
by a recovery to the
20-year average by
2023-24.
Patterns
Interstate
migration
The direction of net flows
are in line with recent
trends.
All in and out flows to
decline by 15 per cent from
the previous year, except
Victorian migration which
Convergence to baseline
spatial pattern (20-year
average) by 2023-24.

Part III — Technical appendix
86 | Centre for Population
remains unchanged (more
people are leaving Victoria
compared with other
states). Migration out of
Victoria to follow the
average allocation over the
last 20 years.
Interstate
GCCSA
migration
Interstate GCCSA flows follow interstate migration assumptions (see above).
Intrastate
GCCSA
migration
In 2020-21, net intrastate GCCSA flows shift by 5 per cent in favour of rest-of-state areas
except in the Northern Territory where the pattern is held stable. This pattern holds until
flows converge to the 10-year average in 2023-24.
Level
The COVID-19 pandemic and resulting economic recession are expected to reduce the level of internal
migration in the short term. In previous recessions in Australia, the level of internal migration has fallen in
response to national and state-specific economic conditions. The projected fall in interstate migration due to
the virus in 2020-21, at 12 per cent nationally, is the largest year-on-year decrease in around 40 years.
However, previous recessions have shown that interstate migration recovers quickly in line with economic
trends. The level of interstate migration is expected to recover to the long-term average by 2023-24.
This assumption is supported by economic modelling that found that gross domestic product per capita is a
significant factor in explaining the annual net interstate migration rate (University of Queensland,
unpublished). Based on this advice from the University of Queensland, the level of interstate migration is
assumed to follow the same trends as current gross domestic product forecasts produced by the Reserve Bank
of Australia.
Between states and territories, the level of capital city internal migration is assumed to follow the same trend
as for interstate migration. Within states and territories, the effect of the pandemic on the level of capital city
internal migration is assumed to be smaller. This is largely due to the lower impact of state border closures on
intrastate migration (notwithstanding hotspot border closures). The counteracting effects of decreasing
internal migration is due to national and state economic conditions, while the increasing internal migration is
due to differences in economic conditions between capital cities and rest-of-state areas (such as differing
unemployment levels and house prices).
Patterns
Internal migration patterns respond to relative socio-economic conditions across states (University of
Queensland, unpublished). Given the greater effects of the COVID-19 pandemic in Victoria, it is assumed that
interstate migration out of Victoria will increase relative to other states. Within each state, there is assumed to
be a short-term shift in net flows out of capital cities and towards rest-of-state areas, except for the Northern
Territory. There are 3 main reasons for this assumption.
• While intrastate migration is not as affected by states and territory border closures, the predominance
of COVID-19 hotspots in cities and current efforts by governments to coordinate responses in these
hotspots mean that parts of capital cities are more likely to be in lockdown than rest-of-state areas in
the future

Part III — Technical appendix
Centre for Population | 87
• Labour market conditions as measured by the unemployment rate are currently less favourable in the
capital cities in most states (University of Queensland, unpublished)
• The combined effect of young adults returning home and increased teleworking may support migration
out of capital cities to rest-of-state areas (University of Queensland, unpublished).
This shift in patterns is assumed to occur in all states with the exception of the Northern Territory, where
patterns are expected to remain stable due to its unique settlement system and demography.
For the pre-COVID-19 scenario, the level and patterns of internal migration are assumed to converge within
5 years to the 20-year average at state level, and to the 10-year average at the capital city and rest-of-state
level.
Composition
As in most countries, Australia’s internal migration follows a well-established pattern of peaking at young adult
ages and declining thereafter. This pattern has persisted for at least 20 years. There has, however, been a
gradual increase over time in the age at which migration peaks. While it is reasonable to assume that the age
distribution of migrants would increase in future (University of Queensland, unpublished), no such assumption
has been applied to the projections, given that the projection period for the Statement is only for a decade.
Future net internal migration data
The Centre funded the Australian Bureau of Statistics to release quarterly provisional Regional Internal
Migration Estimates for the first time from November 2020. This release and future releases will enable more
timely insights and analysis into the immediate impacts of restrictions and economic uncertainty on people’s
decisions to move between states, and between cities and rest-of-state areas. Although these estimates are
not included in the internal migration assumptions of this paper, they will inform future internal migration
analysis and insights by the Centre.
The first release of the provisional Regional Internal Migration Estimates, published on 2 November 2020,
included data up until the June quarter 2020. The data has shown a drop in overall interstate migration in the
financial year to June 2020 compared to the financial year ending June 2019, and a decrease in the number of
people moving to capital cities from rest-of-state areas. These findings are consistent with assumptions that
the Centre has made about future levels and patterns of internal migration. As the reference period for this
data is up to June 2020, the second wave of COVID-19 cases in Victoria and the hard lockdown in Melbourne
are not covered. The data is provisional and may be updated in future publications by the Australian Bureau of
Statistics.

Part III — Technical appendix
88 | Centre for Population
3.3 L IMITATIONS AND UNCER TAINTY
Population projections are uncertain under normal conditions and are more uncertain during unprecedented
shocks such as COVID-19. There is significant uncertainty about the path of the virus and the nature and timing
of easing containment measures, as well as the behavioural response of individuals. The understanding of the
drivers of demographic components and processes have limitations due to their dependence on human
decisions.
Given such uncertainty, this Statement includes the extended restrictions scenario and pre-COVID-19 scenario
(see Box 6) to demonstrate outcomes under alternative assumptions. A Population Statement will be produced
annually and the projections will be revisited regularly as new information becomes available about how the
pandemic affects Australia’s population.
Population projections depend on the availability and quality of input data, assumptions based on historical
trends and expert judgment, as well as the methodology used to bring these elements together. The
uncertainty of population projections increases as the projection horizon extends and the smaller the size of
the population they cover. For example, smaller geographies are more difficult to project than larger ones, as is
the projection of particular age groups compared to the total population.
The projections in this Statement are based on preliminary June 2019 estimated resident population from the
Australian Bureau of Statistics. These will be revised when more complete information becomes available and
will eventually be rebased following the 2021 Census. The preliminary data depend on more timely
administrative information and predictive modelling techniques to capture expected behaviour. The smaller
the geography the less timely and more uncertain the data is and, for this reason, the 2019 estimated resident
populations at the GCCSA geography used in the projections were reconciled with state estimated resident
populations first.
The projection assumptions depend on historical trends and expert judgments. Given the nature of the
pandemic, historical data and experience useful for developing assumptions is limited, placing a greater
reliance on judgment. The components of change are uncertain and this reflects the uncertain path of the virus
and the nature and timing of easing containment measures, both in terms of the restrictions on the movement
of people (on net internal migration and net overseas migration) and the associated economic impact (on
fertility).
Estimates of future net overseas migration are based on current government policy and assumptions about the
nature and duration of future policies to contain the spread of COVID-19 at home and abroad — which are
highly uncertain. Additionally, while forecasts and projections depend on historical trends and expert judgment
regarding the future, they do not take into account current or planned policy changes (including at a state
government level) which may affect population growth rates, unless they have already demonstrated an effect
in the historical data.
The projections are based on an annual model that does not provide quarterly results nor account for
within-year seasonality. Thus, the projections do not focus on aligning the first year of the projection period
(2019-20) with the incomplete estimated resident population data released for that year (released up to March
2020). The preliminary data are uncertain, as are the projections, and the estimated resident population data
for June 2020 will be released in December making the preliminary outcome for 2019-20 available. As a result,
effort was devoted to developing the 2 alternative scenarios than varying assumptions for 2019-20 to take
account of the three-quarters of estimated resident population data published.
The population projections use a top-down approach which constrains lower level geographies to the national
projections by component of change. This approach effectively adjusts state/territory and capital
city/rest-of-state specific assumptions but it prioritises more robust national level trends over trends at the

Part III — Technical appendix
Centre for Population | 89
state/territory and capital city/rest-of-state levels. The alternative is a bottom-up approach that places greater
weight on dynamics at lower geographic scales.
Not only are sub-national geographies constrained to national totals, but the economic impact on population is
only accounted for at a national level. For example, the economic uncertainty associated with the pandemic
means there is lower net interstate migration overall.
BOX 9. COMPARING PAST PROJECTIONS TO OUTCOMES
Population projections incorporate assumptions and judgments based on information available at the time
of their preparation. Understanding the size and source of differences in projections improves the
understanding of uncertainty and how projections are used to inform policy.
Population projections differ from outcomes for reasons including changes in behaviour compared to
expectations, changes in government policy and revisions of the base data. Differences in the projected size
and age profile of the population relate to differences in components. Differences for the population aged
around 15-64 are mostly explained by migration, whereas differences at the oldest ages are explained by
deaths, and at the younger ages are explained by births.
In general, net overseas and interstate migration are the most difficult to predict (Wilson, Forecast Accuracy
and Uncertainty of Australian Bureau of Statistics State and Territory Population Projections, 2012). Natural
increase is generally more stable. However, it can be difficult to disentangle changes in natural increase,
which are also a second-order effect of differences in migration, which alter the size of the population.
Table 7 compares the 2015 Intergenerational Report projections produced by the Treasury in early 2015 and
the projections produced by the Australian Bureau of Statistics in late 2018 against the available actual
outcomes to date. Projections produced more recently have smaller differences than those produced earlier,
and smaller states and territories are more difficult to project than larger ones.
The 2015 Intergenerational Report over-projected Australia’s population for June 2019 by around
206,000 people (or 0.8 per cent). The Australian Bureau of Statistics’ projections, published in late 2018,
over-projected Australia’s population for June 2019 by around 80,000 people (or 0.3 per cent). The
Australian Bureau of Statistics over-projected the population size for all states and territories except South
Australia and Tasmania. The largest percentage differences were for the Northern Territory (over-projected
by 2.4 per cent) and the Australian Capital Territory (over-projected by 0.8 per cent).
Population forecasts and projections are produced across a range of organisations in Australia. These
projections differ in their assumptions, methodology, time periods and detail. Future releases of the
Population Statement will focus on comparisons across a range of these projections in finer detail.
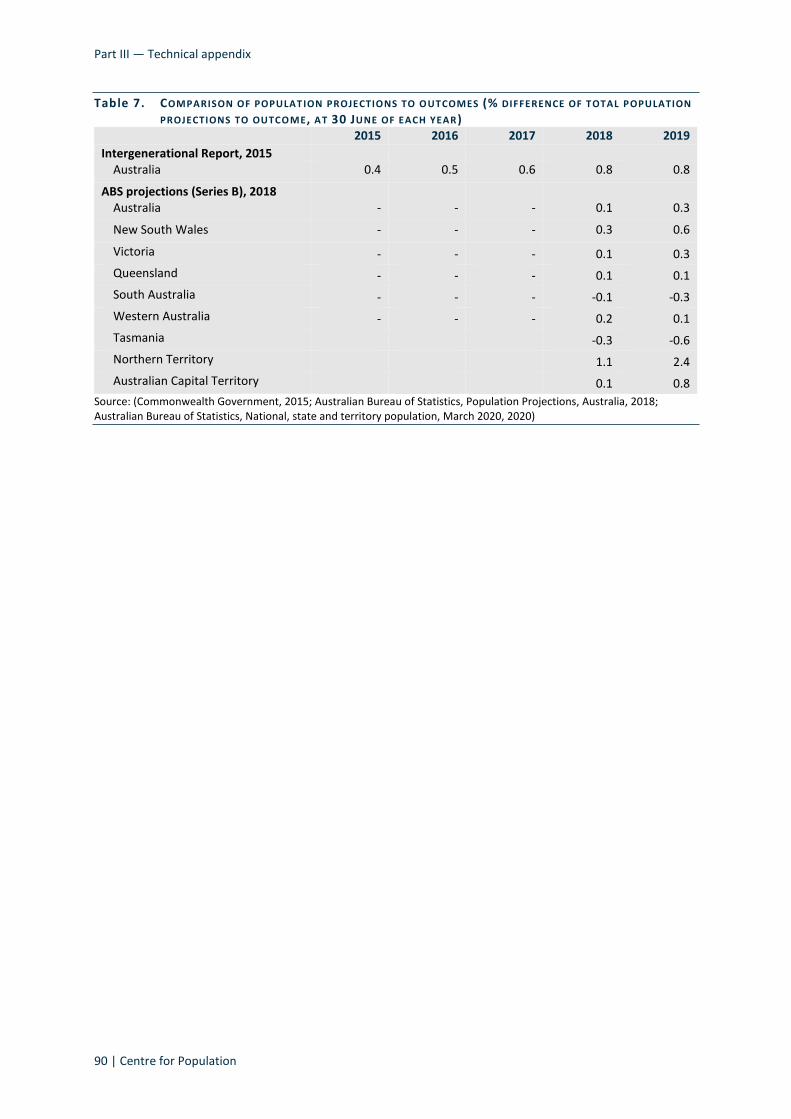
Part III — Technical appendix
90 | Centre for Population
Table 7. COMPARISON OF POPULAT ION PROJECTIONS TO OUTCOMES (% DIFFERENCE OF TOTAL POPULATION
PROJECTIONS TO OUTCOME, AT 30 JUNE OF EACH YEAR) 2015 2016 2017 2018 2019
Intergenerational Report, 2015 Australia 0.4 0.5 0.6 0.8 0.8
ABS projections (Series B), 2018 Australia - - - 0.1 0.3
New South Wales - - - 0.3 0.6
Victoria - - - 0.1 0.3
Queensland - - - 0.1 0.1
South Australia - - - -0.1 -0.3
Western Australia - - - 0.2 0.1
Tasmania -0.3 -0.6
Northern Territory 1.1 2.4
Australian Capital Territory 0.1 0.8
Source: (Commonwealth Government, 2015; Australian Bureau of Statistics, Population Projections, Australia, 2018; Australian Bureau of Statistics, National, state and territory population, March 2020, 2020)
Glossary and References
Centre for Population | 91
GLOSSARY AND REFERENCES
GLOSSARY
NOTES
• Figures in tables and generally in the text have been rounded, and transformations (for example, shares
or rates of change) are calculated using unrounded numbers. Discrepancies between totals and sums of
components are due to rounding.
• In general, the rounding conventions used in the Statement include:
– most rates are rounded to one decimal place with the exception of total fertility rates which are
rounded to 2 decimal places
– estimates over 1 million are rounded to the nearest thousand
– estimates over 10,000 are generally rounded to the nearest 100
– estimates midway between rounding points are rounded up
– the percentage changes and shares throughout the document and in statistical tables are calculated
using unrounded data.
• References to years are all on a financial year basis (1 July to 30 June) unless otherwise stated.
– Population stocks for a year refer to stocks as at 30 June of that year (eg, ‘Australia’s population
was 25.4 million in 2018-19’).
– Population flows for a year refer to flows for the financial year (eg, ‘Australia’s natural increase was
142,000 in 2018-19’).
• Estimates of future population and components of change referred to in the Statement are either
forecasts or projections. This applies to the national and state level projections, for sub-state see Part III.
– Forecasts are predictions about what may happen in the near term based on analysis and modelling
in relation to current circumstances, with the application of assumptions based on expert
judgment. In the Statement:
: the total fertility rate is assumed based on expert advice from Professor McDonald
: net overseas migration is forecast for the period between 2019-20 and 2023-24 (inclusive)
: net internal migration is assumed based on expert advice from the University of Queensland.
– Projections are based on analysis and modelling of long-term trends when rates or levels are stable.
Projections may also include a transition from the last forecast to the assumed stable level or rate.
In the Statement:
: the total fertility rate is projected to stabilise from 2030-31 onward
: mortality probabilities are projected to improve at a stable rate over the entire period

Glossary and References
92 | Centre for Population
: the level of net overseas migration is projected to transition to the stable level after 2023-24
and to be stable from 2028-29 onward, and
: the level of net internal migration is projected to be stable from 2023-24 onward.
• References to the ‘states’ or ‘each state’ includes the Northern Territory and the Australian Capital Territory.
DEFINITIONS
COVID-19
COVID-19 refers to the coronavirus disease caused by the novel severe acute respiratory syndrome
coronavirus 2 (SARS-CoV-2) that was first identified in December 2019.
Dependency ratio
The dependency ratio refers to the number of people of traditional working-age (15-64) for every person
aged under 15, and 65 and over. The old-age dependency ratio refers only to the number of people of
traditional working-age (15-64) for every person aged 65 and over.
Generation
A generation refers to people born and living at about the same time. It roughly aligns with the length of time
over which individuals are born, become adults, and then begin to have their own children — on average
around 30 years.
Greater Capital City Statistical Areas
Greater Capital City Statistical Areas (GCCSA) represent the socio-economic extent of the capital cities as
defined by the Australian Bureau of Statistics. GCCSAs are derived from Statistical Areas Level 4 (SA4).
Source: (Australian Bureau of Statistics, Australian Statistical Geography Standard (ASGS): Volume 1 - Main Structure and
Greater Capital City Statistical Areas, 2016)
Intercensal difference
The intercensal difference is caused by differences in population estimates between successive Censuses,
post-enumeration surveys, and the administrative data sources used for quarterly updates which cannot be
attributed to a particular source.
Source: (Australian Bureau of Statistics, Census of Population and Housing, 2016, 2017)
Internal migration — composition
The composition of net internal migration refers to the specific groups of people who migrate. This could be
measured by age, sex, ethnicity and place of birth.
Internal migration — internal, interstate, intrastate
Internal migration refers to the movement of people across a specified boundary within Australia involving a
change in place of usual residence.
Interstate migration refers to the movement of people over a state or territory boundary involving a change in
place of usual residence. Net interstate migration is the difference between arrivals and departures and can be
either positive or negative.
Intrastate migration refers to the movement of people across a specified boundary within a state or territory.
Source: (Australian Bureau of Statistics, Regional population, 2018-19, 2020)

Glossary and References
Centre for Population | 93
Internal migration — level
The level of net internal migration refers to the overall number of people moving interstate. This can be
measured by the numbers of interstate migrants leaving and entering a state or territory.
Internal migration — patterns
Patterns of net internal migration refer to the origins and destination locations for migration.
Life expectancy
Life expectancy measures how long a person is expected to live if the rest of their life follows the age and
sex-specific mortality rates for the relevant year. This is the expectation of the average years that a person lives
at a specific age. In the Statement, ‘life expectancy’ usually refers to ‘life expectancy at birth’ unless otherwise
specified.
Source: (Australian Government Actuary, 2019)
Overseas migrant, permanent resident
For population purposes, an Australian permanent resident is a non-citizen who holds an Australian
permanent visa and is considered to be usually resident in Australia (see ‘overseas migration’ definition below).
Generally, permanent residents can live, work and study with much fewer restrictions than temporary visa
holders in Australia.
Overseas migrant, temporary resident
A temporary resident is a non-citizen who holds a temporary visa that grants authority for travel to and from
Australia within a specific period for a specific purpose (such as work or study) and is usually resident in
Australia (see ‘overseas migration’ definition below). Temporary visa holders may have other conditions tied to
their stay in Australia. Not all temporary visa holders are considered to be residents as they may not meet the
‘usually resident in Australia’ criterion.
Overseas migration
Overseas migration is defined using a 12/16 month rule. Under this rule, incoming overseas travellers (who are
not currently counted in the population) must be resident in Australia for a total period of 12 months or more
during the 16 month period to be included in the estimated resident population. Similarly, those travellers
departing Australia (who are currently counted in the population) must be absent from Australia for a total of
12 months or more during a 16 month period to then be subtracted from the estimated resident population.
The 12/16 month rule therefore takes account of those people who may have left Australia briefly and
returned, while still being resident for 12 months out of 16. Similarly, it takes account of Australian citizens who
live most of the time overseas but periodically return to Australia for short periods.
Recuperation (with respect to fertility)
The extent to which cumulated cohort fertility rebounds from a low level after an increase in age at first birth is
termed recuperation.
Replacement rate
The replacement rate is the average number of babies a woman would need to have over her reproductive life
span to replace herself and partner. Given the current mortality of women up to age 49 years, replacement
fertility is estimated at around 2.1 babies per woman.
Source: (Australian Bureau of Statistics, Births, Australia, 2019)

Glossary and References
94 | Centre for Population
Rest-of-state area
Within each state, the area not defined as being part of the Greater Capital City is represented by a
rest-of-state region.
Source: (Australian Bureau of Statistics, Australian Statistical Geography Standard (ASGS): Volume 1 - Main Structure and
Greater Capital City Statistical Areas, 2016)
Total fertility rate (TFR)
The total fertility rate is the sum of age-specific fertility rates (divided by 1,000). It represents the number of
children a woman would bear during her lifetime if she experienced current age-specific fertility rates at each
age of her reproductive life. Age-specific fertility rates are the annual number of babies in a specific age group.
Source: (Australian Bureau of Statistics, Births, Australia, 2019)
Working-age population
Working-age population refers to the population aged 15 and over. The ‘traditional working-age population’
refers to the population aged 15 to 64 (inclusive).

Glossary and References
Centre for Population | 95
REFERENCES
Australian Bureau of Statistics. (1992, October 18). Australian Economic Indicators. Retrieved October 23, 2020,
from
https://www.abs.gov.au/AUSSTATS/[email protected]/Previousproducts/1350.0Feature%20Article101992?op
endocument&tabname=Summary&prodno=1350.0&issue=1992&num=&view
Australian Bureau of Statistics. (2016, July 12). Australian Statistical Geography Standard (ASGS): Volume 1 —
Main Structure and Greater Capital City Statistical Areas. Retrieved October 18, 2020, from
https://www.abs.gov.au/ausstats/[email protected]/mf/1270.0.55.001
Australian Bureau of Statistics. (2017, October). 2016 Census QuickStats: Australian Capital Territory. Retrieved
2020, from
https://quickstats.censusdata.abs.gov.au/census_services/getproduct/census/2016/quickstat/8ACTE?
opendocument
Australian Bureau of Statistics. (2017). Australian Statistical Geography Standard (ASGS): Volume 4 —
Significant Urban Areas, Urban Centres and Localities, Section of State, July 2016. Retrieved November
4, 2020, from
https://www.abs.gov.au/ausstats/[email protected]/Lookup/by%20Subject/1270.0.55.004~July%202016~Mai
n%20Features~Significant%20Urban%20Area%20(SUA)~5
Australian Bureau of Statistics. (2017). Census of Population and Housing, 2016. Retrieved October 17, 2020,
from https://www.abs.gov.au/websitedbs/d3310114.nsf/home/about+tablebuilder
Australian Bureau of Statistics. (2017). Migration Australia, 2015-16 — Technical Note: ‘12/16Month Rule’
Methodology for calculating Net Overseas Migration from September Quarter 2006 onwards.
Canberra: Australian Government.
Australian Bureau of Statistics. (2018, October 17). Census of Population and Housing: Understanding the
Increase in Aboriginal and Torres Strait Islander Counts. Retrieved October 28, 2020, from
https://www.abs.gov.au/statistics/people/aboriginal-and-torres-strait-islander-peoples/census-popula
tion-and-housing-understanding-increase-aboriginal-and-torres-strait-islander-counts/2016
Australian Bureau of Statistics. (2018, August 31). Estimates of Aboriginal and Torres Strait Islander Australians.
Retrieved October 17, 2020, from
https://www.abs.gov.au/statistics/people/aboriginal-and-torres-strait-islander-peoples/estimates-abo
riginal-and-torres-strait-islander-australians/latest-release
Australian Bureau of Statistics. (2018, November 29). Life Tables for Aboriginal and Torres Strait Islander
Australians, 2015-17. Retrieved October 29, 2020, from
https://www.abs.gov.au/statistics/people/aboriginal-and-torres-strait-islander-peoples/life-tables-abo
riginal-and-torres-strait-islander-australians/latest-release
Australian Bureau of Statistics. (2018, November 22). Population Projections, Australia. Retrieved October 17,
2020, from
https://www.abs.gov.au/statistics/people/population/population-projections-australia/latest-release
Australian Bureau of Statistics. (2018, May 22). Population Shift: Understanding Internal Migration in Australia.
Retrieved October 19, 2020, from
https://www.abs.gov.au/ausstats/[email protected]/Lookup/by%20Subject/2071.0~2016~Main%20Features~
Population%20Shift:%20Understanding%20Internal%20Migration%20in%20Australia~69

Glossary and References
96 | Centre for Population
Australian Bureau of Statistics. (2018, May 22). Reflecting Australia — Stories from the Census, 2016. Retrieved
October 28, 2020, from
https://www.abs.gov.au/ausstats/[email protected]/Lookup/by%20Subject/2071.0~2016~Main%20Features~
Population%20Shift:%20Understanding%20Internal%20Migration%20in%20Australia~69
Australian Bureau of Statistics. (2019, October 30). 2016-18 Life Tables. Retrieved October 17, 2020, from
https://www.abs.gov.au/statistics/people/population/life-tables/latest-release
Australian Bureau of Statistics. (2019, December 11). Births, Australia. Retrieved October 17, 2020, from
https://www.abs.gov.au/statistics/people/population/births-australia/latest-release
Australian Bureau of Statistics. (2019, July 11). Estimates and Projections, Aboriginal and Torres Strait Islander
Australian. Retrieved October 19, 2020, from
https://www.abs.gov.au/statistics/people/aboriginal-and-torres-strait-islander-peoples/estimates-and
-projections-aboriginal-and-torres-strait-islander-australians/latest-release
Australian Bureau of Statistics. (2019, April 18). Historical population, 2016. Retrieved October 17, 2020, from
https://www.abs.gov.au/statistics/people/population/historical-population/latest-release
Australian Bureau of Statistics. (2020, October 23). Causes of Death, Australia. Retrieved October 28, 2020,
from https://www.abs.gov.au/statistics/health/causes-death/causes-death-australia/latest-release
Australian Bureau of Statistics. (2020, September 24). Deaths, Australia. Retrieved October 24, 2020, from
https://www.abs.gov.au/statistics/people/population/deaths-australia/latest-release
Australian Bureau of Statistics. (2020, October 15). Labour Force, Australia. Retrieved October 17, 2020, from
https://www.abs.gov.au/statistics/labour/employment-and-unemployment/labour-force-australia/lat
est-release
Australian Bureau of Statistics. (2020, April 28). Migration, Australia 2018-19. Retrieved October 29, 2020, from
https://www.abs.gov.au/statistics/people/population/migration-australia/latest-release
Australian Bureau of Statistics. (2020, April 28). Migration, Australia methodology. Retrieved October 29, 2020,
from https://www.abs.gov.au/methodologies/migration-australia-methodology/2018-19
Australian Bureau of Statistics. (2020, September 24). National, state and territory population, March 2020.
Retrieved October 17, 2020, from
https://www.abs.gov.au/statistics/people/population/national-state-and-territory-population/latest-r
elease
Australian Bureau of Statistics. (2020). Net internal and overseas migration estimates by region (SA2 and above)
and age, 2016-17 onwards. Retrieved September 17, 2020, from
http://stat.data.abs.gov.au/OECDStat_Metadata/ShowMetadata.ashx?Dataset=ABS_REGIONAL_MIGR
ATION&ShowOnWeb=true&Lang=en
Australian Bureau of Statistics. (2020, October 1). Provisional Mortality Statistics. Retrieved October 17, 2020,
from
https://www.abs.gov.au/statistics/health/causes-death/provisional-mortality-statistics/latest-release#
data-download
Australian Bureau of Statistics. (2020, October 28). Provisional Mortality Statistics Jan-July. Retrieved October
28, 2020, from
https://www.abs.gov.au/statistics/health/causes-death/provisional-mortality-statistics/latest-release
Glossary and References
Centre for Population | 97
Australian Bureau of Statistics. (2020, August 28). Regional population by age and sex. Retrieved October 17,
2020, from
https://www.abs.gov.au/statistics/people/population/regional-population-age-and-sex/latest-release
Australian Bureau of Statistics. (2020, March 25). Regional population, 2018-19. Retrieved October 17, 2020,
from https://www.abs.gov.au/statistics/people/population/regional-population/2018-19
Australian Bureau of Statistics. (2020, July 28). Regional Statistics, ASGS 2016, 2011-2019. Retrieved October
17, 2020, from http://stat.data.abs.gov.au/Index.aspx?DataSetCode=ABS_REGIONAL_ASGS2016
Australian Bureau of Statistics. (2020, September 15). Residential Property Price Indexes: Eight Capital Cities.
Retrieved October 28, 2020, from
https://www.abs.gov.au/statistics/economy/price-indexes-and-inflation/residential-property-price-in
dexes-eight-capital-cities/latest-release
Australian Bureau of Statistics. (n.d.). Regional Internal Migration Estimates by Region (SA3 and above), Age
and Sex, 2006-07 to 2015-16. Retrieved June 10, 2020, from
http://stat.data.abs.gov.au/index.aspx?DatasetCode=RIN_SA34_GCCSA_STE
Australian Bureau of Statistics. (n.d.). Regional Internal Migration Estimates by Region (SA3 and above), Age
and Sex, 2006-07 to 2015-16; Regional Internal Migration Estimates by Region (SA2 and above)
2016-17 onwards. Retrieved June 10, 2020, from
http://stat.data.abs.gov.au/index.aspx?DatasetCode=RIN_SA34_GCCSA_STE
Australian Bureau of Statistics. (n.d.). Regional Internal Migration Estimates by Region (SA3 and above), Age
and Sex, 2006-07 to 2015-16; Regional Internal Migration Estimates by region (SA2 and above) and
age, 2016-17 onwards. Retrieved June 10, 2020, from
http://stat.data.abs.gov.au/index.aspx?DatasetCode=RIN_SA34_GCCSA_STE
Australian Government Actuary. (2019). Australian Life Tables 2015-17. Retrieved October 17, 2020, from
http://www.aga.gov.au/publications/life_table_2015-17/downloads/Australian%20Life%20Tables%20
2015-17%20v5.pdf
Australian Institute of Health and Welfare. (2019, September 11). Profile of Indigenous Australians. Retrieved
October 22, 2020, from
https://www.aihw.gov.au/reports/australias-welfare/profile-of-indigenous-australians
Australian Institute of Health and Welfare. (2020). Australia’s Health 2020 Data Insights. Canberra.
doi:10.25816/5f05371c539f3
Australian Institute of Health and Welfare. (2020, August 7). Deaths in Australia. Retrieved October 17, 2020,
from https://www.aihw.gov.au/reports/life-expectancy-death/deaths-in-australia/contents/summary
Australian Institute of Health and Welfare. (2020). General Record of Incidence of Mortality Books 2018.
Canberra: Australian Government.
Australian Institute of Health and Welfare. (2020, August 7). General Record of Incidence of Mortality Excel
workbooks. Retrieved October 17, 2020, from
https://www.aihw.gov.au/reports/life-expectancy-deaths/grim-books/contents/grim-excel-workbooks
Australian National Audit Office. (2011). Management of Student Visas. ANAO audit report, no. 46, 2010-11,
Canberra.

Glossary and References
98 | Centre for Population
Bourne, K., Houghton, K., How, G., Achurch, H., & Beaton, R. (2020). The Big Movers: Understanding Population
Mobility in Regional Australia. Canberra: Regional Australia Institute.
Bureau of Infrastructure, Transport and Regional Economics. (2011). Spatial trends in Australian population
growth and movement. Canberra.
Bureau of Infrastructure, Transport and Regional Economics. (2014). The evolution of Australian towns.
Canberra: Commonwealth of Australia. Retrieved from
https://www.bitre.gov.au/sites/default/files/report_136.pdf
Centre for Population. (2020). Historical single year of age fertility rates, for Australia and by state/territory, by
financial year. Canberra: Australian Government.
Chomik, R., Piggott, J., & McDonald, P. (2017). The Impact of Demographic Change on Labour Supply and
Economic Growth: Can APEC Meet the Challenges Ahead? CEPAR.
City of Wanneroo. (2019). Local Area Plan: Yanchep & Two Rocks. Retrieved October 17, 2020, from
https://www.wanneroo.wa.gov.au/consultations/downloads/5dc271d5b1ac0.pdf
Commonwealth Government. (2015). 2015 Intergenerational Report, Australia in 2055. Canberra: Australian
Government.
Department of Education, Skills and Employment. (2020, October). International student data: August 2020.
Retrieved October 27, 2020, from International education online:
https://internationaleducation.gov.au/Pages/default.aspx
Department of Health. (2020, October 17). Coronavirus (COVID-19) current situation and case numbers.
Retrieved October 17, 2020, from
https://www.health.gov.au/news/health-alerts/novel-coronavirus-2019-ncov-health-alert/coronavirus
-covid-19-current-situation-and-case-numbers#cases-and-deaths-by-age-and-sex
Department of Treasury and Finance, Western Australia. (2006, October). Migration in Western Australia: A
recent economic history. Retrieved from
https://www.wa.gov.au/sites/default/files/2020-01/economic-research-papers-migration-in-western-
austraia.pdf
Government of South Australia. (2004). Prosperity through people: A population plan for South Australia.
Adelaide: Government of South Australia.
Gray, M., Qu, L., & Weston, R. (2008, February). Fertility and Family Policy in Australia. AIFS Research Paper No.
41.
Hugo, G. (2008). Australia’s state-specific and regional migration scheme: An assessment of its impacts in South
Australia. Journal of international migration and integration, 125-145.
Kalemba, S. V., Bernard, A., Charles-Edwards, E., & Corcoran, J. (2020). Decline in internal migration levels in
Australia: Compositional or behavioural effect? Population, Space and Place, 26(4).
Lattimore, R., & Pobke, C. (2008, July). Recent Trends in Australian Fertility. Productivity Commission Staff
Working Paper.
McDonald, P. (2020). A Projection of Australia’s Future Fertility. Canberra: Centre for Population.

Glossary and References
Centre for Population | 99
National Skills Commission. (2020, October 30). Small Area Labour Markets (SALM), June Quarter 2020.
Retrieved November 19, 2020, from Labour Market Information Portal:
https://lmip.gov.au/default.aspx?LMIP/Downloads/SmallAreaLabourMarketsSALM
O’Neil, M., & Kaye, L. (2016). The Aged Structure of Population and Economic Growth — Does It Matter?
Economic Issues, 47.
Pangeagiotelis, A. A. (2020). Forecast reconciliation: A geometric view with new insights on bias correction.
International Journal of Forecasting, 6(4). doi:https://doi.org/10.1016/j.ijforecast.2020.06.004
Productivity Commission. (2016). Migrant Intake into Australia. Canberra: Australian Government.
Regional Australia Institute. (2020, June). The Big Movers: Understanding Population Mobility in Regional
Australia. Retrieved October 17, 2020, from
http://www.regionalaustralia.org.au/home/wp-content/uploads/2020/06/RAI_2020_The_Big_Movers
_Population_Mobility_Report_vFinal3.pdf
Reserve Bank of Australia. (1998). Labour Market Adjustment: Evidence on Interstate Labour Mobility.
Retrieved from https://www.rba.gov.au/publications/rdp/1998/pdf/rdp9801.pdf
Sánchez, A. C., & Andrews, D. (2011). Residential Mobility and Public Policy in OECD Countries. OECD Journal:
Economic Studies, 2011(1), 185-206.
The Treasury and the Department of Home Affairs. (2018). Shaping the Nation.
The World Bank. (2020). World Bank Open Data. Retrieved October 17, 2020, from https://data.worldbank.org/
The World Bank. (2020). World Development Indicators. Retrieved October 17, 2020, from
https://databank.worldbank.org/source/world-development-indicators
United Nations. (2019). World Population Prospects 2019. New York.
University of Queensland. (unpublished). Anticipating the impact of COVID-19 on internal migration. Canberra:
Centre for Population.
Wilson, T. (2012). Forecast Accuracy and Uncertainty of Australian Bureau of Statistics State and Territory
Population Projections. International Journal of Population Research. doi:10.1155/2012/419824
Wilson, T., Temple, J., & Charles-Edwards, E. (2020). Will the COVID-19 pandemic affect population ageing in
Australia?