Population Approaches to Improve Diet, Physical Activity, and Smoking Habits: A Scientific Statement...
214
AHA Scientific Statement Population Approaches to Improve Diet, Physical Activity, and Smoking Habits A Scientific Statement From the American Heart Association Dariush Mozaffarian, MD, DrPH, FAHA, Chair; Ashkan Afshin, MD, MPH; Neal L. Benowitz, MD; Vera Bittner, MD, MSPH, FAHA; Stephen R. Daniels, MD, PhD, FAHA; Harold A. Franch, MD, FAHA; David R. Jacobs, Jr, PhD, FAHA; William E. Kraus, MD, FAHA; Penny M. Kris-Etherton, PhD, RD, FAHA; Debra A. Krummel, PhD, RD; Barry M. Popkin, PhD; Laurie P. Whitsel, PhD; Neil A. Zakai, MD, MSc; on behalf of the American Heart Association Council on Epidemiology and Prevention, Council on Nutrition, Physical Activity and Metabolism, Council on Clinical Cardiology, Council on Cardiovascular Disease in the Young, Council on the Kidney in Cardiovascular Disease, Council on Peripheral Vascular Disease, and the Advocacy Coordinating Committee Background—Poor lifestyle behaviors, including suboptimal diet, physical inactivity, and tobacco use, are leading causes of preventable diseases globally. Although even modest population shifts in risk substantially alter health outcomes, the optimal population-level approaches to improve lifestyle are not well established. Methods and Results—For this American Heart Association scientific statement, the writing group systematically reviewed and graded the current scientific evidence for effective population approaches to improve dietary habits, increase physical activity, and reduce tobacco use. Strategies were considered in 6 broad domains: (1) Media and educational campaigns; (2) labeling and consumer information; (3) taxation, subsidies, and other economic incentives; (4) school and workplace approaches; (5) local environmental changes; and (6) direct restrictions and mandates. The writing group also reviewed the potential contributions of healthcare systems and surveillance systems to behavior change efforts. Several specific population interventions that achieved a Class I or IIa recommendation with grade A or B evidence were identified, providing a set of specific evidence-based strategies that deserve close attention and prioritization for wider implementation. Effective interventions included specific approaches in all 6 domains evaluated for improving diet, increasing activity, and reducing tobacco use. The writing group also identified several specific interventions in each of these domains for which current evidence was less robust, as well as other inconsistencies and evidence gaps, informing the need for further rigorous and interdisciplinary approaches to evaluate population programs and policies. Conclusions—This systematic review identified and graded the evidence for a range of population-based strategies to promote lifestyle change. The findings provide a framework for policy makers, advocacy groups, researchers, clinicians, communities, and other stakeholders to understand and implement the most effective approaches. New strategic initiatives and partnerships are needed to translate this evidence into action. (Circulation. 2012;126:1514-1563.) Key Words: AHA Scientific Statements diet nutrition obesity overweight physical activity prevention public policy smoking The American Heart Association makes every effort to avoid any actual or potential conflicts of interest that may arise as a result of an outside relationship or a personal, professional, or business interest of a member of the writing panel. Specifically, all members of the writing group are required to complete and submit a Disclosure Questionnaire showing all such relationships that might be perceived as real or potential conflicts of interest. This statement was approved by the American Heart Association Science Advisory and Coordinating Committee on March 2, 2012. A copy of the document is available at http://my.americanheart.org/statements by selecting either the “By Topic” link or the “By Publication Date” link. To purchase additional reprints, call 843-216-2533 or e-mail [email protected]. The American Heart Association requests that this document be cited as follows: Mozaffarian D, Afshin A, Benowitz NL, Bittner V, Daniels SR, Franch HA, Jacobs DR Jr, Kraus WE, Kris-Etherton PM, Krummel DA, Popkin BM, Whitsel LP, Zakai NA; on behalf of the American Heart Association Council on Epidemiology and Prevention, Council on Nutrition, Physical Activity and Metabolism, Council on Clinical Cardiology, Council on Cardiovascular Disease in the Young, Council on the Kidney in Cardiovascular Disease, Council on Peripheral Vascular Disease, and the Advocacy Coordinating Committee. Population approaches to improve diet, physical activity, and smoking habits: a scientific statement from the American Heart Association. Circulation. 2012;126:1514 –1563. The online-only Data Supplement is available with this article at http://circ.ahajournals.org/lookup/suppl/doi:10.1161/CIR.0b013e318260a20b/-/DC1. Expert peer review of AHA Scientific Statements is conducted by the AHA Office of Science Operations. For more on AHA statements and guidelines development, visit http://my.americanheart.org/statements and select the “Policies and Development” link. Permissions: Multiple copies, modification, alteration, enhancement, and/or distribution of this document are not permitted without the express permission of the American Heart Association. Instructions for obtaining permission are located at http://www.heart.org/HEARTORG/General/ Copyright-Permission-Guidelines_UCM_300404_Article.jsp. A link to the “Copyright Permissions Request Form” appears on the right side of the page. © 2012 American Heart Association, Inc. Circulation is available at http://circ.ahajournals.org DOI: 10.1161/CIR.0b013e318260a20b 1514 by guest on February 6, 2016 http://circ.ahajournals.org/ Downloaded from by guest on February 6, 2016 http://circ.ahajournals.org/ Downloaded from by guest on February 6, 2016 http://circ.ahajournals.org/ Downloaded from by guest on February 6, 2016 http://circ.ahajournals.org/ Downloaded from by guest on February 6, 2016 http://circ.ahajournals.org/ Downloaded from by guest on February 6, 2016 http://circ.ahajournals.org/ Downloaded from by guest on February 6, 2016 http://circ.ahajournals.org/ Downloaded from by guest on February 6, 2016 http://circ.ahajournals.org/ Downloaded from by guest on February 6, 2016 http://circ.ahajournals.org/ Downloaded from by guest on February 6, 2016 http://circ.ahajournals.org/ Downloaded from by guest on February 6, 2016 http://circ.ahajournals.org/ Downloaded from by guest on February 6, 2016 http://circ.ahajournals.org/ Downloaded from by guest on February 6, 2016 http://circ.ahajournals.org/ Downloaded from by guest on February 6, 2016 http://circ.ahajournals.org/ Downloaded from by guest on February 6, 2016 http://circ.ahajournals.org/ Downloaded from by guest on February 6, 2016 http://circ.ahajournals.org/ Downloaded from by guest on February 6, 2016 http://circ.ahajournals.org/ Downloaded from by guest on February 6, 2016 http://circ.ahajournals.org/ Downloaded from by guest on February 6, 2016 http://circ.ahajournals.org/ Downloaded from by guest on February 6, 2016 http://circ.ahajournals.org/ Downloaded from by guest on February 6, 2016 http://circ.ahajournals.org/ Downloaded from by guest on February 6, 2016 http://circ.ahajournals.org/ Downloaded from by guest on February 6, 2016 http://circ.ahajournals.org/ Downloaded from by guest on February 6, 2016 http://circ.ahajournals.org/ Downloaded from by guest on February 6, 2016 http://circ.ahajournals.org/ Downloaded from by guest on February 6, 2016 http://circ.ahajournals.org/ Downloaded from by guest on February 6, 2016 http://circ.ahajournals.org/ Downloaded from by guest on February 6, 2016 http://circ.ahajournals.org/ Downloaded from by guest on February 6, 2016 http://circ.ahajournals.org/ Downloaded from by guest on February 6, 2016 http://circ.ahajournals.org/ Downloaded from by guest on February 6, 2016 http://circ.ahajournals.org/ Downloaded from by guest on February 6, 2016 http://circ.ahajournals.org/ Downloaded from by guest on February 6, 2016 http://circ.ahajournals.org/ Downloaded from by guest on February 6, 2016 http://circ.ahajournals.org/ Downloaded from by guest on February 6, 2016 http://circ.ahajournals.org/ Downloaded from by guest on February 6, 2016 http://circ.ahajournals.org/ Downloaded from by guest on February 6, 2016 http://circ.ahajournals.org/ Downloaded from by guest on February 6, 2016 http://circ.ahajournals.org/ Downloaded from by guest on February 6, 2016 http://circ.ahajournals.org/ Downloaded from by guest on February 6, 2016 http://circ.ahajournals.org/ Downloaded from by guest on February 6, 2016 http://circ.ahajournals.org/ Downloaded from by guest on February 6, 2016 http://circ.ahajournals.org/ Downloaded from by guest on February 6, 2016 http://circ.ahajournals.org/ Downloaded from by guest on February 6, 2016 http://circ.ahajournals.org/ Downloaded from by guest on February 6, 2016 http://circ.ahajournals.org/ Downloaded from by guest on February 6, 2016 http://circ.ahajournals.org/ Downloaded from by guest on February 6, 2016 http://circ.ahajournals.org/ Downloaded from by guest on February 6, 2016 http://circ.ahajournals.org/ Downloaded from by guest on February 6, 2016 http://circ.ahajournals.org/ Downloaded from by guest on February 6, 2016 http://circ.ahajournals.org/ Downloaded from by guest on February 6, 2016 http://circ.ahajournals.org/ Downloaded from by guest on February 6, 2016 http://circ.ahajournals.org/ Downloaded from by guest on February 6, 2016 http://circ.ahajournals.org/ Downloaded from by guest on February 6, 2016 http://circ.ahajournals.org/ Downloaded from by guest on February 6, 2016 http://circ.ahajournals.org/ Downloaded from by guest on February 6, 2016 http://circ.ahajournals.org/ Downloaded from by guest on February 6, 2016 http://circ.ahajournals.org/ Downloaded from by guest on February 6, 2016 http://circ.ahajournals.org/ Downloaded from by guest on February 6, 2016 http://circ.ahajournals.org/ Downloaded from by guest on February 6, 2016 http://circ.ahajournals.org/ Downloaded from by guest on February 6, 2016 http://circ.ahajournals.org/ Downloaded from by guest on February 6, 2016 http://circ.ahajournals.org/ Downloaded from by guest on February 6, 2016 http://circ.ahajournals.org/ Downloaded from by guest on February 6, 2016 http://circ.ahajournals.org/ Downloaded from by guest on February 6, 2016 http://circ.ahajournals.org/ Downloaded from by guest on February 6, 2016 http://circ.ahajournals.org/ Downloaded from by guest on February 6, 2016 http://circ.ahajournals.org/ Downloaded from by guest on February 6, 2016 http://circ.ahajournals.org/ Downloaded from by guest on February 6, 2016 http://circ.ahajournals.org/ Downloaded from by guest on February 6, 2016 http://circ.ahajournals.org/ Downloaded from by guest on February 6, 2016 http://circ.ahajournals.org/ Downloaded from by guest on February 6, 2016 http://circ.ahajournals.org/ Downloaded from by guest on February 6, 2016 http://circ.ahajournals.org/ Downloaded from by guest on February 6, 2016 http://circ.ahajournals.org/ Downloaded from by guest on February 6, 2016 http://circ.ahajournals.org/ Downloaded from by guest on February 6, 2016 http://circ.ahajournals.org/ Downloaded from by guest on February 6, 2016 http://circ.ahajournals.org/ Downloaded from by guest on February 6, 2016 http://circ.ahajournals.org/ Downloaded from by guest on February 6, 2016 http://circ.ahajournals.org/ Downloaded from by guest on February 6, 2016 http://circ.ahajournals.org/ Downloaded from by guest on February 6, 2016 http://circ.ahajournals.org/ Downloaded from by guest on February 6, 2016 http://circ.ahajournals.org/ Downloaded from by guest on February 6, 2016 http://circ.ahajournals.org/ Downloaded from by guest on February 6, 2016 http://circ.ahajournals.org/ Downloaded from by guest on February 6, 2016 http://circ.ahajournals.org/ Downloaded from by guest on February 6, 2016 http://circ.ahajournals.org/ Downloaded from by guest on February 6, 2016 http://circ.ahajournals.org/ Downloaded from by guest on February 6, 2016 http://circ.ahajournals.org/ Downloaded from by guest on February 6, 2016 http://circ.ahajournals.org/ Downloaded from by guest on February 6, 2016 http://circ.ahajournals.org/ Downloaded from by guest on February 6, 2016 http://circ.ahajournals.org/ Downloaded from by guest on February 6, 2016 http://circ.ahajournals.org/ Downloaded from by guest on February 6, 2016 http://circ.ahajournals.org/ Downloaded from by guest on February 6, 2016 http://circ.ahajournals.org/ Downloaded from by guest on February 6, 2016 http://circ.ahajournals.org/ Downloaded from by guest on February 6, 2016 http://circ.ahajournals.org/ Downloaded from by guest on February 6, 2016 http://circ.ahajournals.org/ Downloaded from by guest on February 6, 2016 http://circ.ahajournals.org/ Downloaded from by guest on February 6, 2016 http://circ.ahajournals.org/ Downloaded from by guest on February 6, 2016 http://circ.ahajournals.org/ Downloaded from by guest on February 6, 2016 http://circ.ahajournals.org/ Downloaded from by guest on February 6, 2016 http://circ.ahajournals.org/ Downloaded from by guest on February 6, 2016 http://circ.ahajournals.org/ Downloaded from by guest on February 6, 2016 http://circ.ahajournals.org/ Downloaded from by guest on February 6, 2016 http://circ.ahajournals.org/ Downloaded from by guest on February 6, 2016 http://circ.ahajournals.org/ Downloaded from by guest on February 6, 2016 http://circ.ahajournals.org/ Downloaded from by guest on February 6, 2016 http://circ.ahajournals.org/ Downloaded from by guest on February 6, 2016 http://circ.ahajournals.org/ Downloaded from by guest on February 6, 2016 http://circ.ahajournals.org/ Downloaded from by guest on February 6, 2016 http://circ.ahajournals.org/ Downloaded from by guest on February 6, 2016 http://circ.ahajournals.org/ Downloaded from by guest on February 6, 2016 http://circ.ahajournals.org/ Downloaded from by guest on February 6, 2016 http://circ.ahajournals.org/ Downloaded from by guest on February 6, 2016 http://circ.ahajournals.org/ Downloaded from by guest on February 6, 2016 http://circ.ahajournals.org/ Downloaded from by guest on February 6, 2016 http://circ.ahajournals.org/ Downloaded from by guest on February 6, 2016 http://circ.ahajournals.org/ Downloaded from by guest on February 6, 2016 http://circ.ahajournals.org/ Downloaded from by guest on February 6, 2016 http://circ.ahajournals.org/ Downloaded from by guest on February 6, 2016 http://circ.ahajournals.org/ Downloaded from by guest on February 6, 2016 http://circ.ahajournals.org/ Downloaded from by guest on February 6, 2016 http://circ.ahajournals.org/ Downloaded from by guest on February 6, 2016 http://circ.ahajournals.org/ Downloaded from by guest on February 6, 2016 http://circ.ahajournals.org/ Downloaded from by guest on February 6, 2016 http://circ.ahajournals.org/ Downloaded from by guest on February 6, 2016 http://circ.ahajournals.org/ Downloaded from by guest on February 6, 2016 http://circ.ahajournals.org/ Downloaded from by guest on February 6, 2016 http://circ.ahajournals.org/ Downloaded from by guest on February 6, 2016 http://circ.ahajournals.org/ Downloaded from by guest on February 6, 2016 http://circ.ahajournals.org/ Downloaded from by guest on February 6, 2016 http://circ.ahajournals.org/ Downloaded from by guest on February 6, 2016 http://circ.ahajournals.org/ Downloaded from by guest on February 6, 2016 http://circ.ahajournals.org/ Downloaded from by guest on February 6, 2016 http://circ.ahajournals.org/ Downloaded from by guest on February 6, 2016 http://circ.ahajournals.org/ Downloaded from by guest on February 6, 2016 http://circ.ahajournals.org/ Downloaded from by guest on February 6, 2016 http://circ.ahajournals.org/ Downloaded from by guest on February 6, 2016 http://circ.ahajournals.org/ Downloaded from by guest on February 6, 2016 http://circ.ahajournals.org/ Downloaded from by guest on February 6, 2016 http://circ.ahajournals.org/ Downloaded from by guest on February 6, 2016 http://circ.ahajournals.org/ Downloaded from by guest on February 6, 2016 http://circ.ahajournals.org/ Downloaded from by guest on February 6, 2016 http://circ.ahajournals.org/ Downloaded from by guest on February 6, 2016 http://circ.ahajournals.org/ Downloaded from by guest on February 6, 2016 http://circ.ahajournals.org/ Downloaded from by guest on February 6, 2016 http://circ.ahajournals.org/ Downloaded from by guest on February 6, 2016 http://circ.ahajournals.org/ Downloaded from by guest on February 6, 2016 http://circ.ahajournals.org/ Downloaded from by guest on February 6, 2016 http://circ.ahajournals.org/ Downloaded from by guest on February 6, 2016 http://circ.ahajournals.org/ Downloaded from by guest on February 6, 2016 http://circ.ahajournals.org/ Downloaded from by guest on February 6, 2016 http://circ.ahajournals.org/ Downloaded from by guest on February 6, 2016 http://circ.ahajournals.org/ Downloaded from by guest on February 6, 2016 http://circ.ahajournals.org/ Downloaded from by guest on February 6, 2016 http://circ.ahajournals.org/ Downloaded from by guest on February 6, 2016 http://circ.ahajournals.org/ Downloaded from by guest on February 6, 2016 http://circ.ahajournals.org/ Downloaded from by guest on February 6, 2016 http://circ.ahajournals.org/ Downloaded from by guest on February 6, 2016 http://circ.ahajournals.org/ Downloaded from by guest on February 6, 2016 http://circ.ahajournals.org/ Downloaded from by guest on February 6, 2016 http://circ.ahajournals.org/ Downloaded from by guest on February 6, 2016 http://circ.ahajournals.org/ Downloaded from by guest on February 6, 2016 http://circ.ahajournals.org/ Downloaded from by guest on February 6, 2016 http://circ.ahajournals.org/ Downloaded from by guest on February 6, 2016 http://circ.ahajournals.org/ Downloaded from by guest on February 6, 2016 http://circ.ahajournals.org/ Downloaded from by guest on February 6, 2016 http://circ.ahajournals.org/ Downloaded from by guest on February 6, 2016 http://circ.ahajournals.org/ Downloaded from by guest on February 6, 2016 http://circ.ahajournals.org/ Downloaded from by guest on February 6, 2016 http://circ.ahajournals.org/ Downloaded from by guest on February 6, 2016 http://circ.ahajournals.org/ Downloaded from by guest on February 6, 2016 http://circ.ahajournals.org/ Downloaded from by guest on February 6, 2016 http://circ.ahajournals.org/ Downloaded from by guest on February 6, 2016 http://circ.ahajournals.org/ Downloaded from by guest on February 6, 2016 http://circ.ahajournals.org/ Downloaded from by guest on February 6, 2016 http://circ.ahajournals.org/ Downloaded from by guest on February 6, 2016 http://circ.ahajournals.org/ Downloaded from
Transcript of Population Approaches to Improve Diet, Physical Activity, and Smoking Habits: A Scientific Statement...

AHA Scientific Statement
Population Approaches to Improve Diet, Physical Activity,and Smoking Habits
A Scientific Statement From the American Heart AssociationDariush Mozaffarian, MD, DrPH, FAHA, Chair; Ashkan Afshin, MD, MPH; Neal L. Benowitz, MD;
Vera Bittner, MD, MSPH, FAHA; Stephen R. Daniels, MD, PhD, FAHA;Harold A. Franch, MD, FAHA; David R. Jacobs, Jr, PhD, FAHA; William E. Kraus, MD, FAHA;Penny M. Kris-Etherton, PhD, RD, FAHA; Debra A. Krummel, PhD, RD; Barry M. Popkin, PhD;Laurie P. Whitsel, PhD; Neil A. Zakai, MD, MSc; on behalf of the American Heart Association
Council on Epidemiology and Prevention, Council on Nutrition, Physical Activity and Metabolism,Council on Clinical Cardiology, Council on Cardiovascular Disease in the Young, Council on the Kidney inCardiovascular Disease, Council on Peripheral Vascular Disease, and the Advocacy Coordinating Committee
Background—Poor lifestyle behaviors, including suboptimal diet, physical inactivity, and tobacco use, are leading causesof preventable diseases globally. Although even modest population shifts in risk substantially alter health outcomes, theoptimal population-level approaches to improve lifestyle are not well established.
Methods and Results—For this American Heart Association scientific statement, the writing group systematicallyreviewed and graded the current scientific evidence for effective population approaches to improve dietary habits,increase physical activity, and reduce tobacco use. Strategies were considered in 6 broad domains: (1) Media andeducational campaigns; (2) labeling and consumer information; (3) taxation, subsidies, and other economic incentives;(4) school and workplace approaches; (5) local environmental changes; and (6) direct restrictions and mandates. Thewriting group also reviewed the potential contributions of healthcare systems and surveillance systems to behaviorchange efforts. Several specific population interventions that achieved a Class I or IIa recommendation with grade A or Bevidence were identified, providing a set of specific evidence-based strategies that deserve close attention and prioritizationfor wider implementation. Effective interventions included specific approaches in all 6 domains evaluated for improving diet,increasing activity, and reducing tobacco use. The writing group also identified several specific interventions in each of thesedomains for which current evidence was less robust, as well as other inconsistencies and evidence gaps, informing the needfor further rigorous and interdisciplinary approaches to evaluate population programs and policies.
Conclusions—This systematic review identified and graded the evidence for a range of population-based strategies topromote lifestyle change. The findings provide a framework for policy makers, advocacy groups, researchers, clinicians,communities, and other stakeholders to understand and implement the most effective approaches. New strategicinitiatives and partnerships are needed to translate this evidence into action. (Circulation. 2012;126:1514-1563.)
Key Words: AHA Scientific Statements � diet � nutrition � obesity � overweight � physical activity � prevention� public policy � smoking
The American Heart Association makes every effort to avoid any actual or potential conflicts of interest that may arise as a result of an outsiderelationship or a personal, professional, or business interest of a member of the writing panel. Specifically, all members of the writing group are requiredto complete and submit a Disclosure Questionnaire showing all such relationships that might be perceived as real or potential conflicts of interest.
This statement was approved by the American Heart Association Science Advisory and Coordinating Committee on March 2, 2012. A copy of thedocument is available at http://my.americanheart.org/statements by selecting either the “By Topic” link or the “By Publication Date” link. To purchaseadditional reprints, call 843-216-2533 or e-mail [email protected].
The American Heart Association requests that this document be cited as follows: Mozaffarian D, Afshin A, Benowitz NL, Bittner V, Daniels SR,Franch HA, Jacobs DR Jr, Kraus WE, Kris-Etherton PM, Krummel DA, Popkin BM, Whitsel LP, Zakai NA; on behalf of the American Heart AssociationCouncil on Epidemiology and Prevention, Council on Nutrition, Physical Activity and Metabolism, Council on Clinical Cardiology, Council onCardiovascular Disease in the Young, Council on the Kidney in Cardiovascular Disease, Council on Peripheral Vascular Disease, and the AdvocacyCoordinating Committee. Population approaches to improve diet, physical activity, and smoking habits: a scientific statement from the American HeartAssociation. Circulation. 2012;126:1514–1563.
The online-only Data Supplement is available with this article at http://circ.ahajournals.org/lookup/suppl/doi:10.1161/CIR.0b013e318260a20b/-/DC1.Expert peer review of AHA Scientific Statements is conducted by the AHA Office of Science Operations. For more on AHA statements and guidelines
development, visit http://my.americanheart.org/statements and select the “Policies and Development” link.Permissions: Multiple copies, modification, alteration, enhancement, and/or distribution of this document are not permitted without the express
permission of the American Heart Association. Instructions for obtaining permission are located at http://www.heart.org/HEARTORG/General/Copyright-Permission-Guidelines_UCM_300404_Article.jsp. A link to the “Copyright Permissions Request Form” appears on the right side of the page.
© 2012 American Heart Association, Inc.
Circulation is available at http://circ.ahajournals.org DOI: 10.1161/CIR.0b013e318260a20b
1514 by guest on February 6, 2016http://circ.ahajournals.org/Downloaded from by guest on February 6, 2016http://circ.ahajournals.org/Downloaded from by guest on February 6, 2016http://circ.ahajournals.org/Downloaded from by guest on February 6, 2016http://circ.ahajournals.org/Downloaded from by guest on February 6, 2016http://circ.ahajournals.org/Downloaded from by guest on February 6, 2016http://circ.ahajournals.org/Downloaded from by guest on February 6, 2016http://circ.ahajournals.org/Downloaded from by guest on February 6, 2016http://circ.ahajournals.org/Downloaded from by guest on February 6, 2016http://circ.ahajournals.org/Downloaded from by guest on February 6, 2016http://circ.ahajournals.org/Downloaded from by guest on February 6, 2016http://circ.ahajournals.org/Downloaded from by guest on February 6, 2016http://circ.ahajournals.org/Downloaded from by guest on February 6, 2016http://circ.ahajournals.org/Downloaded from by guest on February 6, 2016http://circ.ahajournals.org/Downloaded from by guest on February 6, 2016http://circ.ahajournals.org/Downloaded from by guest on February 6, 2016http://circ.ahajournals.org/Downloaded from by guest on February 6, 2016http://circ.ahajournals.org/Downloaded from by guest on February 6, 2016http://circ.ahajournals.org/Downloaded from by guest on February 6, 2016http://circ.ahajournals.org/Downloaded from by guest on February 6, 2016http://circ.ahajournals.org/Downloaded from by guest on February 6, 2016http://circ.ahajournals.org/Downloaded from by guest on February 6, 2016http://circ.ahajournals.org/Downloaded from by guest on February 6, 2016http://circ.ahajournals.org/Downloaded from by guest on February 6, 2016http://circ.ahajournals.org/Downloaded from by guest on February 6, 2016http://circ.ahajournals.org/Downloaded from by guest on February 6, 2016http://circ.ahajournals.org/Downloaded from by guest on February 6, 2016http://circ.ahajournals.org/Downloaded from by guest on February 6, 2016http://circ.ahajournals.org/Downloaded from by guest on February 6, 2016http://circ.ahajournals.org/Downloaded from by guest on February 6, 2016http://circ.ahajournals.org/Downloaded from by guest on February 6, 2016http://circ.ahajournals.org/Downloaded from by guest on February 6, 2016http://circ.ahajournals.org/Downloaded from by guest on February 6, 2016http://circ.ahajournals.org/Downloaded from by guest on February 6, 2016http://circ.ahajournals.org/Downloaded from by guest on February 6, 2016http://circ.ahajournals.org/Downloaded from by guest on February 6, 2016http://circ.ahajournals.org/Downloaded from by guest on February 6, 2016http://circ.ahajournals.org/Downloaded from by guest on February 6, 2016http://circ.ahajournals.org/Downloaded from by guest on February 6, 2016http://circ.ahajournals.org/Downloaded from by guest on February 6, 2016http://circ.ahajournals.org/Downloaded from by guest on February 6, 2016http://circ.ahajournals.org/Downloaded from by guest on February 6, 2016http://circ.ahajournals.org/Downloaded from by guest on February 6, 2016http://circ.ahajournals.org/Downloaded from by guest on February 6, 2016http://circ.ahajournals.org/Downloaded from by guest on February 6, 2016http://circ.ahajournals.org/Downloaded from by guest on February 6, 2016http://circ.ahajournals.org/Downloaded from by guest on February 6, 2016http://circ.ahajournals.org/Downloaded from by guest on February 6, 2016http://circ.ahajournals.org/Downloaded from by guest on February 6, 2016http://circ.ahajournals.org/Downloaded from by guest on February 6, 2016http://circ.ahajournals.org/Downloaded from by guest on February 6, 2016http://circ.ahajournals.org/Downloaded from by guest on February 6, 2016http://circ.ahajournals.org/Downloaded from by guest on February 6, 2016http://circ.ahajournals.org/Downloaded from by guest on February 6, 2016http://circ.ahajournals.org/Downloaded from by guest on February 6, 2016http://circ.ahajournals.org/Downloaded from by guest on February 6, 2016http://circ.ahajournals.org/Downloaded from by guest on February 6, 2016http://circ.ahajournals.org/Downloaded from by guest on February 6, 2016http://circ.ahajournals.org/Downloaded from by guest on February 6, 2016http://circ.ahajournals.org/Downloaded from by guest on February 6, 2016http://circ.ahajournals.org/Downloaded from by guest on February 6, 2016http://circ.ahajournals.org/Downloaded from by guest on February 6, 2016http://circ.ahajournals.org/Downloaded from by guest on February 6, 2016http://circ.ahajournals.org/Downloaded from by guest on February 6, 2016http://circ.ahajournals.org/Downloaded from by guest on February 6, 2016http://circ.ahajournals.org/Downloaded from by guest on February 6, 2016http://circ.ahajournals.org/Downloaded from by guest on February 6, 2016http://circ.ahajournals.org/Downloaded from by guest on February 6, 2016http://circ.ahajournals.org/Downloaded from by guest on February 6, 2016http://circ.ahajournals.org/Downloaded from by guest on February 6, 2016http://circ.ahajournals.org/Downloaded from by guest on February 6, 2016http://circ.ahajournals.org/Downloaded from by guest on February 6, 2016http://circ.ahajournals.org/Downloaded from by guest on February 6, 2016http://circ.ahajournals.org/Downloaded from by guest on February 6, 2016http://circ.ahajournals.org/Downloaded from by guest on February 6, 2016http://circ.ahajournals.org/Downloaded from by guest on February 6, 2016http://circ.ahajournals.org/Downloaded from by guest on February 6, 2016http://circ.ahajournals.org/Downloaded from by guest on February 6, 2016http://circ.ahajournals.org/Downloaded from by guest on February 6, 2016http://circ.ahajournals.org/Downloaded from by guest on February 6, 2016http://circ.ahajournals.org/Downloaded from by guest on February 6, 2016http://circ.ahajournals.org/Downloaded from by guest on February 6, 2016http://circ.ahajournals.org/Downloaded from by guest on February 6, 2016http://circ.ahajournals.org/Downloaded from by guest on February 6, 2016http://circ.ahajournals.org/Downloaded from by guest on February 6, 2016http://circ.ahajournals.org/Downloaded from by guest on February 6, 2016http://circ.ahajournals.org/Downloaded from by guest on February 6, 2016http://circ.ahajournals.org/Downloaded from by guest on February 6, 2016http://circ.ahajournals.org/Downloaded from by guest on February 6, 2016http://circ.ahajournals.org/Downloaded from by guest on February 6, 2016http://circ.ahajournals.org/Downloaded from by guest on February 6, 2016http://circ.ahajournals.org/Downloaded from by guest on February 6, 2016http://circ.ahajournals.org/Downloaded from by guest on February 6, 2016http://circ.ahajournals.org/Downloaded from by guest on February 6, 2016http://circ.ahajournals.org/Downloaded from by guest on February 6, 2016http://circ.ahajournals.org/Downloaded from by guest on February 6, 2016http://circ.ahajournals.org/Downloaded from by guest on February 6, 2016http://circ.ahajournals.org/Downloaded from by guest on February 6, 2016http://circ.ahajournals.org/Downloaded from by guest on February 6, 2016http://circ.ahajournals.org/Downloaded from by guest on February 6, 2016http://circ.ahajournals.org/Downloaded from by guest on February 6, 2016http://circ.ahajournals.org/Downloaded from by guest on February 6, 2016http://circ.ahajournals.org/Downloaded from by guest on February 6, 2016http://circ.ahajournals.org/Downloaded from by guest on February 6, 2016http://circ.ahajournals.org/Downloaded from by guest on February 6, 2016http://circ.ahajournals.org/Downloaded from by guest on February 6, 2016http://circ.ahajournals.org/Downloaded from by guest on February 6, 2016http://circ.ahajournals.org/Downloaded from by guest on February 6, 2016http://circ.ahajournals.org/Downloaded from by guest on February 6, 2016http://circ.ahajournals.org/Downloaded from by guest on February 6, 2016http://circ.ahajournals.org/Downloaded from by guest on February 6, 2016http://circ.ahajournals.org/Downloaded from by guest on February 6, 2016http://circ.ahajournals.org/Downloaded from by guest on February 6, 2016http://circ.ahajournals.org/Downloaded from by guest on February 6, 2016http://circ.ahajournals.org/Downloaded from by guest on February 6, 2016http://circ.ahajournals.org/Downloaded from by guest on February 6, 2016http://circ.ahajournals.org/Downloaded from by guest on February 6, 2016http://circ.ahajournals.org/Downloaded from by guest on February 6, 2016http://circ.ahajournals.org/Downloaded from by guest on February 6, 2016http://circ.ahajournals.org/Downloaded from by guest on February 6, 2016http://circ.ahajournals.org/Downloaded from by guest on February 6, 2016http://circ.ahajournals.org/Downloaded from by guest on February 6, 2016http://circ.ahajournals.org/Downloaded from by guest on February 6, 2016http://circ.ahajournals.org/Downloaded from by guest on February 6, 2016http://circ.ahajournals.org/Downloaded from by guest on February 6, 2016http://circ.ahajournals.org/Downloaded from by guest on February 6, 2016http://circ.ahajournals.org/Downloaded from by guest on February 6, 2016http://circ.ahajournals.org/Downloaded from by guest on February 6, 2016http://circ.ahajournals.org/Downloaded from by guest on February 6, 2016http://circ.ahajournals.org/Downloaded from by guest on February 6, 2016http://circ.ahajournals.org/Downloaded from by guest on February 6, 2016http://circ.ahajournals.org/Downloaded from by guest on February 6, 2016http://circ.ahajournals.org/Downloaded from by guest on February 6, 2016http://circ.ahajournals.org/Downloaded from by guest on February 6, 2016http://circ.ahajournals.org/Downloaded from by guest on February 6, 2016http://circ.ahajournals.org/Downloaded from by guest on February 6, 2016http://circ.ahajournals.org/Downloaded from by guest on February 6, 2016http://circ.ahajournals.org/Downloaded from by guest on February 6, 2016http://circ.ahajournals.org/Downloaded from by guest on February 6, 2016http://circ.ahajournals.org/Downloaded from by guest on February 6, 2016http://circ.ahajournals.org/Downloaded from by guest on February 6, 2016http://circ.ahajournals.org/Downloaded from by guest on February 6, 2016http://circ.ahajournals.org/Downloaded from by guest on February 6, 2016http://circ.ahajournals.org/Downloaded from by guest on February 6, 2016http://circ.ahajournals.org/Downloaded from by guest on February 6, 2016http://circ.ahajournals.org/Downloaded from by guest on February 6, 2016http://circ.ahajournals.org/Downloaded from by guest on February 6, 2016http://circ.ahajournals.org/Downloaded from by guest on February 6, 2016http://circ.ahajournals.org/Downloaded from by guest on February 6, 2016http://circ.ahajournals.org/Downloaded from by guest on February 6, 2016http://circ.ahajournals.org/Downloaded from by guest on February 6, 2016http://circ.ahajournals.org/Downloaded from by guest on February 6, 2016http://circ.ahajournals.org/Downloaded from by guest on February 6, 2016http://circ.ahajournals.org/Downloaded from by guest on February 6, 2016http://circ.ahajournals.org/Downloaded from by guest on February 6, 2016http://circ.ahajournals.org/Downloaded from by guest on February 6, 2016http://circ.ahajournals.org/Downloaded from by guest on February 6, 2016http://circ.ahajournals.org/Downloaded from by guest on February 6, 2016http://circ.ahajournals.org/Downloaded from by guest on February 6, 2016http://circ.ahajournals.org/Downloaded from by guest on February 6, 2016http://circ.ahajournals.org/Downloaded from by guest on February 6, 2016http://circ.ahajournals.org/Downloaded from by guest on February 6, 2016http://circ.ahajournals.org/Downloaded from by guest on February 6, 2016http://circ.ahajournals.org/Downloaded from by guest on February 6, 2016http://circ.ahajournals.org/Downloaded from by guest on February 6, 2016http://circ.ahajournals.org/Downloaded from by guest on February 6, 2016http://circ.ahajournals.org/Downloaded from by guest on February 6, 2016http://circ.ahajournals.org/Downloaded from by guest on February 6, 2016http://circ.ahajournals.org/Downloaded from by guest on February 6, 2016http://circ.ahajournals.org/Downloaded from by guest on February 6, 2016http://circ.ahajournals.org/Downloaded from by guest on February 6, 2016http://circ.ahajournals.org/Downloaded from by guest on February 6, 2016http://circ.ahajournals.org/Downloaded from by guest on February 6, 2016http://circ.ahajournals.org/Downloaded from by guest on February 6, 2016http://circ.ahajournals.org/Downloaded from by guest on February 6, 2016http://circ.ahajournals.org/Downloaded from by guest on February 6, 2016http://circ.ahajournals.org/Downloaded from by guest on February 6, 2016http://circ.ahajournals.org/Downloaded from by guest on February 6, 2016http://circ.ahajournals.org/Downloaded from

Cardiovascular diseases (CVD), type 2 diabetes mellitus,and adiposity produce tremendous burdens of deaths,
lost quality of life, and economic disruption globally.1,2 Mostof these conditions and their sequelae are preventable oroccur at unnecessarily young ages and are largely caused bysuboptimal lifestyle habits, in particular, poor diet, physicalinactivity, and use of tobacco.3–13 The resulting burdens onfamilies, communities, and nations are enormous and unsus-tainable, and the health and economic imperatives of improv-ing lifestyle behaviors are fully evident.2
Consequently, the recent United Nations high-level meet-ing on noncommunicable diseases,14 the American HeartAssociation (AHA) 2020 strategic goals,3 and the multisectorUS Million Hearts Initiative15 each highlighted the criticalneed to improve lifestyle habits to prevent CVD and maxi-mize cardiovascular health. Unfortunately, the optimal ap-proaches to improve lifestyle are not established. Althoughthe most relevant specific lifestyle targets are increasinglyevident,3,4,8–12 the most effective strategies to achieve thesechanges have been less clear. An AHA scientific statementidentified several effective individual-level (eg, clinical) in-terventions for achieving behavior change.16 However, al-though individual-based approaches can be effective for somepatients, they do not work for all,16 and the long-termsustainability of such efforts also remains in question.
Population-based strategies are crucial complements toindividual-based efforts and also have potential for broad andsustained impact.17–19 The writing group that prepared thisAHA scientific statement systematically reviewed and gradedthe current scientific evidence for effective population ap-proaches to improve dietary habits, increase physical activity,and reduce tobacco use. Population strategies were consid-ered in 6 broad domains: (1) Media and educational cam-paigns; (2) labeling and consumer information; (3) taxation,subsidies, and other economic incentives; (4) school andworkplace approaches; (5) local environmental changes; and(6) direct restrictions and mandates. The writing group alsoreviewed how healthcare systems and surveillance systemscan contribute to and monitor behavior change efforts. Theinformation presented in this statement is intended to providea useful framework for policy makers, advocacy groups,researchers, clinicians, communities, and other stakeholdersto understand and implement the most effective public healthapproaches for lifestyle change to improve cardiometabolichealth.
The writing group identified several specific interventions thatwere designated an AHA Class I or IIa recommendation withLevel of Evidence A or B, providing a set of specific evidence-based strategies that deserve close attention and prioritization forwider implementation (Table 1). Although much of this evi-dence was derived from studies in high-income regions of theWestern world, for several interventions, concordant evidencewas also available from other regions, including high-incomenon-Western and middle- or low-income regions. Althoughabsolute rates of disease vary across populations, the relativeimpact of major cardiometabolic risk factors is shared acrossnations.20 Likewise, the relative evidence for efficacy of thesedifferent population strategies should help inform policy priori-ties in different countries. Notably, effective interventions were
identified across a range of approaches, including media andeducation, labeling and consumer information, economic incen-tives, school and workplace approaches, local environmentalchanges, and direct restrictions and mandates. This providessome flexibility for policy makers, advocacy groups, and orga-nizations to select from among specific interventions based onwhat corresponds best with local priorities and circumstances.These various evidence-based interventions could also be im-plemented in combinations, either simultaneously or in stages,providing multicomponent approaches to improving diet, in-creasing physical activity, and reducing tobacco use.
In addition to the approaches outlined in Table 1, thewriting group also identified many specific interventions andstrategies in these domains for which the current evidencewas not as robust. These other interventions and evidence fortheir effectiveness are summarized in the sections below.Because the numbers of policy champions and fundingresources for preventive efforts are often limited, prioritiza-tion of different interventions requires knowledge of whichstrategies have evidence for effectiveness and which strate-gies require further investigation.
The writing group recognizes that it could not review everypossible type of population intervention and that its searchstrategies may have missed some relevant studies. Nonethe-less, this AHA scientific statement represents a systematicassessment of several key population approaches for improv-ing lifestyle behaviors, with evaluation of the strength andconsistency of evidence; detailed listings of the primaryevidence in supplementary material; and consideration ofcomplementary evidence across diet, physical activity, andtobacco use behaviors. Given the number and types of studiesidentified, it seems unlikely that the addition of any missedstudies would dramatically alter most of the conclusions. Forthe types of interventions reviewed, the writing group alsoidentified inconsistencies and gaps in the evidence, as sum-marized below. The findings highlight the need for andinform the design of future interdisciplinary efforts, includinginput from academic experts in evaluation of interventions, toestablish more systematic and rigorous approaches for theevaluation of such programs and policies.
Poor lifestyle behaviors, including suboptimal diet, physi-cal inactivity, and tobacco use, are the leading causes ofpreventable diseases in nearly all nations. The resultant ratesof morbidity and mortality, adverse impact on disparities, andeconomic costs are staggering. At the population level, evenmodest shifts in risk behaviors and risk factors substantiallyalter health outcomes and disease risk. This report identifiesa range of evidence-based, population-based strategies thateffectively promote lifestyle change. The findings informpotential partnerships and strategies to successfully addresssuboptimal diet, inactivity, and smoking, which are each amajor preventable cause of poor health globally. The infor-mation presented herein can help provide a blueprint forpublic health officials, researchers, communities, advocacygroups, private donors, and other stakeholders to engage inand form alliances around evidence-based population preven-tion efforts. New strategic initiatives and partnerships areneeded to translate this evidence into action.
Mozaffarian et al Population Approaches to Diet, Activity, and Smoking 1515
by guest on February 6, 2016http://circ.ahajournals.org/Downloaded from

Table 1. Summary of Evidence-Based Population Approaches for Improving Diet, Increasing Physical Activity, and ReducingTobacco Use*
Diet
Media and education Sustained, focused media and educational campaigns, using multiple modes, for increasing consumption ofspecific healthful foods or reducing consumption of specific less healthful foods or beverages, either alone (IIa B)or as part of multicomponent strategies (I B)†‡§
On-site supermarket and grocery store educational programs to support the purchase of healthier foods (IIa B)†
Labeling and information Mandated nutrition facts panels or front-of-pack labels/icons as a means to influence industry behavior andproduct formulations (IIa B)†
Economic incentives Subsidy strategies to lower prices of more healthful foods and beverages (I A)†
Tax strategies to increase prices of less healthful foods and beverages (IIa B)†
Changes in both agricultural subsidies and other related policies to create an infrastructure that facilitatesproduction, transportation, and marketing of healthier foods, sustained over several decades (IIa B)†
Schools Multicomponent interventions focused on improving both diet and physical activity, including specializededucational curricula, trained teachers, supportive school policies, a formal PE program, healthy food andbeverage options, and a parental/family component (I A)†
School garden programs, including nutrition and gardening education and hands-on gardening experiences (IIa A)†
Fresh fruit and vegetable programs that provide free fruits and vegetables to students during the school day(IIa A)†
Workplaces Comprehensive worksite wellness programs with nutrition, physical activity, and tobacco cessation/preventioncomponents (IIa A)†
Increased availability of healthier food/beverage options and/or strong nutrition standards for foods and beveragesserved, in combination with vending machine prompts, labels, or icons to make healthier choices (IIa B)†
Local environment Increased availability of supermarkets near homes (IIa B�)†‡
Restrictions and mandates Restrictions on television advertisements for less healthful foods or beverages advertised to children (I B)†
Restrictions on advertising and marketing of less healthful foods or beverages near schools and public placesfrequented by youths (IIa B)†
General nutrition standards for foods and beverages marketed and advertised to children in any fashion, includingon-package promotion (IIa B)†
Regulatory policies to reduce specific nutrients in foods (eg, trans fats, salt, certain fats) (I B)†§
Physical activity
Labeling and information Point-of-decision prompts to encourage use of stairs (IIa A)†
Economic incentives Increased gasoline taxes to increase active transport/commuting (IIa B)†
Schools Multicomponent interventions focused on improving both diet and physical activity, including specializededucational curricula, trained teachers, supportive school policies, a formal PE program, serving of healthy foodand beverage options, and a parental/family component (IIa A)†
Increased availability and types of school playground spaces and equipment (I B)†
Increased number of PE classes, revised PE curricula to increase time in at least moderate activity, and trainedPE teachers at schools (IIa A/IIb A¶)†
Regular classroom physical activity breaks during academic lessons (IIa A)†§
Workplaces Comprehensive worksite wellness programs with nutrition, physical activity, and tobacco cessation/preventioncomponents (IIa A)†
Structured worksite programs that encourage activity and also provide a set time for physical activity during workhours (IIa B)†
Improving stairway access and appeal, potentially in combination with “skip-stop” elevators that skip some floors(IIa B)†
Adding new or updating worksite fitness centers (IIa B)†
(Continued)
1516 Circulation September 18, 2012
by guest on February 6, 2016http://circ.ahajournals.org/Downloaded from

A Need for Evaluation ofPopulation Interventions
Lifestyle behaviors are influenced by a myriad of individual,social, economic, regulatory, mass media, and other environ-mental factors. Population-based interventions can influencemany of these factors, with potential for broad and sustainedimpact.17–19 The present AHA scientific statement broadly refersto population approaches as any strategy that targets organiza-tions (eg, schools, worksites), communities, regions, or countriesrather than individuals. For example, such approaches werecritical for reducing tobacco use in several developed nationssince the 1950s.21,22 On the basis of this empiric success, agrowing number of recent research studies have investigatedhow population strategies can support behavior change toimprove lifestyle habits. Several studies have evaluated bothestablished and novel population approaches for reducing smok-ing, and an increasing number of studies are reporting on novelpopulation approaches for improving diet and physical activitybehaviors. Recent literature reviews or policy statements haveconsidered subsets of these various strategies.19,21–36 However,
most did not evaluate diet, physical activity, and smokingtogether in the same report, which could provide complementaryevidence on the effectiveness of various population approaches,and many did not systematically review the published literaturenor formally grade the strength of evidence.
A range of population, community, and school/workplaceintervention strategies are being implemented in theUnited States and elsewhere but often with limited evalu-ation. Because of limited funding and other resources forpreventive efforts, knowledge and grading of the mostevidence-based promising strategies are essential to informpriorities. Academic research centers, especially thosewith clinical and translational research awards, are alsobeing asked to focus more on translational projects thatimplement knowledge. Given the wide range of potentialpopulation strategies and the rapidly growing evidencebase evaluating them, it is essential to systematicallyreview these data to identify (1) which policies work andshould be implemented, (2) which policies are promisingand deserve further intensive investigation, and (3) whatcritical research gaps remain.
Table 1. Continued
Local environment Improved accessibility of recreation and exercise spaces and facilities (eg, building of parks and playgrounds,increasing operating hours, use of school facilities during nonschool hours) (IIa B)†
Improved land-use design (eg, integration and interrelationships of residential, school, work, retail, and publicspaces) (IIa B)†
Improved sidewalk and street design to increase active commuting (walking or bicycling) to school bychildren (IIa B)†
Improved traffic safety (IIa B)†
Improved neighborhood aesthetics (to increase activity in adults) (IIa B)†
Improved walkability, a composite indicator that incorporates aspects of land-use mix, street connectivity,pedestrian infrastructure, aesthetics, traffic safety, and/or crime safety (IIa B)†
Smoking
Media and education Sustained, focused media and educational campaigns to reduce smoking, either alone (IIa B) or as part of largermulticomponent population-level strategies (I A)†
Labeling and information Cigarette package warnings, especially those that are graphic and health related (I B)†‡§
Economic incentives Higher taxes on tobacco products to reduce use and fund tobacco control programs (I A)†‡§
Schools and workplaces Comprehensive worksite wellness programs with nutrition, physical activity, and tobacco cessation/preventioncomponents (IIa A)†
Local environment Reduced density of retail tobacco outlets around homes and schools (I B)†
Development of community telephone lines for cessation counseling and support services (I A)†
Restrictions and mandates Community (city, state, or federal) restrictions on smoking in public places (I A)†
Local workplace-specific restrictions on smoking (I A)†‡§
Stronger enforcement of local school-specific restrictions on smoking (IIa B)†
Local residence-specific restrictions on smoking (IIa B)†§
Partial or complete restrictions on advertising and promotion of tobacco products (I B)†
PE indicates physical education.*The specific population interventions listed here are either a Class I or IIa recommendation with an evidence grade of either A or B. The American Heart Association
evidence grading system for class of recommendation and level of evidence is summarized in Table 2. Because implementation of population-level strategies doesnot require perfect evidence but rather consideration of risks versus benefits, associated costs, and alternate approaches, the absence of any specific strategy hereindoes not mean it should not also be considered for implementation. See the more detailed tables and text below for further information on the evidence for eachof these interventions, as well as other strategies that were reviewed.
†At least some evidence from studies conducted in high-income Western regions and countries (eg, North America, Europe, Australia, New Zealand).‡At least some evidence from studies conducted in high-income non-Western regions and countries (eg, Japan, Hong Kong, South Korea, Singapore).§At least some evidence from studies conducted in low- or middle-income regions and countries (eg, Africa, China, Pakistan, India).�Based on cross-sectional studies only; only 2 longitudinal studies have been performed, with no significant relations seen.¶Evidence IIa A for improving physical activity; evidence IIb B for reducing adiposity.
Mozaffarian et al Population Approaches to Diet, Activity, and Smoking 1517
by guest on February 6, 2016http://circ.ahajournals.org/Downloaded from

MethodsSearch Strategies and Data ExtractionThe writing group searched for evidence of the effectiveness ofdifferent population approaches in changing dietary, physicalactivity, or tobacco use habits and related health outcomes. Thepresent report does not review which specific behavioral goalsshould or should not be targeted; these issues have beendiscussed extensively elsewhere.3,4,8–12 The report also does notattempt to describe all of the various policy interventions thatmight be sensible to consider or that have been or are beingimplemented. Rather, the report attempts to identify and assessthe evidence for the effectiveness of such interventions. Popu-lation strategies were considered in 6 broad domains: (1) Mediaand educational campaigns; (2) labeling and consumer informa-tion; (3) taxation, subsidies, and other economic incentives; (4)school and workplace approaches; (5) local environmentalchanges; and (6) direct restrictions and mandates. Observationalor interventional studies were included that evaluated how thesestrategies relate to or alter knowledge or attitudes toward diet,physical activity, or smoking; changes in these behaviors;changes in related risk factors (eg, blood cholesterol and glucose,blood pressure, obesity levels); or disease end points (eg,coronary heart disease [CHD], stroke, diabetes mellitus).
The writing group considered studies evaluating popula-tion strategies at organizational (eg, school, workplace),community, regional/state, or national levels. Notably, thereport excludes studies focused on individual-based associa-tions or interventions (eg, controlled trials in which the unit ofintervention was a person rather than a classroom, worksite,community, or region). The evidence for individual-basedapproaches for diet and physical activity change was re-viewed recently.16 The writing group also did not evaluate thefeasibility of implementation or cost-effectiveness, whichwas beyond the scope of the present report; the findings inthis report can inform such future investigation.
For each category of population intervention, the writinggroup first performed broad searches of online databases, includ-ing PubMed/MEDLINE, EconLit, AGRICOLA (AGRICulturalOnLine Access), ERIC (Education Resources Information Cen-ter), RePORT (National Institutes of Health Research PortfolioOnline Reporting Tools), and the Social Science Citation Index.These searches were followed by additional online searches,hand searches of citations, and use of expert contacts to identifysystematic or narrative reviews in the scientific literature, as wellas policy statements and guidance from the Institute of Medicine(IOM), World Health Organization (WHO), Centers for DiseaseControl and Prevention (CDC), US Department of Health andHuman Services, and other similar international, national, andlocal agencies. The evidence from these identified reviews andreports was evaluated as primary data if the reports includedsufficient descriptions of the methods for literature searches andthe methods and findings of included individual studies to permitinference on the quality and strength of evidence. If the reportsdid not meet these criteria, the original research studies cited inthese reports were obtained and evaluated individually. Finally,to obtain any recent relevant research not identified by thesemethods, the writing group performed systematic searches ofPubMed for all relevant English-language original research
articles published since January 1, 2007, using specified keywords and MeSH terms for each category of population inter-vention, together with searches of related articles and handsearches of citations. Full descriptions of these search criteria areavailable in the online-only Data Supplement.
For each category of population intervention, searches wereperformed and data extracted by teams of 2 to 3 investigators,with studies and data jointly reviewed in regular conferencecalls, emails, and a shared online Web site provided by theAHA. For each identified report, data were extracted on studydesign, population, type and duration of approach or interven-tion, duration of follow-up, outcomes, covariates, findings, andfactors related to quality of design or execution. Details of themajority of final included studies are provided in the extensiveSupplementary Tables accompanying this report.
The writing group also reviewed the evidence for health-care systems’ strategies for behavior change, although acomplete systematic review was beyond the scope of thepresent report. The writing group also reviewed surveillanceand monitoring systems for diet, physical activity, and to-bacco behaviors because of the importance of such systemsfor informing goals and designs of policy programs, under-standing and choosing appropriate metrics, monitoring theeffects of implemented policies, and elucidating current gapsor barriers in knowledge and methods.
Grading the Evidence for PopulationLifestyle StrategiesPopulation-based strategies are typically implemented as apolicy, whether volunteer or mandated and whether at organi-zational (school, worksite), community, city, or broader levels.Traditional policy evaluation often incorporates the CDC Eval-uation Framework,37 which considers the theory behind policystrategies38 and process evaluation. This framework principallyevaluates the process of creating policy change (eg, assessmentof stakeholder engagement, campaigns for public awareness togain momentum for policy change, recruitment of legislativechampions, barriers to success and how these are overcome,media placement, whether the policy actually passes) rather thanthe effects or impact of the policy on its intended target, such ashealth-related outcomes. Health impact assessments are increas-ingly being used as planning tools to foster consideration ofhealth needs in policy and program decisions, including sectorsnot traditionally focused on health.39,40
Evaluation of the effects of population-level strategies onhealth requires investigation in observational or interventionalresearch. Such evaluation is critical to understand the extent towhich specific interventions alter health; determine potential forsustainability; provide accountability to funding partners andstakeholders; improve and enhance future planning efforts; andassess whether there are any unintended consequences.
For the present report, potential metrics of interest includedhealth-related knowledge, behaviors, risk factors, and clinicalend points. Changes in knowledge alone were not consideredsufficient to merit evidence of efficacy. Although the long-term goals of many policy interventions often include de-creasing clinical cardiovascular end points and other lifestyle-related diseases, such effects may require years to becomefully evident. Such a timeframe may be impractical or too
1518 Circulation September 18, 2012
by guest on February 6, 2016http://circ.ahajournals.org/Downloaded from

costly for some types of evaluations. Given the considerableevidence on the impact of dietary, physical activity, andtobacco habits on risk of cardiometabolic diseases, changes inthe behaviors themselves were considered relevant outcomesfor assessing the effectiveness of population-level policies.Changes in intermediate risk factors affected by the behaviors(eg, levels of blood pressure, blood cholesterol, and adipos-ity) are also linked to disease risk and provided additionalrelevant outcomes for assessing effectiveness. Thus, thewriting group evaluated the evidence for the effects ofpopulation interventions on each of these relevant end points,including changes in health-related behaviors, risk factors,and disease end points.
For each type of population intervention, the overallevidence was reviewed and summarized, and these data werereviewed by all members of the writing group and gradedusing the AHA classification (Table 2). The writing grouprecognizes that evaluation of many population approachesdoes not lend itself well to typical medical-model controlledtrials, in which individuals are randomly assigned to double-blinded, isolated interventions such as drug treatment. Bynature, population interventions target groups or communi-ties, not individuals. Additionally, ethical and logisticalconsiderations often preclude the ability to perform random-ized trials at the level of discrete populations. Thus, evidencefrom multiple research paradigms was considered relevant,including results from ecological studies, observational stud-ies, natural experiments, and various interventions, includinguncontrolled, quasi-experimental, and cluster-randomized tri-
als. Well-designed quasi-experimental studies were consid-ered a particularly important means of evaluating the effec-tiveness of population interventions.
Where appropriate, the writing group considered whetherpopulation interventions could be evaluated alone or only aspart of a multicomponent strategy; the evidence for sustain-ability of behavior changes; and qualitative evidence forheterogeneity, that is, whether certain strategies were moreor less effective depending on other factors such as level ofintervention (eg, local, state, federal) or population of interest(eg, children, adults, the elderly, certain ethnic or socioeco-nomic subgroups). Sufficient data were not often found tosupport an inference on the potential heterogeneity of effi-cacy; where relevant, this evidence is presented.
ResultsThe writing group identified a vast body of literature provid-ing evidence on the potential effectiveness of various popu-lation interventions. The writing group found the design,methodology, and findings of each individual study to behighly relevant for considering and grading the evidence as awhole for any specific type of strategy. Thus, althoughpresentation of narrative summaries of each individual inves-tigation in the text was prohibitive, detailed summaries ofmany of the studies included in our assessment were com-piled. These summaries are provided in extensive supplemen-tary tables (Supplementary Tables, available in the online-only Data Supplement),which are cited throughout the text.
Table 2. Classification of Recommendations and Level of Evidence for Population-Level Interventions
The recommendation for any particularintervention is classified as follows*
Class I There is evidence for and/or general agreement that the intervention is beneficial, useful, and effective.The intervention should be performed.
Class II There is conflicting evidence and/or a divergence of opinion about the usefulness/efficacy of theintervention.
Class IIa Weight of evidence/opinion is in favor of usefulness/efficacy. It is reasonable to perform the intervention.
Class IIb Usefulness/efficacy is less well established by evidence/opinion. The intervention may be considered.
Class III There is evidence and/or general agreement that the intervention is not useful/effective and in some casesmay be harmful.
In addition, the weight of evidence insupport of the recommendation isclassified as follows:
Level of Evidence A Data derived from multiple randomized clinical trials or, given the nature of population interventions, fromwell-designed quasi-experimental studies combined with supportive evidence from several other types ofstudies.†
Level of Evidence B Data derived from a single randomized trial or nonrandomized studies.
Level of Evidence C Only consensus opinion of experts, case studies, or standard of care.
*Strength and consistency of the evidence were key considerations for setting the recommendation class, including across different types of study designs,permutations of the intervention strategy and related strategies, implementation settings, and outcomes, including behavioral, risk factor, and clinical endpoints.
†Because of practical and ethical challenges, evaluation of many population approaches does not lend itself well to typical, medical-model randomized controlledtrials. Well-designed quasi-experimental studies, such as time-trend data comparing behaviors and outcomes before versus after an intervention, especially whencombined with careful consideration of additional time-varying confounding variables and/or additional data on behaviors and outcomes in similar localities withoutan intervention, were considered a particularly important means to evaluate the effectiveness of population interventions. Consistent findings from severalwell-designed quasi-experimental evaluations across populations and outcomes, when combined with supportive evidence from other types of studies including atleast some randomized controlled trials demonstrating short-term efficacy of similar strategies, were considered sufficient to merit level of evidence A for populationinterventions.
Mozaffarian et al Population Approaches to Diet, Activity, and Smoking 1519
by guest on February 6, 2016http://circ.ahajournals.org/Downloaded from

Media and Educational CampaignsThe writing group considered the evidence for the effective-ness of media or educational campaigns at national, commu-nity, and school levels. A variety of media have been used,including television, radio, print, or billboard advertising;in-store media education; and leaflets mailed or delivereddoor-to-door. Interventions that simply provided informationon or near products, such as food labels, menu labeling, stairsignage, or warning labels on tobacco products, were consid-ered separately (“Labeling and Consumer Information”).
National, Community, and School-Based Media orEducational Campaigns to Improve DietSeveral focused media campaigns have been conducted toincrease knowledge about and consumption of specifichealthful foods (Supplementary Table 1). These include theUS 5-A-Day For Better Health! campaign to increase con-sumption of fruits and vegetables, initiated by the NationalCancer Institute with collaboration from industry and thefederal government. Cooperative agreements were estab-lished with a nonprofit organization representing farms,commodity groups, and distributors, including in-store andpromotional activities such as a licensed 5-A-Day logo.Reports on this campaign, although not always peer re-viewed,41,42 suggest some success. For instance, the national5-A-Day campaign, launched in 1991, was associated withincreased consumption of fruits and vegetables from �2.8 to4.3 servings per day between 1988 and 1999.41 In March2007, the new Fruits & Veggies—More Matters campaignfocused on women born between 1965 and 1979 withchildren living at home. In a 2010 survey, 18% of thesemothers were “definitely” aware of the campaign, and 38%reported being more likely to purchase a product having thecampaign logo; data were not reported on actual changes inconsumption.42 Similar focused media campaigns in Austra-lia were associated with increased public awareness andconsumption of fruits (from 1.5 to 1.7 servings per day,P�0.05) and vegetables (from 2.6 to 3.1 servings per day,P�0.001).43 In Pakistan, such campaigns led to improve-ments in dietary habits, such as reduced consumption of meatand increased consumption of fruits and vegetables.44
Long-term community- and school-based media and edu-cational campaigns have also been effective in improvingdietary habits of adults, school-aged children, and youngerchildren,45–48 as well as reducing adiposity and cardiovascu-lar risk factors in adults.49 Many of these educational cam-paigns used multiple strategies for communication. There-fore, the independent effects of specific educational strategies(eg, national media advertisements) versus other concordant(eg, supermarket-based) activities, are difficult to quantify.On the basis of the Consumer Information Processing model,the supermarket represents a useful venue to provide point-of-purchase nutrition information to promote healthy eat-ing.50 In 1 intervention,51 use of in-store public serviceannouncements about the 5-A-Day campaign for 4 weeks, incombination with a take-home audiotape, increased knowl-edge about the healthfulness of fruits and vegetables, as wellas self-reported consumption in the intervention group (6.2servings per day) compared with both baseline (5.4 servings
per day) and with shoppers in control stores (5.6 servings perday; P�0.05 for each).
Shorter-term (weeks to months) media campaigns, such asFighting Fat, Fighting Fit in the United Kingdom and similarprograms in the United States and Australia, have generallyincreased knowledge of healthy lifestyle messages, althoughsometimes less so in lower socioeconomic or minority sub-groups and typically with less clear evidence for actualbehavior change,52–54 although there were some exceptions inwhich behavior change was also demonstrated.55 Combiningshorter-term media campaigns with other means of moredirect communication or participation may increase effective-ness. In the Fighting Fat, Fighting Fit campaign, people whochose to register in a 6-month mail-based educational pro-gram increased their consumption of fruits and vegetables by1.3 servings per day, reduced their intake of fat and snacks,increased their physical activity, and lost an average of 2.3kg, lowering the prevalence of obesity by 11% (P�0.001 foreach compared with baseline).56 In the 5-A-Day campaign,sending newsletters with strategies for improving consump-tion of fruits and vegetables and goal-setting informationincreased the frequency and variety of fruit and vegetableconsumption.57
In an urban district of China’s third largest city, Tianjin, aneducational intervention to reduce the population’s consump-tion of sodium was implemented between 1989 and 1992.58
The main activities in the intervention neighborhoods in-cluded training of healthcare personnel about sources andeffects of salt sources on blood pressure and on how toprovide practical advice to patients, community education bymeans of door-to-door distribution of leaflets, distribution ofposters and stickers to food retailers, and introduction oflower-sodium salt in some retail stores. In the interventionneighborhoods, mean sodium intake decreased by 22 and11 mmol/d in men and women, respectively, compared withincreases of 18 and 4 mmol/d, respectively, in the controlneighborhoods (P�0.001 for men, P�0.065 for women).These changes did not vary by education or occupation.Compared with control neighborhoods, systolic blood pres-sure decreased in the intervention neighborhoods by5 mm Hg in men (P�0.065) and 6 mm Hg in women(P�0.008). In North Karelia, Finland, a media- andeducation-based community intervention successfully re-duced consumption of butter, whole-fat dairy, nonlean meats,and salt and increased consumption of vegetable-oil marga-rine and vegetable oils, low-fat dairy, lean meats, vegetables,berries, and fruit.59,60 Targeted dietary habits improved sub-stantially, with associated declines in population blood cho-lesterol and blood pressure levels and rates of CHD.59,60
Three community-based health educational programs wereevaluated in the 1980s in the United States, with a majorfocus on media and education to improve multiple cardiovas-cular risk factors simultaneously. The Stanford Five-CityProject tested a 5-year community-based program that incor-porated behavior change theory (social learning theory, acommunication-behavior change model), community organi-zation principles, and social marketing methods. After 3 to 5years of intervention, compared with controls, the interven-tion communities saw improvements in several cardiovascu-
1520 Circulation September 18, 2012
by guest on February 6, 2016http://circ.ahajournals.org/Downloaded from

lar risk factors, including lower blood cholesterol, bloodpressure, resting heart rate, weight gain, and smoking prev-alence.49 In contrast, similar media and education strategies inthe Minnesota Heart Health Program and the Pawtucket HeartHealth Program did not lead to significant improvements incardiovascular risk factors or events compared with controlcommunities.61–63 In the latter 2 studies, secular improve-ments in risk factors were also seen in the control communi-ties, perhaps in response to similar national campaignstargeting these risk factors; these trends may have limiteddetection of any added effects of the community-levelinterventions.
These US community programs did not have a strongemphasis on complementary population strategies, such asthose related to taxation, subsidies, direct restrictions, ormandates. In comparison, community and national programsin Finland, Singapore, and Mauritius used media and educa-tional campaigns as central elements of larger multicompo-nent interventions that leveraged other strategies, such asalterations in physical environments and changes in taxationand subsidies, to support a healthful lifestyle.60,64,65 Forexample, after 1977, when the North Karelia project wasextended nationally, the original media- and education-focused approach was supplemented with substantial focuson changing the food environment by means of voluntaryagreements with industry, changes in food subsidies andtaxation, and government-supported programs to increaselocal production and consumption of fruits and vegetables(“Taxation, Subsidies, and Other Economic Incentives”; “Di-rect Restrictions and Mandates”).60 Targeted dietary habitsimproved substantially, with associated substantial declinesin population blood cholesterol levels, blood pressure levels,and rates of CHD.59,60
In the nation of Mauritius, a national prevention programwas launched to reduce major risk factors by promotinghealthier diets, increased exercise, smoking cessation, andreduced alcohol intake.65 Media and education efforts weremajor components, including extensive use of mass mediaand widespread community, school, and workplace educationactivities. Legislative restrictions and mandates were alsointroduced to improve cooking oils. From 1987 to 1992,moderate leisure-time physical activity increased from 16.9%to 22.1% in men and from 1.3% to 2.7% in women. Cigarettesmoking decreased from 58.2% to 47.2% in men and from6.9% to 3.7% in women. Heavy alcohol use also declinedsubstantially, from 38.2% to 14.4% and 2.6% to 0.6%,respectively. The effects of legislative measures on cookingoils are discussed in Direct Restrictions and Mandates. In this5-year period, the prevalence of hypertension was reducedfrom 15.0% to 12.1% in men and from 12.4% to 10.9% inwomen. Mean population serum total cholesterol fell by 15%,from 5.5 to 4.7 mmol/L (P�0.001).
Singapore instituted a sustained multicomponent interven-tion in 1992 that combined extensive media/education ap-proaches with school, workplace, and environmental strate-gies and collaboration with food industry to produce healthierfood choices.64 An evaluation of national trends between1998 and 2004 demonstrated significant declines in theprevalence of smoking, hypertension, hypercholesterolemia,
and type 2 diabetes mellitus and significant increases inregular exercise. No relevant comparison or control groupswere available. However, another community-based, multi-component intervention that included education of multiplestakeholders as well as changes in school and communityenvironments demonstrated reductions in age-adjusted bodymass index (BMI) of children in the intervention communitycompared with control communities.66
In sum, the evidence from ecological studies, quasi-experimental studies, and cluster-randomized trials indicatesthat focused national, community, and school-based mediaand educational campaigns are effective in increasing knowl-edge and consumption of specific healthful foods, with someevidence from several studies for associated reductions inadiposity and other cardiovascular risk factors (Table 3).Some of these studies had follow-up of many years todecades, which suggests that behavioral changes are sustain-able when the media and educational campaigns are contin-ued. Such campaigns appear to be most effective when theyare focused on specific foods, implemented for many years,use multiple modes for communication and education, and, ifshorter-term, incorporate other means of more direct commu-nication to or involvement by the public. Broad community-based media and educational programs that target multiplecardiovascular risk factors and behaviors simultaneouslyhave been less successful, which suggests the importance offocused messages for the target audience. This is a majorpremise of social marketing, which uses a consumer orienta-tion to behavior change: Incorporation of research from thetarget population, testing of different strategies and channelsof delivery, and integration of marketing principles (eg,product, place, promotion) into the intervention.67 Media andeducation have also been prominently featured as one part ofsuccessful multicomponent approaches at both national andcommunity levels; their relative contribution to the overallsuccess is difficult to separate in such multicomponentinterventions.
National, Community, and School-Based Media orEducational Campaigns to Increase Physical ActivitySeveral media and educational campaigns have been used topromote physical activity. Examples in the United Statesinclude VERB, a national social marketing campaign coor-dinated by the CDC to increase and maintain physical activityamong 9- to 13-year-olds68; the Play 60 Challenge, a partner-ship between the AHA and the National Football League toencourage children to perform 60 minutes of daily physicalactivity; and the American Association of Retired Persons’(AARP’s) Active for Life: Increasing Physical Activity Lev-els in Adults 50 and Older campaign, a social marketingcampaign to increase moderate physical activity among olderadults.69 Statewide and community-level campaigns havealso been developed, typically mass media strategies involv-ing multiple mediums such as television, radio, newspaper,billboard, or transit ads.53,70,71 In quasi-experimental (pre/post) evaluations, such campaigns generally improved self-reported measures such as awareness of the campaign,changes in attitudes toward activity, and, in a few studies,self-reported general activity levels.72,73 For example, in an
Mozaffarian et al Population Approaches to Diet, Activity, and Smoking 1521
by guest on February 6, 2016http://circ.ahajournals.org/Downloaded from

evaluation of the national VERB campaign, 6 communitiesreceived more intensive advertising and marketing because ofincreased funding and donated media time.74 Compared witha control community receiving the usual national campaign,children in the intervention communities reported higherlevels of awareness and understanding of VERB and greaterfree-time physical activity at 2 years. The effectiveness ofsuch programs for more rigorously or objectively measuredphysical activity or related risk factors has generally not beenassessed. A review of such media campaigns by the US TaskForce on Community Preventive Services concluded thatthere was “insufficient evidence to determine the effective-ness of mass media campaigns, when used alone, to increasephysical activity or improve fitness because of a smallnumber of studies with inconsistent findings and methodolog-ical limitations.”75
As described above, several intensive community-levelmedia and educational interventions have also attempted toalter physical activity as part of a more comprehensive set ofhealth factors and behaviors.49,61,62 These interventions pro-duced mixed results, with benefits on risk factors seen in 1study49 but without clear benefits in the other 2 studiescompared with secular trends.61,62 Multicomponentcommunity-level interventions that combine media and edu-cation with other approaches, such as environmental changes,to encourage healthier diets and more physical activity haveled to reductions in adiposity in children,66 but the effective-ness of the media/education component on physical activityas such is less clear.
In sum, the findings from these studies indicate thatfocused media and education strategies improve awarenessand attitudes about physical activity and, in at least somequasi-experimental studies, self-reported physical activity
(Table 3). Media and educational campaigns may be lesseffective when multiple health behaviors are targeted simul-taneously. Conversely, the combination of a focused mediaand education strategy with other approaches, such as envi-ronmental changes, may hold the most promise; furtherinvestigation of these combinations in multiple target popu-lations is needed.
National, Community, and School-Based Media orEducational Campaigns to Reduce Tobacco UseSeveral comprehensive reviews and other recent reports haveevaluated the evidence for the effects of anti-tobacco mediaand educational campaigns (Supplementary Table 2).76–85 Allof these reviews have concluded that such campaigns canincrease negative attitudes about smoking, reduce initiation ofsmoking among youth, and promote smoking cessationamong active smokers. The impact can be substantial. Forexample, the CDC reviewed the effects of several stateprograms.77 California’s focused anti-tobacco media educa-tion program was associated with large reductions in smokingacross several racial/ethnic groups between 1990 and 2005,including declines from 20% to 15% in Asian men, from 22%to 16% in Hispanic men, and from 28% to 21% in black men.In Florida, a youth tobacco prevention program that includeda major mass media component led to significant declinesafter just 1 year, including absolute declines in currentcigarette use of 3.5% in middle school students and 2.2% inhigh school students.
Such campaigns are most effective when combined withother community, school, and healthcare system–based strat-egies (Table 3). As part of such combined strategies, mediaand education components have generally been estimated toaccount for at least 20% of declines in tobacco use. Factorsthat increase effectiveness include greater duration and dose
Table 3. Media and Educational Campaigns*
Class/Evidence Grade
Diet Sustained, focused media and educational campaigns, using multiple modes (eg, print, radio, Internet,television, social networking, other promotional materials), focused on increasing consumption ofspecific healthful foods
I B
Sustained, focused media and educational campaigns, using multiple modes, for reducingconsumption of specific less healthful foods/beverages
IIa B
Sustained, focused media and educational campaigns as part of multicomponent community ornational strategies to increase consumption of specific healthful foods/beverages or reduceconsumption of less healthful foods/beverages
I B
Shorter-term community-based media and educational programs that target multiple cardiovascularrisk factors and behaviors simultaneously
IIb B
On-site supermarket and grocery store educationalal programs to support purchase of healthier foods IIa B
Physical activity Sustained, focused media and educational campaigns, using multiple modes, to promote physicalactivity
IIb B
Shorter-term community-based media and educational programs that target multiple cardiovascularrisk factors and behaviors simultaneously
IIb B
Smoking Sustained, focused media and educational campaigns as part of larger multicomponentpopulation-level strategies†
I A
Sustained, focused media and educational campaigns alone† IIa B
*Several of these strategies overlap with other population approaches and could be categorized in multiple areas (other Tables). For example, school- andworkplace-based educational strategies are reviewed in School and Workplace Approaches. Given the scope of topics covered in this report, the writing group couldnot review evidence for every type of intervention, eg, evidence for media and educational campaigns to reduce sedentary activities.
†Factors that increase effectiveness include greater duration and dose of exposure to the media campaign and use of strong negative messages about health.
1522 Circulation September 18, 2012
by guest on February 6, 2016http://circ.ahajournals.org/Downloaded from

of exposure to the media campaign and use of strong negativemessages about health. To maximize success, the CDCestimated that such approaches must have sufficient reach,frequency, and duration to reach 75% to 85% of the targetaudience each quarter and run at least 6 months to increaseawareness, 12 to 18 months to have an impact on attitudes,and 18 to 24 months to influence behavior.77
Sustained campaigns appear to be important. From 2000 to2003, Minnesota implemented a high-profile media campaignthat successfully reduced smoking among youth. However,when the program was discontinued, youth’s awareness of themessage declined, and the likelihood of youth initiatingsmoking increased from 43% to 53% within 6 months.77
Similar findings have been seen when several other anti-tobacco media campaigns were discontinued.86
In sum, there is strong evidence that anti-tobacco mediaand educational campaigns are effective for fostering nega-tive attitudes about smoking, reducing smoking initiationamong youth, and promoting smoking cessation among activesmokers, especially when sustained and when combined withother population-level strategies.
Labeling and Consumer Information
Labeling/Information and DietSeveral labeling and information approaches have been used toimprove food purchasing choices. Strategies have includedproviding the content of selected nutrients on food labels, use offront-of-pack product labels or icons to highlight specific nutri-ents or provide overall summaries of healthiness, and listing ofcalories or specific nutrients on restaurant menus. For instance,the US Nutrition Labeling and Education Act of 1990 mandatedthe use of nutrition labels in the form of a standardized“Nutrition Facts” panel on most food packages. In 2005 to 2006,�60% of US adults reported using the nutrient data on theNutrition Facts panel, and approximately half reported looking atthe ingredient list and serving size information.87
Although industry has done extensive research on the impactof labeling and marketing in store environments, these data arenot publically available for evaluation. Some research has alsobeen done by academic investigators. Several observationalcross-sectional studies and limited longitudinal studies haveevaluated factors associated with the use of nutrition labels andwhether their use relates to dietary habits (Supplementary Table3).87–94 Generally, women more than men and also people withgreater education, existing chronic disease, greater awareness ofdiet-disease relations, or counseled by their physician to changetheir diet were more likely to report using nutrition labels to helpmake decisions about foods. Greater reported use of food labelswas inconsistently associated with certain dietary habits, such aslower consumption of added sugars, total fat, and total caloriesand higher consumption of fruits, vegetables, and dietary fiber.In many cases, these differences were observed only for use ofspecific nutrient information on the food label; for example, onlyuse of sugar information on the label, rather than general use ofthe food label, was associated with lower consumption of addedsugar. Some studies did not show any association betweenreported awareness or use of the food label and many or alldietary habits. Additionally, aspects of the food label were
demonstrated to be confusing to consumers, for example, rela-tions between sodium content and salt content.
In part because of the disappointing evidence on the effectsof food labels on dietary behaviors, a growing number ofinitiatives are attempting to provide more focused and clearinformation in the form of front-of-pack labels or icons. Forexample, since 1995 the AHA has operated a nationallabeling program that allows industry to add a “Heart Check”package icon to products that meet specific AHA nutritionalguidelines. In a national survey among 1004 grocery shoppersconducted in February 2009, 83% reported that this labelaided in their awareness of the healthfulness of products; 63%reported trusting this more than any other label or icon; and41% reported looking for this label before purchasing foods(D. Milne, AHA Quantitative Consumer Research, writtencommunication, November 21, 2011). In 2006, the UnitedKingdom Food Standards Agency recommended that UnitedKingdom food retailers and manufacturers place front-of-pack “traffic light” icons on products in a range of categories.Other examples include the mandating of front-of-pack label-ing in the Netherlands (Choices International Foundation,www.choicesprogramme.org),95 Sweden (the Swedish Key-hole),96 and New Zealand (Pick the Tick).97 Sodexo, thelargest caterer in Europe, has voluntarily adopted the “inter-national choices” logo, a front-of-pack stamp based onfood-category specific criteria on saturated fat, trans fat,sodium, added sugar, and dietary fiber content, as well astotal calories.98 India, Poland, and Israel are working to adopta local variant of the Choices International system, and theMexican government is also creating a front-of-pack label tomark healthier choices. A recent government-sponsored sci-entific panel in Australia also reviewed the general rationale,principles, and practical aspects of food labeling, althoughnot the evidence for effects on consumer behavior.99 In theUnited States, the IOM is reviewing front-of-pack nutritionrating systems, considering the purpose and merits of thedifferent programs and the nutrition criteria that underliethem.100,101 The next phase report will assess which icons aremost effective, develop conclusions about systems and iconsthat best promote health and how to optimize their use, andconsider potential benefits of a single, standardized front-of-pack food guidance system regulated by the US Food andDrug Administration.100,101
Limited studies have evaluated the impact of focusedfront-of-pack labels on consumer behavior (SupplementaryTable 3). Several cross-sectional observational studies havebeen performed on correlates of reported and observed use offood labels and front-of-pack logos,102 consumer recogni-tion,103 and purchasing behavior in supermarkets104 related tofront-of-pack logos. Generally, these observational studieshave found that people who report greater attention to healthconcerns are more likely to report using the logo andpurchasing products with the logo. Causation cannot beassessed in such cross-sectional studies; that is, shopperspredisposed to purchasing a healthier food may report usingthe logo, rather than the logo influencing the purchase.
Simplified front-of-pack or point-of-purchase labels oricons have been evaluated in several interventional studies. Ina quasi-experimental intervention in the United Kingdom, a
Mozaffarian et al Population Approaches to Diet, Activity, and Smoking 1523
by guest on February 6, 2016http://circ.ahajournals.org/Downloaded from

front-of-pack icon label for healthfulness had no effect onsales of specific products in supermarkets in the 4 weeksbefore versus after introduction of the icons.105 A similaruncontrolled study in New England supermarkets demon-strated statistically significant but small changes in foodpurchasing at 1 and 2 years after implementation of anin-store, on-shelf version of a front-of-pack icon system.106
One controlled acute (single meal) intervention demonstratedthat food labels reduced total calories consumed at a buffetlunch, but this was a small study (n�47) among motivatedvolunteers.107 A larger (n�420) acute (single meal) con-trolled intervention demonstrated that front-of-pack foodlabels resulted in improved recognition of more versus lesshealthful foods but did not alter which foods were selected bysubjects.108 Two longer-term (3–4 weeks) controlled inter-ventions found no effects on sales of labeling low-fat foodchoices in a vending machine located in a teachers’ lounge109
or placing front-of-pack logos on foods in worksite cafete-rias.110 In a 12-month controlled intervention, the addition ofa low-fat label (with or without promotional signage) tosnacks in vending machines located in high schools andworksites had minimal effects on sales.111
A limited number of quasi-experimental studies suggestthat labeling in combination with additional environmentalchanges may be effective. A combined environmental andlabeling intervention, both increasing healthier options whilealso labeling calories, energy density, and macronutrients onall foods sold in a worksite cafeteria, led to a reduction intotal calories consumed at lunch.112 In a quasi-experimentalstudy at a large US hospital, foods and beverages werelabeled with simple color codes (red, yellow, green) based onUS Department of Agriculture (USDA) food pyramid guide-lines.113 After 3 months, sales of “red” products decreased by9.2%, including 23.1% lower sales of sugar-sweetened bev-erages, and sales of “green” products increased by 4.5%(P�0.001 each). Total sales at the cafeteria did not change,and no changes were seen in sales of these different foods at2 smaller comparison cafeterias that did not institute labeling.
Many foods, such as those sold in cafeterias and restau-rants, are promoted on menus rather than in a package orsetting conducive to a label or logo. In the United States,more than half of all food dollars are spent on such foodsprepared away from home, including at restaurants, fast-foodchains, cafeterias, and other public places.5 Such foods wereexempted from the US Nutrition Labeling and Education Actof 1990. As a result of the new US healthcare reform law,retail food establishments with �20 locations, includingchain restaurants, coffee shops, grocery stores, bakeries, andvending machines, will be required to post calories on menusand have available other nutritional information.
Both observational and quasi-experimental studies haveevaluated the impact of point-of-purchase information, suchas menu or menu board listing of calories and/or nutrients, onfood-purchasing behavior (Supplementary Table 4). In obser-vational analyses, customers who report both seeing andusing posted calorie information purchase fewer total caloriesthan other customers,114,115 although such findings can belimited by reverse causation (ie, calorie-conscious customersmay pay more attention to menu postings rather than the
postings themselves altering calorie consciousness). Interven-tional studies have also been performed. In a review of earlierinterventional studies published through 2003, the authorsconcluded that the design and reporting of many of thesestudies were suboptimal.116 In a short-term study amongcollege students, posting the caloric content of entrees in acollege cafeteria for 14-days led to selection of entrees withlower kilocalories without reducing overall sales revenue.117
Similarly, a short-term comparison of meals purchased atfull-service restaurants in Washington State found that addingcaloric and nutrient information to menus was associated withselection of entrees that were lower in calories, fat, andsodium during the next month.118 Conversely, a study thatshowed adolescents restaurant menus with and without ca-loric information produced relatively small theoreticalchanges in behavior, with only 1 in 5 adolescents selecting alower-calorie or lower-fat alternative when menus had postedinformation.119 Similarly, the posting of caloric informationfor foods and beverages on menu boards of New York Cityfast-food restaurants was associated with increased self-reported awareness of calorie information115 but did not affectaverage calorie consumption by patrons of these restaurantsin low-income areas of New York City compared with eitherpre-menu labeling consumption or with consumption incontrol areas in Newark, NJ.120 In a controlled trial, theaddition of caloric information to a fast-food menu also didnot alter food selection or consumption at a single mealamong adolescents and adults who were regular patrons offast-food restaurants.32 In a systematic review of randomizedcontrolled trials (RCTs) evaluating workplace interventionsto improve lifestyle and health,121 2 trials that provided fatand/or fiber information on foods in worksite vending ma-chines or cafeterias demonstrated small increases in con-sumption of fiber or fruits and vegetables. Conversely, a1-year controlled trial found no effects of listing caloricinformation on foods at the worksite cafeteria on dietaryconsumption or adiposity.122,123 The writing group did notidentify any other studies that investigated the effects ofmenu labeling on other risk factors such as adiposity ormetabolic risk factors.
Some evidence from natural experiments suggests thatfront-of-pack icons and nutrient labels may influence industrybehavior by leading to product reformulations. After thelaunch of a voluntary industry program for a simple “healthychoice” front-of-pack logo in the Netherlands, existing foodswere reformulated and new products were launched to alterseveral nutrients.124 For example, sodium was reduced inprocessed meats, sandwiches, and soups; dietary fiber wasincreased in fruit juices, processed meats, dairy products,sandwiches, and soups; and saturated fat and added sugarwere reduced in dairy products.124 Contemporaneous withmandates to add trans fat content to food labels in Canada andthe United States, many products were reformulated byindustry to reduce or eliminate trans fat.125,126 The impact ofthe labeling per se versus increased consumer and mediaattention surrounding the policy change or other factorscannot be differentiated; for example, in both of these studies,many food products served at restaurants that did not requirelabeling were also reformulated.125,126
1524 Circulation September 18, 2012
by guest on February 6, 2016http://circ.ahajournals.org/Downloaded from

In sum, there is limited evidence that labeling and infor-mation approaches, including nutrient facts labels, simplifiedor summary front-of-pack product labels/icons, or point-of-purchase (eg, menu) listing of calories or specific nutrients,have consistent meaningful effects on dietary behaviors ofconsumers (Table 4). Indeed, for nutrition facts panels, thereis reasonable evidence for little to no effect on diet or evencontribution to confusion. Although between 20% to 80% ofadults in various studies report using food label nutrition oringredient information, front-of-pack icons, or menu labelingto make food choices, with differences by sex, education, andunderlying disease status (Supplementary Table 3), there islimited objective evidence that these labels or icons produceactual dietary change or alter other diet-related risk factors,especially over the long term. Efficacy may be limited by thelittle time that many people spend when selecting foods forpurchase and by a limited understanding of food labels oricons and point-of-purchase information in some subgroups,such as the elderly, men, and those with lower education orliteracy. Simple point-of-purchase icons in cafeterias appearpromising when combined with additional environmentalchanges to alter diet; further investigation is needed indifferent settings and with longer follow-up. Interestingly,labeling and information approaches may be effective forinfluencing industry to reformulate their products, which canimprove dietary habits by altering the characteristics andavailability of different foods and beverages.
Labeling/Information and Physical ActivityFew studies of labeling/information and physical activitywere identified. The use of signage to increase use of stairs asa part of overall physical activity has produced small changesin this behavior, for example, at worksites or shoppingcenters. Displaying signs with either health or weight-controlmessages for 1 month increased the percentage of people whoused the stairs: People �40 years of age increased their use ofstairs from 4.6% at baseline to �6.0%, and those �40 yearsof age increased their use of stairs from 5.1% to �8.4%.127 Inanother intervention, motivational posters or banners encour-aging use of stairs, when posted next to escalators adjacent to
stairs, increased stair use from 2.4% at baseline to 4%(posters) and 6.7% (banners); this increase was sustained at10 weeks after signage was removed.128,129 Incorporation ofmotivating messages was found to increase use of stairs from8.1% to 18.3% over a 6-week intervention.130 In a nonran-domized intervention in a predominantly Hispanic US-Mexico border community, posters at open-area staircases invarious community sites (eg, airport, bank, library, office)produced small increases in stair use among women (absoluteincreases of �1% to 6%), with mixed results (both increasesand decreases) among men.131 In another trial, use of labeling(eg, posters, bulletin boards) to encourage use of stairs at aworksite did not significantly increase physical activity com-pared with controls.121 In sum, these studies indicate thatmotivating signage can increase use of stairs, but the effectsappear modest, and relatively few controlled or long-termstudies have been performed (Table 4).
Labeling/Information and Smoking
Warning Labels on Cigarette PacksObservational, quasi-experimental, and short-term controlledstudies have been performed to evaluate the effectiveness ofwarning labels on cigarette packs (Supplementary Table 5).These studies demonstrate that warning labels are mosteffective in countering the attractiveness and persuasivenessof cigarettes when they are visually noticeable,132,133 avoidthe use of chemical names or ingredients,134 are specificrather than general,135 include pictorial and especiallygraphic136 warnings, are attributed to a specific source (eg,“medical studies,” “the Ministry of Health”) rather thanunattributed,137 and are provided at appropriate literacy lev-els.138 Smokers with greater education are more likely torecall printed warnings on cigarette packages.139
Observational evidence suggests that warning labels areeffective for increasing awareness of health risks and reduc-ing smoking. An international survey that included adultsmokers from the United States, United Kingdom, Canada,and Australia demonstrated that smokers who noticed thewarnings were more likely to endorse health risks and that
Table 4. Labeling and Consumer Information*
Class/Evidence Grade
Diet Detailed nutrition facts panels on packaged foods and beverages III B
Simplified front-of-pack or point-of-purchase labels or icons to support healthier choices, such as a“healthy choice” icon, “traffic light” label, or monochrome or colored Guideline Daily Amount label, onpackaged foods or in grocery stores, cafeterias, vending machines, or restaurants
IIb A†
Menu labeling at restaurants or cafeterias to provide consumers with calorie or other nutrient informationon in-store menus and menu boards
IIb A
Mandated nutrition facts panels or front-of-pack labels/icons as a means to influence industry behavior andproduct formulations
IIa B
Physical activity Point-of-decision prompts to encourage use of stairs IIa A‡
Smoking Cigarette package warnings, especially those that are graphic and health related I B
*Several of these strategies overlap with other population approaches and could be categorized in multiple areas (other Tables). Given the scope of topics coveredin this report, the writing group could not review evidence for every type of intervention, eg, evidence for labeling of cigarette packages for nicotine and tar contentsor delivery, point-of-purchase warnings or messages about harm of tobacco use, or rating movies on the presence or depictions of smoking.
†On the basis of a limited number of quasi-experimental studies, the evidence grade is IIa B when such labeling is combined with additional environmental changes,such as availability and locations of types of foods sold in cafeterias.
‡On the basis of modest effect sizes in short-term, quasi-experimental studies; relatively few controlled or long-term studies have been performed.
Mozaffarian et al Population Approaches to Diet, Activity, and Smoking 1525
by guest on February 6, 2016http://circ.ahajournals.org/Downloaded from

knowledge of health risks was greater in countries with moremandated government warnings.140 As new warnings havebeen added and updated, smokers have reported that thewarnings increased their motivation to quit, reduced theirlikelihood of purchasing cigarettes, and made them smokeless overall.141 Smokers who report noticing warning labelsalso report greater intentions to quit141 and higher stages ofchange and self-efficacy.142 Quasi-experimental evidencesupports these findings.133,143 Notably, industry and tradedocuments indicate that the reverse tactic, for example, thepromotion and labeling of “light” or “low-tar” cigarettes bycigarette companies, has been highly successful in increasingthe use of such cigarettes by consumers.144
In sum, there is relatively limited long-term evidence fromnatural experiments or interventions on the effectiveness oflabeling alone in reducing smoking, perhaps because differentpopulation approaches to reducing smoking (eg, education,labeling, taxation) have often been adopted in combination.However, the available evidence indicates that warning labelsare effective at increasing awareness of health risks, counter-ing attractiveness of cigarette advertisements and packages,and also reducing amounts of smoking (Table 4). Awarenessof warning labels is also linked to intentions and readiness forcessation, although the directionality of this latter associationhas not been established.
Taxation, Subsidies, and OtherEconomic IncentivesThere is considerable interest in potential economic ap-proaches to improve diet, physical activity, and tobacco-related behaviors.145–148
Food Pricing: Direct Taxes or SubsidiesConventional wisdom often holds that healthier foods aremore expensive than less healthy foods, supported by someanalyses of costs on a per-calorie basis.149,150 However, lesshealthful foods often contain more calories and are moreenergy-dense than many healthful foods such as fruits orvegetables, leading to somewhat circular conclusions on aper-calorie basis. Some investigations based on types of foodsand overall eating plans, rather than costs per calorie, alsosupport higher average prices for healthier foods.151,152 Con-versely, several other investigations have not found consistentprice differences between more versus less healthy foods.153–156
Additionally, research evaluating a variety of predictors suggeststhat prices of otherwise similar foods can vary substantially dueto non-intrinsic factors, such as the type of store in which theyare sold.157–159 Prices also vary substantially by whether the foodis from a supermarket or preprepared, with less healthy foodsfrom fast-food outlets costing more, even on a per-calorie basis,than healthy foods from local supermarkets.160 Perceptions arealso relevant. In a study among adults of lower socioeconomicstatus, perceptions of lower availability and higher price ofhealthier foods, rather than actual availability or price, wereassociated with fewer healthful food purchases.161
There has been growing interest in the potential role oftaxes or subsidies to decrease intake of less healthy foods/beverages or increase intake of healthier foods/beverages.
This interest has been partly driven by the success of pricingpolicy for tobacco control, as described below. In the UnitedStates, taxes on less healthy foods or beverages already exist:17 states have specific taxes on soft drinks and syrups, fruitdrinks, candy, and/or gum.162 The primary goals of thesetaxes were to generate state income, often traced to WarRevenue Acts during World War I, rather than to improvehealth. Amounts have been generally small, ranging frompennies per gallon of soft drinks to several percentage pointsin sales taxes. Nonetheless, total annual revenue from suchtaxes can be substantial, for example, up to $200 million peryear in Texas.162 Effects of these existing US taxes onconsumption have not been assessed systematically.
Economists have evaluated how price influences choices(price elasticity) in the food sector for decades, often to assistproducers or consumers rather than because of health consid-erations.163 Ideally, full-demand systems should be used forsuch analyses, which evaluate not only the effects of a pricechange on consumption of the corresponding food/beveragebut also the effects on all other categories of foods/bever-ages.164 For instance, a single price change could affectconsumption of the food or beverage itself (eg, coffee), itscomplements (eg, cream or sugar), and its substitutes (eg,tea).163,165 Unfortunately, such full-demand evaluation hasbeen infrequently performed for dietary factors.
A systematic review of 160 studies assessed the observa-tional relations of food prices with demand and consumptionbehavior in major food categories in the United States.Consumption of foods eaten away from home, soft drinks,juice, and meats had the strongest associations with pricedifferences across regions (r��0.7–0.8).166 All of thesewere cross-sectional studies, and only a few examined bothdirect and cross-price elasticity or effects on total energyintake.
Reviews of cross-sectional analyses have concluded thatsmall taxes would have little effect on consumption of lesshealthy foods or beverages or related risk factors.31 Forexample, a simulation approach estimated that at lower taxrates (eg, 1 cent per kilogram or 1% of value), the effects ofad valorem taxes on salty snack foods would have smalleffects on sales.167 Conversely, the authors calculated thatsuch taxes would generate up to $100 million in annual taxrevenues that could be used for prevention programs. Largerprice increases appear to be more effective at alteringconsumption. On the basis of data from the systematic reviewdescribed above, the authors estimated that a 10% increase inthe price of sugar-sweetened beverages would decrease con-sumption by 8% to 10%.166 Similarly, on the basis oflongitudinal analyses evaluating price increases and de-creases and dietary changes in a cohort of young adults, an18% tax on sugar-sweetened beverages (an amount that hadbeen proposed in New York City) would be estimated tosignificantly lower consumption per person.168 Consistentwith these observational studies, in a multiphase interven-tional study in a hospital cafeteria, a 35% price increase forsugar-sweetened beverages reduced sales by 26% comparedwith both baseline and with a comparison cafeteria.169
1526 Circulation September 18, 2012
by guest on February 6, 2016http://circ.ahajournals.org/Downloaded from

Evidence suggests that price-related reductions in con-sumption of less healthful foods are replaced, at least notfully, with other price-constant similar foods or beverages. Ina cross-sectional analysis among adolescents, each 10%greater price for a fast-food meal was associated with a 3%higher probability of fruit and vegetable consumption, a 0.4kg/m2 lower BMI, and a 5.9% lower prevalence of beingoverweight.170 In a longitudinal study among young adults,price increases and decreases and multiple cross-elasticitiesand their substitutions were evaluated over 20 years.168
Increases in prices of sugar-sweetened beverages and foodsconsumed away from home were associated not only withdecreases in consumption but also with lower total energyintake, body weight, and insulin resistance. On the basis ofthis analysis, an 18% tax on sugar-sweetened beverageswould be estimated to produce an average annual relativeweight loss of 0.99 kg per person over 20 years. Thesefindings suggest that price-related reductions in consumptionof higher taxed items were not fully compensated for byincreased consumption of other similar beverages or foods.
In addition to taxation of foods to decrease consumption,there is interest in subsidizing or lowering prices of morehealthful foods to increase their consumption. In observa-tional analyses, lower prices of fruits and vegetables wereassociated with greater intake of these foods,171 as well aswith lower BMI,170,172 including in prospective studies.173
One analysis estimated that a 10% price subsidy would leadlow-income US consumers to increase their intake of bothfruits and vegetables by �2% to 5%, at a total cost of � $310million for fruits and $270 million for vegetables.174 On thebasis of food consumption data and demand elasticity in theUnited Kingdom, it was estimated that the combination oftaxing less healthy foods and using this revenue to subsidizethe price of fruits and vegetables would sufficiently alterconsumption to prevent �6000 deaths attributable to CVDand cancer each year.175
Several interventional studies have evaluated whether low-ering the prices of healthier food options increases theirconsumption by consumers. In a small quasi-experimentalstudy in a worksite cafeteria, compared with environmentalchanges (adding healthy options, food labels), the furtheraddition of small pricing incentives and nutrition educationdid not further alter food purchases.112 Another quasi-experimental worksite cafeteria intervention demonstratedthat more substantial subsidies on healthier foods and dishes,which lowered prices by 20%, led to significant increases inpurchases of these foods while decreasing purchases ofunsubsidized, less healthy foods.176 A controlled trial evalu-ated the effects of larger price subsidies on food sales fromvending machines in 24 secondary schools and worksites inMinnesota.111 In randomized 4-week intervention periods,price reductions of 10%, 25%, and 50% on low-fat snackswere associated with significant increases in sales of theseproducts of 9%, 39%, and 93%, respectively. Promotionalsignage alone to recommend low-fat options had relativelysmall effects on sales. An 18-month controlled trial inmetropolitan vending machines demonstrated that the com-bination of lower relative prices (a reduction of �31%) andincreased relative availability (�55%) of healthier foods
more than doubled their sales.177 In another intervention, a50% reduction in the price of fresh fruit and baby carrots insecondary school cafeterias produced a 4-fold and 2-foldincrease in the sales of these foods, respectively, comparedwith the usual prices.178 In a controlled trial among 602postpartum women enrolled in the Special SupplementalNutrition Program for Women, Infants and Children (WIC),women assigned to intervention groups received a subsidy($10 per week in farmers’ market or supermarket foodvouchers) to purchase fruits and vegetables; women in thecontrol group received a similar voucher for diapers.179 Thesubsidy was given for 6 months, after which participants weremonitored for another 6 months to evaluate sustainability. At6 months, consumption of fruits and vegetables was signifi-cantly higher in the intervention groups than in control groups(overall, 7.8 versus 4.8 servings per day, P�0.001). Sixadditional months after the intervention ended, this increasewas sustained (7.5 versus 4.9 servings per day, P�0.001).
Interestingly, at least 2 of these interventions suggestedthat the effects of food subsidies might be sustained, at leastweeks to months, after subsidies were removed.176,179 Thissuggests that changes in preferences for healthy foods, onceestablished, may be at least partly sustainable.
In addition to observational studies and shorter-term inter-ventions, national interventions and natural experiments fur-ther suggest that changes in food pricing can substantiallyalter risk of clinical events, with effects evident withinrelatively short time frames. For example, several EasternEuropean countries experienced dramatically divergent in-creases or decreases in cardiovascular mortality in the yearsafter the fall of the Soviet Union.180 The best predictor ofthese changes was the degree of increased consumption ofvegetable oils, in particular, those containing plant-derivedomega-3 fats, in place of animal fats. These differences inconsumption were related to between-country differences inchanges in subsidies and pricing of fats and oils.180 Also, asdescribed above, coordinated changes in agricultural, sub-sidy, and taxation policies in Finland led to decreasedconsumption of animal fats and increased consumption ofvegetable oils and berries, with substantial and sustainedreductions in population CVD risk factors and incidence.59,60
External factors can influence price elasticities of dietarychoices. For example, economic downturns or other pressuresmight impact purchasing behavior to make consumers moresensitive to price differences or, alternatively, to make lessexpensive, processed, calorie-dense foods more appealing tosome consumers. Changes in social and cultural norms, forexample, through education, are also important to maximizethe long-term impact of price changes on consumerbehavior.181
In sum, the evidence indicates that changes in prices ofspecific foods and beverages alter their consumption, withadditional supportive evidence from observational studiesand natural experiments for corresponding changes in diet-related risk factors and clinical events (Table 5). In some butnot all studies, vulnerable populations such as youth andpeople of lower socioeconomic status appear most sensitiveto prices. The overall effects are proportional to price differ-ences, with relatively larger price changes being linked to
Mozaffarian et al Population Approaches to Diet, Activity, and Smoking 1527
by guest on February 6, 2016http://circ.ahajournals.org/Downloaded from

more meaningful differences in consumption. In addition tothe health impact of taxation that results from decreasedconsumption of less healthy foods and beverages, the addi-tional health impact of the tax revenue for funding preventionprograms and/or subsidizing increased consumption ofhealthier foods must also be considered.
Agricultural PolicyA great deal of research over the past century has focused onUS and European agricultural policy.148 Several foods tradi-tionally supported by agricultural policy, such as wheat, corn,dairy, and beef, are typically more energy-dense and lessnutrient-dense, served in larger portion sizes, and, in somecases, less expensive on a per-calorie basis than foods lesssupported by agricultural policy, such as fresh fruits andvegetables, whole grains, nuts, and fish.148,182,183 Many sub-
sidized crops have also historically been diverted for use asinexpensive feed for meat production. Soy has also beensubsidized; vegetable oils in moderation are, of course,healthy.8
Some scholars have concluded that simply removing agri-cultural subsidies from foods or commodities would signifi-cantly shift prices and limit their presence in the foodsupply.182 This work has generally been based on analyses ofcurrent pricing and recent price trends, together with ob-served links between limited social and economic resourcesand disparities in access to healthier foods, without consid-eration of the complex history of agricultural subsidies, theaccompanying systems to increase prices of similar importcrops, and the current types of subsidies and groups whobenefit from the current subsidies.
Table 5. Taxation, Subsidies, and Other Economic Incentives*
Class/Evidence Grade
Diet† Subsidy strategies to lower prices of more healthful foods and beverages I A
Tax strategies to increase prices of less healthful foods and beverages IIa B
Changes in agricultural subsidies to encourage certain crops (eg, fruits, vegetables) and/or reduceother major commodity crops as a means to alter consumption
IIb C
Changes in both agricultural subsidies and other related policies to create infrastructure thatfacilitates production, transportation, and marketing of healthier foods, sustained over severaldecades
IIa B
Sustained individual financial disincentives for adiposity or poor diets (eg, higher insurancepremiums or deductibles, other surcharges) and/or financial incentives for healthier weight orbetter diets
IIb C
Shorter-term (nonsustained) workplace-based financial incentives to employees to promotehealthier diets
IIb A
Financial incentives to support building of supermarkets and grocery stores in underserved areas IIb C‡
Direct, nonsustained individual financial incentives for improved diet or weight loss IIb A§
Sustained individual financial disincentives for poor diet as assessed by adiposity (eg, differencesin insurance premiums, deductibles, or surcharges)
IIb C
Tax incentives to employers to offer comprehensive worksite wellness programs with nutrition,physical activity, and tobacco cessation/prevention components
IIb C
Physical activity† Tax incentives for individuals to purchase exercise equipment or health club/fitness memberships IIb C
Increased gasoline taxes to increase active transport/commuting IIa B
Direct, nonsustained individual financial incentives for increased activity/fitness or weight loss IIb A§
Sustained individual financial disincentives for adiposity or lower activity/fitness (eg, differences ininsurance premiums, deductibles, or surcharges)
IIb C
Tax incentives to employers to offer comprehensive worksite wellness programs with nutrition,physical activity, and tobacco cessation/prevention components
IIb C
Smoking Higher taxes on tobacco products to reduce use and fund tobacco control programs I A
Direct, nonsustained individual financial incentives for tobacco cessation IIb A§
Sustained individual financial disincentives for tobacco use and/or financial incentives forcessation or nonuse (eg, differences in insurance premiums, deductibles, or surcharges)
IIa C
Tax incentives to employers to offer tobacco cessation/prevention or comprehensive worksitewellness programs including tobacco cessation/prevention components
IIb C
*Several of these strategies overlap with other population approaches and could be categorized in multiple areas (other Tables). Given the scope of topics coveredin this report, the writing group could not review evidence for every type of intervention.
†See Table 7 for local community built-environment strategies that could be directly influenced by financial or economic incentives, such as (for diet) numbersand locations of supermarkets or fast-food restaurants, types of foods available in retail outlets, availability of community gardens and farmers’ markets, etc, and(for physical activity) building of parks, transport systems, land-use mix, etc.
‡This class/evidence grade is for effects of such financial incentives on diet and related health outcomes. The class/evidence grade for effects of neighborhoodavailability of supermarkets and grocery stores on diet and related health outcomes is I B and IIb B, respectively (Table 7).
§Behavior changes often do not persist after financial incentives are removed, and these strategies also appear to work less well for complex behaviors such asdiet or weight loss.
1528 Circulation September 18, 2012
by guest on February 6, 2016http://circ.ahajournals.org/Downloaded from

Several economists have explored the role of agriculturalpolicy in the price, availability, and portion sizes offoods.148,184–187 In general, analyses focusing on recent USpolicy have concluded that over the past 2 decades, agricul-tural subsidies alone have not distorted the relative costs offruits and vegetables and other foods relative to animalproducts, sugars, and edible oils.184–187 Rather, a major effectof these agricultural subsidies is income transfer to farmers.According to the Organization for Economic Cooperation andDevelopment, 29% of income of farmers in Western coun-tries comes from government subsidies, trade interventions,or direct income transfers.188 These analyses suggest thatsimple removal of current subsidies from unhealthier com-modities would not have any major impact on food prices atleast over several years.
In contrast to these relatively focused effects of subsidies,the array of other long-term US agricultural and relatedpolicies and investments over the past century have createdan entire framework of production, distribution, marketing,and demand that facilitates lower cost of less healthful,processed foods relative to healthful foods such as fruits,vegetables, nuts, legumes, and fish.148,185–187,189,190 Examplesof such investments include grain elevators, marketing assis-tance, favorable tax policies, and credit and commodityprograms. Adjusted to 1992 dollars, total US public invest-ment in agriculture rose from $500 billion in 1940 to $2.5trillion in 1990, with very little of this spent on directagricultural subsidies.189
These historical trends suggest that comprehensive andsustained changes in multicomponent agricultural policieshave a large impact on diet. This is supported by experiencesin Finland, in which the national extension of a regionalmedia and education campaign to improve diet was accom-panied by modifications over time of several existing agri-cultural, subsidy, and taxation laws over time to support theproduction of healthier foods.60 For instance, taxation policiesthat favored dairy products and subsidies that supportedbutter (eg, direct subsidies to bakeries) and dairy fat weremodified to support mixed vegetable oil and light spreads andgreater production of lean meats and protein. Also, a nationalBerry and Vegetable Project was developed to increase thefeasibility of growing local berries.59 The Ministries ofAgriculture and Commerce financed a major collaborativeproject that included berry farmers, industry, various com-mercial sectors, and health authorities. In addition to mediaand education to increase consumption, this project supportedsales campaigns, the development of new berry products, andrelated relevant activities. Over the period of the project,many Finnish farmers switched from dairy to berry produc-tion, and berry production and consumption rose nationallyfrom initially very low levels. These changes in the foodsupply, together with related media and educational cam-paigns, were associated with substantial reductions in popu-lation CVD risk factors and rates of CVD events.59,60 Addi-tional government budget policies were developed in the2000s to support domestic vegetable consumption and otherhealth-related food innovations60; the specific impact of thesenew policies has not yet been reported.
In sum, the present evidence suggests that changes incurrent US agricultural subsidies alone will produce marginalchanges in food availability, prices, or population dietaryhabits (Table 5). In contrast, experience over the past centurysuggests that sustained efforts over several decades that alterboth agricultural and other related policies to create aninfrastructure that facilitates production, transportation, andmarketing of healthier foods will have greater long-termimpact.
Financial Incentives or Disincentives to Reduce AdiposityThere is growing interest in direct incentives for overweightor obese people to reduce their body weight, for example, bydirectly taxing BMI or by providing rewards for weight loss.Although this is being done increasingly in a range ofindustry insurance and wellness programs (“Workplace-Based Economic Incentives for Employees and Businesses”),it has not been implemented in any free-living populationoutside of such programs.
Financial Incentives to Influence Locations ofSupermarkets or Grocery StoresThe evidence for the influence of the local food environment,including locations and availability of different types ofstores and restaurants, on dietary habits and related riskfactors is reviewed in “Local Environmental Change for Diet(Community Settings).”
Economic Incentives/Subsidies to PromotePhysical ActivityIn modern societies, there is often a real or perceived timecost to performing physical activity.191 Because people mustperceive value to create this time, it is possible that economicincentives could be used to help promote physical activityand recreation.
Incentives to purchase exercise equipment, for example,have been proposed as a means to increase physical activ-ity.192 However, there are no data to determine whether taxincentives for purchase of this equipment have a behavioralor health impact.193,194 The price of gasoline has also beenproposed as a key factor that could influence individuals’transportation choices, including modes of transit such aswalking and biking. Gasoline consumption is responsive toprice changes,195–197 and thus increasing the price of gascould theoretically reduce driving and possibly increasemodes of active commuting.198–200 One cross-sectional ob-servational analysis in Europe found a significant inverseassociation between gasoline price and prevalence of obe-sity.201 Another analysis evaluated pooled data from theBehavioral Risk Factor Surveillance System (BRFSS) sur-veys from 1990 to 2001 to assess the cross-sectional relationsbetween gasoline prices, urban sprawl, and bicycling.202 EachUS $1 increase in gasoline price was associated with absoluteincreases of 0.4% (from 4.3% to 4.7%) and 0.6% (from 2.9%to 3.5%) in the prevalence of bicycling among men andwomen, respectively.202 A longitudinal study using clinic-based US data from 1992 to 2001 found that increases ininflation-adjusted gasoline price were associated with in-creased total physical activity, roughly equivalent to 20
Mozaffarian et al Population Approaches to Diet, Activity, and Smoking 1529
by guest on February 6, 2016http://circ.ahajournals.org/Downloaded from

minutes of additional walking per week for each 25-centincrease per gallon.203 Similarly, a recent study using USsurveillance data from 1979 to 2004 found that each addi-tional $1 in gas prices was associated with additionalwalking.204
In sum, some evidence suggests that changes in gasolineprices could influence physical activity, but more research isneeded because of the limited number of studies and theirtypically cross-sectional designs (Table 5). Otherwise, relativelylittle evidence exists to evaluate the effectiveness of tax incen-tives or subsidies to promote physical activity or minimizesedentary behaviors. Evidence for economic incentives forphysical activity in the workplace setting is reviewed else-where (“Workplace Economic Incentives for Individuals”).
Taxes to Reduce Tobacco UseIn the United States, the cigarette tax increased by 62 cents toa total of $1.01 per pack on April 1, 2009.205 Federal tax ratesalso increased on other tobacco products such as smokelessproducts, roll-your-own tobacco, and cigars. Many states alsoimpose tobacco excise taxes, with a current nationwideaverage of $1.45 per pack as of July 2010. New York Stateraised its cigarette tax by $1.60 in June 2010, giving it thehighest US rate at $4.35 per pack. Tax rates are much lowerin most developing countries, resulting in lower total price. In2006, the average total price per pack was $4.30 in high-income, $1.50 in middle-income, and $1.10 or less in lowermiddle- and low-income countries.206
Global trends in cigarette affordability (price relative to percapita income) were investigated in 70 countries (28 high-income developed countries and 42 developing countries) be-tween 1990 and 2001.207 Cigarettes were more expensive butalso relatively more affordable in developed countries becauseof the higher per capita income. An update of this analysis in 77countries through 2006 found that in high-income countries,cigarettes became less affordable beginning in 1990, whereasamong low-income and middle-income countries, cigarettesbecame more affordable, at an increasingly rapid rate since2000.206 For example, affordability of cigarettes increasedgreatly in the Philippines, Mexico, Vietnam, China, and Russia.In 33 of 34 countries in which cigarette affordability decreased,real price increased. In 20 of 37 countries in which affordabilityincreased, real price decreased.
A robust literature has examined the impact of increases incigarette tax on prevalence of smoking, especially in youth.The majority of studies have found that higher taxes reduceconsumption, including reducing the prevalence of activesmoking and increasing cessation rates, especially amongyoung smokers.208–210 When affordability elasticities of de-mand were evaluated in 70 countries between 1990 and 2001,each 1% increase in the relative income price (the inverse ofcigarette affordability) was estimated to decrease cigaretteconsumption by between 0.49% and 0.57%.207 In the UnitedStates, modeling techniques have estimated that a 40%increase in cigarette prices because of taxes would reducesmoking prevalence from 21% in 2004 to 15.2% in 2025,producing large gains in cumulative life-years (7 million) andquality-adjusted life-years (13 million) and a total costsavings of $682 billion.211
In sum, there is strong evidence that higher tobacco taxesreduce consumption, both overall and in particular amongyouth (Table 5). Industry documents demonstrate that to-bacco companies understand the impact of tax increases onconsumption and have developed pricing strategies that couldpartly counter these effects, such as development of lower-cost generics and price-related marketing efforts such asmultipack discounts and couponing.212 For maximum impact,tobacco tax policies will need to adapt to these industrystrategies.
Workplace Economic Incentives for IndividualsIn March 2010, the Patient Protection and Affordable CareAct codified an existing statute that allows employers tocharge employees a differential health insurance premiumbased on meeting certain health status factors such as BMI,tobacco use, or physical fitness or activity levels within thecontext of a worksite wellness program.213 The maximumdifferential was increased from 20% to 30%, with discretionfor the Secretaries of Health and Human Services andTreasury to increase the differential to 50% if deemedappropriate. Consequently, employers can charge deductiblesthat are up to 30% higher for employees who are obese orwho use tobacco, whereas nonobese employees, nonsmokers,or those who are physically fit can pay lower deductibles.This could translate to increased annual health insuranceexpenditures of $965 to $2412 for individuals and $2675 to$6688 for families for those not meeting these health met-rics.214 A recent survey indicated that because of risinghealthcare costs and the new allowance under the federal law,62% of employers plan on switching from incentives forparticipation to incentives for improvements in health met-rics, shifting costs from healthy employees to their lesshealthy counterparts.215 The premise is that these financialincentives/disincentives will motivate employees to take per-sonal responsibility for their own health and improve theirbehaviors and health status over the short and long term.
Experiments testing financial incentives to improve healthbehaviors have generally been individual-level randomized trialsrather than population-level interventions, for example, at theworkplace or community level. These studies demonstrate thatfinancial incentives can improve health behaviors in the shortterm, especially when financial incentives are larger.216–219
Examples of incentives in these studies included compensationranging from $100 to $400 for completion of smoking cessationprograms with biochemical verification of quitting or incentivesfor weight loss ranging from $7 to $14 for each percentage pointof weight lost. Generally, incentives led to greater participationand completion rates, successful cessation in smoking cessationprograms at 3 months, and greater weight loss, ranging from 0.9to 2.25 kg at 3 months. However, these differences generally didnot persist at longer follow-up (eg, 6 months) after the incentiveprograms had ended.
One review identified 9 individual-level RCTs with afollow-up of at least 1 year that used traditional pay-for-performance incentives for weight loss among overweight orobese adults.220 Intervention durations were typically from 8to 16 weeks, although in some trials the interventions lasted
1530 Circulation September 18, 2012
by guest on February 6, 2016http://circ.ahajournals.org/Downloaded from

throughout follow-up. A pooled analysis found no significanteffect of use of financial incentives on weight loss ormaintenance at 12, 18, or 30 months. Secondary analysessuggested that effects might be greater when incentives werelarger (eg, �1.2% of personal disposable income), whenrewards were given for behavior change rather than forweight change, and when rewards were based on groupperformance rather than individual performance, but none ofthese differences were statistically significant. Another re-view identified 14 studies that tested workplace interventionsincluding incentives or competitions to reduce tobacco use.221
In pooled analysis, a significant reduction in self-reportedtobacco cessation was seen. However, because nearly allinterventions were multicomponent, the specific contributionof the incentives alone could not be evaluated. Additionally,because rewards were generally short-term, the long-termsustainability has not been established.222
A review of economic incentives relating to a largerspectrum of preventive behaviors, such as seat belt use,examined 111 individual-level RCTs and included 47 studiespublished from 1966 to 2002 that met the authors’ criteria.223
The researchers found that economic incentives worked much(73%) of the time, especially for short-term and simplepreventive care with distinct and well-defined behavioraloutcomes, such as immunizations and health screenings, butworked less well for more complex and long-term behaviorsrelated to diet or weight loss.223 These studies did not providesufficient data to determine the size of the incentive requiredto maintain a sustained effect because of the wide diversity ofincentives offered, including coupons, free bus tokens, cashprizes, promotional items, merchandise, and free day care.Also, some of the incentives were confounded with additionallottery or competition intervention components, and many ofthese studies were limited by small numbers of participants,cross-sectional designs, or very modest awards.224
In sum, individual financial incentives appear to produceimprovements in health behaviors, but gains are lost when theincentives are no longer offered (Table 5). The potentiallong-term effects of sustained incentive/disincentive systems,such as related to health insurance premiums or deductibles,need to be further assessed. The CDC will release a report by2013 based on employer data that will analyze the effective-ness of premium-based and cost-sharing incentives in chang-ing health behavior and the effectiveness of different types ofrewards on the impact of incentives within employer-basedworksite wellness programs. Sparse data are available on theeffectiveness of other workplace-based incentives for im-proving physical activity, although many such programsexist, for example, subsidization of gym memberships orannual purchases of fitness equipment. These findings implya need for further research on long-term incentive programsand policies for sustained behavior changes.
Workplace Economic Incentives for BusinessesEconomic incentives can also be provided to businesses topromote healthful behaviors. For example, the Patient Pro-tection and Affordable Care Act authorizes a grant programto small businesses to provide worksite wellness programs.This grant program has not been fully implemented, and thus
its effectiveness cannot be evaluated. Other proposed legis-lation has included tax incentives to businesses for offeringrobust worksite wellness programming. Until these programsare implemented or legislation regarding tax incentivespasses, insufficient data exist to evaluate the impact of thesetypes of incentives on wellness programming or healthbehaviors (Table 5).
School and Workplace Approaches
School-Based Approaches to Improve Both Diet andPhysical ActivityMany school-based approaches have been tested that targetboth dietary and physical activity habits in a combinedintervention (Supplementary Table 6).36,225–228 In such stud-ies, the primary outcome is typically adiposity as measuredby an age- and sex-appropriate BMI (BMI z score), ratherthan changes in diet or physical activity in themselves thatwould have additional health benefits beyond changes inBMI.
One systematic review identified 20 such RCTs havinginterventions of at least 12 weeks’ duration, conducted inages ranging from kindergarten through high school.225 Over-all, about half of the studies (9 of 20) demonstrated signifi-cant improvements in BMI z score after a school-basedprogram targeting both dietary and physical activity behav-iors. A WHO review of 55 intervention studies, mostly fromNorth America, concluded that multicomponent school-basedinterventions can effectively improve knowledge and atti-tudes about diet and physical activity, diet and physicalactivity behaviors, and related clinical outcomes.36 On thebasis of this review, specific components of such interven-tions with evidence for effectiveness included (1) curriculumon diet and/or physical activity taught by trained teachers, (2)supportive school environment and policies, (3) a parental orfamily component, (4) a formal physical activity program,and (5) serving of healthy food options in school cafeteriasand vending machines. More recent trials, including 3- to4-year interventions from Europe and China, generally sup-port these conclusions, although sometimes only in certainsubgroups or for certain outcomes.227–231
In sum, the evidence supports the effectiveness of suchcomprehensive multicomponent school-based interventionsthat target both diet and physical activity (Table 6). Emergingliterature suggests that the effectiveness of such interventionsmay be further augmented by additional intensive communityinvolvement based on the principles of community-basedparticipatory research.232
School-Based Approaches to Improve DietSeveral studies have evaluated various school-based strate-gies to improve diet (Supplementary Table 6).225,233–238 Out-comes have included knowledge and attitudes toward andconsumption of specific foods, such as fruits and vegetablesand sugar-sweetened beverages, and related risk factors suchas high BMI. Multicomponent interventions that target bothdiet and physical activity are described above.
Effects of garden-based education programs in schoolshave been evaluated in at least 10 controlled trials andquasi-experimental studies, with an additional 3 studies
Mozaffarian et al Population Approaches to Diet, Activity, and Smoking 1531
by guest on February 6, 2016http://circ.ahajournals.org/Downloaded from

Table 6. School and Workplace Approaches*
Class/Evidence Grade
Diet† Schools
School garden programs, including nutrition and gardening education and hands-on gardeningexperiences
IIa A
Fresh fruit and vegetable programs that provide free fruits and vegetables to students during the schoolday
IIa A
Multicomponent interventions focused on improving both diet and physical activity, including educationalcurricula taught by trained teachers, supportive school policies, a formal PE program, serving of healthyfood and beverage options in school cafeterias and vending machines, and a parental or familycomponent
I A
School-based educational initiatives alone, without other components IIb A
Restricted accessibility (eg, locations, times of use) to school vending machines IIb B
Provision of cold filtered water and reusable water bottles at schools, with education and promotion ofwater use
IIb B
Workplaces
Comprehensive worksite wellness programs with nutrition, physical activity, and tobaccocessation/prevention components
IIa A�
Worksite cafeteria or vending machine prompts, labels, or icons alone to make healthier choices IIb B
Increased availability of healthier food/beverage options and/or strong nutrition standards for foods andbeverages served, in combination with vending machine prompts, labels, or icons to make healthierchoices
IIa B
Physical activity† Schools
Multicomponent interventions focused on improving both diet and physical activity, including educationalcurricula taught by trained teachers, supportive school policies, a formal PE program, serving of healthyfood and beverage options in school cafeterias and vending machines, and a parental or familycomponent
IIa A
Increased availability and types of school playground spaces and equipment I B
Increased number of PE classes, revised PE curricula to increase time in at least moderate activity, andemployment of trained PE teachers at schools
IIa A‡IIb A‡
Regular classroom physical activity breaks during academic lessons IIa A§
Increasing active commuting to school, eg, a walking school bus program with supervised walkingroutes to and from school
IIb B
Workplaces
Comprehensive worksite wellness programs with nutrition, physical activity, and tobaccocessation/prevention components
IIa A�
Structured worksite programs that encourage activity and also provide a set time for physical activityduring work hours
IIa B§
Improving stairway access and appeal, potentially in combination with “skip-stop” elevators that skipsome floors
IIa B§
Adding new or updating worksite fitness centers IIa B§
Smoking Comprehensive worksite wellness programs with nutrition, physical activity, and tobaccocessation/prevention components
IIa A�
See Table 7 for local environment changes and Table 8 for smoking restrictions related to schools andworkplaces¶
PE indicates physical education.*Several of these strategies overlap with other population approaches and could be categorized in multiple areas (other Tables). Given the scope of topics covered
in this report, the writing group could not review evidence for every type of intervention, eg, evidence for increasing coverage of and participation in school lunchprograms, creating after- or before-school activity programs, regulatory policies to limit screen time in preschool and after-school programs, or curricula on hazardsof smoking taught by trained teachers at school.
†See Table 4 for strategies related to labeling and information approaches to increase consumption of more healthful foods and beverages in cafeterias and vendingmachines and to increase use of stairs; see Table 5 for economic incentives for employees or businesses to improve diet and increase physical activity.
‡IIa A for improving physical activity; IIb B for reducing adiposity.§The evidence is sufficiently consistent for a Class IIa recommendation but only based on a small number of studies, and additional research is required.�Although studies have varied in methodological quality, have been modest in size (n�400 each), and typically have not evaluated sustainability beyond 6 to 12
months, interventions targeting higher-risk employees appear especially effective.¶See Table 7 for reducing density of tobacco retail outlets around schools. See Table 8 for smoking restrictions on school campuses, restrictions on tobacco
advertising and promotion, and increased enforcement of anti-tobacco regulations around schools. See Table 5 for economic incentives for individuals or businessesto reduce tobacco use and Table 8 for smoking restrictions at workplaces.
1532 Circulation September 18, 2012
by guest on February 6, 2016http://circ.ahajournals.org/Downloaded from

evaluating community-based garden programs for chil-dren.233–235 These garden programs typically included weekly1-hour nutrition and gardening classes, plus hands-on time inthe garden several times per month. Overall, the garden-basedprograms significantly increased preferences for fruits and veg-etables in 4 of 8 studies, willingness to try new fruits andvegetables in 4 of 5 studies, and levels of consumption of fruitsand vegetables in 4 of 5 studies.233–235
Two trials evaluated the effects of a fresh fruit andvegetable program, in which intervention schools receivedfree fresh fruits and vegetables for snacks during theschool day.237,239 Both studies demonstrated significantincreases in fruit consumption. For example, the propor-tion of students eating fruit or drinking 100% fruit juice atleast once a day was significantly increased in the inter-vention versus control schools (59% versus 41%) in 1 trial;the proportion eating fruit or drinking 100% fruit juice atleast twice a day was also increased (39% versus 27%).237
In the other trial, average fruit consumption increased by0.34 servings per day; interestingly, fruit consumptionoutside of school also increased by an additional 0.27servings per day.239 Vegetable consumption did not in-crease in either intervention, perhaps due to taste prefer-ences or because fewer choices of vegetables were offeredto students (carrots and celery) compared with fruits(apples, oranges, pears, plums, pineapple, and kiwi).
Two trials using school-based nutrition education alonewithout any additional components demonstrated improve-ments in knowledge, preferences, and attitudes towardconsumption of fruits and vegetables, but findings weremixed for changes in actual consumption.234,240 In asystematic review of school-based randomized educationalinterventions to reduce adiposity, 2 of 3 trials evaluatingdietary policies demonstrated stabilization of BMI z scoreor overweight/obesity in the intervention groups comparedwith continued increases in these measures in controls.225
The 2 successful trials used low-intensity educationalinterventions focused on (1) reducing intake of sugar-sweetened beverages and (2) increasing regular consump-tion of breakfast. The third trial used a board game toimprove nutrition knowledge, failing to show any effectson adiposity. Another cluster-randomized trial in 10 USschools evaluated a comprehensive educational initiativethat included school self-assessment, nutrition education,nutrition policy, social marketing, and parent outreach.238
After 2 years, the intervention lowered the incidence ofoverweight by 50% (7.5% versus 14.9%).
Several intervention studies have evaluated the effects ofproviding cold filtered water at school. One RCT demon-strated that installation of school water fountains and provi-sion of plastic water bottles, together with education andgoal-setting components, increased water consumption by 1.1glasses per day and also reduced the odds of overweight by31% in German elementary school children after 1 schoolyear.241 Two small, nonrandomized pilot studies showed thatsimilar interventions increased water intake by students butdid not reduce intake of other beverages such as soda, sports
drinks, or juice242,243; changes in weight were not assessed inthese short-term (�3 months) studies.
Several cross-sectional observational studies have evalu-ated how school vending machines relate to dietary habits(Supplementary Table 7). Factors predicting greater use ofschool vending machines included either very high or lowparental limits on intake of sugar-sweetened beverages athome244 and the absence of school restrictions on times of useof vending machines.245 The presence of beverage vendingmachines at school was associated with a nearly 3-fold higherlikelihood of students consuming snacks or beverages or bothin place of lunch and a greater likelihood of their choosingless healthy options, although other healthy foods and bev-erages were available.246 Students who frequently usedschool vending machines (�3 times per week) were 3 timesmore likely to buy sugar-sweetened beverages and candymore than once daily.245 The writing group did not identifyany RCTs that tested the effects of changes in school vendingmachines (availability, restrictions, prices, or types of foods)on dietary habits or related risk factors in children. One trialevaluated the effects of labeling low-fat choices in vendingmachines in teachers’ lounges,109 and another evaluated theeffects of increasing the proportions of lower saturated fat,nonconfectionery choices in vending machines in hospi-tals.247 Labeling demonstrated generally small to no effectson purchasing, whereas altering the types of foods availablein the machines correspondingly altered the proportions ofthose types of foods sold.
In sum, several school-based approaches appear to beeffective for improving diet, including garden-based educa-tional programs, fresh fruit and vegetable programs, environ-mental changes or standards that increase healthy foodoptions in cafeterias and vending machines, and comprehen-sive multicomponent interventions focused on both diet andphysical activity (Table 6). There is currently less robustevidence for other approaches, such as school-based educa-tion alone, restrictions on accessibility of school vendingmachines, or promotion of use of water.
School-Based Approaches to Improve Physical ActivityImproving physical activity has been a major focus of manyschool-based studies (Supplementary Table 6). In a prospec-tive observational analysis among US children monitoredfrom first to fifth grade, meeting the recommended time forrecess was associated with lower BMI z scores, and meetingthe recommended time for physical education (PE) wasassociated with lower BMI z scores in boys but not girls.248
Potential strategies to foster physical activity have includedincreased availability and types of playground equipment; theaddition of regularly scheduled classroom activity breaksduring academic lessons; increasing time and intensity in andusing trained teachers for PE classes or, for younger children,in recess and play time; or increasing active commuting toschool. Multicomponent strategies that target both diet andphysical activity are discussed in “School-Based Approachesto Improve Both Diet and Physical Activity.”
In cross-sectional observational studies, the availabilityand types of school playground equipment were associatedwith extent and types of physical activity behaviors. In 1
Mozaffarian et al Population Approaches to Diet, Activity, and Smoking 1533
by guest on February 6, 2016http://circ.ahajournals.org/Downloaded from

analysis, compared with schools not having these factors,greater moderate daily physical activity was seen in schoolswith fixed playground equipment (eg, slides, monkey bars)and visible playground markings, and greater vigorous phys-ical activity was seen in schools with loose equipment (eg,balls, bats) and playground supervision.249 A second studyfound that the number of different permanent play facilities atschools (swings, courts, sandpits, monkey bars, slides, etc)was positively associated with physical activity assessed byaccelerometers.250 For each additional play facility (range, 14to 35), average accelerometer counts were 3.8% higher atschool (P�0.001) and 2.7% higher overall (P�0.001), andtime spent in vigorous physical activity was 9 minutes (3.4%)higher each day. The presence of each additional 5 playfacilities was associated with 15% to 20% higher overallactivity levels in children. Consistent with these observationalstudies, a controlled intervention among 26 elementaryschools in the United Kingdom demonstrated that the addi-tion of playground markings, sports and playground equip-ment, and greater supervision increased vigorous physicalactivity during recess.251
Four intervention studies have assessed the potential effec-tiveness of classroom activity breaks—short physical activitybreaks throughout the day during the periods of academiclessons.252–255 In 3 studies assessing changes in physicalactivity over intervention periods of 12 weeks to 3 years,students in the intervention classrooms increased their phys-ical activity during school, whether assessed by question-naire, pedometer, or accelerometer.253–255 A fourth 1-yearstudy found improvements in objectively assessed strengthbut not in flexibility or cardiorespiratory fitness.256 Three ofthese studies assessed change in BMI: 1 study found reducedBMI in girls but not boys,254 1 study found no significantdifference in intervention versus control schools,255 andanother found significantly increased BMI in the interventiongroup.256 Differences in adiposity versus lean muscle masswere not assessed in these studies. Classroom breaks havealso been used as part of successful multicomponent school-based interventions targeting physical activity.227,257,258
A large number of studies have focused on improving PEin schools, typically by updating PE curricula, adding morePE classes, and training teachers, and often with furthereducational or home-based components (Supplementary Ta-ble 6).225,257,259–261 In controlled trials, such multicomponentinterventions often increase the amount and/or intensity ofphysical activity during school hours. Findings have been moremixed for objectively measured total physical activity, fitness,and inactivity-related risk factors. A systematic review by Harriset al found that only 5 of 18 school-based physical activityinterventions used objective measures of physical activity.259
Three studies using the SOFIT (System for Observing FitnessInstruction Time) instrument found more physical activity in theintervention group; 2 studies using accelerometers found nodifferences in physical activity between intervention andcontrol groups. Another more recent 1-year multicomponentschool-based physical activity intervention found improve-ments in accelerometer-assessed moderate to vigorous phys-ical activity and in body composition.257
Among activity-related risk factors, adiposity has been eval-uated most frequently in school-based physical activity interven-tions. In a recent systematic review, only 5 of 15 controlled trialsshowed improvements in BMI.225 Across individual studies,effects tended to be stronger in girls than in boys and during thefirst several months of the intervention (eg, up to 6 months), withdeclining success thereafter. For example, in 1 trial, an additional2 hours per week of usual PE class reduced BMI z score at 6months, but this improvement was not sustained over longerperiods. In these trials, the overall duration of the interventionphase (ranging from 12 weeks to 1 school year) did not appearto be related to success. Another systematic review and meta-analysis found no significant pooled effect on BMI of 18school-based physical activity trials that included a total of�18 000 children and with durations that ranged from 6 monthsto 3 years.259 Because BMI could be an imperfect end point forphysical activity interventions because of changes in lean musclemass, many of these trials also evaluated other body compositionmetrics, including waist circumference, waist-to-hip ratio, tri-ceps skin-fold thickness, subscapular skin-fold thickness, per-centage of body fat, total lean mass, total fat mass, and skin-foldsum. In 10 trials, only 3 of 18 such measures demonstratedsignificant improvements after the physical activity intervention,1 measure demonstrated deterioration, and 14 measures did notshow any significant change.259 More recent multicomponentschool-based PE/physical activity interventions in Europe dem-onstrated improvements over 1 academic year in aerobic fitness,skin-fold thickness, and/or BMI z score overall or in certainsubgroups.257,261
Overall, the findings for school-based physical activity pro-grams are mixed, with promising results for physical activity butgenerally little effects on adiposity (Table 6). Several but not allof these school-based interventions that focused on improvingPE curriculum, often in combination with other school- orhome-based physical activity components, showed improve-ments in objectively measured school-based and total physicalactivity. Conversely, the majority of these trials found noevidence for reductions in adiposity, including no effects inoverall pooled analyses. The writing group’s review of thedifferent approaches, populations, and outcomes in these variousschool-based physical activity interventions did not provide anyclear explanation for the heterogeneous effects on adiposity orother metabolic outcomes. Many of these trials tested multiplecomponents in combination (eg, restructuring PE curricula,increasing the number of classes or time spent in PE or recess,adding trained PE teachers, use of novel activities such as danceclasses), which limits the ability to draw conclusions about therelative effectiveness of any one of these specific components.Additional ongoing cluster RCTs will provide important addi-tional evidence on the efficacy of overall school-based programsto improve physical activity and reduce adiposity.262,263
In addition to targeting activity during school, there isinterest in increasing physical activity during commuting toschool. In cross-sectional observational analyses, comparedwith passive commuters (eg, by bus, car), children whoactively commute (eg, by walking, bicycling) have highertotal physical activity levels, although not lower BMI/adipos-ity.264 Only 2 studies, both nonrandomized interventions,
1534 Circulation September 18, 2012
by guest on February 6, 2016http://circ.ahajournals.org/Downloaded from

were identified that evaluated specific approaches to increaseactive commuting. These each evaluated “walking schoolbus” programs, in which children walked to school with setstops along the way, accompanied by walking adult chaper-ones.265,266 In both studies, compared with control schools,the program increased the proportion of children who re-ported that they were walking to school. For instance, after 2years in 1 trial, 36% of children in the intervention reportedactive (walking or bicycling) commuting on at least 50% ofschool days versus 26% of controls.265 In a subset of childrenwho received objective physical activity measurements, theseproportions were 71% and 25%, respectively. However,although active commuting was increased, there were nosignificant differences in BMI or in percentage of body fatbetween groups, even after 2 years. This raises the possibilitythat increased commuting activity could be offset in part byunrecognized decreases in activity elsewhere or that statisti-cal power or intervention intensity were insufficient. Childrenwho were frequent walkers had a significantly lower BMI(�0.77 kg/m2) and percentage of body fat (�4.0%)265; suchobservational, non–intention-to-treat analyses should be in-terpreted cautiously. Thus, walking school bus programsappear potentially promising but, given the limited number ofstudies, require further investigation to confirm the effects ontotal physical activity and on inactivity-related risk factors.
In sum, effective school-based approaches to improvephysical activity include increasing the availability and typesof playground spaces and equipment and instituting compre-hensive multicomponent interventions focused on both dietand physical activity (Table 6). Interventions focused on PEalone also increase physical activity but with inconsistenteffects on adiposity. Regular classroom activity breaks alsoappear to increase activity, but relatively few studies haveevaluated this approach. Strategies to increase activity bycommuting, such as walking school bus programs, appearpromising but require further investigation.
School-Based Approaches to Reduce Tobacco UseSchool-based population strategies to reduce tobacco useamong children include reducing the density of tobaccoadvertising and retail outlets around schools; restrictions ontobacco use on school campuses, including colleges anduniversities; and increased enforcement of anti-tobacco re-strictions around schools. The evidence for altering thedensity of retail outlets is discussed in “Local EnvironmentalChange to Reduce Smoking”; the evidence for smokingrestrictions on campus and increased enforcement of existingrestrictions is discussed in “Direct Restrictions andMandates.”
Workplace-Based Approaches to Improve DietSeveral systematic reviews121,267,268 evaluated controlled tri-als of workplace interventions to improve diet, physicalactivity, and other health indicators (Supplementary Table 8).Among these trials, many tested measures to improve diet,generally either based on food labeling or expanding avail-ability of healthier options in cafeterias and vending ma-chines (findings from these and similar, more recent studiesare described in “Labeling and Consumer Information”).Overall, these studies suggested that use of worksite cafeteria
or vending machine labels or icons alone had little effect onimproving diet, consistent with findings for labeling andconsumer information approaches in other settings (Table 4).In contrast, the combination of such labeling or other promptstogether with additional environmental changes, such as typesand locations of foods and beverages served, positivelyaffected purchasing behaviors at worksites. Such worksitedietary and/or physical activity interventions also demon-strated improvements in adiposity measures,267,268 for exam-ple, pooled reductions in weight of 1.26 kg (95% confidenceinterval [CI], �4.6 to �1.0) and in BMI of 0.5 kg/m2 (95%CI, �0.8 to �0.2) in 1 meta-analysis. The evidence foreffects on other clinical risk factors was mixed.268
A WHO report recently reviewed the evidence for religiouscongregation–based interventions to improve diet.36 Thesewere generally individual-focused interventions that werehoused in religious congregations rather than environmental orpopulation interventions per se. Most were based in blackcongregations in disadvantaged US communities. The WHOreport concluded that the number of such studies was small butthat the evidence was relatively consistent for positive psycho-social, behavioral, and/or risk factor changes. The report con-cluded that using the existing social structure of a religiouscommunity might facilitate adoption of changes towards ahealthy lifestyle, especially in disadvantaged communities.
In sum, the evidence suggests that worksite food orbeverage labeling or information alone may not be effectivebut that the combination of such labeling or other promptstogether with environmental changes in available foods andbeverages can improve dietary habits (Table 6). Althoughthese worksite interventions appear promising, their interpre-tation may be limited by weaknesses in methodology andreporting: for example, often outcome measures were self-reported, randomization processes were not described, orinterventions were nonrandomized.121,268
Workplace-Based Approaches to ImprovePhysical ActivityReviews of controlled trials that predominantly used infor-mational and behavioral approaches to improve diet andphysical activity interventions are described above.121,267,268
Several other studies have focused on the workplace physicalenvironment (Supplementary Table 8).
In an observational study, men more often used stairs in aworksite with visible staircases than in one with concealedstairs; no differences were seen for women.269 In a naturalexperiment, the combination of “skip-stop” elevators (stop-ping at every third floor, requiring employees to take thestairs to other floors) with changes to nearby stairs to makethem open and appealing resulted in a 33-fold increased useof stairs, compared with a traditional elevator core and fireexit stairs on the other side of the building.270 Initially,approximately one third of employees were satisfied with theskip-stop system, one third were neutral, and one third weredissatisfied. Two years later, approximately half were satis-fied, one fourth neutral, and one fourth dissatisfied. Theevidence for effects of worksite signs or prompts to encour-age stair use is reviewed in “Labeling/Information andPhysical Activity.”
Mozaffarian et al Population Approaches to Diet, Activity, and Smoking 1535
by guest on February 6, 2016http://circ.ahajournals.org/Downloaded from

There is also interest in worksite fitness centers to improvephysical activity. In 1 cross-sectional observational analysis, thepresence of exercise facilities, lockers, and exercise programs atthe workplace were each associated with greater walking/stepstaken per day.271 In another observational analysis, perceivedlow quality of exercise facilities at the worksite fitness centerwas associated with lower likelihood of membership.272 Consis-tent with these observational findings, in a randomized interven-tion, adding a new worksite fitness center or upgrading existingworksite fitness centers was associated with increased physicalactivity among employees.121 In contrast, in another controlledtrial, the addition of a worksite walking track did not signifi-cantly improve CVD risk factors.121
Worksite physical activity may also be increased withoutfitness centers. In a 1-year intervention that provided 1 hour perweek at work for either resistance training or other generalactivity (largely walking), self-reported physical activity wasunchanged, but both interventions improved percent body fatand systolic blood pressure compared with controls.273 A 10-week worksite intervention that encouraged walking by meansof education and weekly email prompts increased walking by�1800 steps per day compared with controls.274
In sum, the evidence suggests that certain workplace-basedinterventions can increase physical activity, but the numbersand types of studies that have assessed this topic in a rigorousfashion are relatively limited (Table 6).
Workplace-Based Approaches to Reduce Tobacco UseSee “Direct Restrictions and Mandates.”
Workplace-Based Economic Incentives for Employeesand BusinessesSee “Taxation, Subsidies, and Other Economic Incentives.”
Comprehensive Worksite Wellness ProgramsThe priorities for design of worksite wellness programs werereviewed recently.146 Such programs should include compo-nents on tobacco cessation and prevention, nutrition educa-tion and promotion, regular physical activity, stress manage-ment/reduction, early detection and screening programs,weight management, disease management, CVD education,and changes in the worksite environment to encouragehealthy behaviors and promote occupational safety andhealth.146 Cultural sensitivity and targeting of higher-riskemployees are also important.
Several quasi-experimental studies and some randomizedtrials have evaluated the effectiveness of comprehensive work-site wellness programs (Supplementary Table 8).275–282 In sum,these studies provide relatively consistent evidence that suchprograms improve health behaviors and related clinical riskfactors (Table 6). Examples of findings include improved diet(increased consumption of fruits and vegetables, reduced con-sumption of saturated fat and fatty meats), increased dailyactivity and walking, reduced smoking (14% reduction), reducedsystolic blood pressure (�7 mm Hg reduction) and body fat (9%reduction), and lower estimated global CVD risk (�13% reduc-tion). Interventions targeting higher-risk employees appear es-pecially effective. However, limitations were noted, includinginconsistent methodology across trials, often relatively smallsizes (n�400), and short durations of follow-up (typically �6
months, with a few studies having a follow-up of 12–18months). Under the Patient Protection and Affordable Care Act,by 2013 the CDC will release a report based on employer datathat will analyze the effectiveness of worksite wellnessprograms.
Local Environmental Changes(Community Settings)In addition to school and workplace environments, increasingattention is being devoted to how the local community environ-ment may influence behaviors. The local environment has beenvariably defined, including as a small area immediate and uniqueto individuals (eg, based on a maximum linear or travel dis-tance); as a larger area shared by many individuals, typicallyadministrative units; or as a “residential environment” or “neigh-borhood” without specifying a definitive boundary. In additionto targeting overall population behaviors, interventions on com-munity or neighborhood environments could also be relevant forreducing disparities, given the often less favorable local envi-ronments near homes and schools of disadvantaged subgroups.
Local Environmental Change for Diet(Community Settings)Research on the local food environment has generally fo-cused on accessibility to food outlets, including supermar-kets, grocery stores, convenience stores, fast-food restaurants,and full-service restaurants (Supplementary Table 9). Somestudies have also assessed in-store availability of foods andparticipation in farmers’ markets or community gardens.
All identified studies of local accessibility to types of foodoutlets were observational. Some studies were broadly re-gional and did not assess neighborhood-specific associa-tions.283 Most studies typically evaluated 1 or moreneighborhood-level characteristics of food outlets, includingpresence (yes/no), number, density per capita, and distancefrom home. Analyses typically adjusted for both individual-level and other neighborhood-level characteristics to mini-mize the potential effects of confounding. Nearly all studieswere cross-sectional, with only a few longitudinal analyses.
Four larger cross-sectional studies found that greater accessi-bility to neighborhood supermarkets (presence, number, or distance)was associated with more healthful dietary habits284–287; 1 smallcross-sectional study288 and the only large longitudinal study289
did not. Seven cross-sectional studies in both adults and childrenfound that greater accessibility to neighborhood supermarkets(presence, number, or distance) was associated with lowerprevalence of adiposity290–297; 1 county-level (ecological) studydid not.298 In 2 of these studies,284,292 relationships were strongerin blacks than in whites. One small longitudinal study (n�353)found no significant relation between neighborhood supermar-kets and 3-year risk of overweight/obesity or change in BMI zscore in young girls.299 Overall, most of these studies, althoughcross-sectional, found links between neighborhood supermarketsand better diets or lower adiposity.
Fewer studies have evaluated associations for neighborhoodgrocery stores or convenience stores. Among studies evaluatingaccessibility to grocery stores, 1 small study found no associa-tions with fruit or vegetable consumption,288 and 5 of 6 studies,including 1 longitudinal study, found no associations with
1536 Circulation September 18, 2012
by guest on February 6, 2016http://circ.ahajournals.org/Downloaded from

adiposity.173,290,292,293,298,300 In 2 smaller studies, living closer toa neighborhood convenience store was associated with morehealthful dietary habits among women285 but less healthfuldietary habits among adolescent boys.288 Four of 6 studies,including 1 longitudinal study, found that greater accessibility toa neighborhood convenience store was associated with moreadiposity or diabetes mellitus.173,290,292,293,298,299 In an analysis inJapan, a greater local density of mixed types of stores (super-markets, grocery, bakeries, etc) was positively associated withconsumption of confectioneries and bread but not meats, fish,fruits and vegetables, or rice.301 These studies together provideinconsistent evidence for relations of grocery or conveniencestores with diet or risk factors.
A few cross-sectional studies have assessed the relation ofneighborhood fast-food restaurants to dietary habits, with gen-erally null associations.284,288,302 In 1 longitudinal analysis, thenumber of neighborhood fast-food restaurants per capita wasassociated with fast-food consumption only among low-incomeyounger adults.289 Many more studies have evaluated howaccessibility to fast-food restaurants relates to adiposity. Mostdid not find any significant relation between neighborhoodaccessibility (number, distance, or density) to fast-food restau-rants and prevalence of adiposity in either adults or chil-dren.173,291,293,294,299,303–305 Exceptions include analyses using theBRFSS, in which higher per capita density of fast-food restau-rants was associated with higher BMI and prevalence of obe-sity306 and diabetes mellitus298 in adults. In a US study amongpregnant women from 3 states, the presence of a fast-foodrestaurant close to home (within 0.8 km) was associated withgreater weight gain,307 and in a regional Canadian survey, ahigher ratio of fast-food restaurants and convenience stores togrocery stores was associated with a higher prevalence ofobesity in adults.308 In Portland, OR, adults who lived inneighborhoods with a high density of fast-food restaurants andvisited these restaurants regularly (at least once per week) had ahigher prevalence of obesity309 and weight gain over time310; theinference for built-environment effects is limited in this study bythe latter condition of regular visits. A regional analysis inCanada found that higher per capita density of fast-food restau-rants was associated with higher total mortality and admissionsfor acute coronary syndromes.311 In sum, with some exceptions,most studies did not find evidence for relations of neighborhoodfast-food restaurants with diet or risk factors.
A small number of cross-sectional studies have evaluated howaccessibility of fast-food restaurants around school (rather thanhome) relates to adiposity in children.307,312 These studies foundthat the presence of a fast-food restaurant near school (�0.8 km)was associated with a higher BMI and prevalence ofoverweight/obesity. Few studies have investigated the relation ofnon–fast-food restaurants with diet-related behaviors. Somecross-sectional studies assessed the relation of neighborhoodfull-service restaurants with dietary habits, with generally nullassociations.284,288 In 2 separate cross-sectional analyses using2006–2007 BRFSS data, a higher per capita density of full-service restaurants was associated with a lower BMI and lowerprevalence of obesity298,306 and diabetes mellitus.298 Overall, theevidence for effects of fast-food restaurants near school ornon–fast-food restaurants near home remains generally limited.
Only a few identified cross-sectional studies evaluatedwhether neighborhood in-store availability of foods, typicallyassessed by shelf space, related to dietary habits or adiposity.Among 4 studies, positive correlations were generally seen only inunadjusted (crude) analyses for self-reported consumption of vari-ous foods and corresponding shelf space in supermarkets.313–316 In2 studies that evaluated metabolic risk markers, after multivari-able adjustment, including for race/ethnicity, neighborhoodavailability of healthier foods was not significantly associatedwith insulin resistance or adiposity; greater shelf space forenergy-dense snack foods was positively associated withBMI.317,318 In sum, these findings do not permit strong conclu-sions about causal effects of in-store relative food space oravailability; proprietary industry research on this topic has beenextensive and would be helpful if released.
Several studies have considered local farmers’ markets inrelation to consumption of fruits and vegetables (SupplementaryTable 9). Most did not evaluate built-environment accessibilitybut rather participation in voucher or coupon programs topurchase produce at these markets, most often as part of theFarmers’ Market Nutrition Program for women enrolled in WICor similar seniors’ farmers’ market programs.319,320 A handful ofcross-sectional and quasi-experimental studies found that WICparticipants receiving such vouchers because of enrollment inthe Farmers’ Market Nutrition Program reported eating morefruits and vegetables. A small, uncontrolled community inter-vention found that implementation of summer farmers’ marketsthat included vouchers to community members, direct youthparticipation, and education led to positive attitudes toward suchmarkets as both a learning opportunity and exposure to freshfoods for children.321 Overall, these studies provide some limitedevidence that initiatives that provide vouchers for purchasingfruits and vegetables at farmers’ markets increase consumptionof fruits and vegetables. These findings provide additionalsupport for the effectiveness of subsidies for more healthfulfoods (“Food Pricing: Direct Taxes or Subsidies” section) butnot on the potential impact of local environmental changes.
Two cross-sectional ecological analyses used the USDA FoodEnvironment Atlas, an online mapping tool of various foodoutlets in US counties, to assess the per capita density offarmers’ markets in relation to the prevalence of adult obesityand/or diabetes mellitus across US counties.297,298 Neither anal-ysis found a significant independent relation between the densityof farmers’ markets and prevalent obesity; 1 analysis observed asignificant inverse association with prevalent diabetes melli-tus.298 A small longitudinal study among young girls in northernCalifornia found mixed results for neighborhood farmers’ mar-kets and 3-year risk of adiposity.299 Availability of farmers’markets within 0.4 km of home was not associated with risk ofoverweight/obesity or change in BMI z score; availability within1.6 km of home was inversely associated with overweight/obesity (odds ratio [OR]�0.22; 95% CI, 0.05–1.06) but not witha change in BMI z score.
A few cross-sectional studies or small pre/post studies havefound that participation in a community garden program isassociated with higher self-reported consumption of fruitsand vegetables.322–324 These studies compared individualswho were or were not participating in these gardens withineach community rather than neighborhood or community
Mozaffarian et al Population Approaches to Diet, Activity, and Smoking 1537
by guest on February 6, 2016http://circ.ahajournals.org/Downloaded from

availability of such gardens, and thus, the findings do notinform relevance for local environmental change.
Overall, nearly all of these environmental studies, includingthose for supermarkets, were cross-sectional, which limits infer-ences about the direction of the associations (ie, whether foodoutlet accessibility influenced the health-related behavior or viceversa). Currently, there is still minimal prospective observationalor quasi-experimental evidence that altering locations of foodoutlets will make an impact on the purchase of healthy foods. Inthe United Kingdom, for example, randomized controlled stud-ies on placement of supermarkets in low-income food desertsaltered where shopping was done but did not affect foodpurchasing patterns.325,326 Further research, including morerigorous study designs, is needed to evaluate the effects ofthe neighborhood food environment, around both homeand school, on dietary behaviors.
Nonetheless, public policy has moved rapidly, and severalinitiatives provide financial incentives to encourage building ofnew supermarkets in impoverished areas. For instance, the NewYork City Food Retail Expansion to Support Health (FRESH)
program provides both zoning and financial incentives to en-courage grocery stores to locate in some of the most underservedneighborhoods with primarily pedestrian-oriented local shop-ping districts. In Pennsylvania, the Fresh Food Financing Initia-tive provided grants and loans to increase the number ofsupermarkets or grocery stores in underserved state communi-ties. The impact of these and similar programs on dietarybehaviors, health outcomes, and economic indexes is not yetknown; a limited set of evaluations is currently ongoing. TheObama administration has prioritized this initiative to addressfood deserts, and the Treasury Department announced a $25million notice of funds availability for the Healthy Food Financ-ing Initiative to take this program nationwide. Rigorous evalu-ation of the impact of such programs on food purchasing andeating habits is needed.
In sum, our understanding of the impact of local storeavailability on food selection and diet, including amongpopulations with limited resources, is at an early stage (Table7). Recent IOM and USDA reports concluded that theavailability of local supermarkets was cross-sectionally asso-
Table 7. Local Environmental Change (Community Settings)*
Class/Evidence Grade
Diet Increased availability of supermarkets near homes IIa B†
Increased availability of grocery stores near homes IIb B
Reduced availability of convenience stores near homes IIb B
Reduced availability of fast-food restaurants near homes IIb B
Reduced availability of fast-food restaurants near schools IIb B
Changes in in-store availability of healthier or less healthy foods IIb B
Increased availability of farmers’ markets IIb B
Increased availability of community gardens IIb C
Physical activity Improved accessibility of recreation and exercise spaces and facilities (eg, building of parks andplaygrounds, increasing operating hours, use of school facilities during nonschool hours)
IIa B
Improved land-use design (eg, integration and interrelationships of residential, school, work,retail, and public spaces)
IIa B
Improved sidewalk and street design (eg, network of sidewalks, street crossings, and bike lanesto create a safe and comfortable environment that connects to schools, parks, and otherdestinations)
IIa B‡IIb B
Improved traffic safety IIa B
Improved personal safety (eg, crime related) IIb B
Improved neighborhood aesthetics (eg, appeal, greenness, cleanliness, enjoyable scenery) IIa B§IIb B
Improved walkability (composite indicator of land-use mix, street connectivity, pedestrianinfrastructure, aesthetics, traffic safety, and/or crime safety)
IIa B
Smoking� Reducing density of retail tobacco outlets around homes and schools I B
Development of community telephone lines for cessation counseling and support services I A¶
*Nearly all of the evidence for these local environment approaches is derived from cross-sectional studies only. Several of these strategies overlap with otherpopulation approaches and could be categorized in multiple areas (other Tables). Given the scope of topics covered in this report, the writing group could not reviewevidence for every type of intervention, eg, community building codes to require access to and maintenance of drinking water fountains (evidence for school-baseddrinking water policies is summarized in Table 6); community group-based physical activity programs or classes; financial incentives or disincentives for remote ornearby parking and drop-off zones.
†Based on cross-sectional studies only; only 2 longitudinal studies have been performed, with no significant relations seen.‡IIa B for presence and better quality of sidewalks or biking paths for increasing active commuting to school by children. IIb B for street connectivity and active
commuting by children, sidewalks or street design and overall physical activity in children, and sidewalks or street design and physical activity by adults.§IIa B for adults; IIb B for children.�See Table 8 for smoking restrictions or better enforcement of existing restrictions in schools, workplaces, or other public places.¶This strategy has been tested largely in individual-based randomized controlled trials within communities. The writing group identified 1 additional controlled trial
that tested this strategy by randomizing communities.
1538 Circulation September 18, 2012
by guest on February 6, 2016http://circ.ahajournals.org/Downloaded from

ciated with healthier choices and fewer CVD risk factors butthat causal inference was limited, without strong evidence thatplacement of a new food outlet that offers healthy choices willimprove the diet of people in these communities.325,327–329
Similarly, the writing group found that the most consistentevidence for associations of community environment withdiet was seen for accessibility of home to supermarkets, withgreater access cross-sectionally linked to more healthfulhabits and less adiposity in both adults and children. Findingsfor grocery stores or convenience stores were mixed. Forneighborhood fast-food restaurants, little evidence was iden-tified for associations with dietary habits, and studies ofadiposity were quite mixed, with the majority showing noassociations. A limited number of studies that evaluatedschool-related (rather than home-related) fast-food restau-rants found positive associations with students’ adiposity.Local supermarket shelf space for various foods was gener-ally not associated with consumption of these foods or withmetabolic risk markers in a handful of studies. Evidence forthe effects of neighborhood farmers’ markets or communitygardens on diet or diet-related risk factors was quite limited.
Local Food Environment and DisparitiesLocal food environments are related to disparities. Forexample, using 2001 sanitation department and geographicinformation systems data, Block et al mapped all fast-foodrestaurants in New Orleans, LA.330 After adjustment for otherneighborhood characteristics, each 10% higher density offast-food restaurants was associated with 4.8% lower neigh-borhood income and 3.7% higher proportion of black resi-dents. Predominantly black neighborhoods had 1 additionalfast-food restaurant per every 2.59 square kilometer (1 squaremile) compared with predominantly white neighborhoods.Similar findings were seen in St Louis, MO,331 and South LosAngeles, CA,332 where fast-food restaurants were moredensely located in lower-income urban neighborhoods. In thelatter analysis, more affluent areas also had significantlygreater availability of healthier restaurant options in terms ofboth preparation methods and menu choices.
In a review of 54 US studies published between 1985 and2008 on neighborhood differences in access to food, residentsof low-income, minority, and rural neighborhoods generallyhad less access to supermarkets and healthful foods.30 Forexample, in a national study of �28 000 US ZIP codes,Powell et al found that low-income neighborhoods had fewerchain supermarkets than middle-income neighborhoods, al-though they also had more nonchain supermarkets andgrocery stores.333 After adjustment for income and othercovariates, predominantly black communities had approxi-mately half as many chain supermarkets as predominantlywhite communities, and predominantly Latino communitieshad approximately one third as many as did largely non-Latino communities (P�0.01 each).
A systematic review evaluated 45 observational studiespublished between January 1995 and January 2009 thatassessed various built-environment factors and obesity indisadvantaged individuals or areas in the United States.334
The authors concluded that access to supermarkets, ratherthan only grocery or convenience stores, was 1 of 3 neigh-
borhood factors with the strongest evidence for inverseassociations with adiposity and related lifestyle behaviors indisadvantaged populations (the others were availability ofplaces to exercise and safety). The authors also concludedthat disadvantaged populations were more likely to live inneighborhoods with suboptimal availability of food stores,places to exercise, aesthetic characteristics, and traffic orcrime-related safety.
Fewer studies have been performed outside the UnitedStates. In an analysis in Glasgow, Scotland, the mean densi-ties of restaurants, fast-food restaurants, cafes, and takeawayoutlets were significantly lower in both the most and leastaffluent neighborhoods compared with more average neigh-borhoods.335 In a much broader analysis across the UnitedKingdom, neighborhood deprivation, as defined by a com-pound measure of income, employment, health, education,and housing, was positively associated with per capita densityof McDonald’s outlets in both Scotland and England(P�0.001).336
In sum, local food environments appear related to neigh-borhood socioeconomic status in a variety of populations.The effects of interventions on disparities in these foodenvironments or whether neighborhood disparities or socio-economic status modifies the efficacy of such interventionsare still unknown.
Local Environmental Change for Physical Activity(Community Settings)A growing number of studies have evaluated the potentialimpact of the community environment on physical activityand activity-related risk factors, including in urban and ruralsettings and among children, adolescents, and adults (Supple-mentary Table 10a–f). The writing group identified manyrecent systematic or narrative reviews of these topics, gener-ally composed of cross-sectional observational studies withfew longitudinal studies included. Given the array of smallercross-sectional observational studies that were already cap-tured in the identified reviews, in additional systematicsearches for original articles published after 2007, the writinggroup focused on additional studies that were randomizedtrials, quasi-experimental studies, longitudinal studies, orlarge (n�5000) cross-sectional studies.
In evaluating neighborhood environment and physicalactivity, metrics of interest have included accessibility ofrecreation or exercise spaces and facilities; land-use design(eg, integration of residential, work, retail, and public spaces;interrelationships of destinations such as homes, worksites,schools, and shopping areas); sidewalks and street design;crime and safety; and aesthetic conditions such as greennessor cleanliness. Several studies also evaluated compositevariables, such as walkability, to incorporate several ofthese metrics simultaneously. These various characteristicshave been assessed on the basis of individual perception(self-report), direct observation (eg, from community au-dits), or existing databases in combination with geographicinformation systems. Outcomes in these studies haveincluded leisure-time recreation and exercise, utilitariantransport or travel, occupation-related physical activity,and adiposity.
Mozaffarian et al Population Approaches to Diet, Activity, and Smoking 1539
by guest on February 6, 2016http://circ.ahajournals.org/Downloaded from

Accessibility of Recreation or Exercise Spacesand FacilitiesMany studies have evaluated accessibility to recreation orexercise spaces and facilities such as parks, playgrounds,bikeways, and sports facilities (Supplementary Table 10a).Among adults, greater accessibility was generally, althoughnot always, associated with more physical activity.28,337–342
Examples of factors linked to greater physical activity in-cluded access to local parks and bicycle paths, the presence offacilities on frequently traveled routes, and neighborhooddensity of public and private facilities.339 In 1 meta-analysis,after adjustment for age, income, and education, the presenceof physical activity facilities was positively associated withphysical activity assessed as a binary factor (eg, any walking,sufficient walking, sufficient leisure-time activity) (OR�1.20;95% CI, 1.06–1.34).340 In a review of 13 cross-sectionalstudies among children, greater accessibility was positivelyassociated with physical activity in 9 of 13 studies, at least insome subgroups, particularly among girls.343 Interestingly, allstudies assessed the neighborhood availability of facilities,not whether children or parents actually used these facili-ties.343 In contrast to these findings, a review of studiespublished through 2004 concluded that availability or acces-sibility of physical activity equipment, facilities, and pro-grams was unrelated to physical activity levels in youth.344
Cross-sectional and longitudinal analyses from the NationalLongitudinal Study of Adolescent Health suggest some pos-itive associations between green space coverage or availabil-ity of physical activity facilities and physical activity amongUS adolescents but with somewhat varying findings, depend-ing on the environment measure, the physical activity out-come, and sex.345–348
Adiposity has also been evaluated as an outcome.342,349,350
In a review of cross-sectional studies that directly measuredbody weight in adults or children, 2 of 3 studies in adultsobserved that shorter distance to or greater density of fitnessfacilities was associated with lower BMI, prevalence ofoverweight, and calculated 10-year risk of CHD.349 In across-sectional analysis in a multiethnic US cohort, perceivedavailability of neighborhood facilities and spaces for exercisewas independently associated with lower insulin resis-tance.317 Among youth, 2 studies found inverse associationsbetween the number of facilities and risk of overweight; 2studies evaluating distance found no relation to over-weight.349 In a systematic review, children’s own (but nottheir parents’) reported accessibility to physical activityfacilities and bike/walking trails was inversely associatedwith adiposity outcomes in several studies.350
A systematic review of 45 US studies on built-environmentfactors and obesity in disadvantaged populations concludedthat availability of places to exercise was 1 of 3 neighborhoodfactors with strong evidence for inverse associations with riskof adiposity and related lifestyle behaviors.334 The 2009IOM report Local Government Actions to Prevent ChildhoodObesity recommended that neighborhood accessibility toparks, playgrounds, and public and private recreational facil-ities be increased.147 Suggested interventions included build-ing and maintaining parks and playgrounds close to residen-tial areas; improving access to public and private recreational
facilities through increased operating hours and developmentof culturally appropriate activities; and establishing joint useof facilities agreements to allow school playing fields, play-grounds, and recreation centers to be used by the communitywhen schools are closed.
In sum, greater access to recreation and exercise spaces andfacilities is relatively consistently linked to greater physicalactivity and lower adiposity or other metabolic risk factors(Table 7). However, nearly all the evidence is cross-sectional,which limits inferences about causality, and additional pro-spective, quasi-experimental, and cluster-randomized studiesare needed.
Land-Use Mix/Locations and Accessibility of DestinationsThe evidence for how land-use design might influencephysical activity or adiposity is summarized in Supplemen-tary Table 10b. Several recent systematic reviews evalu-ated how land-use mix might influence physical activity inchildren.147,334,350 –355 Each of these reviews identified onlya handful of observational studies, all cross-sectional.Most studies evaluated overall land-use mix, quantified onthe basis of varying metrics incorporating the types,variety, and physical interrelationships of land use (eg,residential, school, entertainment, retail, office) nearhome. A few studies evaluated simpler metrics, such asdistance to school from home, in relation to children’sactive commuting (walking or biking to school). Across allthese systematic reviews, 5 of 6 original studies found apositive relation between overall land-use mix and chil-dren’s physical activity; in 5 of 8 studies, between overallland-use mix and children’s active commuting; and in 3 of3 studies, between distance from home to school andchildren’s active commuting. After adjustment for con-founders, magnitudes of these relationships often remainedquite large (eg, OR 2- to 3-fold or greater), especially foractive commuting. Four recent systematic reviews evalu-ated the evidence for associations between land-use mixand childhood adiposity.350,351,355,356 Only 3 unique studieswere identified by these reviews, all cross-sectional obser-vational analyses, including 2 studies in southern Califor-nia (n�799, n�98) and 1 study in Canada (n�501). Noneobserved significant relations between land-use mix andBMI or overweight/obesity in children. One longitudinalanalysis among US adolescents found no significant rela-tion between land-cover diversity and moderate to vigor-ous physical activity.346 The writing group did not identifyany additional recent randomized trials, quasi-experimental studies, longitudinal studies, or large(n�5000) cross-sectional studies of these relationshipsamong youth published after 2007.
Several recent systematic reviews evaluated the relation betweenland-use mix and physical activity in adults.334,337,338,340,351,352,357–359
These reviews collectively identified 18 original investiga-tions, all cross-sectional observational studies; our furthersearches identified a few more recent large cross-sectionalstudies.271 Nearly all found significant positive associa-tions, often with substantial magnitudes of associations(eg, OR in the 2- to 3-fold range or higher). Only 1 small
1540 Circulation September 18, 2012
by guest on February 6, 2016http://circ.ahajournals.org/Downloaded from

longitudinal investigation was identified, which evaluatedwalking in 32 low-income women who, based on a housingprogram, moved to either a suburban neighborhood or aneotraditional neighborhood (ie, small lots, modest setbackdistances, front porches, sidewalks, etc).360 Among multi-ple land-use metrics evaluated, an increase in the popula-tion density of service-related jobs after the move wasassociated with fewer steps walked; changes in otherland-use metrics were not significantly associated withwalking. Cross-sectional studies of land-use mix andadiposity in adults are consistent with the findings forphysical activity. Of 6 original investigations identifiedacross multiple systematic reviews,334,337,351,352 4 investi-gations observed independent inverse relations betweenland-use mix and BMI or overweight/obesity, and 2investigations observed nonsignificant trends toward suchinverse associations.
In sum, multiple cross-sectional studies in differentpopulation groups have observed relatively consistent androbust relationships between more diverse land-use mix,that is, the presence of greater number and diversity ofdestinations near the home, and physical activity in bothchildren and adults (Table 7). The magnitude of many ofthese associations makes it less likely that residualconfounding could fully explain the relations. However,although a cross-sectional relation is clearly present, thedesign of these studies precludes inference about thedirection of the association; for example, families whoprefer to walk and be active could be selecting neighbor-hoods with more diverse land use rather than land-use mixaltering physical activity. In adults, studies of land-use mixand adiposity are consistent with physical activity find-ings; similar studies in children did not find relations withadiposity but were limited in number and sample size.
Sidewalks and Street DesignThe design of sidewalks and streets may influence physicalactivity. Characteristics of interest have included availabil-ity and quality (eg, the presence of shoulders) of sidewalksand walking paths and street connectivity, a measure ofease of travel and provision of alternate routes for activecommuting. Studies of these factors and physical activityor adiposity are summarized in Supplementary Table 10c.
The writing group identified multiple recent systema-tic reviews of sidewalk or street design and activecommuting to school and/or general physical activity inchildren.147,334,338,343,353,354,361 Collectively, these reviewsincluded 8 cross-sectional studies that evaluated the presenceof sidewalks or biking paths: 5 of 6 of these studies observedpositive relations with active commuting to school, butonly 1 of 3 studies observed positive relations with generalphysical activity. These reviews also identified 5 cross-sectional studies that evaluated street connectivity: 1 of 2studies found positive relations with active commuting toschool and 2 of 3 studies with general physical activity.
The writing group also identified 1 additional cross-sectional study and prospective study from 1 large US cohortof adolescents346,348 and 2 additional prospective studies from
1 relatively small (n�500) cohort of children and adolescentsin Melbourne, Australia.362,363 In the US cohort, street con-nectivity was positively related to moderate to vigorousphysical activity in cross-sectional analyses, with variation byurbanization and by sex,348 but was unrelated to moderate tovigorous physical activity in longitudinal analyses.346 In theAustralian cohort, the extent of sidewalks and walking pathsnear home was positively correlated with changes in activecommuting over time in girls but not in boys362; however,these findings were not adjusted for covariates. Intersectiondensity, a measure of better street connectivity, was posi-tively correlated with changes in active commuting over timein adolescent boys but not in younger boys or in girls. Inadjusted analyses in this cohort, parental perceptions of betterpedestrian crossings were associated with a 2.5-fold greaterincrease in overall active commuting to school over 2 years offollow-up.363 Only 1 quasi-experimental analysis was identi-fied, which found that California children whose route addeda new Safe Routes to School construction project increasedboth their active commuting to school and general walkingcompared with children whose route did not have a SafeRoutes to School project added. Two recent systematicreviews349,356 identified only 2 cross-sectional studies ofstreet connectivity and childhood obesity; neither found asignificant association. No additional randomized trials,quasi-experimental studies, longitudinal studies, or large(n�5000) cross-sectional studies published after 2007 werefound of these relationships in children.
The writing group evaluated multiple recent reports thatsystematically reviewed the literature for sidewalk and streetdesign and physical activity in adults.334,337,338,340,351,357,359,361
In addition to evaluating original investigations, severalreports also included multiple earlier reviews.338,351,359 Somestudies focused on rural populations337 and others on minoritysubgroups.357 All investigations identified by these reviewswere cross-sectional observational studies. End points in-cluded walking (overall, for commuting, and for recreation),exercise, and overall physical activity. Although virtually allof the reviews concluded that the presence or quality ofsidewalks and street connectivity was positively linked tophysical activity in adults, findings from the original inves-tigations were much more mixed (Supplementary Table 10c).Overall, fewer than half of the original studies found signif-icant associations between sidewalks or street connectivityand various physical activity outcomes, and in studies report-ing positive associations, these were sometimes only seen forcertain characteristics of sidewalks or street connectivity,certain types of activity, or certain subgroups of the popula-tion, without any clear pattern across studies.
The writing group identified 2 prospective studies and 1quasi-experimental study published after 2007. Among 357women in Melbourne, Australia, sidewalk availability wasnot significantly related to walking for leisure or transportover 2 years’ follow-up.364 Among 5115 US young adults,neighborhood street density was positively associated withwalking, bicycling, and jogging in low-urbanicity areas butnot in middle- or high-urbanicity areas.365 In Knoxville, TN,neighborhood physical activity and active commuting to
Mozaffarian et al Population Approaches to Diet, Activity, and Smoking 1541
by guest on February 6, 2016http://circ.ahajournals.org/Downloaded from

school were directly observed before and after construction ofan urban greenway/trail in 1 neighborhood and in 2 controlneighborhoods that did not receive a trail.366 Total neighbor-hood physical activity significantly increased in the interven-tion neighborhood and decreased in control neighborhoods(P�0.001); active commuting did not change.
Recent systematic reviews identified 4 cross-sectional studies ofsidewalk availability and adiposity in adults.334,337,349,367 Findingswere mixed, with no significant associations among adults inthe rural southern United States or Hispanic adults in Texasand inverse associations among urban US adults and Austra-lian adults. Only 1 cross-sectional study of street connectivityand adiposity was included, which found no significantassociations with obesity in a large study of US adults. Thewriting group did not identify additional randomized trials,quasi-experimental studies, longitudinal studies, or large(n�5000) cross-sectional studies of these relationships inadults published after 2007.
In sum, there is mixed evidence for a relation betweensidewalks or street design and physical activity or adiposity inadults, with several studies finding associations but manyothers not and nearly all findings coming from cross-sectionalstudies (Table 7). Among children, the presence and greaterquality of sidewalks or biking paths were more consistentlylinked to increased active commuting to school in cross-sectional studies, supported at least in part by 1 prospectivestudy and 1 quasi-experimental analysis. Relatively fewstudies have evaluated sidewalks and general physical activ-ity in children, street design and general physical activity oractive commuting in adults, or sidewalks or street design andadiposity in adults, which limits conclusions about theserelations.
Neighborhood Safety and CrimeMany observational studies have evaluated whether safety orcrime in a community environment is linked to physicalactivity (Supplementary Table 10d). Several recent narrativeor systematic reviews have assessed this topic for children’sphysical activity, with many of these reviews identifying thesame overlapping sets of original individual stud-ies.147,343,344,353–355,368–371 Nearly all studies identified in thesereviews were cross-sectional; a handful were longitudinal. Inthe great majority of studies, parental perceptions of overallneighborhood safety were positively associated with chil-dren’s physical activity. When different aspects of safetywere evaluated, most studies evaluating traffic safety (eg,related to aspects of road or pedestrian crossings) observedpositive relationships with children’s physical activity. Rela-tively fewer studies in these reviews evaluated neighborhoodcrime or perceived personal danger (eg, from strangers). Forself-reported measures of crime or personal danger, findingswere often mixed and nonsignificant. In 2 studies usingobjective measures of neighborhood crime, significant in-verse associations with children’s physical activity were seen.Fewer studies in these reviews evaluated traffic safety orcrime and active commuting to school by children, with moststudies finding no significant association.353 Two recentsystematic reviews evaluated the relation between neighbor-hood safety and various measures of childhood adipos-
ity.355,356 Findings were mixed, and most studies did not findsignificant associations.
In searches for additional experimental studies, longitudi-nal studies, or large (n�5000) cross-sectional studies pub-lished after 2007, several prospective studies were identified,including studies based on data from the Australian ChildrenLiving in Active Neighborhoods Study362,363,372 and the USNational Longitudinal Study of Adolescent Health346 (Sup-plementary Table 10d). In the Australian studies, variousparentally perceived and objectively measured neighborhoodtraffic safety characteristics were assessed in relation to 2- to5-year changes in parentally reported or self-reported physi-cal activity and active commuting, in physical activity as-sessed by accelerometer, and in BMI z score. In someanalyses, associations were seen for certain neighborhood-activity relationships, at least in some age- or sex-specificgroups. For example, the number of traffic/pedestrian lightsand total length of walking paths were positively associatedwith changes in active commuting among girls 8 to 9 years ofage, and parental perception of no traffic lights or pedestriancrossings was associated with a lower frequency of increasedactive commuting to school. However, these and otherparental perceptions as well as other evaluated metrics, suchas total length of busy versus local roads or number ofintersections, were not associated with increased physicalactivity or commuting in other sex or age groups or withobjectively measured 5-year changes in physical activity orBMI z score. In the US study, neighborhood crime safety(rates) were found to be inversely related to bouts of moderateto vigorous physical activity in both males and females.346
Four systematic reviews evaluated how neighborhoodsafety relates to physical activity in adults (SupplementaryTable 10d).337,359,373,374 The identified studies were generallycross-sectional. The large majority of studies in these reviewsfound that perceived or objective measures of safety werepositively associated with physical activity, including amongwomen and men, and with use of parks and park activities.Among studies that evaluated only walking, rather thanoverall physical activity, a minority found significant associ-ations with attributes of neighborhood safety.359 A systematicreview of 45 observational studies on various built-environment factors and obesity in disadvantaged US popu-lations concluded that neighborhood safety was 1 of 3 factorswith the strongest evidence for inverse associations with riskof adiposity and related lifestyle behaviors.334
In sum, the evidence indicates that parental perceptions ofoverall neighborhood safety are cross-sectionally linked tochildren’s physical activity, with greater evidence for safetyissues related to traffic and road conditions than to crime,except in a few studies that used objective measures of thelatter (Table 7). Although the writing group’s review foundmixed evidence for the relation of neighborhood crime tophysical activity or adiposity in children, a 2009 IOM reportrecommended community policing strategies to improve thesafety and security of streets and parks, especially in higher-crime neighborhoods, to reduce the risk of childhood obe-sity.147 This report also recommended several interventions toimprove traffic safety, including the Safe Routes to School
1542 Circulation September 18, 2012
by guest on February 6, 2016http://circ.ahajournals.org/Downloaded from

programs, to allow more children to safely walk or ride abicycle to school; traffic enforcement programs to improvesafety for bicyclists; and retrofitting streets to reduce vehiclespeeds, accommodate bicyclists, and improve the walkingenvironment. In adults, the writing group found perceived orobjective measures of neighborhood safety to be consistentlyassociated with physical activity and use of parks. A handfulof longitudinal studies provide some limited support for thesefindings, although the heterogeneity of observed results doesnot allow strong conclusions in this regard. No interventionalor quasi-experimental studies were identified.
Aesthetic ConditionsSeveral studies have evaluated whether neighborhood aes-thetics such as vegetation or green space, enjoyable scenery,and physical disorder (eg, garbage, broken glass) are linked tophysical activity or adiposity (Supplementary Table 10e).Recent systematic reviews collectively evaluated �20 cross-sectional studies, approximately half in children and half inadults.334,337,339,354,356 In children, findings were relativelylimited and mixed. For example, among 6 cross-sectionalstudies published since 2006, different neighborhood charac-teristics, including greenness, physical disorder, and enjoy-able scenery, were evaluated by no more than 3 studies each;outcomes also varied, including active commuting, overallphysical activity, or adiposity. Only approximately half of theinvestigated relationships were statistically significant, with-out clear patterns across different types of neighborhoodcharacteristics or outcomes. In a prospective analysis by Belland colleagues among nearly 4000 children in Indiana,objectively quantified neighborhood greenness was inverselyassociated with BMI z score over 2 years’ follow-up.356
In adults, few studies evaluated greenness or physicaldisorder, with mixed results. In contrast, many cross-sectionalstudies evaluated general aesthetics or enjoyable scenery, andnearly all found relations with more favorable physicalactivity or adiposity measures (Supplementary Table 10e).Other reviews evaluating either original studies or reviewspublished before 2006 concluded that cross-sectional studiesdemonstrate associations between various metrics of neigh-borhood aesthetics and physical activity or walking inadults.28,338,359
In sum, better general aesthetics of neighborhoods appearpositively related to physical activity among adults, with lessconsistent findings among children (Table 7). However, nearlyall of the studies have been cross-sectional, which limits infer-ence about causality. Additional prospective, quasi-experimental, and cluster-randomized studies are needed.
WalkabilityWalkability represents a composite indicator of various localneighborhood characteristics, such as land-use mix, street con-nectivity, pedestrian infrastructure, aesthetics, and traffic orcrime safety. As with other local environmental factors reviewedin this report, nearly all evidence for relation with physicalactivity or adiposity is derived from cross-sectional studies(Supplementary Table 10f). Although the numbers of studieswere relatively limited, nearly all found either self-reported orgeographic information systems–assessed indexes of walkabilityto be positively associated with physical activity, including
objective measures of physical activity.28,334,338,351,352,359 Fewstudies evaluated walkability and adiposity in either children oradults, with a minority of these observing positivefindings.349–352,355,358,359
In sum, cross-sectional observational studies identify con-sistent positive associations between walkability and physicalactivity in children and adults (Table 7). Studies of walkabil-ity and adiposity are fewer and inconsistent.
Local Environmental Change to Reduce Smoking(Community Settings)Community strategies to alter the environment to reducesmoking have most commonly involved smoking restrictions.The evidence for effectiveness of smoking restrictions orbetter enforcement of existing restrictions in schools, work-places, or other public places is discussed in “Direct Restric-tions and Mandates.”
Density of Tobacco Retail OutletsSeveral studies have evaluated the relation between density oftobacco retail outlets around homes or schools and smokingbehaviors (Supplementary Table 11). Several cross-sectionalstudies in both youth and adults have demonstrated positiveassociations between density of or distance to neighborhoodtobacco retail outlets and prevalence of smoking.375–379 Sim-ilar findings have been observed for tobacco retailers aroundschools.380,381 For example, among 24 875 students from 135randomly selected California high schools, the absoluteprevalence of current smoking was 3.2% higher at schools inneighborhoods with the highest tobacco-outlet density (�5outlets within 0.8 km) than in neighborhoods with no tobaccooutlets.381 In this cohort, the density of retail cigaretteadvertising in school neighborhoods was also associated withhigher school smoking prevalence.
In sum, the density of tobacco retail outlets around bothhomes and schools is consistently associated with greatersmoking (Table 7). Only cross-sectional studies were identi-fied rather than longitudinal or interventional (eg, quasi-experimental) studies of these relationships.
Community Telephone Quit LinesCommunity services, such as telephone counseling, mayassist with smoking cessation (Supplementary Table 11).Such interventions have generally been evaluated inindividual-randomized trials rather than as a community-wideintervention per se.382 For example, in individual-level trials,smokers randomly assigned to receive greater telephonesupport had higher cessation rates at 12 months in 1 study andat 6 months (but not 18 months) in another.383,384 Onerandomized trial tested the effects of telephone hotlines at thecommunity level.385 Compared with providing smokers withdetailed self-help cessation packets, the addition of telephonehotlines to assist with cessation increased cessation rates,including cotinine-validated cessation, at up to 18 months’follow-up and also reduced relapse rates.
In sum, the success of individual-based telephonecessation-support interventions, together with 1 supportivetrial at the community level, suggests that such an approach atthe community level would be effective for reducing tobacco
Mozaffarian et al Population Approaches to Diet, Activity, and Smoking 1543
by guest on February 6, 2016http://circ.ahajournals.org/Downloaded from

use (Table 7). This evidence has led the US Task Force onCommunity Preventive Services to recommend the develop-ment of community telephone hotlines for counseling andsupport services for tobacco cessation.386
Direct Restrictions and MandatesThe evidence for effects of direct restrictions and mandateson diet, physical activity, and tobacco use is summarized inTable 8.
Direct Restrictions and Mandates: Diet
Restrictions on Advertising to ChildrenThe scope and effects of food and beverage marketing onconsumer behavior are well documented, particularly amongchildren. In 2006, the largest food and beverage companies
spent $1.6 billion in the United States alone to market theirproducts to children and adolescents, with 46% of all youth-marketing expenditures devoted to television.387 In 2006, theIOM Committee on Food Marketing and the Diets of Chil-dren and Youth reported a systematic review of the availableresearch and concluded that there is moderate to strongevidence that television advertising influences food andbeverage preferences, purchase requests, beliefs, and dietaryintake. Similar reports388 and more recent studies supportthese findings (Supplementary Table 12).389
The IOM committee and other recent analyses also con-cluded that food and beverage marketing practices geared tochildren and youth are out of balance with recommendedhealthful diets and contribute to an environment that putstheir health at risk.387–391 For example, in a review of�98 000 food-product advertisements on top-rated US chil-dren’s television shows, 98% and 89% of the advertised foodsseen by viewers 2 to 11 years of age and 12 to 17 years of age,respectively, were packaged or processed foods that werehigh in fat, sugar, or sodium. Approximately half of allcalories among the advertised products came from sugar.390
In another review of 1600 hours of children’s programming,most food advertisements were for candy and snacks (34%),sugared cereals (28%), and fast foods (10%); none of the8854 ads were for fruits or vegetables.391
In a nationally representative longitudinal study of USchildren, Chou et al estimated the potential impact of televi-sion marketing restrictions on adiposity in children andadolescents.392 On the basis of the relation between thenumber of hours of television advertisements for fast-foodrestaurants seen per week and observed risk of overweight, itwas estimated that a ban on these advertisements wouldreduce the prevalence of overweight by 18% among USchildren 3 to 11 years of age and by 14% among USadolescents 12 to 18 years of age.392 Similarly, in an analysisusing 2003–2004 National Health and Nutrition ExaminationSurvey (NHANES) data and evidence for relation of televi-sion advertising to dietary consumption, it was estimated thateliminating television food advertisements to children 6 to 12years of age would reduce the prevalence of obesity by14.6%.393
On the basis of evidence for the influence of advertising,as well as the types of foods and beverages currentlymarketed, a 2009 IOM report recommended several strat-egies for restricting such marketing to children and ado-lescents.147 These included the development of regulationsthat account for the full spectrum of advertising andmarketing practices across all media, the banning offast-food and restaurant advertisements on television, andthe banning of advertising and marketing of less healthfulfoods and beverages near school grounds and public placesfrequently visited by youth.
Restrictions on marketing to youth currently exist in manycountries. A WHO report found that among 73 countriesreviewed, 85% had regulations on television advertising thatspecifically refer to children.394 For example, Australia bansfood advertisements aimed at children �13 years of age; theNetherlands bans advertising of sweets to children �12 yearsof age; and the United Kingdom bans advertising in or around
Table 8. Direct Restrictions and Mandates*
Class/Evidence
Grade
Diet† Restrictions on television ads for less healthfulfoods or beverages aimed at children
I B
Restrictions on advertising and marketing ofless healthful foods or beverages near schoolsand public places frequented by youths
IIa B
General nutrition standards for foods andbeverages marketed and advertised to childrenin any fashion, including on-package promotion
IIa B
Regulatory policies to reduce specific nutrientsin foods (eg, trans fats, salt, certain fats)
I B
Mandates to support production of healthiertypes of foods (eg, more fruits, vegetables,whole grains)
IIa C
Physicalactivity†
Development of specific national guidelines forphysical activity modes and amounts, whichcan then influence other legislative initiativesthat impact physical activity, such as legislationdealing with schools and workplaces,transportation funding, the built environment,and regulation of public lands, among others
IIa C
Smoking Community (city, state, or federal) restrictions onsmoking in public places
I A
Local workplace-specific restrictions on smoking I A
Presence of local school-specific restrictions onsmoking
IIb B
Stronger enforcement of local school-specificrestrictions on smoking
IIa B
Local residence-specific restrictions on smoking IIa B
Partial or complete restrictions on advertising andpromotion of tobacco products
I B
Mandatory plain packaging I C
*Several of these strategies overlap with other population approaches andcould be categorized in multiple areas (other Tables). Given the scope of topicscovered in this report, the writing group could not review evidence for everytype of intervention, for example, regulation of tobacco constituents, such asbanning certain characterizing flavoring; setting minimum age limits forsmoking or purchasing tobacco; or restrictions on showing smoking in movies.
†See Tables 6 and 7 for school and workplace-related approaches and localcommunity built-environment strategies, respectively, for improving diet andphysical activity.
1544 Circulation September 18, 2012
by guest on February 6, 2016http://circ.ahajournals.org/Downloaded from

television programs aimed at or likely to appeal to children�15 years of age. Sweden, Norway, and Quebec, Canada,each ban all television advertising aimed at children, regard-less of the product involved. The United States does not haveany restrictions on marketing or advertising of foods andbeverages to children, although the Interagency Work Groupof the Federal Trade Commission, the Food and DrugAdministration, the CDC, and the USDA have developed aset of proposed voluntary principles that would guide indus-try in marketing food to children.
In sum, there is consistent evidence that television adver-tising to children influences food and beverage preferences,purchases, and consumption and that the majority of suchadvertising is for products suboptimal for health. On the basisof this evidence, restrictions on such advertising would beeffective at improving dietary behaviors in children (Table 8).Television advertising has been studied most; somewhat lessevidence exists for other types of advertising and marketing.
Restrictions on Specific Dietary FactorsA growing number of city, regional, or national policies aimto restrict levels in the food supply of certain dietary factorswith adverse health effects (Supplementary Table 12). Forexample, several nations, regions, and cities have placedrestrictions on the content of industrially produced trans fat incooking oils or foods.23,395 Analyses of foods before and afterimplementation of these restrictions have demonstrated wide-spread compliance, with little evidence for adverse effects onfood availability, price, or quality.23,395 The effects of theserelatively recent interventions on clinical outcomes have notyet been assessed.
In Finland, a national multicomponent strategy to improvedietary habits was initiated in 1977 that incorporated legisla-tive restrictions on the maximum salt content of certain foodsin the 1990s and the percentage of milk fat in whole andlow-fat milk in the 1980s and 1990s.59,60 Other interventioncomponents included media and education, voluntary agree-ments with industry, modifications to taxation and subsidypolicies for several foods, and government-supported pro-grams to increase production and consumption of fruits (seethe corresponding relevant sections of this report for furtherdetails on these other interventions). The direct restrictions onsalt and milk-fat content were successfully implemented withgood compliance. From the 1970s to the late 1990s, meandaily salt consumption in Finland declined from approxi-mately 14.5 g in men (unknown in women) to approximately11 g in men and 7 g in women; mean diastolic blood pressuredeclined by 5% in men and 13% in women; and mean totalblood cholesterol declined by almost 20%. Age-adjustedCHD mortality decreased by 65%, with approximately threequarters of this decrease estimated to be related to improve-ments in population risk factors rather than medical treat-ments.59,60 Given the sustained multicomponent nature of theoverall intervention, the health effects of the direct restric-tions on salt and milk fat were not assessed separately.
In Mauritius, a national multicomponent intervention pro-gram was instituted in 1987 to improve population lifestyle-related risk factors.396 This program included a regulatorypolicy for general cooking oil to limit the content of palm oil
and replace it with soybean oil. On the basis of serialcross-sectional surveys, this policy is estimated to havereduced consumption of saturated fat by �3.5% energy andincreased consumption of polyunsaturated fat by �5.5%energy by 1992. In those 5 years, mean population totalcholesterol concentrations fell by 0.79 mmol/L in men and0.82 mmol/L in women (P�0.001 each). The cooking oil–related decrease in saturated fat and increase in polyunsatu-rated fat was estimated to explain approximately half of thisdecline in both men and women.
In sum, these quasi-experimental experiences demonstratethat regulatory policies to reduce particular nutrients in foodsare highly effective for improving population dietary habits(Table 8).
Mandates on Specific Dietary FactorsIn addition to restrictions on consumption of less healthfulfoods, policies and legislation can be implemented to man-date increased availability of healthier dietary options. Forexample, the Mauritius policy intervention included not onlylimits on palm oil but also increased soybean oil as itsreplacement.396 The resulting increases healthful polyunsatu-rated fat contributed to the substantial population improve-ments in blood cholesterol levels.396
Beyond this, relatively limited evidence was identified onpolicy or legislative mandates to increase the production oravailability of more healthful foods. As described in Agricul-tural Policy, the modification of Finnish taxation policiessuccessfully encouraged production of mixed vegetable oiland light spreads and greater production of lean meats andprotein. The national Berry and Vegetable Project success-fully increased local healthy crops.59,60 However, these inter-ventions were not direct mandates but changes in taxation,subsidies, and agricultural policies to support and encouragedietary changes.
In sum, the use of mandates to increase consumption ofhealthful foods appears to be a potentially promising strategy,but further research and evidence are required (Table 8).
Direct Restrictions and Mandates: Physical ActivityRegulation of physical activity through legislation offers aunique challenge, especially when contrasted with that ofsmoking. Smoking, a negative health behavior, is susceptibleto direct regulatory approaches, whereas physical inactivity,which is the lack of a healthy behavior, renders legislativeapproaches much more challenging. Most direct regulatoryapproaches to encouraging physical activity operate throughchanges in the built environment, worksite wellness pro-grams, financial incentives, or transportation policies.397,398
These various approaches are addressed in other sections ofthis report and have been summarized in other reviews.36,399
Multiple population strategies are often employed simulta-neously and in settings in which randomized controlledexperiments are not practical; thus, quantifying the indepen-dent effects of different approaches is challenging. For all ofthese reasons, there is little evidence for the effectiveness ofdirect restrictions or mandates to increase physical activity.
Mozaffarian et al Population Approaches to Diet, Activity, and Smoking 1545
by guest on February 6, 2016http://circ.ahajournals.org/Downloaded from

Evidence is just now being developed at some state and locallevels.400
The promulgation by any country of specific nationalguidelines for physical activity, such as modes and amounts,does not mandate physical activity but could still be consid-ered a policy intervention if such guidelines were subse-quently referenced and addressed in other legislative initia-tives that affect physical activity, such as legislation dealingwith schools and workplaces, transportation funding, the builtenvironment, and regulation of public lands, among others.For example, the US Dietary Guidelines for Americansdirectly inform the nutrition standards for foods and bever-ages served at schools, jails, and government workplaces.Consequently, the development of the first Physical ActivityGuidelines for Americans in 20089 may represent the begin-ning of incorporation of physical activity guidelines into USfederal policy. School-based mandates, such as requiringminimum time in PE classes or, for younger children, recessand play time, are discussed in “School and WorkplaceApproaches.”
In sum, consensus opinion from the writing group andothers suggests that specific national guidelines can improvepopulation physical activity by influencing subsequent policyand legislation, but further research and evidence are required(Table 8).
Direct Restrictions and Mandates: Smoking
Community Restrictions on Smoking in Public PlacesCommunity smoking restrictions prohibit smoking in some orall public places in a geographic locality, with 1 specific aimbeing to reduce exposure to secondhand smoke amongnonsmokers. Several quasi-experimental studies have evalu-ated the health effects of such bans, comparing communityrates of clinical events or hospitalizations in time periodsbefore versus after the ban and/or parallel assessments ofdisease rates in a nearby locality without a smoking ban(Supplementary Table 13). Most studies were ecological,evaluating overall rates of exposure and events in the popu-lation rather than how individual exposures were related toparticular coronary events. Durations of follow-up fromimplementation of the ban to assessment of end points variedacross studies from 0.2 to 3.0 years.
A 2009 IOM review of community smoking bans foundconsistent and substantial reductions in markers of tobacco-generated air pollution and particulate matter in places inwhich smoking was banned.401 The IOM report also foundsubstantial evidence that smoking bans were effective inreducing coronary events, based on critical reviews of 11quasi-experimental studies that examined smoking bans andchanges in acute coronary events.402–412 All studies demon-strated reductions in coronary event rates, with decreasesranging from �6% to 47%. Additionally, in 1 locality inwhich the ban was revoked, a subsequent increase in coronaryevents was seen. In studies that evaluated coronary ratesseparately for smokers versus nonsmokers, reductions weredemonstrated in both groups, consistent with the benefits ofreduced exposure to secondhand smoke among nonsmokers.
In 2 separate meta-analyses of these studies, the pooledrelative reduction in acute coronary events was 17% (95% CI,
8%–25%).413,414 The largest relative risk reductions were seenamong younger people and nonsmokers. Meta-regressionsuggested that benefits increased over time, with largerreductions in coronary events seen with longer durations offollow-up after the smoking ban was instituted.413
Since these reviews, 4 new reports of the effects ofsmoking bans on cardiovascular and respiratory conditionshave been published, all demonstrating reductions in cardio-vascular and/or respiratory events after implementation ofsmoking bans.415–418 Herman and Walsh415 studied Arizona’sMay 2007 statewide smoking ban, which prohibited smokingin most enclosed public places and places of employment, inrelation to rate of hospital admissions from January 2004 toMay 2008, stratified by the county-specific presence orabsence of preexisting smoking bans to separate the effects ofthe ban from temporal trends. When counties with no priorbans were compared with those with prior bans, Herman andWalsh found that those with no prior bans experiencedsignificant reductions in hospital admissions for conditionsdirectly affected by secondhand smoke, including acutemyocardial infarction (MI; 13%), angina (33%), stroke(14%), and asthma (22%). No significant differences wereseen for control conditions such as appendicitis, kidneystones, acute cholecystitis, and ulcers, each of which was notexpected to be affected by the smoking ban. Trachsel et alfound a 22% lower rate of incident acute MI in the year afterthe March 1, 2008, smoking ban in public buildings in theSwiss canton of Graubunden compared with the prior 2years.416 Graubunden had a stable population of �100 000 inthese years but also had a large transient tourist population.Rates in both residents and nonresidents were lower, whichsuggests a short-term benefit of the smoking ban.
Naiman et al evaluated hospital admission rates for multi-ple smoking-related conditions, including acute MI, angina,stroke, asthma, chronic obstructive pulmonary disease, andpneumonia/bronchitis, from January 1996, 3 years beforeinitial implementation of a smoking ban in restaurants andrelated settings in Toronto, Ontario, Canada, to March 2006,2 years after the last phase was implemented.417 Rates ofcardiovascular conditions decreased by 39% and admissionsfor respiratory conditions decreased by 33%; no changeswere observed in control cities or control end points. Dove etal evaluated rates of fatal MI before and after implementationof a comprehensive smoke-free workplace law in Massachu-setts in July 2004, stratified by cities/towns with and withoutprevious local smoking bans from 1999 through 2006.418 MImortality rates decreased by 9.2% after implementation of thelaw in cities and towns with no prior local smoking ban, witha smaller, not statistically significant decrease in localitiesthat did have a prior ban. The effect of the statewide ban onMI mortality was larger (�18.6%; P�0.001) after the firstyear of implementation.
As described in several studies, variability in the extent ofreductions in coronary events was explained by differentlevels of preexisting partial bans. Before the total public ban,different localities in these areas had particular configurationsof prior legislation, including preexisting less-restrictive
1546 Circulation September 18, 2012
by guest on February 6, 2016http://circ.ahajournals.org/Downloaded from

bans, different venues covered by the bans (such as offices,other workplaces, restaurants, or bars), and various levels ofcompliance with and enforcement of the bans. Localities withthe least preexisting partial bans experienced the largesteffects of reduced smoking exposure caused by the broaderbans.
In all these studies, other factors potentially associated withthe smoking ban, such as related media reports or outreachefforts, were difficult or impossible to separate from theimpact of the ban itself.401,412,413 The effects of smoking bansmay also influence or be synergistic with other cessationefforts. For example, Italian smokers who attempted cessa-tion through group counseling or use of bupropion were moresuccessful after a community smoking ban was instituted thantheir counterparts who participated in such cessation effortsbefore the ban.419 A smoking ban may also encourage otherhealth-promoting actions, such as people initiating a smokingban at home or quitting smoking. The combination of sucheffects may contribute to the full benefits of a smoking ban,such as reduced hospitalizations for childhood asthma420 andreduced occurrence of disease conditions in younger andmore recent smokers.421 Considerations of the best methodsfor modeling the different causal pathways that influence thetotal effects of smoking bans are ongoing.401,422
Economic arguments against smoking restrictions (ie, thatsuch bans hurt certain businesses that cater to smokers) arenot well substantiated in prospective studies. In 1 analysis,although some businesses did have to change their businessplans, overall bar and restaurant revenue was not reduced andmay even have increased after a smoking ban was imple-mented.423 Such findings may be intuitive given that in manycountries, the majority of people do not smoke. Smoking bansalso reduce cleaning costs and employee medical costs,11
providing further economic incentives to businesses to sup-port such bans.
In sum, the studies reviewed in the IOM report401 andrecent meta-analyses,412,413 in combination with several othermore recent studies, provide convincing evidence that com-munity smoking bans reduce rates of cardiovascular andsmoking-related respiratory events, at least in part throughlower exposure to secondhand smoke and possibly otherconcomitant effects (Table 8). The pooled analysis suggests asubstantial overall effect that increases over time.413
Workplace-Based Restrictions on SmokingSeveral studies have evaluated smoking restrictions in theworkplace (Supplementary Table 13). In a systematic reviewand meta-analysis of 26 quasi-experimental studies, theimplementation of a smoke-free workplace policy was asso-ciated with pooled reductions in absolute smoking prevalenceof 3.8% (95% CI, 2.8%–4.7%) and in cigarette consumptionamong smokers of 3.1 cigarettes per day (95% CI, 2.4–3.8).424 Overall, smoke-free workplace policies were associ-ated with a 29% reduction (95% CI, 11%–53%) in totalcigarettes smoked. A more recent systematic review thatincluded 37 studies, including 13 quasi-experimental studies,demonstrated similar results, with smoke-free policies in theworkplace (majority of studies) or community (some studies)linked to reduced prevalence of active smoking, more at-
tempts to quit and higher quit rates, and fewer overallcigarettes smoked per day.425 Some limited evidence suggeststhat the effects of smoke-free workplace policies may belarger in men than in women and among people with greatereducation, but favorable effects were generally seen in allgroups studied.426–432
Similarly, in a prospective analysis of employees at worksitesin 20 US and Canadian cities between 1993 and 2001, peoplewho worked in places that changed to or maintained smoke-freepolicies were 1.9 times more likely to quit (OR�1.92; 95% CI,1.11–3.32), and continuing smokers decreased their averagedaily consumption by 2.57 cigarettes per day compared withpeople whose worksites did not have a smoke-free policy.433
These associations were strongest in worksites that had smoke-free policies in place in both 1993 and 2001. Similar findingswere seen in analyses of smoking cessation rates in US hospitalsthat instituted smoke-free policies, compared with rates beforethe ban434 or with workplaces without smoke-free policies in thesame communities.435 In cross-sectional analyses in Japan, theUnited States, and Switzerland, employees at sites with morerestrictive smoke-free policies were less likely to be currentsmokers and, when assessed, smoked fewer cigarettes per day ifthey were still active smokers.436–438 Similar findings have beenseen in cross-sectional studies among teenaged workers inworksites.439
Smoke-free workplace policies have also been associatedwith lower exposure to secondhand smoke. In a systematicreview, studies using either self-reported (n�3) or biochemical(n�3) measures of exposure all found significant reductions insecondhand smoke exposure after implementation of a smoke-free workplace policy.424 Among worksites that are not fullysmoke-free, the designation of specific smoking areas is associ-ated with fewer cigarettes smoked by smokers and less exposureto secondhand smoke among nonsmokers. For instance, in theprospective analysis of US and Canadian worksites, in those thatwere not smoke-free but had designated smoking areas, employ-ees consumed 2.22 fewer cigarettes per day than employees inworksites with no smoking restrictions.433 In a cross-sectionalstudy in Massachusetts, compared with employees in smoke-free worksites, those in worksites with designated smokingareas had a 2.9-fold higher odds (95% CI, 2.4 –3.5) ofbeing exposed to secondhand smoke and were exposed 1.7times longer (95% CI, 1.4 –2.2); employees in worksiteswhere smoking was permitted had a 10.3-fold higher odds(95% CI, 6.7–15.9) of being exposed to secondhand smokeand were exposed 6.34 times longer (95% CI, 4.37–9.21).440
Lower exposure to secondhand smoke was also reported byemployees of worksites with smoke-free policies in US,Swiss, and Chinese studies compared with worksites withoutsuch policies.434,438,441
As seen with community-level smoking restrictions,worksite-based restrictions can be synergistic with othercessation efforts. After the extension of a smoke-free indoorpolicy to include outdoor spaces at 1 worksite, participantswho enrolled in smoking cessation programs had higher6-month quit rates after the extension (52.4%) than before(43.0%); post-ban participants were 80% less likely to relapsethan pre-ban participants, and nonquitters decreased theirconsumption by 6.6 cigarettes per day, a 39% decrease.442
Mozaffarian et al Population Approaches to Diet, Activity, and Smoking 1547
by guest on February 6, 2016http://circ.ahajournals.org/Downloaded from

In sum, full smoke-free policies at the workplace areconsistently linked with increased smoking cessation, fewercigarettes consumed among those who continue to smoke,and decreased exposure to secondhand smoke (Table 8).Partial policies, such as designated smoking areas, are con-sistently linked with fewer cigarettes smoked by activesmokers and less exposure to secondhand smoke amongnonsmokers. A 2009 AHA policy statement supports theseconclusions and advocates for comprehensive smoke-freelaws for all workplaces and public environments.443
School-Based Restrictions on SmokingSeveral studies have evaluated the potential influence ofcampus smoking restrictions and enforcement of such restric-tions on smoking among students (Supplementary Table 13).In some, but not other, cross-sectional observational studies,students at schools with stronger policies restricting tobaccouse were less likely to be current smokers.210,444–449 A limitednumber of quasi-experimental evaluations with only short-term (1–4 months) follow-up demonstrated mixed findings,with no consistent evidence for the effects of campus smok-ing restrictions on active smoking or cessation.450,451
In contrast to studies assessing the presence of anti-tobaccopolicies, cross-sectional observational studies evaluating thelevel of enforcement of these policies more consistently foundlinks between stronger enforcement and lower rates of smokingamong students.210,452–458 Interestingly, in some studies, teach-ers’ smoking behaviors on school grounds were also stronglylinked (2–5-fold relation) to students’ smoking.446,447
In sum, there is mixed evidence for the effectiveness ofschool-based smoking restrictions on reducing smoking, andfurther investigation is required (Table 8).
Residence-Based Restrictions on SmokingIn recent systematic reviews of multiple cross-sectional andlongitudinal studies, residence smoking restrictions werestrongly and consistently linked to lower smoking prevalence,lower average cigarette consumption among smokers, higherrates of cessation attempts, and lower rates of relapse inadults; and less smoking, less progression to experimentation,and less exposure to secondhand smoke in children459–461
(Supplementary Table 13). The magnitude of the relationobserved was often very large, including �2-fold differencesin many of these associations. The results of most individualstudies support the findings of these systematic re-views.439,452,462–469 In addition to detached homes, multiunithousing may be a reasonable target for smoking restrictionsto reduce secondhand smoke exposure,470–473 but the writinggroup did not identify studies evaluating the effectiveness ofsuch interventions. In sum, the evidence supports the effec-tiveness of residence-based smoking restrictions for reducingsmoking (Table 8).
Restrictions on Advertising and PromotionThe powerful effects of tobacco advertising and promotion onconsumer behavior are well documented, particularly amongchildren and adolescents.22,474–478 In longitudinal studies,exposure to tobacco marketing is consistently related topositive attitudes and beliefs about tobacco use, experiment-ing with cigarettes, and becoming a smoker, with a dose-
response relation between extent of exposure to marketingand risk. These effects are seen with both traditional market-ing approaches and other exposures, such as point-of-salepromotion (which represents a substantial proportion oftobacco industries’ marketing budgets in many localities), aswell as pro-tobacco depictions in films, television shows, andgaming videos. Similar findings are seen across a range ofcultural and socioeconomic backgrounds.
On the basis of these well-established relationships, restric-tions on advertising and marketing of tobacco products toyouth have been a mainstay of anti-tobacco efforts.477 Ingeneral, such restrictions have been implemented as part ofmulticomponent strategies to reduce smoking, so that theindependent magnitude of their effects is difficult to quantifydirectly. Overall, the clear impact of advertising on tobacco-related attitudes and behaviors22,474–478 provides robust evi-dence that the absence or limitation of such advertisingreduces their pro-tobacco effects in youth. Because thetobacco industry has become highly skilled at exploitingmultiple potential traditional and nontraditional avenues formarketing, more complete advertising and promotional bansare more successful than partial restrictions in both developedand developing countries.479,480 On the basis of this body ofconvincing evidence, the Framework Convention on TobaccoControl has called for comprehensive bans on tobacco adver-tising in all nations.480 A review of internal industry docu-ments, trade publications, published research, and govern-ment reports indicates that cigarette packs themselves wouldremain a key promotional vehicle after such advertising bans,and the mandating of plain packaging of all tobacco productshas been recommended.481
In sum, there is consistent evidence to support the effec-tiveness of restrictions on advertising and marketing oftobacco products for reducing tobacco use (Table 8).
Healthcare Systems ApproachesAlthough a complete systematic review of healthcare systemsinterventions to improve lifestyle was beyond the scope ofthis report, the writing group reviewed key evidence forpotential effective strategies. A 2010 AHA scientific state-ment provides a strong evidence base for effective behavioralchange strategies at the healthcare level.16 Several approacheshave been effective, including (1) individual-oriented ses-sions to assess readiness for behavior change, collaborativelyidentify goals, and develop plans to achieve these goals; (2) afocus on specific, proximal goals for targeted behaviors; (3)self-monitoring with oral, written, and/or electronic feedback;(4) group sessions for peer support, group problem solving,and skill development for behavior change; and (5) trainedmotivational interviewing when people are ambivalent aboutchange.36,413 Focused behavior change goals are most effec-tive.16,36 Thus, clinical providers should work with patients tohelp prioritize a limited set of relevant food and activityhabits and, for smokers, tobacco reduction and cessationgoals.3,4,8,482 The use of multiple educational techniques,including live and media presentations, can improve health-care provider knowledge about and use of behavioralchange.483 Helpful supplementary approaches include long-term support from family, peers, or community programs,
1548 Circulation September 18, 2012
by guest on February 6, 2016http://circ.ahajournals.org/Downloaded from

particularly after the initial months when adherence canwane, and use of electronic feedback.413,484,485
Several aspects of healthcare systems can influence andfoster these evidence-based behavior change strategies. First,medical training across all levels should incorporate andprioritize education for care providers in these strategies.Healthcare systems should also develop and promote efficienttelephone or electronic approaches to monitor diet quality,physical activity, adiposity, and smoking; to schedule andtrack regular individual or group visits for education andbehavioral support; and to provide individualized feedback topatients on their efforts to change behaviors.486–488 Impor-tantly, healthcare systems should also restructure qualitybenchmarks and reimbursement guidelines to include specificfocus on health behaviors, including dietary quality andphysical activity.486–488
Although relatively few healthcare systems changes havefocused on diet or physical activity specifically, several ap-proaches are being initiated for tobacco and obesity control. Forinstance, many electronic medical records systems have fieldsfor tobacco use and body weight, although consistency andaccuracy of their use remains variable. In addition, in 2003, theUS Centers for Medicare and Medicaid Services guidelines forpneumonia, heart failure, and MI admissions began to requiresmoking cessation counseling as a performance measure forreimbursement.489 The Joint Commission on Accreditation ofHealthcare Organizations then added smoking cessation coun-seling as a criterion for excellence, and the combined qualitymeasure went into effect in January 2005. These measures weresuccessful in increasing counseling,490 although the effects ontobacco use have not been well studied. One retrospectiveanalysis of 889 consecutive smokers treated for acute MI at 19US hospitals in 2003 to 2004 did not find higher smokingcessation rates at 1 year in patients who met the Centers forMedicare and Medicaid Services documentation requirement forcounseling than in those without this documentation.491 Re-cently, the Joint Commission announced plans for a requirementto assess smoking and offer cessation counseling to all hospital-ized patients.492
In sum, specific changes in healthcare systems can be acrucial complement to other population behavior changeapproaches. These include changes in systems for medicaltraining, electronic medical records, structuring of individualand group visits, patient and provider feedback, qualitybenchmarks, and reimbursement guidelines.
Surveillance and Monitoring Systems forInforming and Evaluating Population StrategiesSeveral national and subnational surveillance systems currentlyexist for monitoring lifestyle habits and related health outcomesin the United States (Supplementary Table 14). Many arecoordinated and led by the CDC, for which public healthsurveillance is a key role; other federal and state agencies alsoperform surveillance. Examples of different surveillance meth-odologies for lifestyle factors include telephone-based surveys ofadults (eg, the BRFSS, the American Time Use Survey),household studies conducted with questionnaires or face-to-faceinterviews (eg, the National Health Interview Study), and manythat try to reach children and are often conducted in schools (eg,
the National Youth Tobacco Survey, the School Health Policiesand Programs Study). Some surveillance methods, such asNHANES or the Canadian Health Measures Survey, also cap-ture extensive clinical and laboratory data. NHANES, for exam-ple, measures levels of cotinine, a biomarker of nicotine expo-sure, in a nationally representative sample of smokers, includingoversampling of blacks and Hispanics. Cotinine measurementsmade in successive years are used to assess longitudinal trends inboth intensity of smoking and exposure to secondhand smoke.International surveillance methods of behavioral factors areslowly growing, typically based on cooperation between gov-ernment agencies in different countries or coordinated by inter-national agencies such as the WHO. Examples include theGlobal Youth Tobacco Surveillance system and the WHOSTEPwise approach to Surveillance surveys (www.who.int/chp/steps/en/). Based on the writing group’s review, effective behav-ioral surveillance systems should include at least the followingcharacteristics:
● Standardized, validated metrics and surrogate markersrelating to dietary habits, physical activity, and tobacco usethat include prevalence, incidence, marketing/countermar-keting strategies, clinical practice guidelines, and/or envi-ronmental changes
● Repeated longitudinal assessments conducted at regularintervals with consistent methods
● Assessment of trends in both the overall population andsubgroups, especially at-risk populations
● Data collection at national, state, and local levels asappropriate
● Methods to minimize unnecessary duplication of otherongoing surveillance efforts
Overall, adequate surveillance and monitoring systems areessential to understand and select appropriate metrics ofhealth behaviors to follow over time, to inform the design ofpopulation-level programs to improve these behaviors, tomonitor the effects of implemented policies, and to elucidategaps and barriers in our knowledge and methods. Quantifi-cation of the current distributions of behaviors, risk factors,diseases, and their correlates and determinants in the overallpopulation and in more vulnerable subpopulations is neces-sary for informed selection of specific targets for interventionand for reducing disparities. Quantification of changes andtrends over time is necessary to evaluate the impact ofinterventions on behaviors and related health outcomes.
Gaps in Current Diet, Physical Activity, andTobacco SurveillanceFor most lifestyle behaviors, surveillance is generally self-reported. There are limitations to such data, including underre-porting or overreporting, gaps in memory or recall, and self-bias.More objective measures, such as biomarkers of some dietaryhabits, pedometer or accelerometer data for physical activity, orplasma, saliva, or urine cotinine levels for smoking, are helpfuland should be added whenever possible to provide more preciseestimations of these behaviors. Conversely, even self-reporteddietary activity, physical activity, and tobacco use data areconsistently linked to disease risk in numerous studies, and thus,self-reported data obtained via standardized, validated question-
Mozaffarian et al Population Approaches to Diet, Activity, and Smoking 1549
by guest on February 6, 2016http://circ.ahajournals.org/Downloaded from

naires are a useful mainstay for simple, effective, and cost-efficient surveillance methods.
Tobacco use surveillance methods have improved overtime and can be relatively comprehensive, including moni-toring of tobacco-related behaviors, prevalence, biomarkersof exposure, attitudes, health outcomes, and policies, as wellas monitoring of marketing and its impact on consumerbehavior. Some approaches also capture exposure to second-hand tobacco smoke, existing school curriculum and policies,worksite smoking policies and practices, local communityordinances related to tobacco use and indoor air quality, andprevention policies to advise smokers to quit in the healthcaresetting. In the United States, improvements in tobacco sur-veillance have informed and driven successful, comprehen-sive tobacco control and prevention policy in recent decades.
In comparison, current methods for monitoring dietary andphysical activity habits and related knowledge, attitudes, poli-cies, marketing, and industry practices are relatively crude.493
Several national health surveys capture no diet or physicalactivity measures (Supplementary Table 14).494 Even for thosethat do, the diversity of exposures makes dietary and physicalactivity surveillance more challenging than for tobacco. In theUnited States, for example, labeled food products comprise up to600 000 unique UPCs (universal product codes), even after theexclusion of products purchased in small amounts.494 Thiscomplexity is increased by continual reformulation of productsby the food industry, which reformulates foods more frequently(eg, �75 000 products every 2 years) than they are measured.495
The number and diversity of restaurant and other prepared foodsadd further to the challenge. Many metrics of dietary quality arealso not standardized, including, for example, carbohydratequality (eg, what is the best metric to assess whether a productis “whole grain”) or added sugars (eg, �11% of all USfoods/beverages contain fruit juice concentrate as a sweetener,but this is not measured as an “added sugar”). Other limitationsof current diet surveillance methods are an inability to linkconsumption choices systematically with a variety of determi-nants, including food programs, food access, policy changes (eg,shifts in the Supplemental Nutrition Assistance Program), andeconomic factors such as income and types of employ-ment.493,496 More systematic data are also needed on prices andyield of key foods, such as fruits and vegetables, to providerobust data for guiding agricultural policy. Similarly, manysurveillance systems capture only certain types of physicalactivity, such as leisure-time activity and exercise. Other rele-vant activities are often not assessed, including commutingactivity, work activity, total activity (ie, all movements incorpo-rated into activities of daily living), and sedentary activity (eg,TV viewing; other screen time; time spent sitting at work,school, or home).
Innovative methods for incorporating diet, physical activity,and related policy metrics into existing survey systems shouldalso be considered. For example, the USDA collects a nationalfarmers’ market manager survey that could include more sur-veillance data related to diet, policies, and health. Similarly,economic development projects that support supermarkets orgrocery stores could include collection of diet and health-relatedmetrics in stores and communities. As recently reviewed by theAHA, several states are implementing new methods for BMI
surveillance in children, such as through school immunizationrecords or during wellness visits to the doctor.443 Such programscan implement BMI surveillance (more widely accepted) orBMI assessment and reporting (ie, identification of children whoare overweight or obese), followed by notification of theirparents (more controversial). To increase impact, such surveil-lance should be reported in an aggregate manner to the stateDepartment of Health so that progress can be tracked and ideallypassed on to a national database.
A major gap in surveillance is the absence of systematiccollation, monitoring, and evaluation of behavior changepolicies themselves. Such surveillance should occur at local,regional, and national levels and include proposed programs,enactment, implementation, costs, sustainability, reach overtime, and, of course, effectiveness.
Recommendations for Use of CurrentSurveillance ProgramsDespite these limitations, current surveillance systems can pro-vide useful information to evaluate the impact of population-level strategies on behavior change, risk factors, and chronicdisease, as well as whether policies have a similar or differentimpact on particularly vulnerable populations. In the UnitedStates, for example, prevalence data from the BRFSS and theNational Youth Tobacco Survey have been helpful for determin-ing the impact of raising tobacco excise taxes on tobacco use,especially in youth. NHANES has documented progress inreducing population exposure to secondhand smoke. LocalNHANES data could be used to measure urinary sodium levelsto assess the impact of sodium reduction in the food supply. TheAHA is using NHANES data to monitor progress towarddietary, physical activity, and tobacco goals for achievingcardiovascular health.3,5 Globally, the WHO STEP data havebeen important for estimating the impact of low fruit andvegetable consumption on mortality in both developed anddeveloping nations.13 The 2010 Global Burden of Diseasesproject will substantially expand the assessment of global dietaryrisk factors,497 and updates of this work will be important toassess dietary changes over time and the impact of nationaldietary policies. Local surveillance is also important, as national-,state-, or even county-level surveillance data may not be sufficientto assess the effectiveness of some community-based efforts, suchas in cities, communities, schools, and workplaces. Local datacollection will be crucial in such circumstances. As populationstrategies increasingly focus on diet, physical activity, and tobaccouse, it will be important to identify how current surveillance systemscan inform the effectiveness of such policies and, importantly, refinethese surveillance systems over time to help prioritize populationapproaches and maximize their impact.
Research GapsSeveral key research gaps were identified. Several particularmulticomponent strategies appear promising but require furtherinvestigation to confirm effectiveness, such as combining sus-tained, focused media/educational campaigns with local-environment changes to improve physical activity and combin-ing simple labels/icons with local-environment changes (eg,changes in availability) to improve diet. Results of worksite-based interventions to increase physical activity (eg, by altering
1550 Circulation September 18, 2012
by guest on February 6, 2016http://circ.ahajournals.org/Downloaded from

the physical environment for use of stairs, setting aside worktime for exercise, encouraging walking, or adding a worksitefitness center) are also encouraging but based on a small numberof studies.
Additional research is also needed on the effects of severalfinancial and economic strategies. The effects of long-termindividual financial incentives and penalties (eg, based oninsurance rates) require further study with more robust designsthat assess discrete levels and types of incentives, minimizeconfounding intervention components, and are of sufficientduration to assess sustainability. Similarly, the effects of finan-cial and regulatory requirements on healthcare systems topromote healthy behaviors need more rigorous study. Whilesufficient evidence exists to implement changes in food andbeverage pricing to improve dietary behavior, more researchshould assess the potential additional effects on consumption ofsubstitutes and complements for these foods/beverages.
The writing group found a large and rapidly growing numberof studies assessing how altering the local community environ-ment may influence diet and physical activity. Several facets ofthe environment appear promising for interventions, but widevariations in definitions and methods for assessment of environ-mental exposures, behavioral outcomes, and potential confound-ing variables, as well as in analysis methods, limit the ability topool or compare results across studies. Better standardization ofthese methods is needed. Additionally, nearly all of these studieswere cross-sectional, which limits inference about the directionof the association; for example, rather than the environmentaffecting behavior, people may choose to live in neighborhoodshaving or not having certain characteristics based on their ownbehavior preferences, or the average preferences of residents ina neighborhood may influence the environment (eg, the types ofstores that open and are successful). Thus, more longitudinal andquasi-experimental studies of the local environment and lifestyleare essential.
Major gaps were identified in the strength of evidence foreffectiveness of several types of interventions and policies thatare currently being implemented. These include, for example,the use of front-of-pack labels or icons on packaged foods or ofmenu labeling in restaurants; sustained individual financialdisincentives, such as differences in insurance rates, for poorlifestyle; business tax incentives for comprehensive worksitewellness programs; and mandating of an increased number of PEclasses led by trained PE teachers at schools without an accom-panying multicomponent strategy. The implementation ofpolicy-level strategies does not always require perfect evidence;risks versus benefits and associated costs and alternative ap-proaches may warrant implementation even without strongevidence. Nonetheless, these findings highlight the need forintegrated rigorous evaluation of the impact of these policies ontargeted behaviors and health outcomes as they are implementedin practice.
For many interventions, there was limited or inconsistentevidence to evaluate the potential heterogeneity of effects, forexample, depending on the population (children, adults, specificvulnerable subgroups, etc) or level of intervention (local, state,federal). For some strategies, such as media and educationalcampaigns or labeling and information approaches, a few studiessuggested less effectiveness or awareness in lower education or
minority subgroups, but others did not. In contrast, for otherstrategies, such as taxation or subsidies, more consistent evi-dence suggested stronger effects in youth or lower-income ordisadvantaged populations. Similarly, local environmental strat-egies appeared to hold particular promise in disadvantagedsubgroups, largely based on greater potential for improving theenvironment in such neighborhoods; however, nearly all studieswere cross-sectional, which limits inferences about the effective-ness of such approaches in any population. Direct restrictionsand mandates appear especially promising for influencing theentire population and even reducing disparities, given that theirtargets (eg, excess intake of unhealthy foods, insufficient intakeof healthy foods, tobacco use) are often concentrated in disad-vantaged subgroups. Further investigation of the potential het-erogeneity for each of these strategies is needed, in particularbecause identified heterogeneity could be useful, for example, toselect interventions with stronger effects in vulnerablesubpopulations.
For some approaches, such as labeling/information and schooland workplace strategies, the long-term sustainability of conse-quent behavior changes was not well established. The effective-ness of many individual-based (eg, clinical) behavior changestrategies are known to wane over time when the interventionceases.16 This also appeared to be true for some types ofpopulation-based interventions, such as media or educationapproaches, for which sustained population responses requiredongoing educational efforts. On the other hand, an advantage ofmany of the identified population-based strategies was theirpotential for inherent sustainability, for example, by altering thephysical environment, pricing or availability of products, or legalor social acceptance of specific products or behaviors.
Finally, although much can be done with current national andinternational surveillance systems, the writing group identifiedthe need for further improvements, especially for dietary, phys-ical activity, and sedentary behaviors, to better capture theselifestyle factors and also their relevant determinants, such aspolicies, environmental correlates, and industry practices.
ConclusionsThis systematic review identified and graded a range ofevidence-based population-based strategies to effectively pro-mote lifestyle change. The findings inform potential partnershipsand strategies to successfully address suboptimal diet, inactivity,and smoking, which are each major preventable causes of poorhealth globally. New strategic initiatives and partnerships areneeded to translate this evidence into action.
AcknowledgmentsWe are grateful to Jennifer Fleming, MS, RD; Lindsay Greiner, RD;Fadar Otite, MD, MPH; and Namasha Schelling, BS, for assistancewith literature searches, data summaries, and citation managementduring the preparation of this manuscript. We thank SimonCapewell, DSc, and Karen Glanz, PhD, MPH, for their review andhelpful comments on an earlier version of this manuscript, as well asthe 4 peer reviewers of this manuscript for their insightful commentsand suggestions during the peer review process.
Mozaffarian et al Population Approaches to Diet, Activity, and Smoking 1551
by guest on February 6, 2016http://circ.ahajournals.org/Downloaded from

Disclosures
Writing Group Disclosures
Writing Group Member Employment Research GrantOther Research
SupportSpeakers’
Bureau/Honoraria Expert WitnessOwnership
InterestConsultant/
Advisory Board Other
Dariush Mozaffarian Harvard School of PublicHealth
None None None None None None None
Ashkan Afshin Harvard School of PublicHealth
None None None None None None None
Neal L. Benowitz University of California,San Francisco
None None None Testimony againsttobacco companies
related tonicotine addiction†
Merck stocksold during
development†
Pfizer* None
Vera Bittner University of Alabamaat Birmingham
None None None None None None None
Stephen R. Daniels Denver Health ScienceCenter
None None None None None None None
Harold A. Franch Emory University None None None None None None None
David R. Jacobs, Jr University of Minnesota NIH/NHLBI† None None None None California WalnutCommission*
None
William E. Kraus Duke University MedicalCenter
None None None None None None None
Penny M. Kris-Etherton Pennsylvania StateUniversity
Almond Board ofCalifornia†; National
Cattleman’s BeefAssociation†; ThePeanut Institute†
None None None None AmericanSociety for Nutrition
and NationalRestaurant
Association’sHealthy RestaurantInitiative and Menu
Partnership*; Buildinga Healthier America*;
California WalnutCommission*;Health FitnessCorporation*;
MonaVie†; Unilever*
None
Debra A. Krummel University of Cincinnati None None None None None None None
Barry M. Popkin University of North Carolinaat Chapel Hill
Danone Waters†;Nestle Waters*
None None None None None None
Laurie P. Whitsel Director of Policy Researchfor American Heart
Association
None None None None None None None
Neil A. Zakai University of Vermont None None None None None None None
This table represents the relationships of writing group members that may be perceived as actual or reasonably perceived conflicts of interest as reported on the DisclosureQuestionnaire, which all members of the writing group are required to complete and submit. A relationship is considered to be “significant” if (1) the person receives $10 000or more during any 12-month period, or 5% or more of the person’s gross income; or (2) the person owns 5% or more of the voting stock or share of the entity, or owns$10 000 or more of the fair market value of the entity. A relationship is considered to be “modest” if it is less than “significant” under the preceding definition.
*Modest.†Significant.
Reviewer Disclosures
Reviewer Employment Research GrantOther Research
SupportSpeakers’ Bureau/
HonorariaExpert
WitnessOwnership
InterestConsultant/
Advisory Board Other
Stephen Cook University of Rochester NHLBI K23† None None None None None None
Rachel K. Johnson University of Vermont Dairy ResearchInstitute*
None National DairyCouncil*
None None International DairyFoods Association*
None
Allison Karpyn Food Trust of Philadelphia Robert Wood JohnsonFoundation*†
None None None None None None
Jim Sallis San Diego StateUniversity
NIH† None SPARK Programs ofSchool Specialty Inc†
None Santech Inc† SPARK Programs† None
This table represents the relationships of reviewers that may be perceived as actual or reasonably perceived conflicts of interest as reported on the DisclosureQuestionnaire, which all reviewers are required to complete and submit. A relationship is considered to be “significant” if (1) the person receives $10 000 or moreduring any 12-month period, or 5% or more of the person’s gross income; or (2) the person owns 5% or more of the voting stock or share of the entity, or owns$10 000 or more of the fair market value of the entity. A relationship is considered to be “modest” if it is less than “significant” under the preceding definition.
*Modest.†Significant.
1552 Circulation September 18, 2012
by guest on February 6, 2016http://circ.ahajournals.org/Downloaded from

References1. Mathers CD, Loncar D. Projections of global mortality and burden of
disease from 2002 to 2030. PLoS Med. 2006;3:e442.2. Institute of Medicine. Promoting Cardiovascular Health in the
Developing World: A Critical Challenge to Achieve Global Health.Washington, DC: The National Academies Press; 2010.
3. Lloyd-Jones DM, Hong Y, Labarthe D, Mozaffarian D, Appel LJ, VanHorn L, Greenlund K, Daniels S, Nichol G, Tomaselli GF, Arnett DK,Fonarow GC, Ho PM, Lauer MS, Masoudi FA, Robertson RM, Roger V,Schwamm LH, Sorlie P, Yancy CW, Rosamond WD. Defining andsetting national goals for cardiovascular health promotion and diseasereduction: the American Heart Association’s strategic impact goalthrough 2020 and beyond. Circulation. 2010;121:586–613.
4. Danaei G, Ding EL, Mozaffarian D, Taylor B, Rehm J, Murray CJ,Ezzati M. The preventable causes of death in the United States: com-parative risk assessment of dietary, lifestyle, and metabolic risk factors.PLoS Med. 2009;6:e1000058.
5. Roger VL, Go AS, Lloyd-Jones DM, Adams RJ, Berry JD, Brown TM,Carnethon MR, Dai S, de Simone G, Ford ES, Fox CS, Fullerton HJ,Gillespie C, Greenlund KJ, Hailpern SM, Heit JA, Ho PM, HowardVJ, Kissela BM, Kittner SJ, Lackland DT, Lichtman JH, Lisabeth LD,Makuc DM, Marcus GM, Marelli A, Matchar DB, McDermott MM,Meigs JB, Moy CS, Mozaffarian D, Mussolino ME, Nichol G, PaynterNP, Rosamond WD, Sorlie PD, Stafford RS, Turan TN, Turner MB,Wong ND, Wylie-Rosett J. Heart disease and stroke statistics–2011update: a report from the American Heart Association. Circulation.2011;123:e18–e209.
6. Folsom AR, Yatsuya H, Nettleton JA, Lutsey PL, Cushman M,Rosamond WD. Community prevalence of ideal cardiovascular health,by the American Heart Association definition, and relationship withcardiovascular disease incidence. J Am Coll Cardiol. 2011;57:1690–1696.
7. Popkin BM. Global nutrition dynamics: the world is shifting rapidlytoward a diet linked with noncommunicable diseases. Am J Clin Nutr.2006;84:289–298.
8. Mozaffarian D, Appel LJ, Van Horn L. Components of a cardiopro-tective diet: new insights. Circulation. 2011;123:2870–2891.
9. US Department of Health and Human Services. 2008 Physical ActivityGuidelines for Americans. Washington, DC: US Dept of Health andHuman Services; 2008.
10. US Department of Health and Human Services, Centers for DiseaseControl and Prevention, National Center for Chronic Disease Preventionand Health Promotion, Office on Smoking and Health. The HealthConsequences of Smoking: A Report of the Surgeon General. Atlanta,GA: US Dept of Health and Human Services; 2004.
11. US Department of Health and Human Services, Centers for DiseaseControl and Prevention, Coordinating Center for Health Promotion,National Center for Chronic Disease Prevention and Health Promotion,Office on Smoking and Health. The Health Consequences of InvoluntaryExposure to Tobacco Smoke: A Report of the Surgeon General. Atlanta,GA: US Dept of Health and Human Services; 2006.
12. Mozaffarian D, Capewell S. United Nations’ dietary policies to preventcardiovascular disease. BMJ. 2011;343:d5747.
13. Ezzati M, Lopez AD, Rodgers A, Vander Hoorn S, Murray CJ. Selectedmajor risk factors and global and regional burden of disease. Lancet.2002;360:1347–1360.
14. General Assembly of the United Nations. High-level meeting on non-communicable diseases. 2011. http://www.un.org/en/ga/president/65/issues/ncdiseases.shtml. Accessed June 25, 2012.
15. Frieden TR, Berwick DM. The “Million Hearts” initiative: preventingheart attacks and strokes. N Engl J Med. 2011;365:e27.
16. Artinian NT, Fletcher GF, Mozaffarian D, Kris-Etherton P, Van Horn L,Lichtenstein AH, Kumanyika S, Kraus WE, Fleg JL, Redeker NS,Meininger JC, Banks J, Stuart-Shor EM, Fletcher BJ, Miller TD, HughesS, Braun LT, Kopin LA, Berra K, Hayman LL, Ewing LJ, Ades PA,Durstine JL, Houston-Miller N, Burke LE. Interventions to promotephysical activity and dietary lifestyle changes for cardiovascular riskfactor reduction in adults: a scientific statement from the AmericanHeart Association. Circulation. 2010;122:406–441.
17. Rose G. Sick individuals and sick populations. Int J Epidemiol. 1985;14:32–38.
18. Blackburn H. Population strategies of cardiovascular disease prevention:scientific base, rationale and public health implications. Ann Med. 1989;21:157–162.
19. Kumanyika SK, Obarzanek E, Stettler N, Bell R, Field AE, FortmannSP, Franklin BA, Gillman MW, Lewis CE, Poston WC 2nd, Stevens J,Hong Y. Population-based prevention of obesity: the need for compre-hensive promotion of healthful eating, physical activity, and energybalance: a scientific statement from the American Heart AssociationCouncil on Epidemiology and Prevention, Interdisciplinary Committeefor Prevention (formerly the expert panel on population and preventionscience). Circulation. 2008;118:428–464.
20. Yusuf S, Hawken S, Ounpuu S, Dans T, Avezum A, Lanas F, McQueenM, Budaj A, Pais P, Varigos J, Lisheng L. Effect of potentially modi-fiable risk factors associated with myocardial infarction in 52 countries(the INTERHEART study): case-control study. Lancet. 2004;364:937–952.
21. National Institutes of Health. State-of-the-science conference statement:tobacco use: prevention, cessation, and control. Ann Intern Med. 2006;145:839–844.
22. Institute of Medicine. Ending the Tobacco Problem: A Blueprint for theNation. Washington, DC: The National Academies Press; 2007.
23. Angell SY, Silver LD, Goldstein GP, Johnson CM, Deitcher DR,Frieden TR, Bassett MT. Cholesterol control beyond the clinic: NewYork City’s trans fat restriction. Ann Intern Med. 2009;151:129–134.
24. He FJ, MacGregor GA. A comprehensive review on salt and health andcurrent experience of worldwide salt reduction programmes. J HumHypertens. 2009;23:363–384.
25. Matson-Koffman DM, Brownstein JN, Neiner JA, Greaney ML. Asite-specific literature review of policy and environmental interventionsthat promote physical activity and nutrition for cardiovascular health:what works? Am J Health Promot. 2005;19:167–193.
26. Dietz WH, Benken DE, Hunter AS. Public health law and the preventionand control of obesity. Milbank Q. 2009;87:215–227.
27. Lytle LA. Measuring the food environment: state of the science. Am JPrev Med. 2009;36:S134–S144.
28. Sallis JF, Glanz K. Physical activity and food environments: solutions tothe obesity epidemic. Milbank Q. 2009;87:123–154.
29. Story M, Giles-Corti B, Yaroch AL, Cummins S, Frank LD, Huang TT,Lewis LB. Work group IV: future directions for measures of the foodand physical activity environments. Am J Prev Med. 2009;36:S182–S188.
30. Larson NI, Story MT, Nelson MC. Neighborhood environments: dis-parities in access to healthy foods in the U.S. Am J Prev Med. 2009;36:74–81.
31. Powell LM, Chaloupka FJ. Food prices and obesity: evidence and policyimplications for taxes and subsidies. Milbank Q. 2009;87:229–257.
32. Harnack LJ, French SA. Effect of point-of-purchase calorie labeling onrestaurant and cafeteria food choices: a review of the literature. Int JBehav Nutr Phys Act. 2008;5:51.
33. Magnus A, Haby MM, Carter R, Swinburn B. The cost-effectivenessof removing television advertising of high-fat and/or high-sugar foodand beverages to Australian children. Int J Obes (Lond). 2009;33:1094 –1102.
34. Papadakis S, Moroz I. Population-level interventions for coronary heartdisease prevention: what have we learned since the North Karelia proj-ect? Curr Opin Cardiol. 2008;23:452–461.
35. Horowitz CR, Robinson M, Seifer S. Community-based participatoryresearch from the margin to the mainstream: are researchers prepared?Circulation. 2009;119:2633–2642.
36. World Health Organization. Interventions on diet and physical activity:what works. 2009. http://www.who.int/dietphysicalactivity/whatworks/en/index. Accessed December 28, 2010.
37. Framework for program evaluation in public health. MMWR RecommRep. 1999;48:1–40.
38. Taylor-Powell E, Henert E. Developing a logic model: teaching andtraining guide. 2008. http://www.worldbridgeresearch.com/files/Logic_Models_Teaching_Manual.pdf. Accessed March 25, 2012.
39. The Health Impact Project. 2010. http://www.healthimpactproject.org/.Accessed March 25, 2012.
40. Collins J, Koplan JP. Health impact assessment: a step toward health inall policies. JAMA. 2009;302:315–317.
41. US Department of Agriculture. Economic Research Service; 1999.http://www.ers.usda.gov. Accessed March 25, 2012.
42. State of the Plate: 2010 Study on America’s Consumption of Fruits &Vegetables. http://www.pbhfoundation.org/pdfs/about/res/pbh_res/stateplate.pdf. Accessed March 25, 2012.
Mozaffarian et al Population Approaches to Diet, Activity, and Smoking 1553
by guest on February 6, 2016http://circ.ahajournals.org/Downloaded from

43. Dixon H, Borland R, Segan C, Stafford H, Sindall C. Public reaction toVictoria’s “2 Fruit ‘n’ 5 Veg Every Day” campaign and reported con-sumption of fruit and vegetables. Prev Med. 1998;27:572–582.
44. Nishtar S, Mirza YA, Jehan S, Hadi Y, Badar A, Yusuf S, Shahab S.Newspaper articles as a tool for cardiovascular prevention programs ina developing country. J Health Commun. 2004;9:355–369.
45. Sanigorski AM, Bell AC, Kremer PJ, Cuttler R, Swinburn BA. Reducingunhealthy weight gain in children through community capacity-building:results of a quasi-experimental intervention program, Be Active EatWell. Int J Obes. 2008;32:1060–1067.
46. Kelder SH, Perry CL, Lytle LA, Klepp KI. Community-wide youthnutrition education: long-term outcomes of the Minnesota Heart HealthProgram. Health Educ Res. 1995;10:119–131.
47. Croft JB, Temple SP, Lankenau B, Heath GW, Macera CA, Eaker ED,Wheeler FC. Community intervention and trends in dietary fat con-sumption among black and white adults. J Am Diet Assoc. 1994;94:1284–1290.
48. de Silva-Sanigorski AM, Bell AC, Kremer P, Nichols M, Crellin M,Smith M, Sharp S, de Groot F, Carpenter L, Boak R, Robertson N,Swinburn BA. Reducing obesity in early childhood: results from Romp& Chomp, an Australian community-wide intervention program. Am JClin Nutr. 2010;91:831–840.
49. Farquhar JW, Fortmann SP, Flora JA, Taylor CB, Haskell WL, WilliamsPT, Maccoby N, Wood PD. Effects of communitywide education oncardiovascular disease risk factors: the Stanford Five-City Project.JAMA. 1990;264:359–365.
50. Glanz K, Hewitt AM, Rudd J. Consumer behavior and nutrition edu-cation: an integrative review. J Nutr Educ. 1992;24:267–277.
51. Connell D, Goldberg JP, Folta SC. An intervention to increase fruit andvegetable consumption using audio communications: in-store publicservice announcements and audiotapes. J Health Commun. 2001;6:31–43.
52. Wardle J, Rapoport L, Afuape T, Duman M. Mass education for obesityprevention: the penetration of the BBC’s “Fighting Fat, Fighting Fit”campaign. Health Educ Res. 2001;16:343–355.
53. Beaudoin CE, Fernandez C, Wall JL, Farley TA. Promoting healthyeating and physical activity: short-term effects of a mass mediacampaign. Am J Prev Med. 2007;32:217–223.
54. Dunt D, Day N, Pirkis J. Evaluation of a community-based healthpromotion program supporting public policy initiatives for a healthydiet. Health Promot Int. 1999;14:317–327.
55. Reger B, Wootan MG, Booth-Butterfield S, Smith H. 1% Or less: acommunity-based nutrition campaign. Public Health Rep. 1998;113:410–419.
56. Miles A, Rapoport L, Wardle J, Afuape T, Duman M. Using themass-media to target obesity: an analysis of the characteristics andreported behaviour change of participants in the BBC’s “Fighting Fat,Fighting Fit” campaign. Health Educ Res. 2001;16:357–372.
57. Lutz SF, Ammerman AS, Atwood JR, Campbell MK, DeVellis RF,Rosamond WD. Innovative newsletter interventions improve fruit andvegetable consumption in healthy adults. J Am Diet Assoc. 1999;99:705–709.
58. Tian HG, Guo ZY, Hu G, Yu SJ, Sun W, Pietinen P, Nissinen A.Changes in sodium intake and blood pressure in a community-basedintervention project in China. J Hum Hypertens. 1995;9:959–968.
59. Pekka P, Pirjo P, Ulla U. Influencing public nutrition for non-communicable disease prevention: from community intervention tonational programme: experiences from Finland. Public Health Nutr.2002;5:245–251.
60. Puska P, Stahl T. Health in all policies: the Finnish initiative: back-ground, principles, and current issues. Annu Rev Public Health. 2010;31:315–328.
61. Luepker RV, Rastam L, Hannan PJ, Murray DM, Gray C, Baker WL,Crow R, Jacobs DR Jr, Pirie PL, Mascioli SR, Mittelmark MB,Blackburn H. Community education for cardiovascular disease pre-vention: morbidity and mortality results from the Minnesota HeartHealth Program. Am J Epidemiol. 1996;144:351–362.
62. Winkleby MA, Feldman HA, Murray DM. Joint analysis of three U.S.community intervention trials for reduction of cardiovascular diseaserisk. J Clin Epidemiol. 1997;50:645–658.
63. Lefebvre RC, Lasater TM, Carleton RA, Peterson G. Theory anddelivery of health programming in the community: the Pawtucket HeartHealth Program. Prev Med. 1987;16:80–95.
64. Bhalla V, Fong CW, Chew SK, Satku K. Changes in levels of majorcardiovascular risk factors in the multi-ethnic population in Singapore
after 12 years of a national noncommunicable disease interventionprogramme. Singapore Med J. 2006;47:841–850.
65. Dowse GK, Gareeboo H, Alberti KG, Zimmet P, Tuomilehto J, PurranA, Fareed D, Chitson P, Collins VR. Changes in population cholesterolconcentrations and other cardiovascular risk factor levels after five yearsof the non-communicable disease intervention programme in Mauritius:Mauritius Non-communicable Disease Study Group. BMJ. 1995;311:1255–1259.
66. Economos CD, Hyatt RR, Goldberg JP, Must A, Naumova EN, CollinsJJ, Nelson ME. A community intervention reduces BMI z-score inchildren: Shape Up Somerville first year results. Obesity (Silver Spring).2007;15:1325–1336.
67. Lefebvre RC, Flora JA. Social marketing and public health intervention.Health Educ Q. 1988;15:299–315.
68. Huhman ME, Potter LD, Duke JC, Judkins DR, Heitzler CD, Wong FL.Evaluation of a national physical activity intervention for children:VERB campaign, 2002–2004. Am J Prev Med. 2007;32:38–43.
69. Emery J, Crump C, Hawkins M. Formative evaluation of AARP’sActive for Life campaign to improve walking and bicycling envi-ronments in two cities. Health Promot Pract. 2007;8:403–414.
70. Wray RJ, Jupka K, Ludwig-Bell C. A community-wide media campaignto promote walking in a Missouri town. Prev Chronic Dis. 2005;2:A04.
71. Peterson M, Chandlee M, Abraham A. Cost-effectiveness analysis of astatewide media campaign to promote adolescent physical activity.Health Promot Pract. 2008;9:426–433.
72. Price SM, Huhman M, Potter LD. Influencing the parents of childrenaged 9–13 years: findings from the VERB campaign. Am J Prev Med.2008;34:S267–S274.
73. Huhman ME, Potter LD, Nolin MJ, Piesse A, Judkins DR, BanspachSW, Wong FL. The influence of the VERB campaign on children’sphysical activity in 2002 to 2006. Am J Public Health. 2010;100:638–645.
74. Berkowitz JM, Huhman M, Nolin MJ. Did augmenting the VERBcampaign advertising in select communities have an effect onawareness, attitudes, and physical activity? Am J Prev Med. 2008;34(suppl):S257–S266.
75. Task Force on Community Preventive Services. Guide to CommunityPreventive Services. Campaigns and informational approaches toincrease physical activity: mass media campaigns. http://www.thecommunityguide.org/pa/campaigns/massmedia.html. Accessed April15, 2011.
76. US Department of Health and Human Services, Centers for DiseaseControl and Prevention, National Center for Chronic Disease Preventionand Health Promotion, Office on Smoking and Health. Effective edu-cational strategies to prevent tobacco use among young people.Reducing Tobacco Use: A Report of the Surgeon General. Atlanta, GA:US Dept of Health and Human Services; 2000.
77. US Department of Health and Human Services, Centers for DiseaseControl and Prevention, National Center for Chronic Disease Preventionand Health Promotion, Office on Smoking and Health. Best Practicesfor Comprehensive Tobacco Control Programs—2007. Atlanta, GA: USDept of Health and Human Services; 2007.
78. Bala M, Strzeszynski L, Cahill K. Mass media interventions for smokingcessation in adults. Cochrane Database Syst Rev. 2008;(1):CD004704.
79. Davis RM, Gilpin EA, Loken B, Viswanath K, Wakefield MA. The Roleof the Media in Promoting and Reducing Tobacco Use. Tobacco controlmonograph No. 19. Bethesda, MD: US Dept of Health and HumanServices, National Institutes of Health, National Cancer Institute; 2008.
80. Tynan M, Pechacek T, McKenna M, Ashley D, Deyton L, Briss P,Popovic T. CDC grand rounds: current opportunities in tobacco control.MMWR Morb Mortal Wkly Rep. 2010;59:487–492.
81. Wakefield MA, Loken B, Hornik RC. Use of mass media campaigns tochange health behaviour. Lancet. 2010;376:1261–1271.
82. Pennant M, Davenport C, Bayliss S, Greenheld W, Marshall T, Hyde C.Community programs for the prevention of cardiovascular disease: asystematic review. Am J Epidemiol. 2010;172:501–516.
83. Farrelly MC, Davis KC, Haviland ML, Messeri P, Healton CG.Evidence of a dose-response relationship between “truth” antismokingads and youth smoking prevalence. Am J Public Health. 2005;95:425–431.
84. Henriksen L, Dauphinee AL, Wang Y, Fortmann SP. Industry sponsoredanti-smoking ads and adolescent reactance: test of a boomerang effect.Tob Control. 2006;15:13–18.
1554 Circulation September 18, 2012
by guest on February 6, 2016http://circ.ahajournals.org/Downloaded from

85. Sutfin EL, Szykman LR, Moore MC. Adolescents’ responses to anti-tobacco advertising: exploring the role of adolescents’ smoking statusand advertisement theme. J Health Commun. 2008;13:480–500.
86. Campaign for Tobacco Free Kids. The impact of reductions to state tobaccocontrol program funding. http://www.tobaccofreekids.org/research/factsheets/pdf/0270.pdf. Accessed September 30, 2011.
87. Ollberding NJ, Wolf RL, Contento I. Food label use and its relation todietary intake among US adults. J Am Diet Assoc. 2010;110:1233–1237.
88. Kristal AR, Hedderson MM, Patterson RE, Neuhouser M. Predictors ofself-initiated, healthful dietary change. J Am Diet Assoc. 2001;101:762–766.
89. Neuhouser ML, Kristal AR, Patterson RE. Use of food nutrition labelsis associated with lower fat intake. J Am Diet Assoc. 1999;99:45–53.
90. Grimes CA, Riddell LJ, Nowson CA. Consumer knowledge andattitudes to salt intake and labelled salt information. Appetite. 2009;53:189–194.
91. Satia JA, Galanko JA, Neuhouser ML. Food nutrition label use isassociated with demographic, behavioral, and psychosocial factors anddietary intake among African Americans in North Carolina. J Am DietAssoc. 2005;105:392–402.
92. Lewis JE, Arheart KL, LeBlanc WG, Fleming LE, Lee DJ, Davila EP,Caban-Martinez AJ, Dietz NA, McCollister KE, Bandiera FC, Clark JDJr. Food label use and awareness of nutritional information and recom-mendations among persons with chronic disease. Am J Clin Nutr. 2009;90:1351–1357.
93. Weaver D, Finke M. The relationship between the use of sugar contentinformation on nutrition labels and the consumption of added sugars.Food Policy. 2003;28:213–219.
94. Post RE, Mainous AG 3rd, Diaz VA, Matheson EM, Everett CJ. Use ofthe nutrition facts label in chronic disease management: results from theNational Health and Nutrition Examination Survey. J Am Diet Assoc.2010;110:628–632.
95. Roodenburg AJ, Popkin B, Seidell JC. Development of internationalcriteria for a front of package nutrient profiling system: the internationalChoices Programme. Eur J Clin Nutr. 2011;65:1190–1200.
96. Livsmedelsverket. The Keyhole Symbol. 2009. http://www.slv.se/en-gb/Group1/Food-and-Nutrition/Keyhole-symbol/. Accessed January 4,2011.
97. The National Heart Foundation of New Zealand. http://www.heartfoundation.org.nz/healthy-living/healthy-eating/heart-foundation-tick.Accessed March 25, 2012.
98. Choices International Foundation. Healthy choices made easy. 2011.http://www.choicesprogramme.org/en. Accessed May 13, 2011.
99. Blewett N, Goddard N, Pettigrew S, Reynolds C, Yeatman H. Labellinglogic. Review of food labelling law and policy. 2011. http://www.foodlabellingreview.gov/au/internet/foodlabelling/publishing.nsf/Content/labelling�logic. Accessed March 25, 2012.
100. Institute of Medicine, Committee on Examination of Front-of-PackageNutrition Ratings Systems and Symbols. Wartella EA, Lichtenstein AH,Boon CS, eds. Examination of Front-of-Package Nutrition RatingSystems and Symbols: Phase 1 Report. Washington, DC: The NationalAcademies Press; 2010:140.
101. US Food and Drug Administration. Labeling and nutrition: food labelingand nutrition overview. 2011. http://www.fda.gov/Food/LabelingNutrition/default.htm. Accessed March 25, 2012.
102. Grunert KG, Fernandez-Celemin L, Wills JM, Storcksdieck GenanntBonsmann S, Nureeva L. Use and understanding of nutrition infor-mation on food labels in six European countries. Z Gesundh Wiss.2010;18:261–277.
103. Vyth EL, Steenhuis IH, Mallant SF, Mol ZL, Brug J, Temminghoff M,Feunekes GI, Jansen L, Verhagen H, Seidell JC. A front-of-packnutrition logo: a quantitative and qualitative process evaluation in theNetherlands. J Health Commun. 2009;14:631–645.
104. Vyth EL, Steenhuis IH, Vlot JA, Wulp A, Hogenes MG, Looije DH,Brug J, Seidell JC. Actual use of a front-of-pack nutrition logo in thesupermarket: consumers’ motives in food choice. Public Health Nutr.2010;13:1882–1889.
105. Sacks G, Rayner M, Swinburn B. Impact of front-of-pack “traffic-light”nutrition labelling on consumer food purchases in the UK. HealthPromot Int. 2009;24:344–352.
106. Sutherland LA, Kaley LA, Fischer L. Guiding stars: the effect of anutrition navigation program on consumer purchases at the supermarket.Am J Clin Nutr. 2010;91:1090S–1094S.
107. Temple JL, Johnson K, Recupero K, Suders H. Nutrition labels decreaseenergy intake in adults consuming lunch in the laboratory. J Am DietAssoc. 2010;110:1094–1097.
108. Borgmeier I, Westenhoefer J. Impact of different food label formats onhealthiness evaluation and food choice of consumers: a randomized-controlled study. BMC Public Health. 2009;9:184.
109. Fiske A, Cullen KW. Effects of promotional materials on vending salesof low-fat items in teachers’ lounges. J Am Diet Assoc. 2004;104:90–93.
110. Vyth EL, Steenhuis IH, Heymans MW, Roodenburg AJ, Brug J, SeidellJC. Influence of placement of a nutrition logo on cafeteria menu itemson lunchtime food choices at Dutch work sites. J Am Diet Assoc.2011;111:131–136.
111. French SA, Jeffery RW, Story M, Breitlow KK, Baxter JS, Hannan P,Snyder MP. Pricing and promotion effects on low-fat vending snackpurchases: the CHIPS Study. Am J Public Health. 2001;91:112–117.
112. Lowe MR, Tappe KA, Butryn ML, Annunziato RA, Coletta MC, OchnerCN, Rolls BJ. An intervention study targeting energy and nutrient intakein worksite cafeterias. Eat Behav. 2010;11:144–151.
113. Thorndike AN, Levy D, Sonnenberg L, Barraclough S, Riis J. A simplepoint-of-purchase labeling intervention to promote healthier food andbeverage choices in a large hospital cafeteria. Paper presented at:American Heart Association 51st Annual Joint Conference on Cardio-vascular Disease Epidemiology and Prevention and Nutrition, PhysicalActivity, and Metabolism; March 2011; Atlanta, GA.
114. Bassett MT, Dumanovsky T, Huang C, Silver LD, Young C, Nonas C,Matte TD, Chideya S, Frieden TR. Purchasing behavior and calorieinformation at fast-food chains in New York City, 2007. Am J PublicHealth. 2008;98:1457–1459.
115. Dumanovsky T, Huang CY, Bassett MT, Silver LD. Consumerawareness of fast-food calorie information in New York City afterimplementation of a menu labeling regulation. Am J Public Health.2010;100:2520–2525.
116. Seymour JD, Yaroch AL, Serdula M, Blanck HM, Khan LK. Impact ofnutrition environmental interventions on point-of-purchase behavior inadults: a review. Prev Med. 2004;39(suppl 2):S108–S136.
117. Chu YH, Frongillo EA, Jones SJ, Kaye GL. Improving patrons’ mealselections through the use of point-of-selection nutrition labels. Am JPublic Health. 2009;99:2001–2005.
118. Pulos E, Leng K. Evaluation of a voluntary menu-labeling program infull-service restaurants. Am J Public Health. 2010;100:1035–1039.
119. Yamamoto JA, Yamamoto JB, Yamamoto BE, Yamamoto LG. Ado-lescent fast food and restaurant ordering behavior with and withoutcalorie and fat content menu information. J Adolesc Health. 2005;37:397–402.
120. Elbel B, Kersh R, Brescoll VL, Dixon LB. Calorie labeling and foodchoices: a first look at the effects on low-income people in New YorkCity. Health Aff (Millwood). 2009;28:w1110–w1121.
121. Engbers LH, van Poppel MN, Chin APMJ, van Mechelen W. Worksitehealth promotion programs with environmental changes: a systematicreview. Am J Prev Med. 2005;29:61–70.
122. Engbers LH, van Poppel MN, van Mechelen W. Modest effects of acontrolled worksite environmental intervention on cardiovascular risk inoffice workers. Prev Med. 2007;44:356–362.
123. Engbers LH, van Poppel MN, Chin APM, van Mechelen W. The effectsof a controlled worksite environmental intervention on determinants ofdietary behavior and self-reported fruit, vegetable and fat intake. BMCPublic Health. 2006;6:253.
124. Vyth EL, Steenhuis IH, Roodenburg AJ, Brug J, Seidell JC. Front-of-pack nutrition label stimulates healthier product development: aquantitative analysis. Int J Behav Nutr Phys Act. 2010;7:65.
125. Ratnayake WM, L’Abbe MR, Mozaffarian D. Nationwide product refor-mulations to reduce trans fatty acids in Canada: when trans fat goes out,what goes in? Eur J Clin Nutr. 2009;63:808–811.
126. Mozaffarian D, Stampfer MJ. Removing industrial trans fat from foods.BMJ. 2010;340:c1826.
127. Andersen RE, Franckowiak SC, Snyder J, Bartlett SJ, Fontaine KR. Caninexpensive signs encourage the use of stairs? Results from a com-munity intervention. Ann Intern Med. 1998;129:363–369.
128. Kerr J, Eves F, Carroll D. Encouraging stair use: stair-riser banners arebetter than posters. Am J Public Health. 2001;91:1192–1193.
129. Kerr J, Eves F, Carroll D. Six-month observational study of promptedstair climbing. Prev Med. 2001;33:422–427.
130. Kerr J, Eves FF, Carroll D. Getting more people on the stairs: the impactof a new message format. J Health Psychol. 2001;6:495–500.
Mozaffarian et al Population Approaches to Diet, Activity, and Smoking 1555
by guest on February 6, 2016http://circ.ahajournals.org/Downloaded from

131. Coleman KJ, Gonzalez EC. Promoting stair use in a US-Mexico bordercommunity. Am J Public Health. 2001;91:2007–2009.
132. Borland R, Hill D. The path to Australia’s tobacco health warnings.Addiction. 1997;92:1151–1157.
133. Hammond D, Fong GT, Borland R, Cummings KM, McNeill A, DriezenP. Text and graphic warnings on cigarette packages: findings from theinternational tobacco control four country study. Am J Prev Med. 2007;32:202–209.
134. Crawford MA, Balch GI, Mermelstein R. Responses to tobacco controlpolicies among youth. Tob Control. 2002;11:14–19.
135. Loken B, Howard-Pitney B. Effectiveness of cigarette advertisements onwomen: an experimental study. J Appl Psychol. 1988;73:378–382.
136. Hammond D, Fong GT, McDonald PW, Brown KS, Cameron R.Graphic Canadian cigarette warning labels and adverse outcomes:evidence from Canadian smokers. Am J Public Health. 2004;94:1442–1445.
137. Guttman N, Peleg H. Public preferences for an attribution to governmentor to medical research versus unattributed messages in cigarette warninglabels in Israel. Health Commun. 2003;15:1–25.
138. Malouff J, Gabrilowitz D, Schutte N. Readability of health warnings onalcohol and tobacco products. Am J Public Health. 1992;82:464–465.
139. Millar WJ. Reaching smokers with lower educational attainment. HealthRep. 1996;8:11–19.
140. Hammond D, Fong GT, McNeill A, Borland R, Cummings KM. Effec-tiveness of cigarette warning labels in informing smokers about the risksof smoking: findings from the International Tobacco Control (ITC) FourCountry Survey. Tob Control. 2006;15(suppl 3):iii19–iii25.
141. Willemsen MC. The new EU cigarette health warnings benefit smokerswho want to quit the habit: results from the Dutch Continuous Survey ofSmoking Habits. Eur J Public Health. 2005;15:389–392.
142. Fathelrahman AI, Omar M, Awang R, Borland R, Fong GT, HammondD, Zain Z. Smokers’ responses toward cigarette pack warning labels inpredicting quit intention, stage of change, and self-efficacy. NicotineTob Res. 2009;11:248–253.
143. Portillo F, Antonanzas F. Information disclosure and smoking riskperceptions: potential short-term impact on Spanish students of the newEuropean Union directive on tobacco products. Eur J Public Health.2002;12:295–301.
144. Pollay RW, Dewhirst T. The dark side of marketing seemingly “Light”cigarettes: successful images and failed fact. Tob Control. 2002;11(suppl 1):I18–I31.
145. Brownson RC, Haire-Joshu D, Luke DA. Shaping the context of health:a review of environmental and policy approaches in the prevention ofchronic diseases. Annu Rev Public Health. 2006;27:341–370.
146. Carnethon M, Whitsel LP, Franklin BA, Kris-Etherton P, Milani R, PrattCA, Wagner GR. Worksite wellness programs for cardiovasculardisease prevention: a policy statement from the American Heart Asso-ciation. Circulation. 2009;120:1725–1741.
147. Institute of Medicine and National Research Council of the NationalAcademies, Committee on Childhood Obesity Prevention Actions forLocal Governments. Parker L, Burns AC, Sanchez E, eds. Local Gov-ernment Actions to Prevent Childhood Obesity. Washington, DC: TheNational Academies Press; 2009.
148. Popkin BM. Agricultural policies, food and public health. EMBO Rep.2011;12:11–18.
149. Drewnowski A. Obesity, diets, and social inequalities. Nutr Rev. 2009;67(suppl 1):S36–S39.
150. Temple NJ, Steyn NP, Fourie J, De Villiers A. Price and availability ofhealthy food: a study in rural South Africa. Nutrition. 2011;27:55–58.
151. Jetter KM, Cassady DL. The availability and cost of healthier foodalternatives. Am J Prev Med. 2006;30:38–44.
152. Liese AD, Weis KE, Pluto D, Smith E, Lawson A. Food store types,availability, and cost of foods in a rural environment. J Am Diet Assoc.2007;107:1916–1923.
153. Ni Mhurchu C, Ogra S. The price of healthy eating: cost and nutrientvalue of selected regular and healthier supermarket foods in NewZealand. N Z Med J. 2007;120:U2388.
154. Cassady D, Jetter KM, Culp J. Is price a barrier to eating more fruits andvegetables for low-income families? J Am Diet Assoc. 2007;107:1909–1915.
155. Katz DL, Doughty K, Njike V, Treu JA, Reynolds J, Walker J, Smith E,Katz C. A cost comparison of more and less nutritious food choices inUS supermarkets. Public Health Nutr. 2011;14:1693–1699.
156. Mozaffarian RS, Andry A, Lee RM, Wiecha JL, Gortmaker SL. Priceand healthfulness of snacks in 32 YMCA after-school programs in 4 USmetropolitan areas, 2006–2008. Prev Chronic Dis. 2012;9:E38.
157. Block D, Kouba J. A comparison of the availability and affordability ofa market basket in two communities in the Chicago area. Public HealthNutr. 2006;9:837–845.
158. Palermo CE, Walker KZ, Hill P, McDonald J. The cost of healthy foodin rural Victoria. Rural Remote Health. 2008;8:1074.
159. Krukowski RA, West DS, Harvey-Berino J, Elaine Prewitt T. Neigh-borhood impact on healthy food availability and pricing in food stores.J Community Health. 2010;35:315–320.
160. McDermott AJ, Stephens MB. Cost of eating: whole foods versusconvenience foods in a low-income model. Fam Med. 2010;42:280–284.
161. Giskes K, Van Lenthe FJ, Brug J, Mackenbach JP, Turrell G. Socio-economic inequalities in food purchasing: the contribution ofrespondent-perceived and actual (objectively measured) price and avail-ability of foods. Prev Med. 2007;45:41–48.
162. Jacobson MF, Brownell KD. Small taxes on soft drinks and snack foodsto promote health. Am J Public Health. 2000;90:854–857.
163. Timmer CP, Falcon WP, Pearson SR. Food Policy Analysis. Baltimore,MD: Johns Hopkins University Press for the World Bank; 1983.
164. Deaton A, Muellbauer J. An almost ideal demand system. Am Econ Rev.1980;70:312.
165. Frazao E, ed. America’s Eating Habits: Changes and Consequences.Washington, DC: US Dept of Agriculture; 1999. Agriculture Infor-mation Bulletin 750.
166. Andreyeva T, Long MW, Brownell KD. The impact of food prices onconsumption: a systematic review of research on the price elasticity ofdemand for food. Am J Public Health. 2009;100:216–222.
167. Kuchler F, Tegene A, Harris JM. Taxing Snack Foods: What to Expectfor Diet and Tax Revenues: Current Issues in Economics of FoodMarkets. Washington, DC: US Dept of Agriculture; 2004. AgricultureInformation Bulletin 747-08.
168. Duffey KJ, Gordon-Larsen P, Shikany JM, Guilkey D, Jacobs DR Jr,Popkin BM. Food price and diet and health outcomes: 20 years of theCARDIA study. Arch Intern Med. 2010;170:420–426.
169. Block JP, Chandra A, McManus KD, Willett WC. Point-of-purchaseprice and education intervention to reduce consumption of sugary softdrinks. Am J Public Health. 2010;100:1427–1433.
170. Powell LM, Auld MC, Chaloupka FJ, O’Malley PM, Johnston LD.Access to fast food and food prices: relationship with fruit and vegetableconsumption and overweight among adolescents. Adv Health EconHealth Serv Res. 2007;17:23–48.
171. Powell LM, Zhao Z, Wang Y. Food prices and fruit and vegetableconsumption among young American adults. Health Place. 2009;15:1064–1070.
172. Beydoun MA, Powell LM, Wang Y. The association of fast food, fruitand vegetable prices with dietary intakes among US adults: is theremodification by family income? Soc Sci Med. 2008;66:2218–2229.
173. Sturm R, Datar A. Body mass index in elementary school children,metropolitan area food prices and food outlet density. Public Health.2005;119:1059–1068.
174. Dong D, Lin BH. Fruit and Vegetable Consumption by Low-IncomeAmericans: Would a Price Reduction Make a Difference? Washington,DC: US Dept of Agriculture; 2009. Economic Research Report 70.
175. Nnoaham KE, Sacks G, Rayner M, Mytton O, Gray A. Modellingincome group differences in the health and economic impacts of targetedfood taxes and subsidies. Int J Epidemiol. 2009;38:1324–1333.
176. Michels KB, Bloom BR, Riccardi P, Rosner BA, Willett WC. A studyof the importance of education and cost incentives on individual foodchoices at the Harvard School of Public Health cafeteria. J Am CollNutr. 2008;27:6–11.
177. French SA, Hannan PJ, Harnack LJ, Mitchell NR, Toomey TL, GerlachA. Pricing and availability intervention in vending machines at four busgarages. J Occup Environ Med. 2010;52(suppl 1):S29–S33.
178. French SA. Pricing effects on food choices. J Nutr. 2003;133:841S–843S.
179. Herman DR, Harrison GG, Afifi AA, Jenks E. Effect of a targetedsubsidy on intake of fruits and vegetables among low-income women inthe Special Supplemental Nutrition Program for Women, Infants, andChildren. Am J Public Health. 2008;98:98–105.
180. Zatonski W, Campos H, Willett W. Rapid declines in coronary heartdisease mortality in Eastern Europe are associated with increased con-
1556 Circulation September 18, 2012
by guest on February 6, 2016http://circ.ahajournals.org/Downloaded from

sumption of oils rich in alpha-linolenic acid. Eur J Epidemiol. 2008;23:3–10.
181. Dellava JE, Bulik CM, Popkin BM. Price changes alone are not adequateto produce long-term dietary change. J Nutr. 2010;140:1887–1891.
182. Drewnowski A, Specter SE. Poverty and obesity: the role of energydensity and energy costs. Am J Clin Nutr. 2004;79:6–16.
183. Drewnowski A, Darmon N. Food choices and diet costs: an economicanalysis. J Nutr. 2005;135:900–904.
184. Schaffer HD, Hunt DB, Ray DE. US Agricultural Commodity Policy andIts Relationship to Obesity. Knoxville, TN: Agricultural Policy AnalysisCenter, University of Tennessee; 2007.
185. Alston JM, Anderson MA, James JS, Pardey PG. Persistence Pays: U.S.Agricultural Productivity Growth and the Benefits From Public R&DSpending (Natural Resource Management and Policy). New York, NY:Springer; 2009.
186. Alston JM, Pardey PG. Public funding for research into specialty crops.HortScience. 2008;43:1461–1470.
187. Alston JM, Sumner DA, Vosti SA. Are agricultural policies making usfat? Likely links between agricultural policies and human nutrition andobesity, and their policy implications. Rev Agric Econ. 2006;28:313–322.
188. Paarlberg R. Food Politics: What Everyone Needs to Know. Oxford,United Kingdom: Oxford University; 2010.
189. Gardner BL. American Agriculture in the Twentieth Century: How ItFlourished and What It Cost. Cambridge, MA: Harvard UniversityPress; 2002.
190. Popkin BM. The World Is Fat: The Fads, Trends, Policies, and ProductsThat Are Fattening the Human Race. New York, NY: Avery-PenguinGroup; 2008.
191. Variyam JM. The price is right: economics and the rise in obesity.Amber Waves. 2005;3:20–27.
192. Active Living by Design. http://www.activelivingbydesign.org/.Accessed March 25, 2012.
193. Kuchler F, Lin BH. The influence of individual choices and attitudes onadiposity. Int J Obes Relat Metab Disord. 2002;26:1017–1022.
194. Kuchler F, Ballenger N. Societal costs of obesity: how can we assesswhen federal interventions will pay? FoodReview. Winter 2002;25:33–37.
195. Harrington J, Friel S, Thunhurst C, Kirby A, McElroy B. Obesogenicisland: the financial burden of private transport on low-incomehouseholds. J Public Health (Oxf). 2008;30:38–44.
196. Hughes J, Knittel CR, Sperling D. Evidence of a shift in the short-runprice elasticity of gasoline demand. Energy J. 2008;29:113–134.
197. Leigh JP, Geraghty EM. High gasoline prices and mortality from motorvehicle crashes and air pollution. J Occup Environ Med. 2008;50:249–254.
198. Edwards RD. Public transit, obesity, and medical costs: assessing themagnitudes. Prev Med. 2008;46:14–21.
199. Wen LM, Rissel C. Inverse associations between cycling to work, publictransport, and overweight and obesity: findings from a population basedstudy in Australia. Prev Med. 2008;46:29–32.
200. Zheng Y. The benefit of public transportation: physical activity toreduce obesity and ecological footprint. Prev Med. 2008;46:4–5.
201. Rabin BA, Boehmer TK, Brownson RC. Cross-national comparison ofenvironmental and policy correlates of obesity in Europe. Eur J PublicHealth. 2007;17:53–61.
202. Rashad I. Associations of cycling with urban sprawl and the gasolineprice. Am J Health Promot. 2009;24:27–36.
203. Hou N, Popkin BM, Jacobs DR Jr, Song Y, Guilkey DK, He K, LewisCE, Gordon-Larsen P. Longitudinal trends in gasoline price and physicalactivity: the CARDIA study. Prev Med. 2011;52:365–369.
204. Courtemanche C. A silver lining? The connection between gasolineprices and obesity. Econ Inq. 2011;49:935–957.
205. Campaign for Tobacco Free Kids. State Tobacco Taxes. http://www.tobaccofreekids.org/what_we_do/state_local/taxes/. Accessed April 17,2011.
206. Blecher EH, van Walbeek CP. Cigarette affordability trends: an updateand some methodological comments. Tob Control. 2009;18:167–175.
207. Blecher EH, van Walbeek CP. An international analysis of cigaretteaffordability. Tob Control. 2004;13:339–346.
208. Carpenter C, Cook PJ. Cigarette taxes and youth smoking: new evidencefrom national, state, and local Youth Risk Behavior Surveys. J HealthEcon. 2008;27:287–299.
209. DeCicca P, Kenkel D, Mathios A. Cigarette taxes and the transition fromyouth to adult smoking: smoking initiation, cessation, and participation.J Health Econ. 2008;27:904–917.
210. Lovato CY, Zeisser C, Campbell HS, Watts AW, Halpin P, ThompsonM, Eyles J, Adlaf E, Brown KS. Adolescent smoking: effect of schooland community characteristics. Am J Prev Med. 2010;39:507–514.
211. Ahmad S, Franz GA. Raising taxes to reduce smoking prevalence in theUS: a simulation of the anticipated health and economic impacts. PublicHealth. 2008;122:3–10.
212. Chaloupka FJ, Cummings KM, Morley CP, Horan JK. Tax, price andcigarette smoking: evidence from the tobacco documents and impli-cations for tobacco company marketing strategies. Tob Control. 2002;11(suppl 1):I62–I72.
213. The Patient Protection and Affordable Care Act. Pub L No. 111-148,124 Stat 119 (2010).
214. Kaiser/HRET. Average premiums for individual and family coveragebased on Kaiser/HRET annual survey of health plans. 2009.
215. Changes ahead: health care reform in a challenging economy. TowersWatson Survey. 2010. http://www.towerswatson.com/united-states/research/2884. Accessed March 25, 2012.
216. Volpp KG, Gurmankin Levy A, Asch DA, Berlin JA, Murphy JJ, GomezA, Sox H, Zhu J, Lerman C. A randomized controlled trial of financialincentives for smoking cessation. Cancer Epidemiol Biomarkers Prev.2006;15:12–18.
217. Volpp KG, Pauly MV, Loewenstein G, Bangsberg D. P4P4P: an agendafor research on pay-for-performance for patients. Health Aff (Millwood).2009;28:206–214.
218. Volpp KG, Troxel AB, Pauly MV, Glick HA, Puig A, Asch DA, GalvinR, Zhu J, Wan F, DeGuzman J, Corbett E, Weiner J, Audrain-McGovernJ. A randomized, controlled trial of financial incentives for smokingcessation. N Engl J Med. 2009;360:699–709.
219. Finkelstein EA, Linnan LA, Tate DF, Birken BE. A pilot study testingthe effect of different levels of financial incentives on weight loss amongoverweight employees. J Occup Environ Med. 2007;49:981–989.
220. Paul-Ebhohimhen V, Avenell A. Systematic review of the use offinancial incentives in treatments for obesity and overweight. Obes Rev.2008;9:355–367.
221. Leeks KD, Hopkins DP, Soler RE, Aten A, Chattopadhyay SK.Worksite-based incentives and competitions to reduce tobacco use: asystematic review. Am J Prev Med. 2010;38:S263–S274.
222. Cahill K, Perera R. Competitions and incentives for smoking cessation.Cochrane Database Sys Rev. 2011;(4):CD004307.
223. Kane RL, Johnson PE, Town RJ, Butler M. A structured review of theeffect of economic incentives on consumers’ preventive behavior. Am JPrev Med. 2004;27:327–352.
224. Hey K, Perera R. Competitions and incentives for smoking cessation.Cochrane Database Syst Rev. 2005;(4):CD004307.
225. Brown T, Summerbell C. Systematic review of school-based inter-ventions that focus on changing dietary intake and physical activitylevels to prevent childhood obesity: an update to the obesity guidanceproduced by the National Institute for Health and Clinical Excellence.Obes Rev. 2009;10:110–141.
226. Rosenkranz RR, Behrens TK, Dzewaltowski DA. A group-randomizedcontrolled trial for health promotion in Girl Scouts: healthier troops in aSNAP (Scouting Nutrition and Activity Program). BMC Public Health.2010;10:81.
227. Hollar D, Messiah SE, Lopez-Mitnik G, Hollar TL, Almon M, AgatstonAS. Healthier options for public schoolchildren program improvesweight and blood pressure in 6-to 13-year-olds. J Am Diet Assoc.2010;110:261–267.
228. Jiang J, Xia X, Greiner T, Wu G, Lian G, Rosenqvist U. The effects ofa 3-year obesity intervention in schoolchildren in Beijing. Child CareHealth Dev. 2007;33:641–646.
229. Marcus C, Nyberg G, Nordenfelt A, Karpmyr M, Kowalski J, EkelundU. A 4-year, cluster-randomized, controlled childhood obesity pre-vention study: STOPP. Int J Obes. 2009;33:408–417.
230. Foster GD, Linder B, Baranowski T, Cooper DM, Goldberg L, HarrellJS, Kaufman F, Marcus MD, Trevino RP, Hirst K. A school-basedintervention for diabetes risk reduction. N Engl J Med. 2010;363:443–453.
231. Jago R, McMurray RG, Drews KL, Moe EL, Murray T, Pham TH,Venditti EM, Volpe SL. HEALTHY intervention: fitness, physicalactivity and metabolic syndrome results. Med Sci Sports Exerc. 2011;43:1513–1522.
Mozaffarian et al Population Approaches to Diet, Activity, and Smoking 1557
by guest on February 6, 2016http://circ.ahajournals.org/Downloaded from

232. Hoelscher DM, Springer AE, Ranjit N, Perry CL, Evans AE, Stigler M,Kelder SH. Reductions in child obesity among disadvantaged schoolchildren with community involvement: the Travis County CATCH Trial.Obesity. 2010;18(suppl 1):S36–S44.
233. Robinson-O’Brien R, Story M, Heim S. Impact of garden-based youthnutrition intervention programs: a review. J Am Diet Assoc. 2009;109:273–280.
234. Parmer SM, Salisbury-Glennon J, Shannon D, Struempler B. Schoolgardens: an experiential learning approach for a nutrition educationprogram to increase fruit and vegetable knowledge, preference, andconsumption among second-grade students. J Nutr Educ Behav. 2009;41:212–217.
235. Somerset S, Markwell K. Impact of a school-based food garden onattitudes and identification skills regarding vegetables and fruit: a12-month intervention trial. Public Health Nutr. 2009;12:214–221.
236. Walton M, Pearce J, Day P. Examining the interaction between foodoutlets and outdoor food advertisements with primary school food envi-ronments. Health Place. 2009;15:811–818.
237. Davis EM, Cullen KW, Watson KB, Konarik M, Radcliffe J. A FreshFruit and Vegetable Program improves high school students’ con-sumption of fresh produce. J Am Diet Assoc. 2009;109:1227–1231.
238. Foster GD, Sherman S, Borradaile KE, Grundy KM, Vander Veur SS,Nachmani J, Karpyn A, Kumanyika S, Shults J. A policy-based schoolintervention to prevent overweight and obesity. Pediatrics. 2008;121:e794–e802.
239. Coyle KK, Potter S, Schneider D, May G, Robin LE, Seymour J, DebrotK. Distributing free fresh fruit and vegetables at school: results of a pilotoutcome evaluation. Public Health Rep. 2009;124:660–669.
240. Day ME, Strange KS, McKay HA, Naylor PJ. Action schools!BC–Healthy Eating: effects of a whole-school model to modifyingeating behaviours of elementary school children. Can J Public Health.2008;99:328–331.
241. Muckelbauer R, Libuda L, Clausen K, Toschke AM, Reinehr T,Kersting M. Promotion and provision of drinking water in schools foroverweight prevention: randomized, controlled cluster trial. Pediatrics.2009;123:e661–e667.
242. Patel AI, Bogart LM, Elliott MN, Lamb S, Uyeda KE, Hawes-DawsonJ, Klein DJ, Schuster MA. Increasing the availability and consumptionof drinking water in middle schools: a pilot study. Prev Chronic Dis.2011;8:A60.
243. Loughridge JL, Barratt J. Does the provision of cooled filtered water insecondary school cafeterias increase water drinking and decrease thepurchase of soft drinks? J Hum Nutr Diet. 2005;18:281–286.
244. Nickelson J, Roseman MG, Forthofer MS. Associations betweenparental limits, school vending machine purchases, and soft drink con-sumption among Kentucky middle school students. J Nutr Educ Behav.2010;42:115–122.
245. Thompson OM, Yaroch AL, Moser RP, Finney Rutten LJ, Agurs-Collins T. School vending machine purchasing behavior: results fromthe 2005 YouthStyles survey. J Sch Health. 2010;80:225–232.
246. Park S, Sappenfield WM, Huang Y, Sherry B, Bensyl DM. The impactof the availability of school vending machines on eating behavior duringlunch: the Youth Physical Activity and Nutrition Survey. J Am DietAssoc. 2010;110:1532–1536.
247. Gorton D, Carter J, Cvjetan B, Ni Mhurchu C. Healthier vendingmachines in workplaces: both possible and effective. N Z Med J. 2010;123:43–52.
248. Fernandes MM, Sturm R. The role of school physical activity programsin child body mass trajectory. J Phys Act Health. 2011;8:174–181.
249. Willenberg LJ, Ashbolt R, Holland D, Gibbs L, MacDougall C, GarrardJ, Green JB, Waters E. Increasing school playground physical activity:a mixed methods study combining environmental measures and chil-dren’s perspectives. J Sci Med Sport. 2010;13:210–216.
250. Nielsen G, Taylor R, Williams S, Mann J. Permanent play facilities inschool playgrounds as a determinant of children’s activity. J Phys ActHealth. 2010;7:490–496.
251. Ridgers ND, Fairclough SJ, Stratton G. Twelve-month effects of aplayground intervention on children’s morning and lunchtime recessphysical activity levels. J Phys Act Health. 2010;7:167–175.
252. Stewart JA, Dennison DA, Kohl HW 3rd, Doyle JA. Exercise level andenergy expenditure in the TAKE 10! in class physical activity program.J Sch Health. 2004;74:397–400.
253. Mahar MT, Murphy SK, Rowe DA, Golden J, Shields AT, Raedeke TD.Effects of a classroom-based program on physical activity and on-taskbehavior. Med Sci Sports Exerc. 2006;38:2086–2094.
254. Liu A, Hu X, Ma G, Cui Z, Pan Y, Chang S, Zhao W, Chen C.Evaluation of a classroom-based physical activity promoting pro-gramme. Obes Rev. 2008;9(suppl 1):130–134.
255. Donnelly JE, Greene JL, Gibson CA, Smith BK, Washburn RA, SullivanDK, DuBose K, Mayo MS, Schmelzle KH, Ryan JJ. Physical ActivityAcross the Curriculum (PAAC): a randomized controlled trial topromote physical activity and diminish overweight and obesity in ele-mentary school children. Prev Med. 2009;49:336–341.
256. Katz DL, Cushman D, Reynolds J, Njike V, Treu JA, Walker J, SmithE, Katz C. Putting physical activity where it fits in the school day:preliminary results of the ABC (Activity Bursts in the Classroom) forfitness program. Prev Chronic Dis. 2010;7:A82.
257. Kriemler S, Zahner L, Schindler C, Meyer U, Hartmann T, Hebestreit H,Brunner-La Rocca HP, van Mechelen W, Puder JJ. Effect of schoolbased physical activity programme (KISS) on fitness and adiposity inprimary schoolchildren: cluster randomised controlled trial. BMJ. 2010;340:c785.
258. Jurg ME, Kremers SP, Candel MJ, Van der Wal MF, De Meij JS. Acontrolled trial of a school-based environmental intervention to improvephysical activity in Dutch children: JUMP-in, kids in motion. HealthPromot Int. 2006;21:320–330.
259. Harris KC, Kuramoto LK, Schulzer M, Retallack JE. Effect ofschool-based physical activity interventions on body mass index inchildren: a meta-analysis. CMAJ. 2009;180:719–726.
260. Jago R, McMurray RG, Bassin S, Pyle L, Bruecker S, Jakicic JM, MoeE, Murray T, Volpe SL. Modifying middle school physical education:piloting strategies to increase physical activity. Pediatr Exerc Sci. 2009;21:171–185.
261. Jansen W, Borsboom G, Meima A, Zwanenburg EJ, Mackenbach JP,Raat H, Brug J. Effectiveness of a primary school-based intervention toreduce overweight. Int J Pediatr Obes. 2011;6:e70–e77.
262. Sobko T, Svensson V, Ek A, Ekstedt M, Karlsson H, Johansson E, CaoY, Hagstromer M, Marcus C. A randomised controlled trial for over-weight and obese parents to prevent childhood obesity: early STOPP(STockholm Obesity Prevention Program). BMC Public Health. 2011;11:336.
263. Roth K, Mauer S, Obinger M, Ruf KC, Graf C, Kriemler S, Lenz D,Lehmacher W, Hebestreit H. Prevention through Activity in Kinder-garten Trial (PAKT): a cluster randomised controlled trial to assess theeffects of an activity intervention in preschool children. BMC PublicHealth. 2010;10:410.
264. Faulkner GE, Buliung RN, Flora PK, Fusco C. Active school transport,physical activity levels and body weight of children and youth: a sys-tematic review. Prev Med. 2009;48:3–8.
265. Heelan KA, Abbey BM, Donnelly JE, Mayo MS, Welk GJ. Evaluationof a walking school bus for promoting physical activity in youth. J PhysAct Health. 2009;6:560–567.
266. Mendoza JA, Levinger DD, Johnston BD. Pilot evaluation of a walkingschool bus program in a low-income, urban community. BMC PublicHealth. 2009;9:122.
267. Anderson LM, Quinn TA, Glanz K, Ramirez G, Kahwati LC, JohnsonDB, Buchanan LR, Archer WR, Chattopadhyay S, Kalra GP, Katz DL.The effectiveness of worksite nutrition and physical activity inter-ventions for controlling employee overweight and obesity: a systematicreview. Am J Prev Med. 2009;37:340–357.
268. Groeneveld IF, Proper KI, van der Beek AJ, Hildebrandt VH, vanMechelen W. Lifestyle-focused interventions at the workplace to reducethe risk of cardiovascular disease–a systematic review. Scand J WorkEnviron Health. 2010;36:202–215.
269. Engbers LH, van Poppel MN, van Mechelen W. Measuring stair use intwo office buildings: a comparison between an objective and a self-reported method. Scand J Med Sci Sports. 2007;17:165–171.
270. Nicoll G, Zimring C. Effect of innovative building design on physicalactivity. J Public Health Policy. 2009;30(suppl 1):S111–S123.
271. Schwartz MA, Aytur SA, Evenson KR, Rodriguez DA. Are perceptionsabout worksite neighborhoods and policies associated with walking?Am J Health Promot. 2009;24:146–151.
272. Schwetschenau HM, O’Brien WH, Cunningham CJ, Jex SM. Barriers tophysical activity in an on-site corporate fitness center. J Occup HealthPsychol. 2008;13:371–380.
273. Pedersen MT, Blangsted AK, Andersen LL, Jorgensen MB, Hansen EA,Sjogaard G. The effect of worksite physical activity intervention onphysical capacity, health, and productivity: a 1-year randomized con-trolled trial. J Occup Environ Med. 2009;51:759–770.
1558 Circulation September 18, 2012
by guest on February 6, 2016http://circ.ahajournals.org/Downloaded from

274. Gilson N, McKenna J, Cooke C, Brown W. Walking towards health ina university community: a feasibility study. Prev Med. 2007;44:167–169.
275. Pelletier KR. A review and analysis of the clinical- and cost-effectiveness studies of comprehensive health promotion and diseasemanagement programs at the worksite: 1998–2000 update. Am J HealthPromot. 2001;16:107–116.
276. Pelletier KR. A review and analysis of the clinical and cost-effectivenessstudies of comprehensive health promotion and disease managementprograms at the worksite: update VI, 2000–2004. J Occup Environ Med.2005;47:1051–1058.
277. Pelletier KR. A review and analysis of the clinical and cost-effectivenessstudies of comprehensive health promotion and disease managementprograms at the worksite: update VII, 2004–2008. J Occup EnvironMed. 2009;51:822–837.
278. Calderon KS, Smallwood C, Tipton DA. Kennedy Space Center Car-diovascular Disease Risk Reduction Program evaluation. Vasc HealthRisk Manag. 2008;4:421–426.
279. Chung M, Melnyk P, Blue D, Renaud D, Breton MC. Worksite healthpromotion: the value of the Tune Up Your Heart program. Popul HealthManag. 2009;12:297–304.
280. Milani RV, Lavie CJ. Impact of worksite wellness intervention oncardiac risk factors and one-year health care costs. Am J Cardiol.2009;104:1389–1392.
281. Racette SB, Deusinger SS, Inman CL, Burlis TL, Highstein GR, BuskirkTD, Steger-May K, Peterson LR. Worksite Opportunities for Wellness(WOW): effects on cardiovascular disease risk factors after 1 year. PrevMed. 2009;49:108–114.
282. Cahill K, Moher M, Lancaster T. Workplace interventions for smokingcessation. Cochrane Database Sys Rev. 2008;(4):CD003440.
283. Wang MC, Cubbin C, Ahn D, Winkleby MA. Changes in neigh-bourhood food store environment, food behaviour and body mass index,1981–1990. Public Health Nutr. 2008;11:963–970.
284. Morland K, Wing S, Diez Roux A. The contextual effect of the localfood environment on residents’ diets: the Atherosclerosis Risk In Com-munities Study. Am J Public Health. 2002;92:1761–1767.
285. Laraia BA, Siega-Riz AM, Kaufman JS, Jones SJ. Proximity of super-markets is positively associated with diet quality index for pregnancy.Prev Med. 2004;39:869–875.
286. Moore LV, Diez Roux AV, Nettleton JA, Jacobs DR Jr. Associations ofthe local food environment with diet quality: a comparison ofassessments based on surveys and geographic information systems: theMulti-Ethnic Study of Atherosclerosis. Am J Epidemiol. 2008;167:917–924.
287. Rose D, Richards R. Food store access and household fruit and veg-etable use among participants in the US Food Stamp Program. PublicHealth Nutr. 2004;7:1081–1088.
288. Jago R, Baranowski T, Baranowski JC, Cullen KW, Thompson D.Distance to food stores and adolescent male fruit and vegetable con-sumption: mediation effects. Int J Behav Nutr Phys Act. 2007;4:35.
289. Boone-Heinonen J, Gordon-Larsen P, Kiefe CI, Shikany JM, Lewis CE,Popkin BM. Fast food restaurants and food stores: longitudinal associ-ations with diet in young to middle-aged adults: the CARDIA study.Arch Intern Med. 2011;171:1162–1170.
290. Morland K, Diez Roux AV, Wing S. Supermarkets, other food stores,and obesity: the Atherosclerosis Risk In Communities Study. Am J PrevMed. 2006;30:333–339.
291. Lopez RP. Neighborhood risk factors for obesity. Obesity (SilverSpring). 2007;15:2111–2119.
292. Powell LM, Auld MC, Chaloupka FJ, O’Malley PM, Johnston LD.Associations between access to food stores and adolescent body massindex. Am J Prev Med. 2007;33:S301–S307.
293. Liu GC, Wilson JS, Qi R, Ying J. Green neighborhoods, food retail andchildhood overweight: differences by population density. Am J HealthPromot. 2007;21(suppl):317–325.
294. Wang MC, Kim S, Gonzalez AA, MacLeod KE, Winkleby MA.Socioeconomic and food-related physical characteristics of theneighbourhood environment are associated with body mass index. JEpidemiol Community Health. 2007;61:491– 498.
295. Chen SE, Florax RJ. Zoning for health: the obesity epidemic andopportunities for local policy intervention. J Nutr. 2010;140:1181–1184.
296. Rundle A, Neckerman KM, Freeman L, Lovasi GS, Purciel M, Quinn J,Richards C, Sircar N, Weiss C. Neighborhood food environment andwalkability predict obesity in New York City. Environ Health Perspect.2009;117:442–447.
297. Jilcott SB, Keyserling T, Crawford T, McGuirt JT, Ammerman AS.Examining associations among obesity and per capita farmers’ markets,grocery stores/supermarkets, and supercenters in US counties. J Am DietAssoc. 2011;111:567–572.
298. Salois MJ. Obesity and diabetes, the built environment, and the “local”food economy in the United States, 2007. Econ Hum Biol. 2012;10:35–42.
299. Leung CW, Laraia BA, Kelly M, Nickleach D, Adler NE, Kushi LH,Yen IH. The influence of neighborhood food stores on change in younggirls’ body mass index. Am J Prev Med. 2011;41:43–51.
300. Inagami S, Cohen DA, Finch BK, Asch SM. You are where you shop:grocery store locations, weight, and neighborhoods. Am J Prev Med.2006;31:10–17.
301. Murakami K, Sasaki S, Takahashi Y, Uenishi K. Neighborhood foodstore availability in relation to food intake in young Japanese women.Nutrition. 2009;25:640–646.
302. Richardson AS, Boone-Heinonen J, Popkin BM, Gordon-Larsen P.Neighborhood fast food restaurants and fast food consumption: anational study. BMC Public Health. 2011;11:543.
303. Burdette HL, Whitaker RC. Neighborhood playgrounds, fast food res-taurants, and crime: relationships to overweight in low-income pre-school children. Prev Med. 2004;38:57–63.
304. Simmons D, McKenzie A, Eaton S, Cox N, Khan MA, Shaw J, ZimmetP. Choice and availability of takeaway and restaurant food is not relatedto the prevalence of adult obesity in rural communities in Australia. IntJ Obes (Lond). 2005;29:703–710.
305. Jeffery RW, Baxter J, McGuire M, Linde J. Are fast food restaurants anenvironmental risk factor for obesity? Int J Behav Nutr Phys Act.2006;3:2.
306. Mehta NK, Chang VW. Weight status and restaurant availability: amultilevel analysis. Am J Prev Med. 2008;34:127–133.
307. Currie J, DellaVigna S, Moretti E, Pathania V. The Effect of Fast FoodRestaurants on Obesity and Weight Gain. Cambridge, MA: NationalBureau of Economic Research; 2009. NBER working paper 14721.
308. Spence JC, Cutumisu N, Edwards J, Raine KD, Smoyer-Tomic K.Relation between local food environments and obesity among adults.BMC Public Health. 2009;9:192.
309. Li F, Harmer P, Cardinal BJ, Bosworth M, Johnson-Shelton D. Obesityand the built environment: does the density of neighborhood fast-foodoutlets matter? Am J Health Promot. 2009;23:203–209.
310. Li F, Harmer P, Cardinal BJ, Bosworth M, Johnson-Shelton D, MooreJM, Acock A, Vongjaturapat N. Built environment and 1-year change inweight and waist circumference in middle-aged and older adults: PortlandNeighborhood Environment and Health Study. Am J Epidemiol. 2009;169:401–408.
311. Alter DA, Eny K. The relationship between the supply of fast-foodchains and cardiovascular outcomes. Can J Public Health. 2005;96:173–177.
312. Davis B, Carpenter C. Proximity of fast-food restaurants to schools andadolescent obesity. Am J Public Health. 2009;99:505–510.
313. Cheadle A, Psaty BM, Curry S, Wagner E, Diehr P, Koepsell T, KristalA. Can measures of the grocery store environment be used to trackcommunity-level dietary changes? Prev Med. 1993;22:361–372.
314. Fisher BD, Strogatz DS. Community measures of low-fat milk con-sumption: comparing store shelves with households. Am J PublicHealth. 1999;89:235–237.
315. Edmonds J, Baranowski T, Baranowski J, Cullen KW, Myres D. Eco-logical and socioeconomic correlates of fruit, juice, and vegetable con-sumption among African-American boys. Prev Med. 2001;32:476–481.
316. Bodor JN, Rose D, Farley TA, Swalm C, Scott SK. Neighbourhood fruitand vegetable availability and consumption: the role of small food storesin an urban environment. Public Health Nutr. 2008;11:413–420.
317. Auchincloss AH, Diez Roux AV, Brown DG, Erdmann CA, BertoniAG. Neighborhood resources for physical activity and healthy foods andtheir association with insulin resistance. Epidemiology. 2008;19:146–157.
318. Rose D, Hutchinson PL, Bodor JN, Swalm CM, Farley TA, Cohen DA,Rice JC. Neighborhood food environments and body mass index: theimportance of in-store contents. Am J Prev Med. 2009;37:214–219.
319. McCormack LA, Laska MN, Larson NI, Story M. Review of the nutri-tional implications of farmers’ markets and community gardens: a callfor evaluation and research efforts. J Am Diet Assoc. 2010;110:399–408.
320. Racine EF, Smith Vaughn A, Laditka SB. Farmers’ market use amongAfrican-American women participating in the Special Supplemental
Mozaffarian et al Population Approaches to Diet, Activity, and Smoking 1559
by guest on February 6, 2016http://circ.ahajournals.org/Downloaded from

Nutrition Program for Women, Infants, and Children. J Am Diet Assoc.2010;110:441–446.
321. Freedman DA, Bell BA, Collins LV. The Veggie Project: a case studyof a multi-component farmers’ market intervention. J Prim Prev. 2011;32:213–224.
322. Alaimo K, Packnett E, Miles RA, Kruger DJ. Fruit and vegetable intakeamong urban community gardeners. J Nutr Educ Behav. 2008;40:94–101.
323. Lackey JF and associates. Evaluation of community gardens. 1998.http://www.uwex.edu/ces/pdande/evaluation/pdf/comgardens.pdf.Accessed March 25, 2012.
324. Johnson DB, Smith LT. Testing the recommendations of the Wash-ington State Nutrition and Physical Activity Plan: the Moses Lake casestudy. Prev Chronic Dis. 2006;3:A59.
325. Cummins S, Macintyre S. Food deserts: evidence and assumption inhealth policy making. Br Med J. 2002;325:436–438.
326. Cummins S, Petticrew M, Higgins C, Findlay A, Sparks L. Large scalefood retailing as an intervention for diet and health: quasi-experimentalevaluation of a natural experiment. J Epidemiol Community Health.2005;59:1035–1040.
327. Institute of Medicine and National Research Council. The Public HealthEffects of Food Deserts: Workshop Summary. Washington, DC: TheNational Academies Press; 2009.
328. Ver Ploeg M, Breneman V, Farrigan T, Hamrick K, Hopkins D,Kaufman P, Lin BH, Nord M, Smith T, Williams R, Kinnison K,Olander C, Singh A, Tuckermanty E. Access to Affordable andNutritious Food: Measuring and Understanding Food Deserts and TheirConsequences: Report to Congress. 2010. http://www.ers.usda.gov/Publications/AP/AP036/. Accessed March 25, 2012.
329. ver Ploeg M. Food environment, food store access, consumer behavior,and diet. Choices. 2010;25.
330. Block JP, Scribner RA, DeSalvo KB. Fast food, race/ethnicity, andincome: a geographic analysis. Am J Prev Med. 2004;27:211–217.
331. Baker EA, Schootman M, Barnidge E, Kelly C. The role of race andpoverty in access to foods that enable individuals to adhere to dietaryguidelines. Prev Chronic Dis. 2006;3:A76.
332. Lewis LB, Sloane DC, Nascimento LM, Diamant AL, Guinyard JJ,Yancey AK, Flynn G. African Americans’ access to healthy foodoptions in South Los Angeles restaurants. Am J Public Health. 2005;95:668–673.
333. Powell LM, Slater S, Mirtcheva D, Bao Y, Chaloupka FJ. Food storeavailability and neighborhood characteristics in the United States. PrevMed. 2007;44:189–195.
334. Lovasi GS, Hutson MA, Guerra M, Neckerman KM. Built environmentsand obesity in disadvantaged populations. Epidemiol Rev. 2009;31:7–20.
335. Macintyre S, McKay L, Cummins S, Burns C. Out-of-home food outletsand area deprivation: case study in Glasgow, UK. Int J Behav Nutr PhysAct. 2005;2:16.
336. Cummins SC, McKay L, MacIntyre S. McDonald’s restaurants andneighborhood deprivation in Scotland and England. Am J Prev Med.2005;29:308–310.
337. Frost SS, Goins RT, Hunter RH, Hooker SP, Bryant LL, Kruger J, PlutoD. Effects of the built environment on physical activity of adults livingin rural settings. Am J Health Promot. 2010;24:267–283.
338. Bauman AE, Bull FC. Environmental Correlates of Physical Activityand Walking in Adults and Children: A Review of Reviews. London,United Kingdom: National Institute of Health and Clinical Excellence;2007.
339. Humpel N, Owen N, Leslie E. Environmental factors associated withadults’ participation in physical activity: a review. Am J Prev Med.2002;22:188–199.
340. Duncan MJ, Spence JC, Mummery WK. Perceived environment andphysical activity: a meta-analysis of selected environmental character-istics. Int J Behav Nutr Phys Act. 2005;2:11.
341. Coombes E, Jones AP, Hillsdon M. The relationship of physical activityand overweight to objectively measured green space accessibility anduse. Soc Sci Med. 2010;70:816–822.
342. Witten K, Hiscock R, Pearce J, Blakely T. Neighbourhood access toopen spaces and the physical activity of residents: a national study. PrevMed. 2008;47:299–303.
343. Davison KK, Lawson CT. Do attributes in the physical environmentinfluence children’s physical activity? A review of the literature. Int JBehav Nutr Phys Act. 2006;3:19.
344. Ferreira I, van der Horst K, Wendel-Vos W, Kremers S, van Lenthe FJ,Brug J. Environmental correlates of physical activity in youth: a reviewand update. Obes Rev. 2007;8:129–154.
345. Boone-Heinonen J, Casanova K, Richardson AS, Gordon-Larsen P.Where can they play? Outdoor spaces and physical activity amongadolescents in U.S. urbanized areas. Prev Med. 2010;51:295–298.
346. Boone-Heinonen J, Guilkey DK, Evenson KR, Gordon-Larsen P. Res-idential self-selection bias in the estimation of built environment effectson physical activity between adolescence and young adulthood. Int JBehav Nutr Phys Act. 2010;7:70.
347. Boone-Heinonen J, Gordon-Larsen P. Life stage and sex specificity inrelationships between the built and socioeconomic environments andphysical activity. J Epidemiol Community Health. 2011;65:847–852.
348. Boone-Heinonen J, Popkin BM, Song Y, Gordon-Larsen P. What neigh-borhood area captures built environment features related to adolescentphysical activity? Health Place. 2010;16:1280–1286.
349. Papas MA, Alberg AJ, Ewing R, Helzlsouer KJ, Gary TL, Klassen AC.The built environment and obesity. Epidemiol Rev. 2007;29:129–143.
350. Dunton GF, Kaplan J, Wolch J, Jerrett M, Reynolds KD. Physicalenvironmental correlates of childhood obesity: a systematic review.Obes Rev. 2009;10:393–402.
351. Feng J, Glass TA, Curriero FC, Stewart WF, Schwartz BS. The builtenvironment and obesity: a systematic review of the epidemiologicevidence. Health Place. 2010;16:175–190.
352. Brownson RC, Hoehner CM, Day K, Forsyth A, Sallis JF. Measuring thebuilt environment for physical activity: state of the science. Am J PrevMed. 2009;36:S99–S123.
353. Davison KK, Werder JL, Lawson CT. Children’s active commuting toschool: current knowledge and future directions. Prev Chronic Dis.2008;5:A100.
354. Panter JR, Jones AP, van Sluijs EM. Environmental determinants ofactive travel in youth: a review and framework for future research. Int JBehav Nutr Phys Act. 2008;5:34.
355. Galvez MP, Pearl M, Yen IH. Childhood obesity and the built envi-ronment. Curr Opin Pediatr. 2010;22:202–207.
356. Carter MA, Dubois L. Neighbourhoods and child adiposity: a criticalappraisal of the literature. Health Place. 2010;16:616–628.
357. Casagrande SS, Whitt-Glover MC, Lancaster KJ, Odoms-Young AM,Gary TL. Built environment and health behaviors among African Amer-icans: a systematic review. Am J Prev Med. 2009;36:174–181.
358. Chow CK, Lock K, Teo K, Subramanian SV, McKee M, Yusuf S.Environmental and societal influences acting on cardiovascular riskfactors and disease at a population level: a review. Int J Epidemiol.2009;38:1580–1594.
359. Saelens BE, Handy SL. Built environment correlates of walking: areview. Med Sci Sports Exerc. 2008;40:S550–S566.
360. Wells NM, Yang Y. Neighborhood design and walking: a quasi-experimental longitudinal study. Am J Prev Med. 2008;34:313–319.
361. Tester JM. The built environment: designing communities to promotephysical activity in children. Pediatrics. 2009;123:1591–1598.
362. Carver A, Timperio A, Hesketh K, Crawford D. Are safety-relatedfeatures of the road environment associated with smaller declines inphysical activity among youth? J Urban Health. 2010;87:29–43.
363. Hume C, Timperio A, Salmon J, Carver A, Giles-Corti B, Crawford D.Walking and cycling to school: predictors of increases among childrenand adolescents. Am J Prev Med. 2009;36:195–200.
364. Cleland VJ, Timperio A, Crawford D. Are perceptions of the physicaland social environment associated with mothers’ walking for leisure andfor transport? A longitudinal study. Prev Med. 2008;47:188–193.
365. Hou N, Popkin BM, Jacobs DR Jr, Song Y, Guilkey D, Lewis CE, Gordon-Larsen P. Longitudinal associations between neighborhood-level streetnetwork with walking, bicycling, and jogging: the CARDIA study. HealthPlace. 2010;16:1206–1215.
366. Fitzhugh EC, Bassett DR Jr, Evans MF. Urban trails and physicalactivity: a natural experiment. Am J Prev Med. 2010;39:259–262.
367. Booth KM, Pinkston MM, Poston WS. Obesity and the built envi-ronment. J Am Diet Assoc. 2005;105:S110–117.
368. Carver A, Timperio A, Crawford D. Playing it safe: the influence ofneighbourhood safety on children’s physical activity: a review. HealthPlace. 2008;14:217–227.
369. Weir LA, Etelson D, Brand DA. Parents’ perceptions of neighborhoodsafety and children’s physical activity. Prev Med. 2006;43:212–217.
370. Gordon-Larsen P, McMurray RG, Popkin BM. Determinants of ado-lescent physical activity and inactivity patterns. Pediatrics. 2000;105:E83.
1560 Circulation September 18, 2012
by guest on February 6, 2016http://circ.ahajournals.org/Downloaded from

371. Kerr J, Rosenberg D, Sallis JF, Saelens BE, Frank LD, Conway TL.Active commuting to school: associations with environment andparental concerns. Med Sci Sports Exerc. 2006;38:787–794.
372. Crawford D, Cleland V, Timperio A, Salmon J, Andrianopoulos N,Roberts R, Giles-Corti B, Baur L, Ball K. The longitudinal influence ofhome and neighbourhood environments on children’s body mass indexand physical activity over 5 years: the CLAN study. Int J Obes (Lond).2010;34:1177–1187.
373. Foster S, Giles-Corti B. The built environment, neighborhood crime andconstrained physical activity: an exploration of inconsistent findings.Prev Med. 2008;47:241–251.
374. McCormack GR, Rock M, Toohey AM, Hignell D. Characteristics ofurban parks associated with park use and physical activity: a review ofqualitative research. Health Place. 2010;16:712–726.
375. West JH, Blumberg EJ, Kelley NJ, Hill L, Sipan CL, Schmitz KE, RyanS, Clapp JD, Hovell MF. Does proximity to retailers influence alcoholand tobacco use among Latino adolescents? J Immigr Minor Health.2010;12:626–633.
376. Pearce J, Hiscock R, Moon G, Barnett R. The neighbourhood effects ofgeographical access to tobacco retailers on individual smokingbehaviour. J Epidemiol Community Health. 2009;63:69–77.
377. Li W, Land T, Zhang Z, Keithly L, Kelsey JL. Small-area estimation andprioritizing communities for tobacco control efforts in Massachusetts.Am J Public Health. 2009;99:470–479.
378. Novak SP, Reardon SF, Raudenbush SW, Buka SL. Retail tobaccooutlet density and youth cigarette smoking: a propensity-modelingapproach. Am J Public Health. 2006;96:670–676.
379. Chuang YC, Cubbin C, Ahn D, Winkleby MA. Effects of neigh-bourhood socioeconomic status and convenience store concentration onindividual level smoking. J Epidemiol Community Health. 2005;59:568–573.
380. McCarthy WJ, Mistry R, Lu Y, Patel M, Zheng H, Dietsch B. Densityof tobacco retailers near schools: effects on tobacco use among students.Am J Public Health. 2009;99:2006–2013.
381. Henriksen L, Feighery EC, Schleicher NC, Cowling DW, Kline RS,Fortmann SP. Is adolescent smoking related to the density and proximityof tobacco outlets and retail cigarette advertising near schools? PrevMed. 2008;47:210–214.
382. Stead LF, Perera R, Lancaster T. Telephone counselling for smokingcessation. Cochrane Database Sys Rev. 2006;(3):CD002850.
383. Lando HA, Hellerstedt WL, Pirie PL, McGovern PG. Brief supportivetelephone outreach as a recruitment and intervention strategy forsmoking cessation. Am J Public Health. 1992;82:41–46.
384. Zhu SH, Stretch V, Balabanis M, Rosbrook B, Sadler G, Pierce JP.Telephone counseling for smoking cessation: effects of single-sessionand multiple-session interventions. J Consult Clin Psychol. 1996;64:202–211.
385. Ossip-Klein DJ, Giovino GA, Megahed N, Black PM, Emont SL,Stiggins J, Shulman E, Moore L. Effects of smokers’ hotline: results ofa 10-county self-help trial. J Consult Clin Psychol. 1991;59:325–332.
386. The Guide to Community Preventive Services. Increasing tobacco usecessation: multicomponent interventions that include telephone support.2011. http://www.thecommunityguide.org/tobacco/cessation/multicomponentinterventions.html. Accessed April 15, 2011.
387. The Federal Trade Commission. Marketing Food to Children and Ado-lescents: A Review of Industry Expenditures, Activities, and Self-Regulation. 2008. www.ftc.gov/os/2008/07/P064504.foodmktingreport.pdf. Accessed August 9, 2012.
388. Hastings G, McDermott L, Angus K, Stead M, Thomson S. The extent,nature and effects of food promotion to children: a review of theevidence. Technical paper prepared for the World Health Organization.2006. http://www.who.int/dietphysicalactivity/publications/Hastings_paper_marketing.pdf. Accessed September 30, 2011.
389. Institute of Medicine, Committee on Food Marketing and the Diets ofChildren and Youth. McGinnis JM, Gootman JA, Kraak VI, eds. FoodMarketing to Children and Youth: Threat or Opportunity? Washington,DC: The National Academies Press; 2006.
390. Powell LM, Szczypka G, Chaloupka FJ, Braunschweig CL. Nutritionalcontent of television food advertisements seen by children and ado-lescents in the United States. Pediatrics. 2007;120:576–583.
391. Gantz W, Schwartz N, Angelini JR, Rideout V. Food for thought:television food advertising to children in the United States: a KaiserFamily Foundation report. 2007. http://www.kff.org/entmedia/upload/7618.pdf. Accessed March 25, 2012.
392. Chou SY, Rashad I, Grossman M. Fast-food restaurant advertising ontelevision and its influence on childhood obesity. J Law Econ. 2008;51:599–618.
393. Veerman JL, Van Beeck EF, Barendregt JJ, Mackenbach JP. By howmuch would limiting TV food advertising reduce childhood obesity?Eur J Public Health. 2009;19:365–369.
394. Hawkes C. Marketing food to children: the global regulatory envi-ronment. 2004. http://www.whqlibdoc.who.int/publications/2004/9241591579.pdf. Accessed March 25, 2012.
395. Leth T, Jensen HG, Mikkelsen AA, Bysted A. The effect of the regu-lation on trans fatty acid content in Danish food. Atheroscler Suppl.2006;7:53–56.
396. Uusitalo U, Feskens EJ, Tuomilehto J, Dowse G, Haw U, Fareed D,Hemraj F, Gareeboo H, Alberti KG, Zimmet P. Fall in total cholesterolconcentration over five years in association with changes in fatty acidcomposition of cooking oil in Mauritius: cross sectional survey. BMJ.1996;313:1044–1046.
397. Eyler A, Lankford T, Chriqui J, Evenson KR, Kruger J, Tompkins N,Voorhees C, Zieff S, Aytur S, Brownson R. An analysis of state legis-lation on community trails. J Phys Act Health. 2010;7(suppl1):S40–S47.
398. Gomez LF, Mateus JC, Cabrera G. Leisure-time physical activity amongwomen in a neighbourhood in Bogota, Colombia: prevalence and socio-demographic correlates. Cad Saude Publica. 2004;20:1103–1109.
399. Eyler A, Brownson R, Schmid T, eds. Physical activity policy: frompresent to future. J Phys Act Health. 2010;7(suppl 1):S1–S125.
400. Harris CV, Bradlyn AS, Tompkins NO, Purkey MB, Kennedy KA,Kelley GA. Evaluating the West Virginia Healthy Lifestyles Act:methods and procedures. J Phys Act Health. 2010;7(suppl 1):S31–S39.
401. Institute of Medicine, Committee on Secondhand Smoke Exposure andAcute Coronary Events. Secondhand Smoke Exposure and Cardio-vascular Effects: Making Sense of the Evidence. Washington, DC: TheNational Academies Press; 2009.
402. Barone-Adesi F, Vizzini L, Merletti F, Richiardi L. Short-term effects ofItalian smoking regulation on rates of hospital admission for acutemyocardial infarction. Eur Heart J. 2006;27:2468–2472.
403. Bartecchi C, Alsever RN, Nevin-Woods C, Thomas WM, Estacio RO,Bartelson BB, Krantz MJ. Reduction in the incidence of acute myo-cardial infarction associated with a citywide smoking ordinance.Circulation. 2006;114:1490 –1496.
404. Centers for Disease Control and Prevention. Reduced hospitalizationsfor acute myocardial infarction after implementation of a smoke-freeordinance: city of Pueblo, Colorado, 2002–2006. MMWR Morb MortalWkly Rep. 2009;57:1373–1377.
405. Cesaroni G, Forastiere F, Agabiti N, Valente P, Zuccaro P, Perucci CA.Effect of the Italian smoking ban on population rates of acute coronaryevents. Circulation. 2008;117:1183–1188.
406. Juster HR, Loomis BR, Hinman TM, Farrelly MC, Hyland A, Bauer UE,Birkhead GS. Declines in hospital admissions for acute myocardialinfarction in New York state after implementation of a comprehensivesmoking ban. Am J Public Health. 2007;97:2035–2039.
407. Khuder SA, Milz S, Jordan T, Price J, Silvestri K, Butler P. The impactof a smoking ban on hospital admissions for coronary heart disease. PrevMed. 2007;45:3–8.
408. Lemstra M, Neudorf C, Opondo J. Implications of a public smoking ban.Can J Public Health. 2008;99:62–65.
409. Pell JP, Haw S, Cobbe S, Newby DE, Pell AC, Fischbacher C, McCo-nnachie A, Pringle S, Murdoch D, Dunn F, Oldroyd K, Macintyre P,O’Rourke B, Borland W. Smoke-free legislation and hospitalizations foracute coronary syndrome. N Engl J Med. 2008;359:482–491.
410. Sargent RP, Shepard RM, Glantz SA. Reduced incidence of admissionsfor myocardial infarction associated with public smoking ban: beforeand after study. BMJ. 2004;328:977–980.
411. Seo DC, Torabi MR. Reduced admissions for acute myocardialinfarction associated with a public smoking ban: matched controlledstudy. J Drug Educ. 2007;37:217–226.
412. Vasselli S, Papini P, Gaelone D, Spizzichino L, De Campora E, GnaviR, Saitto C, Binkin N, Laurendi G. Reduction incidence of myocardialinfarction associated with a national legislative ban on smoking.Minerva Cardioangiol. 2008;56:197–203.
413. Meyers DG, Neuberger JS, He J. Cardiovascular effect of bans onsmoking in public places: a systematic review and meta-analysis. J AmColl Cardiol. 2009;54:1249–1255.
Mozaffarian et al Population Approaches to Diet, Activity, and Smoking 1561
by guest on February 6, 2016http://circ.ahajournals.org/Downloaded from

414. Lightwood JM, Glantz SA. Declines in acute myocardial infarction aftersmoke-free laws and individual risk attributable to secondhand smoke.Circulation. 2009;120:1373–1379.
415. Herman PM, Walsh ME. Hospital admissions for acute myocardialinfarction, angina, stroke, and asthma after implementation of Arizona’scomprehensive statewide smoking ban. Am J Public Health. 2011;101:491–496.
416. Trachsel LD, Kuhn MU, Reinhart WH, Schulzki T, Bonetti PO.Reduced incidence of acute myocardial infarction in the first year afterimplementation of a public smoking ban in Graubuenden, Switzerland.Swiss Med Wkly. 2010;140:133–138.
417. Naiman A, Glazier RH, Moineddin R. Association of anti-smokinglegislation with rates of hospital admission for cardiovascular and respi-ratory conditions. CMAJ. 2010;182:761–767.
418. Dove MS, Dockery DW, Mittleman MA, Schwartz J, Sullivan EM,Keithly L, Land T. The impact of Massachusetts’ smoke-free workplacelaws on acute myocardial infarction deaths. Am J Public Health. 2010;100:2206–2212.
419. Grassi MC, Enea D, Ferketich AK, Lu B, Nencini P. A smoking ban inpublic places increases the efficacy of bupropion and counseling oncessation outcomes at 1 year. Nicotine Tob Res. 2009;11:1114–1121.
420. Mackay D, Haw S, Ayres JG, Fischbacher C, Pell JP. Smoke-freelegislation and hospitalizations for childhood asthma. N Engl J Med.2010;363:1139–1145.
421. Hozawa A, Houston T, Steffes MW, Widome R, Williams OD, IribarrenC, Pletcher MJ, Daviglus ML, Carr JJ, Jacobs DR Jr. The association ofcigarette smoking with self-reported disease before middle age: theCoronary Artery Risk Development in Young Adults (CARDIA) study.Prev Med. 2006;42:193–199.
422. Gasparrini A, Gorini G, Barchielli A. On the relationship betweensmoking bans and incidence of acute myocardial infarction. Eur JEpidemiol. 2009;24:597–602.
423. Collins NM, Shi Q, Forster JL, Erickson DJ, Toomey TL. Effects ofclean indoor air laws on bar and restaurant revenue in Minnesota cities.Am J Prev Med. 2010;39:S10–S15.
424. Fichtenberg CM, Glantz SA. Effect of smoke-free workplaces onsmoking behaviour: systematic review. BMJ. 2002;325:188.
425. Hopkins DP, Razi S, Leeks KD, Priya Kalra G, Chattopadhyay SK,Soler RE. Smokefree policies to reduce tobacco use: a systematicreview. Am J Prev Med. 2010;38:S275–S289.
426. Bell K, McCullough L, Devries K, Jategaonkar N, Greaves L, Rich-ardson L. Location restrictions on smoking: assessing their differentialimpacts and consequences in the workplace. Can J Public Health.2009;100:46–50.
427. Moskowitz JM, Lin Z, Hudes ES. The impact of workplace smokingordinances in California on smoking cessation. Am J Public Health.2000;90:757–761.
428. Owen N, Borland R. Delayed compensatory cigarette consumption aftera workplace smoking ban. Tob Control. 1997;6:131–135.
429. Farrelly MC, Evans WN, Sfekas AES. The impact of workplacesmoking bans: results from a national survey. Tob Control. 1999;8:272–277.
430. Heloma A, Jaakkola MS. Four year follow up of smoke exposure,attitudes and smoking behaviour following enactment of Finland’snational smoke-free work-place law. Addiction. 2003;98:1111–1117.
431. Kinne S, Kristal AR, White E, Hunt J. Work-site smoking policies: theirpopulation impact in Washington State. Am J Public Health. 1993;83:1031–1033.
432. Gritz ER, Thompson B, Emmons K, Ockene JK, McLerran DF, NielsenIR. Gender differences among smokers and quitters in the Working WellTrial. Prev Med. 1998;27:553–561.
433. Bauer JE, Hyland A, Li Q, Steger C, Cummings KM. A longitudinalassessment of the impact of smoke-free worksite policies on tobaccouse. Am J Public Health. 2005;95:1024–1029.
434. Wheeler JG, Pulley LV, Felix HC, Bursac Z, Siddiqui NJ, Stewart MK,Mays GP, Gauss CH. Impact of a smoke-free hospital campus policy onemployee and consumer behavior. Public Health Rep. 2007;122:744–752.
435. Longo DR, Johnson JC, Kruse RL, Brownson RC, Hewett JE. A pro-spective investigation of the impact of smoking bans on tobacco ces-sation and relapse. Tob Control. 2001;10:267–272.
436. Mizoue T, Reijula K, Heloma A, Yamato H, Fujino Y. Impact ofworkplace smoking restrictions on smoking behaviour and attitudestoward quitting in Japan. Tob Control. 2000;9:435.
437. Osypuk TL, Subramanian S, Kawachi I, Acevedo-Garcia D. Isworkplace smoking policy equally prevalent and equally effectiveamong immigrants? J Epidemiol Community Health. 2009;63:784–791.
438. Friedrich V, Brugger A, Bauer G. Worksite tobacco prevention in theCanton of Zurich: stages of change, predictors, and outcomes. Int JPublic Health. 2009;54:427–438.
439. Farkas AJ, Gilpin EA, White MM, Pierce JP. Association betweenhousehold and workplace smoking restrictions and adolescent smoking.JAMA. 2000;284:717–722.
440. Skeer M, Cheng DM, Rigotti NA, Siegel M. Secondhand smokeexposure in the workplace. Am J Prev Med. 2005;28:331–337.
441. Ma J, Apelberg BJ, Avila-Tang E, Yang G, Ma S, Samet JM, StillmanFA. Workplace smoking restrictions in China: results from a six countysurvey. Tob Control. 2010;19:403–409.
442. Osinubi OY, Sinha S, Rovner E, Perez Lugo M, Jain NJ, Demissie K,Goldman M. Efficacy of tobacco dependence treatment in the context ofa “smoke free grounds” worksite policy: a case study. Am J Ind Med.2004;46:180–187.
443. American Heart Association, Department of Policy Research. PolicyPosition Statement on Body Mass Index (BMI) Surveillance andAssessment in Schools. 2009. http://www.heart.org/idc/groups/heart-public/@wcm/@adv/documents/downloadable/ucm_301789.pdf.Accessed September 30, 2011.
444. Sellstrom E, Bremberg S. Is there a “school effect” on pupil outcomes?A review of multilevel studies. J Epidemiol Community Health. 2006;60:149–155.
445. Borders TF, Xu KT, Bacchi D, Cohen L, SoRelle-Miner D. Collegecampus smoking policies and programs and students’ smokingbehaviors. BMC Public Health. 2005;5:74.
446. Barnett TA, Gauvin L, Lambert M, O’Loughlin J, Paradis G, McGrathJJ. The influence of school smoking policies on student tobacco use.Arch Pediatr Adolesc Med. 2007;161:842–848.
447. Piontek D, Buehler A, Rudolph U, Metz K, Kroeger C, Gradl S, FloeterS, Donath C. Social contexts in adolescent smoking: does school policymatter? Health Educ Res. 2008;23:1029–1038.
448. Boris NW, Johnson CC, Huang S, Myers L, Andrew K, Webber LS.Targeting school tobacco policy: lessons from the Acadiana Coalition ofTeens against Tobacco (ACTT). Health Promot Pract. 2009;10:549–556.
449. Murnaghan D, Leatherdale S, Sihvonen M, Kekki P. School-basedtobacco-control programming and student smoking behaviour. ChronicDis Can. 2009;29:169–177.
450. Apel M, Klein K, McDermott RJ, Westhoff WW. Restricting smoking atthe University of Koln, Germany: a case study. J Am Coll Health.1997;45:219–223.
451. Etter JF, Ronchi A, Perneger T. Short-term impact of a university basedsmoke free campaign. J Epidemiol Community Health. 1999;53:710–715.
452. Wakefield MA, Chaloupka FJ, Kaufman NJ, Orleans CT, Barker DC,Ruel EE. Effect of restrictions on smoking at home, at school, and inpublic places on teenage smoking: cross sectional study. BMJ. 2000;321:333–337.
453. Adams ML, Jason LA, Pokorny S, Hunt Y. The relationship betweenschool policies and youth tobacco use. J Sch Health. 2009;79:17–23.
454. Lipperman-Kreda S, Paschall MJ, Grube JW. Perceived enforcement ofschool tobacco policy and adolescents’ cigarette smoking. Prev Med.2009;48:562–566.
455. Sabiston CM, Lovato CY, Ahmed R, Pullman AW, Hadd V, CampbellHS, Nykiforuk C, Brown KS. School smoking policy characteristics andindividual perceptions of the school tobacco context: are they linked tostudents’ smoking status? J Youth Adolesc. 2009;38:1374–1387.
456. Evans-Whipp TJ, Bond L, Ukoumunne OC, Toumbourou JW, CatalanoRF. The impact of school tobacco policies on student smoking inWashington State, United States and Victoria, Australia. Int J EnvironRes Public Health. 2010;7:698–710.
457. Lovato C, Sabiston C, Hadd V, Nykiforuk C, Campbell H. The impactof school smoking policies and student perceptions of enforcement onschool smoking prevalence and location of smoking. Health Educ Res.2007;22:782–793.
458. Lovato CY, Pullman AW, Halpin P, Zeisser C, Nykiforuk CIJ, Best F,Diener A, Manske S. The influence of school policies on smokingprevalence among students in grades 5–9, Canada, 2004–2005. PrevChronic Dis. 2010;7:A129.
1562 Circulation September 18, 2012
by guest on February 6, 2016http://circ.ahajournals.org/Downloaded from

459. Mills AL, Messer K, Gilpin EA, Pierce JP. The effect of smoke-freehomes on adult smoking behavior: a review. Nicotine Tob Res. 2009;11:1131–1141.
460. Emory K, Saquib N, Gilpin EA, Pierce JP. The association betweenhome smoking restrictions and youth smoking behaviour: a review. TobControl. 2010;19:495–506.
461. Kabir Z, Alpert HR, Goodman PG, Haw S, Behm I, Connolly GN,Gupta PC, Clancy L. Effect of smoke-free home and workplace policieson second-hand smoke exposure levels in children: an evidencesummary. Pediatr Health. 2010;4:391–403.
462. Pizacani BA, Martin DP, Stark MJ, Koepsell TD, Thompson B, Diehr P.A prospective study of household smoking bans and subsequent ces-sation related behaviour: the role of stage of change. Tob Control.2004;13:23–28.
463. Wechsler H, Lee JE, Rigotti NA. Cigarette use by college students insmoke-free housing: results of a national study. Am J Prev Med. 2001;20:202–207.
464. Siahpush M, Borland R, Scollo M. Factors associated with smokingcessation in a national sample of Australians. Nicotine Tob Res. 2003;5:597–602.
465. Shelley D, Yerneni R, Hung D, Das D, Fahs M. The relative effect ofhousehold and workplace smoking restriction on health status amongChinese Americans living in New York City. J Urban Health. 2007;84:360–371.
466. Schultz AS, Nowatzki J, Dunn DA, Griffith EJ. Effects of socializationin the household on youth susceptibility to smoking: a secondary anal-ysis of the 2004/05 Canadian Youth Smoking Survey. Chronic Dis Can.2010;30:71–77.
467. Myung SK, McDonnell DD, Kazinets G, Seo HG, Moskowitz JM.Relationships between household smoking restrictions and intentionto quit smoking among Korean American male smokers in California.J Korean Med Sci. 2010;25:245–250.
468. Ayers JW, Hofstetter CR, Hughes SC, Park H, Paik HY, Irvin VL, LeeJ, Juon HS, Latkin C, Hovell MF. Smoking on both sides of the Pacific:home smoking restrictions and secondhand smoke exposure amongKorean adults and children in Seoul and California. Nicotine Tob Res.2010;12:1142–1150.
469. Fu SS, Burgess DJ, van Ryn M, Rhodes K, Widome R, Ricards JJ,Noorbaloochi S, Clothier B, Su J, Joseph AM. Smoking-cessationstrategies for American Indians: should smoking-cessation treatmentinclude a prescription for a complete home smoking ban? Am J PrevMed. 2010;39:S56–S65.
470. Wilson KM, Klein JD, Blumkin AK, Gottlieb M, Winickoff JP.Tobacco-smoke exposure in children who live in multiunit housing.Pediatrics. 2011;127:85–92.
471. Jackson SL, Bonnie RJ. A systematic examination of smoke-freepolicies in multiunit dwellings in Virginia as reported by propertymanagers: implications for prevention. Am J Health Promot. 2011;26:37–44.
472. Ong MK, Diamant AL, Zhou Q, Park HY, Kaplan RM. Estimates ofsmoking-related property costs in California multiunit housing. Am JPublic Health. 2012;102:490–493.
473. Pizacani BA, Laughter D, Menagh K, Stark MJ, Drach L, Hermann-Franzen C. Moving multiunit housing providers toward adoption ofsmoke-free policies. Prev Chronic Dis. 2011;8:A21.
474. Lovato C, Linn G, Stead LF, Best A. Impact of tobacco advertising andpromotion on increasing adolescent smoking behaviours. CochraneDatabase Syst Rev. 2003;(4):CD003439.
475. DiFranza JR, Wellman RJ, Sargent JD, Weitzman M, Hipple BJ, Win-ickoff JP. Tobacco promotion and the initiation of tobacco use: assessingthe evidence for causality. Pediatrics. 2006;117:e1237–e1248.
476. Wellman RJ, Sugarman DB, DiFranza JR, Winickoff JP. The extent towhich tobacco marketing and tobacco use in films contribute to chil-
dren’s use of tobacco: a meta-analysis. Arch Pediatr Adolesc Med.2006;160:1285–1296.
477. Pierce JP. Tobacco industry marketing, population-based tobaccocontrol, and smoking behavior. Am J Prev Med. 2007;33:S327–S334.
478. Paynter J, Edwards R. The impact of tobacco promotion at the point ofsale: a systematic review. Nicotine Tob Res. 2009;11:25–35.
479. Quentin W, Neubauer S, Leidl R, Konig HH. Advertising bans as ameans of tobacco control policy: a systematic literature review of time-series analyses. Int J Public Health. 2007;52:295–307.
480. Blecher E. The impact of tobacco advertising bans on consumption indeveloping countries. J Health Econ. 2008;27:930–942.
481. Freeman B, Chapman S, Rimmer M. The case for the plain packaging oftobacco products. Addiction. 2008;103:580–590.
482. Barlow SE. Expert committee recommendations regarding the prevention,assessment, and treatment of child and adolescent overweight and obesity:summary report. Pediatrics. 2007;120(suppl 4):S164–S192.
483. Davis D, Galbraith R. Continuing medical education effect on practiceperformance: effectiveness of continuing medical education: AmericanCollege of Chest Physicians Evidence-Based Educational Guidelines.Chest. 2009;135:42S–48S.
484. Norman GJ, Zabinski MF, Adams MA, Rosenberg DE, Yaroch AL,Atienza AA. A review of eHealth interventions for physical activity anddietary behavior change. Am J Prev Med. 2007;33:336–345.
485. Baird J, Cooper C, Margetts BM, Barker M, Inskip HM. Changinghealth behaviour of young women from disadvantaged backgrounds:evidence from systematic reviews. Proc Nutr Soc. 2009;68:195–204.
486. Bodenheimer T. Helping patients improve their health-related behaviors:what system changes do we need? Dis Manag. 2005;8:319–330.
487. Simpson LA, Cooper J. Paying for obesity: a changing landscape.Pediatrics. 2009;123(suppl 5):S301–S307.
488. Quist-Paulsen P. Cessation in the use of tobacco: pharmacologic andnon-pharmacologic routines in patients. Clin Respir J. 2008;2:4–10.
489. Balkstra CR, Fields M, Roesler L. Meeting Joint Commission onAccreditation of Healthcare Organization’s requirements for tobaccocessation: the St. Joseph’s/Candler Health System approach to success.Crit Care Nurs Clin North Am. 2006;18:105–111, xiii.
490. Joint Commission report shows quality gains. Healthcare BenchmarksQual Improve. 2007;14:52–54.
491. Reeves GR, Wang TY, Reid KJ, Alexander KP, Decker C, Ahmad H,Spertus JA, Peterson ED. Dissociation between hospital performance ofthe smoking cessation counseling quality metric and cessation outcomesafter myocardial infarction. Arch Intern Med. 2008;168:2111–2117.
492. The Joint Commission. Tobacco treatment. 2012. http://www.jointcommission.org/tobacco_treatment/. Accessed July 29, 2012.
493. Panel on Enhancing the Data Infrastructure in Support of Food andNutrition Programs, Research, and Decision Making, National ResearchCouncil. Improving Data to Analyze Food and Nutrition Policies. Wash-ington, DC: The National Academies Press; 2005.
494. McInnes MM, Shinogle JA. Physical Activity: Economic and PolicyFactors. Washington, DC: National Bureau of Economic Research;2009. NBER working paper 15039.
495. Ng SW, Zaghloul S, Ali HI, Harrison G, Popkin BM. The prevalenceand trends of overweight, obesity and nutrition-related non-communicable diseases in the Arabian Gulf States. Obes Rev. 2011;12:1–13.
496. Schroeter C, Lusk J, Tyner W. Determining the impact of food price andincome changes on body weight. J Health Econ. 2008;27:45–68.
497. Micha R, Kalantarian S, Wirojratana P, Byers T, Danaei G, Elmadfa I,Ding E, Giovannucci E, Powles J, Smith-Warner S, Ezzati M, Mozaf-farian D; on behalf of the Global Burden of Diseases, Nutrition andChronic Disease Expert Group. Estimating the global and regionalburden of suboptimal nutrition on chronic disease: methods and inputs tothe analysis. Eur J Clin Nutr. 2012;66:119–129.
Mozaffarian et al Population Approaches to Diet, Activity, and Smoking 1563
by guest on February 6, 2016http://circ.ahajournals.org/Downloaded from

Council on Peripheral Vascular Disease, and the Advocacy Coordinating CommitteeCardiovascular Disease in the Young, Council on the Kidney in Cardiovascular Disease,
on Nutrition, Physical Activity and Metabolism, Council on Clinical Cardiology, Council on on behalf of the American Heart Association Council on Epidemiology and Prevention, Council
Krummel, Barry M. Popkin, Laurie P. Whitsel and Neil A. ZakaiHarold A. Franch, David R. Jacobs, Jr, William E. Kraus, Penny M. Kris-Etherton, Debra A. Dariush Mozaffarian, Ashkan Afshin, Neal L. Benowitz, Vera Bittner, Stephen R. Daniels,
Scientific Statement From the American Heart AssociationPopulation Approaches to Improve Diet, Physical Activity, and Smoking Habits: A
Print ISSN: 0009-7322. Online ISSN: 1524-4539 Copyright © 2012 American Heart Association, Inc. All rights reserved.
is published by the American Heart Association, 7272 Greenville Avenue, Dallas, TX 75231Circulation doi: 10.1161/CIR.0b013e318260a20b
2012;126:1514-1563; originally published online August 20, 2012;Circulation.
http://circ.ahajournals.org/content/126/12/1514World Wide Web at:
The online version of this article, along with updated information and services, is located on the
http://circ.ahajournals.org/content/suppl/2012/08/16/CIR.0b013e318260a20b.DC1.htmlData Supplement (unedited) at:
http://circ.ahajournals.org//subscriptions/
is online at: Circulation Information about subscribing to Subscriptions:
http://www.lww.com/reprints Information about reprints can be found online at: Reprints:
document. Permissions and Rights Question and Answer this process is available in the
click Request Permissions in the middle column of the Web page under Services. Further information aboutOffice. Once the online version of the published article for which permission is being requested is located,
can be obtained via RightsLink, a service of the Copyright Clearance Center, not the EditorialCirculationin Requests for permissions to reproduce figures, tables, or portions of articles originally publishedPermissions:
by guest on February 6, 2016http://circ.ahajournals.org/Downloaded from

1
Supplementary Table 1. Media and Education Campaigns to Promote Healthier Diets Author, y
Population Duration Intervention/Evaluation Findings
Economic Research Service, 199941
US population 10 y+ In 1991, the California campaign 5-A-Day—For Better Health! was adopted as a national campaign initiative by the National Cancer Institute to increase consumption of fruits and vegetables. Also in 1991, the produce industry established the PBH Foundation, a nonprofit consumer organization, to partner with the National Cancer Institute and US Department of Health and Human Services. Cooperative agreements were established between PBH and members of the supermarket industry, and a package of supermarket activities was designed for both in-store and promotional use. By using the licensed 5-A-Day logo, supermarkets joined PBH as active partners in promoting increased fruit and vegetable consumption.
• Since the launch of the 5-A-Day campaign, intake of fruits and vegetables increased from ≈2.8 servings per day in 1988 to 4.3 servings in 1999.
• The independent effects of supermarket-based activities are still being quantified.
Connell et al, 200151
N=374 shoppers in 3 intervention stores; 378 control shoppers in 3 other stores matched by demographic characteristics
4 wk of in-store audio messages, plus take-home audiocassettes
The 5-A-Day For Better Health audio intervention included 2 components: in-store audio PSAs, and take-home audiotapes. Both contained 5-A-Day messages promoting the value of eating fruits and vegetables. During the 4-wk intervention, 1 of 4 PSAs was broadcast through the in-store audio system approximately every 30 min. The PSAs were rotated throughout the shopping day. Two were 30 s long and 2 others were 60 s long. Shoppers in the intervention stores who agreed to participate in the study were given a set of 2 audiocassettes, each with a 1-h program. The first focused on skill-building information about fruit and vegetable preparation. It featured chefs who described shortcuts for easy ways to prepare vegetable-based meals. The second provided a nutrition knowledge test using celebrity hosts.
• At posttest, the original questionnaires were readministered in telephone interviews with 87.7% of the original intervention group and 93.7% of the original control group.
• Knowledge scores in the intervention group increased significantly over baseline (from 59.3 to 74.5; P<0.001) and as compared with the control group (61.9 to 66.4; P<0.001).
• Self-reported intake of fruits and vegetables increased significantly (P<0.01) in both intervention and control groups (5.39 servings per day to 6.19 servings per day; 5.38 servings per day to 5.63 servings per day, respectively); however, the magnitude of the difference was significantly greater in the intervention group (P<0.05).
PBH Gen X Mom 2010 Survey, by OnResearch42
N=1000 Gen X moms; N=300 Gen Y moms
Online survey After extensive consumer research, PBH, the CDC, and other national partners launched a new call to action, Fruits & Veggies—More Matters, in March 2007. The Fruits & Veggies—More Matters
• Among Gen X moms, total “definite” awareness of the Fruits & Veggies—More Matters campaign grew from 12% in 2007 before the campaign launch to 18% in 2010.

2
campaign replaced the 5-A-Day program as the rallying cry to deliver the benefits of fruits and vegetables to consumers in a way designed to change and sustain their behavior over the long term. Fruits & Veggies—More Matters was developed with moms, the “gatekeepers” to their family’s meals, as the primary target audience. Gen X moms were chosen as a subset for PBH’s targeted efforts. In January 2010, PBH developed and fielded a customized online survey, commissioned through OnResearch, which included 1000 Gen X moms (those born between 1965 and 1979) with children age ≤18 y living at home. The survey included several questions that have been tracked annually since the initial baseline survey was conducted in early February 2007. In 2010, a sample of 300 Gen Y moms (those born between 1980 and 1990) with children ≤18 y living at home was added for comparative purposes, because many of the Fruits & Veggies—More Matters campaign messages are targeted at mothers with younger children. An understanding of Gen Y moms and how they compared with Gen X moms was sought because Gen X moms and their children are aging.
• In 2010, 45% of moms said they were more likely to purchase a product with the Fruits & Veggies—More Matters logo on it, up 5% since 2009.
• In 2010, of the Gen X moms who were aware of the Fruits & Veggies—More Matters logo, 38% said it motivates them to help their family eat more fruits and vegetables, up from 23% in 2007. This motivational level was consistent among both Gen X and Gen Y moms.
• Of those moms who were aware of the Fruits & Veggies—More Matters logo, 74% said that if they saw the Fruits & Veggies—More Matters logo on a product, it would mean that the product was healthy; 66% said it meant that the food was nutritious; and 55% said that it provides a serving of fruit and/or a vegetable.
• The Internet remains the most effective medium of communication with Gen X and Gen Y moms. Driving traffic to the Fruits & Veggies—More Matters website as well as providing additional content on the website should help increase awareness and positive brand associations.
Wardle et al, 200152
N=1894 residents of Great Britain. The study targeted groups with a higher prevalence of overweight.
7-wk intervention, with data collected 3 mo after intervention
A survey evaluated the success of the “Fighting Fat, Fighting Fit” campaign in achieving public awareness of the need for preventing obesity. Questions included weight, height, recognition of campaign name, content recall, and participation in the campaign registration scheme. The Fighting Fat, Fighting Fit campaign was the largest health education campaign ever undertaken by the BBC (British Broadcasting Corporation), spanning 7 wk of numerous types of peak and daytime programming across local TV/radio stations, websites, books, and videos. As part of the campaign, people were invited to receive a registration packet for a small fee. The packet included a self-help guide for lifestyle change and 3 registration cards to return over a 5-mo period to chart progress in weight loss, activity levels, and eating habits.
• Of the respondents, >50% had heard of the campaign and 30% were able to recall the healthy lifestyle messages. However, only 1% registered to participate.
• Those who registered were white and had higher education levels and SES.
• Awareness was high in all socio-economic groups, but memory for the healthy lifestyle messages was significantly poorer in those with lower levels of education and those from ethnic minority groups.
• Awareness was no higher in overweight vs normal-weight respondents.
Miles et al, N=2112 from a 5 mo after To increase active participation in the “Fighting Fat, • Average weight loss was 2.3 kg (P<0.001); 78% of

3
200156 random sample of 6000 registrants in Britain. Most were overweight or obese women.
baseline evaluation
Fighting Fit” campaign, the campaign message was supplemented with a booklet offering practical advice about how to make healthy lifestyle changes in eating and physical activity. Each booklet provided registration cards allowing people to register with the campaign. Registration included 6 mo of membership and 3 registration cards to return over a 5-mo period to chart progress in weight, activity levels and eating habits. Registration incentives were available, including free exercise sessions and prizes for those who had made the greatest improvements. The campaign aimed to stimulate behavior change; therefore, both the program and the booklet provided specific guidance for self-management.
those who lost weight completed at least 1 evaluation.
• The percentage of people classified as obese was reduced by 11% (P<0.001)
• Satisfaction with weight improved, and the percentage of people saying they were very or quite satisfied with their weight increased from 3% to 17%.
• There were significant reductions in fat and snack intake as well as increases in fruit and vegetable intake (an increase of 1.3 portions per day [P<0.001]); the number of people eating 5 portions per day increased by 23%.
• There were significant increases in brisk walking, moderate activity, and vigorous activity. Overall, 74% of participants increased their activity levels following the campaign.
• There also were significant increases in overall psychological well-being and perceptions of health.
Beaudoin et al 200753
Low-income, predominantly black urban population in New Orleans, Louisiana
5 mo Ads and signs were targeted to adults with specific emphasis on black women age 18-49 y.
A mass media campaign resulted from a partnership between the Louisiana Public Health Institute and the city of New Orleans, with funding from the CDC. The campaign was aimed at increasing physical activity levels and intake of fruits and vegetables while lowering consumption of high-calorie snack foods. This study evaluated phase 1 of the intervention (February 2005−August 2005), which focused on the goals listed above. During this phase the campaign produced 2 TV ads, 4 radio ads, 26 tailgate bus signs, 20 large side-panel bus signs, 2 tailgate streetcar signs, and 2 large side-panel streetcar signs. Data collection instruments came from the 2004 and 2005 versions of the BRFSS survey, with locally added questions addressing the media campaign and its intended effects.
• From baseline, there were significant increases in message recall measures, positive attitudes toward fruit and vegetable consumption, and positive attitudes toward walking. However, actual behaviors did not change significantly
Sanigorski et al, 200845
Intervention: N=1001 (baseline) and 839 (follow-up) children age 4-12 y attending school in Colac, Australia
3 y
Be Active Eat Well was a multifaceted community capacity-building campaign promoting healthy eating and physical activity. The program was designed to build the community’s capacity to create its own solutions to promote healthy eating, physical activity, and healthy weight in children age 4-12 y. The intervention program was designed, planned, and implemented by the key organizations in Colac,
• Children in the intervention group gained less weight (−0.92 kg), showed significantly lower increases in waist circumference (−3.14), BMI z score (−0.11), and waist-height ratio (−0.02) compared with children in the control group.
• The prevalence of overweight/obesity increased in both groups, and the incidence was not significantly
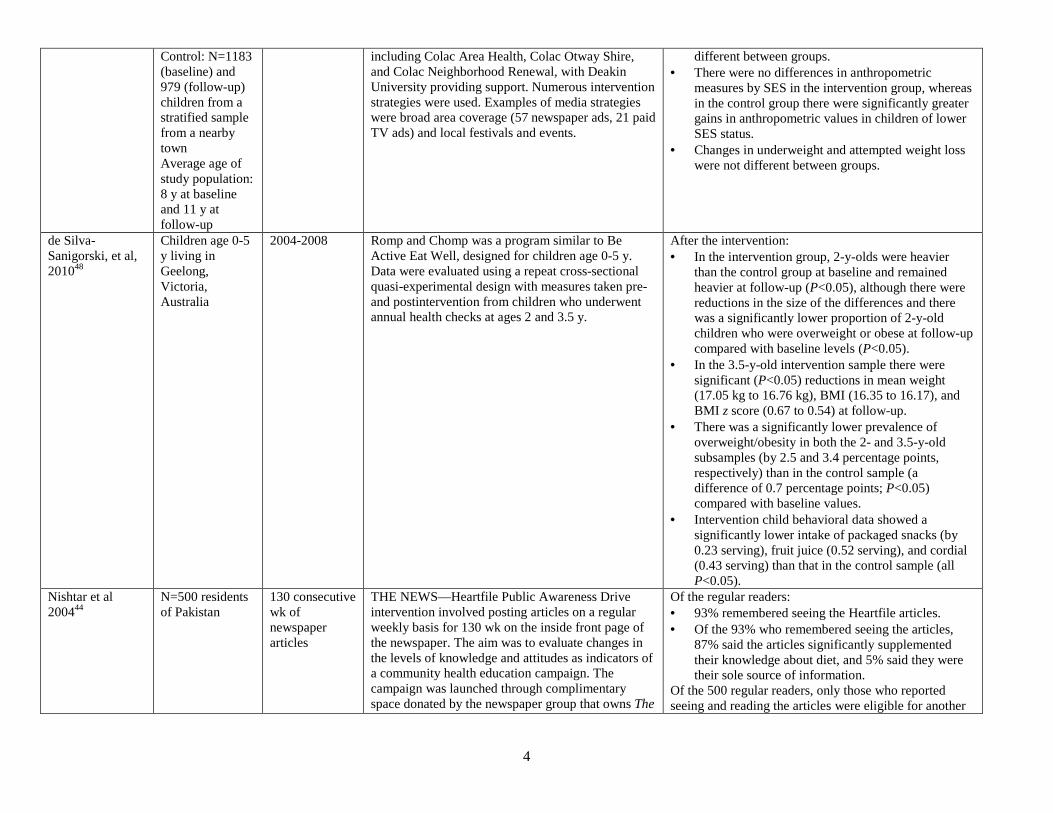
4
Control: N=1183 (baseline) and 979 (follow-up) children from a stratified sample from a nearby town Average age of study population: 8 y at baseline and 11 y at follow-up
including Colac Area Health, Colac Otway Shire, and Colac Neighborhood Renewal, with Deakin University providing support. Numerous intervention strategies were used. Examples of media strategies were broad area coverage (57 newspaper ads, 21 paid TV ads) and local festivals and events.
different between groups. • There were no differences in anthropometric
measures by SES in the intervention group, whereas in the control group there were significantly greater gains in anthropometric values in children of lower SES status.
• Changes in underweight and attempted weight loss were not different between groups.
de Silva-Sanigorski, et al, 201048
Children age 0-5 y living in Geelong, Victoria, Australia
2004-2008 Romp and Chomp was a program similar to Be Active Eat Well, designed for children age 0-5 y. Data were evaluated using a repeat cross-sectional quasi-experimental design with measures taken pre- and postintervention from children who underwent annual health checks at ages 2 and 3.5 y.
After the intervention: • In the intervention group, 2-y-olds were heavier
than the control group at baseline and remained heavier at follow-up (P<0.05), although there were reductions in the size of the differences and there was a significantly lower proportion of 2-y-old children who were overweight or obese at follow-up compared with baseline levels (P<0.05).
• In the 3.5-y-old intervention sample there were significant (P<0.05) reductions in mean weight (17.05 kg to 16.76 kg), BMI (16.35 to 16.17), and BMI z score (0.67 to 0.54) at follow-up.
• There was a significantly lower prevalence of overweight/obesity in both the 2- and 3.5-y-old subsamples (by 2.5 and 3.4 percentage points, respectively) than in the control sample (a difference of 0.7 percentage points; P<0.05) compared with baseline values.
• Intervention child behavioral data showed a significantly lower intake of packaged snacks (by 0.23 serving), fruit juice (0.52 serving), and cordial (0.43 serving) than that in the control sample (all P<0.05).
Nishtar et al 200444
N=500 residents of Pakistan
130 consecutive wk of newspaper articles
THE NEWS—Heartfile Public Awareness Drive intervention involved posting articles on a regular weekly basis for 130 wk on the inside front page of the newspaper. The aim was to evaluate changes in the levels of knowledge and attitudes as indicators of a community health education campaign. The campaign was launched through complimentary space donated by the newspaper group that owns The
Of the regular readers: • 93% remembered seeing the Heartfile articles. • Of the 93% who remembered seeing the articles,
87% said the articles significantly supplemented their knowledge about diet, and 5% said they were their sole source of information.
Of the 500 regular readers, only those who reported seeing and reading the articles were eligible for another

5
News, which is the largest circulating daily English newspaper in the country. The postintervention evaluation involved a cross-sectional telephone survey in a major city. A total of 2621 persons were called, but only those who were considered regular readers (N=500) were eligible for the interview.
interview (N=375). Of these: • 40% reported making some dietary changes. • 39% changed their exercise habits. • 8% reduced the amount they smoked.
Lutz et al, 199957 5-A-Day For Better Health newsletter intervention
Intervention: newsletters
This intervention included 4 groups: 1 control group and 3 newsletters (computer-tailored, nontailored, and tailored with goal-setting information). All 3 newsletters contained strategies for improving fruit and vegetable consumption. The tailored newsletters used computer algorithms to match individuals’ baseline survey information with the most relevant newsletter messages promoting dietary change. Baseline surveys were completed by 710 health maintenance organization clients. Postintervention surveys were completed by 573 participants (80.8%) 6 mo after baseline.
• All newsletter groups had significantly higher daily intake (from 3.4 to 4.1 servings vs no increase in control; P<0.002) and variety scores (from 6.5 to 8 vs no change in control; P<0.0001) compared with the control group, as measured using FFQs.
• Although a trend toward improved intake and variety was noted with each added newsletter element, there were no significant differences among newsletter groups.
Kelder et al, 199546
N=2376 6th graders from 13 junior high schools
5 y The Lunch Bag Program for 6th graders and the Slice of Life for 10th graders consisted of the following:
• Brief 1-session intervention
• Students were provided with lunch bags containing a recipe book, heart-healthy snacks, food lists, a comic book, and several games about healthy foods for students and parents.
• Students also wrote their own newspaper, designed to influence intentions to eat healthy foods.
• Data were collected at baseline (grade 6) through grade 12 (7 time points total)
• An upward trend in healthier food choices was seen for both males and females in the intervention group.
• Females: At all but the final time point (12th grade), a significantly (P<0.01) greater number of healthier food choices were made by the intervention group compared with the reference group; the total increase from baseline was 6.0 to 9.5 vs 6.0 to 8.5 choices, respectively.
• Knowledge of healthy food choices was significantly greater (at P<0.01) in the intervention group vs reference group for all but the 4th time point (9th grade; P<0.05); the total increase was 12.5 to 16 vs 12.5 to 15, respectively.
• Restraint in salting food was also significantly greater (P≤0.05) in the intervention group compared with the reference group at all time points. Total restraint increased from 5.6 to 6.7 vs 5.6 to 6.0, respectively.
• Males: A significantly higher (P<0.05) number of healthy food choices were selected at time points 2-4 (grades 6-10) but not at the final 2 time points (grades 11-12). The total increase from baseline was the same for both the intervention and reference groups.

6
• Knowledge of healthy food choices was significantly greater (P≤0.01) in the intervention group compared with the reference group at all but the 3rd time point (grade 8). The total increase in knowledge score was 12.0 to 15.5 in the intervention group vs 12.0 to 14.5 in the reference group.
• Restraint in salting food was significantly different (P<0.05) between the 2 groups at all but the final end point (grade 12) compared with the reference group. The total increase in restraint score was 5.4 to 6.2 vs 5.4 to 5.7 in the intervention and reference groups, respectively.
Reger et al, 199855
Clarksburg and Bridgeport, West Virginia
7-wk campaign
The concept of The 1% or Less campaign was developed in 1994 by the CSPI. The first demonstration project was conducted from February to April 1995 in West Virginia. The campaign lasted 7 wk and consisted of paid TV/newspaper/radio ads, public relations efforts, taste tests, and educational programs at supermarkets, schools, and worksites. Ads (1 newspaper ad, 2 30-s TV ads, and 2 60-s radio ads) were developed to encourage consumers to switch from whole/2% milk to 1%/skim milk. TV ads ran 366 times during the first 2 wk and last 2 wk of the campaign. Radio ads aired 244 times over a 2-wk period in the middle of the campaign. Fourteen quarter-page newspaper ads were run during the campaign. Data were collected at baseline, immediately following the campaign, and 6 mo later.
• 80% of the 1910 taste test participants reported liking the taste of the skim milk sample, and 94% said they liked the taste of 1%, skim, or both.
• Milk sales increased by 16% and remained high at follow-up.
• The share of low-fat milk sales increased from 18% of overall milk sales to 41% of overall milk sales immediately following the campaign and was sustained at the 6-mo follow-up.
• In the postintervention survey, 38% of respondents who reported drinking whole milk reported they had switched to low-fat milk.
Dunt et al, 199954 N=591 residents of Greater Shepparton, central Victoria, Australia
3 mo in 1991; pre- and postintervention surveys
Towards a Healthy Diet ran as an early 3-mo component of a 2-y project conducted by the Victoria division of the Heart Foundation. Two 5-wk media campaigns were implemented. Promotional tools included TV, radio, brochures, T-shirts, and other media events. In addition, public policy initiatives were integrated into the media campaigns throughout.
• The intervention did not alter either individual dietary behavior or intention to change dietary behavior, as assessed by questionnaires and in supermarket sales figures for milk and table spreads.
• The intervention did affect perceptions about the level of interest in healthy diet in the community (more eating places offering healthy food and more local residents eating healthy foods).
Dixon et al, 199843
N=500 residents age ≥20 y in Victoria, Australia
Campaign TV ads ran from 1992 to 1995: Phase 1: Sept 1-19, 1992 Phase 2: Oct 3-
The Victoria “2 Fruit ‘n’ 5 Veg Every Day” campaign was a broadly based, multilevel statewide nutrition promotion initiative aimed at increasing awareness of the need to eat more fruits and vegetables and encouraging increased consumption of these foods. The lead health agency for the
• Reported fruit and vegetable consumption increased significantly between phases 1 and 2 (during the most intensive TV advertising) from 1.5 to 1.7 servings per day of fruits (P<0.05) and from 2.6 to 3.1 servings per day of vegetables (P<0.001).
• No additional increases were seen across the

7
23, 1993 Phase 3: Oct 9-16, 1994 Phase 4: little media coverage
campaign was the Victoria Food and Nutrition Program. The campaign was designed in part after the 5-A-Day For Better Health program. A central feature of the campaign was a short, intensive burst of TV ads conducted over a 3-wk period in the first 2 phases of the campaign and 1 wk in the third phase. The mass media program was primarily TV based, but some print and radio ads were also included. In addition to advertising, community-based health and education professionals, food retailers, and food service providers were also targeted as routes of influence. Data were collected via 4 annual postcampaign telephone surveys conducted ≈2-3 wk postintervention.
remaining phases. However, the initial increase was maintained.
• Similarly, during the most media-intensive phases (1 and 2), significant increases were found in the level of public awareness, reported consumption, and beliefs about appropriate levels of consumption.
Croft et al, 199447 N=9839 adults age ≥18 y living in 2 South Carolina communities (intervention and control)
Intervention phase: February 1988–September 1990
The South Carolina Cardiovascular Disease Prevention Project was designed to reduce CVD morbidity and mortality by decreasing the prevalence and severity of high blood pressure, elevated cholesterol, and smoking. The intervention focused on media and education and involved multiple segments of the community to promote cardiovascular health and help residents make lifestyle changes. Numerous programs were offered, including community classes, grocery store tours, speakers’ bureaus, professional education classes, home study courses, and worksite nutrition programs. Media programs included radio and TV PSAs, talk shows, newspaper articles and supermarket ads. A task force of local restaurant managers, registered dietitians, and news media was established to implement the restaurant labeling program entitled “Eat Smart for a Healthy Heart.” Data were collected during 3 telephone surveys taken in 1987, 1989, and 1991.
• Favorable changes in most eating behaviors and levels of awareness were observed in both the intervention and control communities.
• From 1987 to 1991, the intervention community experienced greater absolute changes than the control community in use of animal fats (−8.9 vs −4.0%; P<0.05) and unsaturated fats (+8.4% vs +3.6%; P<0.05) and in awareness of restaurant nutrition information (+33.0% vs +19.4%; P=0.0001).
• These favorable changes were noted among both black and white respondents.
Tian et al, 199558 7 intervention neighborhoods and 10 control neighborhoods in Tianjin, China
1989-1992 The Tianjin Project was a community-based education program to reduce salt consumption. The main activities included training of healthcare personnel about salt and blood pressure and providing practical advice to patients, community education via distribution of door-to-door leaflets, and distribution of posters and stickers to food retailers. Lower-sodium salt was also introduced in some limited retail stores. Sodium intake
• From 1989 to 1992, mean sodium intake decreased in men and women by 22 and 11 mmol/d, respectively, compared with increases of 18 and 4 mmol/d, respectively, in the control area (P<0.001 for men, P=0.065 for women).
• These changes did not vary by education level or occupation groups.
• Compared with the control area, systolic blood pressure decreased in men and women in the

8
(consecutive 3-d weighed food records) and blood pressure (directly measured) were assessed in representative cross-sectional surveys, with >90% participation.
intervention area by 5 and 6 mm Hg, respectively (P=0.065 for men, P=0.008 for women).
• Knowledge related to recommended levels of salt intake, importance of controlling salt, and differences between regular and low-sodium mineral salt also improved.
Dowse et al, 199565
Mauritius 1987-1992 In 1987, the Mauritius government launched a national prevention program to improve lifestyle-related risk factors by promoting healthier diets, increased exercise, smoking cessation, and reduced alcohol intake. Primary components of the program included extensive use of mass media and widespread community, school, and workplace education activities. Fiscal and legislative measures were also introduced to improve cooking oils (see Supplementary Table 12). Cross-sectional cluster surveys of all adults age 25-74 y living in geographically defined clusters were performed in 1987 and 1992.
• From 1987 to 1992, moderate leisure-time physical activity increased from 16.9% to 22.1% in men and from 1.3% to 2.7% in women. Cigarette smoking decreased from 58.2% to 47.2% in men and from 6.9% to 3.7% in women.
• Heavy alcohol use also declined substantially (from 38.2% to 14.4% and 2.6% to 0.6%, respectively).
• Changes in cooking oils and their estimated effects are presented in Supplementary Table 12.
• During this same period, declines were seen in prevalence of hypertension (from 15.0% to 12.1% in men and 12.4% to 10.9% in women), and mean population serum total cholesterol fell by 15%, from 5.5 to 4.7 mmol/L (P<0.001).
• Conversely, prevalence of overweight/obesity rose, and rates of glucose intolerance did not change.
Pekka et al, 200259 Puska and Stahl, 201060
North Karelia, Finland
1972-1977; extended nationally thereafter
The North Karelia Project was a media- and education-based community intervention to improve population blood cholesterol levels and other cardiovascular risk factors by reducing consumption of butter, whole-fat dairy products, nonlean meats, and salt, and increasing consumption of vegetable oil−based margarine and vegetable oils, low-fat dairy products, lean meats, vegetables, berries, and fruit. Diet education was provided via posters, leaflets, and messages; local newspaper and radio coverage; primary care doctors and nurses; schools; collaborative efforts with community groups such as a powerful housewives’ organization; and a network of lay community leaders. Local food manufacturers were encouraged to produce healthier food options, for example, cooperating with the food and catering industry to lower the sodium content of foods.
The project was subsequently extended to the national level, with additional substantial focus on other policy approaches (see “Multicomponent
• Targeted dietary habits improved substantially, with associated declines in population blood cholesterol and blood pressure levels and, over time, rates of CHD.

9
Interventions”). Lefebvre et al 198763
Pawtucket, Rhode Island
1984-1988 The Pawtucket Heart Health Program was a community-based, multicomponent educational intervention to lower cardiovascular risk factors, based on a blend of social learning theory, community organization models, community psychology tenets, and diffusion research. Point-of-purchase nutrition education in supermarkets was 1 intervention strategy. By using consumer intercept interviews, awareness of shelf labels and their effect on purchase behavior has been continuously evaluated.
• Between 1984 and 1988, the percentage of shoppers who could identify labels correctly increased from 11% to 24% (P<0.05). The percentage who reported they were encouraged to purchase the identified foods increased from 36% to 54% (P<0.05).
Farquhar et al, 199049
2 treatment cities (N=122,800) and 2 control cities (N=197,500) in California
30-64 mo of education
The Stanford Five-City Project tested whether community-wide health education can reduce risk of stroke and CHD. Treatment cities received a 5-y, low-cost, comprehensive program using social learning theory, a communication-behavior change model, community organization principles, and social marketing methods that resulted in about 26 h of exposure to multichannel and multifactor education. Risk factors were assessed in representative cohort and cross-sectional surveys at baseline and in 3 later surveys.
• When compared with control communities, significant net reductions in community averages favoring treatment occurred in plasma cholesterol (2%), blood pressure (4%), resting pulse rate (3%), and smoking prevalence (13%).
• These risk factor changes resulted in decreases in composite total mortality risk scores (15%) and CHD risk scores (16%).
• Subjects in the treatment communities also gained significantly less weight (0.57 kg) compared with control communities (1.25 kg) over 6 y.
Luepker et al, 199661
3 upper Midwestern communities with 3 matched comparison communities
1980-1990 The Minnesota Heart Health Program was a 5- to 6-y intervention program that used community-wide and individual health education in an attempt to decrease population risk.
• In the education communities, CHD incidence declined by 1.8% per year in men (P=0.03) and 3.6% per year in women (P=0.007), but these declines were not significantly different from secular trends in matched control communities.
• Stroke incidence did not decline in either education or control communities.
Winkleby et al, 199762
Communities in California, Minnesota, and Rhode Island
1980s The Stanford Five-City Project, Minnesota Heart Health Program, and Pawtucket Heart Health Program were community-based heart disease prevention interventions conducted in the 1980s. Among 12 total cities, 6 cities received 5−8-y interventions for risk reduction, with a major focus on media and education. When data from the 3 studies were pooled, time trends were estimated for cigarette smoking, blood pressure, total cholesterol level, BMI, and CHD mortality risk in men and women age 25-64 y.
• The joint estimates of intervention effect were in the expected direction in 9 of 12 gender-specific comparisons. However, none of these were statistically significant.

10
Multicomponent Interventions (Including Major Components Beyond Media and Education, Such as Environmental Change) Author, y
Population Duration Intervention/Evaluation Major Findings
Pekka et al, 200259 Puska and Stahl, 201060
Finland 1970s to present
The Finnish North Karelia Project was a media- and education-focused community intervention to improve population dietary habits. The project was subsequently extended to the national level, with additional substantial focus on voluntary agreements with industry to increase production and sales of more healthful foods, modifications of taxation and subsidy policies for several foods, government-supported programs to increase local production and consumption of berries and vegetables, and restrictions on milk fat (see “Taxation and Subsidies” and “Direct Restrictions and Mandates”).
• From the late 1970s to 1998, the proportion of Finns who reported using mostly butter on bread declined from 60% to 5%. Vegetable-oil soft margarines and butter–vegetable oil mixtures were the main replacement for butter.
• From 1978 to 1998, the proportions of men and women using whole milk declined from 44% to 9% and 35% to 4%, respectively.
• From 1972 to 1997, the proportion of Finns who mainly used vegetable oil for cooking increased from 1% to 2% to 34%; increases were even higher in urban areas.
• Overall, between 1972 and 1997, the percentage of energy derived from saturated fats declined from 21% to 14% and from polyunsaturated fat increased from 3.5% to 5.0%, substantially increasing the ratio of polyunsaturated to saturated fats.
• These and other dietary changes were associated with substantial declines in population cholesterol levels, including 18% declines in North Karelia and similar declines in other monitored areas.
• On the basis of urine sodium excretion, mean daily salt intakes declined from about 14-15 g in men (unknown in women) to about 11 g in men and 7 g in women.
• Diastolic blood pressure decreased by 5% in men and 13% in women.
• Age-standardized CHD mortality among adults age 35-64 y decreased by 73% in North Karelia and by 65% in the whole country between 1971 and 1995.
• About 75% of this decline could be explained by improvements in population risk factors (especially declines in blood cholesterol) rather than changes in medical treatments.
Bhalla et al, 200664
N=4084 Singapore residents
1998-2004 A survey evaluated the National Healthy Lifestyle Program, a population-wide, noncommunicable disease, multicomponent intervention program created in 1992. It aimed to provide information, skill training, and the social and physical
• Hypertension in Singapore residents age 30-69 y decreased from 28% in 1998 to 24% in 2004.
• Prevalence of high cholesterol (≥6.2 mmol/L) decreased from 26% to 18%.

11
environments necessary to encourage healthy living by Singapore residents. This multiple-strategy program includes innovative media and communication activities, systematic involvement of government agencies, community organizations, workplaces and schools, and collaboration with the food industry to provide healthier food choices. The program is evaluated every 6 y using population-based cross-sectional surveys. This paper reported findings from 1998 to 2004.
• Prevalence of diabetes decreased from 9.5% to 7.8%.
• Prevalence of obesity was not significantly changed. • Smoking rates decreased from 15% to 12.5%. • Regular exercise increased from 17% to 25%.
Economos et al, 200766
N=1178 children in grades 1-3 attending public schools in 3 culturally diverse communities in Somerville, Massachusetts (1 intervention, 2 controls)
Intervention lasted 3 y (September 2002−August 2005); data collected covered 1 school year Pretest: September 2003 Posttest: May 2004
Shape Up Somerville: Eat Smart, Play Hard was one of the first collaborative community-based participatory research initiatives designed to change the environment to prevent obesity in early elementary school−age children. Many groups and individuals within the community, including children, parents, teachers, school food service providers, city departments, policy makers, healthcare providers, before- and after-school programs, restaurants, and the media were involved in the multicomponent intervention.
• The average change in BMI z score in the intervention community was −0.130 compared with control 1 (P<0.02) and −0.105 compared with control 2 (P<0.02). When the 2 control communities were pooled, the average change in BMI z score was −0.1005 in the intervention community compared with the control communities (P<0.001).
• Parental education was not a significant predictor of BMI z score change, nor were other factors such as the child’s sex, grade, age, race, primary language spoken at home, school, or local community.
PBH indicates Produce for Better Health Foundation; PSA, public service announcement; Gen X, Generation X; Gen Y, Generation Y; CDC, Centers for Disease Control and Prevention; BRFSS, Behavioral Risk Factor Surveillance System; SES, socioeconomic status; FFQ, food frequency questionnaire; CSPI, Center for Science in the Public Interest; CVD, cardiovascular disease; CHD, coronary heart disease; and BMI, body mass index. Note: Reference numbers (eg, Connell et al, 200150) appearing in this supplementary table correspond with those listed in the reference section of the statement. For the purposes of this supplementary table, these meta-analyses or systematic reviews (see "Author, y" column) are considered the primary citation. Additional studies mentioned in the primary citation may be included in the "Intervention/Exposure" and "Findings" columns. The additional studies can be accessed through the primary citation.

Supplementary Table 10a. Local Environmental Change to Improve Physical Activity (Community Settings)
Accessibility of Recreation or Exercise Spaces and Facilities
Children and Adolescents (Outcome: Physical Activity)
Author, y Design and Number of Studies
Population Exposure Outcome Findings
IOM Committee on Childhood Obesity Prevention Actions for Local Governments, 2009147
Systematic review, including 4 reviews, 1 longitudinal and 2 cross-sectional studies on the exposure-outcome relation in this section
Children or adolescents
Access to recreational facilities (general)
Physical activity • On the basis of 2 reviews and a cross-sectional study, the authors concluded that availability and accessibility of parks or playgrounds in the neighborhood is positively associated with children’s level of physical activity and may reduce sedentary time at home.
• On the basis of 1 review and 1 prospective study, the authors concluded that access to recreational facilities is positively associated with physical activity and inversely associated with obesity.
• On the basis of a cross-sectional study, it was concluded that access to well-maintained parks is a more important problem in high-density lower-SES neighborhoods.
Committee on Environmental Health, American Academy of Pediatrics, 2009361
Systematic review, including 5 studies on the exposure-outcome relation in this section
Children Access to recreational facilities (density- inequalities in access)
Physical activity • Density: Of 4 studies, all reported a significant positive association between density of parks and physical activity. Three studies used park area as the environmental variable, and 1 used number of recreational facilities. Epstein et al (2006) conducted a crossover experimental study among 58 children age 8-15 y. The study included 3 phases (baseline, increased sedentary behavior, and decreased sedentary behavior), with each phase lasting for 3 wk. In intervention phases, participants were encouraged to increase or decrease sedentary behaviors by 25%-50% and were provided with up to $475 for adherence to recommendations. In the decreased sedentary behavior phase, the extent of increase in time spent on physical activity was positively associated with accessible park land (hectares) within 0.8 km (P=0.01). Also, in this phase, living in an area with a large community park was positively associated with 38.9 min more MVPA per day. Roemmich et al (2006) studied the association of GIS-derived percentage of park area in the neighborhood with physical activity among 32 boys and 27 girls age 4-7 y. They found a significant positive association between percentage of park area and total physical activity (P<0.05). In a similar study, Roemmich et al (2007) studied the same relation among 44 boys and 44 girls age 8-12 y. After adjustment for age, sex, parental overweight, and time activity monitor worn, percentage of park area was associated with total physical activity (P<0.05). Also, among a nationally representative sample of US adolescents (N=20,745) in grades 7-12, Gordon-Larsen et al (2006) showed that the number of facilities in the neighborhood was positively associated with physical activity and

inversely associated with overweight. After adjustment for population density, the presence of 1, 2, 3, 4, and 5 facilities in the neighborhood was associated with a 3%, 7%, 10%, 14%, and 18% increase in the odds of having 5 bouts of MVPA and with a 5%, 10%, 15%, 20%, and 24% decrease in odds of being overweight, respectively.
• Inequalities in access: Gordon-Larsen et al (2006) also showed that living in a lower-SES area or areas with a higher percentage of minorities is associated with reduced access to physical activity facilities. Also, among 160 adolescents age 12-18 y, Humbert et al (2006) showed that those who lived in lower-SES areas were more likely than their affluent peers to report that a nearby recreation facility is important for their degree of physical activity.
Sallis and Glanz, 200928
Narrative review, including 1 review on the exposure-outcome relation in this section
Children Access to recreation facilities (distance)
Physical activity • On the basis of a review by Davison et al (2006) (see below), the authors concluded that proximity to parks, playgrounds, and recreation areas was consistently associated with children’s total physical activity.
Ferreira et al, 2007344
Systematic review of 150 studies, mostly cross-sectional, published from January 1980 to December 2004, including 45 independent samples in adolescents and 20 in children on the exposure-outcome relation in this section
Children (age 3-12 y) and adolescents (age 13-18 y)
Local environmental characteristics, including access/availability to physical activity equipment, facilities, or programs
Physical activity
• A wide range of physical, sociocultural, and economic variables were evaluated in these studies, but only a few were examined in >3 independent samples.
• Of 20 independent samples in which the relation between access/availability to physical activity equipment, facilities, or programs and physical activity was assessed in children, 3 samples found a positive association and 17 found no significant association.
• Of 45 independent samples in which the relation between access/availability to physical activity equipment, facilities, or programs and physical activity was examined in adolescents, 11 samples found a positive association, 2 found an inverse association, and 32 found no significant association.
• On the basis of these findings, the authors concluded that the availability or accessibility of physical activity facilities was unrelated to physical activity.
Davison and Lawson, 2006343
Review of 33 cross-sectional studies, including 12 studies on the exposure-outcome relation in this section
Children age 3-18 y
Perceived or objectively measured environment, categorized into recreational infrastructure (eg, availability of parks/playgrounds),
Physical activity
General: • Carver et al (2004): Among 347 Australian girls and boys age 12-
13 y, parental reports of the presence of good sporting facilities for their children nearby were associated with higher children’s reports of walking or cycling in the neighborhood (for recreation, transport, exercise, or going to school).
• Density: Of 10 studies, 9 reported a significant positive association:
• Sallis et al (1993): Among preschool children, a significant positive association was seen between parental reports of the number of play areas within walking distance of home and observed levels of physical activity.

transport infrastructure (eg, traffic speed/density, presence of sidewalks), and local conditions (eg, safety, crime)
• Sallis et al (2001): In a study of 137 physical activity areas in 24 public middle schools in San Diego County, California, a significant positive association was seen between the number of permanent area sport facilities (eg, tennis courts, soccer fields, baseball diamonds) and observed physical activity in each play area only in boys, not girls.
• Timperio et al (2004): Among 919 Australian elementary school children, ages 5-6 and 10-12 y, only older girls (not older boys or younger children) who reported no park in the area had lower rates of walking and cycling (OR=0.5; 95% CI, 0.3-0.8, P<0.01).
• Hume et al (2005): In a study of 127 children age 10 y, the children were instructed to draw pictures of their home and neighborhood. Girls who drew more opportunities for physical activity, eg, the presence of facilities such as gyms and swimming centers, had higher objectively measured physical activity.
• Zakarian et al (1994): Self-reported number of facilities for sports and exercise in the area was correlated with adolescent self-reported vigorous activity (boys: r=0.17; P<0.001; girls: r=0.10; P=0.002).
• Brodersen et al (2005): Among 4320 English boys and girls, the objectively measured number of sport pitches in the borough was associated with higher self-reported vigorous activity among girls (β=−0.02; P=0.03) but not boys.
• Norman et al (2006): Among 799 US adolescents, the objectively measured number of private recreational facilities and parks within 1.6 km of home were associated with higher accelerometer-measured MVPA among adolescent girls (unadjusted β=0.110; P=0.016) but not boys.
• Mota et al (2005): Among 1123 Portuguese students age 13-18 y, adolescents’ reports of availability of facilities such as swimming pools, playgrounds, and parks were associated with higher self-reported activity (P=0.03). Fein et al (2004): Among 610 high school students in rural Alberta, Canada, a positive association was seen between perceived availability of convenient neighborhood recreation facilities and physical activity levels.
• Dunton et al (2003): Among 87 US girls age 14-17 y, no association was seen between perceived exercise facilities in the community and self-reported physical activity.
Distance: Of 2 studies, 1 found a significant association: • Gomez et al (2004): Among 177 US adolescents in 7th grade, a
significant positive association was seen between objectively measured distance to the nearest play area and outdoor activity only in boys (β=−0.317; P=0.006), not girls.
• Adkins et al: Among 52 US black girls age 8-10 y, no significant association was seen between parental and children’s reports of

distance to playgrounds and parks and children's objectively measured physical activity.
Children and Adolescents (Outcome: Obesity)
Author, y Design and Number of Studies
Population Exposure Outcome Findings
Carter and Dubois, 2010356
Systematic review of 27 studies published between1999 and 2009 including 4 studies on the exposure-outcome relation in this section
Children and adolescents age 2-18 y
Access to recreation facilities (general, density)
Adiposity, eg, skin-fold thickness, BMI, percentage of lean body mass, etc
Of 4 studies, 1 found a significant inverse association between access to recreational facilities and obesity, and 1 found a significant positive association between the number of locked schools in the neighborhood and BMI. • General: Veugelers et al (2008) studied the association of parental
perception of access to playgrounds/parks and recreational facilities with overweight and obesity among 5471 students in 5th grade from urban and rural areas of Nova Scotia, Canada. After adjustment for child gender, parental education, and household income, children in the highest tertile of access to playgrounds/parks had significantly lower odds of overweight (OR=0.76; 95% CI, 0.62-0.95) and obesity (OR=0.71; 95% CI, 0.53-0.99). However, after stratification by residence (urban or rural), access to playgrounds/parks was significantly associated only with overweight in rural children (OR=0.68; 95% CI, 0.48-0.97). Also, being in the highest tertile of access to recreational facilities was inversely associated with overweight (OR=0.71; 95% CI, 0.56-0.90) and obesity (OR=0.58; 95% CI, 0.40-0.84). After stratification by residence, significant association was only observed between access to recreational facilities and obesity among rural children (OR=0.47; 95% CI, 0.23-0.95).
• Density: Evenson et al (2007) studied the relation between self-reported number of physical activity facilities in the walking distance and overweight among 1554 girls in the 6th grade from 6 states. Participants were asked to report accessibility of 14 types of facilities from their home or school. These facilities included basketball court, beach/lake, golf course, health club, martial arts studio, playing field, park/recreation center/YMCA/YWCA, track, skating rink, swimming pool, walking/biking/hiking path, tennis court, and dance/gymnastic club. After adjustment for school, site, nonschool physical activity, neighborhood SES, no significant association was found with overweight and obesity. In another study using the same population, Scott et al (2007) did not find any significant association between the number of parks, number of unlocked schools, or having at least 1 school within a 0.8-km radius of home and BMI. However, they found a significant association between the number of locked schools in the neighborhood and BMI.
• Distance: Burdette and Whitaker (2004) compared 7020 overweight

(BMI ≥95th percentile) and nonoverweight children age 3-4 y and did not find any significant difference in mean distance to the nearest playground (kilometers) between overweight (0.31±0.21) and nonoverweight (0.31±0.22; P=0.77) children.
Dunton et al, 2009350
Systematic review, 15 studies published before May 2008 (14 cross-sectional and 1 longitudinal), including 6 studies on the exposure-outcome relation in this section
Children and adolescents age 3-18 y
Access to recreational facilities (general, density)
Obesity • In this systematic review, studies were divided into 2 major groups based on the age range of the study populations (3-12 y and 13-18 y).
• General: Among children age 3-12 y, 1 study found an inverse association and 1 found no association between access to physical activity facilities and obesity. Density: Among children age 3-12 y, 1 study found a positive relation between the number of locked schoolyards and obesity. Among children age 13-18 y, 1 study found an inverse relation between the number of physical activity and recreational facilities and obesity; 2 studies did not find any association between the number of private recreational facilities and obesity; and 2 studies did not find any association between the number of parks and obesity.
• Distance: Among children age 3-12 y, 2 studies did not find any association between proximity to playgrounds, parks, and play areas and obesity. Among children age 13-18 y, 1 study did not find any association between distance to nearest private recreational facility and obesity; and 1 study did not find any association between areas of parks and distance to the nearest park and obesity.
Papas et al, 2007349
Review of 20 studies (18 cross- sectional, 2 longitudinal), including 3 studies on the exposure-outcome relation in this section among children
Children Objectively measured access to recreational facilities (density, distance)
Direct measures of body weight (eg, BMI)
Density: • Among 20,745 US adolescents in the National Longitudinal Study
of Adolescent Health, after adjustment for population density, Gordon-Larsen et al (2006) found that the number of physical activity facilities per census block group was inversely associated with overweight. Compared with no activity facilities in the block group, having 1, 2, 3, 4, 5, 6, or 7 facilities in the census block was associated with 0.95 (0.90-0.99), 0.90 (0.82-0.98), 0.85 (0.74-0.97), 0.80 (0.67-0.96), 0.76 (0.60-0.95), 0.72 (0.55-0.95), and 0.68 (0.49-0.94) lower odds of overweight, respectively.
Distance: • Two studies (Liu 2002, Burdette 2004) found no relation between
distance from home to the nearest playground and obesity. • Among 7020 low-income children age 3-4 y participating in WIC
programs in Cincinnati, Ohio, Burdette and Whitaker (2004) found no significant relation between distance from the child’s home to the nearest playground and obesity.
• Among 2554 children age 4-18 y living in Indiana, Liu et al (2002) found no significant difference between mean distance to the nearest public play space among obese (567 m) vs nonobese

children (571 m).
Adults (Outcome: Physical Activity)
Author, y Design Number of Studies
Population Exposure Outcome Findings
Frost et al, 2010337
Systematic review of studies published between 1994 and 2008, including 4 studies on the exposure-outcome relation in this section
Adults (age ≥18 y) in rural areas
Access to recreation facilities (general)
Physical activity • Of 4 studies, 1 reported significant positive association between general access to indoor exercise facilities and regular walking.
• Wilcox et al (2003) studied the relation between perceived access to exercise facilities and physical activity level (active/sedentary) among 1242 rural and 1096 urban US women (age ≥40 y). After adjustment for age, race, education, geographical region, neighborhood variables, and health-related behaviors, no significant association was found between access to facilities and sedentary behaviors in urban (OR=0.96; 95% CI, 0.65-1.42) or rural population (OR=1.09; 95% CI, 0.81-1.41).
• Among 1000 rural midwestern white women age 25-50 y, Eyler (2003) did not find any significant association between knowing of a place to exercise in the neighborhood and meeting the recommendations for physical activity (OR=0.99; 95% CI, 0.99-1.00).
• In a similar study among 567 black women in rural areas of Alabama, Sanderson et al (2003) found no significant association between knowing a place to exercise in the neighborhood and meeting the recommendations for physical activity (OR=0.86; 95% CI, 0.56-1.33).
• Bronson et al reported a borderline significant association between access to indoor exercise facilities and regular walking among 1269 rural adults in southeastern Missouri (OR=1.3; 95% CI, 1.0-1.7).
Sallis and Glanz, 200928
Narrative review, including 1 review about the exposure-outcome relation in this section
Adults Access to recreational facilities (general, distance)
Physical activity • On the basis of a review by Bauman and Bull (2007), the authors concluded that there is a positive relation between proximity to recreational facilities and physical activity.
Bauman and Bull, 2007338
Systematic review of reviews published between 2002 and 2007, including 8 reviews about the exposure-outcome relation in this section
Children and adults
Access to recreational facilities (general, distance)
Physical activity or walking
• All 8 studies on the relation between access to recreational facilities and physical activity found a positive association:
• A narrative review by Badland and Schofield (2005) found a significant positive association between access to facilities within walking distance and parks and physical activity.
• A systematic review by Cunningham and Michael (2004) reported a positive association between proximity to facilities or parks and physical activity.
• A meta-analysis by Duncan et al (2005) showed a significant positive relation between availability of physical activity facilities and physical activity. (Please see below for Duncan et al, 2005.)

• A systematic review by Humpel et al (2002) found a significant positive association between accessibility of facilities, including nearby parks and physical activity.
• A systematic review by Lee and Moudon (2004) identified lack of access to facilities as a barrier to physical activity.
• A systematic review by McCormack et al (2004) found a significant positive association between shorter distance to resources for activity and level of physical activity.
• A systematic review by Trost et al (2004) reported a significant positive association between access to facilities and level of physical activity.
• A systematic review by Wendel-Vos et al (2005) found significant positive association between proximity to recreational facilities and vigorous physical activity.
Duncan et al, 2005340
Meta-analysis: 16 studies published between January 1989 and February 2005. The number of studies on the exposure-outcome relation in this section was not reported.
Adults Access to recreational facilities (general)
Physical activity as a binary factor, eg, any walking, sufficient walking, sufficient leisure-time activity
• In crude (unadjusted) analyses, no variables demonstrated a significant association with physical activity.
• After adjustment for age, income, and educational level, the perceived presence of physical activity facilities was positively associated with physical activity (OR=1.20; 95% CI, 1.06, 1.34). Significant unexplained heterogeneity was present (P<0.05).
Humpel et al, 2002339
Review of 19 studies (18 cross-sectional, 1 longitudinal), including 6 studies on the exposure-outcome relation in this section
Adults Perceived (16 studies) and/or objectively determined (4 studies) physical environment categorized to accessibility of facilities, opportunities for activity, weather, safety, and aesthetics
Physical activity • Among 3392 Australian adults, Ball et al (2001) found that convenience (a park or beach within walking distance, accessible cycle path, shops within walking distance) was positively associated with walking for exercise (yes/no) in the past 2 wk (low vs high, OR=0.60 [0.46-0.77]), after adjustment for age, sex, and education.
• Among 2374 older Australian adults, Booth et al found a positive association between access to recreational facilities (eg, recreation center, cycle path, golf course, gym, park) and being active (vigorous activities, walking for exercise, leisure, and moderate activities ≥800 kcal/kg per week) (OR=1.14; 95% CI, 1.03-1.26), after adjustment for sociodemographic, social-cognitive, and perceived environmental variables.
• Among 413 adults, mean age 51 y, use of bikeways was evaluated in relation to perceived presence of sidewalks, heavy traffic, enjoyable neighborhood scenery, distance from bikeway, and having a busy street or steep hill to cross on the way to the bikeway. After adjustment for age and sex, several factors were inversely associated with bikeway use, including self-reported and GIS distance from the bikeway, a busy street to cross, and a GIS-measured steep-hill barrier.
• Among 2053 adults in San Diego, California, no significant association was seen between perceived convenience of exercise facilities (eg, aerobic dance studio, bike lane, running track) and

vigorous exercise (P=0.52). • When the preceding association was assessed prospectively, 24-mo
changes in physical activity were predicted by the neighborhood environment but only in initially sedentary men (P=0.04).
• Among 14,674 adults age 18-69 y who participated in the Canada Fitness Survey in 1983, women who reported no physical activity facility in their neighborhood were more likely to participate in physical activity. No significant association was seen in men.
Adults (Outcome: Obesity) Frost et al, 2010337
Systematic review of studies published between 1994 and 2008, including 1 study on the exposure-outcome relation in this section
Adults (age ≥18 y) in rural areas
Access to recreational facilities (distance)
Physical activity/obesity
• Boehmer et al (2006) studied the relation between time to walk from home to the nearest recreational facility and obesity among 1476 adults living in rural areas of Missouri, Tennessee, and Arkansas. After adjustment for age, gender, education, neighborhood variables, and health-related behaviors, the presence of a park that was more than a 20-min walk from home was positively associated with obesity (OR=1.53; 95% CI, 1.10-2.11).
Papas et al, 2007349
Review of 20 studies (18 cross- sectional, 2 longitudinal), including 3 studies on the exposure-outcome relation in this section among adults
Adults Objectively measured access to recreational facilities (density, distance)
Direct measures of body weight (eg, BMI)
Density: • Of 2 studies, 1 found a significant inverse association: • Mobley et al (2006): Among 2692 women, the number of fitness
facilities per 1000 residents was associated with 1.39 kg/m2 lower BMI (P<0.05) and 15.1% lower calculated 1-y CHD risk (P<0.05).
• Rutt and Coleman (2005): Among 996 Hispanic adults in Texas, there was no significant relation between the number of local resources for physical activity and BMI.
Distance: • Of 2 studies, 1 found a significant positive relation between
distance from home to the nearest recreational facility and obesity:Giles-Corti et al (2003): Among 1803 Australian adults age 18-59 y, there was a significant positive association between poor access (distance) to recreational facilities and obesity.
• Rutt and Coleman (2005): Among 996 Hispanic adults in Texas, there was no significant relation between distance to local physical activity facilities and BMI.
Additional Original Articles, 2007-2010* Author, y Design
and Duration
Population Intervention/Exposure Outcome Major Findings
Coombes et al, 2010341
Cross-sectional, 2005
N=6803 residents age >16 y in Bristol, United
Distance by road from home to 5 types of green space, including those with organized layout (formal green spaces), informal design (informal
• Frequency of visiting green spaces
• Engaging in at
After adjustment for age, sex, SES, self-rated health, and area deprivation: • People who lived farther from formal green
space (>2250 m) compared with those living nearer (<830 m) had lower odds of visiting the

Kingdom green spaces), habitats such as woodland (natural green spaces), areas designed for children or teenagers (youth green spaces), and playing fields and tennis courts (sport green spaces)
least 5 sessions per week of >30 min of physical activity
• Overweight or obesity
green space at least once a week (OR=0.64; 95% CI, 0.55-0.75), lower odds of doing ≥5 sessions per week of >30 min of physical activity (OR=0.76; 95% CI, 0.65-0.88), and higher odds of being overweight or obese (OR=1.27; 95% CI, 1.09-1.47).
• People who lived farther from informal green space (>680 m) compared with those living nearer (<200 m) had lower odds of visiting the green space at least once a week (OR=0.80; 95% CI, 0.68-0.93) and lower odds of being overweight or obese (OR=0.83; 95% CI, 0.72-0.97).
• People who lived farther from natural green space (>800 m) compared with those living nearer (<250 m) had lower odds of visiting the green space at least once a week (OR=0.80; 95% CI, 0.68-0.94); similar findings were seen for sport green space (OR=0.87; 95% CI, 0.74-1.02). No relation was seen between distance to these green spaces and activity or adiposity.
• After further adjustment for multiple neighborhood variables (road density, number of junctions per kilometer of road, ratio of junctions to cul-de-sacs, percentage of population age >60 y, percentage of nonwhite population, percentage of population who actively transport to work, and percentage of population with limiting long-term illness), only the associations of formal green space with physical activity remained significant.
Witten et al, 2008342
Cross-sectional, 2002-2003
N=12,529 adults (age ≥15 y), nationally representative sample in New Zealand
Travel time (by car) to the nearest park derived from GIS
• Sedentary behavior (<30 min per week of physical activity)
• Meeting activity guidelines (≥2.5 h on >5 days per week)
• BMI
After adjustment for age, sex, race, individual SES, deprivation, and type of residence (urban/rural): • Distance to the park was not associated with BMI
(β=−0.02; 95% CI, −0.08-0.05), sedentary behaviors (OR=0.84; 95% CI, 0.63-1.11), or meeting physical activity guidelines (OR=1.15; 95% CI, 0.96-1.37).
Boone-Heinonen et al, 2010345
Cross-sectional, 1994-1995
N=10,359 US adolescents, grades 7-12, nationally representative, in the National
Percentage of green space coverage and distance to the nearest neighborhood or major parks derived from GIS
Participation in wheel-based activities (eg, bicycling, roller skating); active sports; exercise; and ≥5 bouts per week of MVPA
After adjustment for individual and neighborhood SES variables: • Green space coverage was positively associated
with MVPA in boys and girls (for 10%-20% vs <10% green space: OR=1.62; 95% CI, 1.10, 2.39) and with exercise participation in girls (OR=1.73; 95% CI, 1.21, 2.49) but not boys.

IOM indicates Institute of Medicine; SES, socioeconomic status; MVPA, moderate to vigorous physical activity; GIS, geographical information systems; BMI, body mass index; OR, odds ratio; CI, confidence interval; YMCA/YWCA, Young Men’s Christian Association/Young Women’s Christian Association; WIC, Women, Infants, and Children; and CHD, coronary heart disease. *Given the array of smaller, cross-sectional, observational studies that were already captured in the published narrative and systematic reviews identified here, in the writing group’s additional systematic searches for original articles published after 2007, performed by means of PubMed searches, evaluation of related articles, and hand searches of reference lists, the writing group focused on those additional studies that were randomized trials, quasi-experimental studies, longitudinal studies, or large (N>5000) cross-sectional studies.
Longitudinal Study of Adolescent Health
• Green space coverage was not significantly associated with wheel-based sports or active sports.
• Distance to parks was associated with higher participation in active sports by boys and girls.
• Distance to parks was associated with higher participation in wheel-based activities and MVPA in girls but not boys.
Boone-Heinonen et al, 2010346-348
Prospective cohort, 1994-1995 to 2001-2002
N=12,701 US adolescents, grades 7-12 at baseline, nationally representative, in the National Longitudinal Study of Adolescent Health
Number and population density of pay and public physical activity facilities (per 10,000 population) derived from GIS. Longitudinal analyses also assessed land-cover diversity, street connectivity, and crime rate.
Number of bouts of MVPA In cross-sectional analyses, after adjustment for individual SES: • Number of physical activity facilities within 3 km
was associated with MVPA but with some variation by urbanicity and sex.
• Density of physical activity facilities was not significantly associated with MVPA.
In longitudinal analyses, after adjustment for measured covariates and within-person time-invariant factors: • Greater density of pay facilities was positively
associated with MVPA in boys but not girls. • Density of public facilities was not associated with
higher MVPA. See Supplementary Tables 10b, 10c, and 10d for findings on land-cover diversity, street connectivity, and crime rate, respectively.

Supplementary Table 10b. Local Environmental Change to Improve Physical Activity (Community Settings)
Land-Use Design (Locations and Accessibility of Destinations)*
Children (Outcome: Physical Activity)
Author, y Design and Number of Studies
Population Exposure Outcome Findings
Feng et al, 2010351
Systematic review, including 3 studies on the exposure-outcome relation in this section
Children/ adolescents
Land-use mix
Physical activity/travel mode to school
Of 3 studies, 1 found significant positive association between land-use mix and physical activity, and 1 found significant positive association between land-use mix and biking/walking to school:
Overall land-use mix:
• Kligerman et al (2007) studied the relation between land-use mix and objectively measured physical activity among 98 white or Mexican-American adolescents age 14-17 y living in San Diego County, California. Land-use mix was defined as the geometric mean of 5 land uses in 3 buffer sizes (0.4, 0.8, and 1.6 km) around the participant’s home. After adjustment for age and ethnicity, land-use mix at a 0.8-km buffer around home was positively associated with physical activity (point estimate and 95% CI were not reported).
• Norman et al (2006) studied the relation between land-use mix and objectively measured physical activity among 799 adolescents age 11-15 y living in San Diego County, California. Land-use mix was defined as the geometric mean of acreage for 5 types of land-use (residential, institutional, entertainment, retail, and office). The mean land-use mix for a 1.6-km buffer around participants’ homes was 0.38. Given that no significant association was observed between land-use mix and physical activity in bivariate analysis, it was not included in the final model. The estimates of bivariate analysis were not provided.
• Kerr et al (2006) studied the association of perceived and objectively measured land-use mix and parental report of mode of transport to school among 259 children age 5-18 y in Seattle, King County, Washington. Perceived land-use mix was computed using NEWS-Y, based on parental responses to questions about proximity to (land-use mix diversity) and accessibility of nonresidential destinations (land-use mix access). Objectively measured land-use mix was computed using the method described in Frank et al (2004) (see below). After adjustment for child age and gender, parental education, and parental concerns, only perceived land-use mix access was positively associated with active commuting to school (OR=1.8; 95% CI, 1.05-3.42). No significant associations were found between walking/biking to school and perceived

land-use mix diversity (OR=1.9; 95% CI, 0.96-3.79) or GIS-measured land-use mix (OR=1.5; 95% CI, 0.85-2.77).
Galvez et al, 2010355
Systematic review of articles published between January 2008 and August 2009, including 2 articles on the exposure-outcome relation in this section
Children/ adolescents
Land-use mix/distance to school
Physical activity/travel mode to school
∑ (�� �� ��)�
�� �
Both studies found significant positive association between land-use mix and active transport to school. One study found significant inverse association between distance to school and active travel to school.
Overall land-use mix:
• Rosenberg et al (2009) studied the relation between perceived land-use mix and physical activity among 171 adolescents (age 12-18 y) living in Boston, Massachusetts; Cincinnati, Ohio; and San Diego, California. The NEWS-Y was used to assess land-use mix. After adjustment for adolescent gender, race, and parental income, land-use mix access was positively associated with walking to shops (P=0.0001) and walking to school (P=0.002) once per week. No significant association was found between land-use mix access and meeting recommended physical activity levels (P=0.13).
• Larsen et al (2009) studied the relation between GIS-measured land-use mix and self-reported mode of travel between home and school among 614 students age 11-13 y. Land-use mix was defined as evenness of distribution of 6 types of land uses (recreational, agricultural, residential, institutional, industrial, and commercial) in a buffer of 500 m around participants’ homes and a buffer of 1.6 km around participants’ schools. Land-use mix was calculated as
(Note: u indicates land use classification; p, proportion of land dedicated to a particular land use; and N, total number of land uses). In a stepwise logistic regression, after adjustment for gender, household income, residential density, and distance to school, children living in areas in the upper quartile of land-use mix were more likely to actively travel between school and home compared with those living in the lower quartile (OR=3.46; 95% CI, 1.60-7.47). After adjustment for gender, street trees in the home neighborhood, and distance to school, children going to schools in the upper quartile of land-use mix were more likely to actively travel between school and home (OR=2.89; 95% CI, 1.63-5.12).
Distance to school: • In 614 students age 11-13 y, after adjustment for gender, household
income, residential density, and land-use mix, Larsen et al (2009) found significant inverse association between distance to school and active transport from school (OR=0.44; 95% CI, 0.35-0.56).

Dunton et al, 2009350
Systematic review: 15 studies published before May 2008, including 2 studies on the exposure-outcome relation in this section
Children/ adolescents
Land-use mix
Physical activity
Of 2 studies, 1 found significant positive association between land-use mix and physical activity.
Overall land-use mix:
• Kligerman et al (2007): See above. • Norman et al (2006): See above.
IOM Committee on Childhood Obesity Prevention Actions for Local Governments, 2009147
Systematic review, including 2 reviews and 4 cross sectional studies on the exposure-outcome relation in this section
Children or adolescents
Land-use mix/distance to school
Physical activity/active transport to school or other destinations.
• On the basis of a review by Badland and Schofield (2005) and a cross-sectional study by Frank et al (2004), it was concluded that living in a balanced land-use mix in the neighborhood is positively associated with physical activity.
• On the basis of a review by Saelens and Handy (2008), it was concluded that proximity to destinations was positively associated with walking and bicycling to destinations.
• On the basis of 3 cross-sectional studies by Tal and Handy (2008), Kerr et al (2006) (see above), and McDonald (2007) (see below), it was concluded that distance from home to school was associated with active transport to school.
Brownson et al, 2009352
Systematic review, including 4 studies on the exposure-outcome relation in this section
Children or adolescents
Land-use mix
Physical activity/travel mode to school
Of 4 studies, 1 found significant positive association between land-use mix and walking/biking to school and 1 found significant positive association between land-use mix and physical activity.
Land-use mix:
• Ewing et al (2004) studied the relation between land-use mix at the level of TAZ and mode of travel to school among 3815 students living in Alachua County, Florida. Land-use mix was defined as degree of land-use balance between jobs and residents at the TAZ level and was assessed by 2 indicators. No association was found between land-use variables and active mode of transport to school (estimates were not provided).
• Kerr et al (2006): See above. • Norman et al (2006): See above • Kligerman et al (2007): See above.
Lovasi et al, 2009334
Systematic review of 45 US studies (sample size >100) published between January 1995 and January 2009, including 2 studies on the exposure-outcome relation in this section
Children or adolescents
Land-use mix
Walking/travel mode to school
Of 2 studies, 1 found significant positive association between land-use mix and active transport to school and 1 found significant positive association between land-use mix and walking:
Overall land-use mix:
• Kerr et al (2007) studied the relation between land-use mix and self- or parent-reported walking among 3161 children age 5-18 y living in Atlanta, Georgia. Land-use data were obtained from county-level tax

assessor’s parcel data and census data (no further information was provided). After adjustment for sociodemographic variables, the presence of commercial, recreational, or open spaces in the neighborhood was positively associated with probability of walking at least once over a 2-d period among boys (OR=1.5; 95% CI, 1.1-2.1; P<0.01) and girls (OR=2.2; 95% CI, 1.5-3.1; P<0.001).
• Kerr et al (2006): See above.
Davison et al, 2008353
Systematic review of studies published before June 2007, including 2 studies on the exposure of interest in this study
Children or adolescents
Land-use mix
Travel mode to school
Of 2 studies, both found significant positive association between land-use mix and active transport to school.
Overall land use-mix:
• McMillan (2007) studied the relation between objectively measured land-use mix and caregivers’ reports of travel mode to school among children in grades 3-5 at 16 elementary schools in California. Land-use mix was defined as the proportion of street segments with land-use mix within a buffer of 0.4 km around the school. Data on land-use mix were obtained from environmental audits. After adjustment for sociodemographic variables, household transportation options, social/cultural norms and neighborhood safety (traffic, crime), land-use mix was positively associated with walking/biking to school (β=0.015; P=0.001).
• Kerr et al (2006): See above.
Panter et al, 2008354
Systematic review of 24 studies published between 2002 and 2007, including 8 studies on the exposure-outcome relation in this section
Children or adolescents
Land-use mix/distance to school
Physical activity/travel mode to school or local destinations
Of 8 studies, 2 found significant positive association between land-use mix and walking; 2 found significant positive association between distance to school and walking/biking to school; and 1 found significant positive association between the presence of walkable destinations in the neighborhood and physical activity.
Overall land-use mix:
• Frank et al (2007) studied the relation between land-use mix and self-reported walking among 3161 US children age 5-20 y. Land-use mix was calculated based on the Frank et al (2004) method. After adjustment for sociodemographic variables, land-use mix was positively associated with walking at least once over 2 d (OR=1.8; 95% CI, 1.4-2.3; P<0.001) and walking >0.8 km per day (OR=1.9; 95% CI, 1.3-2.9; P<0.001).
• Kerr et al (2007): See above. McDonald (2007) studied the relation between land-use mix and self-reported mode of travel to school among 614 US children age 5-18 y living in Alameda County, California. Land-use mix was defined as evenness of distribution of 5 types of land use (eg, single-family, multifamily, retail/service, manufacturing/trade/other) in a 1-km network buffer around a household residence and was calculated based on the

Cervero and Kockelman (1997) method. After adjustment for individual, social environmental, and other built-environment variables, no significant association was found between land-use mix and active transport to school.
• Mota et al (2007) evaluated the relation between self-reported access to destinations and self-reported travel mode to school among 705 Portuguese girls age 11-18 y. No significant difference was observed between active and passive travelers in terms of their level of agreement with the statement, “many stores are within easy walking distance of my home” (P=0.91).
• Among 480 US girls age 10-15 y, Evenson et al (2006) found a positive association between the presence of walkable destinations and physical activity above median (OR=1.78; 95% CI, 1.11-2.83).
• Ewing et al (2004): See above. Distance to school: • Timperio et al (2006) studied the relation between objectively measured
distance to school and parental report of walking/biking to school among 912 Australian children age 5-6 y and 10-12 y. After adjustment for sociodemographic and neighborhood variables, proximity to school was positively associated with active transport to school among children age 5-6 y (OR=5.2; 95% CI, 2.2-12.3), and 10-12 y (OR=10.2; 95% CI, 5.9-17.6).
• Ziviani et al (2004) studied the relation between parental perception of distance to school and parental report of mode of transport to school among 164 children age 6-11 y living in Brisbane, Australia. Distance to school was inversely associated with walking to school at least once per week (OR=0.54; 95% CI, 0.35-0.74; P=0.001).
Children (Outcome: Obesity)
Author, y Design and Number of Studies Population Exposure Outcome Findings
Feng et al, 2010351 Systematic review, including 3 studies on the exposure-outcome relation in this section
Children/ adolescents
Land-use mix
Adiposity All 3 studies found no significant association between land-use mix and adiposity.
Land-use mix:
• Norman et al (2006) studied the relation between land-use mix and objectively measured BMI among 799 adolescents age 11-15 y living in San Diego County, California. Land-use mix was defined as the geometric mean of acreage for 5 types of land use (residential, institutional, entertainment, retail, and office). The mean land-use mix for a 1.6-km buffer around participants’ homes was 0.38. Given that no significant association was observed between land-use mix and obesity in bivariate analysis, it was not included in the final model. The estimates of bivariate analysis were not provided.

• Kligerman et al (2007) studied the relation between land-use mix and objectively measured BMI among 98 white or Mexican-American adolescents age 14-17 y living in San Diego County, California. Land-use mix was defined as the geometric mean of 5 land uses in 3 buffer sizes (0.4, 0.8, and 1.6 km) around participants’ homes. After adjustment for age and ethnicity, land-use mix was not associated with BMI (point estimate and 95% CI were not reported).
• Spence et al (2008) studied the association of GIS-measured land-use mix with objectively measured overweight among 501 Canadian children age 4-6 y living in Edmonton, Alberta. Land-use mix within a buffer of 1.5 km around participants’ homes was estimated based on the density of 4 types of land uses (institutional, maintenance, dining, and leisure). After adjustment for child age, sex, physical activity, junk food consumption, neighborhood-level education, and proportion of employed women in the neighborhood, land-use mix was not associated with being overweight in girls (OR=0.80; 95% CI, 0.47-1.36) or boys (OR=0.87; 95% CI, 0.58-1.30).
Galvez et al, 2010355 Systematic review of articles published between January 2008 and August 2009, including 1 article on the exposure-outcome relation in this section
Children Land-use mix
Overweight • Spence et al (2008): See above.
Carter and Dubois, 2010356
Systematic review of 27 studies published between 1999 and 2009, including 1 study on the exposure-outcome relation in this section
Children/ adolescents
Land-use mix
Adiposity • Spence et al (2008): See above.
Dunton et al, 2009350 Systematic review, 15 studies published before May 2008, including 2 studies on the exposure-outcome relation in this section
Children/ adolescents
Land-use mix
Adiposity Both studies found no significant association between land-use mix and adiposity. • Spence et al (2008): See above. • Norman et al (2006): See above.
Adults (Outcome: Physical Activity)
Author, y Design and Number of Studies
Population Exposure Outcome Findings

Feng et al, 2010351 Systematic review, including 2 studies on the relation between exposure and outcome of interest in this section
Adults Land-use mix
Physical activity/walking
Of 2 studies, 1 found significant positive association between land-use mix and walking and 1 found significant correlations between land-use mix and physical activity: Land-use mix: • Li et al (2008) studied the association of land-use mix with self-reported
physical activity among 1221 adults age 50-75 y living in Portland, Oregon. Land-use mix was defined as evenness of distribution of various land-use types and was computed based on the methods of Frank et al (2004). After adjustment for age, gender, race/ethnicity, employment status, home ownership, household income, health status, fruit and vegetable intake, fried-food consumption, BMI, and neighborhood factors, including residential density, median household income, and percentage of black and Hispanic residents, land-use mix was positively associated with neighborhood walking (PR=4.07; 95% CI, 2.29-7.23), walking for transportation (PR=5.76; 95% CI, 2.70-12.31), walking for errands (PR=1.50; 95% CI, 1.01-2.22), and meeting physical activity recommendations (PR=1.46; 95% CI, 1.05-2.04).
• Frank et al (2005) studied the relation between land-use mix and accelerometer-measured physical activity among 357 adults age 20-69 y living in Atlanta, Georgia. Land-use mix was defined as evenness of distribution based on the area of 3 types of land uses (residential, commercial, and office) in a 1-km network-based street buffer around participants’ homes and was calculated based on the method of Frank et al (2004). The mean calculated land-use mix was 0.38. After adjustment for age, education, and gender, land-use mix was significantly correlated with natural log of the minutes of moderate physical activity per day (r=0.145; P=0.01). However, the association of land-use mix and physical activity was not assessed in the final multivariate regression model.
Frost et al, 2010337 Systematic review of studies published between 1994 and 2008, including 3 studies on the exposure-outcome relation in this section
Adults Presence of walkable destinations
Physical activity
Of 3 studies, 1 found significant positive association between perceived presence of walkable destinations and physical activity:
Land-use mix (presence of walkable destinations):
• Deshpande et al (2005) studied the association of perceived presence of walkable destination and self-reported physical activity among 274 adults with diabetes in rural areas from 12 communities in Missouri, Tennessee, and Arkansas. After adjustment for BMI, health status, and physical impairment, significant positive association was found between presence of walkable destinations and physical activity (OR=2.30; 95% CI, 1.25-4.23).
• Sanderson et al (2003) studied the relation between perceived presence of walkable destinations and physical activity among 567 women age 20-50 y living in 3 predominantly black rural areas of Alabama. After adjustment for age, marital status, education, number of children, annual

income level, employment status, and general health, no significant association was found between perceived presence of walkable destinations (yes/no) and meeting recommendations for physical activity (OR=1.06 [0.74-1.52]).
• Eyler (2003) studied the relation between perceived presence of walkable destinations and self-reported physical activity among 1000 white women age 20-50 y in rural areas of Missouri and Illinois. No association was found between the presence of places within walking distance (yes/no) and meeting recommendations for physical activity (OR=0.91; 95% CI, 0.68-1.25). Adjustment for age, general health status, and self-efficacy did not change the results, and the adjusted OR was not reported.
Brownson et al, 2009352
Systematic review, including 3 studies about the exposure-outcome relation in this section
Adults Land-use mix
Physical activity/walking
Of 3 studies, 1 found significant correlation between land-use mix and moderate physical activity, 1 found significant positive association between social land use and walking for transport, and 1 found significantly higher land-use access in high-walkable neighborhoods. Land-use mix: • Frank et al (2005): See above. • Forsyth et al (2008) studied the relation between percentage of social
land use in the neighborhood and physical activity among 715 US adults living in the Twin Cities area of Minnesota. Percentage of social land use was calculated as total area in parcels, with social uses divided by total land area in parcels, with water area removed. Social uses included daycare centers, medical clinics and offices, theaters, bowling alleys, lodge halls and amusement parks, sports/public assembly facilities, tax-exempt community recreational facilities, library, exempt property owned by the board of education, and other exempt property. After adjustment for age, sex, race, education, marital status, home ownership, tenure, overall health, car ownership, total household members, and other neighborhood variables, social land use was inversely associated with walking for leisure and positively associated with walking for transport.
• Saelens et al (2003) studied the association of self-reported measure of land-use mix with objectively assessed physical activity among 107 adults age 18-65 y living in 2 nonadjacent census tracts in San Diego, California. A NEWS questionnaire was used to obtain land-use data. Land-use mix diversity was assessed by a question about walking proximity to nonresidential land uses such as a small grocery store, restaurants, and post office (subscale score range: 1-5). To assess land-use mix access, participants were asked if they do most of their shopping at local stores and if they find it difficult to park in local shopping areas (subscale score range: 1-4). After adjustment for age and education, residents of the high-walkable neighborhood had significantly higher land-use mix access (3.2 vs 2.8; P<0.05); higher land-use mix diversity (3.5 vs 2.8; P<0.05); and higher total physical activity (210.5 vs 139.9 min per week; P<0.01).

Casagrande et al, 2009357
Systematic review of studies (population ≥ 90% black) published before August 2007, including 2 studies on the exposure-outcome relation in this section
Adults Land-use mix
Physical activity
Of 2 studies, 1 found significant correlation between land-use mix and moderate physical activity.
Land-use mix
• Atkinson et al (2005) studied the relation between land-use mix and physical activity among 102 US adults (age 20-65 y). The NEWS questionnaire was used to obtained self-reported data on land-use mix diversity and land-use mix access. In bivariate analysis, land-use mix diversity was not significantly correlated with accelerometer-measured moderate-intensity (r=0.02; P=0.86) and vigorous-intensity (r=0.13; P=0.21) physical activity. Land-use mix access was not correlated with accelerometer-measured moderate-intensity (r=0.14; P=0.18), and vigorous-intensity (r=0.19; P=0.06) physical activity either.
• Among 357 adults age 20-69 y living in Atlanta, Georgia, Frank et al (2005) found significant correlation between land-use mix and natural log of the minutes of moderate physical activity per day (r=0.145; P=0.01). This association was not assessed in the final multivariate regression model.
Chow et al, 2009358 Systematic review, including 2 studies on the exposure-outcome relation in this section
Adults Land-use mix
Physical activity
Of 2 studies, 1 found significantly higher land-use access in high-walkable neighborhoods. Land-use mix • Eyler (2003): See above. • Saelens et al (2003: See above.
Lovasi et al, 2009334 Systematic review of 45 US studies (sample size >100) published between January 1995 and January 2009, including 4 studies on the exposure-outcome relation in this section.
Adults Land-use mix
Physical activity
Of 4 studies, 1 found significant positive association between land-use mix and walking, 1 found significant correlations between land-use mix and physical activity, 2 found significant positive association between neighborhood walkability and land-use mix, and 1 found significant positive association between count of nonresidential and specific destinations in the neighborhood and walking. Land-use mix: • Cerin et al (2007) studied the association of objectively assessed land-use
mix and perceived access to destinations with self-reported weekly minutes of walking for transport among 2650 adults age 20-65 y living in 32 neighborhoods from 154 census collection districts in Adelaide, Australia. Land-use mix was defined as evenness of distribution of 5 types of land uses (residential, commercial, industrial, recreational, and other) in a 1-km network buffer around a participant’s home and was calculated based on the Cervero and Kockelman (1997) method. Perceived land-use mix and proximity of destinations was assessed by a subscale of NEWS. After adjustment for sociodemographic factors, perceived proximity to commercial destinations was positively associated with transport-related walking (β=12.4; 95% CI, 0.2-28.8). However, after adjustment for type of neighborhood (residential,

recreational, commercial/industrial), the association was no longer statistically significant (β=8.3; 95% CI, −4.4-21.0). Furthermore, after adjustment for sociodemographic factors and type of neighborhood, perceived proximity to commercial workplace was positively associated with transport-related walking (β=15.0; 95% CI, 3.3-26.7). No significant association was found between perceived proximity to
schools and walking for transport; or between land-use mix and walking for transport.
• Hoehner et al. (2005) studied the association of land-use mix with transportation and recreational physical activity among 1073 adult residents of Savannah, GA and St. Louis, MO. Perceived land-use mix was assessed through participants’ response to questions about presence and count of specific destinations in their neighborhood. Objective measures of land-use mix included the count of nonresidential and specific destinations in the neighborhood and were assessed through environmental audits. After adjustment for age, gender, and, education, people who reported 7–13 destinations within 5-min walking distance from their home were more likely to be involved in any kind of walking for transport compared to those who reported no destination within 5-min walking distance from their home (OR=2.4; 95% CI: 1.3–4.3). Also, based on environmental audits, living in neighborhood with 43-131 nonresidential destinations (fourth quartiles) was associated with higher probability of walking for transport compared to living in the neighborhood with 0-10 nonresidential destinations (OR=3.5; 95% CI: 2.3–5.5).
• Frank et al (2005): See above. • Saelens et al (2003): See above.
Saelens and Handy, 2008359
Systematic review of 13 reviews published between 2002 and 2006 and 29 original studies published between 2005 and 2006, including 3 reviews and 11 original studies on the exposure-outcome relation in this section (4 of which were included)
Children and adults
Land-use mix
Physical activity/walking
• On the basis of 3 reviews by Badland and Schofield (2005), Heath et al (2006), and Saelens et al (2003), it was concluded that living in an area with balanced land-use mix is positively associated with physical activity.
• Among the 11 original studies, 2 were in children, both described elsewhere in this Table (see Kerr 2006 and McMillan 2007). Of the 9 in adults, 1 is described elsewhere in this Table (see Hoehner 2005) and another in the walkability Table, below (see Frank 2006).
• Of the studies on the relation between proximity of nonresidential destinations and walking for transport, 8 found a positive association and 3 found a null or an unexpected association.
• Of the studies on the relation between proximity of nonresidential destinations and walking for recreation, 3 found a positive association and 4 found a null or unexpected association.
• Of the studies on the relation between proximity of nonresidential destinations and general walking, 3 found positive association and 1 found no association.

Bauman and Bull, 2007338
Systematic review of reviews published between 2002 and 2007, including 5 reviews on the exposure-outcome relation in this section
Children and adults
Land-use mix
Physical activity/walking
Land-use mix:
• Of 6 reviews, 5 found sufficient evidence to conclude that land-use mix was positively associated with physical activity. One of these studies was a meta-analysis by Duncan et al (2005) (see below).
• Of 3 reviews, 2 reported positive association between land-use mix and walking.
Duncan et al, 2005340
Meta-analysis: 16 studies published between January 1989 and February 2005. The number of studies on the exposure-outcome relation in this section was not reported.
Adults Various environmental characteristics, including neighborhood shops and services
Physical activity as a binary factor, eg, any walking, sufficient walking, sufficient leisure-time activity, etc
• In crude (unadjusted) analyses, no variables demonstrated a significant association with physical activity.
• After adjustment for age, income, and education level, the perceived presence of shops and services was positively associated with physical activity (OR=1.30; 95% CI, 1.14, 1.46).
Adults (Outcome: Obesity)
Author, y Design and Number of Studies
Population Exposure Outcome Findings
Feng et al, 2010351 Systematic review, including 3 studies on the relation between exposure and outcome of interest in this section
Adults Land-use mix
Adiposity All 3 studies found an inverse association between land-use mix and obesity.
Land-use mix:
• Frank et al (2004) used data from SMARTRAQ to study the relation between land-use mix and self-reported measure of obesity (BMI ≥30) among 10,878 adult residents of Atlanta, Georgia. Land-use mix was defined as evenness of distribution based on areas of 4 types of land use (residential, commercial, office, and institutional) in a 1-km network buffer around a household residence. A land-use mix formula was calculated that could take values between 0 (single land-use environment) and 1 (even distribution of square footage across all 4 land uses). The mean land-use mix in this study was 0.15. After adjustment for age, income, and educational attainment, land-use mix was inversely associated with obesity (OR=0.88; 95% CI, 0.84-0.92; P<0.000).
• Li et al (2008) studied the association of land use with objective measure of overweight/obesity (BMI ≥25) among 1221 adults age 50-75 y living in Portland, Oregon. Land-use mix was defined as evenness of distribution of various land-use types and was computed based on the Frank et al (2004) method (see above). After adjustment for age, gender, race/ethnicity, employment status, home ownership, household income, health status, fruit and vegetable intake, fried-food consumption, and neighborhood factors, including residential density, median household

income, and percentage of black and Hispanic residents, land-use mix was inversely associated with risk of being overweight or obese (PR=0.75; 95% CI, 0.62-0.90).
• Mobley et al (2006) studied the relation between land-use mix and BMI among 2692 women enrolled in the CDC WISEWOMAN program. Land-use mix was defined as evenness of distribution based on square areas of 5 types of land use (residential, commercial, office, institutional, rural) in ZIP codes of each participant’s residence and computed based on the Frank et al (2004) method. The mean land-use mix was 0.49 (0.00-0.96). After adjustment for demographic, socioecological and other built-environment variables, land-use mix was inversely associated with BMI (β=−2.60; P<0.05).
Frost et al, 2010337 Systematic review of studies published between 1994 and 2008 including 1 study on the effect exposure-outcome relation in this section.
Adults in rural areas
Presence of walkable destinations
Obesity • Boehmer et al (2006) studied the association of perceived proximity to destinations with self-reported measure of obesity (BMI ≥30) among 2210 adults in rural areas from 13 counties in Missouri, Tennessee, and Arkansas. After adjustment for gender, age, and education, participants who disagreed/strongly disagreed that there were many destinations to go within easy walking distance from their home did not have a significantly different risk of obesity compared with those who agreed/strongly agreed with this statement (OR=1.25; 95% CI, 0.99-1.57). Those who reported no destination within a 10-min walk from home did not have a significantly different risk of obesity compared with those who reported 7-11 destinations within a 10-min walk from their home (OR=1.38; 95% CI, 0.99-1.92).
Brownson et al, 2009352
Systematic review, including 2 studies about the exposure-outcome relation in this section
Adults Land-use mix
Adiposity Both studies found significant inverse association between land-use mix and adiposity.
Land-use mix
• Rundle et al (2007) studied the relation between land-use mix in the census tract of residence and objectively assessed BMI among 13,102 adults living in New York City. Land-use mix was defined as the balance between commercial and residential land uses and was calculated by multiplying the ratio of residential building area by the ratio of commercial building area for each tract. The product was then scaled by a factor of 4. The calculated index ranged from 0 to 1 and had a mean of 0.34. After adjustment for individual- and neighborhood-level sociodemographic characteristics, land-use mix was inversely associated with BMI (β=−0.55; P<0.01). Further adjustment for other built-environment variables (subway stop, bus stop, population, and intersection densities) did not greatly alter results (β=−0.46; P<0.05).
• Frank et al (2004): See above.
Lovasi et al, 2009334 Systematic review of 45 US studies
Adults Land-use mix/prese
Adiposity Of 4 studies, 2 found significant positive association between land-use mix and adiposity.

(sample size >100) published between January 1995 and January 2009, including 4 studies on the exposure-outcome relation in this section
nce of walkable destinations
Land-use mix:
• Rundle et al (2007): See above. • Frank et al (2004): See above. • Boehmer et al (2006): See above. • Boehmer et al (2007) studied the association of perceived presence of
walkable destinations and obesity among 1032 adult residents of high- and low-income areas of Savannah, Georgia, and St Louis, Missouri. After adjustment for age, gender, education, and other environmental variables, people who strongly disagreed that “there are many destinations to go to within easy walking distance from my home” did not have a significantly different risk of obesity compared with those who agreed with this statement (OR=1.5; 95% CI, 0.8-2.6).
Additional Original Articles 2007-2010*
Author, y Design and Duration
Population Intervention/Exposure
Outcome Findings
Rodríguez et al, 2009271
Cross-sectional, 2000-2002
N=5529 adults age 45-84 y in Baltimore, Maryland; Chicago, Illinois; Forsyth County, North Carolina; Los Angeles, California; New York City, NY; and St Paul, Minnesota
Land-use (evenness of distribution of residential, institutional, retail, and office in a 200-m buffer around participants’ homes) calculated using the Cervero and Kockelman (1997) method. Self-reported presence of all destinations, stores, and schools or YMCAs within walking distance (20 min)
Self-reported walking (minutes per week) for transport (level 1: none; level 2: from 0 to 150 min per week; level 3: ≥150 min per week) Self-reported minutes per week of walking for exercise (level 1: none; level 2: from 0 to 90 min per week; level 3: ≥90 min per week).
After adjustment for age, gender, education, race/ethnicity, family income, and proportion of 400-m buffer from home accessible via roads:
Walking for transport: • People who lived in the areas in the 4th quartile of land-use mix did not
have significantly different odds of walking for transport (level 2 vs 1: OR=1.26; 95% CI, 0.71-2.24 and level 3 vs 1: OR=1.36; 95% CI, 0.63-2.96).
• Perceived presence of walkable destinations was positively associated with walking for transport (level 2 vs 1: OR=1.13; 95% CI, 1.03-1.24 and level 3 vs 1: OR=1.26; 95% CI, 1.06-1.50).
• Perceived presence of stores within walking distance was positively associated with walking for transport >150 min per week (level 2 vs 1: OR=1.13; 95% CI, 0.98-1.30 and level 3 vs 1: OR=1.29; 95% CI, 1.07-1.55).
• Perceived presence of schools and YMCA within walking distance was positively associated with walking for transport (level 2 vs 1: OR=1.06; 95% CI, 0.83-1.35 and level 3 vs 1: OR=1.18; 95% CI, 0.87-1.60).
Walking for exercise: • People who lived in the areas in the 4th quartile of land-use mix were
more likely to walk for exercise >90 min per week (level 2 vs 1: OR=1.05; 95% CI, 0.87-1.27 and level 3 vs 1: OR=1.29; 95% CI, 1.08-1.54).
• Perceived presence of walkable destinations was positively associated with walking for exercise (level 2 vs 1: OR=1.12; 95% CI, 1.07-1.18 and

CI indicates confidence interval; NEWS-Y, Neighborhood Environment Walkability Scale−Youth; OR, odds ratio; GIS, geographical information systems; IOM, Institute of Medicine; TAZ, traffic analysis zone; BMI, body mass index; PR, prevalence ratio; SMARTRAQ, Strategies for Metro Atlanta’s Regional Transportation and Air Quality; WISEWOMAN, Well-Integrated Screening and Evaluation for Women Across the Nation; CDC, Centers for Disease Control and Prevention; YMCA, Young Men’s Christian Association; and MVPA, moderate to vigorous physical activity. *Given the array of smaller, cross-sectional, observational studies that were already captured in the published narrative and systematic reviews identified here, in the writing group’s additional systematic searches for original articles published after 2007, performed by means of PubMed searches, evaluation of related articles, and hand searches of reference lists, the writing group focused on those additional studies that were randomized trials, quasi-experimental studies, longitudinal studies, or large (N>5000) cross-sectional studies.
level 3 vs 1: OR=1.30; 95% CI, 1.20-1.41). • Perceived presence of stores in walking distance was positively
associated with walking for exercise >90 min per week (level 2 vs 1: OR=1.04; 95% CI, 0.95-1.13 and level 3 vs 1: OR=1.18; 95% CI, 1.07-1.29).
• Perceived presence of schools and YMCA within walking distance was positively associated with walking for exercise >90 min per week (level 2 vs 1: OR=1.08; 95% CI, 0.98-1.18) and level 3 vs 1: OR=1.18; 95% CI, 1.05-1.32).
Wells and Yang, 2008360
Observational, longitudinal, 2003-2006
N=32 low-income, primarily black women (age 23-60 y) living in 4 southeastern US towns
• 1 group moved to neotraditional neighborhoods and 1 group moved to conventional suburban neighborhoods
• Land-use mix was assessed by multiple different metrics without control for multiple testing.
• Population density
Number of steps walked per week, assessed by pedometer
After adjustment for race, household size, and premove steps: • Unexpectedly, 1 metric of greater land-use mix, an increase in service-
jobs population density after the move, was associated with fewer steps walked per week (P=0.013).
• Most land-use mix variables were not associated with walking in this small sample.
Boone-Heinonen et al, 2010346
Observational, longitudinal, 1994-1995 to 2001-2002
N=12,701 US adolescents, grades 7-12 at baseline, in the nationally representative National Longitudinal Study of Adolescent Health
Neighborhood land-cover diversity, street connectivity, physical activity facilities, and crime rate derived from GIS
Bouts of MVPA
In longitudinal analyses, after adjustment for measured covariates and within-person time-invariant factors: • Land-cover diversity was not significantly associated with higher
MVPA. See Supplementary Tables 10a, 10c, and 10d for findings on physical activity facilities, street connectivity, and crime rate, respectively.

Supplementary Table 10c. Local Environmental Change to Improve Physical Activity (Community Settings)
Street and Sidewalk Design
Children (Outcome: Physical Activity)
Author, y Design and Number of Studies
Population Exposure Outcome Findings
IOM Committee on Childhood Obesity Prevention Actions for Local Governments, 2009147
Systematic review including 4 reviews, 1 quasi-experimental, and 1 cross-sectional study on the exposure of interest in this section
Children or adolescents
Pedestrian infrastructure (sidewalk availability) and street design (street connectivity)
Physical activity
Pedestrian infrastructure:
• On the basis of 3 reviews by Davison and Lawson (2006) (see below), Badland and Schofield (2005), and Saelens et al (2003), it was concluded that the presence of sidewalks is positively associated with walking or biking for transportation or recreation.
• On the basis of a review by Booth et al (2005), it was concluded that availability of sidewalks might be associated with obesity.
• In a quasi-experimental analysis, Boarnet et al (2005a) studied the relation between parental reports of presence of a SR2S construction project on the way to school and change in the mode of transport to school among 862 children in grades 3-5 in California. Children whose route to school included a newly installed sidewalk were more likely to increase their active transport to school than children whose route did not include a new sidewalk (P<0.01).
Street design: • On the basis of a review by Badland and Schofield (2005) and a cross-
sectional study by Frank et al (2004), it was concluded that street connectivity is positively associated with physical activity.
Committee on Environmental Health, American Academy of Pediatrics, 2009361
Systematic review, including 1 quasi-experimental study on the exposure of interest in this section
Children Pedestrian infrastructure (sidewalk availability)
Physical activity
Pedestrian infrastructure:
• Boarnet et al (2005a): See above
Lovasi et al, 2009334
Systematic review of 45 US studies (sample size >100) published between January 1995 and January 2009, including 1
Children or adolescents (age 10-15 y)
Pedestrian infrastructure (availability of sidewalk and walking trail)
Physical activity
Pedestrian infrastructure:
• Evenson et al (2006) studied the association of self-reported presence of walking or biking infrastructure with self-reported physical activity and mode of transport to school among 480 US girls age 10-15 y. After adjustment for site, race/ethnicity, and grade, presence of neighborhood

study on the exposure of interest in this section
bicycle or walking trails was positively associated with physical activity above the median (OR=1.68; 95% CI, 1.16-2.44) and active commuting to school (OR=1.59; 95% CI, 1.05-2.40). The presence of sidewalks was not associated with physical activity (OR=1.34; 95% CI, 0.89-2.02) or active commuting (OR=1.05; 95% CI, 0.66-1.67).
Panter et al, 2008354
Systematic review of 24 studies published between 2002 and 2007, including 5 on the exposure of interest in this section
Children (4-11 y) or adolescents (12-18 y)
Pedestrian infrastructure (sidewalk availability) and street design (street connectivity).
Walking or cycling to school or other local destinations
Pedestrian infrastructure:
Of 5 studies, 3 reported significant positive association between the presence of sidewalks and active mode of transport, and 1 study reported the same between the presence of bicycle or walking trails and physical activity. • Mota et al (2007) evaluated the relation between self-reported presence of
infrastructure for walking and self-reported travel mode to school among 705 Portuguese girls age 11-18 y. No significant difference was observed between their level of agreement with the statement “there are pavements on most of the streets in my neighborhood “ and active vs passive commuting (P=0.19).
• Kerr et al (2006) evaluated the association of parental perception of neighborhood characteristics with travel mode to school among 259 US girls and boys age 4-18 y. After adjustment for sociodemographic and other perception variables, significant positive association was observed between perceived presence of walking or cycling infrastructure (eg, sidewalks and pedestrian/bike trails) and active commuting to school (OR=2.5; 95% CI, 1.30-4.67).
• Evenson et al (2006): See above. • Among 726 US youth age 10-15 y, Evenson et al (2004) found significant
positive association between the presence of sidewalks on main roads (higher sidewalk coverage) and active travel to school.
• Among 1395 US boys and girls age 8-18 y, Fulton et al (2003) found significant positive association between parental report of presence of sidewalks and walking to school.
Street design: Both studies showed significant positive association between street connectivity and active commuting to school. • Mota et al (2007): See above. • Kerr et al (2006): See above.
Davison et al, 2008353
Systematic review of studies published before June 2007, including 3 on the exposure of interest in this section
Children or adolescents
Pedestrian infrastructure (sidewalk availability) and street design (street connectivity)
Active commuting
Pedestrian infrastructure:
All 3 studies found significant positive association: • Kerr et al (2006): See above. • Boarnet et al (2005a): See above. • In a quasi-experimental study evaluating California’s SR2S program,
Boarnet et al (2005b) showed a significant increase in children’s observed walking after completion of the sidewalk gap closure projects.

Bauman and Bull, 2007338
Systematic review of reviews published between 2002 and 2007, including 1 on the exposure of interest in this section
Children or adolescents
Pedestrian infrastructure (sidewalk availability) and street design (street connectivity)
Physical activity
Pedestrian infrastructure:
• Davison and Lawson (2006): See below. The authors thought there was adequate evidence to conclude that sidewalk availability was positively associated with physical activity.
Street design: • Davison and Lawson (2006): See below.
Davison and Lawson, 2006343
Systematic review of 33 studies, including 7 on the exposure of interest in this section
Children or adolescents
Pedestrian infrastructure (sidewalk availability and conditions) and street design (street connectivity)
Physical activity or active commuting
Pedestrian infrastructure:
Of 4 studies, 2 studies found significant association between the presence of sidewalks and physical activity, and 1 study found significant association between sidewalk characteristics and physical activity. • Ewing et al (2004) found that the proportion of street kilometers with
sidewalks was positively associated with children's rates of walking or cycling to school (β=1.480; t statistic: 2.09).
• Mota et al (2005) studied the relation between perceived presence of sidewalks on streets in the neighborhood and self-reported physical activity among 1123 adolescents. No significant relation was found between their level of agreement with the statement “there are sidewalks on most of the streets in my neighborhood” and activity (P=0.15).
• Jago et al (2005) studied the relation between objectively assessed sidewalk conditions and physical activity among 210 Boy Scouts. Sidewalk characteristics such as distance from sidewalk to curb, average height of trees, sidewalk material, and sidewalk type were positively associated with objectively measured light-intensity physical activity (β=0.20; P=0.003).
• Boarnet et al (2005a): See above. Street design: Of 4 studies, 2 found significant positive association between street connectivity and physical activity. • Among 105 US students age 9-11 y, Braza et al (2004) found a positive
relation between street connectivity (objectively measured number of intersections per street kilometer) in a 0.8-km buffer around schools and active commuting (walking or biking to school) by students.
• Among 799 US boys and girls age 11-15 y, Norman et al found a positive association between intersection density and objectively measured MVPA in girls but not boys.
• Mota et al (2005) found no relation between perceived street connectivity and self-reported physical activity among Portuguese adolescents in grades 7-12.
• Timperio et al (2006) studied route directness (connectivity) and parental reports of walking or riding to school for 912 Australian children. Greater route directness was associated with less walking and cycling to school in older children (10-11 y) but not in younger children (5-6 y).

Children (Outcome: Obesity) Author, y
Design and Number of Studies
Population
Exposure
Outcome
Findings
Carter and Dubois, 2010356
Systematic review of 27 studies published between1999 and 2009, including 1 on the exposure of interest in this section
Children and adolescents
Street design (street connectivity)
Obesity Street design:
• In a study of a nationally representative sample of US children age 5-18 y, Grafova (2008) found no association between street connectivity and obesity. However, children living in neighborhoods built after 1969 were more likely to be obese than those living in neighborhoods built before 1969.
Papas et al, 2007349
Review of 20 studies, including 1 study on the exposure of interest in this section
Adolescent Street design (street connectivity)
Obesity Street design:
• In a study of 20,745 US adolescents, Nelson et al (2006) did not find a significant association between street connectivity and obesity.
Additional Original Articles (Children)* Author, y Design and
Duration Population Intervention/Exposure Outcome Findings
Boone-Heinonen et al, 2010348
Observational, cross-sectional, 1994-1995 National Longitudinal Study of Adolescent Health
N=17,659 US adolescents, grades 7-12, nationally representative
Street connectivity measures, including intersection density and link-node ratio, within 1, 3, 5, and 8.05 km of home, derived from GIS
Participation in MVPA After adjustment for age, race, household income, parental education, census tract poverty, county level crime, and population density within the neighborhood buffer: • Intersection density within 1 km was most
consistently associated with MVPA. • Relations appeared to vary by urbanicity
and sex.
Boone-Heinonen et al, 2010346
Observational, longitudinal, 1994-1995 to 2001-2002 National Longitudinal Study of Adolescent Health
N=12,701 US adolescents, grades 7-12 at baseline, nationally representative
Neighborhood land-cover diversity, street connectivity, physical activity facilities, and crime rate derived from GIS
Bouts of MVPA In longitudinal analyses, after adjustment for measured covariates and within-person time-invariant factors: • Street connectivity was not significantly
associated with higher MVPA. See Supplementary Tables 10a, 10b, and 10d for findings on physical activity facilities, land-cover diversity, and crime rate, respectively.
Carver et al, 2010362
Observational, prospective,
Children (age 8-9 y; N=170) and
Objectively measured characteristics of
• Change in frequency of parent-reported (for
In crude (unadjusted) analyses: Age 8-9 y:

2001-2004 Children Living in Active Neighborhoods Study
adolescents (age 13-15 y; N=276) from 19 government primary schools in high- (n=10) and low- (n=9)SES neighborhoods ofMelbourne, Australia
neighborhood (a radius of 800 m around children’s homes), including • Total lengths of
walking tracks • Total numbers of
intersections per neighborhood (intersection density)
children age 8-9 y) or self-reported (by adolescents age 13-15 y) walking or cycling to/from 15 neighborhood destinations between 2004 and 2006
• Change in MVPA
measured by accelerometer in 4-6 complete consecutive days in 2001, 2004, and 2006
• Active commuting increased over follow-up in both boys and girls.
• In crude analyses, total length of walking tracks was positively associated with change in active commuting in girls (β=0.0016; P=0.015) but not boys.
Age 13-15 y: • Active commuting tended to decrease over
follow-up in both boys and girls. • Total length of walking tracks was
positively associated with change in active commuting in girls (β=0.0016; P=0.002).
• Intersection density was positively associated with change in active commuting among boys (β =0.03; P=0.030).
Hume et al, 2009363
Observational, prospective, 2004-2006 Children Living in Active Neighborhoods Study
Children (age 8-9 y, N=121) and adolescents (age 13-15 y, N=188) from 19 government primary schools in high-(n=10) and low- (n=9)SES neighborhoods ofMelbourne, Australia
Parents’ self-reported satisfaction with neighborhood characteristics, including number of pedestrian crossings (strongly agree/agree=1; others=0)
Change in frequency of parent-reported (children age 8-9 y) or self-reported (children 13-15 y) walking or cycling to/from school between 2004 and 2006 dichotomized into 2 groups (increased, not changed)
After adjusting for gender, maternal education, and clustering of children by school: • Parents’ satisfaction with the number of
pedestrian crossings was associated with increased frequency of active commuting to school over 2 y (OR=2.4; 95% CI:1.1-5.4; P=0.03).
Adults (Outcome: Physical Activity)
Author, y
Design and Number of Studies
Population
Exposure
Outcome
Findings
Feng et al, 2010351
Systematic review, including 5 reviews on the exposure of interest in this section
Adults Street design (street connectivity)
Physical activity
Street design:
• On the basis of a review by Frank and Engelke (2003), it was concluded that street networks are associated with mode of transportation.
• On the basis of a review by Saelens et al (2003) and a review by Sallis et al (2004), it was concluded that street connectivity is associated with ease of active travel between places.
• On the basis of 3 reviews by Saelens et al (2003), Frank et al (2004), and Ewing and Cervero (2001), it was concluded that street connectivity is positively associated with active transport by reducing trip distance and providing alternate routes.
Frost et al, 2010337
Systematic review of studies published
Adults (age ≥18 y) in rural areas
Pedestrian infrastructure (availability of
Physical activity
Pedestrian infrastructure:
Of 7 studies, 3 studies found significant positive association between presence of

between 1994 and 2008, including 7 studies on the exposure of interest in this section
sidewalk, shoulder, and walking trail)
sidewalks and physical activity, 1 found positive association between presence of shoulders on streets and physical activity, and 1 found positive association between presence of walking trails and physical activity. • Deshpande et al (2005) studied the association between neighborhood
sidewalks and walking among 274 adults with diabetes in rural areas from 12 communities in Missouri, Tennessee, and Arkansas. After adjustment for BMI, health status, and physical impairment, no significant association was found between presence of sidewalks and physical activity (OR=1.28; 95% CI, 0.71-2.29), but positive association was seen between presence of shoulders on streets and physical activity (OR=2.4; 95% CI, 1.3-4.5).
• Eyler (2003) found no association between perceived presence of sidewalks and meeting recommendations for physical activity among white women age 20-50 y in rural areas of Missouri and Illinois (OR=0.99; 95% CI, 0.97-1.01).
• Among 1194 adults in rural areas of a southeast county, Addy et al (2004) found positive association between perceived presence of sidewalks and occasional walking (OR=2.23; 95% CI, 1.27-3.92) but not regular walking (OR=1.39; 95% CI, 0.77-2.51).
• Parks et al (2003) studied the association between perceived presence of walking trails and meeting the recommendations for physical activity among 1818 adults in a nationally representative sample of US rural areas. After adjustment for age, race, education, and gender, a positive association was seen in lower-income urban participants (OR=1.89; 95% CI, 1.06-3.41) but not rural or higher-income urban participants.
• Among 1148 adults from a southeastern US rural community, Reed et al (2006) found positive association between perceived presence of sidewalks and meeting recommended physical activity levels (OR=3.59; 95% CI, 1.05-12.24) only among white participants.
• Sanderson et al (2003) studied the relation between perceived presence of sidewalks and physical activity among 567 adults from rural areas of Alabama. After adjustment for age, marital status, education, number of children, annual income level, employment status, and general health, no significant association was found between presence of sidewalks and meeting recommendations for physical activity (OR=1.28; 95% CI, 0.82-2.01).
• Among 102 black and white women age ≥50 y in rural areas of South Carolina, Wilcox et al (2003) found an inverse association between perceived absence of sidewalks and physical activity (β=−0.21, P<02).
Committee on Environmental Health, American Academy of Pediatrics, 2009361
Systematic review, including 2 studies that evaluated the exposure of interest in this section
Adults Pedestrian infrastructure (sidewalk availability and conditions)
Physical activity
Pedestrian infrastructure:
Of 2 studies, 1 found positive association between availability of sidewalks and physical activity and 1 between sidewalk conditions and physical activity. • Giles-Corti studied 1803 Australian adults age 18-59 y stratified by SES.
After adjustment for age and sex, participants from lower-SES areas were more likely to feel there was availability of sidewalks in their neighborhood (OR=1.88; 95% CI, 1.31-2.71; P=0.001). After adjustment for age, sex, number of children age <18 y at home, education, household income, and

work status, sidewalk availability was positively associated with walking for transport (OR=1.65; 95% CI, 1.12-2.41; P=0.011), trend toward walking for recreation (OR=1.41; 95% CI, 0.99-2.03; P=0.058), and meeting recommended levels of walking (OR=1.65; 95% CI, 0.95-2.87; P=0.077). In similar analyses, presence of sidewalks was positively associated with both performing vigorous exercise (OR=1.52; 95% CI, 1.05-2.21; P=0.027) and meeting recommended levels of vigorous exercise (OR=2.73; 95% CI, 1.39-5.37; P=0.003).
• Hoehner et al (2005) studied perceived availability of sidewalks and objective measures of sidewalk conditions and physical activity among 1068 adult residents of a low-walkable city (St Louis, Missouri) and high-walkable city (Savannah, Georgia). More than 90% of participants strongly agreed or agreed with the presence of sidewalks on most streets in their community. No association was found between sidewalk availability and meeting the recommendations for transportation activity (OR=0.9; 95% CI, 0.4-1.7) or recreational activity (OR=0.9; 95% CI, 0.5-1.7). Sidewalk levelness (percent of street segments with sidewalks with little or no unevenness) was inversely associated with meeting recommendations for transportation activity (OR=0.5; 95% CI, 0.3-0.8) but not recreational activity (OR=0.8; 95% CI, 0.6-1.2).
Lovasi et al, 2009334
Systematic review of 45 US studies (sample size >100) published between January 1995 and January 2009, including 2 studies on exposure of interest in this section
Adults Pedestrian infrastructure (availability of sidewalks and walking trails)
Physical activity
Pedestrian infrastructure:
Of 2 studies, 1 found positive association between presence of walking/bicycling trail and physical activity. • King et al (2000) evaluated presence of sidewalks and inactivity in a
nationally representative US sample of 2912 women age ≥40 y from different racial/ethnic groups. After adjustment for age, race, employment, marital status, location, education, neighborhood, personal barriers characteristics, physical health, and preference for home-based exercise, no significant association was found between presence of sidewalks and being inactive (OR=1.08; 95% CI, 0.87-1.34).
• Among 1194 low- and high-SES residents of a rural southeastern US county, Wilson et al (2004) evaluated self-reported and objectively assessed sidewalk availability and walking. Objective data showed similar rates of sidewalk availability in low- vs high-SES areas, although low-SES participants perceived lower availability. Sidewalk availability was not significantly related to walking in either group. Low-SES residents had less access to objectively assessed walking and bicycling trails (3.2 vs 59.2 km). After adjustment for age, sex, race, education, and BMI, compared with not having access, those who both had access and used walking/bicycling trails were more likely to meet physical activity guidelines among low-SES (OR=2.81; 95% CI, 1.38-7.93; P=0.05) but not high-SES participants. Access alone, without use, was not associated with meeting physical activity guidelines (OR=1.17; 95% CI, 0.53-2.55).

Casagrande et al, 2009357
Systematic review of minority studies (population ≥90% black) published before August 2007, including 6 studies on the exposure of interest in this section
Black adults (age ≥18 y)
Pedestrian infrastructure (sidewalk availability)
Physical activity
Pedestrian infrastructure:
Of 6 studies, 2 found positive association between presence of sidewalks and physical activity. • King et al (2000): See above. • Eyler (2003): See above. • Wilcox et al (2003): See above. • Sanderson et al (2003): See above. • Ainsworth et al (2003) studied perceived presence of sidewalks and meeting
recommendations for physical activity among 917 black women age 20-50 y in South Carolina. Most (77.2%) women reported no sidewalks in their neighborhood. After adjustment for education and county of residence, sidewalk availability was positively associated with meeting recommendations (OR=1.57; 95% CI, 1.14-2.17).
• Young et al (2003) studied perceived presence of sidewalks and meeting recommendations for physical activity among 234 black women age 20-50 y in Baltimore, Maryland. Most (94%) women reported availability of sidewalks in their neighborhood. No significant association was seen between sidewalk availability and meeting recommendations for physical activity (OR=0.30; 95% CI, 0.04-2.32).
Saelens and Handy, 2008359
Systematic review of 13 reviews published between 2002 and 2006 and 29 original studies published between 2005 and 2006, including 6 reviews and 10 original studies on the exposure of interest in this section
Children and adults
Pedestrian infrastructure (sidewalk availability) and street design (street connectivity)
Walking Pedestrian infrastructure:
• On the basis of 4 reviews by Handy (2005), Heath et al (2006), McCormack et al (2004), and McMillan (2005), the authors concluded that presence of sidewalks is associated with walking.
• Of 8 studies, 2 found positive association between pedestrian infrastructure and walking for transportation.
• Of 6 studies, 4 found positive association between pedestrian infrastructure and walking for recreation.
• Of 4 studies, 2 found positive association between pedestrian infrastructure and walking in general.
Street design: • On the basis of 2 reviews by Badland and Schofield (2005) and Saelens et al
(2003), the authors concluded that street connectivity is associated with walking.
• Of 7 studies, 3 found positive association between street connectivity and walking for transportation.
• Of 4 studies, none found positive association between street connectivity and walking for recreation.
• Of 6 studies, 3 found positive association between street connectivity and walking in general.
Bauman and Bull, 2007338
Systematic review of reviews published
Adults Pedestrian infrastructure (sidewalk
Physical activity or walking
Pedestrian infrastructure:
Of 6 reviews, 3 found significant positive association between sidewalk

between 2002 and 2007, including 6 reviews about the exposure of interest in this section
availability) and street design (street connectivity)
availability and physical activity, and 3 found positive association between sidewalk availability and walking. • A review by Trost et al (2002) did not find sufficient evidence to conclude
that sidewalk availability is associated with physical activity levels. • A meta-analysis by Duncan et al (2005) showed presence of sidewalks was
positively associated with physical activity (see below). • A systematic review by Humpel et al (2002) concluded that presence of safe
sidewalks was positively associated with physical activity. • A systematic review by McCormack et al (2005) concluded that sidewalk
safety was positively associated with physical activity and walking for recreation.
• A systematic review by Owen et al (2004) found significant positive association between presence of sidewalks and walking for transport.
• A review by Wendel Vos Droomers et al (2005) concluded that presence of sidewalks was positively associated with walking.
Street design: Three studies found positive association between street connectivity and physical activity. One study found positive association between street connectivity and walking. • Badland and Schofield (2005) found positive association between street
connectivity and the number of intersections and physical activity. • Vojnovic (2006) found positive association between street connectivity and
physical activity. • Wendel Vos et al (2005) found positive association between street
connectivity and active commuting. • McCormack et al (2004) found positive association between street
connectivity and physical activity and walking.
Duncan et al, 2005340
Meta-analysis of 16 studies published between January 1989 and February 2005. The number of studies that evaluated the exposure of interest in this section was not reported.
Adults Pedestrian infrastructure (sidewalk availability)
Physical activity
Pedestrian infrastructure:
• After adjustment for age, income, and education, the perceived presence of sidewalks was positively associated with physical activity (OR=1.29; 95% CI, 1.17-1.41). The presence of sidewalks explained 6% of physical activity variance.
Adults (Outcome: Obesity) Author, y
Design and Number of Studies
Population
Exposure
Outcome
Findings

Frost et al, 2010337
Systematic review of studies published between 1994 and 2008, including 1 on the exposure of interest in this section
Adults (age ≥18 y) in rural areas
Pedestrian infrastructure (sidewalk availability)
Obesity Pedestrian infrastructure:
• Boehmer et al (2006) studied the association between perceived presence of sidewalks and obesity among 2210 adults in rural areas from 13 counties in Missouri, Tennessee, and Arkansas. After adjustment for gender, age, and education, no significant association was found between sidewalk availability and obesity (OR=1.19; 95% CI, 0.95-1.48).
Lovasi et al, 2009334
Systematic review of 45 US studies (sample size >100) published between January 1995 and January 2009, including 2 studies on the exposure of interest in this section
Adults Pedestrian infrastructure (sidewalk availability and conditions)
Obesity Pedestrian infrastructure:
Of 2 studies, 1 found significant inverse association between sidewalk availability and obesity. • Boehmer et al (2006): See above. • Boehmer et al (2007) evaluated perceived presence and observed conditions
of sidewalks and obesity among 1032 adult urban residents of high- and low-income areas of Savannah, Georgia, and St Louis, Missouri. After adjustment for age, gender, education, and other environmental variables, people who strongly disagreed that “there are sidewalks on most of the streets in my community” had significantly greater odds of obesity compared with those who agreed with this statement (OR=2.2; 95% CI, 1.1-4.3). Poor condition of sidewalks was also positively associated with obesity (OR=2.1; 95% CI, 1.3-3.6). This association was stronger among lower-income participants.
Papas et al, 2007349
Review of 20 studies, including 3 studies on the exposure of interest in this section
Adults Pedestrian infrastructure (sidewalk availability) and street design (street connectivity)
Direct measures of body weight (eg, BMI)
Pedestrian infrastructure:
Of 2 studies, 1 found inverse association between sidewalk availability and odds of overweight. • Giles-Corti et al (2003) evaluated sidewalk availability and obesity among
1803 Australian adults age 18-59 y. After adjustment for age, gender, education, occupation, SES, smoking status, time spent watching TV, leisure-time physical activity, physical activity level compared with peers, and other environmental variables, living on a street with no sidewalks or sidewalks on only 1 side of the street was positively associated with overweight (OR=1.35; 95% CI, 1.03-1.78). A nonsignificant trend was seen between sidewalk availability and obesity (OR=1.62; 95% CI, 0.98-2.68).
• Rutt and Coleman (2005) did not find significant association between sidewalk availability and BMI among 996 Hispanic adults in Texas.
Street design: • In a study of 10,878 US adults age 18-100 y, Frank et al (2004) did not find
significant association between the number of intersections within a 1-km radius of home and obesity.
Booth et al, 2005367
Narrative review of 9 studies, including 1 on the exposure of
Adults Pedestrian infrastructure (sidewalk availability)
Overweight/obesity
Pedestrian infrastructure:
• Giles-Corti et al (2003): See above.

IOM indicates Institute of Medicine; SR2S, Safe Routes to School; OR, odds ratio; CI, confidence interval; GIS, geographical information systems; MVPA, moderate to vigorous physical activity; SES, socioeconomic status; BMI, body mass index; and CARDIA, Coronary Artery Risk Development in Young Adults. *Given the array of smaller, cross-sectional, observational studies that were already captured in the published narrative and systematic reviews identified here, in the writing group’s additional systematic searches for original articles published after 2007, performed by means of PubMed searches, evaluation of related articles, and hand searches of reference lists, the writing group focused on those additional studies that were randomized trials, quasi-experimental studies, longitudinal studies, or large (N>5000) cross-sectional studies.
interest in this section
Additional Original Articles 2007-2010 (Adults)* Author, y Design and
Duration Population Intervention/Expos
ure Outcomes Findings
Cleland et al, 2008364
Observational, prospective, 2004-2006
N=357 mothers of children in the Children Living in Active Neighborhoods study in Melbourne, Australia
Self-reported characteristics of neighborhood, including infrastructure
Self-reported time spent on walking for leisure (low: <90 min per week; high ≥90 min per week) or for transport (low:<30 min per week; high ≥90 min per week) in the local neighborhood
• After adjustment for highest level of schooling and corresponding baseline walking variables, no significant association was found between sidewalk availability and walking for leisure or transport.
Hou et al, 2010365
Observational, prospective, 1985-1986 to 2000-2001
N=5115 young US adults in the CARDIA cohort
Time-varying street network data within 1 km of home, derived from GIS
Self-reported walking, bicycling, and jogging
After adjustment for time-varying individual-level and census-level covariates: • Neighborhood street density was positively
associated with walking, bicycling, and jogging in low-urbanicity areas.
• In middle- and high-urbanicity areas, street density had no relation to activity in men and was inversely associated with activity in women.
Fitzhugh et al, 2010366
Quasi-experimental, 2005-2007
Residents of 3 neighborhoods in Knoxville, Tennessee (1 intervention and 2 control neighborhoods)
Construction of an urban greenway/trail in a neighborhood that lacked connectivity of the residential pedestrian infrastructure to nonresidential destinations
2-h counts of directly observed (1) total physical activity in the general neighborhood and (2) active commuting to school
• At follow-up, total physical activity was significantly higher in the intervention neighborhood (P=0.028).
• During follow-up, total physical activity significantly increased in the intervention neighborhood (median difference=+8.5; P<0.001) and decreased in control neighborhoods (median difference=−1; P<0.001).
• Active transport to school was not significantly changed in either intervention or control neighborhoods.

Supplementary Table 10d. Local Environmental Change to Improve Physical Activity (Community Settings)
Neighborhood Safety and Crime
Safety and Physical Activity in Children and Adolescents (Reviews)
Author, y
Design and Number of Studies
Population
Exposure
Outcome
Findings
Galvez et al, 2010355
Systematic review of articles published between January 2008 and August 2009, including 8 articles about the exposure-outcome relation in this section
Children or adolescents age ≤18 y
Safety: overall, traffic-related, crime-related
Physical activity
Overall safety:
• Five studies found positive association between parental perception of safety and children’s physical activity. Wen et al found that parental perception of neighborhood safety was positively associated with time spent playing outdoors in children age 10-12 y (P=0.06). Veugelers et al found positive association between parental perception of neighborhood safety and playing sports without a coach (OR=1.23; 95% CI, 1.04-1.46). Beets et al found parental perception of a neighborhood's safety for children to play outside fully mediated the effect of neighborhood quality on parental reports of children's activity. Carver et al found positive association between parental perceptions of safety and adolescent boys' physical activity after school. They found no associations between parental perceptions of neighborhood safety and children's physical activity outside school hours. Kerr et al found that perceived safety was positively associated with use of indoor exercise equipment in girls age 11-15 y.
Traffic safety: • Two studies found significant association between subjective measures of road
safety and physical activity. Rosenberg et al found positive association between parental perception of road safety and parental reports of children’s (age 5-11 y) activity in parks (P=0.047). They also found positive association between adolescents’ perception of road safety and walking to a park (P=0.003). Carver et al found inverse association between self-reported concerns about road safety and physical activity during evenings and outside school hours among adolescent girls.
Crime safety: • Among 3 studies that evaluated neighborhood crime, 1 found significant inverse
association with walking, 1 found significant positive association with sedentary behaviors, and 1 found no association. Rosenberg et al found an inverse association between adolescents’ concerns over crime safety and walking to shops (P=0.03). Brown et al found positive association between sex offenders per capita (IRR=2.35; 95% CI, 1.27, 4.34) and burglaries per 100 capita (IRR=1.25; 95% CI, 1.05, 1.47) in the school area and playing video games among boys. Also, they found positive association between burglaries (IRR=1.19; 95% CI, 1.038, 1.356) and larcenies (IRR=1.05; 95% CI, 1.00,

1.10) in the school area and hours of television watching among the girls. Martin and McCaughtry did not find any significant association between self-reported crime attributes of the neighborhood (eg, crime, litter, gangs) and physical activity among black children.
IOM Committee on Childhood Obesity Prevention Actions for Local Governments, 2009147
Systematic review, including 2 reviews, 2 longitudinal studies, and 1 cross-sectional study on the exposure-outcome relation in this section
Children or adolescents
Safety (overall, crime)
Physical activity
Overall safety:
• On the basis of a review by Carver et al368 (see below), a longitudinal study by Cleland et al364, and a cross-sectional study by Weir et al,369 the committee concluded that perceived safety significantly affects walking in both children and adults.
Crime safety: • On the basis of a review by Ferreira et al344 and a longitudinal study by Gordon-
Larsen et al,370 the committee concluded that safety from crime was associated with physical activity.
Carver et al, 2008368
Narrative review, including 11 studies about the exposure-outcome relation in this section
Children or adolescents (United States, Australia, New Zealand, United Kingdom, and Europe)
Safety (traffic, crime)
Physical activity
Traffic safety (perceived measures):
• On the basis of the descriptive findings of 6 studies, road safety is a common concern among both parents and children. Three studies found significant inverse association between parental concerns about road safety and children’s physical activity. Among 2 studies on the relation between adolescents’ perceptions of road safety and physical activity, 1 reported positive association and 1 reported no association. Also, 1 study compared perceptions of parents and their children and found that children age 10-12 y were less concerned about road safety than their parents were. However, parental perception of road safety was a stronger predictor of children’s walking and cycling in the neighborhood.
Traffic safety (objective measures): • A study that used objective measure of road safety found significant inverse
association between GIS-derived need to cross a busy road on the most direct route to school and walking or cycling to school among children age 5-6 y and 10-12 y.
Crime safety (perceived measures): • On the basis of the descriptive findings of 3 studies, harm from strangers is a
common concern among parents. For instance, 1 study reported 88% of parents of 5–6-y-olds and 81% of parents of 10–12-y-olds reported stranger danger as a concern. However, the only study on the relation between parental perception of stranger danger and physical activity did not find any significant association, which the authors thought could relate to high prevalence of the concern. Another study found no associations between adolescents’ perception of stranger danger and walking or cycling in their neighborhood.
Crime safety (objective measures): • Most studies reviewed used a subjective measures of crime safety. However, 2
studies that used objective measures reported significant associations. A study of Mexican-American adolescents found significant inverse association

between the number of violent crimes committed within a radius of 0.8 km of home during the past year and outdoor physical activity, although only among girls. Another study, after adjusting for SES, sex, age, BMI, and ethnicity, found that objectively measured social disorder was inversely associated with time spent on recreational physical activity among children and adolescents age 11-16 y. However, this study did not find a significant association between physical disorder (eg, wrecked vehicles) and physical activity.
Panter et al, 2008354
Systematic review of 24 studies published between 2002 and 2007, including 13 studies about the exposure-outcome relation in this section
Children (age 5-11 y) or adolescents (age 12-18 y) in the United States, Australia, and Europe
Safety (traffic, crime)
Walking or cycling to school or other local destinations
Traffic safety:
• All 5 studies that evaluated the relation between road safety and active travel reported significant association; however, the characteristics of the road evaluated in the studies were to some extent different. For example, 1 study found significant inverse association between parental reports of no lights or crossings in the neighborhood and parental perception that children had to cross busy roads to get to school and active travel to school. Another study found significant positive association between self-perception of safety and walking among the girls. This study found inverse association between parental concerns about traffic and walking or cycling among the boys. Another study found inverse association between unsafe roads and walking regardless of the child’s or parents’ perception of safety.
Crime safety: • Among the 8 studies on the relation between parental perception of personal
safety and active commuting, 3 reported significant inverse association. For instance, 1 study371 found lower parental concern of safety was associated with 5.2 higher odds of active commuting to school (OR=5.2; 95% CI, 2.71-9.96). However, 5 other studies did not find any significant association between parental concerns about personal safety (eg, stranger danger) and walking or cycling among children and adolescents.
Davison et al, 2008353
Systematic review of studies published before June 2007, including 8 studies on the exposure-outcome relation in this section
Children or adolescents (age <18 y)
Safety (traffic, crime)
Active commuting
Traffic safety: • Among the 4 studies on the relation between perceived traffic safety and
mode of transport to school, only 1 study found significant inverse association between parental concerns about traffic safety and active commuting to school.
Crime safety: • Among the 4 studies on the relation between concerns about crime or
strangers and children’s mode of transport, only 1 study found significant positive association between parental perception of safe neighborhood and active commuting to school.
• On the basis of the finding of the studies on the exposure-outcome relation in this section and studies about other environmental characteristics, the authors concluded that parental perception of environmental attributes is a stronger predictor of children’s active commuting compared with objectively measured characteristics.
Ferreira et al, Systematic review Children and Safety (crime) Physical Crime safety:

2007344 of 150 studies published from January 1980 to December 2004, including 3 cross-sectional studies on the exposure-outcome relation in this section
adolescents (age ≤18 y)
activity • Among the studies on the relation between crime incidence (measured objectively) and adolescents’ physical activity, 2 found significant inverse association. This finding was at odds with the lack of association between adolescents’ physical activity and the neighborhood safety estimates they perceived.
• Although a wide range of potential correlates at the physical, sociocultural, and economical levels were identified in this study, only a few were examined in >3 independent samples.
Davison and Lawson, 2006343
Systematic review of 33 studies, including 12 studies on the exposure-outcome relation in this section
Children or adolescents age <18 y
Safety (traffic, crime)
Physical activity
Crime safety: • Among 9 studies that examined the association between perceived safety and
children's physical activity, 7 found no association. Only studies by Molnar et al and Gomez et al found significant association.
Traffic safety: • All 3 studies that examined the relation between road safety and physical
activity reported an inverse association. Timperio et al reported that parental perception that their children had to cross many roads to get to a play area was associated with significantly lower rates of walking and cycling among children. Also, in a second study, Timperio et al, using the same sample but using an objective assessment of the environment, found that the presence of a busy road barrier was associated with lower rates of active commuting to school among children age 5-6 y and 10-12 y. Also, Carver et al reported that parental concerns about traffic were associated with lower rates of walking or cycling among girls and boys.
Safety and Obesity Among Children and Adolescents (Reviews)
Dunton et al, 2009350
Systematic review, including 15 studies (14 cross-sectional), with a few studies on the exposure-outcome relation in this section
Children and adolescents
Physical environment characteristics
BMI • Positive associations with obesity outcomes were found for number of neighborhood hazards (low-SES areas) and parental perceptions of heavy traffic (older children).
Galvez et al, 2010355
Systematic review of articles published between January 2008 and August 2009, including 8 articles on the exposure-outcome relation of interest in this section
Children and adolescents age ≤18 y
Safety (overall, crime, traffic, physical disorder)
Obesity • Among 3 studies evaluating parental perception of safety, 2 found significant association with healthy weight among 5th grade girls and children age ≥11 y, and 1 reported no association.
• Among 2 studies that examined adolescents’ perception of safety and BMI, 1 found an inverse association only in racial groups other than blacks and whites (a combined group of Hispanics, Asians, American Indians, and other racial groups).
• Among 3 studies that evaluated neighborhood conditions or physical disorder, 1 found positive association, 1 found inverse association, and 1 found no association.
• In 2 studies, there was no associations between crime and obesity.

• The findings from 1 longitudinal study suggested TV as a mediator of the relation between neighborhood safety and obesity.
Carter and Dubois, 2010356
Systematic review of 27 studies published between 1999 and 2009, including 7 studies on the exposure-outcome relation in this section
Children and adolescents (age 2-18 y) living in the United States, Canada, Australia, United Kingdom, and Germany
Safety Adiposity (skin-fold thickness, BMI, percentage of lean body mass, etc)
• Among the 7 studies that examined the relation between neighborhood safety and child adiposity, only 1 found significant relation and only in 1 age group. Timperio et al (2004) evaluated the relation between parental and children’s perceptions of neighborhood environment and overweight and obesity among 291 children age 5-6 y and 919 children age 10-12 y in Melbourne, Australia. After adjustment for gender, family SES, school area SES, and number of cars owned adjusted for clustering by school, parents’ perception of heavy traffic in local streets was associated with overweight or obesity among children age 10-12 y (OR=1.4; 95% CI, 1.0-1.8). Also, among children of this age group, parents’ perception of lack of road safety in the neighborhood was associated with obesity (OR=3.9; 95% CI, 1.0-15.2).
Safety and Physical Activity Among Children and Adolescents (Original Articles)*
Author, y Design, Duration Population Intervention/Exposure Outcome Major Findings
Boone-Heinonen et al, 2010346
Observational, prospective, 1994-1995 to 2001-2002
N=12,701 US adolescents, grades 7-12 at baseline, in the nationally representative National Longitudinal Study of Adolescent Health
Neighborhood land-cover diversity, street connectivity, physical activity facilities, and crime rate derived from GIS
Bouts of MVPA In longitudinal analyses, after adjustment for measured covariates and within-person time-invariant factors: • Higher crime rates were associated with
significantly lower MVPA. See Supplementary Tables 10a, 10b, and 10c for findings on physical activity facilities, land-cover diversity, and street connectivity, respectively.
Carver et al, 2010362
Observational, prospective, 2001- 2006
Children (age 8-9 y; N=170) and adolescents (age 13-15 y; N=276) from 19 government primary schools in high- (n=10) and low- (n=9) SES neighborhoods of Melbourne, Australia (Children Living in Active Neighborhoods Study)
Objectively measured neighborhood characteristics in 800-m radius around home: • Total length of local
roads and unsealed (unpaved) roads suitable for vehicles (GIS derived)
• Local road index calculated by dividing total length of all local roads and unsealed (unpaved) roads suitable for vehicles by total length of all roads in the neighborhood (GIS derived)
• Total numbers of speed
Change in frequency of parent-reported (for children age 8-9 y) or self-reported (adolescents age 13-15 y) walking or cycling to/from 15 neighborhood destinations between 2004 and 2006 Change in MVPA measured by accelerometer in 4-6 complete consecutive days in 2001, 2004, and 2006
Age group 8-9 y: • Number of traffic/pedestrian lights and total
length of walking paths were positively associated with changes in active transport among girls (β=0.45, P=0.004 and β=0.0016, P=0.015, respectively).Slow points were associated with change in physical activity before school (β=1.55, P=0.021) among boys.
Age group 13-15 y: • Among boys, speed bumps were positively
associated with change in physical activity after school (β=0.23, P=0.015).
• Among girls, total length of local roads (β=0.49, P=0.005), intersection density (β=0.05, P=0.036), and number of speed bumps (β=0.33, P= 0.020) were associated with change in physical activity during nonschool hours.

bumps, gates/barriers on roads, slow points or sections of road narrowing, and traffic/pedestrian lights (obtained from street directory data)
• Among boys, intersection density was positively associated with change in active transport (β=0.03, P=0.030).
• Among girls, total length of walking paths was positively associated with change in active transport (β=0.0016, P=0.002).
Crawford et al, 2010372
Observational, prospective, 2001-2006
Children (age 10-12 y at baseline; N=301) from 19 government primary schools in high- (n=10) and low- (n=9) SES neighborhoods of Melbourne, Australia (Children Living in Active Neighborhoods Study)
Objectively measured characteristics of neighborhood (a radius of 2 km around home) in 2004 and 2006, including: • Number of accessible
public open spaces • Number of public open
sports venues • Total length of walking
and cycling tracks • Distance to school • Number of intersections
and cul-de-sacs • Total length of “access”
paths • Total length of “busy”
roads and “local” roads Also assessed, parental perceptions of local environment in 2001, 2004, 2006, including perception of heavy traffic, road safety lights/crossings, sporting venues, and public transport
Change in MVPA measured by accelerometer in 4-6 complete consecutive days in 2001, 2004, and 2006 Change in BMI z score from objectively measured height and weight in 2001, 2004, and 2006
• After adjustment for age and clustering by school, baseline BMI, and other covariates significantly associated with outcome, no significant associations were seen between these neighborhood factors and 5-y changes in physical activity or BMI z score.
Hume et al, 2009363
Observational, prospective, 2004-2006
Children (age 8-9 y in 2004; N=121) and adolescents (age 13-15 y in 2004; N=188) from 19 government primary schools in high- (n=10) and low- (n=9) SES neighborhoods of Melbourne, Australia (Children Living in Active Neighborhoods
• Parent-reported concerns over heavy traffic, stranger danger, road safety, and traffic lights or pedestrian crossings in area of residence
• 6-point Likert-type responses were dichotomized to strongly agree/agree (=1) vs others (=0).
Change in frequency of parent-reported (for children age 5-6 y) or self-reported (children age 10-12 y) walking or cycling to/from school between 2004 and 2006, dichotomized into 2 groups (increased, not changed)
After adjusting for gender, SES, and clustering by school: • Parental perception of no traffic lights or
pedestrian crossings for child use was associated with lower frequency of increased active commuting to school: over 2 y, OR=0.4; 95% CI, 0.2, 0.8; P=0.01.
• No significant associations were seen between parental concerns about heavy traffic, stranger danger, or road safety and outcome (OR or P value not reported).

Study)
Safety and Physical Activity Among Adults (Reviews)
Author, y Design and Number of Studies
Population Exposure Outcome Findings
Duncan et al, 2005340
Meta-analysis, 16 studies published between January 1989 and February 2005. The number of studies on the exposure-outcome relation in this section was not reported.
Adults Various environmental characteristics
Physical activity as a binary factor, eg, any walking, sufficient walking, sufficient leisure-time activity
• In crude (unadjusted) analyses, no variables demonstrated a significant association with physical activity.
• After adjustment for age, income, and education level, absence of heavy traffic as a problem was positively associated with physical activity (OR=1.22; 95% CI, 1.08, 1.37).
Ferreira et al, 2007344
Systematic review of 150 studies published from January 1980 to December 2004, mostly cross-sectional, including several on the exposure-outcome relation in this section
Youth Environment characteristics
Physical activity
• Although a wide range of potential correlates at the physical, sociocultural and economic level was identified in this study, only a few were examined in > 3independent samples.
• Within the sociocultural environment, crime incidence (measured objectively) was inversely associated with adolescents’ physical activity in 2 of 3 studies available, a finding that was at odds with the lack of association between adolescents’ physical activity and neighborhood safety estimates they perceived.
Foster et al, and Giles-Corti 2008373
Systematic review of 41 quantitative studies published before July 2007 on the exposure-outcome relation in this section
Adults Neighborhood safety (traffic, crime)
Physical activity
• Among the 11 studies that examined the effect of perceived neighborhood safety (traffic, crime) and physical activity exclusively among women, 4 found significant positive association between feeling safe and physical activity.
• Among 25 studies on the subjective measure of safety (traffic, crime) in both women and men, 20 studies found significant positive association between perception of safety and physical activity.
• Among 7 studies on the objective measure of safety in both women and men, 5 studies found significant positive association between safety and physical activity.
• Among 6 studies on perceived safety in older adults (age >50 y), 5 studies found significant positive association between perception of safety and physical activity.
Saelens and Handy, 2008359
Systematic review of 13 reviews
Children and adults
Safety (traffic, crime)
Walking • All 4 reviews concluded that significant associations exist between attributes of safety and walking.

OR indicates odds ratio; CI, confidence interval; IRR, incidence rate ratio; IOM, Institute of Medicine; GIS, geographical information systems; SES, socioeconomic status; BMI, body mass index; and MVPA, moderate to vigorous physical activity. *Given the array of smaller, cross-sectional, observational studies that were already captured in the published narrative and systematic reviews identified here, in the writing group’s additional systematic searches for original articles published after 2007, performed by means of PubMed searches, evaluation of related articles, and hand searches of reference lists, the writing group focused on those additional studies that were randomized trials, quasi-experimental studies, longitudinal studies, or large (N>5000) cross-sectional studies.
published from 2002 and 2006 and 29 original studies published between 2005 and 2006, including 4 reviews and 15 original studies on the exposure-outcome relation in this section
• Traffic safety: Among 8 original studies that examined the relation between traffic and walking for transportation, 2 found inverse association. Among 6 studies the examined the relation between traffic and recreational walking, none found inverse association. Among 2 studies that examined the relation between traffic and walking in general, 1 found inverse association.
• Crime safety: Among 7 original studies that examined the relation between personal safety and walking for transportation, 3 found positive association. Among 5 studies that examined the relation between personal safety and recreational walking, 1 found positive association. Among 4 studies that examined the relation between personal safety and walking in general, 2 found positive association.
Frost et al, 2010337
Systematic review of studies published from 1994-2008, including 17 on the exposure-outcome relation in this section
Adults age ≥18 y in rural areas
Safety (traffic, crime)
Physical activity
• Traffic safety: Among 8 studies that evaluated traffic safety (perceived or objectively measured), 4 studies reported significant positive associations between light traffic or perceived safety from traffic and physical activity.
• Crime safety: Among 9 studies that evaluated crime safety (perceived or objectively measured), 4 reported significant association with physical activity and 2 reported significant association with walking.
McCormack et al, 2010374
Systematic review of studies published before 2009, including 19 studies on the exposure-outcome relation in this section
Children and adults
Safety (traffic, crime)
Park use or park-based physical activity
• All 19 studies found association with safety attributes and park use or park-related physical activity. Safety attributes were categorized into 2 major groups: safety from crime and safety from injury.
• Crime safety:
− 3 studies found positive association between the presence of lighting and park use.
− 4 studies found positive association between the presence of law enforcement and increased security and park use; however, 2 studies found inverse association between police presence and park use.
− 3 studies found an inverse association between the presence of the homeless in the park and park use.
• Safety from injury: − 3 studies found an inverse association between the presence of glass,
syringes, and debris and park use. − 3 studies found an inverse association between heavy traffic and park use.

Supplementary Table 10e. Local Environmental Change to Improve Physical Activity (Community Settings)
Aesthetic Conditions*
Children Author, y
Design and Number of Studies
Population
Exposure
Outcome
Findings
Carter and Dubois, 2010356
Systematic review of 27 studies published between 1999 and 2009, including 4 studies (3 cross-sectional, 1 prospective) on the exposure-outcome relation in this section
Children and adolescents (age 2-18 y) living in the United States, Canada, Australia, United Kingdom, or Germany
Aesthetics (enjoyable scenery, greenness, physical disorder)
Adiposity (skin-fold thickness, BMI, percentage of lean body mass, etc)
Of 4 studies, 2 found inverse association between greenness and adiposity; 1 found positive association between physical disorder and adiposity; and 1 did not identify significant association between enjoyable scenery and adiposity. Greenness: • Liu et al (2007) studied greenness and adiposity among 7334 children age
3-18 y who were visited for routine well-child care in a network of primary care clinics in Marion County, Indiana. Satellite imagery of the amount of plant life quantified NDVI within a 2-km circular buffer of each home. After adjustment for age, race, gender, and median neighborhood family income, NVDI was inversely associated with odds of obesity in children who lived in areas with high population density (OR=0.90; P<0.01) but not in areas with low population density (OR=1.13; P=0.31).
• In a prospective study, Bell et al (2008) evaluated 3831 children age 3-16 y who received well-child care from a clinic network in Marion County, Indiana. After adjustment for age, sex, race, health insurance status, and baseline weight, mean NDVI in a 1-km circular and network buffer around the home was inversely associated with BMI z score 2 y after the first visit (β=−0.06; 95% CI, −0.09, −0.02).
Physical disorder: • Among 2482 US children age 5-18 y, Grafova (2008) evaluated
neighborhood physical disorder (eg, garbage, broken glass on the streets) and obesity. After adjustment for age, gender, race, ethnicity, family wealth, income-to-needs ratio, mother's BMI, primary caregiver’s level of education, number of children in the household, sex of household head, mother's annual hours of work, and region, living in areas with no physical disorder was associated with lower odds of obesity (OR=0.5; 95% CI, 0.4-0.8).
Enjoyable scenery: • Evenson et al (2007) evaluated children’s perceptions of enjoyable
neighborhood scenery among 1554 US 6th grade girls. After adjustment for school, site, nonschool physical activity, neighborhood SES, percentage receiving a free or reduced-price lunch, and race, no association was observed with overweight (OR=0.9; 95% CI, 0.7-1.3).

Lovasi et al, 2009334
Systematic review of 45 US studies (sample size >100) published between January 1995 and January 2009, including 2 on the exposure-outcome relation in this section
US children of low SES, black race, or Hispanic ethnicity
Aesthetics (enjoyable scenery, greenness, physical disorder)
Physical activity/obesity
Of 2 studies, 1 found significant inverse association between greenness and adiposity in areas of high population density, and 1 did not identify significant association between physical disorder and adiposity. • Green space: Liu et al (2007): See above. • Physical disorder: Molnar et al evaluated objectively measured neighborhood
physical disorder and parent-reported recreational physical activity among 1378 boys and girls age 11-16 y in 80 neighborhood clusters in Chicago, Illinois. After adjustment for age, sex, race, BMI, family SES, and neighborhood education, no significant association was found between a composite score of neighborhood physical disorder and physical activity.
Panter et al, 2008354
Systematic review of 24 studies published between 2002 and 2007, including 4 cross-sectional studies on the exposure-outcome relation in this section
Children (age 5-11 y) or adolescents (age 12-18 y)
Aesthetics (general, enjoyable scenery, physical disorder, greenness)
Walking or cycling to school or other local destinations
Of 4 studies, 3 found significant associations. • General aesthetics: Among 259 parents of children age 5-18 y, after
adjustment for child age, gender, and parental education, Kerr et al (2006) found positive association between parental perception of neighborhood aesthetics and children’s actively commuting to school at least once per week (OR=2.5; 95% CI, 1.33-4.80).
• Enjoyable scenery: In a cross-sectional study of 480 US girls age 10-15 y, Evenson et al (2006) found significant positive association between presence of enjoyable scenery and physical activity level above the median (OR=1.91; 95% CI, 1.17-3.11). No significant association was seen with active commuting to school.
• Greenness: Evenson et al (2006) did not find any significant association between presence of trees and active commuting.
• Physical disorder: Evenson et al (2006) found inverse association between reporting bad smells in the neighborhood and walking or cycling to school (OR=0.43; 95% CI, 0.24-0.75). No association was seen between presence or absence of litter and active commuting.
Adults Frost et al, 2010337
Systematic review of studies published between 1994 and 2008, including 4 cross-sectional studies on the exposure-outcome relation in this section
Adults age ≥18 y in rural areas
Aesthetics (enjoyable scenery, greenness, physical disorder)
Physical activity/obesity
General aesthetics: 1 study found an association with physical activity. • Deshpande et al (2005) evaluated neighborhood aesthetic quality and
physical activity in 278 persons with diabetes. After adjustment for BMI, health status, and physical impairment, a positive association was seen between perception of the community as pleasant for physical activity and being regularly physically active (OR=2.27; 95% CI, 1.07-4.81).
Enjoyable scenery: Among 4 studies, 2 found associations with physical activity and 1 with obesity. • Wilcox et al (2000) found that after adjustment for age, race, education,
neighborhood characteristics, region, psychosocial factors, and health variables, presence of enjoyable scenery was associated with leisure-time physical activity among rural (OR=1.71; 95% CI, 1.16-2.53) but not urban (OR=1.29; 95% CI, 0.88-1.89) middle-aged women.
• Kirby et al (2007) found positive association between presence of enjoyable scenery and total minutes per week of walking (β=0.186; P<0.05) but not with overall physical activity or subtypes of strenuous,

moderate, or light physical activity. • Deshpande et al (2005) saw a trend between presence of enjoyable
scenery and being regularly physically active (OR=1.76; 95% CI, 0.96-3.21).
• After adjustment for age, gender, and education, Boehmer et al (2006) found that not having enjoyable community scenery was associated with obesity (OR=1.8; 95% CI, 1.3-2.6) among 2210 adults in rural Missouri, Tennessee, and Arkansas.
Greenness: 1 study found no association with physical activity. • Deshpande et al (2005) (see above) did not find significant association
between tree-lined streets and physical activity (OR=0.66; 95% CI, 0.26-1.70).
Physical disorder: Of 2 studies, neither found significant associations. • Deshpande et al (2005) (see above) found only nonsignificant trends
between being regularly physically active and living in a well-maintained community (OR=1.58; 95% CI, 0.78-3.22) or community free from garbage (OR=1.87; 95% CI, 0.90-3.91); sample size was small (N=278).
• After adjustment for age, gender, and education, Boehmer et al (2006) did not find significant association between living in a well-maintained community or a community free from garbage and odds of being obese in 2210 adults living in rural Missouri, Tennessee, and Arkansas.
Lovasi et al, 2009334
Systematic review of 45 US studies (sample size >100) published from January 1995 to January 2009, including 6 studies on the exposure-outcome relation in this section
US children or adults of low SES, black race, or Hispanic ethnicity
Aesthetics (enjoyable scenery, greenness, physical disorder)
Physical activity/obesity
Enjoyable scenery: Among 4 studies, 2 found association with physical activity and 1 with obesity; and 1 did not find any significant association with obesity. • Brownson et al (2001) evaluated perceived neighborhood aesthetics and
physical activity among 1818 US adults. After adjustment for age, sex, race, income, and education, presence of enjoyable scenery was positively associated with meeting recommendations for physical activity (OR=1.46; 95% CI, 1.13-1.88).
• King et al (2000) evaluated the influence of enjoyable scenery in a nationally representative sample of 2912 US women age ≥40 y from different racial/ethnic groups. After adjustment for age, race, employment, marital status, location, education, neighborhood, personal barriers characteristics, physical health, and preference for home-based exercise, absence of enjoyable scenery was associated with being physically inactive (<20 min activity) (OR=1.42; 95% CI, 1.12-1.79).
• Boehmer et al (2007) assessed perceived neighborhood aesthetics and obesity in 1032 urban residents of high- and low-income areas of Savannah, Georgia, and St Louis, Missouri. After adjustment for age, gender, education, and other environmental variables, people who strongly disagreed that “there are many interesting things to look at while walking in my neighborhood” had greater odds of obesity than those who strongly agreed with this statement (OR=2.6; 95% CI, 1.2-5.6).
• Boehmer et al (2006) (see above) found no significant association between enjoyable scenery and odds of obesity.
Physical disorder: Of 2 studies, 1 found positive association with obesity.

• Boehmer et al (2007) found significant positive association between observed physical disorders and obesity (OR=3.6; 95% CI, 1.8-7.2).
• Boehmer et al (2006): See above.
Humpel et al, 2002339
Review including 19 studies (18 cross-sectional, 1 longitudinal), including 3 cross-sectional studies on the exposure-outcome relation in this section.
Adults Perceived (16 studies) and objectively assessed (4 studies) local environment, including accessibility of facilities, safety, and aesthetics
Physical activity
Among variables pertaining to aesthetics, friendly neighborhood, attractive local area, pleasant scenery, and living environment were positively associated with physical activity: • Ball et al (2000) found perceived lower neighborhood attractiveness
associated with less walking for exercise (10+ min) in 3392 adults after adjustment for age, sex, and education (OR=0.57; 95% CI, 0.41-0.79).
• King et al (2000): See above. • Sallis et al (1997) found no significant relation of enjoyable scenery with
walking for exercise or strength/vigorous exercise in young adults, mean age 20.6 y, after adjustment for age, sex, race, and SES, but sample size was very small (N=110).
Adults and Children Sallis and Glanz, 200928
Narrative review, including 1 review on the exposure-outcome relation in this section
Children and adults
Aesthetics (general)
Physical activity
• On the basis of the finding of a systematic review of systematic reviews by Bauman and Bull (2007) (see below), the authors concluded that the aesthetic quality of a neighborhood was associated with physical activity.
Saelens and Handy, 2008359
Systematic review of 13 reviews published between 2002 and 2006 and 29 original studies published between 2005 and 2006, including 6 reviews and 9 original studies on the exposure-outcome relation in this section
Children and adults
Aesthetics (general)
Walking • On the basis of findings of 6 reviews, the authors concluded that aesthetic qualities were associated with walking.
• Of 9 original studies, 4 found positive associations: 1 of 5 studies for aesthetics and walking for transportation; 2 of 2 studies for aesthetics and recreational walking; and 1 of 2 studies for aesthetics and overall walking.
Bauman and Bull, 2007338
Systematic review of reviews published between 2002 and 2007, including 6 reviews on the exposure-outcome relation in this
Children and adults
Aesthetics (general)
Physical activity or walking
Of the 6 reviews, all focused on adults, and 5 concluded that the aesthetic quality of a neighborhood was associated with physical activity or walking. • A narrative review by Vojnovic (2006) found positive association
between aesthetics of environment and walking or cycling. • A narrative review by Badland and Schofield (2005) reported positive
association between aesthetic factors and nonmotorized transport use. • A systematic review by Wendel Vos et al (2005) did not find consistent
relation between aesthetics and walking.

BMI indicates body mass index; NDVI, normalized difference vegetation index; OR, odds ratio; CI, confidence interval; and SES, socioeconomic status. *Given the array of smaller, cross-sectional, observational studies that were already captured in the published narrative and systematic reviews identified here, in the writing group’s additional systematic searches for original articles published after 2007, performed by means of PubMed searches, evaluation of related articles, and hand searches of reference lists, the writing group focused on finding any additional studies that were randomized trials, quasi-experimental studies, longitudinal studies, or large (N>5000) cross-sectional studies. No such studies not already included here were identified.
section • A systematic review by Owen et al (2004) concluded that there was positive association between an aesthetically pleasant environment and walking.
• A narrative review by McCormack et al (2004) found positive relation between cleanliness, scenery, varied building designs, and greenery and physical activity.
• A systematic review by Humpel et al (2002) found positive association between perception of pleasant neighborhood and physical activity.

Supplementary Table 10f. Local Environmental Change to Improve Physical Activity (Community Settings)
Walkability (Composite Indicators)*
Children (Outcome: Physical Activity)
Author, y Design and Number of Studies
Population Exposure Outcome Findings
Feng et al, 2010351
Systematic review, including 2 studies on the exposure and outcome of interest in this section
Children/ adolescents
Walkability Physical activity
Of 2 studies, 1 found positive association between walkability and physical activity and 1 found positive association between walkability and active transport to school. • Kligerman et al (2007) evaluated a GIS-based walkability index and
accelerometer-measured physical activity among 98 white or Mexican-American adolescents (age 14-17 y) in San Diego County, California. Walkability was defined as the weighted sum of z scores for land-use mix, intersection density, residential density, and retail density. After adjustment for age and ethnicity, the walkability index up to a 0.8-km buffer around home was positively associated with physical activity (β=0.278; P=0.008).
• Kerr et al (2006) evaluated a GIS-based walkability index and parent-reported mode of transport to school among 259 children age 5-18 y in Seattle, Washington. The Frank et al (2005) method (see below) was used to calculate a walkability index for each block (subunit of census tract). After adjustment for child age, gender, and parental education and concerns, living in a neighborhood with a high walkability index was positively associated with active commuting to school (OR=1.9; 95% CI=1.04-3.59).
Brownson et al, 2009352
Systematic review, including 4 studies about the exposure of interest in this section
Children/ adolescents
Walkability Physical activity
Of 4 studies, 1 found association with physical activity, 1 with sedentary behaviors, and 1 with active commuting to school. • Kligerman et al (2007): See above. • Kerr et al (2006): See above. • Merchant et al (2007) evaluated walkability in 160 children from 2 public
elementary schools in Hamilton, Ontario, Canada. Walkability was assessed as the sum of the scores from questions in each domain of the NEWS questionnaire, including parental perceptions of population density, street connectivity, land-use mix, walking/cycling infrastructure, aesthetics, traffic safety, and crime safety. Children at the school with less walkability spent substantially more time watching TV (107 vs 6 min per day; P<0.05) and on the computer (102 vs 18 min per day; P<0.05) but also slightly less time sitting on weekends (43 vs 61 min per day; P<0.05).
• Norman et al (2006) assessed walkability and physical activity among 799 adolescents age 11-15 y in San Diego, California. The Frank et al (2005) method (see below) was used to calculate a GIS-based walkability composite measure for a 1.60-km buffer around the home. After adjustment for age,

ethnicity, and household education, no association was found between walkability index and MVPA. The authors felt that variability in walkability was fairly small in this study.
Sallis and Glanz, 200928
Narrative review, including 1 study on the exposure of interest in this section
Children Walkability Physical activity
• Kerr et al (2006): See above.
Lovasi et al, 2009334
Systematic review of 45 US studies (sample size >100) published between January 1995 and January 2009, including 1 study on the exposure of interest in this section
Children Walkability Physical activity
• Kerr et al (2006): See above.
Saelens and Handy, 2008359
Systematic review of 13 reviews published between 2002 and 2006 and 29 original studies published between 2005 and 2006, including 1 original study on the exposure of interest in this section
Children Walkability Physical activity
• Kerr et al (2006): See above.
Children (Outcome: Obesity)
Author, y Design and Number of Studies
Population Exposure Outcome Findings
Feng et al, 2010351
Systematic review, including 1 study on the exposure of interest in this section
Children Walkability Overweight • Spence et al (2008) evaluated walkability and overweight in 501 children age 4-6 y in Edmonton, Alberta, Canada. Walkability was defined as the weighted sum of z scores for intersection density, dwelling density, and land-use mix. After adjustment for age, gender, physical activity, junk-food consumption, neighborhood-level education, and proportion of employed women in the neighborhood, the walkability index was inversely associated with overweight in girls (OR=0.78; 95% CI, 0.66-0.91) but not boys

(OR=0.90; 95% CI, 0.79-1.03).
Galvez et al, 2010355
Systematic review of articles published between January 2008 and August 2009, including 1 on the exposure of interest in this section
Children Walkability Overweight • Spence et al (2008): See above.
Brownson et al, 2009352
Systematic review, including 1 study on the exposure of interest in this section
Children/ adolescents
Walkability BMI • Among 799 adolescents age 11-15 y in San Diego, California, Norman et al (2006) (see above) found no association between a GIS-based walkability index and BMI. The authors felt that variability in walkability was fairly small in this study.
Dunton et al, 2009350
Systematic review, 15 studies published before May 2008, including 2 on the exposure of interest in this section
Children/ adolescents
Walkability Overweight/BMI
Of 2 studies, 1 found inverse association between walkability and physical overweight but only among girls. • Spence et al (2008): See above. • Norman et al (2006): See above.
Adults (Outcome: Physical Activity)
Author, y Design and Number of Studies
Population Exposure Outcome Findings
Feng et al, 2010351
Systematic review, including 1 study on the exposure of interest in this section
Adults Walkability Physical activity
• Frank et al (2005) assessed walkability and physical activity in 523 adults age 20-69 y in metropolitan Atlanta, Georgia. Walkability was defined by weighted sum of z scores for intersection density, dwelling density, and land-use mix. After adjustment for age, sex, education, and ethnicity, people in the highest quartile of walkability had higher odds of meeting physical activity guidelines than those in the 1st quartile (OR=2.40; 95% CI, 1.18-4.88).
Brownson et al, 2009352
Systematic review, including 2 studies about the exposure of interest in this section
Adults Walkability Physical activity
Of 2 studies, both found significant association between walkability and physical activity. • Saelens et al (2003) evaluated walkability and BMI in 107 adults age 18-65 y
in 2 nonadjacent neighborhoods in San Diego, California. Walkability was quantified using the NEWS questionnaire, based on mean scores on reported accessibility of nonresidential destinations, street connectivity, walking/cycling infrastructure, aesthetics, traffic safety, and crime safety. After adjustment for age and education, residents of the low-walkable

neighborhood had significantly lower objectively measured physical activity (130.7 vs 194.8 min during the past week; P<0.01).
• Frank et al (2005): See above.
Saelens and Handy, 2008359
Systematic review of 13 reviews published between 2002 and 2006 and 29 original studies published between 2005 and 2006, including 1 original study on the exposure of interest in this section
Adults Walkability Physical activity
• Among adult residents of King County, Washington, Frank et al (2006) examined the relation between walkability index in a 1-km network buffer around home and time spent walking/cycling for transport. After adjustment for demographics, the walkability index was positively associated with time spent walking/cycling for transport.
Bauman and Bull, 2007338
Systematic review of reviews published between 2002 and 2007, including 7 reviews on the exposure of interest in this section
Adults Walkability Physical activity or walking
Of 7 reviews, 3 reported significant positive association between walkability and overall physical activity, and 4 between walkability and walking: • A narrative review by Badland and Schofield (2005) found positive
association between walkability and physical activity. • A systematic review by Lee et al (2004) found positive association between
walkability (based on self-reported data) and meeting recommendations for physical activity.
• A systematic review by McCormack et al (2005) found positive association between walkability and physical activity.
• A narrative review by Saelens et al (2003) found positive association between walkability and transport-related physical activity.
• A systematic review by Sallis et al (2004) found positive association between walkability and walking trips.
• A systematic review by Owen et al (2004) found positive association between walkability score and walking for transport.
• A review by Wendel Vos Droomers et al (2005) found positive association between walkability indexes and walking.
Adults (Outcome: Obesity)
Author, y Design and Number of Studies
Population Exposure Outcome Findings
Brownson et al, 2009352
Systematic review, including 1 study on the exposure of interest in this section
Adults Walkability BMI • Among 107 adults in San Diego, California, Saelens et al (2003) (see above) found no significant difference in BMI of residents of higher vs lower walkable neighborhoods (27.3 vs 25.4, P=0.097)

GIS indicates geographical information systems; OR, odds ratio; NEWS, Neighborhood Environment Walkability Scale; MVPA, moderate to vigorous physical activity; CI, confidence interval; BMI, body mass index; and NHANES, National Health and Nutrition Examination Survey. *Given the array of smaller, cross-sectional, observational studies that were already captured in the published narrative and systematic reviews identified here, in the writing group’s additional systematic searches for original articles published after 2007, performed by means of PubMed searches, evaluation of related articles, and hand searches of reference lists, the writing group focused on those additional studies that were randomized trials, quasi-experimental studies, longitudinal studies, or large (N>5000) cross-sectional studies. No such studies not already included here were identified. Note: Reference numbers (eg, Sallis and Glanz, 200928) appearing in Supplementary Table 10a through 10f correspond with those listed in the reference section of the statement. For the purposes of this supplementary table, these meta-analyses or systematic reviews (see "Author, y" column) are considered the primary citation. Additional studies mentioned in the primary citation may be included in the "Intervention/Exposure" and "Findings" columns. The additional studies can be accessed through the primary citation.
Chow et al, 2009358
Systematic review, including 1 study on the exposure of interest in this section
Adults Walkability BMI • Saelens et al (2003): See above.
Saelens and Handy, 2008359
Systematic review of 13 reviews published between 2002 and 2006 and 29 original studies published between 2005 and 2006, including 1 original study on the exposure of interest in this section
Adults and children
Walkability BMI • Among adult residents of King County, Washington, Frank et al (2006) (see above) found walkability to be inversely associated with BMI.
• Using NHANES III data, Doyle et al (2006) evaluated county-level walkability and BMI among 9229 US adults. Walkability was defined by z scores of average block size, percentage of all blocks having areas <0.03 km2, and intersection density. After adjustment for demographics, walkability index was inversely associated with obesity (β=−0.054; P<0.05).
Papas et al, 2007349
Review of 20 studies, including 2 studies on the exposure of interest in this section
Adults Walkability
BMI Of 2 studies, 1 found significant association between walkability and obesity. • Saelens et al (2003): See above. • Doyle et al (2006): See above.

Supplementary Table 11. Local Environmental Change to Reduce Tobacco Use (Community Settings)
Reducing the Density of Tobacco Retail Outlets
Author, y Design Population Duration Intervention/Evaluation Major Findings West et al, 2010375
Observational, cross-sectional
N=205 Latino adolescents recruited from 7 high schools in San Diego, California, and participating in a larger RCT evaluating the effectiveness of a counseling intervention to increase medication adherence
2004-2005 Baseline data, including data on alcohol and tobacco use, were collected from participants. US Census Bureau data from the San Diego GIS were used to identify neighborhood characteristics. Alcohol and tobacco retailer addresses were obtained from the San Diego County Department of Environmental Health, Food and Housing Division. Distance to the nearest retailer from each participant’s residential area was measured by the shortest road path.
Homes: • After ordinal regression while adjusting
for hypothesized social predictors, greater distance from home to the nearest retailer was associated with lower alcohol and tobacco use (OR=0.90; 95% CI, 0.82, 0.99).
Pearce et al, 2009376
Observational, cross-sectional
N=12,529 persons age 15+ y living in noninstitutional permanent dwellings and participating in the New Zealand Health Survey
2002-2004 Smoking status was ascertained by questionnaire and categorized as “heavy” for 10+ cigarettes per day and “light” otherwise. Street addresses of supermarkets and local convenience stores were collected from territorial authorities in New Zealand and used to geocode geographical access to tobacco by road for each census block. Accessibility of outlets (measured as road travel time with a car) in each census block was divided into quartiles and paired with individual-level data. Multivariate-adjusted regression assessed if the neighborhood differed between smokers and nonsmokers and whether relationships for heavy smokers differed from light smokers and nonsmokers.
Homes:
After adjusting for individual-level demographic and socioeconomic variables: • Persons living in the highest quartile for
best supermarket access (<1.89 travel min by car) had 23% higher odds of being a smoker (OR=1.23; 95% CI, 1.04, 1.42) compared with the lowest quartile (>6.54 travel min).
• Persons living in the highest quartile for best convenience store access (<0.98 travel minutes) had 19% higher odds of being a smoker (OR=1.19; 95% CI, 1.04, 1.38) compared with the lowest quartile.
• Results were not statistically significant after adjustment for neighborhood deprivation and rural/urban residence.
• Similar nonsignificant results were obtained for heavy smokers compared with light smokers and nonsmokers.
Li et al, 2009377
Observational, cross-sectional
N=55,467 individuals in 398 communities in Massachusetts
1999-2005. BRFSS data were used to categorize individuals as current smokers or noncurrent smokers and obtain individual demographic characteristics. Large cities in Massachusetts were divided into communities according to ZIP code, and community-level sociodemographic data were obtained from the 2000 US Census. Tobacco retail outlet density was calculated by geocoding
Homes:
• Higher tobacco retailer density near home was positively associated with current smoking. Each 1 additional retailer per 16 km of road was associated with 13% higher odds of current smoking (OR

the Massachusetts state Department of Revenue license registry of tobacco retailers. Mixed-effects logistic regression models assessed individual- and community-level predictors of smoking.
=1.13; 95% CI, 1.00, 1.27), after adjusting for other covariates.
Novak et al, 2006378
Observational, cross-sectional
N=2116 youth (age 11-23 y) living in 178 randomly selected census tracts in Chicago
1995-1996 and 1997-1999
Smoking behavior and demographic characteristics were obtained by interviewer-administered questionnaires in 2 waves (1995-1996 and 1997-1999). Trained raters drove at 8 kph down every street within the selected census tracts. Both sides of blocks were videotaped, and observer logs gathered data on land use, physical conditions, patterns of social interaction, and retail locations licensed to sell tobacco. Density was computed by dividing the number of block faces with at least 1 retail outlet by the total number of observed block faces. Generalized estimation equation models, adjusted for neighborhood confounders and another with propensity score strata, were used to evaluate the relation of retail tobacco outlet density with youth smoking.
Homes:
• After adjustment for census-tract level confounders, youths living in areas at the 75th percentile of retail tobacco outlet density were 21% more likely to have smoked in the past month (OR=1.21; 95% CI, 1.04, 1.41), compared with those living at the 25th percentile.
• Findings were similar in the propensity score–adjusted model (OR=1.20; 95% CI, 1.00, 1.44).
Chuang et al, 2005379
Observational, cross-sectional
N=8121 adults age 25-74 y in 4 cities in northern California in the Stanford Heart Disease Prevention Program
5 cross-sectional assessments between 1979 and 1990
Individual-level data, including data on smoking, demographics, and SES, were collected from 5 cross-sectional surveys. Convenience store addresses were collected from business listings of telephone books for the years corresponding to the surveys and geocoded. The distance, number, and density of stores within a 1.6-km radius in each neighborhood were estimated. These scores were divided into tertiles, and multilevel models were adjusted for individual and neighborhood characteristics.
Homes:
• Persons living in areas with high compared with low convenience store density have higher smoking prevalence.
• Shorter distance to a store and higher number of stores within a 1.6-km radius of home were associated with higher smoking prevalence.
• ORs and 95% CIs were not provided.
McCarthy et al, 2009380
Observational, cross-sectional
N=19,306 students from 245 randomly sampled schools in California participating in the California Student Tobacco Survey
2003-2004 Data on tobacco use were collected from students who were categorized as established smokers if they had smoked at least 1 cigarette in the last month and at least 100 lifetime cigarettes. Students were categorized as experimental smokers if they had smoked at least 1 cigarette in the last month but <100 lifetime cigarettes. Retailer density was assessed using geocoded 2006 California Board of Equalization data on tobacco retail licensees. The number of retail outlets within a 1.6-km radius buffer area around each school was counted. Random-intercept models in a generalized linear mixed-model
Schools:
• The number of retailers within a 1.6-km radius of schools was associated with greater likelihood of students being experimental smokers (OR=1.11; 95% CI, 1.02, 1.21) in urban high schools but not middle schools.
• The number of retailers within a 1.6-km radius was not significantly associated with likelihood of being an established smoker (OR=1.06; 95% CI, 0.94, 1.20) in all student groups.

framework evaluated the relation of tobacco retailer density with tobacco use.
Henriksen et al, 2008381
Observational, cross-sectional
N=24,875 adolescents enrolled in 135 randomly selected schools in California participating in the California Student Tobacco Survey conducted by the California Department of Public Health
2005-2006 Tobacco use data were obtained from the survey. Tobacco outlet addresses were obtained from state retailer licensing data using unique postal ZIP codes within 0.8 km of high schools. Distance from each school street address to every tobacco outlet within 0.8 km was measured “as the crow flies,” and tobacco outlet density was measured by the total number within 0.8 km of each school. After multiple regressions and adjustment for school and neighborhood demographics, the association between density and proximity of tobacco outlets in high school neighborhoods and school smoking prevalence was evaluated.
Schools: • Prevalence of current smoking was 3.2
percentage points higher at schools in neighborhoods with the highest tobacco outlet density (≥5 outlets) vs neighborhoods without any tobacco outlets.
• The density of retail cigarette advertising in school neighborhoods was similarly associated with high school smoking prevalence.
• Proximity (presence of a tobacco outlet within 300 m of a school; distance to the nearest tobacco outlet from school) was not associated with smoking prevalence.
Provision of Community Telephone Quit Lines
Author, y Design Population Duration Intervention/Evaluation Major Findings Ossip-Klein et al, 1991385
RCT N=1813 smokers with intention to quit, recruited from a 10-county region in Western New York state
From 1985 to 1987, with an 18-mo follow-up
Counties were matched on population size and other demographics, and pairs of counties were randomly assigned to manual only (American Lung Association self-help packet, containing a quit manual, maintenance manual, and relaxation tape) or manual plus hotline intervention. Participants in hotline counties were offered access to a telephone hotline, hotline stickers, and flyers and were encouraged to call the hotline in addition to the manual-only intervention. Validation of abstinence was by significant-other report for all subjects and salivary cotinine levels for about 50% of subjects.
• In the hotline group, 35.9% (n=321) of subjects called the hotline at least once during the 18-mo follow-up.
• Abstinence was consistently higher in the manual-plus-hotline counties compared with manual-only counties across all follow-ups and abstinence definitions.
• 1-, 3-, and 6-mo 48-h abstinence prevalence was higher in manual-plus-hotline counties based on both significant-other report and salivary cotinine (P< 0.05 each).
• Abstinence rates were higher in hotline counties at 12 and 18 mo (10.3% vs 6% at 18 mo for salivary cotinine validation), and continuous abstinence from months 3 to 18 (6.6% vs 4.0%).
RCT indicates randomized controlled trial; GIS, geographical information systems; OR, odds ratio; CI, confidence interval; BRFSS, Behavioral Risk Factor Surveillance System; and SES, socioeconomic status. Note: Reference numbers (eg, West et al, 2010375) appearing in this supplementary table correspond with those listed in the reference section of the statement. For the purposes of this supplementary table, these meta-analyses or systematic reviews (see "Author, y" column) are considered the primary citation. Additional studies mentioned in the primary citation may be included in the "Intervention/Exposure" and "Findings" columns. The additional studies can be accessed through the primary citation.

Supplementary Table 12. Direct Restrictions and Mandates for Diet
Restrictions on Advertising to Children
Author, y Design Population Duration Intervention/Evaluation Major Findings IOM Committee on Food Marketing and the Diets of Children and Youth, 2006389
Review Children and adolescents
Variable Variable • There is moderate to strong evidence that television advertising influences food and beverage preferences, purchase requests, beliefs, and dietary intake of children and adolescents.
• Current food and beverage marketing practices geared to children and youth are out of balance with recommended healthful diets and contribute to an environment that puts their health at risk.
Powell et al, 2007390
Observational, cross-sectional
A sample of 98,306 30-s equivalent food-product ads seen by US television viewers age 2-11 y and 12-17 y
2003-2004 Food products and their related nutritional contents were examined in aggregate and by 5 separate categories that included cereals, sweets, snacks, drinks, and other food products. Ads viewed were weighted by television ratings data to provide actual exposure measures of the nutritional content of food advertising seen by children and adolescents.
• 97.8% and 89.4% of advertised foods seen by viewers age 2-11 y and 12-17 y, respectively, were high in fat, sugar, or sodium.
• Nearly half of all calories among the advertised products came from sugar.
• 97.6% of cereal ads seen by children age 2-11 y were for high-sugar cereals.
• Among children, no substantial differences were found in the nutritional content of ads seen by blacks vs whites.
• Among adolescents, a slightly higher proportion of food ads were for high-sugar products, overall and across all food-product categories, seen by blacks vs whites.
Gantz et al, 2007391
Observational, cross-sectional
All TV programs displayed in 1 wk in top 10 networks for 3 age groups (2-7 y, 8-12 y, and
2005 The Kaiser Family Foundation used samples of >1600 h of all genres of programming viewed by children and combined a detailed analysis of advertising content with viewing data from a large national sample of children to determine how many ads young people
• Children age 8-12 y were watching the most food ads on TV, an average of 21 ads per day or >7600 ads per year, followed by adolescents age 13-17 y (17 food ads per day), and children age 2-7 y (12 food ads per day).

13-17 y), totaling 1638 h
actually see, given the mix of programming they watch.
• Most ads were for candy and snacks (34%), sugared cereals (28%), and fast foods (10%); none of the 8854 ads reviewed marketed fruits and vegetables.
Chou et al 2008392
Observational, longitudinal N=14,852 children, a nationally representative sample of the US population age 12-16 y
1996-1999 The 1979 Child−Young Adult National Longitudinal Survey of Youth and the 1997 National Longitudinal Survey of Youth were used to estimate the effects of fast-food restaurant advertising on children and adolescents being overweight. The advertising measure used was the number of hours of spot television fast-food restaurant advertising messages seen per week.
• The findings estimated that a ban on television fast-food restaurant ads would reduce the number of overweight children age 3-11 y by 18% and the number of overweight adolescents age 12-18 y by 14%.
Veerman et al, 2009393
Simulation study Children age 6-12 y in NHANES 2003-2004, a nationally representative US survey
2003-2004 Body measurement data from NHANES and literature related to television advertising and dietary consumption levels were used to construct a mathematical simulation model to estimate the potential effects of reducing the exposure of US children age 6-12 y to TV food advertising on the prevalence of overweight and obesity.
• Reducing exposure to zero would decrease average BMI by 0.38 kg/m2 and lower prevalence of obesity by 14.6% (from an absolute prevalence of 17.8% to 15.2%).
Restrictions on Specific Dietary Factors
Author, y Design Population Duration Intervention/Evaluation Major Findings Leth et al, 2006395
Quasi-experimental (pre- vs postintervention)
Major foods in Denmark before and after legislation banning trans fat
2003-2005 In March 2003, Denmark passed a regulation to impose a maximum of 2% industrially produced trans fatty acid in oils and fats destined for human consumption. The law was applied at the source, not in the final product, covered all oils and fats used in foodstuffs on the Danish market or exported from Denmark, and limited products claiming to be “free from trans fat” to <1 g trans fat per 100 g in oil or fat used for production. This study evaluated the trans fat content of the 253 and 148 sample foods before (2003) and after (2005) implementation of the law.
• The number of samples that contained >2% TFA was significantly reduced, and most of these products contained only between 2% and 6% TFA.
• Danish regulation helped reduce the amount of industrially produced TFA used in foods to a very low level..
• Producers successfully developed new methods of production without increasing prices or reducing the variety of products on the market.
Angell et al 200923
Quasi-experimental (pre- vs postintervention)
All licensed food establishments, including
2006-2008 In 2006, the New York City Department of Health and Mental Hygiene proposed an amendment to the city's health code to restrict use of artificial trans fat in fry oils,
• Primary analyses of outcomes of this regulation show that restaurant use of artificial trans fat for frying, baking, or cooking or in spreads has

restaurants, in New York City
spreads, and all other ingredients and products in all licensed food establishments, including restaurants, school cafeterias, catering businesses, senior centers, and offerings from street-food vendors. The FDA threshold (up to 0.5 g of trans fat per serving) was adopted as the threshold for labeling the products containing any trans fat. This restriction went into full effect in November 2008.
decreased from 50% to <2%. • After 2 y, dozens of national chains
had removed artificial trans fat and 13 jurisdictions, including California, had adopted similar laws.
Pekka et al, 200259 Puska and Stahl, 201060
Quasi-experimental (pre-vs postintervention)
Finland 1980s to present.
A multicomponent national intervention to improve dietary habits was instituted after 1977, which included media and education, substantial focus on voluntary agreements with industry, modifications to taxation and subsidy policies for several foods, and government-supported programs to increase local production and consumption of berries (see other relevant Tables for more details on these interventions). In addition, national legislative restrictions were implemented on the maximum percentage of milk fat in whole milk and low-fat milk (1980s, 1990s) and maximum salt content of certain foods (1990s).
• In 1978, 44% of men and 35% of women used whole milk, whereas in 1998 the respective proportions were only 9% and 4%, respectively. Low-fat milk became the standard milk used in schools and catering.
• As measured by urine sodium excretion, mean daily salt intakes declined from about 14 to 15 g in men (unknown in women) to about 11 g in men and 7 g in women.
• These and other dietary changes were associated with substantial declines in population cholesterol levels, including 18% declines in North Karelia between 1972 and 1997 and similar declines in other monitored areas.
• Diastolic blood pressure decreased by 5% in men and 13% in women.
• Age-standardized CHD mortality among adults age 35-64 y decreased by 73% in North Karelia and by 65% in the whole country between 1971 and 1995.
• About 75% of this decline could be explained by improvements in population risk factors rather than changes in medical treatments.
Uusitalo et al, 1996396
Quasi-experimental (pre- vs postintervention) using serial cross-sectional surveys
N=5080 and 5162 subjects in 1987 and 1992 in Mauritius, including a subset of 2059 subjects age 30-
1987-1992
In 1987, the Ministry of Health initiated a multicomponent intervention program to modify multiple lifestyle-related risk factors. One component was a regulatory policy to change the composition of general cooking oil, limiting the
• From 1987 to 1992, the estimated mean reduction in intake of saturated fat related to changes in intake of cooking oil was 3.5% of energy in men and 3.6% in women, and estimated mean increase in intake of

64 y with assessment of diet in 1992
content of palm oil and mandating its replacement with soybean oil. Five years after this regulatory intervention, in 1992, a follow-up survey and a 24-h recall were performed to assess whether changes in the composition of cooking oil had influenced population blood cholesterol levels. Phospholipid fatty acid concentrations were also measured.
polyunsaturated fat was 5.5% of energy in men and 5.6% in women.
• From 1987 to 1992, mean total blood cholesterol levels fell by 0.79 mmol/L in men and 0.82 mmol/L in women (P<0.001 each). Changes in saturated and polyunsaturated fat consumption due to changes in cooking oil explained 48% of this decrease in men and 49% of the decrease in women.
Mandates for Specific Dietary Factors
Author, y Design Population Duration Intervention/Evaluation Major Findings Pekka et al, 200259
Quasi-experimental (pre- vs postintervention)
Finland
Late 1970s to 1980s
The Berry and Vegetable Project aimed to increase the feasibility of growing berries in Finland. The Ministry of Agriculture and the Ministry of Commerce financed a major collaborative project between berry farmers, industry, various commercial sectors, and health authorities to develop and grow berries in Finland. In addition to media and education campaigns, the project supported sales campaigns, development of new berry products, and related relevant activities.
• Over the period of the project, many Finnish farmers switched from dairy to berry production.
• At a national level, berry production and consumption rose gradually from initially very low levels.
• These changes, together with other changes in food supply, were associated with substantial reductions in population CVD risk factors and rates of CVD events.
Puska and Stahl, 201060
Quasi-experimental (pre- vs postintervention)
Finland 2000 to present A media- and education-focused community intervention in North Karelia to improve dietary habits was subsequently extended to the national level after 1977, with additional substantial focus on other policy strategies. In the 2000s, additional government budget policies were developed to support domestic vegetable consumption and other health-related food innovations.
• The specific impact of budget policies that were developed to support domestic vegetable consumption and health-related food innovations has not been reported.
Uusitalo et al, 1996396
Quasi-experimental (pre- vs postintervention) using serial cross-sectional surveys
N=5080 and 5162 subjects in 1987 and 1992 in Mauritius, including a subset of 2059
1987-1992
This intervention is described in this Table above, in “Restrictions on Specific Dietary Factors.” The intervention included both a restriction on palm oil in cooking oil and a mandate to increase use of soybean oil
• From 1987 to 1992, the estimated mean reduction in intake of saturated fat related to changes in intake of cooking oil was 3.5% of energy in men and 3.6% in women, and the

subjects age 30-64 y with assessment of diet in 1992
as its replacement. estimated mean increase in intake of polyunsaturated fat was 5.5% of energy in men and 5.6% in women.
• From 1987 to 1992, mean total blood cholesterol levels fell by 0.79 mmol/L in men and 0.82 mmol/L in women (P<0.001 each). The changes in saturated and polyunsaturated fat consumption due to changes in cooking oil explained 48% of this decrease in men and 49% of the decrease in women.
IOM indicates Institute of Medicine; NHANES, National Health and Nutrition Examination Survey; BMI, body mass index; TFA, trans fatty acid; FDA, US Food and Drug Administration; CHD, coronary heart disease; and CVD, cardiovascular disease.
Note: Reference numbers (eg, Powell et al, 2007390) appearing in this supplementary table correspond with those listed in the reference section of the statement. For the purposes of this supplementary table, these meta-analyses or systematic reviews (see "Author, y" column) are considered the primary citation. Additional studies mentioned in the primary citation may be included in the "Intervention/Exposure" and "Findings" columns. The additional studies can be accessed through the primary citation.

Supplementary Table 13. Smoking Restrictions in Communities, Worksites, Schools, and Residences
Smoking Restrictions in Communities
Author, y Design Population Duration Intervention/Evaluation Major Findings IOM Committee on Secondhand Smoke Exposure and Acute Coronary Events, 2009401
Review of quasi-experimental studies (pre-/postintervention)
Multiple studies that examined smoking bans and markers of air pollution and 11 studies in the United States, Canada, and Europe that examined smoking bans and acute coronary events
Follow-up durations of individual studies after the ban ranged from 0.2 to 3.0 y
Smoking bans in public places in communities: Study designs were generally quasi-experimental, comparing rates of relevant hospitalizations in time periods before vs after the ban, with varying durations from implementation of the ban to the assessment of post-ban end points. As additional ecological controls, several studies performed parallel assessments of the coronary rates in the same time periods in a nearby locality that had not instituted a smoking ban.
• Many studies have consistently demonstrated substantial reductions in markers of air pollution and particulate matter in places where smoking was banned.
• There was substantial evidence that these smoking bans were effective in reducing acute coronary events, with reductions ranging from ≈6% to 47%.
• In studies that evaluated coronary rates separately for smokers vs nonsmokers, reductions were demonstrated in both groups, consistent with benefits of reduced exposure to secondhand smoke among nonsmokers.
Meyers et al, 2009413
Systematic review and meta-analysis
11 reports from 10 study locations that examined smoking bans in public places and risk of acute coronary events (the same studies as the IOM report, above)
As above As above • Pooling all studies, the relative reduction in acute coronary events was 17% (RR=0.83; 95% CI, 0.75-0.92).
• Largest RR reductions were seen among younger persons and nonsmokers.
• Benefits increased over time: the reduction in RR incrementally decreased 26% for each year of observation after implementation of the ban.
Herman and Walsh, 2011415
Quasi-experimental study (pre-/postintervention)
May 2007 statewide smoking ban in Arizona, which prohibited smoking in most enclosed public places and places of
January 2004 −May 2008
Rate of hospital admissions was evaluated before and after the ban, both overall and stratified by county-specific presence or absence of preexisting smoking bans, to separate the effects of the ban vs temporal
• Comparing counties with no prior bans to those with prior bans, counties with no prior bans experienced significant reductions in hospital admissions for conditions

employment trends. directly affected by secondhand smoke, including acute MI (13%), angina (33%), stroke (14%), and asthma (22%).
• No significant differences were seen for control conditions such as appendicitis, kidney stones, acute cholecystitis, and ulcers.
Trachsel et al, 2010416
Quasi-experimental study (pre-/postintervention)
March 1, 2008, smoking ban in public buildings in the Swiss canton of Graubünden.
2006-2009 Rates of incident MI in the 2 y before and 2 y after the ban. Rates were evaluated both for the stable resident population and the large, transient tourist population to evaluate longer-term vs shorter-term effects.
• There was a 22% lower rate of incident acute MI in the year following the ban, compared with the prior 2 y.
• Rates of acute MI in both residents and nonresidents were lower, suggesting a short-term benefit of the smoking ban.
Naiman et al, 2010417
Quasi-experimental study (pre-/postintervention)
Smoking ban in restaurants and related settings in Toronto, Ontario, Canada
January 1996−March 2006
The study evaluated hospital admission rates for multiple smoking-related conditions, including acute MI, angina, stroke, asthma, chronic obstructive pulmonary disease, and pneumonia/bronchitis, from January 1996, 3 y before initial implementation of the ban, to March 2006, 2 y after the last phase was implemented. The study also evaluated control cities and control end points.
• Rates of cardiovascular conditions decreased by 39%, and admissions for respiratory conditions decreased by 33%.
• No changes were observed in control cities or control end points.
• Reductions in disease end points occurred during the ban period related to implementation in restaurant settings.
Dove et al, 2010418
Quasi-experimental study (pre-/postintervention)
July 2004 comprehensive smoke-free workplace law in Massachusetts
1999-2006 The study evaluated rates of fatal MI before and after implementation of the ban, stratified by cities/towns with and without previous local smoking bans.
• MI mortality rates decreased by 9.2% after implementation of the law in cities and towns with no prior local smoking ban.
• A smaller, not statistically significant decrease occurred in localities that did have a prior ban.
• The effect of the statewide ban was larger after the first 12 mo (–18.6%; P<0.001) than in the first year.
Smoking Restrictions in the Workplace

Author, y Design Population Duration Intervention/Evaluation Major Findings Fichtenberg and Glantz, 2002424
Systematic review with random effects meta-analysis of quasi-experimental studies (pre-/postintervention)
N=22,122 from 8 prospective studies, 7 sequential cross-sectional studies, 6 retrospective studies, and 5 population surveys conducted in the United States, Canada, Australia, and Germany
Durations of individual study follow-up ranged from 1 to 24 mo
The included studies measured changes in smoking behavior that accompanied the implementation of smoke-free regulation in individual workplaces. Differences in consumption (per smoker and per employee) and prevalence before and after workplaces became smoke-free (in workplace studies) and between comparable samples with and without regulations (in population studies) were calculated.
• Implementation of totally smoke-free workplaces was associated with pooled reductions in absolute smoking prevalence of 3.8% (95% CI, 2.8%, 4.7%) and daily cigarette use among smokers of 3.1 cigarettes (95% CI, 2.4, 3.8)
• The combined effects of stopping smoking and lower consumption per continuing smoker equaled 1.3 (range 0.2-1.8) fewer cigarettes smoked per day per employee, a 29% (95% CI, 11%, 53%) relative reduction.
• Studies having either self-reported (N=3) or biochemical (N=3) measures of secondhand smoke all found significant reductions in environmental tobacco smoke exposure after policy implementation.
Bell et al, 2009426
Systematic review of cross-sectional (n=12), cohort (n=3), and quasi-experimental (n=1) studies
N=16 studies in workers in the United States (n=8), Australia (n=3), Ireland (n=3), Finland (n=1), and Scotland (n=1)
Included studies were published between 1990 and 2007.
Workplace smoking bans were the exposure of interest. In this review, the authors tried to study effect modification of the smoke-free policy on smoking indexes by certain key demographic variables.
• No differences were seen by age or sex in 2 studies finding a positive association between strong antismoking policies and quitting in the prior 6 mo (OR=1.51; 95% CI, 1.1, 1.7)427 and a decrease in daily cigarette consumption (−5.2 cigarettes per day) after 5 mo and an increase of 1.7 cigarettes per day at 6 mo to 2 y after workplace smoking bans.428
• Farrelly et al429 and Heloma and Jaakkola430 showed that a complete smoking ban was associated with slightly larger reduced prevalence of smoking in men relative to women, whereas Kinne et al431 showed that men, but not

women, whose workplace had smoking restrictions smoked fewer cigarettes on workdays and nonwork days.
• Farrelly et al429 also showed that workers with a college degree showed a larger decline in smoking prevalence (28% reduction) than those without a high school education (13.7% reduction). Gritz et al432 showed that white collar workers had higher quit rates than blue-collar workers in relation to smoking bans.
Hopkins et al, 2010425
Systematic review Participants in 37 worksite studies of varying designs: prospective (n=8), retrospective (n=7), cross-sectional (n=13), and quasi-experimental (n=13), conducted in a variety of work settings in the United States (n=29), Canada (n=4), Australia (n=1), and Europe(n=2).
Included studies were published between 1980 and June 2005.
Adoption of a smoke-free policy was the exposure of interest. In 19 of the included studies, smoke-free policies were implemented either voluntarily or in response to a community-wide smoke-free law. In 18 of the studies individual workers provided information about the existing smoking policy at their workplace. Outcomes included prevalence of tobacco use, cessation of tobacco use, attempts to quit, and number of cigarettes smoked per day.
• In 22 studies that reported on prevalence, the median absolute change/difference in prevalence of tobacco use associated with smoke-free policy was a decrease of 3.4 percentage points (interquartile interval: −6.3 to −1.4). This difference was significant in 10 studies.
• In 6 studies that provided data to evaluate self-reported quit attempts, the median absolute change/difference was 4.1 percentage points higher (interquartile interval: −0.7 to +6.8).
• In 23 studies that assessed the impact of smoke-free policies on cessation, the median change/difference in tobacco quit rates was 6.4 percentage points higher (interquartile interval: 2.0-9.7). This result was significant in 8 studies.
• In 8 studies that provided multivariate-adjusted ORs for cessation comparing exposure to worksite smoke-free policy vs no smoke-free policy, OR ranged from 1.21 (95% CI,

1.00, 1.45) to 1.92 (95% CI, 1.11, 3.32).
• In 18 studies that reported on number of cigarettes smoked per day, a smoke-free policy was associated with a median change/difference of 2.2 fewer cigarettes per day (interquartile interval: −1.7 to −3.3).
Mizoue et al, 2000436
Observational, cross-sectional
N=1040 employees of a municipal office in Japan
Not stated A health survey using a self-administered questionnaire was conducted among a random sample of employees already subjected to 1 of 3 policies: a workroom ban, a work area ban with a smoking area inside the workroom, and time limits on smoking and prohibition of smoking during meetings (minimum restriction). Smoking behavior characteristics and desire to change smoking were compared among these policies, with adjustment for age.
• A 12% lower prevalence of smoking and a 17% higher proportion of ex-smokers were found in workplaces with a workroom ban than in those with minimum restrictions.
• Among current smokers the workroom ban was significantly associated with a lower consumption of cigarettes (mean difference from minimum restrictions, 4.1 cigarettes per day: P<0.001).
• The proportion of heavy smokers who consumed >25 cigarettes per day was 32% lower among smokers subject to a workroom ban compared with those working under minimum restrictions.
Farkas et al, 2000439
Observational, cross-sectional
N=17,185 teenagers, age 15-17 y, in the Current Population Surveys conducted by the US Census Bureau
1992-1993 and 1995-1996
Smoking behavior and household and workplace smoking restrictions were assessed using standardized questionnaires. These responses were designated as smoke-free, partial ban, and no smoking restrictions, respectively.
• Compared with those in workplaces with no smoking restrictions, adolescents who worked in smoke-free settings were less likely to be smokers (OR=0.68; 95% CI, 0.51, 0.90).
Siahpush et al, 2003464
Observational, cross-sectional
N=2526 current smokers and successful quitters age 14+ y in the 1998 Australian National Drug Strategy Household Survey
1998 Smoking behavior of participants was ascertained by a mixture of interviews and self-administered questionnaires. Participants also answered questions on the presence of a smoking ban at home, school, or the workplace. Associations were examined by multivariate logistic
• Workplace smoking bans were not significantly associated with odds of smoking cessation.

regression analysis. Skeer et al, 2005440
Observational, cross-sectional
N=3650 Massachusetts adults who were employed primarily at a single worksite outside the home that was not mainly outdoors
January−June 2002 Participants were obtained by random-digital dialing of Massachusetts households and asked about their smoking status, hours of exposure to tobacco smoke at work, and their worksite smoking policy. A multivariate logistic regression model was created to assess exposure to secondhand smoke in the workplace by workplace smoking policy, adjusting for potential confounding variables
• Employees who worked in places where smoking was permitted had 10.3 higher odds (95% CI, 6.7, 15.9) of being exposed to secondhand smoke, and those who worked in places with designated smoking areas had 2.9 higher odds of being exposed to secondhand smoke (95% CI, 2.4, 3.5), compared with employees in smoke-free worksites.
• Compared with smoke-free worksites, employees who worked in places with designated smoking areas were exposed to secondhand smoke 1.7 times longer (95% CI, 1.4, 2.2) and those who worked in places with no restrictions on smoking were exposed 6.34 times longer (95% CI, 4.37, 9.21).
Shelley et al, 2007465
Observational, cross-sectional
N=1472 Asians (1071 nonsmokers and 401 current smokers), age 18-74 y, living in 2 communities in New York City
November 2002−August 2003
Smoking behavior, health status, and household and workplace smoking restrictions were assessed using standardized questionnaires.
• A smoking ban at work only was not associated with a higher likelihood of reporting good/excellent health (OR=1.13; 95% CI, 0.56, 2.31).
Osypuk et al, 2009437
Observational, cross-sectional
N=85,784 US indoor workers who participated in the 2001-2002 TUS of the CPS conducted by the US Census Bureau
2001-2002 Survey participants were asked about their individual smoking habits and smoking policies at their workplace. Workplace smoking was modeled as a dichotomous variable (smoke-free vs non−smoke-free) where non−smoke-free workplaces included sites with designated smoking areas and no smoking restrictions. The association between smoke-free workplaces and current smoking was compared among immigrants and those born in the United States after covariate adjustment.
• Employment in a workplace that was not smoke-free was associated with higher odds of current smoking among all survey participants, OR=1.34 (95% CI, 1.27, 1.41).
• Stratified analysis showed that US-born participants working in non−smoke-free workplaces were 1.36 times more likely to be current smokers (OR=1.36; 95% CI, 1.29, 1.44) compared with those working in smoke-free workplaces. The association was potentially

weaker among immigrants (OR=1.15; 95% CI, 0.97, 1.35).
Friedrich et al, 2009438
Observational, cross-sectional
N=1627 employees of larger companies (>20 employees) in the canton of Zurich, Switzerland
2007 Questionnaire data about the prevalence of tobacco prevention usage, tobacco prevention measures, and the stages of change with respect to introduction of tobacco prevention measures were obtained from human resources managers in included companies. Multivariable regression was used to evaluate the relation between worksite tobacco prevention measures and policies and relevant outcomes such as percentage of smokers in the workforce and environmental smoke-related problems.
• Greater restrictiveness in smoke-free policies was inversely associated with percentage of smokers in the workforce and with environmental tobacco smoke−related problems (environmental tobacco smoke exposure and complaints) after ordinal regression analysis
• Compared with companies that banned smoking indoors and outdoors, workers in companies with no policy were 3.77 times more likely and those in companies with designated smoking areas were 2.75 times more likely to report environmental tobacco smoke−related complaints.
• No statistical difference was found in environmental tobacco smoke−related complaints between companies with indoor smoking bans alone and those with both outdoor and indoor smoking bans.
Ma et al, 2010441
Observational, cross-sectional
N=2698 workers, age 18-69 y, in 6 counties in China
2004 Face-to-face interviews collected data on demographic characteristics, smoking behaviors, secondhand smoke exposure, and worksite smoking policy. Multivariate-adjusted models evaluated the relation between worksite smoking restriction policies and secondhand smoke exposure among nonsmokers, intention to quit among smokers, and cigarettes smoked.
• Nonsmokers in workplaces with an unrestricted smoking policy were 3.7 times more likely (OR=3.7; 95% CI, 1.3, 10.1) to be exposed to secondhand smoke compared with nonsmokers in smoke-free workplaces.
• Significant associations were not seen for intention to quit or cigarettes smoked.
Longo et al, 2001435
Quasi-experimental study, comparing current or former smokers in hospitals that
N=1033 current or former smokers in 26 randomly selected
Follow-up ranged from 6 mo to 9 y, depending on when
The Joint Commission on Accreditation of Healthcare Organizations mandated smoke-free
• At each of the time periods examined, the post-ban quit ratio for the hospital

implemented a smoke-free policy vs those in non−smoke-free control workplaces in the same communities
smoke-free hospitals in 21 states (intervention group) and 816 current or former smokers in workplaces without smoke-free policies who lived in the same communities (comparison group)
the smoking ban was implemented in each hospital (varying between hospitals from 1987 to 1994).
hospitals in the United States in 1993. Hospital and other community (control) employees were surveyed beginning in 1994 using a questionnaire and were resurveyed twice to assess their smoking status prospectively (until 1996). The main outcome measures were the proportions of smokers who quit after the ban (quit ratio) and the relapse rate. Between-group comparisons were conducted using the Cochran-Mantel-Haenszel statistic for general association, stratified Cox proportional hazards models, and other appropriate statistical tools.
employees was higher than that for the community employees.
• For employees whose workplace smoking bans were implemented at least 7 y before the survey, 25.6% of smokers quit post-ban, compared with 14.2% for employees in non−smoke-free workplaces (P=0.02).
• After adjusting for a variety of factors, time to quitting smoking was shorter for hospital employees (P<0.001), with an overall RR of quitting of 2.3.
• Relapse rates were similar in both groups.
Osinubi et al, 2004442
Quasi-experimental study (pre-/postintervention)
N=128 employees of the New Jersey Insurance Manufacturers Group enrolled in a tobacco-dependence treatment program
1999-2000 The insurance group extended its smoke-free indoor policy to a smoke-free indoor and outdoor policy. Data on smoking habits of 101 employees enrolled in a tobacco-dependence treatment program in the group with target quit dates set before implementation of the ban were compared with those of 27 workers enrolled after the ban was implemented. In-person follow-ups were conducted with participants at 2 wk after their target quit dates, and quit status was verified with exhaled carbon monoxide. Quit status at 6 mo was assessed by self-report or telephone interviews.
• Post-ban participants had higher quit rates than pre-ban participants (52.4% vs 43.0%) after 6 mo.
• Post-ban participants were 80% less likely to relapse than pre-ban participants.
• Nonquitters decreased their consumption by 6.6 cigarettes per day (39.1% decrease).
Bauer et al 2005433
Quasi-experimental study (pre-/postintervention)
N=1967 employed persons, age 25-64 y at baseline, enrolled in COMMIT in 20 US and Canadian cities
8 y, 1993-2001 Data on personal and demographic characteristics, tobacco use behaviors, and restrictiveness of worksite smoking policies were obtained from trial participants who worked primarily indoors using telephone interviews done in 1993 and 2001. Multivariate models were constructed to examine the role of changes in worksite smoking policies
• People who worked in environments that changed to or maintained smoke-free policies between 1993 and 2001 were 1.9 times more likely than people whose worksites did not do so to have stopped smoking (OR=1.92; 95% CI, 1.11, 3.32).

over time (and other factors) in determining smoking behaviors.
• Continuing smokers in these environments decreased their average daily consumption by 2.57 cigarettes.
• People working in environments that had smoke-free policies in place in both 1993 and 2001 were 2.3 times more likely (OR=2.29; 95% CI, 1.08, 4.45) than people not working in such environments to quit by 2001, and continuing smokers reported a decline in average daily consumption of 3.85 cigarettes.
• No significant change was observed in the likelihood of quitting in people working in environments with designated smoking areas compared with those working in environments that allowed smoking, but workers in such environments consumed 2.22 significantly fewer cigarettes per day.
Wheeler et al, 2007434
Quasi-experimental study (pre-/postintervention)
N=1400 workers at the University of Arkansas for Medical Sciences University Hospital and Arkansas Children’s Hospital
2003-2005 The hospitals implemented smoke-free campuses in 2003. Smoking behavior and exposure to secondhand smoke was assessed in 1400 of the approximately 9000 employees at random 3 mo before implementation of the ban and 10 mo after implementation, using sequential cross-sectional anonymous surveys.
• Prevalence of smoking among employees declined from 9.6% before to 2.6% after implementation of the ban (P<0.05).
• Significantly fewer employees reported that they had to walk through cigarette smoke on campus after the ban than before (18% vs 43%, P<0.001).
Smoking Restrictions on School Campuses
Author, y Design Population Duration Intervention/Evaluation Major Findings Sellstrom et al, 2006444
Systematic review 17 cross-sectional or longitudinal studies performed in high-income countries
Search conducted between August and October 2003; time range of articles not
The study aimed to evaluate the relation between the school environment and various child outcomes. Smoking behavior was 1
• In the 3 studies that evaluated smoking as an outcome, smoking was more prevalent in schools without

involving youth age <18 y and with hierarchically structured data
stated outcome of interest. antismoking policies. • The odds of being a smoker in
a school without an antismoking policy was 1.2 to 2.77 times higher than in a school with a smoking policy.
Siahpush et al, 2003464
Observational, cross-sectional
N=2526 current smokers and successful quitters age 14+ y in the 1998 Australian National Drug Strategy Household Survey
1998 Smoking behavior of participants was ascertained by a mixture of interviews and self-administered questionnaires. Participants also answered questions on the presence of a smoking ban at home, school, or the workplace. Associations were examined by multivariate logistic regression analysis.
• Campus smoking bans were not significantly associated with odds of cessation.
Borders et al, 2005445
Observational, cross-sectional
N=13,041 undergraduate students at 12 4-y colleges and universities in Texas
Not reported A web-based survey covering past and current tobacco use was completed by students in participating schools. Campus smoking policies and regulations, including those on restriction of tobacco distribution, prohibition of sales, and restrictions on advertising were obtained from school administrators. Multivariate logistic regression evaluated the association between these school policies and probability of smoking.
• College-level policies such as prohibition of tobacco sales on campus, prohibition of smoking in residential halls, restricted tobacco distribution, smoking restricted to 6 m from entrances, and clearly identified nonsmoking areas were each not significantly associated with self-reported smoking.
Barnett et al, 2007446
Observational, cross-sectional
N=763 students age 13 y and 768 students age 16 y in 57 schools in Quebec, Canada
1999 Student smoking behaviors and other key individual variables were obtained from students by self-reported and parent-completed questionnaires. School-level data on smoking policies were obtained from school principals. Multilevel modeling evaluated relations between school policies and student smoking.
• School policies targeted at student smoking or indoor smoking by staff were not significantly associated with students’ cigarette consumption.
• Female students age 13 y attending schools that allowed staff to smoke outdoors were 4.8 times more likely (OR=4.8; 95% CI, 1.1, 21.1) to be daily smokers than those attending schools where teachers were not permitted to smoke outdoors.
Piontek et al, 2008447
Observational, cross-sectional
N=2510 secondary school students age 10-15 y and N=843
Not reported Student smoking behavior and students’ perception of their school’s antismoking policy were assessed
• Absence of smoking bans for students was associated with higher odds of being a current

students age 16-21 y enrolled in 40 schools in Bavaria, Germany
using self-administered questionnaires. Logistic regression examined school context variables, including rules on smoking as predictors of current adolescent smoking.
smoker in the younger age group only (OR=1.62; 95% CI, 1.03-2.53).
• Among older students, the presence of teachers who smoked on school grounds was associated with a higher likelihood of smoking (OR=1.97; 95% CI, 1.18-3.29).
Boris et al, 2009448
Observational, cross-sectional
N=1041 teachers and N=4763 9th grade students in 20 schools in 5 districts in southern Louisiana
Spring 2000 Cross-sectional data on smoking behaviors were collected from teachers. Participating students completed the Healthy Habits Survey, which included information on smoking behavior at the end of their 1st semester in high school (to determine if short-term exposure to differing school policy affected adolescent behavior). Logistic regression methods were used to assess the relation between school policy and student smoking prevalence.
• No significant difference
was observed for teacher
smoking (11% vs 13%,
P=0.42) or student smoking
(24.6% vs 25.2%, P=0.75) at
schools with a no-use vs
restricted-use policy.
Murnaghan et al, 2009449
Observational, sequential cross-sectional
N=1537 10th grade students enrolled in all 10 English-speaking schools in Prince Edward Island, Canada followed up over 3 waves of data collection
1999-2001 Repeated cross-sectional smoking behavior data were collected from a census sample of all 10 schools using the SHAPES tobacco module over 3 y. In year 1, none of the schools had policies banning smoking on school property or participated in provincially directed school-based smoking prevention programs. In year 2, 4 of the schools had introduced a policy banning smoking on school property and the other 6 schools had implemented provincially directed school-based smoking prevention programs. In year 3, all 10 schools had introduced a policy banning smoking on school property and implemented the provincially directed school-based smoking prevention programs. Logistic regression analysis examined the relation between school and
• The presence of a school tobacco ban was not significantly associated with reduced odds of smoking after multivariate adjustment.

environmental factors and smoking in 12th grade students.
Lovato et al, 2010210
Observational, cross-sectional
N=22,681 students in grades 10 and 11 in 77 schools in 5 Canadian provinces
2003-2004 Student smoking behaviors were assessed using the SHAPES questionnaire. Written school antismoking policies were examined and scored to quantify their “smoking policy intent,” and interviews were conducted with school officials to ascertain the degree of policy enforcement. School properties were also observed and tobacco control bylaws obtained from each school’s municipality. Data on community-level variables were obtained from the Canadian census data records. Multilevel generalized linear models evaluated the relation between key individual-, school-, or community-level variables and student smoking.
• Students attending schools with stronger policies prohibiting tobacco use were less likely to smoke (OR=0.92; 95% CI, 0.88-0.97).
Apel et al, 1997450
Quasi-experimental evaluation (pre-/postintervention)
N=915 female and N=308 male students at the School of Education, University of Koln, Germany
1995 The university announced a new policy limiting smoking to designated areas. Ashtrays were also placed at each designated area and removed from all other areas that had been declared smoke-free. Approximately every 10th student was interviewed with a questionnaire. The effect of the new policy was then assessed.
• Of the students
interviewed, 36% were
current smokers.
• Of smokers, 28% of male
smokers and 30% of female
smokers reported smoking less 1 mo after the policy was implemented.
Etter et al, 1999451
Quasi-experimental evaluation (pre-/postintervention)
N=1856 staff and students of the University of Geneva, Switzerland
September1995−July 1996
A smoking restriction policy was implemented at the university in March 1996. Smoking was prohibited in 4 faculty buildings of the university except in limited areas with display of posters and distribution of leaflets about the no-smoking program. No intervention was implemented in some other faculty buildings, considered comparison buildings. Surveys were conducted 3-4 mo before and 3-4 mo after implementation of the policy.
• The proportion of smokers who made at least 1 attempt to quit in the 4 mo after implementation almost doubled in the intervention group before vs after implementation (2.0% to 3.8%, P=0.003) but remained unchanged in the comparison group (1.8%).
• The proportion of active smokers was lower, but not significantly so, in the intervention (24.8%) vs

comparison (27.2%) groups at 4 mo after the intervention.
• Among participants who were smokers both at baseline and at follow-up, the number of cigarettes smoked within university buildings did not change significantly in the intervention group (5.5 cigarettes per day at baseline vs 5.7 at follow-up; P=0.14) but decreased significantly in the comparison group (5.5 at baseline vs 5.0 at follow-up, P=0.035).
• There was no difference in self-reported exposure to environmental tobacco smoke between the 2 groups.
• More members of the intervention group (28%) reported less annoyance because of environmental tobacco smoke than the comparison group (14%) (P=0.001).
Stronger Enforcement of Schools’ Anti-Tobacco Policies
Wakefield et al, 2000452
Observational, cross-sectional
N=17,287 students, grades 9-12, age 14-17 y, obtained by a 3-stage sampling procedure of US counties
Spring 1996 Smoking behavior and household and school smoking restrictions were assessed using standardized questionnaires.
• School smoking bans were associated with a greater likelihood of being in an earlier stage of smoking uptake (OR=0.89; 95% CI, 0.85, 0.99) and lower 30-d prevalence of smoking (OR=0.86; 95% CI, 0.77, 0.94) only when the ban was strongly enforced, as measured by instances when teenagers perceived that most or all students obeyed the rule.
Adams et al, 2009453
Observational, cross-sectional
N=16,561 students, grades 7-12, at 20 middle and high schools in northern and central Illinois and participating
2007 Data on students’ personal and observed smoking habits were obtained by questionnaire. Phone interviews were conducted with school administrators and staff who
• Schools with a higher enforcement variable had less current tobacco use by minors (OR=0.83; 95% CI, 0.70-

in the Youth Tobacco Access Project, a large 5-y intervention study of youth tobacco use funded by the National Cancer Institute
were most knowledgeable about enforcement of the school tobacco policy. Comprehensiveness of school tobacco policies, including applicability, restrictions, and repercussions, was rated. Random effects regression with a 2-level hierarchical model examined school enforcement, observations of minors using tobacco on school grounds, and youth smoking status.
0.99). • Schools with higher
enforcement of tobacco policies had fewer observations of tobacco use on school grounds. For each additional unit of enforcement, the odds that youth saw minors using tobacco on the school grounds decreased by ≈0.5.
• Comprehensiveness of school tobacco policies was not significantly related to current tobacco use by students.
Lipperman-Kreda et al, 2009454
Observational, cross-sectional
N=21,281 middle and high school students (primarily grades 8 and 11) in 255 schools who participated in the 2006 Oregon Health Teens Survey
2006 Students were asked about school tobacco policies and whether the policies were strictly enforced, as well as about their individual smoking behavior. The percentage of students who perceived the rule against tobacco use as strictly enforced was calculated in each school. By quartiles, schools with perceived low levels of strictly enforced antismoking policy were compared with schools with higher levels of perceived enforcement against student smoking.
• After covariate adjustment, students at schools with high enforcement had 0.62 times the odds of any cigarette smoking and 0.46 times the odds of daily cigarette smoking compared with students in schools with low enforcement of antismoking policy (P<0.05 each).
Sabiston et al, 2009455
Observational, cross-sectional
N=24,213 students, grades 10-11, from 81 schools in 5 Canadian provinces
2003-2004 Student smoking behaviors were assessed using the SHAPES questionnaire. Written policies were collected from schools, interviews with school administrators were conducted, and school properties were observed to assess multiple dimensions of the school tobacco policy. A multilevel logistic regression model assessed the relations between social smoking indicators, school policy characteristics, and student smoking behavior.
• Students were less likely to be smokers in schools with stronger prohibition (OR=0.83; 95% CI, 0.72, 0.95) compared with weaker prohibition.
• Students’ perceptions of school tobacco context were associated with a greater likelihood of smoking (OR=1.26; 95% CI, 1.20, 1.33).
Evans-Whipp et al, 2010456
Observational, cross-sectional
N=3466 students, grades 6, 8 and 10, from 285 schools in the International Youth
2003 Students completed questionnaires about their personal smoking behaviors and smoking behaviors occurring on school property.
• Peer smoking on school grounds was lower in schools with a strict enforcement of policy (OR=0.45; 95% CI,

Development Study in Washington state, the United States, and Victoria, Australia
Selected school staff from each school completed surveys, and the comprehensiveness of each school’s smoking policy was rated. Random effects logistic regression evaluated the relation of specific school policy components with smoking outcomes.
0.25-0.82; P=0.009). • There was no clear evidence
that a comprehensive smoking ban, harsh penalties, remedial penalties, harm minimization policy, or abstinence policy had any significant relation to smoking outcomes.
Lovato et al, 2007457
Observational, cross-sectional
N=22,318 students in grades 10 and 11 in 81 randomly sampled schools in 5 districts in Canada
Not reported Student smoking behaviors were assessed using the SHAPES tobacco module, and a senior school administrator with extensive knowledge of each school’s tobacco policy was also recruited to complete a questionnaire about the implementation of the school smoking policy. Written tobacco policies were also collected from each school and each corresponding school district board. Multiple linear regression was conducted to examine policy implementation and students’ perception of policy enforcement as predictors of school smoking prevalence and smoking behaviors occurring on and off school property.
• Students’ perceptions of policy enforcement were correlated with school smoking prevalence (R2=0.36) and location of tobacco use (R2=0.23-0.63).
• Policy intention and implementation subscales did not significantly correlate with school smoking prevalence but were moderately correlated with tobacco use on school property (R2=0.21-0.27).
Lovato et al, 2010210
Observational, cross-sectional
N=22,681 students in grades 10 and 11 in 77 schools in 5 Canadian provinces
2003-2004 Student smoking behaviors were assessed using the SHAPES questionnaire. Written school antismoking policies were examined and scored to quantify their “smoking policy intent,” and interviews were conducted with school officials to ascertain the degree of policy enforcement. School properties were also observed and tobacco control bylaws obtained from each school’s municipality. Data on community-level variables were obtained from the Canadian census data records. Multilevel generalized linear models evaluated the relation between key individual-, school-, or community-level variables and student smoking.
• Students in schools with stronger enforcement of antismoking policies were more likely to smoke (OR=1.20; 95% CI, 1.07, 1.35).
Lovato et al 2010458
Observational, cross-sectional
N=29,553 students in grades 5-9 who
2004-2005 Student smoking behaviors were assessed using the SHAPES
• Neither smoking policy intent variables nor strict

participated in the Canadian Youth Smoking Survey
questionnaire. Each school’s written tobacco policy was examined, scored, and coded, with higher scores representing stronger policies. Enforcement of school policies was assessed by interviewing school staff most knowledgeable about the anti-smoking policy. Negative binomial regression analysis models examined the relation between school policy characteristics and school smoking prevalence. Multilevel logistic regression evaluated the relations between school-level variables and individual smoking status.
enforcement of anti-tobacco policies were significant predictors of individual smoking status.
Residence-Based Restrictions on Smoking
Author, y Design Population Duration Intervention/Evaluation Major Findings Mills et al, 2009459
Systematic review of cross-sectional (n=16) and longitudinal (n=7) studies
Adults in the United States (n=20 studies), Canada (n=2 studies), Australia (n=2 studies), and United Kingdom (n=1 study)
Studies published between January 1990 and November 2008
Home smoking restrictions were assessed using a variety of different questions in the included studies. Complete or partial home smoking bans were evaluated and typically compared with no restrictions. Outcome measures included smoking prevalence, smoking cessation, daily cigarette consumption by smokers, and relapse after smoking cessation.
• Of 2 studies that evaluated smoking prevalence, 2 found significantly lower prevalence of smokers in persons living in homes with smoking restrictions compared with homes without smoking restrictions.
• Of 14 studies that assessed daily cigarette consumption, 13 found significantly lower daily cigarette consumption in smokers living in homes with smoking restrictions compared with homes without restrictions. One study found null results. The 3 longitudinal studies that reported significantly lower consumption showed a reduction in daily cigarette use of ≈2 cigarettes per day.
• Of 13 studies that assessed quitting, 12 showed that smokers living in homes with smoking restrictions were more likely to quit compared with those living in homes

with no smoking restrictions. One study reported null results. Point estimates for OR of abstinence ranged from 1.32 to 3.89 in the various studies.
• All 5 studies that reported relapse showed that smokers living in smoke-free homes were less likely to relapse after quitting, compared with those living in homes without smoking restrictions. In a longitudinal study, Hyland et al found that those living in a smoke-free home at baseline were less likely to be smoking 4 y later compared with those who allowed smoking in their homes (OR=0.6; 95% CI, 0.4, 0.8).
Emory et al, 2010460
Systematic review of longitudinal (n=2) and cross-sectional studies (n=16)
Children age <18 y in the United States (n=16 studies), Ukraine (n=1 study), Finland (n=1 study), and Australia (n=1 study)
• Variable individual study duration
• Studies published between January 1990 and January 2010 were included.
• In 7 of the included studies, smoking restrictions at home were separated into 3 categories: complete, partial, and no smoking restrictions.
• Among the studies, 11 used a dichotomous exposure, in which completely smoke-free homes were compared with all others.
• Outcomes examined in the various studies were heterogeneous and included smoking initiation, status or transitions on the smoking uptake continuum, current smoking defined as smoking in the past 30 d, cigarette consumption among current smokers, intent to smoke, and smoking cessation among youth-ever smokers.
• Included studies adjusted for relevant covariates.
• Both longitudinal studies showed positive association between home smoking restriction and at least 1 index of improved smoking behavior among adolescents.
• One of these longitudinal studies (Klein et al) showed that adolescents with a home smoking ban were 12% less likely to have smoked in the past month (OR= 0.88; 95% CI, 0.80, 0.96) compared with those without home smoking bans.
• In the other longitudinal study (Albers et al), having a smoke free home was not significantly related to progression to established smoking. Not having a smoke-free home was associated with transition from nonsmoking to experimentation for children who lived with nonsmokers (OR=1.89; 95% CI, 1.30, 2.74)

but not for children who lived with smokers.
• Of the 17 cross-sectional studies, 14 showed at least some marginal positive association between home smoking restriction and adolescent smoking behavior. For example, Rissell et al 2008 found that students with clear rules about not smoking were 33% less likely to be current smokers (OR= 0.67; 95% CI, 0.49, 0.90) than those without clear rules. Rainio et al (2008) showed that odds of being cigarette experimenters (as opposed to never-users) were 2-fold higher in children with no home smoking restrictions vs those in smoke-free homes.
Kabir et al, 2010461
Systematic review of cross-sectional studies (n=8), longitudinal (n=1), quasi-experimental (n=1), and randomized trial (n=1)
Children age 0-17 y (mean age 12-14 y) in studies in the United States (n=5 studies), Europe (n=5 studies), Australia (n=1 study), and Latin America, Asia, or the Middle East (n=1 study)
Studies published between January 2000 and April 2010
The study assessed the relation of voluntary home smoking restrictions with secondhand smoke exposure in children. Studies used either self-reported or biochemical measures (urinary cotinine, hair cotinine: creatinine ratio) to assess secondhand smoke exposure.
• Children living in homes with smoking bans had significantly lower odds of secondhand smoke exposure compared with those living in homes with no smoking bans.
• Children living in homes with smoking restrictions had significantly less biochemical concentration of secondhand smoke (>50% less) than those living in homes with no smoking restrictions.
Pizacani et al, 2004462
Observational, prospective N=1133 adult smokers identified from a 1997 telephone survey in Oregon, including 583 assessed during follow-up
1997-1999, median duration of follow-up 21.3 mo
A standardized questionnaire on tobacco attitudes and practices was administered by telephone, including level of household smoking restrictions, eg, full home ban, partial home ban, and no home smoking ban. Of the 1133 smokers identified at baseline, 583 were interviewed at follow-up to assess quitting activities, quit attempts, time until relapse, and smoking cessation.
• A full ban at baseline was associated with higher odds of a subsequent quit attempt (OR=2.0; 95% CI, 1.0, 3.9).
• Among respondents in the preparation stage at baseline (intention to quit in the next month with a quit attempt in the previous year), a full ban was associated with higher odds of being in cessation for at least 7 d during follow-up

(OR=4.4; 95% CI, 1.1, 18.7) and a lower relapse rate (HR=0.5; 95% CI, 0.2, 0.9).
• These associations were not seen among smokers in precontemplation (no intention to quit) or contemplation (intention to quit within the next 6 mo) stages.
Farkas et al, 2000439
Observational, cross-sectional
N=17,185 adolescents, age 15-17 y, in the CPS conducted by the US Census Bureau
1992-1993, and 1995-1996
Smoking behavior and household and workplace smoking restrictions were assessed using standardized questionnaires. These responses were designated as smoke-free, partial ban, and no smoking restrictions, respectively.
• Compared with those in households with no smoking restrictions, adolescents who lived in smoke-free households were less likely to be smokers (OR=0.74; 95% CI, 0.62, 0.88).
• Among ever-smokers, adolescents were more likely to be former smokers if they lived in smoke-free homes (OR=1.80; 95% CI, 1.23, 2.65).
Wakefield et al, 2000452
Observational, cross-sectional
N=17,287 students, grades 9-12, age 14-17 y, obtained by a 3-stage sampling procedure of US counties
Spring 1996 Smoking behavior and household and school smoking restrictions were assessed using standardized questionnaires.
• Restrictions on smoking at home were associated with a greater likelihood of being in an earlier stage of smoking uptake (P<0.05) and a lower 30-d prevalence of smoking (OR=0.79; 95% CI, 0.67, 0.91).
Wechsler et al, 2001463
Observational, cross-sectional
N=14,138 students enrolled in 119 US colleges and participating in the Harvard School of Public Health Alcohol Survey
Spring 1999 Smoking behavior and household and school smoking restrictions were assessed using standardized questionnaires. Multiple logistic regression was used to model association of current cigarette use in the past 30 d with types of housing after adjusting for smoking history and other variables.
• Current smoking was lower among residents of smoke-free housing compared with residents of unrestricted housing (21.0% vs 30.6%, P<0.0001).
Siahpush et al, 2003464
Observational, cross-sectional
N=2526 current smokers and successful quitters age 14+ y in the 1998 Australian National Drug Strategy Household Survey
1998 Smoking behavior of participants was ascertained by a mixture of interviews and self-administered questionnaires. Participants also answered questions on the presence of a smoking ban in their homes, schools, or workplaces.
• The odds of having quit smoking were 4.5 times greater for respondents who lived in households where smoking was not permitted than for those in households with no smoking restrictions

Associations were examined by multivariate logistic regression analysis.
(OR 4.5; 95% CI, 3.1, 6.6).
Shelley et al, 2007465
Observational, cross-sectional
N=1472 Asians (1071 nonsmokers and 401 current smokers), age 18-74 y, living in 2 communities in New York City
November 2002−August 2003
Smoking behavior, health status, and household and workplace smoking restrictions were assessed using standardized questionnaires.
• Among nonsmokers, compared with no smoking restrictions, respondents who had a total smoking ban at home only were more likely to report excellent/good health (OR=1.90; P<0.05); as were respondents who had a total smoking ban both at home and work (OR=2.61; P<0.01).
Schultz et al, 2010466
Observational, cross-sectional
N=29,243 students, grades 5-9, age 11-15 y, from randomly sampled public and private schools in 10 provinces in Canada and participating in the Canadian Youth Smoking Survey
2004-2005 Participants completed questionnaires on smoking behavior and home smoking restrictions, including total ban, some restrictions, and no restrictions. Susceptibility to smoking was categorized into levels of smoking experience and intention: nonsusceptible nonsmoker, susceptible nonsmoker, and experimenter/smoker.
• Respondents living in homes with no smoking bans were more likely (OR=1.70; 95% CI, 1.31, 2.21) to be smokers or experimenters compared with those living in homes with smoking bans
• For nonsmokers, the odds of being susceptible to smoking increased with absence of a total household smoking ban.
Myung et al, 2010467
Observational, cross-sectional
N=2545 Asian male smokers age >18 y living in California
2003-2004 Data on smoking status, intention to quit smoking, and household smoking restrictions were obtained from the California Korean American Tobacco Use Survey. Multivariate adjusted logistic regression model was used to study the association between household smoking restriction and intention to quit.
• Having an intention to quit smoking in those living in homes with complete or partial smoking restrictions was 2.5 times higher than for those with no restriction on smoking in their homes (OR=2.54; 95% CI, 1.22, 2.58).
Ayers et al, 2010468
Observational, cross-sectional
N=500 adult Koreans living in Seoul, Korea and N=2830 persons of Korean ancestry living in California
2002 Telephone interviews were conducted with randomly selected persons to obtain information about the kind of smoking restriction that exists in their home, estimate the number of cigarettes they and their “most exposed” child were exposed to, and obtain information about other important covariates. Logistic regression models were constructed to evaluate the association between home smoking restrictions and secondhand smoke
• Smoking restrictions were inversely associated with home secondhand smoke exposure.
• The predicted probability of any secondhand smoke exposure in Koreans without any home smoking restriction was 0.5 (95% CI, 0.45, 0.56) compared with 0.1 (95% CI, 0.17, 0.33) in Koreans with complete home smoking ban.
• The predicted probability of

exposure and predicted probabilities were reported.
any secondhand smoke exposure in persons of Korean ancestry living in California without any home smoking restriction was 0.62 (95% CI, 0.52, 0.70) compared with 0.03 (95% CI, 0.02, 0.04) in those with a complete home smoking ban.
Fu et al, 2010469
Observational, cross-sectional
N=291 American Indians obtained from a cohort of smokers participating in the Minnesota Health Care Programs’ nicotine replacement treatment program
2005-2006 Administrative records obtained at baseline and follow-up survey data obtained after 8 mo of nicotine replacement therapy were used to obtain data on smoking behavior, type of smoking ban at home, and other demographics. Multivariate analysis assessed the relation between presence of complete home smoking ban and 7-d point prevalence abstinence.
• Complete smoking ban was associated with a greater likelihood of smoking abstinence in the past week, compared with no ban and partial ban (OR=3.57; 95% CI, 1.52, 8.40).
IOM indicates Institute of Medicine; RR, relative risk; CI, confidence interval; MI, myocardial infarction; OR, odds ratio; TUS, Tobacco Use Supplement; HR, hazard ratio; CPS, current population surveys; COMMIT, Community Intervention Trial for Smoking Cessation; and SHAPES, School Health Action, Planning and Evaluation System. Note: Reference numbers (eg, Meyers et al, 2009413) appearing in this supplementary table correspond with those listed in the reference section of the statement. For the purposes of this supplementary table, these meta-analyses or systematic reviews (see "Author, y" column) are considered the primary citation. Additional studies mentioned in the primary citation may be included in the "Intervention/Exposure" and "Findings" columns. The additional studies can be accessed through the primary citation.

1
Supplementary Table 14. Examples of Major Surveillance Surveys for Diet, Physical Activity, and Tobacco Use in the United States
Survey Description Methodology Frequency What Is Measured National Health and Nutrition Examination Survey (NHANES) http://www.cdc.gov/nchs/nhanes.htm National Center for Health Statistics*
A program of studies that assesses the health and nutritional status of adults and children in the United States
A nationally representative sample of ≈5000 persons located in counties across the country is examined every year. Fifteen counties are visited annually. NHANES incorporates both a physical examination and an interview.
Ongoing The NHANES interview includes demographic, socioeconomic, dietary, and health-related questions. The examination component consists of medical, dental, and physiological measurements, as well as laboratory tests.
Youth Risk Behavioral Surveillance System (YRBSS)
http://www.cdc.gov/HealthyYouth/yrbs/index.htm CDC and state, territorial, and local education and health agencies and tribal governments*
Monitors priority health-risk behaviors and prevalence of obesity and asthma among youth and young adults
Includes a national school-based survey and district surveys
Every 2 y since 1991
YRBSS monitors 6 categories of priority health risk: • Behaviors that contribute to
unintentional injuries and violence • Tobacco use • Alcohol and other drug use • Sexual behaviors that contribute to
unintended pregnancy and sexually transmitted diseases
• Unhealthy dietary behaviors • Physical inactivity In addition, YRBSS monitors the prevalence of obesity and asthma.
Behavioral Risk Factor Surveillance System (BRFSS)
http://www.cdc.gov/brfss/ CDC, states, territories, and tribal governments*
A state-based system of health surveys that collects information on health risk behaviors, preventive health practices, and healthcare access primarily related to chronic disease and injury
Currently data are collected monthly in all 50 states, the District of Columbia, Puerto Rico, the US Virgin Islands, and Guam. More than 350,000 adults are interviewed by telephone each year.
Annually since 1984
BRFSS collects data on behaviors that are associated with preventable chronic diseases, injuries, and infectious diseases. States use BRFSS data to identify emerging health problems, establish and track health objectives, and develop and evaluate public health policies and programs. Many states also use BRFSS data to support health-related legislative efforts.
Household Food Acquisition and Purchase Survey (FoodAPS)
http://www.ers.usda.gov/Briefing/DietQuality/food_aps.htm USDA Economic Research Service*
A nationally representative survey of household food purchases and acquisitions
Detailed information will be collected about foods purchased for consumption at home and away from home as well as foods acquired through food and nutrition assistance programs (both public and private). The survey will collect information from up to 3500 low-income and 1500 higher-income households.
Full-scale implementation of the study is expected in 2012.
FoodAPS will provide data about household food choices. • Quantities, prices, and expenditures
for all at-home and away-from-home foods and beverages bought and acquired from all sources
• Nutritional value of foods bought and acquired
• Eating occasions by household members

2
Methodology is still being finalized.
• Household characteristics, including income, program participation, nonfood expenditures, food security, health status, and diet and nutrition knowledge
• Household access to food, including location of purchase and distance to outlets
Quarterly Food-at-Home Price Database (QFAHPD)
http://www.ers.usda.gov/Briefing/CPIFoodAndExpenditures/qfahpd.htm USDA Economic Research Service*
Provides food price data to support research on the economic determinants of diet quality and health outcomes. Contains regional and market-level quarterly prices across all 48 contiguous states.
The database is constructed from Nielsen Homescan data and includes quarterly observations on the mean price of 52 food categories for 35 market groups covering the contiguous United States.
1999-2006
The food categories created by QFAHPD correspond with the 2005 Dietary Guidelines for Americans and capture price premiums for convenience and processing. Prices are presented in dollars per 100 g of food as purchased by consumers.
School Health Profiles (Profiles)
http://www.cdc.gov/healthyyouth/profiles/index.htm States, territories, tribal governments, and school districts*
Provides data on health policies and activities at schools for states and large urban school districts
A representative sample of public middle schools and high schools in a state, territory, tribal government, or school district collected with self-administered, mailed questionnaires
Every 2 y since 1994
Profiles school health education requirements and content, physical education requirements, school health policies related to HIV infection/AIDS, prevention of tobacco use, nutrition, asthma management activities, and family and community involvement in school health programs
School Health Policies and Practices Study (SHPPS)
http://www.cdc.gov/HealthyYouth/shpps/index.htm CDC*
Provides national data on 8 components of school health at the state, school district, school, and classroom levels
Information collected includes all states, a nationally representative sample of school districts, and a nationally representative sample of public and private elementary schools, middle schools, and high schools. Computer-assisted personal interviews, Web-based surveys, and self-administered, mailed questionnaires are used.
Every 6 y since 1994
SHPPS studies health education, physical education and activity, health services, mental health and social services, nutrition services, healthy and safe school environment, faculty and staff health promotion, and family and community involvement.
National Youth Tobacco Survey (NYTS)
http://www.cdc.gov/tobacco/data_statistics/surveys/NYTS/index.htm
A school-based survey of students in grades 6-12 that provides national data on long-term, intermediate, and short-term indicators key to the design, implementation, and evaluation of comprehensive tobacco prevention and control programs. The NYTS also serves
• Both public and private schools eligible for inclusion
• Multistage design*; schools randomly selected, with probability proportional to enrollment size *Classrooms are chosen
Every 2 or 3 y since 1999
The NYTS was designed to examine correlates of tobacco use such as demographics, minors’ access to tobacco, and exposure to secondhand smoke. The NYTS provides nationally representative data about middle and high school youths’ tobacco-related

3
CDC, states, territories, and tribal governments*
as a baseline for comparing progress toward meeting selected Healthy People 2010 goals for reducing tobacco use among youth.
randomly within selected schools, and all students in selected classes are eligible to participate.
• Anonymous and self-administered questionnaire
• Only 1 class period required to administer questionnaire.
• State-level data collected, but data can be analyzed at the local level.
beliefs, attitudes, behaviors, and exposure to pro- and anti-tobacco influences.
Global Youth Tobacco Surveillance (GYTS)
http://www.cdc.gov/mmwr/preview/mmwrhtml/ss5701a1.htm WHO, CDC, Canadian Public Health Association, individual countries*
A school-based survey designed to enhance the capacity of countries to monitor tobacco use among youth and to guide the implementation and evaluation of tobacco prevention and control programs. The GYTS uses a standard methodology for constructing the sampling frame, selecting schools and classes, preparing questionnaires, following consistent field procedures, and using consistent data management procedures for data processing and analysis. Information generated from the GYTS can be used to stimulate the development of tobacco control programs and can serve as a means to assess progress in meeting program goals.
GYTS is composed of 56 “core” questions. The questionnaire also allows countries to insert their own country-specific questions.
Ongoing • Knowledge and attitudes of young people toward cigarette smoking
• Prevalence of cigarette smoking and other tobacco use among young people
• Role of the media and advertising in young people’s use of cigarettes
• Access to cigarettes
• Tobacco-related school curriculum
• Environmental tobacco smoke
• Cessation of cigarette smoking
Tobacco Marketing Surveillance ProjectTrinkets and Trash
http://www.trinketsandtrash.org/ University of Medicine and Dentistry of New Jersey*
Tobacco marketing surveillance project and archive
Monitors tobacco industry marketing in magazines, direct mail, email, websites, and other channels
Ongoing Trinkets and Trash makes images and information available through its website.
American Time Use Survey (ATUS)
http://www.bls.gov/tus/ Bureau of Labor Statistics; US Census Bureau*
Provides nationally representative estimates of how, where, and with whom Americans spend their time and is the only federal survey providing data on the full range of nonmarket activities, from child care to volunteering. ATUS data files are used by researchers to study a broad range of issues; the data files include information collected from
Data are collected through telephone interviews. Census Bureau interviewers use computer-assisted telephone interviewing. Households without telephones can also be selected for the ATUS sample. In a letter about the survey, the Bureau of Labor Statistics asks respondents in these households to call a toll-free
Annually since 2003
Age; sex; race; activity start time, stop time, duration, and location; family income; school enrollment; educational attainment; marital status; employment status; usual hours of work; multiple job status; full- or part-time work; occupation; body weight; geographic location/region of the country; eating and health module

4
>98,000 interviews conducted from 2003 to 2009. Data files can be linked to data files from the Current Population Survey, expanding the context in which time-use data can be analyzed. ATUS data are being used to examine eating and drinking patterns and how they relate to a person's overall health; how Americans use food assistance programs; and how different groups of Americans spend their leisure time, such as watching television, socializing, and exercising.
number to complete the interview. Respondents are only interviewed once.
Demographic and Health Surveys (DHS)
http://www.measuredhs.com/
One implementing agency, usually a bona fide governmental, nongovernmental, or private sector organization such as a national statistical office, a family planning organization, a ministry of health, a university, a government research group, or a private research group. Involvement of ministries of health is becoming more important because of the increased health content of DHS surveys and the need to have access to specialized staff who can collect biological specimens such as blood samples.*
Provides data for a wide range of monitoring and impact evaluation indicators in the areas of population, health, and nutrition.
Standard DHS surveys have large sample sizes (usually between 5000 and 30,000 households) and typically are conducted every 5 y to allow comparisons over time.
Interim DHS surveys focus on collection of information on key performance monitoring indicators but may not include data for all impact evaluation measures (such as mortality rates). These surveys are conducted between rounds of DHS surveys and have shorter questionnaires than DHS surveys. Although nationally representative, these surveys have smaller samples than DHS surveys (2000-3000 households).
Every 5 y Anemia, child health, education, family planning, fertility, fertility preferences, gender/domestic violence, HIV prevalence, knowledge, attitudes, and behavior, household and respondent characteristics, infant/child mortality, malaria, maternal health, maternal mortality, nutrition, wealth/SES, and women’s empowerment.
National Health Interview Survey (NHIS)
http://www.cdc.gov/nchs/nhis.htm
Monitors the health of the nation on a broad range of health topics, including health status, healthcare access, and progress toward achieving national health objectives
The NHIS is a large-scale household interview survey of a statistically representative sample of the US civilian non-institutionalized population. Interviewers visit 35,000-40,000 households across the country and collect data on about 75,000-
Annually since 1957
Demographic variables, SES, general health, health conditions, health behaviors, medical care/access, household information, and geography

5
US Census Bureau, National Center for Health Statistics*
100,000 individuals. The questionnaire consists of 2 main parts: a core set of questions that remain basically unchanged from year to year and supplemental questions that change from year to year and that collect additional data pertaining to current issues of national importance. About 20 min of an average NHIS interview is devoted to supplemental questions. Federal agencies and private nonprofit organizations may sponsor supplements. NHIS analyses on a variety of topics are published through Vital and Health Statistics Series Reports, National Health Statistics Reports, NCHS Data Briefs, and Health E-Stats.
Early Childhood Longitudinal Program (ECLS-B) http://nces.ed.gov/ecls/birth.asp
US Department of Education, National Center for Education Statistics*
ECLS was designed to provide decision makers, researchers, child care providers, teachers, and parents with detailed information about children's early life experiences. ECLS-B, the birth cohort of ECLS, looks at children's health, development, care, and education during the formative years from birth through kindergarten entry.
ECLS-B collects information from children, parents, child care providers, teachers, and schools. It is a nationally representative sample of children born in 1998 and 2001. The children participating in the study came from diverse socioeconomic and racial/ethnic backgrounds with oversamples of Asian and Pacific Islander children, American Indian and Alaska Native children, Chinese children, twins, and low and very low birth weight children. ECLS-B is a longitudinal study.
Ongoing from 1998
Cognitive assessment, child development, school readiness, early school experience. ECLS provides national data on children's status at birth and at various points thereafter; children's transitions to nonparental care, early education programs, and school; and children's experiences and growth through 8th grade. ECLS also provides data to analyze the relations among a wide range of family, school, community, and individual variables with children's development, early learning, and performance in school.
National Collaborative on Childhood Obesity Research (NCCOR) Measures Registry http://www.nccor.org/measures National Collaborative on Childhood Obesity Research*
Free, searchable online registry was designed to provide measures and resources for use in childhood obesity research. The purpose of the registry is to promote consistent use of common measures and research methods across childhood obesity prevention and research at the individual, community, and population levels. Measures are defined broadly as tools and methodologies to assess individual diet,
The Measures Registry was developed by a collaborative team of NCCOR members, contractors, and academic experts who searched bibliographic resources for peer-reviewed articles in 4 domains: (1) individual dietary behavior, (2) individual physical activity behavior, (3) food environment, and (4) physical activity environment. Selected articles deemed to contain
Ongoing from 2011
The Measures Registry includes nearly 750 measures in 4 domains. Types of measures in the Registry include questionnaires, instruments, diaries, logs, electronic devices, direct observation of people or environments, protocols, and analytic techniques. Details about each measure include validity, reliability, protocols for use, and settings, geographic areas, and populations in which the measure has

6
physical activity, and the environments in which these behaviors occur.
measures in these domains were then summarized for entry into the searchable database. Data abstraction form, search parameters, and coding decisions for describing measures are available on the website.
been used. Users can search for measures and details about how to use them, find measures in development, link to other measures registries and related resources, and submit new measures for inclusion.
CDC indicates Centers for Disease Control and Prevention; USDA, US Dept of Agriculture; HIV, human immunodeficiency virus; AIDS, acquired immune deficiency syndrome; WHO, World Health Organization; CPS, current population surveys; and SES, socioeconomic status. *Ownership of data.

1
Supplementary Table 2. Media and Education Campaigns to Reduce Smoking
Author, y Design Population Intervention/Exposure Findings
Farrelly et al, 200583
Quasi-experimental comparison (pre- vs postintervention)
National US monitoring data, including ≈50,000 students in grades 8, 10, and 12
Pre- vs postevaluation of a media campaign on smoking prevalence in US youth, including a “Truth” campaign, a TV campaign, and a measure of the “dose” of exposure by market
• The prevalence of youth smoking declined from 25.3% to 18% between 1999 and 2002.
• The media campaign was estimated to account for 22% of this decline.
Henriksen et al, 200684
Randomized controlled study
N=832, 9th and 10th graders, age 14-17 y
Evaluation of responses of adolescents to 5 smoking prevention ads sponsored by a tobacco company
• Tobacco company ads were viewed as less favorable than other ads.
• None of the ads had an effect on intention to smoke. • Company-sponsored ads engendered a more favorable
response to the sponsoring company. Sutfin et al 200885
Cross-sectional between subjects, randomized experimental design
N=488 high school students, some smokers and some nonsmokers
Exposure to 3 approaches to antismoking ad: 1. Endangering others 2. Negative life circumstances 3. Industry manipulation
• Negative life circumstances were associated with lower intention to smoke.
• Response differed by smoking status. • Smokers liked ads with more negative thoughts less.
US Surgeon General’s Report, 200076
Review, nonsystematic
10 studies, ranging from N=654 to N=6716 Intervention compared with comparison group
Educational anti-tobacco strategies • Education conducted in conjunction with community and healthcare system−based strategies can postpone or prevent smoking onset in 20-40% of adolescents.
CDC, 200777
Review of health communication intervention best practices for comprehensive tobacco control programs.
Multiple states Review of effects of paid television, radio, billboard, print, and web-based advertising to reduce tobacco use
• Countermarketing and media must have sufficient reach, frequency, and duration to be successful.
• Ads should reach 75%-85% of the target audience each quarter.
• A campaign should run at least 6 mo to increase awareness, 12-18 mo to have an impact on attitudes, and 18-24 mo to influence behavior.
Davis et al, 200879
Review, systematic Publications from 1970 to May 2007, including 10 controlled field experiments (26 publications) in children and 19 controlled field experiments (39 publications) in adults
Media approaches to tobacco control: 1. Mass media 2. Marketing communication (ie,
sponsorship) 3. Consumer marketing (ie, packaging) 4. Stakeholder marketing (ie, health
warnings)
• Media communications play a key role in knowledge, attitudes, and behaviors related to tobacco.
• Cigarettes are one of the most heavily marketed products in the United States, and there is a causal relationship between tobacco advertising and increased tobacco use.
• Mass media campaigns should be designed to discourage tobacco use, curb smoking initiation, and encourage cessation. Best results occur when mass media is combined with other strategies.
• Advertising that includes strong negative messages about health is most effective.
Wakefield et al, 201081
Review, nonsystematic
Studies of antismoking media campaigns,
Mass media campaigns for smoking cessation
• Mass media campaigns were associated with declines in smoking initiation in adolescents and increases in adults

2
including 25 controlled field experiments (youth); 40 controlled field experiments (adults); 57 population-based state/national media campaigns; and 11 time-series studies with controls (adults)
quitting. • Smoking prevention is more likely when mass media
efforts are combined with school or community programs.
• In adults, mass media campaigns work best when combined with other control strategies, but study design often makes it difficult to establish independent effects.
• The dose of exposure to ad campaigns is important: more exposure improves efficacy.
Tynan et al, 201080
Review, nonsystematic
Children and adults Multiple • Sustained media campaigns combined with other interventions − Increase negative attitudes about smoking − Decrease smoking initiation among youth − Promote smoking cessation
Pennant et al, 201082
Systematic review of multicomponent CVD prevention programs that included a media-based approach and were published between January 1970 and July 2008
36 relevant community intervention programs (international) using controlled before-after comparisons in adults
Multicomponent prevention programs all included a media-based approach, with (1) screening and (2) individual and group intervention. Interventions were delivered at the workplace, schools, or other locations.
• Net absolute reduction of smoking prevalence of 1.7% across studies (statistical significance not provided)
CDC indicates Centers for Disease Control and Prevention, and CVD, cardiovascular disease.
Note: Reference numbers (eg, Farrelly et al, 2005483) appearing in this supplementary table correspond with those listed in the reference section of the statement. For the purposes of this supplementary table, these meta-analyses or systematic reviews (see "Author, y" column) are considered the primary citation. Additional studies mentioned in the primary citation may be included in the "Intervention/Exposure" and "Findings" columns. The additional studies can be accessed through the primary citation.

Supplementary Table 3. Nutrient and Front-of-Pack Labels
Observational Studies of Consumer Behavior
Author, y
Design Population Duration Intervention/Evaluation Major Findings
Neuhouser et al, 199989
Observational, cross-sectional
N=1450 adult residents of Washington state
September 1995−September 1996
The questionnaire assessed use of nutrition labels, fat-related diet habits, fruit and vegetable consumption, diet-related psychosocial factors, health behavior, and demographic characteristics.
• Use of nutrition labels was significantly higher among women, residents age <35 y, and residents with more than a high school education.
• When controlled for demographic factors, the strongest predictors of label use were belief in the importance of eating a low-fat diet, belief in an association between diet and cancer, and being in the maintenance stage of change for adopting a low-fat diet.
• Label use was significantly associated with lower fat intake and, after adjusting for all demographic, psychosocial, and behavioral variables, explained 6% of the variance in fat intake (P<0.001).
• Label use was not associated with fruit and vegetable consumption.
Weaver and Finke, 200393
Observational, cross-sectional
N=5765 respondents age 20+ y who completed both the CSFII and the DHKS
1994-1996 Self-reported data from a population-based cross-sectional survey. This study modeled total consumption of added sugar. Respondents’ consumption of these added sugars was originally measured in teaspoons. As a dependent variable in this model, added sugar consumption was measured as a percentage of food density so that persons with different caloric needs and intakes could be compared more accurately. The results indicate which persons are receiving a larger proportion of daily energy intake from sugar.
• The average proportion of food energy from added sugars for the entire sample was 13.2%.
• Regular use of sugar information on nutrition panels was associated with a significantly lower density of added sugar.
• Persons who “always” used labels for sugar information consumed 1.1% less of their total energy from added sugars, compared with all other individuals (P<0.05).
Satia et al, 200591
Observational, cross-sectional
N=658 blacks age 20-70 y
Not reported Self-reported data from a population-based cross-sectional survey. An 11-page questionnaire assessed nutrition label use, fruit and vegetable consumption, total and saturated fat intakes, fat-related dietary behaviors, diet-related psychosocial factors, and demographic and behavioral characteristics. Mean age was 44±12 y, 41% were men, 37% were college
• 78% of respondents read nutrition labels when they purchased packaged foods.
• Nutrition label use was significantly higher among participants who were women, older, educated beyond high school, and obese (P<0.05).
• After adjusting for demographic characteristics, the strongest psychosocial predictors of nutrition label use were healthful eating self-efficacy, strong belief in a diet-cancer relationship, and

graduates, and 75% were overweight/obese.
trying to lose weight. • Respondents who used labels usually/often had
higher consumption of fruits and vegetables (mean 3.0 vs 2.1 servings per day, P<0.0001).
• Respondents who usually/often read grams of fat information had lower total fat intake compared with those who rarely/never read this information (mean 29.1 vs 34.8 g/d, P<0.0001).
Lewis et al, 200992
Observational, cross-sectional
N=5603 US adults age 18+ y in the NHANES survey
2005-2006 A survey was conducted to examine use of label information among persons with and without chronic disease. Participants were classified into 5 disease categories: hypertension, hypercholesterolemia, diabetes/at risk of diabetes, overweight, and heart disease. Data were collected via 17 questions about awareness of federal nutrition information and food label use. Two 24-h dietary recall interviews also were given.
• Subjects with chronic diseases were more aware of nutritional recommendations, checked more often for specific nutrients, and used nutrition information on food labels more often than did participants without such diseases.
• However, label behavior use was inconsistently associated with dietary guideline compliance. Therefore, people with chronic disease generally reported better nutrition awareness than those without, but this did not translate into better eating behaviors.
Grimes et al, 200990
Observational, cross-sectional
N=474 subjects surveyed in shopping centers within metropolitan Melbourne, Australia; 65% were female; 64% were the family’s main shopper
Survey instrument to assess consumers’ salt knowledge
Current labeling regulations in Australia require food products to display the sodium content of the food per serving and per 100 g within the nutrition information panel. Salt content is not provided (Sanz, 2007a) and many consumers may lack the knowledge to convert sodium into salt levels to accurately interpret sodium information. This study examined consumers’ ability to interpret nutrition information about salt labeled on food products. Researchers approached passing shoppers and invited them to take part in the study by completing a questionnaire.
• 88% of participants knew of the relation between salt intake and high blood pressure.
• 65% of participants were unable to correctly identify the relation between salt and sodium.
• 69% reported reading the sodium content of food products when shopping. Sodium label use was significantly related to shoppers’ concern about the amount of salt in their diet and the belief that their health could improve by lowering their salt intake.
• ≈50% of shoppers were unable to accurately use labeled sodium information to select low-salt options.
Post et al, 201094
Observational, cross-sectional
N=3748 US adults age 20+ y and with chronic disease in the NHANES survey
2005-2006 The purpose of this study was to assess whether patients with chronic disease who were advised by a healthcare professional to change their diet read nutrition labels and did so more frequently than patients who have not been so advised and whether these patients have a more healthful diet. Data were collected using both survey questions and 24-h dietary recall data.
• Among patients with chronic disease, the odds of reading food labels when told by their doctor or another healthcare professional to reduce calories or weight was 50% higher than in those without physician intervention (OR=1.50; 95% CI, 1.12-2.00).
• Those who read food labels consumed lower daily energy (2058 vs 2251 kcal; P=0.006), saturated fat (26.8 vs 29.2 g; P=0.04), carbohydrates (240 vs 267 g; P=0.003), and sugars (105 vs 126 g; P=0.001), and more fiber (16 vs 14.5 g; P=0.01) than those who did not.

Ollberding et al, 201087
Observational, cross-sectional
N=4454 US adults age 18+ y in the NHANES survey
2005-2006
The purpose of this study was to describe the prevalence of food label use and the association between food label use and nutrient intake. Data on food label use were collected during the interview portion of the survey and nutrient intake was estimated using 2 24-h food recalls.
• 61.6% of participants reported using the Nutrition Facts panel.
• 51.6% looked at the list of ingredients, 47.2% looked at serving size, and 43.8% reviewed health claims at least sometimes when deciding to purchase a food product.
• There were significant differences (P<0.05) in food label use across all demographic characteristics examined.
• When comparing food label users with nonusers, label users reported significant differences in mean nutrient intake of total energy (−164 kcal/d), total fat (−9 g/d), saturated fat (−3 g/d), cholesterol (−29 mg/d), sodium (−204 mg/d), dietary fiber (+1.1 g/d), and sugars (−12 g/d) (P<0.05 for each).
Vyth et al, 2010104
Observational, cross-sectional
N=404 adult shoppers in 9 Dutch supermarkets over 3 wk
Not reported Shoppers completed a validated questionnaire asking about different motivations for food choice. These motivations were related to their purchased products, which were recorded and scored for a front-of-pack Choices logo after they had finished shopping.
• 62% of shoppers reported familiarity with the front-of-pack logo.
• Attention to “weight control” and “product information” were the motivations for food choice that were positively associated with purchasing products with the logo.
• The food choice motive “hedonism” was negatively associated with purchasing products with the logo.
Grunert et al, 2010102
Observational, cross-sectional
N=11,700 shoppers at major retailers in the United Kingdom (n = 2019), Sweden (n = 1858), France (n = 2337), Germany (n = 1963), Poland (n = 1800), and Hungary (n = 1804)
February 2008−February 2009
In-store observations and in-store interviews were conducted to evaluate the use of nutrition information on food labels and the understanding of GDA front-of-pack nutrition labels. Shoppers were also given questionnaires to complete at home (N=6000; response rate 50.3%). Use of labels was assessed in 6 product categories. Understanding of GDA front-of-pack nutrition labels was assessed by tasks related to conceptual understanding, substantial understanding, and health inferences. Demographics, nutrition knowledge, and interest in healthy eating were measured as potential determinants.
• Overall, 16.8% of shoppers looked for nutrition information. The main sources looked at were the nutrition facts, GDA labels, and ingredients lists. The main data sought were calories, fat, and sugar.
• Understanding of GDA labels was high in the United Kingdom, Sweden, and Germany, and more limited in the other countries.
• In regression analysis, country, interest in healthy eating, interest in nutrition knowledge, and social grade were associated with use and understanding.

Kristal et al, 200188
Observational, longitudinal cohort
N=336 men and 502 women
Baseline data were collected from October 1995 to May 1996. Follow-up surveys were conducted from October 1997 to May 1998.
This prospective population-based study examined the demographic and psychosocial predictors of adopting reduced-fat and high fruit and vegetable consumption dietary patterns over 2 y. Data came from the Washington State Cancer Risk Behavior Survey, a random-digit-dial survey of adults age 18+ y to monitor attitudes and behavior related to cancer risk and prevention.
• During the 2 y of follow-up, fat intake (% energy) decreased by ≈2 percentage points and fruit and vegetable intake increased by 0.17 servings per day (P<0.001 each).
• Changes were greater among women and persons who were well educated.
• Persons in the maintenance stage of change and persons who believed there was a strong relation between diet and cancer made the largest dietary changes.
• Use of food labels was strongly associated with reduction of fat but not with increases in consumption of fruits and vegetables.
Interventional Studies of Consumer Behavior
Author, y
Design Population Duration Intervention/Evaluation Major Findings
Sacks et al, 2009105
Quasi-experimental comparison (pre- vs postintervention)
Shoppers at a major UK retailer thought to be representative of the UK population
4 wk before vs 4 wk after introduction of front-of-pack labeling in 2006
In 2006, the UK Food Standards Agency recommended that UK food retailers and manufacturers place front-of-pack traffic light labels on products in a range of categories. The format consisted of 4 separate color-coded lights indicating amount of fat, saturated fat, sugar, and salt. Red indicated a high level; amber, medium level; and green, low level. This study aimed to examine the impact of labeling on food sales in a major UK supermarket. Products were analyzed in 2 major categories: chilled prepackaged “ready meals” and fresh prepackaged “sandwiches.” Data were collected as percent change in sales before vs after the traffic-light labels were introduced. Product promotions, life cycle, and seasonality were taken into account.
• Sales of ready meals increased by 2.4% in the 4 wk after the traffic-light labels were introduced.
• Sales of the selected sandwiches did not change significantly.
• For both types of foods, there was no association between label coding for healthfulness and changes in product sales.
Sutherland et al, 2010106
Quasi-experimental comparison (pre- vs postintervention)
Supermarket shoppers in Maine, New Hampshire, Vermont, Massachusetts, and northern New York
2 y Purchasing data obtained from 2006 to 2008 from a northeastern supermarket chain with 168 stores
The Guiding Stars Nutrition Navigation Program was implemented in September 2006. The program was driven by an algorithm that generates weighted scores based on points debited for trans fat, saturated fat, cholesterol, sodium, and added sugars and credited for vitamins and minerals, fiber, and whole grains. If a product met inclusion criteria for earning 1, 2, or 3 stars, the star icons
• Significant changes were seen in food purchasing immediately after implementation of the program and 1 and 2 y later.
• Evaluating the same 8-mo period (January−August) each year, in 2006, 24.5% of items purchased earned a star rating; this proportion increased to 25.0% (P<0.001) and 25.9% (P<0.0001) at the 1- and 2-y follow-up periods, respectively.

were displayed at the point of purchase on the UPC shelf tag. Purchasing data were examined before implementation and at 1- and 2-y follow-up periods.
• Evaluating a 4-wk period 1 y after program implementation, consumers purchased significantly more ready-to-eat cereals with stars (eg, less added sugars and more dietary fiber) and fewer no-star, high-sugar, low-fiber cereals.
Borgmeier and Westenhoefer, 2009108
RCT, short-term (1 session)
N=420 adults living in Hamburg, Germany
1-time exposure to 5 different experimental conditions
This study investigated which food label format enables consumers to best differentiate healthier products from less healthy ones and the impact of these food labels on planned food choices and diet quality. Five labels were evaluated: (1) a simple “healthy choice” tick, (2) a multiple traffic-light label, (3) a monochrome GDA label, (4) a color GDA label, and (5) no label. Data were collected on whether the labels influenced (1) subjects’ ability to identify the healthier food item in 28 pairwise comparisons of foods from different food groups and (2) subjects’ choice of foods from a range of different foods to compose a theoretical 1-d consumption.
Task I • Compared with no label, subjects could best
identify the healthier food in pairwise comparisons with use of the traffic-light label, followed by either of the GDA labels and then the tick label (P<0.001 across comparisons).
• Compared with no label, subjects’ selections of a 1-d menu did not vary significantly according to any of the types of labels in terms of energy or nutrients.
Temple et al, 2010107
RCT, short-term (1 meal)
N=47 (24 male, 23 female) adults age 18-50 y recruited from flyers posted around the University of Buffalo
1 lunch session Participants visited the lab for 1 session lasting ≈1 h. Participants were randomly assigned to 1 of 2 video groups (nutrition labeling education vs control [organic food movement]) and 1 of 2 labeling conditions (labels vs no labels). Participants watched a short educational video and then ate a buffet lunch.
Subjects assigned to nutrition label groups consumed less energy (P<0.05): • Women in the label group consumed 500 kcal vs
700 kcal for those in the no-label group. • Men in the label group consumed 600 kcal vs
1000 kcal for those in the no-label group. • The educational video had no independent effects.
Fiske and Cullen, 2004109
RCT (4 wk) 10 vending machines in teachers’ lounges in Texas elementary and middle schools
• Assessed items sold
• Assessed dollar sales for items
• Total machine revenue
2-wk baseline assessment, 4-wk intervention • Each vending machine had 28 snack
items and 5 choices of gum. • Low-fat items were promoted by
means of − No intervention (control, 2
machines) − Increased availability plus labels
(intervention I, 4 machines). − Increased availability plus labels plus
signs (intervention II, 4 machines).
• The mean numbers of low-fat snacks sold were 2.5, 2.6, and 3.2 in the control, intervention I, and intervention II groups, respectively, but these differences did not achieve statistical significance (P=0.08).
• A significant difference in total machine revenue was not seen with either intervention.

Vyth et al, 2011110
RCT (3 wk) N=25 worksite cafeterias (13 intervention, 12 control) in the Netherlands
• Sales data were collected daily pre- and postintervention for 9 wk, from March to May 2009
• Employees (N=368) from 1 intervention and 1 control worksite completed questionnaires pre- and postintervention.
• Intervention cafeterias: Choices nutrition logo added to foods
• Control cafeterias: same menu without the logo
• No significant intervention effects were found in sales of sandwiches, soups, snacks, fruit, or salads.
• Self-reported “intention to eat healthier” and “paying attention to product information” were positively associated with self-reported consumption of foods with the Choices logo at lunch.
Combined Interventions
French et al, 2001111
RCT 55 vending machines in 12 secondary schools and 12 worksites in Minnesota
1 y Changing Individuals’ Purchase of Snacks (CHIPS) study • 55 vending machines were used,
including placement of low-fat snacks in 2 designated rows of the machine.
• Effects of price and labeling on sales were evaluated during a 1-y intervention.
• Labeling conditions: none, low-fat label, low-fat label plus promotional sign
• Pricing conditions: equal price, 10% reduction, 25% reduction, 50% reduction
• Labels alone had no effect on sales. • Promotional signage was associated with a very
small increase in low-fat snack sales. • Price reductions of 10%, 25%, and 50% on low-fat
snacks were associated with significant increases in low-fat snack sales. Low-fat snack sales increased by 9%, 39%, and 93% respectively.
Lowe et al, 2010112
Quasi-experimental (pre- vs postintervention)
N=96 hospital employees
Worksite cafeteria purchases at lunch assessed by scanned food purchasing cards, comparing the period 3 mo before vs after interventions
Group 1: environmental changes in the cafeteria, including addition of selected healthier options along with food labeling (calories, energy density, macronutrients) for all foods sold during lunch Group 2: environmental changes in the cafeteria plus pricing incentives and 4 1-h group sessions of nutrition education on strategies for decreasing energy density of the diet
• Comparing before vs after intervention in both groups, total lunchtime calories and percent energy from fat decreased (≈70 kcal and 5% energy less, respectively; P<0.01 each).
• There were no differences between the 2 intervention groups, ie, the addition of pricing incentives and nutrition education did not appear to have any additional impact. However, the sample size was small and may have not been adequately powered after attrition of subjects.
Thorndike et al, 2011113
Quasi-experimental
Large hospital cafeteria in
Electronically recorded food
Foods and beverages were labeled with simple color codes (red, yellow, green)
• After 3 mo, sales of “red” products decreased by 9.2%, including 23.1% lower sales of sugar-

(pre- vs postintervention)
Boston, Massachusetts, plus 2 smaller comparison cafeterias in the same hospital
sales in the 3 mo before vs after the labeling change
based on USDA food pyramid guidelines in the intervention cafeteria. No changes were made in the comparison cafeterias.
sweetened beverages. Sales of “green” products increased by 4.5% (P<0.001 each).
• Total sales did not change. • No changes were seen in sales of these different
foods at the 2 comparison cafeterias.
CSFII indicates Continuing Survey of Food Intakes by Individuals; DHKS, Diet and Health Knowledge Survey; NHANES, National Health and Nutrition Examination Survey; OR, odds ratio; CI, confidence interval; GDA, guideline daily amount; UPC, universal product code; and RCT, randomized controlled trial. Note: Reference numbers (eg, Neuhouser et al, 199983) appearing in this supplementary table correspond with those listed in the reference section of the statement. For the purposes of this supplementary table, these meta-analyses or systematic reviews (see "Author, y" column) are considered the primary citation. Additional studies mentioned in the primary citation may be included in the "Intervention/Exposure" and "Findings" columns. The additional studies can be accessed through the primary citation. ,

Supplementary Table 4. Menu and Other Point-of-Sale Information on Calories and Nutrients
Author, y Study Type Population Intervention/Evaluation Findings Seymour et al 2004116
Review of interventional studies to improve diet by changes in food availability, access, pricing, or point-of-purchase information in worksites, universities, grocery stores, and restaurants
A total of 38 intervention studies in adult populations, published between 1970 and June 2003
Point-of-purchase information on foods or beverages in worksites, universities, grocery stores, and restaurants
• Many interventions were not thoroughly evaluated or lacked important evaluation information, and direct comparison of studies across settings was not possible.
• The authors concluded that worksite and university interventions (ie, “limited access” sites in which few other choices were available) had the greatest potential for success. Interventions in grocery stores appeared least effective.
• Sustainability of diet changes was not addressed in these studies.
Bassett et al, 2008114
Observational, cross-sectional
N=7318 customers from 275 randomly selected restaurants in 11 fast-food chains in New York City
The authors randomly sampled a total of 300 chain restaurants from ≈1625 eligible locations from March to June 2007. Receipts of consenting customers were collected after their purchase, along with other self-reported information about the purchase. Calories were identified from an electronic database.
• The mean fast-food purchase contained 827 calories, and 34% of respondents purchased foods containing ≥1000 calories.
• One chain (Subway) posted point-of-purchase calorie information. In comparison with the other 10 chains, Subway customers were more likely to report seeing calorie information (4% vs 32%, P<0.001).
• Among Subway customers, those who reported seeing calorie information purchased 52 fewer calories than did other Subway customers (P<0.01).
Yamamoto et al, 2005119
Quasi-experimental comparison (pre- vs postintervention)
N=106 adolescents, age 11-18 y, students enrolled in band, orchestra, or tennis
Participants were shown menus with and without calorie/fat information from McDonald’s, Denny’s, and Panda Express. First, they were shown the regular menu, and then they were asked to select a dinner item and estimate their calorie/fat consumption. Next, they were shown the menus with calorie and fat information and asked again to select a dinner item and estimate consumption.
• Of the 106 subjects, 75 subjects chose the same meal after the revelation of calorie/fat information.
• Significant declines were shown in calories and fat in meals ordered at McDonald’s (P=0.002, P=0.001) and Panda Express (P=0.005, P=0.004), but these changes occurred in <20% of the study subjects.
• Significant differences were not shown in meals ordered at Denny’s.
Chu et al, 2009117
Quasi-experimental evaluation (pre- vs postintervention)
Students purchasing food at the study dining center at Ohio State University in 2004
This study sought to determine whether the display of nutrition information at the point of selection for all entrées available in a university dining hall would alter patrons’ meal selection. A quasi-experimental design was used to test the hypotheses that (1) average energy content of entrées sold per day decreases when nutrition labels are present at point of selection, (2) entrées with the highest energy content have the greatest decrease in sales, and (3) this change can occur without any negative
• The average energy content of entrées sold decreased 12.4 kcal from the last day of pretreatment to the first day of the treatment period (P=0.007). A negative slope, small in magnitude, was observed during the treatment period (−0.3 kcal/d). At the beginning of the posttreatment period, the daily average energy content immediately began to increase. Across the posttreatment period, the daily average energy content increased at a rate of 1.5 kcal/d (P=0.01).

impact on overall sales. Nutrition information was posted for 14 d, with sales tracked immediately before, during, and after the intervention.
• The sale of the entrées with the highest energy content significantly decreased during the treatment period compared with the pretreatment period (P=0.007).
• The difference in total sales between the study periods was not significant and revenue remained consistent.
Elbel et al, 2009120
Quasi-experimental comparison (pre- vs postintervention)
N=1156 receipts from customers in fast-food restaurants in low-income, minority communities in New York City and Newark (control) before and after institution of menu labeling in New York City
Receipts were collected from willing customers at McDonald’s, Burger King, Wendy’s, and KFC in New York City (14 stores) and control stores in Newark (5 stores). A set of questions was also given to participants to collect age, sex, race, education, whether food was for dining in or to go, whether calorie information was posted, whether calorie information influenced their choice, and whether calorie information caused them to purchase fewer or more calories.
• Postlabeling, 54% of participants in New York City reported noticing calorie information.
• Participants in New York City purchased a mean of 825 calories (95% CI, 779-870) before labeling and 846 calories (95% CI, 758-889) after labeling.
• Participants in Newark purchased a mean of 823 calories (95% CI, 802-890) before labeling and 826 calories (95% CI, 746-906) after labeling.
• Overall, no change in calories chosen was detected.
Dumanovsky et al, 2010115
Quasi-experimental comparison (pre- vs postintervention)
N=2417 customers from 45 fast-food restaurants representing the 15 largest fast-food chains in New York City
Consumer awareness of menu calorie information was evaluated in separate cross-sectional surveys in the 3 mo before and 3 mo after enforcement of a city health code requiring fast-food chains to display food-item calories on menus/menu boards. Customers reported whether they had seen calorie information and, if so, whether it had affected their purchase. Data were weighted to the number of city locations for each chain.
• The percentage of customers who reported seeing calorie information rose from 38% pre- to 72% postenforcement (P<0.001).
• Among customers who reported seeing calorie information postenforcement, 27% reported using the information, a 2-fold increase in the overall proportion of customers making calorie-informed choices (10% vs 20%, P<.001).
Pulos and Leng, 2010118
Quasi-experimental comparison (pre-vs postintervention)
6 full-service restaurants in Pierce County, Washington state
Restaurants added nutrition information including calories, fat, sodium, and carbohydrates to their menus for all regular items, excluding beverages and daily specials. Data on entrée sales were provided for 30 d before and 30 d after the information was added.
• 71% of consumers (95% CI, 65-77) reported noticing the nutrition information.
• Postlabeling, entrées sold contained an average of 15 fewer calories, 1.5 g less fat, and 45 fewer milligrams of sodium.
• The most frequent change after viewing nutrition information was choosing an entrée containing lower calories (20.4%, 95% CI, 15.2, 25.6) and lower fat (16.5%, 95% CI, 11.6, 21.4).
Harnack and French, 200832
RCT, short-term (1 meal)
N=594 adolescents (>16 y) and adults in the Minneapolis/St Paul metropolitan area who
Two hotel conference rooms and 1 church basement were set up as dining rooms where meals were consumed from 4:50 to 7:30 PM. Participants were shown 1 of the following 4 menus: Control menu: No calories; value pricing is in accordance with McDonald’s pricing. Price menu: No calories; value pricing was removed. Price was standardized per ounce.
• No significant differences were found in the average number of calories consumed by the 4 groups (P=0.25).
• Taste was rated as a very important/most important aspect by 97.6% of participants for buying fast food and 98.5% of participants for buying groceries.
• Nutrition was rated as a very important/most important aspect by 58.2% of participants for buying

regularly (once or more per week) eat at fast-food restaurants
Calorie menu: Calories were added to the value price menu. The background of the calorie column was bright yellow to draw attention to it. The average calorie needs for adults were also shown in the calories count box. Calorie plus price menu: Calories were added as in the calorie menu, value pricing was removed, and price was standardized per ounce as in the price menu.
fast food and 83.5% of participants for buying groceries.
• 54% of participants in the calorie menu group and 59% in the calorie plus price menu group reported noticing calorie information on their menu.
• However, providing calorie information at point of purchase had little effect on food selection or consumption.
Engbers et al, 2006,122 2007123
Nonrandomized controlled trial (1 y)
N=515 office workers at 2 government worksites
Intervention worksite: Product information sheets were available near cafeteria foods, including calorie values in terms of exercise. Every 4 wk, 1 of 6 food groups was highlighted. Leaflets were available in the canteen with information on healthy food, blood pressure, and cholesterol. Control worksite: No treatment. Brief dietary questionnaire given at 3 and 12 mo.
At 1 y: • No significant effects on consumption of fruits,
vegetables, or dietary fat
CI indicates confidence interval.
Note: Reference numbers (eg, Seymour et al, 2004110) appearing in this supplementary table correspond with those listed in the reference section of the statement. For the purposes of this supplementary table, these meta-analyses or systematic reviews (see "Author, y" column) are considered the primary citation. Additional studies mentioned in the primary citation may be included in the "Intervention/Exposure" and "Findings" columns. The additional studies can be accessed through the primary citation.

Supplementary Table 5. Labeling and Consumer Information on Smoking: Package Warnings and Labeling
Author, y Design Population Intervention/Evaluation Evidence and Results
Millar, 1996139
Observational, cross-sectional
Adults age ≥20 y in selected health surveys conducted between 1977 and 1994
Differences in rates of smoking were examined by educational attainment and other self-reported characteristics.
• Smaller proportions of smokers with lower education recalled printed warnings about heart disease on cigarette packages.
• All smokers cited the mass media as their major source of information about smoking, but those with lower education levels reported mass media less often than did smokers with higher education levels and were less likely to obtain information from books, pamphlets, or magazines.
• Smokers with lower education levels reported encountering fewer smoking restrictions in their daily activities than did those with higher education levels.
Borland and Hill, 1997132
Observational, cross-sectional
Following the introduction of new health warnings and content labeling on cigarettes and other tobacco products in Australia in 1995, surveys were conducted to evaluate whether these changes increased the noticeability of the warnings and contributed to an increase in relevant knowledge.
• To be effective, health warnings need to be noticed and persuasive and need to provide guidance for appropriate action.
• To be noticed, health warnings need to stand out from the surrounding pack design and need to be large enough to be read easily.
• To be persuasive, warnings need to be understood, believed, and judged personally relevant by the reader.
Crawford et al, 2002134
Observational, cross-sectional
N=785 teenagers of white and other races/ethnicities, primarily smokers, from rural, urban, and suburban locations across the United States
The 13-site TCN, sponsored by the CDC, conducted 129 focus groups that were homogeneous for sex and ethnicity to explore adolescents' response to current and potential tobacco control policy issues.
• Teenagers were generally familiar with laws and rules about access and possession for minors but believed them ineffective.
• They found a list of chemical names of cigarette ingredients largely meaningless but believed that disclosing and publicizing their common uses could be an effective deterrent, especially for those who were not yet smoking.
• They were aware of current warning labels but considered them uninformative and irrelevant.
• They were knowledgeable about prices and reported that a sharp, sudden (and large) increase could lead them to decrease their smoking patterns; however, a moderate increase would most likely result in unintended negative consequences (eg, stocking up and selling cigarettes at a profit; buying black-market cigarettes; working at a store that sells cigarettes; stealing cigarettes from stores or family members; and using other forms of tobacco or other substances, such as nicotine replacement products, alcohol, or marijuana).
Guttman and Peleg, 2003137
Observational, cross-sectional
N=1000 adults, and N=200 adult smokers in Israel
The Israel Ministry of Health surveyed 1000 adults by telephone and 200 smokers in face-to-face interviews to guide its decisions about how warnings should be attributed and how to counter
• There was little effect from unattributed warnings. • Smokers, when presented with actual warnings, tended to
favor those attributed to “medical studies.” • Nonsmokers were somewhat more likely to prefer warnings
attributed to the Ministry of Health, explaining that it is

tobacco lobby opposition. “responsible for the topic” or “has the authority.”
Health Canada 2005a; Health Canada 2005b
Observational, cross-sectional
Canadian surveys
National surveys conducted on behalf of Health Canada
• ≈95% of youth smokers and 75% of adult smokers reported that pictorial warnings on cigarette packs have been effective in providing important health information.
Willemsen, 2005141
Observational, cross-sectional
N=3937 Dutch adult smokers
The Dutch Continuous Survey of Smoking Habits examined the self-perceived impact of new health warnings on the attractiveness of cigarettes, smokers’ motivations to quit, and smoking behavior.
• 32% said they preferred to purchase a pack without the new warning labels.
• 18% reported that warning labels increased their motivation to quit.
• 14% became less inclined to purchase cigarettes because of the new warning labels
• 10% said they smoked less. • Those who intended to quit within 6 mo were 5-6 times as
likely to report smoking less due to the warnings than those who did not plan to quit.
• A strong dose-response relation was observed between these effects and intention to quit.
Hammond et al, 2006140
Observational, cross-sectional
N=9058 adult smokers from the ITC-4, including nationally representative surveys in the United States, United Kingdom, Canada, and Australia
A telephone survey was conducted to examine variations in smokers' knowledge about tobacco risks and the impact of package warnings. Respondents were asked to state whether they believed smoking caused heart disease, stroke, impotence, lung cancer in smokers, and lung cancer in nonsmokers. Respondents were also asked whether the following chemicals are found in cigarette smoke: cyanide, arsenic, and carbon monoxide.
• Smokers in the 4 countries exhibited significant gaps in their knowledge of the risks of smoking.
• Smokers who noticed the warnings were significantly more likely to endorse health risks, including lung cancer and heart disease.
• In each instance where labeling policies differed between countries, smokers living in countries with government-mandated warnings reported greater health knowledge. For example, in Canada, where package warnings include information about the risks of impotence, smokers were 2.68 (2.41-2.97) times more likely to agree that smoking causes impotence compared with smokers from the other 3 countries.
• Similarly, respondents living in countries with more comprehensive warnings were more likely to cite packages as a source of health information. For example, 85% of Canadian respondents cited packages as a source of health information, in contrast to only 47% of US smokers.
Fathelrahman et al, 2009142
Observational, cross-sectional
N=1919 adult male smokers in Malaysia
This study examined whether different responses among smokers toward cigarette pack warning labels could predict quit intentions and self-efficacy in quitting. Face-to-face interviews were conducted using a standardized questionnaire.
• The responses “more likely to quit because of the warning labels” and “stopped from having a cigarette when about to smoke one” significantly predicted all stages of change and self-efficacy independent of the other measures.
• In addition, thinking about the health risks and reading the warnings more often added extra predictive capacity but only in the early stages of contemplating change.
Pollay and Dewhirst 2002144
Observational, retrospective
Trade sources and internal US tobacco
This study evaluated the development, intent, and consequences of US tobacco industry advertising for low machine
• Several tactics were used by cigarette manufacturers, leading consumers to perceive filtered and low machine yield brands as safer relative to other brands.

company documents
yield (“light”) cigarettes. Data were collected via analysis of trade sources and internal US tobacco company documents now available on various web sites created by corporations, litigation, or public health bodies.
• Tactics include using cosmetic (that is, ineffective) filters, loosening filters over time, using medicinal menthol, using high-tech imagery, using virtuous brand names and descriptors, adding a virtuous variant to a brand’s product line, and generating misleading data on tar and nicotine yields.
• The ads were intended to reassure smokers concerned about the health risks of smoking and to present the respective products as an alternative to quitting.
• Such promotional efforts were successful in getting smokers to adopt filtered and low-yield cigarette brands.
Hammond et al, 2004136
Observational, longitudinal
N=616 adult smokers in Canada
The impact of graphic Canadian cigarette warning labels was assessed using a longitudinal telephone survey.
• Participants reported negative emotional responses to the warnings, including fear (44%) and disgust (58%).
• Smokers who reported greater negative emotion were more likely to have quit, tried to quit, or reduced their smoking 3 mo later (OR=1.37; 95% CI, 1.15, 1.64).
• Participants who tried to avoid the warnings (30%) were no less likely to think about the warnings or engage in cessation behavior at follow-up.
Portillo and Antonanzas, 2002143
Quasi-experimental comparison (pre- vs postintervention)
N=435 students at the University of La Rioja, Spain
A questionnaire was administered both before and after students were presented with a demonstration of the health warnings on cigarette packets based on the new European Union directive. Students were surveyed on their perceptions of the principal health risks attributable to the consumption of tobacco, ie, lung cancer, respiratory diseases, and CVD.
• Perceptions changed significantly after exposure to the content and type of information presented on the new packaging. In general, students attributed a higher health risk to smoking after the presentation.
Hammond et al, 2007133
Quasi-experimental comparison (pre- vs postintervention
N=14,975 adult smokers from the ITC-4, including nationally representative surveys in the United States, United Kingdom, Canada, and Australia
The current study examined the effectiveness of health warnings on cigarette packages in 4 countries. Telephone surveys were conducted in representative cohorts of adult smokers between 2002 and 2005, before and at 3 time points after implementation of new package warnings in the United Kingdom.
• Large, comprehensive warnings on cigarette packages are more likely to be noticed and rated as effective by smokers.
• Changes in health warnings are also associated with increased effectiveness.
• Health warnings on US packages, which were last updated in 1984, were associated with the least effectiveness.
Loken and Howard-Pitney, 1988135
RCT, short-term (1 session)
115 college women, including smokers and nonsmokers
This study evaluated factors that could influence subjects’ reactions to print ads for cigarettes. Subjects were shown cigarette ads that varied in 2 dimensions: showing or not showing an
• Ads were rated as more attractive, more persuasive, and more credible when they showed an attractive model than when they did not.
• Compared with general warnings, specific warnings on ads acted as a counterinfluence to their appeal, making the ads

attractive model and showing a general or specific warning label. Subjects were evaluated on each ad, with ratings combined into 3 dimensions: (1) attractiveness (good-bad, clever-stupid, well designed−not well designed, attractive-unattractive), (2) persuasiveness (persuasive-unpersuasive, makes me−does not make me want to buy the product), and (3) credibility (informative-uninformative, honest-dishonest).
appear less attractive and less persuasive.
Malouff et al, 1992138
RCT, short-term (1 session)
The readability of label warnings was assessed with 3 standard tests. The tests focused on length of sentences, average number of syllables per word, and unfamiliarity of the words.
• Literacy levels of the warning labels affected their readability
TCN indicates Tobacco Control Network; CDC, Centers for Disease Control and Prevention; ITC4, International Tobacco Control Four-Country Survey; OR, odds ratio; CI, confidence interval; CVD, cardiovascular disease; and RCT, randomized controlled trial.
Note: Reference numbers (eg, Seymour et al, 2004110) appearing in this supplementary table correspond with those listed in the reference section of the statement. For the purposes of this supplementary table, these meta-analyses or systematic reviews (see "Author, y" column) are considered the primary citation. Additional studies mentioned in the primary citation may be included in the "Intervention/Exposure" and "Findings" columns. The additional studies can be accessed through the primary citation.

Supplementary Table 6. School-Based Approaches to Improving Diet and Physical Activity
Interventions Targeting Both Diet and Physical Activity
Author, y
Study Type
Population Outcomes Duration Intervention/Exposure
Findings
Brown and Summerbell, 2009225
Systematic review of RCTs
RCTs evaluating school children, age kindergarten through 18 y, and published by September 2007
Effects of diet and physical activity interventions on BMI Only studies reporting a weight outcome were reviewed.
Interventions of at least 12 wk
Among 38 identified trials of school-based lifestyle interventions that focused on improving diet and/or physical activity behaviors to reduce BMI, 20 trials focused on both diet and physical activity.
Diet plus physical activity intervention vs control (20 trials): • Of 20 studies, 9 studies showed significant improvements in BMI
z score. • In a 6-mo intervention in 5 Chilean primary schools, a program
of active recess, parental involvement, health kiosks, and activities led to maintained BMI among boys in the intervention group, whereas boys in the control group had increased BMI.
• In 10 US schools, the Planet Health program focused on dietary change plus reduction of sedentary behaviors, especially TV time, in 12-y-olds. The intervention reduced prevalence of obesity (OR=0.47; 95% CI, 0.24-0.93) and increased obesity remission (OR=2.16; 95% CI, 1.07-4.35) over 2 y.
• In Crete, a Know Your Body program to improve cardiovascular health demonstrated long-term improvements in BMI and skin-fold measurements, including reduction in BMI of 0.7 kg/m2 at 3 y (P<0.001), and 3.7 kg/m2 at 6 y (P<0.05).
• An intervention among 8-y-old children in the United States led to reduced weight gain at 2 y. The lowering of BMI z score by the intervention was seen in normal-weight (−0.29; 95% CI, −0.38, −0.21), not overweight (−0.02, 95% CI, −0.16, 0.12) children.
• A 12-wk New York public school intervention in 14-y-olds to reduce diabetes risk showed improved BMI and percent body fat.
• The Wellness, Academics and You (WAY) program in 9−11-y-olds showed a reduction in risk of becoming overweight in the children in the intervention group.
WHO, 200936
Review of RCTs
School-age children
Diet and/or physical activity
Variable Multiple school-based interventions reviewed from 107 peer-reviewed articles on 55 interventions, mostly from North America
• Effective interventions for diet and/or physical activity are comprehensive and multicomponent and include − Curriculum on diet and/or physical activity taught by
trained teachers − Supportive school environment/policies − Parental/family component − Physical activity program − Healthy food options in school cafeterias, vending
machines, etc • There is also evidence for moderate additional effectiveness of
the following: − A focused approach with other supportive activities in the

curriculum − A formative assessment that addresses the needs of the
school and cultural contexts Jiang et al, 2007228
Nonrandomized controlled trial
N=2425 children in 5 primary schools in Beijing, China
Prevalence of overweight and obesity
3 y (dates not reported)
Intervention schools: Nutrition education was aimed at both children and parents and included regular talks and printed materials on diet, physical activity, and sedentary behaviors. Overweight, obese, and nonfit children were also asked to run for 20 min per day after class, monitored by PE teachers. Control schools: no intervention
• After 3 y, prevalence of overweight and obesity decreased in intervention schools and increased in control schools.
• Compared with controls, intervention schools had a lower prevalence of overweight (9.8 vs 14.4%; P<0.01) and obesity (7.9 vs 13.3%; P<0.01).
• Dietary intake, physical activity, and other obesity-related behaviors were not assessed.
Hoelscher et al, 2010232
Nonrandomized controlled trial
30 low-income primary schools in central Texas, ≈60% Hispanic
Serial cross-sectional evaluations of ≈1000 4th grade students each year, including BMI, self-reported diet, and physical activity using the SPAN questionnaire
Spring 2007−spring 2008
CATCH BP (control): Multicomponent school intervention for diet and physical activity, including altering the school environment in the classroom, cafeteria, and PE curriculum, with additional family/home components CATCH BP + Community: The above plus additional intensive community involvement based on principles of community-based participatory research
Comparison of CATCH BP + Community with CATCH BP alone: • Diet: Percentage of students eating breakfast increased and
consumption of unhealthy foods decreased (P<0.05 each); a trend toward greater consumption of fruits and vegetables was also seen (P=0.07).
• Physical activity: No significant differences were seen. • Sedentary activity: less time at the computer (P=0.003) and
trends toward less time watching TV (P=0.10). • Prevalence of overweight/obesity decreased by 1.3 percentage
points in CATCH BP schools vs 8.3 percentage points in CATCH BP + Community schools (P=0.05). Similar declines were seen in boys, girls, Hispanics, and non-Hispanics.
Marcus et al, 2009229
RCT N=3135 children, grades 1-4, in 10 schools in
• Physical activity assessed by accelerometer
• BMI z score • Prevalence of
4 school years, August 2001−June 2005
Intervention schools: STOPPVegetables, low-fat dairy products, and whole grains were
• At baseline, the prevalence of overweight plus obesity was higher in intervention vs control schools (20.3% vs 16.1%). Prevalence decreased in intervention schools (to 17.1%) and increased in control schools (to 18.9%) (P<0.05 for comparison of changes).
• Differences in changes in mean BMI z scores were not

Stockholm, Sweden
overweight and obesity
introduced and promoted; sweets and sweetened drinks were eliminated. Physical activity was increased by 30 min per day during school; sedentary behavior during afterschool programs was reduced.
significant. • There was a nonsignificant trend toward higher physical activity
assessed by accelerometer in intervention vs control schools (P=0.10).
• Eating habits at home were healthier in intervention vs control schools.
Hollar et al, 2010227
Nonrandomized controlled trial
N=2494 children age 6-13 y in 5 elementary schools in Osceola County, central Florida
• Systolic and diastolic BP
• BMI percentiles and weight
August 2004−June 2006
Multicomponent: 4 nonrandomly selected intervention schools (N=2029 students) received a multicomponent intervention including 10−15-min physical activity breaks during academic lessons, changes in school meals to meet US Dietary Guidelines for Americans, and changes in school curriculum to teach children, parents, and teachers about good nutrition and the benefits of physical activity. Control schools: no intervention
After 2 academic years: • Systolic BP was lower than baseline in intervention schools (≈1
mm Hg lower in boys and ≈1.5 mm Hg lower in girls), whereas no changes were seen in control schools, but these differences were not statistically significant (P=0.30 for boys, P=0.15 for girls).
• Changes in diastolic BP were also not different in boys (P=0.79).
• Girls in the intervention schools had a significant decline in diastolic BP (≈1.8 mm Hg lower) compared with controls (P=0.04).
• Comparing intervention vs control schools, BMI z scores and weight z scores decreased significantly for girls (−0.03 vs 0.0, P=0.003 and –0.05 vs −0.03, P=0.01, respectively) but not for boys (P=0.86 and P=0.59).
Foster et al, 2010230 Jago et al, 2011231
RCT N=4603 students in 42 US middle schools at 7 US sites, with schools having at least 50% of children
BMI, waist circumference, fasting glucose, fasting insulin Metabolic syndrome risk factors, fitness assessed by 20-m shuttle run, and self-reported
Fall 2006 (start of 6th grade) −spring 2009 (end of 8th grade)
“HEALTHY” schools: Multicomponent intervention targeting diet, physical activity, and behavioral knowledge/skills. Changes were made in quantity and quality of foods and drinks in cafeterias,
Comparison of intervention vs control schools at the end of follow-up: • Declines in prevalence of overweight and obesity in both groups
of ≈4 percentage points (OR=0.99; 95% CI, 0.82, 1.19, P=0.92) • Greater declines in BMI z score (−0.05 vs −0.01, P=0.04) and
waist circumference >90th percentile (−8.1 vs −5.9%, P=0.04 • Smaller increases in fasting insulin (+3.8 vs 4.0, P=0.04) • No significant difference in fasting glucose • No significant differences in prevalence of metabolic syndrome,
although low numbers (only 5% at baseline) • No significant differences in objective fitness or self-reported

eligible for federally subsidized meals or at least 50% black or Hispanic
moderate to vigorous physical activity
vending machines, a la carte options, snack bars, school stores, fundraisers, and classroom parties. PE curriculum was revised to increase time in moderate to vigorous physical activity. Education included self-monitoring and goal setting, plus peer involvement, communication strategies, and social marketing. Control schools: no intervention
moderate to vigorous physical activity
Rosenkranz et al, 2010226
RCT N=76 girls age 9-13 y in Girl Scout troops Intervention (N=3 troops, 34 girls) Standard care control: (N=4 troop s, 42 girls) (Included due to similarity of this troop-based approach to school-based approaches)
• BMI z score • Physical
activity assessed by accelerometry
• Self-reported intake of fruits and vegetables and sugar-sweetened beverages, physical activity
• Parental survey of intake of fruits and vegetables and sugar-sweetened beverages, family meals, physical activity, and BMI of parent, frequency of eating while
October 2007−November 2008
Intervention: Social cognitive theory interactive health curriculum during troop meetings, led by briefly trained (2 h) troop leaders, targeting behaviors (frequent family meals, parent/child physical activity, no TV during meals, water over sugar-sweetened beverages, adding fruits and vegetables to meals, manners, and preparation/clean-up of family meals), goal setting, activity (dancing, yoga, etc), snack/recipe preparation, role-playing, and take-home projects
• Most effects were not significantly different from the control troops, including child BMI z score, parent BMI, and most behavioral variables.
• However, girls in the intervention troops did accumulate less sedentary activity (P=0.01), more moderate physical activity (P=0.004), and more moderate to vigorous physical activity (P<0.001) as assessed by accelerometry.
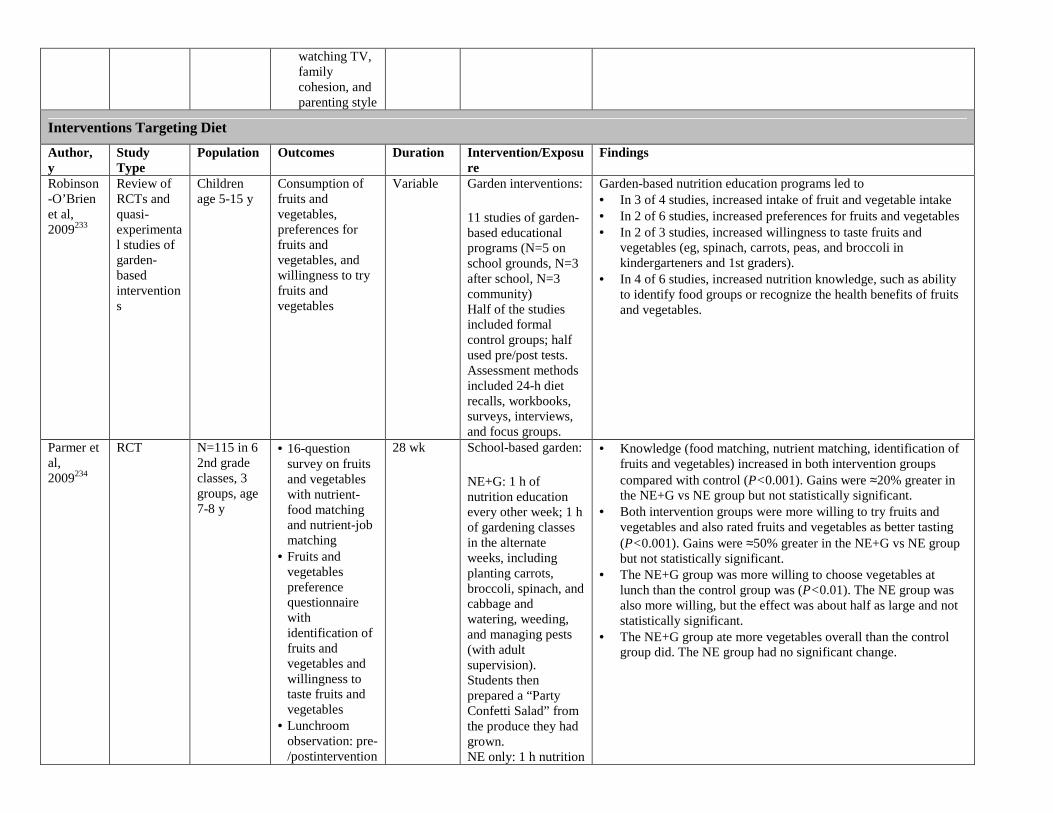
watching TV, family cohesion, and parenting style
Interventions Targeting Diet
Author, y
Study Type
Population Outcomes Duration Intervention/Exposure
Findings
Robinson-O’Brien et al, 2009233
Review of RCTs and quasi-experimental studies of garden-based interventions
Children age 5-15 y
Consumption of fruits and vegetables, preferences for fruits and vegetables, and willingness to try fruits and vegetables
Variable Garden interventions:
11 studies of garden-based educational programs (N=5 on school grounds, N=3 after school, N=3 community) Half of the studies included formal control groups; half used pre/post tests. Assessment methods included 24-h diet recalls, workbooks, surveys, interviews, and focus groups.
Garden-based nutrition education programs led to • In 3 of 4 studies, increased intake of fruit and vegetable intake • In 2 of 6 studies, increased preferences for fruits and vegetables • In 2 of 3 studies, increased willingness to taste fruits and
vegetables (eg, spinach, carrots, peas, and broccoli in kindergarteners and 1st graders).
• In 4 of 6 studies, increased nutrition knowledge, such as ability to identify food groups or recognize the health benefits of fruits and vegetables.
Parmer et al, 2009234
RCT N=115 in 6 2nd grade classes, 3 groups, age 7-8 y
• 16-question survey on fruits and vegetables with nutrient-food matching and nutrient-job matching
• Fruits and vegetables preference questionnaire with identification of fruits and vegetables and willingness to taste fruits and vegetables
• Lunchroom observation: pre-/postintervention
28 wk School-based garden:
NE+G: 1 h of nutrition education every other week; 1 h of gardening classes in the alternate weeks, including planting carrots, broccoli, spinach, and cabbage and watering, weeding, and managing pests (with adult supervision). Students then prepared a “Party Confetti Salad” from the produce they had grown. NE only: 1 h nutrition
• Knowledge (food matching, nutrient matching, identification of fruits and vegetables) increased in both intervention groups compared with control (P<0.001). Gains were ≈20% greater in the NE+G vs NE group but not statistically significant.
• Both intervention groups were more willing to try fruits and vegetables and also rated fruits and vegetables as better tasting (P<0.001). Gains were ≈50% greater in the NE+G vs NE group but not statistically significant.
• The NE+G group was more willing to choose vegetables at lunch than the control group was (P<0.01). The NE group was also more willing, but the effect was about half as large and not statistically significant.
• The NE+G group ate more vegetables overall than the control group did. The NE group had no significant change.

education every other week Control: no treatment
Somerset and Markwell, 2009235
Quasi-experimental study (historical control)
Intervention in 4th to 7th graders, age 8-13 y: 4th (N=25), 5th (N=21), 6th (N=34), and 7th (N=40) Historical controls: 4th (N=30), 5th (N=37), 6th (N=38), and 7th (N=22)
• Identification of fruits and vegetables survey using 3-point Likert scale
• 38 questions • 1st: given 1 mo
before intervention
• 2nd: given in subsequent autumn
12 mo (2 data years)
School-based garden: • Part used as an
outdoor classroom • Garden-based
teacher hired to incorporate garden activities into curriculum.
• Children had classes on composting, propagation, planting, harvesting, and cooking.
• Weekly garden activities were also planned.
• Children developed a greater ability to identify fruits and vegetables, had enhanced confidence in preparation of fruits and vegetables, and had changes in perceived consumption.
• Preference for whether vegetables taste good increased in 4th graders from 36% to 74%, in 5th graders from 64% to 68%, and in 6th graders from 30% to 42%. In 7th graders, preference decreased from 36% to 31%.
• The proportion of children saying they liked to eat vegetables every day increased in 4th graders from 33% to 50%; in 5th graders from 47% to 65%; and in 6th graders from 26% to 35%. In 7th graders, the proportion decreased from 23% to 18%.
• There was an increase in children saying yes when asked if their friends were eating “lots of vegetables”: in 5th graders from 24% to 70%, 6th graders from 11% to 32%, and 7th graders from 19% to 23%. (Results in 4th graders not reported.)
Day et al, 2009240
RCT (pilot) Intervention schools (5): N=246 Control schools (5): N=198 Age: 4th and 5th graders
• KAP survey • 24-h recall • FFQ • Food Choices
Scale for Children
• Teacher-recorded logs
12 wk Action Schools!
• School received classroom activities/menu for implementation
• 1.5 h of training • Each teacher
received (Canada) $12.50 per month for fruit and vegetable tasting activities
• Servings of fruits increased at intervention schools (P<0.05). • There were no effects on willingness to try new fruits and
vegetables. • Percentage of fruits and vegetables tried increased from 78% to
83% in intervention schools.
Davis et al, 2009237
RCT Intervention school (1): N=4800 Control school (1): N=3500 Age: high school, grades 9-12
Anonymous postintervention surveys that assessed intake of fruits and vegetables and demographics, including N=2080 intervention and N=1610 control students
Spring 2006, fall and spring 2006-2007
Fresh Fruit and Vegetable Program: During the 2006-2007 school year, baskets of fresh fruits (apples, oranges, pears, plums, pineapple, and kiwi) and vegetables (carrots and celery with low-fat ranch
• Only 1 in 5 students from both the intervention and control schools consumed >5 servings per day of fruits, fruit juices, or vegetables.
• More intervention students consumed fruit/100% fruit juice at least twice a day (39.3% vs 27.3%; P<0.05).
• More intervention students consumed a total of 5+ fruit juices/vegetables per day (22% vs 18.4%; P<0.05) and 1+ fruits day (59.1% vs 40.9%; P<0.05).
• There were no differences in eating vegetables.

Restricted to those with demographic info (N=1515 and N=1377)
dip) were given to each homeroom (N=180). Students could select fruits and vegetables from the baskets, and teachers were encouraged to discuss fruits and vegetables in class.
Coyle et al, 2009239
Quasi-experimental (pre- vs postintervention)
N=725, including N=207 with 24-h diet recalls, from a sample of kindergarten through 12th grade students from 5 schools in Mississippi
• Attitudes toward, familiarity, and preferences for fruits and vegetables
• Consumption of fruits and vegetables
Pre- vs postintervention during the 2004-2005 school year
Fresh Fruit and Vegetable Program: A federally funded initiative provided free fresh fruit and vegetable snacks to students. During the 2004-2005 school year, the Mississippi Department of Education Child Nutrition Programs initiated a pilot program to distribute free fruits and vegetables to students in kindergarten through 12th grade during the school day.
• Results showed greater familiarity with fruits and vegetables at all grade levels (P<0.05)
• Increased preferences for fruit were observed among 8th and 10th grade students (P<0.01).
• 8th graders also reported more positive attitudes toward eating fruits and vegetables (P<0.01), increased perceived self-efficacy to eat more fruit (P<0.01), and increased willingness to try new fruit.
• Student consumption of fruit in school and overall increased significantly, by 0.34 and 0.61 servings per day, respectively (P<0.01).
• In-school vegetable intake decreased (P=0.05), whereas overall vegetable consumption did not change.
Brown and Summerbell, 2009225
Systematic review of RCTs
RCTs evaluating school children, age kindergarten through 18 y, and published by September 2007
Effects of diet and physical activity interventions on BMI Only studies reporting a weight outcome were reviewed.
Interventions of at least 12 wk
Diet policy interventions and adiposity: Among 38 identified trials of school-based lifestyle interventions that focused on improving diet and/or physical activity behaviors to reduce BMI, 3 trials focused on diet alone.
Diet intervention vs control (3 trials): • Of 3 trials, 2 trials showed improvements in BMI z score. • 2 UK schools (11-y-olds) tested a low-intensity 12-mo
intervention to reduce intake of sugar-sweetened beverages. At 12 mo, the percentage of overweight/obese increased in the control group and was unchanged in the intervention group (mean absolute difference 7.7%; 95% CI, 2.2%, 13.1%). At 3 y, prevalence of overweight had increased in both groups, and between-group differences were no longer significant.
• A school in Norway (15-y-olds) evaluated whether dietary habits/school performance improved when participants ate breakfast. At 4 mo, BMI increased in the control group but not in the intervention group in both boys and girls (P<0.05).
• A school in Italy (12-y-olds) tested the efficacy of board games in providing nutrition knowledge/promoting healthy dietary behavior. There was no effect on BMI z score at 24 wk.
Foster et RCT N=1349 Primary: 2 y Diet policy • Significantly fewer children in the intervention schools (7.5%)

al, 2008238
students in grades 4-6 from 10 schools (5 intervention, 5 control) in a US city in the Mid-Atlantic region with at least 50% of students eligible for free or reduced-price meals
Incidences of overweight and obesity Secondary: Prevalence and remission of overweight and obesity; BMI z score; intake of total energy, fat, and fruits and vegetables; body dissatisfaction; hours of activity and inactivity
interventions and adiposity:
Schools were matched on school size and type of food service and randomly assigned to intervention or control groups. The School Nutrition Policy Initiative included the following components: school self-assessment, nutrition education, nutrition policy, social marketing, and parent outreach.
than in the control schools (14.9%) became overweight after 2 y, a 50% reduction.
• Prevalence of overweight was also lower in the intervention schools.
• No differences were observed in incidence or prevalence of obesity or in remission of overweight or obesity at 2 y.
Muckelbauer et al, 2009241
RCT N=2950 2nd and 3rd graders from 32 elementary schools (17 intervention, 15 control)
in socially deprived areas of Dortmund and Essen, 2 neighboring cities in Germany
• Daily water consumption
• Risk of overweight
1 y, August 2006−June
2007
School water Randomization was performed at the city level. Intervention included installation of 1-2 water fountains in schools, providing children with reusable water bottles, and teachers encouraging use of the water bottles. Other components were education (4 45-min classroom lessons regarding water needs of the body and the water circuit in nature) and goal setting (at 3 mo, teachers introduced a motivation unit that used a goal-setting strategy for a sustained increase in water consumption,
At the end of 1-y follow-up: • Daily water consumption was 1.1 glasses (200 mL) greater in
the intervention group. • Compared with the control group, the odds of overweight were
31% lower in the intervention group (P=0.04).

including quantitative targets and feedback). Control schools: no intervention
Patel et al, 2011242
Nonrandomized intervention study (pilot)
1 intervention and 1 comparison middle school in lower-income areas of Los Angeles, California
Daily water consumption at school, based on surveys of 7th grade students (N=793) and recordings of water used in cafeterias
5 wk, with assessment at 2 mo, in 2008
School water: In the intervention school, cold filtered drinking water was provided in 19-L dispensers in the cafeteria, reusable water bottles were distributed to students and staff, and education activities promoted drinking water. The comparison school received no intervention.
At 2 months postintervention, adjusting for sociodemographic characteristics and baseline intake of water at school: • The proportion of children drinking any water at school
(adjusted OR=1.76), drinking from fountains (OR=1.45), or drinking from reusable water bottles (OR=1.99) was higher in the intervention school than in the comparison school (P<0.01 for each).
• No statistically significant differences were seen in consumption of other beverages, including sodas, sports drinks, or 100% juice.
Loughridge and Barratt, 2005243
Nonrandomized intervention study (pilot)
3 secondary schools in North Tyneside, United Kingdom
Average water consumption at school
3 mo School water: Intervention schools received either cooled filter water plus active promotion or water alone. The control school received no intervention.
At the end of the 3-mo follow-up: • The average volume of water drunk by students in the water
plus promotion school was greater (P=0.05) than in the water-alone or control schools.
• The volume of soft drinks purchased by students in all 3 schools before and during the intervention did not significantly change.
Interventions Targeting Physical Activity
Author, y
Study Type
Population Outcomes Duration Intervention/Exposure
Findings
Willenberg et al, 2010249
Observational, cross-sectional
23 schools, N=3006 children 12 focus groups, N=91, to identify children’s ideas about what’s fun and healthy
• SOPLAY scans • Focus groups:
concept map, group discussion, drawing, photographic ordering
October 2004–December 2005 Focus groups in 2005-2006
School equipment:
Availability and types of playground equipment at schools
• 44% of children engaged in sedentary behavior, 30% in MPA, and 27% in VPA.
• MPA was higher in schools with fixed equipment, eg, slides, monkey bars (35% vs 20%; P<0.001)
• MPA was greater where the blacktop was marked with court markings/goals (34% vs 20%; P<0.001); play line markings were also higher (25% vs 20%; P=0.04).
• VPA was higher when loose equipment (33% vs 20%; P<0.001) and supervision (29% vs 22%; P<0.001) were available.
• In focus groups, children expressed concern about blacktop surfaces due to fear of injuries and falls.
• Children had an overriding preference for metal surfaces to

Age: 9-11 y wooden ones because they thought they were better for safe play and “attractive and fun” and thought that colored surface markings were better for playing.
• Children often were quick to point out that adults shouldn’t assume that older kids don’t want to play on fixed play equipment and also stated that as the school year went on, less loose equipment was available for play.
Nielsen et al, 2010250
Observational, cross-sectional
7 schools, N=417 children age 5-12 y, participating in the APPLE study
Physical activity measured by Actical accelerometer worn at the hip for 2-5 d, put on in the morning and taken off at bedtime
September−November 2004
School equipment:
number of permanent play facilities in schools, such as swings, playground markings (eg, hopscotch), courts, sandpits, slides, tower forts, and monkey bars
• The number of play facilities in schools ranged from 14 to 35 and was positively associated with both total physical activity and time engaged in MPA/VPA.
• For each additional play facility, average accelerometry counts were 3.8% higher at school (P<0.001) and 2.7% higher overall (P<0.001).
• Each additional facility was also associated with 2.3% (P=0.001) or 4 min more vigorous activity during school hours and 3.4% (P<0.0001) or 9 min more MPA/VPA over the day.
• Higher activity at school wasn’t compensated for by decreased activity later.
• For each additional 5 play facilities, overall activity increased by 15%-20%.
• The effects of play facilities were seen in both sexes and all ages.
Ridgers et al, 2010251
RCT 15 UK intervention schools (N=256, 130 boys, 126 girls) 11 UK control schools (N=214, 102 boys, 112 girls) Age: elementary school
• Physical activity: heart rate telemetry/accelerometry
• All wore a heart rate monitor.
• 300 wore an accelerometer during points of measure.
• BMI • Recess duration:
all had morning and lunch recess, and 11 also had recess in the afternoon.
12 mo School equipment:
• Intervention schools each received £20,000 (≈$31,174 US) to change the playground environment funded by the Department for Education and Skills as part of a national sporting playground initiative.
• Changes included the addition of playground markings (sports area, multiactivity area, quiet play area); physical structures, such as
• During lunch recess, VPA was 1.4% greater in intervention schools compared with control schools (P<0.05).
• Playground markings/structures increased the proportion of morning recess heart rate spent in MPA (from baseline 0.2±0.1% to 3.1±3.1%) and VPA (from baseline 0.2±0.1% to 3.6±2.1%) (P<0.05 each).
• There were similar positive effects on lunch recess heart rate for both MPA (from baseline 0.2± 0.01% to 3.0± 2.1%) and VPA (from baseline 0.2± 0.1% to 0.9± 1.3%).
• Effects were stronger at 6 mo postintervention than at 12 mo. • As age increased, physical activity during morning and lunch
recess decreased.

soccer goal posts, basketball hoops, fencing, seating; and greater supervision.
Brown and Summerbell, 2009 225
Systematic review of RCTs
RCTs evaluating school children, age kindergarten through 18 y
Effects of diet and physical activity interventions on BMI Only studies reporting a weight outcome were reviewed.
Interventions of at least 12 wk
Among 38 identified RCTs of school-based lifestyle interventions that focused on improving diet and/or physical activity behaviors to reduce BMI, 15 RCTs focused on physical activity alone.
Physical activity intervention vs control (15 trials): • 5 of 15 trials showed improvements in BMI z score. • 1 trial showed that 2 h per week of extra PE class improved BMI
at 6 mo but not over longer periods. • 1 trial showed that a 12-wk, 150 min per week aerobic dance
class reduced BMI (−0.8 kg/m2). • 10 of 15 trials showed no improvement (eg, 6-mo intervention
promoting supportive school, 12-wk intervention encouraging walking in girls, 4-mo intervention promoting additional PE classes, 12-wk intervention with individual counseling from a school nurse; 66-session aerobic/dance/gymnastics program).
Harris et al, 2009259
Systematic review and meta-analysis of RCTs
RCTs of school-based interventions with objective data on change in BMI, published through September 2008
Effect of school-based physical activity interventions on change in BMI in children
School-based interventions of at least 6 mo
• 18 RCTs involving 18,141 children, primarily in elementary school
• Duration of studies ranged from 6 mo to 3 y. In 15 of 18 studies, there was some type of cointervention.
Physical activity intervention vs control (18 trials):
• In overall pooled meta-analysis, physical activity interventions did not improve BMI compared with controls: weighted mean difference: −0.05 kg/m2; 95% CI, −0.19, 0.10.
• Similarly, no consistent changes were seen in other measures of body composition. Outcome measures reported included percentage of body fat, waist circumference, waist-to-hip ratio, triceps skin-fold thickness, subscapular skin-fold thickness, total lean mass, total fat mass, and skin-fold sum. Among 10 studies evaluating 18 such measures, only 3 of the 18 measures found significant improvement with physical activity intervention,1 demonstrated deterioration with physical activity intervention, and 14 did not show any significant change.
• Only 5 trials evaluated objective measures of physical activity. Three studies used SOFIT and found more physical activity in the intervention group; 2 studies used accelerometers and found no difference in physical activity in intervention vs control groups.
Jago et al, 2009260
Quasi-experimental pilot study (pre- vs postintervention)
• Pilot
study for
the
STOPP-
T2D 2003 study: 6 US schools (N=585)
• 2004
Monitored heart rate as a measure of MVPA
2003-2004 2003 activity study: • School received
$10,000 for equipment
• Specialist PE teacher provided
• 56 instruction cards designed for lesson plans to result in high levels of
2003: • Mean heart rate during PE ranged from 143 to 150 bpm. The
percentage of class time with heart rate >130-140 bpm ranged from 66% to 76%, equivalent to ≈16 min of physical activity during a 45-min class.
• For each day of the intervention, there was an increase of 0.2 bpm (P<0.0001) in mean heart rate during PE. An increase was also seen in the percentage of time spent in activities producing a heart rate >130 bpm (P<0.0001) and >140 bpm (P<0.0001) of about 0.3% per day for both.

study: 7 US schools (N=1544)
• Age: 6th graders
MVPA 2004 curriculum study • School received
$10,000 worth of equipment
• 5 units: basketball, Frisbee, jump rope, soccer, team ball; 8-12 lesson plans
• Master PE teacher and TA provided
2004: • The percentage of class time with heart rate >130 bpm
increased from 63% in week 3 to 72% in week 8, and with heart rate >140 bpm, from 49% in week 3 to 58% in week 8.
Kriemler et al, 2010257
RCT N=502 students in 28 1st and 5th grade elementary school classrooms from 15 schools in Switzerland
• Body fat (sum of 4 skin folds)
• Aerobic fitness (shuttle run test)
• Physical activity (accelerometry on weekdays)
• Quality of life • BMI, metabolic
risk (average z scores of waist circumference, BP, blood glucose, inverted HDL cholesterol, and triglycerides)
1 academic year (August 2005−June 2006)
Multicomponent PE+activity • Participants in both
groups received 3 45-min PE classes per week.
• The intervention group (16 classrooms) also received structuring of the 3 existing PE classes; 2 additional 45-min PE classes per week; daily short activity breaks (3-5 per day during academic lessons, lasting 2-5 min each); and daily physical activity homework.
After adjustment for grade, sex, baseline values, and clustering within classes: • Children in the intervention classrooms showed a greater
decrease in skin-fold thickness z score (−0.12; 95% CI, −0.21, −0.03; P=0.009), increase in shuttle run z score (+0.17; 95% CI, 0.01, 0.32; P=0.04), and total daily MPA/VPA z score (+0.44; 95% CI, 0.05, 0.82; P=0.03), with the latter due to increased activity during school hours (+1.19; 95% CI, 0.78, 1.60; P<0.001).
• The intervention also reduced BMI z score (−0.12; 95% CI, −0.19, −0.04; P<0.003) and cardiovascular risk z score (−0.18; 95% CI, −0.29, −0.06; P<0.003).
• No significant differences were seen in z scores for overall daily physical activity (0.21; −0.21 to 0.63), physical quality of life (0.42; −1.23 to 2.06), or psychological quality of life (0.59; −0.85 to 2.03).
Jansen et al, 2011261
RCT N=2622 children in grades 3-8 (age 6-12 y) in 20 schools in multiethnic, low-income areas in Rotterdam, Netherlands
• BMI • Waist
circumference • Fitness assessed
by 20-m shuttle run
1 school year
Multicomponent PE+activity: • “Lekker Fit”
schools: 3 PE sessions per week by trained teacher, additional sport/play outside school hours, physical activity education
• Control schools: no intervention.
Comparing intervention with control schools after 1 y: • No significant differences overall in grades 6-8 • In grades 3-5 only:
− Lower prevalence of overweight (OR=0.53; 95% CI, 0.36, 0.78)
− Lower waist circumference (−1.29 cm; 95% CI, −2.16, −0.42)
− Greater fitness (+0.57 laps; 95% CI, 0.13, 1.01)

Jurg et al, 2006258
Nonrandomized controlled trial
N=510 students, grades 4-6, in 4 intervention and 2 control schools in Amsterdam, Netherlands
• Physical activity assessed with a questionnaire
August 2002−June 2003
Multicomponent, including activity breaks • JUMP-in program:
Schools received an intervention including accessible school exercise activities around or within the school, structured PE by school teachers with a goal of 60+ min of MPA per day, regular breaks during usual lessons for physical activity, relaxation, and posture exercises, and parental support.
• Control schools: no intervention
• After multilevel analysis and adjustment for baseline physical habits and activities, pupils in the intervention schools were more likely to meet the guidelines (at least 60 min of MPA daily): OR 1.63; 95% CI, 1.02, 2.61.
• This difference was only significant among 6th grade students (OR 4.33; 95% CI, 1.82, 10.32), not 4th grade (OR 0.84; 95%CI, 0.34, 2.09) or 5th grade (OR 1.16; 95% CI, 0.48, 2.79) students.
Stewart et al, 2004252
Intervention study but without control or pre- vs postintervention comparison
N=71 students in a nonrandomized sample from 3 classrooms (grades 1, 3, 5) in a school in Georgia; of the students, 88% were black, 7% Hispanic, and 5% white
• Exercise intensity in METs, estimated from step counts measured using accelerometer parameters
• Calculated energy expenditure
Spring 2001
Activity breaks • A 10-min
classroom-based physical activity program implemented by teachers at least once a day in the intervention school (TAKE10!)
• No control
• During the program, exercise intensity ranged from 6.2 to 6.4 METs across all grades during activity and in the moderate to vigorous range of energy expenditure during all sessions.
• Average energy expenditure ranged from 25 to 37 kcal during each session and increased with grade.
• Change in exercise intensity or expenditure before or after the program was not assessed.
Mahar et al, 2006253
RCT N=243 students in 15 classes from
• Daily steps during school hours, measured by a pedometer
12-wk period from August–
Activity breaks • Intervention classes
(N=135 students) received a 10-min
• Students in the intervention classes took more daily steps in school than those in the control classes (5587 vs 4805, +782; effect size=0.49; P<0.05).

kindergarten through 4th grade in a public school in North Carolina
November (year not stated)
classroom-based physical activity program implemented by teachers.
• Control classes (N=108 students): no intervention
Liu et al, 2008254
Nonrandomized controlled trial
N=753 boys and girls age 6-12 y from 2 elementary schools in Beijing, China
• Duration of total physical activity per day assessed by validated 7-d questionnaire
• Average energy expenditure per day calculated from activity questionnaire
• BMI
October 2004−June 2005
Activity breaks • Intervention school:
a 10-min classroom-based physical activity program implemented by teachers at least once per day (Happy 10 program)
• Control school: no intervention
• Duration of total physical activity increased from 2.8 to 3.3 h per day in the intervention school but decreased from 4.4 to 2.9 h per day in the control school (P<0.05 for comparison of change).
• Average energy expenditure increased from 15.0 to 18.2 kcal/kg in the intervention school but decreased from 24.3 to 14.7 kcal in the control school (P<0.05 for comparison of change).
• Among boys, BMI increased similarly in both intervention (18.1-19.0 kg/m2) and control (18.0-18.7 kg/m2) schools (P=NS for comparison of change).
• Among girls, BMI decreased in the intervention (18.6-18.2 kg/m2) but increased in the control (16.4-17.1 kg/m2) school (P<0.05 for comparison of change).
Donnelly et al, 2009255
RCT N=1527 students, grades 2-3, in 24 schools in Northern Kansas
• BMI (primary) • Daily physical
activity assessed in a subset using accelerometers
2003-2006 Activity breaks • Physical Activity
Across the Curriculum: 14 intervention schools received a 90 min per week MVPA lesson delivered intermittently in the school day in addition to 60 min per week of PE.
• 10 control schools received 60 min per week of PE.
• There was no significant change in BMI or BMI percentile between the intervention and control schools. End BMI: 19.9 vs 20.0; change in BMI: 2.0±1.9 vs 2.0±1.9, P=0.83.
• Intervention schools had higher mean accelerometer counts (851 vs 744 over 4 d, P=0.007) due to greater activity during both school hours and on weekends and more time spent in MVPA (98 vs 72 min over 4 d, P=0.001)
• In post hoc observational analyses, intervention schools complying with 75+ min per week of intervention (N=9) had a smaller increase in BMI than intervention schools with <75 min per week of intervention (N=5). Change in BMI: 1.8±1.8 vs 2.4±2.0, P=0.02.
• The significance of change in BMI in compliant intervention schools (1.8±1.8) vs control schools (2.0±1.9) was not reported but did not appear to be statistically significant.
Katz et al, 2010256
RCT N=1214 students grades 2-4 at 5 schools in Missouri
• BMI • Maximal oxygen
consumption • Measured
abdominal strength, upper body strength, back extensor strength, and
September2007−April 2008
Activity breaks • Students in 3
intervention schools (N=655) received a range of multiple structured physical activity breaks, implemented by teachers during times when students
• Over 1 academic year, students in the intervention group had a significantly greater increase in BMI than controls (median BMI change 0.3 vs 0.1; P=0.02) and a trend toward a greater BMI z score (P=0.07 Lean muscle mass was not assessed.
• • The intervention group showed greater improvements in median
abdominal strength (curl-ups: +9.0 vs 0.0; P<0.01), upper-body strength (90-degree push-ups: +2.0 vs 0.0; P<0.01), and trunk extension (trunk lifts: +1.0, IQR 0.0, 3.0, vs 1.0, IQR 0.0, 2.0;

flexibility were not concentrating maximally in class.
• Students in 2 control schools (N=559) received no intervention.
P<0.01). • No significant differences were seen in flexibility or maximal
O2 consumption.
Mendoza et al, 2009266
Nonrandomized controlled trial
3 urban, socioeconomically disadvantaged public elementary schools (1 intervention vs 2 controls) in Seattle, Washington, kindergarten to 5th grade (age 5-11 y)
Evaluated change in walking vs all other forms of transport to school, assessed by serial cross-sectional surveys
(n≈650 each) at baseline and 1-y follow-up
1 y Walking school bus • Part-time
coordinator • Parent volunteers
• At baseline, the proportions of students walking to school did not differ at the intervention (20±2%) vs control (15±2%) schools (P=0.39).
• At 1 y, more students walked to school at the intervention (25±2%) vs control (7±1%) schools (P=0.001).
• No significant changes were seen in the percentage of students riding in a car or taking the school bus at baseline or 1 y (all P>0.05).
Heelan et al, 2009265
Nonrandomized controlled trial
2 intervention schools (N=464) 1 control school (N=227) Age: elementary school
• Trial assessed how children got to school (walking, biking, riding in car/bus) for 1 wk 3 times per year.
• A subset (N=201) received objective activity measures.
• BMI, skin-fold thickness, and percentage of body fat were measured twice per year.
2 y Walking school bus • Children walked to
school in groups with set stops along the way.
• Adults were present as “bus drivers” for supervision.
• Walk stops were within a 1.6-km radius of the school.
• 8 routes were created for the 2 participating schools.
• Participants walked an average of 1.04 km each way.
• After 2 y, 36% of children at the intervention schools actively commuted at least 50% of the time (meeting the HP 2010 goal) vs 26% of children at the control school (P<0.05).
• In the subset with objective measures, the effects were greater: 71% of intervention participants met the HP 2010 goal compared with 25% of control participants.
• Over 2 y, there were no statistically significant differences in BMI, BMI z score, or percentage of body fat between children at the intervention and control schools.
• In observational analyses, there was a significant difference in change in BMI over 2 y between frequent walkers (∆BMI=0.80 kg/m2) vs passive commuters (∆BMI=1.57 kg/m2), P<0.05.
• Frequent walkers vs passive commuters also had a smaller increase in sum of skin folds (2.40±5.80 vs 5.55±4.66) and percentage of body fat (1.55%±3.84% vs 3.72%±3.31).
RCT indicates randomized controlled trial; BMI, body mass index; OR, odds ratio; CI, confidence interval; WHO, World Health Organization; SPAN, School Physical Activity and Nutrition; PE, physical education; CATCH BP, Coordinated Approach to Child Health−Blood Pressure; STOPP, Stockholm Obesity Prevention Program; BP, blood pressure;

NE, nutrition education; NE+G, nutrition education plus gardening; KAP, Knowledge, Attitude, and Practice; FFQ, food frequency questionnaire; SOPLAY, System for Observing Play and Leisure Activity in Youth; VPA, vigorous physical activity; MPA, moderate physical activity; APPLE, A Pilot Programme for Lifestyle and Exercise; SOFIT, System for Observing Fitness Instruction Time; STOPP-T2D, Studies to Treat or Prevent Pediatric Type 2 Diabetes; MVPA, moderate to vigorous physical activity; PE, physical education; bpm, beats per minute; HDL, high-density lipoprotein; METs, metabolic equivalents; NS, not significant; IQR, interquartile range; and HP 2010, Healthy People 2010. Note: Reference numbers (eg, Brown and Summerbell, 2009218) appearing in this supplementary table correspond with those listed in the reference section of the statement. For the purposes of this supplementary table, these meta-analyses or systematic reviews (see "Author, y" column) are considered the primary citation. Additional studies mentioned in the primary citation may be included in the "Intervention/Exposure" and "Findings" columns. The additional studies can be accessed through the primary citation.

Supplementary Table 7. Studies of School Vending Machines
Author, y Design Population Outcomes Duration
Intervention/Exposure Findings
Nickelson et al, 2010244
Observational, cross-sectional
8 public middle schools N=4049 Age: 6th-8th grades
• Self-reported parental limits on soft drink intake
• School vending machine soft drink purchases
• Soft drink consumption
Survey taken during 1 class period
YRBSS
• Observed 7 items from YRBSS in relation to purchases of soft drinks from school vending machines and consumption of soft drinks at school/home
• Examined survey question about parental limits on consumption of soft drinks
• Measured age, sex, race/ethnicity, milk, and fruit juice intake
• 67% of students reported consuming no soft drinks per day.
• 54% of students reported no parental limits on consumption, 33% reported a limit of 1 soft drink per day, and 14% reported a limit of 2-3 soft drinks per day.
• The greatest number of purchasers of soft drinks from school vending machines were students who reported a parental limit of 2-3 soft drinks per day (29%) or no parental limit (27%) (P<0.001).
• Students with the lowest soft drink purchases from school vending machines (20%) reported a parental limit of 1 soft drink per day (P<0.001).
Park et al, 2010246
Observational, cross-sectional
73 Florida public middle schools N=4322 Age: 6th-8th grades
• Use of school vending machines
• Consuming snacks/caloric beverages in place of lunch
Spring 2003
Florida Youth Physical Activity and Nutrition Survey
• Statewide, self-reported school-based survey for middle school students to monitor attitudes, behaviors, physical activity, and nutrition knowledge
• Developed by Florida Dept of Health
• Survey examined vending machine types and items offered
• Items were grouped into healthier and less healthy snacks and beverages.
• 99% of students reported the presence of a vending machine serving snacks, 89% reported a beverage vending machine, and 88% reported having both.
• 70% reported buying less healthy snacks and 69% reported buying less healthy beverages.
• In schools with a beverage vending machine, more students (19%) selected snacks/beverages instead of lunch than in schools without beverage vending machines (7%) (P<0.05).
• Students in schools with a beverage machine had a higher risk for buying lunch from the vending machine (adjusted OR=3.5; 95% CI, 2.2-5.7).
• Students who bought snacks/beverages from the vending machines instead of school lunch ≥3 days per week more often purchased less healthy snacks.
Thompson et al, 2010245
Observational, cross-sectional
Public school students N=869
• Access to school vending machines
• Food purchases and dietary intakes
Given May−June 2005
Youth Styles Survey
• Consumer mail panel survey as part of Styles survey
• Survey inquired about school
• 58.7% of students reported that access to school vending machines was restricted to certain hours. The majority of these students reported not making any purchases from the vending machine (P<0.05).
• Students who bought food from the

vending machine access, purchasing behaviors, school rules about vending machines, individual dietary intakes, and purchase of pizza/fried foods from the school cafeteria.
vending machine ≥3 days per week were more likely to have unrestricted access to vending machines (OR=1.71; 95% CI, 1.13-2.59), drink soda (OR=3.21; 95% CI, 1.87-5.51), and eat chocolate/candy (OR=2.71; 95% CI, 1.34-5.46) at least 1 or more times per day.
• Students who bought lunch 1-2 times per week were more likely to buy fried foods/pizza from the school cafeteria (OR=2.43; 95% CI, 1.69-3.49); those buying food >3 times per week were even more likely to buy fried foods/pizza (OR=5.05; 95% CI, 3.10-8.22).
Fiske and Cullen, 2004109
RCT 10 vending machines in teachers’ lounges in Texas elementary and middle schools
• Assessed items sold
• Assessed dollar sales for items
• Total machine revenue
2-wk baseline assessment; 4-wk intervention
Teacher vending machines: • Each machine had 28 snack
items and 5 choices of gum. • Low-fat items were promoted
by − Labels (intervention I, 4
machines) − Labels plus signs
(intervention II, 4 machines)
− No intervention (control, 2 machines)
• Intervention I resulted in a trend toward a small increase in sales of low-fat items (P=0.08).
• Intervention II resulted in more target foods sold, without a significant effect on total dollar sales (P=0.11).
• A significant difference in total machine revenue was not seen in either intervention.
Gorton et al, 2010247
Quasi-experimental (pre- vs postintervention)
14 vending machines at 2 hospital sites N=835 at baseline; N=611 at follow-up (Included here although worksite-based)
• Web-based staff surveys: 1 preintervention and 1 midway through intervention
• Sales data pre- vs postintervention
March–May 2007 and March−May 2008
Hospital vending machines: • Intervention to provide at
least 50% more healthy choices in vending machines (defined as <800 kJ, <1.5 g saturated fat per 100 g, <450 mg per 100 g nonconfectionery items), and 50% other choices (<800 kJ)
• Preintervention: 16% of staff used vending machines >1 time per day, 51% said they tried to choose healthier items, and 84% reported they never or infrequently used vending machines.
• Mid intervention: no significant changes. • End intervention: no significant changes.
15% used vending machines >1 time per day, 53% said they tried to choose healthier items, and 85% reported they never or infrequently used vending machines.
• 87% of staff who frequented vending machines reported noticing that healthier snacks were available.
• 54% of staff who frequented vending machines reported changing their choices, with 31% doing so to make healthier choices.
• Postintervention, average purchase: 40% lower kJ, 32% lower total fat, and 41%

lower saturated fat
YRBSS indicates Youth Risk Behavior Surveillance System; OR, odds ratio; CI, confidence interval; and RCT, randomized controlled trial. Note: Reference numbers (eg, Nickelson et al, 2010238) appearing in this supplementary table correspond with those listed in the reference section of the statement. For the purposes of this supplementary table, these meta-analyses or systematic reviews (see "Author, y" column) are considered the primary citation. Additional studies mentioned in the primary citation may be included in the "Intervention/Exposure" and "Findings" columns. The additional studies can be accessed through the primary citation.

Supplementary Table 8. Workplace-Based Approaches to Improve Diet and Physical Activity.
Diet and Physical Activity
Author, y Design Population Outcomes Intervention/Exposure Findings Engbers et al, 2005121
Systematic review of controlled trials (with or without randomization) evaluating workplace environmental modifications to improve diet, physical activity, or other health indicators
Healthy employees in manufacturing, education, service, state agencies, health care, sales (insurance, computer, food), and telecommunications
• Knowledge or behaviors related to diet, physical activity, or other health indicators
• Follow-up in all trials identified ranged from 3 mo to 2.4 y.
All trials included worksite interventions to improve diets: • Glasgow et al, Emmones et al,
Sorenson et al, and Hebert et al used point-of-purchase food labeling, but how the labeling was used was not specified.
• Kronefeld et al, Beresford et al, Glasgow et al, Pegus et al, Sorenson et al, and Emmons et al expanded the availability of healthy products/enhanced visibility of healthy food; most distributed posters and bulletins.
• Glasgow et al, Pegus et al, Sorenson et al, and Emmons et al implemented healthy food options in vending machines.
All interventions were multicomponent, combining environmental changes with education, counseling, and distribution of info (brochures, kick-off events, flyers, etc).
• Glasgow et al: 2 studies, same intervention, 1995no effects on dietary intake, tobacco use, and cholesterol levels; 1997 no effect on cholesterol levels, significant decrease in fat intake, significant increase in self-reported exercise
• Emmons et al: significant increase in exercise behavior and consumption of fruits and vegetables
• Sorenson et al: 2 studies − Treatwell 1992: no significant changes in fiber
intake, significant decrease in dietary fat − Treatwell 5-day 1999: worksite plus
familysignificant increase in fruit and vegetable intake compared with worksite intervention and control
• Sorenson et al: Working Well Trial 1996significant increase in fruits and vegetables consumption, insignificant decrease in smoking
• Sorenson et al: Well Works Trial 1998significant decrease in fat intake, significant increase in fruit and vegetable consumption and fiber, no effect on smoking; 2002no significant changes between conditions on fruit and vegetable intake, smoking cessation rates higher in 1 intervention condition
• Hebert et al: identical subjects to Sorenson 1992, increase in vegetable consumption, decrease in ground/processed meat consumption, high correlation between priori intervention targets and behavior
• Kronefeld et al: increase in consumption of chicken, few other changes in dietary habits; increase in exercise in both intervention and control groups; decrease in number of smokers in intervention group
• Beresford et al: larger increase in fruit and vegetable intake in intervention than in control sites (both significant)
• Pegus et al: significant increase in knowledge of cardiac risk factors, diet, and BP management;

improvements in exercise, diet, nutrition, smoking, BMI, BP, and cholesterol but no significant differences from control
• Braeckman et al: no change in cholesterol levels, significant increase in nutrition knowledge, significant decrease in total energy and fat intake, increase in BMI in intervention group
• Strong evidence on effectiveness of worksite dietary interventions to alter fruit, vegetable, and fat intake
• Many studies of lower quality: only 4 of 13 trials overall could be qualified as high quality; outcome measures were often self-reported; none of the studies described randomization process
Physical activity • See entry in the next section of this Table, below.
Anderson et al, 2009267
Systematic review of RCTs of worksite interventions on diet and/or physical activity for adults
RCTs in worksites
Any adiposity-related outcomes, including weight, BMI, or body fat
US Task Force on Community Preventive Services review of diet and/or physical activity interventions at worksites:
• Most studies combined informational and behavioral strategies to influence diet and physical activity.
• Fewer studies modified the work environment (eg, cafeteria, exercise facilities) to promote healthy choices.
At 6−12-mo follow-up, the overall pooled effect estimate showed • Weight reduction of 1.26 kg (95% CI, −4.6, −1.0)
based on 9 RCTs • BMI reduction of 0.5 kg/m2 (95% CI, −0.8, −0.2)
based on 6 RCTs • Heterogeneity not identified by sex or worksite
settings.
Groeneveld et al, 2010268
Systematic review of RCTs that targeted workers; aimed at improving diet and/or physical activity; and measured CVD risk factors
31 RCTs identified
Body weight, body fat, BP, blood lipids, and/or blood glucose
Diversity of interventions identified, including counseling, group education, and exercise. Of the 31 trials, 18 were judged to be of high quality.
.
• Strong evidence was found for a beneficial effect on body fat.
• Among higher-risk populations, there was also strong evidence for a beneficial effect on body weight.
• Due to inconsistencies in results between studies, there was no evidence for the effectiveness of interventions on the remaining outcomes.
Engbers et al, 2006, 2007122,123
Controlled trial N=452 and 515 office workers at 2 government
• Brief dietary questionnaire
• BMI, waist/hip circumference, skin-fold
Food Steps Trial: 1-y intervention: • Diet: Product information sheets
placed near foods, indicating calorie values in terms of exercise.
Dietary habits: • No significant effects on consumption of fruits,
vegetables, or dietary fat Physical activity: • Not reported

worksites thickness, BP, cholesterol levels
• Measures at 3 and 12 mo
Every 4 wk, 1 of 6 food groups was highlighted. Leaflets with information on healthy food, BP, and cholesterol were left in the canteen.
• Activity: Focus on increasing use of stairs by point-of-decision prompts on ground floor elevator doors; use of footprint graphics on the floor to lead employees to stairwells; motivational quotes, poems, and exercise facts posted on the windows between floors; and slim mirrors on every other staircase floor
• Control group: no treatment
Physiologic risk factors, among those with a BMI ≥23: • At 1 y, there were no significant differences in
anthropometric measures between groups. • When compared with controls, the intervention
group had significant favorable changes in total cholesterol (women only); HDL cholesterol (men only); and the total-HDL ratio.
• When compared with controls, BP was actually significantly increased in the intervention group (+5 mm Hg, P<0.001).
Lowe et al, 2010112
Quasi-experimental (pre-/postintervention)
N=96 hospital employees
Worksite cafeteria lunch purchases as assessed by scanned purchasing cards, comparing 3 mo before vs after the intervention
• Group 1: Environmental changes in the cafeteria, including addition of selected healthier options along with food labeling (calories, energy density, macronutrients) for all foods sold during lunch
• Group 2: Environmental changes in the cafeteria plus pricing incentives and 4 1-h group sessions of nutrition education on strategies for decreasing energy density of the diet
• In a comparison of before vs after the intervention, total calories and percent energy from fat at lunch decreased (≈70 less kcal and 5% less energy, respectively; P<0.01 each).
• There were no differences between the 2 intervention groups, ie, the addition of pricing incentives and nutrition education did not appear to have any additional impact. However, the sample size was small and may have not been adequately powered after attrition of subjects.
Physical Activity
Author, y Design Population Outcomes Intervention/Exposure Findings Engbers et al, 2005121
Systematic review of controlled trials (with or without randomization) evaluating workplace environmental modifications to improve diet, physical activity, or other health
Healthy employees in manufacturing, education, service, state agencies, health care, sales (insurance, computer, food), and
• Knowledge or behaviors related to diet, physical activity, or other health indicators
• Follow-up in all trials identified ranged from 3 mo to 2.4 y.
3 trials included worksite interventions to increase physical activity: • Walking track on factory grounds • Posters and bulletin boards to
encourage use of stairs • New or upgrading of worksite
fitness facilities, plus route for walking during lunchtime
All interventions were multicomponent, combining environmental changes with education, counseling, and distribution of information
Physical activity • Adding a worksite walking track did not
significantly improve CVD risk factors. Improvements were seen in both intervention and control groups.
• Posters and bulletins for stairs did not significantly increase activity. Exercise improved in both intervention and control groups.
• Adding or upgrading worksite fitness facilities significantly increased physical activity.
• Studies were generally of lower quality, with self-reported outcomes and no clear description of randomization procedures.
indicators telecommunications
(brochures, kick-off events, flyers, etc).
Diet See entry in prior section of this Table, above.
Engbers et al, 2007269
Observational, cross-sectional
N=186 office workers with BMI >23 at 2 government agencies
• Self-reported stair use: how often stairs were used, how many floors covered
• Objective measures using detection device, chip card
Worksite 1 • 6-story building, staircases visible
and located directly next to elevator
Worksite 2 • 12-story city hall building, tighter
security, stairs not accessible from 1st floor, stairs hidden
(Baseline data from Food Steps Trial)
• Worksite 1: Men and normal-weight employees used stairs more often and covered more floors than did women and overweight employees, respectively.
• Worksite 1: Men had significantly higher values on objective stair-use frequency (P=0.002) and objective number of floors covered (P<0.001) compared with worksite 2.
• No significant differences were found between worksite 1 and 2 for women.
Schwetschenau et al, 2008272
Observational, cross-sectional
N=88 employees of a Midwestern company
Membership in and use of workplace fitness centers
Survey of worksite employees to assess perceived barriers to using worksite fitness centers
• The perception that the fitness center had inadequate exercise facilities was associated with a lower likelihood of membership.
• Among members, embarrassment about exercising in front of colleagues was associated with lower frequency of use.
Schwartz et al, 2009271
Observational, cross-sectional
N=293 employed adults in Montgomery County, Maryland
• Accelerometer determined steps per weekday
• Self-reported walking home from work
8 built-environment characteristics near workplace (presence of sidewalks, crosswalks/pedestrian signals, cul-de-sacs, bicycle or pedestrian trails, trees along streets, no litter, four-way intersections, too much traffic) and 4 workplace policies (presence of exercise facilities, exercise programs, showers, and lockers)
• No built-environment characteristic near the workplace was significantly associated with measured amounts of weekday walking.
• Some built-environment characteristics were positively associated with self-reported walking home from work, including the presence of sidewalks, crosswalks, and pedestrian signals near the workplace.
• All 4 workplace policies were positively associated with weekday walking (P<0.05).
Nicoll et al, 2009270
Quasi-experimental
N=299 office building employees in Texas
• Stair use from infrared monitors and card readers
• Survey of stair use and attitudes and behaviors toward physical activity.
• Natural experiment: 1 bank of skip-stop elevators, which stop only at every 3rd floor, requiring users to take stairs to other floors, with nearby stairs made open and appealing
• Control: Traditional elevator core and fire exit stairwell on the other side of the building
• The open stair near the skip-stop elevator was used 33 times more than the enclosed fire stair in traditional core (117,619 entries for skip-stop stairs, 3570 entries for traditional stairs).
• Initial attitudes toward skip stop: 32% satisfied, 32% neutral, and 35% dissatisfied
• Attitudes 22 mo later: 48% satisfied, 27% neutral, and 25% dissatisfied
• 73% of employees used stairs daily. Pedersen et al, 2009273
RCT N=549 employees in Denmark
• Self-reported physical activity.
• Physical fitness by maximal muscle strength, maximal O2
Resistance training: • Allotted 1 h per week during work
for intervention activities • Traditional dynamic strengthening
exercises with dumbbells and isometric exercises
General physical exercise:
After 1 y: • There were no changes in self-reported physical
activity. • Both interventions decreased percentage of body
fat (mean decrease 2.2%, P<0.01) and systolic BP (mean decrease 6.4 mm Hg, P<0.001).
• There were also small increases (≈10%) in muscle

uptake • Heart rate • BMI • Percent body fat • BP
• Allotted 1 h per week during work for intervention activities
• Steppers placed at copy machine, punch bags placed in the hall, Nordic walking group sessions, step counters, and 8-min exercise CD
• Employees also encouraged to increase physical activity during leisure time
Control: • Information on health-enhancing
activities except for physical activity, with formation of discussion groups
• Allotted 1 h per week during work hours for intervention activities
strength and maximal O2 uptake. • There were no significant differences in BMI or
productivity.
Gilson et al, 2007274
RCT N=64 university employees in the United Kingdom (58 women, 6 men)
• Pedometer step counts assessed at 1, 5, and 10 wk
• Percentage of body fat
• Waist circumference
• BP
Intervention group 1: • Designated campus walking
routes • At least 15 min of continuous
brisk walking every workday • Weekly emails for 10 wk Intervention group 2: • Incorporating walking into daily
tasks • Accumulation of step counts,
“walk and talk” • Weekly emails for 10 wk Control: no treatment
At 10 wk: • Steps decreased in control group and increased in
both treatment groups, with a net difference of about 1800 steps per day (P<0.002).
• There were small, nonsignificant changes in other health variables.
Comprehensive Worksite Wellness Programs
Author, y Design Population Outcomes Intervention/Exposure Findings Pelletier 2001, 2005, 2009275-277
Systematic reviews of RCTs and quasi-experimental studies that evaluated both clinical and cost outcomes
Published studies from the United States, including 15 from 1998-2000, 12 from 2000-2004, and 16 from 2004-
• Clinical outcomes
• Cost outcomes
Comprehensive worksite wellness programs, defined as programs that provided ongoing health promotion and disease prevention that integrates specific components into a coherent, ongoing program and is consistent with corporate objectives.
Evidence from 1998-2000 (15 studies): • Many methodologic limitations were identified. • Overall data indicate benefits for both clinical and
cost outcomes, in particular for facets of programs that identify and provide individualized risk reduction for high-risk employees.
Evidence from 2000-2004 (12 studies): • Methodologic limitations continue and are perhaps
even worse. • In the context of these important limitations, these
studies provide additional evidence of benefits for both clinical and cost outcomes.

2008 Evidence from 2004-2008 (16 studies): • Nearly all studies were quasi-experimental; only 1
RCT was identified. • Overall conclusions are unchanged from prior
reviews. Cahill et al, 2008282
Systematic review of controlled workplace interventions for smoking cessation
51 studies published through 2008
• Smoking cessation attempts
• Smoking cessation
Randomized and quasi-RCTs allocating individuals, workplaces, or companies to intervention or control conditions to promote smoking cessation. Most studies randomized individuals at the workplace (rather than randomizing workplace-level interventions) to various interventions, including group therapy, individual counseling, self-help materials, nicotine replacement therapy, and social support.
Due to heterogeneity in study methods, formal meta-analysis was not performed. Qualitative impressions of the authors were summarized. Among 37 studies of individual-level interventions:
• Group programs, individual counseling, and nicotine replacement therapy each increased cessation rates in comparison with no treatment or minimal intervention controls.
• Self-help materials were less effective. Among 16 studies of workplace-level interventions: • Strong evidence was not seen that comprehensive
programs reduced prevalence of smoking. • Incentive schemes increased cessation attempts,
but there was less evidence that they increased the rate of actual quitting.
Calderon et al, 2008278
Quasi-experimental (pre- vs postintervention)
N=366 employees, average age 49 y, 75% male
2- and 5-mo changes from baseline in CVD risk factors over 3 y of the program
Kennedy Space Center Cardiovascular Disease Risk Reduction Program:
A worksite program to identify employees with high cholesterol from voluntary monthly screening visits and target their CVD risk factors through health education phone counseling. Phone counseling consists of reviewing lab values with participants, discussing dietary fat intake frequency using an intake questionnaire, and promoting increase in exercise frequency.
At 2 mo: • Decreases in systolic BP (P=0.03); diastolic BP
(P=0.002); total cholesterol, LDL cholesterol, and dietary fat intake (P<0.001 each); and increase in exercise frequency (P=0.04)
At 5 mo: • Decreases in triglycerides (P=0.05) and total
cholesterol, LDL cholesterol, and dietary fat intake (P<0.001 each)
Chung et al, 2009279
Quasi-experimental (pre- vs postintervention)
N=343 Chrysler employees, age >18 y
• Smoking status • Physical activity • HDL, LDL,
total cholesterol • BP • Diabetes • Overall
estimated Framingham risk
• Intervention: 18-mo approach to improve CVD risk: − Employees were stratified into 3
risk categories: low (no CVD), moderate (treated and controlled CVD), or high (newly diagnosed CVD).
− All received more targeted education/individualized intervention than general employees, including meeting with a nurse, receiving a starter
Compared with baseline, postintervention: • Smoking decreased by 14%. • 36% of participants lost weight. • Mean BMI decreased slightly from 28.4 to 28.2
(P=0.04). • Mean systolic and diastolic BP decreased by 6.7
mm Hg (P<0.0001) and 1.1 mm Hg (P=0.02), respectively.
• Mean total cholesterol/HDL-C ratio was lower (P=0.02).
• Predicted RR of CVD was 12.7% lower (P=0.01)

kit, and focusing on realistic and measurable goals to reduce risk.
− Moderate-/high-risk employees also received additional progress meetings and small-group educational sessions.
• Control: All employees received general education, a CVD risk profile assessment and BMI calculator, general seminars on CVD topics, information in company newsletters, a toll-free number for questions, and physical activity guidelines.
• At baseline, 68.5% were low risk, 21.6% were moderate risk, and 9.9% were high risk. At conclusion, 71.1% were low risk, 21.6% were moderate risk, and 7.3% were high risk, for an overall RR reduction of 12.7% (P=0.01).
• The proportion of subjects who reported being active for 30-60 min most days of the week increased from 0.5% to 57%.
• 86% planned to maintain lifestyle changes. • 95% thought it was important for employers to
offer a workplace health promotion program.
Milani and Lavie, 2009280
RCT N=308 employees and N=31 spouses, randomized to active intervention (N=185) vs usual care (N=154)
• 6-mo changes in risk factors
• Total medical claim costs the year before and the year after intervention
• Cost-effectiveness.
Intervention: 6-mo worksite health intervention using cardiac rehabilitation and exercise training staff, consisting of worksite health education, nutritional counseling, smoking cessation counseling, physical activity promotion, selected physician referral, and other health counseling
• Improvements were seen in body fat (−9%; P=0.001), HDL-C (+13%; P=0.0001), diastolic BP (−2%; P=0.01), health habits (−60%; P=0.0001), total health risk (−25%; P=0.0001), quality of life (+10%; P=0.001), and other symptoms (depression −33%, anxiety −32%, somatization −33%, hostility −47%; all P<0.001).
• Of employees categorized as high risk at baseline, 57% were converted to low-risk status.
• Average employee annual claim costs decreased 48% (P=0.002) for the 12 mo after the intervention, whereas control employees' costs remained unchanged (−16%; P=NS).
• Compared with the costs of intervention, the savings represented a 6-fold return on investment.
Racette et al, 2009281
RCT N=151 employees age >18 at worksites within a large medical center in St Louis, Missouri
At 6 mo and 1 y: • Diet • Fitness • BMI, body
composition • BP • Blood lipids • Overall
estimated Framingham risk
Intervention: • Personal health report • Transtheoretical Model of
Behavior Change • Pedometers, weekly healthy snack
cart, on-site Weight Watchers meetings, on-site group exercise program, monthly lunchtime seminars, monthly newsletters, walking maps, team competitions, participation cards, participation rewards
• Registered dietitian available weekly
Control: • Personal health report
In the intervention group: • Increased daily servings of fruits and vegetables
from 4.7 at baseline to 7.8 at 6 mo and 7 at 1 y (P<0.01); smaller improvements in control (4.3 at baseline, 5.3 at 6 mo, 5.1 at 1 y)
• Decreased intake of saturated fat, fatty meats, and fried foods at 6 mo and 1 y (P<0.001)
• Increased daily physical activity (P<0.001) as shown in an increase in walking/moderate activities (P<0.01)
• Percentage of employees in lowest Framingham risk category increased from 40% to 57% at 1 y (P<0.01); no significant change in control.
• At 1 y, percentage with metabolic syndrome decreased from 38% to 25% in intervention (P=0.02) and 29% to 18% in control (P=0.07).

BP indicates blood pressure; BMI, body mass index; RCT, randomized controlled trial; CI, confidence interval; CVD, cardiovascular disease; HDL, high-density lipoprotein; HDL-C, high-density lipoprotein cholesterol; LDL, low-density lipoprotein; RR, relative risk; and NS, not significant Note: Reference numbers (eg, Engbers et al, 2005121) appearing in this supplementary table correspond with those listed in the reference section of the statement. For the purposes of this supplementary table, these meta-analyses or systematic reviews (see "Author, y" column) are considered the primary citation. Additional studies mentioned in the primary citation may be included in the "Intervention/Exposure" and "Findings" columns. The additional studies can be accessed through the primary citation.

Supplementary Table 9. Local Environmental Change to Improve Diet (Community Settings)
Accessibility to Supermarkets, Grocery Stores, and Convenience Stores
Author, y Design Population Duration Intervention/Evaluation Major Findings
Morland et al, 2002284
Observational, cross-sectional
N=2392 black and 8231 white participants, age 49-73 y, in the ARIC cohort
1993-95, 1999 This study evaluated the relation between local food environment and intakes of selected foods and nutrients. The food environment was characterized by the number of supermarkets, grocery stores, full-service restaurants, and fast-food restaurants located in the residence census tract of participants (Maryland, North Carolina, Mississippi, and Minnesota), based on data from local health departments and state departments of agriculture in 1999. Dietary intakes were estimated by a semiquantitative FFQ in 1993-1995. Evaluated dietary metrics included daily consumption of ≥2 servings of fruits, ≥3 servings of vegetables, ≤300 mg of cholesterol, ≤30% of calories from total fat, and ≤10% of calories from saturated fat.
• 31% of white but only 8% of black participants lived in a census tract with 1 or more supermarkets. On average, there were 5 times as many supermarkets in census tracts where whites lived.
After adjustment for income, education, and other types of food stores and places: • The presence of a neighborhood
supermarket was associated with meeting dietary metrics for fruits and vegetables (RR=1.54; 95% CI, 1.11, 2.12), total fat (RR=1.22; 95% CI, 1.03, 1.44), and saturated fat (RR=1.30; 95% CI, 1.07, 1.56) among blacks and with meeting the dietary metric for total fat (RR=1.09; 95% CI, 1.01, 1.18) among whites.
• Among blacks only, each additional supermarket in the census tract was associated with 0.41 higher daily servings of fruits and vegetables (95% CI, 0.13, 0.76).
• See the separate section in this Table (below) for findings related to fast-food and full-service restaurants.
Laraia et al, 2004285
Observational, cross-sectional
N=918 women in the PIN study in North Carolina
1995-1999 This study examined the relation between distance to the closest supermarket or convenience store and diet quality index for pregnancy. Data on food stores were obtained from the USDA 2000 inspection registry and geocoded. Data on dietary intakes (percentage of recommended servings of grains, vegetables, and fruits, percentage of RDA of folate and iron, AI of calcium, percentage of calories from fat, and a meal pattern score) were obtained from a validated FFQ and used to construct a diet quality index.
After adjustment for individual factors (age, race, marital status, income, and education) and distance to other food retail outlets: • Women living >6.4 km from a
supermarket were more likely to fall into the lowest diet quality tertile compared with women living ≤3.2 km from a supermarket (OR=2.16; 95% CI, 1.2, 4.0).
• Each 1.6 km closer to the nearest convenience store was associated with better diet, ie, lower probability of being in the lowest diet quality tertile (34% at

3.2 km, 38% at 6.4 km, and 42% at 9.6 km).
Rose et al, 2004287
Observational, cross-sectional
N=963, national sample of US participants in the Food Stamp program
1996-1997 This study evaluated the relation between access to food stores and fruit and vegetable consumption. By using self-reported supermarket shopping, travel time, and car ownership, a 3-level supermarket access variable was created, including little access, moderate access, and easy access. Weekly household fruit and vegetable consumption was estimated by 2 at-home interviews.
After adjustment for urbanization, household income and size, race, schooling, single-parent status, and employment status of the respondent: • Distance to the nearest supermarket was
inversely associated with fruit consumption. Those who lived >8 km from the nearest supermarket consumed 62 g less fruit (95% CI, −7, −117), with a nonsignificant trend toward 36 g less vegetables (95% CI, −108, 35) per adult equivalent per day than those living closer to the store.
• Overall “easy access” to a supermarket was associated with consuming 84 g more fruit (95% CI, 5, 162) and a nonsignificant trend toward 48 g more vegetables (95% CI, −57, 153) per adult equivalent per day, compared with little access.
Sturm et al, 2005173
Observational, longitudinal
N=6918 participants, age 7 y, in the ECLS-K in 59 metropolitan areas in 37 states
4 y, 1998-2002 This study evaluated the relation between density of grocery stores, convenience stores, fast-food restaurants, and full-service restaurants in a child’s neighborhood (home and school ZIP codes) and changes in BMI. Individual-level data were obtained from the cohort. Data on per capita numbers of grocery stores, convenience stores, full-service restaurants, fast-food restaurants, ratio of grocery stores to convenience stores, and ratio of full-service restaurants to fast-food restaurants in the residence ZIP code were obtained from the US Census Bureau 1999 ZIP Code Business Patterns files.
After adjusting for BMI, birth weight, family income, sex, mother's education, and race/ethnicity: • BMI change over 3 y was not
significantly associated with density of grocery or convenience stores.
• See the separate section in this Table (below) for findings related to fast-food and full-service restaurants.
Inagami et al, 2006300
Observational, cross-sectional
N=2144 participants in the Los Angeles Family and Neighborhood Study
2000-2002 This study examined the relation between distance to and characteristics of the grocery store where people shop and BMI. Data on neighborhood and grocery store characteristics, including
After adjustment for age, gender, education, race/ethnicity, employment, marital status, income, and neighborhood socioeconomic characteristics: • Living ≥2.82 km from a grocery store

percentage living below the poverty line, percentage of households headed by a woman, male unemployment rate, and percentage of families receiving public assistance were obtained from the 2000 US Census and used to create a neighborhood disadvantage score. BMI was calculated from self-reported height and weight.
was associated with higher BMI (+0.78, P<0.05).
• BMI was also higher in individuals who chose to shop in grocery stores in more disadvantaged neighborhoods than in their own residential neighborhood (P<0.01).
Morland et al, 2006290
Observational, cross-sectional
N=10,763 participants, age 49-73 y, in the ARIC cohort living in 207 areas of Mississippi, North Carolina, Maryland, and Minnesota
1993-95, 1999 This study evaluated the relation between the presence of supermarkets, grocery stores, and convenience stores in an individual’s residential census tract and prevalence of obesity and other CVD risk factors. Food store data were obtained from local health departments and state departments of agriculture in 1999. BMI was calculated from weight and height measurements collected in 1993.
After adjustment for age, gender, race/ethnicity, income, education, physical activity, and all types of food stores and places simultaneously: • The presence of supermarkets was
associated with a lower prevalence of overweight (OR=0.94; 95% CI, 0.90, 0.98) and obesity (OR=0.83; 95% CI, 0.75, 0.92).
• No association was found between the presence of grocery stores and overweight (OR=1.03; 95% CI, 1.00, 1.07) or obesity (OR=1.06; 95% CI, 0.99, 1.16).
• The presence of convenience stores was associated with a higher prevalence of overweight (OR=1.06; 95% CI, 1.02, 1.10) and obesity (OR=1.16; 95% CI, 1.05, 1.27).
• No significant associations were found between the presence of supermarkets, grocery stores, or convenience stores and prevalence of diabetes, high cholesterol, or hypertension.
Jago et al, 2007288
Observational, cross-sectional
N=204 Boy Scouts, age 10-14 y, recruited from 36 troops within the greater Houston, Texas area
2003 This study evaluated the relation between distance to food and restaurant outlets and fruit and vegetable consumption. A buffer with a 1.6-km radius was created around each participant’s home, and by using council public health records, distance to the nearest food establishment was calculated. An FFQ was used to assess fruit and vegetable consumption. Vegetables were evaluated in 2 groups,
After adjustment for BMI, age, parental education, and ethnicity: • No significant associations were seen
between distance to supermarkets or warehouse clubs and fruit and vegetable consumption.
• Living closer to a convenience store was associated with lower consumption of fruit and juice (P=0.002), low-fat vegetables (P=0.006), and high-fat vegetables (P=0.001).

including “high-fat” vegetables (potatoes, french fries, coleslaw) and other (“low-fat”) vegetables.
• See the separate section in this Table (below) for findings related to fast-food and full-service restaurants.
Wang et al, 2007294
Observational, multiple cross-sectional
N=5795 participants, age 25-74 y, in the Stanford Heart Disease Prevention Program surveys
1979-1990 This study assessed the relation between various types of food stores and BMI. Data on distance to and density of chain supermarkets, grocery stores, ethnic markets, convenience stores, and fast-food restaurants were obtained from the California State Board of Equalization and telephone business directories for the relevant years. Data on BMI and other individual factors were obtained from 5 cross‐sectional surveys conducted between 1979 and 1990.
After adjustment for age, gender, ethnicity, SES, smoking, physical activity, and nutrition knowledge: • Among women only, closer proximity to
supermarkets and ethnic markets was associated with lower BMI (P<0.05 each). No associations were seen in men.
• Proximity to grocery stores and convenience stores and density of each of these types of stores were not significantly associated with BMI.
• See the separate section in this Table (below) for findings related to fast-food restaurants.
Lopez, 2007291
Observational, cross-sectional
N=15,358 participants in the Massachusetts BRFSS
1998-2002 This study examined the relation between neighborhood presence of a supermarket and fast-food density and obesity. ZIP code level data were obtained from the 2000 US Census and the 2001 County Business Patterns. BMI was calculated based on self-reported height and weight.
After adjusting for age, sex, race/ethnicity, education, income, smoking status, population density, median income, establishment density, and employment density: • The presence of a supermarket was
associated with lower risk of obesity (OR=0.89; 95% CI, 0.82, 0.98).
• See the separate section in this Table (below) for findings related to fast-food restaurants.
Powell et al, 2007292
Observational, cross-sectional
N=73,079 8th and 10th grade students in the nationwide US Monitoring and Future study
1997-2003 This study examined the relation between per capita availability of chain supermarkets, nonchain supermarkets, convenience stores, and grocery stores and weight status among children. Individual-level data came from the study, and food store data were obtained from Dun and Bradstreet business lists. BMI was calculated from self-reported weight and height.
After adjusting for age, gender, race/ethnicity, grade, parents’ education, neighborhood designation (rural, urban), student income, weekly hours of work by the student, mother’s employment status (part-time or full-time), presence of restaurants and fast-food restaurants, prices of fast food and fruits and vegetables, and neighborhood per capita income: • The density of chain supermarkets per
10,000 capita was inversely associated with BMI (β=−0.1093, P<0.01) and overweight (β=−0.0059, P<0.05).
• Greater density of convenience stores was associated with higher BMI (β=0.0295,

P<0.05) and overweight (β=0.0015, P<0.05).
• The association between supermarket availability and weight was larger for black children (β=−0.3187, P<0.01) vs white (β=−0.0959, P<0.01) or Hispanic children (β=−0.0898, P<0.1).
• No association was found between the availability of nonchain supermarkets and grocery stores and BMI.
Liu et al, 2007293
Observational, cross-sectional
N=7334 children, age 3-18 y, who visited for child-wellness care in 7 urban primary care clinics in Marion County, Indiana
2000 This study evaluated the relation between proximity of home to a supermarket, grocery store, convenience store, and fast-food restaurant and prevalence of overweight (BMI >95th percentile). Data on food establishments and categorization were obtained from hygiene grading conducted by the Marion County Health Department. Data from the 2000 US Census were used to classify participants’ residence as high (≥695 persons/km2) or low (<695 persons/km2) population density.
After adjusting for age, race, gender, and median family income of the neighborhood: • Greater distance to the nearest
supermarket was associated with higher-risk overweight only in children living in lower-population density regions (OR: 1.04; P=0.03).
• No significant associations were seen between distance to the nearest grocery store or convenience store and prevalence of overweight in either high or low population density neighborhoods.
• See the separate section in this Table (below) for findings related to fast-food restaurants.
Moore et al, 2008286
Observational, cross-sectional
N=2384 adults, age 45-84 y, in the MESA cohort
2004 This study assessed the relation between local food environment and diet quality. Food environment was characterized by density of supermarkets within 1.6 km of home, participants’ reports of the availability of healthy foods in the neighborhood, and a measure of the availability of healthy foods created by aggregating the perceptions of non-MESA participants living in the participants’ neighborhoods. Supermarket data were obtained from InfoUSA (Papillion, Nebraska). An FFQ was used to develop 2 dietary measures, including the AHEI and the empirically derived FPM diet pattern. A healthy diet was defined as scoring in the top quintile of AHEI or the bottom quintile of FPM.
After adjustment for age, sex, race, and per capita income: • Living in a neighborhood with no
supermarkets within 1.6 km of home compared with living in the neighborhood with >2.2 supermarkets near home was associated with a 25% lower probability of having a healthy diet based on AHEI (RR=0.75; 95% CI, 0.59-0.95) and a 46% lower probability of having a healthy diet based on FPM (RR=0.54; 95% CI, 0.42, 0.70).
• On the basis of participant or informant reports, living in a neighborhood with the lowest availability of healthy food was associated with 22%-35% lower probability of having a healthy diet by either diet pattern (P<0.05), compared with living in a neighborhood with the

highest availability of healthy food.
Wang et al, 2008283
Observational, overall cross-sectional trends
N=5779 participants, age 25-74 y, in the Stanford Heart Disease Prevention Program surveys
1981-1990 This study examined the overall trends in number and density of neighborhood food stores, food consumption behavior, and prevalence of overweight. Individual-level data came from participants in 1 of 4 cross-sectional surveys between 1981 and 1990 in 4 mid-sized cities in California. Food store data came from the California State Board of Equalization and telephone business directories for the same years. Diet was assessed by a limited interviewer-administered 24-h recall. Notably, only overall analyses (the whole region combined), rather than neighborhood-level analyses, were performed.
• From 1981 to 1990, the total number and density of stores per neighborhood selling sweets, pizza, and fast food each increased (P<0.05 for each).
• Overall increases in the number and/or density of stores that sold sweets, doughnut shops, small grocery stores, and convenience stores paralleled overall increases in the percentage of participants reporting consumption of sweets and other preprepared foods.
• Overall increases in fast-food restaurants did not correspond with an increase in the overall percentage of participants reporting consumption of fried foods, which showed decreases of 32% for women and 20% for men.
• The percentage of overweight participants increased 13% in women and 7% in men.
Murakami et al, 2009301
.
Observational, cross-sectional
N=990 female students age 18-22 y studying dietetics at 15 institutions in Japan
2006-2007 Neighborhood food-store availability and individual food intake were evaluated in a group of young Japanese women. The number of all food stores serving different types of foods within a 1-km mesh-block of residence was derived from the census of commerce. Dietary intake was estimated using a validated, self-administered diet-history questionnaire.
After adjustment for household SES, geographic variables, and frequency of eating out: • Neighborhood store availability (density)
for confectioneries and bread was positively associated with intake of confectioneries and bread.
• No significant independent association was seen between neighborhood store availability for the other foods examined, including meat, fish, fruits and vegetables, or rice.
Rundle et al, 2009296
Observational, cross-sectional
N=13,102 adults living in New York City
2000-2002 Geocoding was used to assess the density of healthy food outlets (supermarkets, fruit and vegetable markets, natural food stores) within 0.8 km of home. BMI was measured.
After adjustment for age, sex, race/ethnicity, education, neighborhood sociodemographic characteristics, and population density: • Greater density of healthy food outlets
was associated with lower BMI. • Comparing quintile 5 vs 1 (median
density 11 vs 0 stores/km2), the adjusted BMI difference was 0.8 kg/m2 (P=0.003), the prevalence ratio of overweight was 0.94 (95% CI, 0.88, 1.01), and the prevalence ratio of obesity was 0.87 (0.78, 0.97).

Jilcott et al, 2011297
Observational, cross-sectional
3106 counties in all 50 states
2007-2009 market/store data, 2006-2008 BRFSS data
The USDA ERS Food Environment Atlas was used to map per capita farmers’ markets, grocery stores/supermarkets, and supercenters in each county. County prevalence of adult obesity was also obtained from the Atlas, based on BRFSS. Results were stratified by whether the county was rural (no cities with >50,000 residents) or metropolitan (all others).
After adjustment for county-level race, age, median income, and natural amenities (topography, climate, water access): • Per capita density of grocery
stores/supermarkets was inversely associated with obesity, especially in metro counties in which each 24.3/100,000 greater stores was associated with 0.59% lower obesity (P<0.001).
• Per capita density of supercenters was inversely associated with obesity: per each 1.7/100,000 greater stores, obesity prevalence was 0.08% lower (P=0.004).
• When all 3 types of outlets were considered together, densities of grocery stores/supermarkets and supercenters but not farmers’ markets, were independently associated with lower obesity.
Chen et al, 2010295
Simulation study
N=3550 residents in 5 poor neighborhoods of Marion County, Indiana, from the Marion County Health Department Obesity Needs Assessment Survey
2005
This study simulated the effect on BMI of a policy to increase the number of new chain grocery stores in 5 poor neighborhoods. Data on participants’ weight, shopping and eating habits, use of trails and recreation areas, and geographic identifiers came from the survey, and data on chain grocers came from the Marion County Health Department’s health safety inspection records. The effect on BMI of introducing new chain grocery stores in previously underserved neighborhoods was estimated from a prior non−peer-reviewed analysis by the authors on observed links between grocery stores and BMI.
• The addition of 5 new grocery stores in this county would favorably affect the BMI of ≈302 residents by changing the number of such stores within 1.6 km of residents’ homes.
• Persons living closest to the new stores would be affected most.
• Among these 302 affected residents, the simulated increase in access to grocery stores was predicted to decrease BMI by 0.43 kg/m2 (P<0.05).
Boone-Heinonen et al, 2011289
Observational, longitudinal
N=5115 young US adults, age 18-30, in the CARDIA cohort
1985-1986 to 2000-2001
This prospective study examined the relation of neighborhood fast-food chain, supermarket, and grocery store density (counts per population) with fast-food intake, diet quality, and fruit and vegetable intake, using linked time-varying GIS within 1, 1-3, 3-5, and 5-8 km of home.
After adjustment for individual sociodemographic factors, neighborhood poverty, and sex: • Supermarket and grocery store density
were generally unrelated to diet quality or fruit and vegetable intake.
• See the separate section in this Table (below) for findings related to fast-food

restaurants.
Leung et al, 2011299
Observational, longitudinal
N=353 girls, age 6-7 y, recruited from a health maintenance organization in Northern California
2005-2008 This prospective study examined the relation of neighborhood food stores with 3-y risk of overweight/obesity and change in BMI. Per capita density of food stores was identified from 2006 data from InfoUSA, a commercial database. Stores were classified according to industry codes into 9 separate categories, including convenience stores, drug stores, fast-food outlets, farmers’ markets, full-service restaurants, small grocery stores, specialty stores, specific food store venues, and supermarkets. Neighborhoods were assessed at 0.4- and 1.6-km buffers around homes. BMI was measured.
After adjustment for baseline BMI/weight and family sociodemographics: • Among the 9 types of stores evaluated
within a 0.4-km buffer, availability of convenience stores was associated with higher risk of overweight/obesity (OR=3.38; 95% CI, 1.07, 10.7) and an increase in BMI z score (β=0.13; 95% CI, 0.00, 0.25). No other significant associations were seen.
• Among the 9 types of stores evaluated within a 1.6-km buffer, availability of farmers’ markets was inversely associated with overweight/obesity (OR=0.22; 95% CI, 0.05, 1.06) but not with change in BMI z score (P>0.10). No other significant relations were seen.
Accessibility to Fast-Food and Full-Service Restaurants
Author, y Design Population Duration Intervention/Evaluation Major Findings
Morland et al, 2002284
Observational, cross-sectional
N=2392 black and 8231 white participants, age 49-73 y, in the ARIC cohort
1993-1995, 1999
This study evaluated the relation between local food environment and intakes of selected foods and nutrients. Food environment was characterized by the number of supermarkets, grocery stores, full-service restaurants, and fast-food restaurants located in the residence census tract of participants (Maryland, North Carolina, Mississippi, and Minnesota), based on data from local health departments and state departments of agriculture in 1999. Dietary intakes were estimated by semiquantitative FFQ in 1993-1995. Evaluated dietary metrics included daily consumption of ≥2 servings of fruits, ≥3 servings of vegetables, ≤300 mg of cholesterol, ≤30% energy from total fat, and ≤10% energy from saturated fat.
• Fast-food restaurants were evenly dispersed across neighborhoods.
• No significant associations were seen between the presence of fast-food or full-service restaurants and these dietary metrics in either blacks or whites.
• See the separate section in this Table (above) for findings related to supermarkets and grocery stores.
Burdette et al, 2004303
Observational, cross-sectional
N=7020 low-income preschool children,
2001 This study evaluated the relation between proximity of residence to fast-
• The distance (mean±SD) to the nearest fast-food restaurant was similar in

age 3-6 y, enrolled in the WIC program in Cincinnati, Ohio
food restaurants and prevalence of overweight (BMI ≥95th percentile). Height and weight were measured at the most recent WIC visit. Fast-food restaurant locations were obtained from US Yellow Page listings. ArcView was used to geocode residence and fast-food restaurants.
overweight (1.12±0.64 km) vs nonoverweight (1.10±0.61 km) children (P=0.91).
• 56.0% of overweight children lived in a neighborhood with a fast-food restaurant, whereas 55.5% of nonoverweight children lived in a neighborhood with a fast-food restaurant (P=0.84).
Simmons et al, 2005304
Observational, cross-sectional
N=1454 residents of randomly selected households in Australia
2001-2003 This study examined the relation between availability of take-out and fast-food restaurants and obesity. Restaurants were mapped through direct observation and use of the local telephone directory. The per capita density of local take-out and dine-in fast-food restaurants (number per 1000 population) was calculated using the 2001 census population in each town. BMI was calculated from measured height and weight. The food environment was assessed separately for regional centers, large rural towns, and small rural towns.
• No significant associations were found between the density of take-out and dine-in fast-food restaurants and prevalence of obesity.
Jeffery et al, 2006305
Observational, cross-sectional
N=1033 Minnesota residents from a random digit-dial telephone survey
Not provided This study evaluated the relation between living or working near various types of restaurants and BMI. GIS methodology was used to calculate the total number of restaurants and the number of fast-food restaurants within 0.8, 1.6, and 3.2 km of home and work. BMI was determined by self-reported height and weight.
After adjustment for age and education: • A significant inverse relation was
observed between the number of fast-food, non−fast-food, and total restaurants within 3.2 km of work and BMI in men (fast food: β�=−0.029, P=0.008; non−fast food: β�=−0.022, P=0.01; total: β�=−0.005, P=0.01) but not women.
• No significant relations were seen between the number of restaurants near home and BMI in men or women.
Jago et al, 2007288
Observational, cross-sectional
N=204 Boy Scouts, age 10-14 y, recruited from 36 troops within the greater Houston, Texas area
2003 This study evaluated the relation between distance to food and restaurant outlets and fruit and vegetable consumption. A buffer with a 1.6-km radius was created around each participant’s home, and council public health records were used to calculate distance to the nearest food establishment. An FFQ was used to assess consumption of
After adjustment for BMI, age, parental education, and ethnicity: • Living closer to a fast-food restaurant was
associated with higher consumption of high-fat vegetables (P=0.003) and fruit and juice (P=0.006).
• No significant associations were seen between distance to cafeterias or full-service restaurants and fruit and vegetable consumption.

fruits, juice, and vegetables. Vegetables were evaluated in 2 groups, including “higher-fat” vegetables (potatoes, french fries, and coleslaw) and other (“lower-fat”) vegetables.
• See the separate section in this Table (above) for findings related to supermarkets and convenience stores.
Wang et al, 2007294
Observational, multiple cross-sectional
N=5795 participants, age 25-74 y, in the Stanford Heart Disease Prevention Program surveys
1979-1990 This study assessed the relation between various types of food stores and BMI. Data on distance to and density of chain supermarkets, grocery stores, ethnic markets, convenience stores, and fast-food restaurants were obtained from the California State Board of Equalization and telephone business directories for the relevant years. Data on BMI and other individual factors were obtained from 5 cross‐sectional surveys conducted between 1979 and 1990.
After adjustment for age, gender, ethnicity, SES, smoking, physical activity, and nutrition knowledge: • Proximity to and density of fast-food
restaurants were not significantly associated with BMI.
• See the separate section in this Table (above) for findings related to supermarkets, ethnic markets, grocery stores, and convenience stores.
Lopez, 2007291
Observational, cross-sectional
N=15,358 participants in the Massachusetts BRFSS
1998-2002 This study examined the relation between fast-food density (stores per square kilometer) and presence of a supermarket in the neighborhood and obesity. ZIP code level data were obtained from the 2000 US Census and the 2001 County Business Patterns. BMI was calculated based on self-reported height and weight.
After adjusting for age, sex, race/ethnicity, education, income, smoking status, population density, median income, establishment density, and employment density: • Fast-food density was not associated with
obesity (OR=1.00; 95% CI, 0.92, 1.01). • See the separate section in this Table
(above) for findings related to supermarkets.
Liu et al, 2007293
Observational, cross-sectional
N=7334 children, age 3-18 y, visited for child-wellness care in 7 urban primary care clinics in Marion County, Indiana
2000 This study evaluated the relation between proximity of home to a supermarket, grocery store, convenience store, and fast-food restaurant and prevalence of overweight (BMI >95th percentile). Data on food establishments and categorization were obtained from hygiene grading conducted by the Marion County Health Dept. The 2000 US Census data were used to classify participants’ residences as high population density (≥695 persons/km2), or low population density (<695 persons/km2).
After adjusting for age, race, gender, and median family income of the neighborhood: • No significant associations were seen
between distance to the nearest fast-food restaurant and prevalence of overweight in either high or low population density neighborhoods.
• See the separate section in this Table (above) for findings related to supermarkets, grocery stores, and convenience stores.
Mehta and Chang,
Observational, cross-sectional
N=714,054 US adults in the BRFSS,
2006-2007 This study examined the relation between restaurant environment and
After adjustment for age, age-squared, gender, race/ethnicity, education, smoking status,

2008306 a nationally representative sample of the noninstitutionalized adult population age 18+ y
BMI across counties in the United States. Restaurant environment was measured by per capita fast-food and full-service restaurant density (number per 10,000 individuals) and ratio of fast-food to full-service restaurants. Individual data came from the 2002-2006 BRFSS. Restaurant data came from the 2002 US Economic Census.
household income, and county-level variables (population size, median household income, percentage of adults with a high school diploma): • Higher BMI was seen with higher fast-
food restaurant density (β=0.09; 95% CI, 0.02-0.16; P<0.05) and a higher ratio of fast-food to full-service restaurants (β=0.20; 95% CI, 0.12-0.27; P<0.001).
• Lower BMI was seen with higher density of total restaurants (β=−0.22; 95% CI, −0.30-0.14; P<0.001) and full-service restaurants (β=−0.32; 95% CI, −0.40-0.24; P<0.001).
• Higher risk of being obese was associated with density of fast-food restaurants (OR=1.05; 95% CI, 1.02-1.08) and a higher ratio of fast-food to full-service restaurants (OR=1.08; 95% CI, 1.05-1.1) were associated with.
• Lower risk of being obese was associated with higher density of total restaurants (OR=0.94; 95% CI, 0.91-0.96) and full-service restaurants (OR=0.89; 95% CI, 0.87-0.92).
Spence et al, 2009308
Observational, cross-sectional
N=2900 participants, age 18+ y, in Edmonton, Canada, in the Population Health Survey
2002 This study examined the relation between relative availability of and distance to different types of neighborhood food retail stores and obesity. Data on food outlets came from the Health Inspection division of Capital Health and the Alberta First Business Directory. An RFEI was calculated based on the ratio of the number of fast-food restaurants plus convenience stores divided by the number of grocery stores. Buffers of 800 m and 1600 m were evaluated around participants’ postal codes. BMI was calculated from self-reported height and weight.
After adjustment for age, sex, education, and neighborhood SES index: • RFEI within 800 m of home was
associated with obesity: residents of areas with the lowest RFEI (<3.0) had a lower prevalence of obesity than residents in areas with the highest RFEI (5.0+) (OR=0.75; 95% CI, 0.59, 0.94).
Li et al, 2009309
Observational, cross-sectional
N=1221 adults, age 50-75 y, in a regionally
2006-2007 This study examined the relation between fast-food restaurant density and individual-level behaviors and
After adjustment for age, gender, education, household income, employment status, home ownership, alcohol and tobacco use, fruit and

representative sample of 120 neighborhoods in Portland, Oregon
obesity. BMI, eating-out behavior, eating self-efficacy, fried food consumption, fruit and vegetable intake, physical activity, and sociodemographic characteristics were assessed at in-person interviews. Fast-food restaurant data came from commercial business data at InfoUSA.
vegetable intake, fried food consumption, and neighborhood characteristics (land-use mix, residential density, median household income, percentage of non-Hispanic black residents, percentage of Hispanic residents): • Residents of high-density fast-food
restaurant neighborhoods who also regularly visited fast-food or buffet restaurants (1-2 times per week) were more likely to be obese than those living in low-density fast-food restaurant neighborhoods (OR=1.9; 95% CI, 1.01-3.5, P<0.05).
• Compared with low-density fast-food restaurant neighborhoods, residents of high-density fast-food restaurant neighborhoods were more likely to report low self-efficacy in eating healthy food (OR=1.21; 95% CI, 1.06, 1.39, P<0.005) and to not meet recommended levels of physical activity (OR=1.79; 95% CI, 1.01, 3.19, P<0.05).
Currie et al, 2009307
Observational, cross-sectional
3.06 million 9th grade children in California public schools; and pregnant women in Michigan, New Jersey, and Texas
Children Study: 1999 and 2001-2007 Pregnant Woman Study: 1989-2003
This study evaluated the relation between fast-food restaurants and obesity among 9th grade children and pregnant women. Data on children came from the California public schools; data on schools (percentage black, white, Hispanic, and Asian; percentage immigrant; pupil/teacher ratios; fraction eligible for free lunch, etc) came from the National Center for Education Statistics Common Core of Data. Data on census block of the school (median earnings, percentage with a high-school degree, percentage unemployed, percentage urban) came from the 2000 US Census. Data on pregnant women came from Vital Statistics birth data in 3 states, with restaurant data from the NETS Database. Availability of fast-food or other restaurants was assessed within 0.16, 0.4, and 0.8 km of either the school or the mother’s residence.
After adjusting for school-level variables, census block variables, and year effects: • Among 9th grade children, the presence
of a fast-food restaurant within 0.16 km of a school was associated with a 5.2% higher risk of obesity.
• Among pregnant women, the density of fast-food restaurants within a 0.8-km radius of home was associated with a 2.5% higher probability of gaining >20 kg during pregnancy.

Davis et al, 2009312
Observational, cross-sectional
N=529,367 middle school and high school students in the California Healthy Kids Survey
2002-2005 This study evaluated the relation between proximity of fast-food restaurants to schools and obesity among middle school and high school students in California. Individual-level data came from the survey, school data came from the California Department of Education, and data on fast-food restaurants came from Microsoft Streets and Trips, with restaurant brands classified as “top limited-service restaurants” by Technomic Inc.
After adjustment for student-level characteristics (age, gender, grade, race/ethnicity, physical activity), school-level characteristics (school type, percentage of students eligible for free or reduced-price meals, school enrollment, indicators for school location types), county indicators, and survey wave: • Students with a fast-food restaurant
within 0.8 km of their school were more likely to be overweight (OR=1.06; 95% CI, 1.02, 1.10, P<0.01) and obese (OR=1.07; 95% CI, 1.02, 1.12, P<0.01).
• After further adjustment for the presence of nearby gas stations, motels, and grocery stores, attending a school within 0.8 km of a fast-food restaurant was associated with a 0.13-unit increase in BMI (95% CI, 0.05, 0.20, P<0.01).
Richardson et al, 2011302
Observational, cross-sectional
N=13,150 young US adults, age 18-28 y, in the nationally representative National Longitudinal Study of Adolescent Health
2001-2002 This study evaluated the relation of neighborhood fast-food availability and frequency of self-reported fast-food consumption.
After adjustment for individual and neighborhood characteristics: • No significant association was seen in
rural, low-density urban, or high-density urban areas.
Sturm et al, 2005173
Observational, longitudinal
N=6918 participants, age 7 y, in the ECLS-K in 59 metropolitan areas in 37 states
4 y, 1998-2002 This study evaluated the relation between density of grocery stores, convenience stores, fast-food restaurants, and full-service restaurants in a child’s neighborhood (home and school ZIP codes) and changes in BMI. Individual-level data were obtained from the cohort. Data on per capita numbers of grocery stores, convenience stores, full-service restaurants, fast-food restaurants, ratio of grocery stores to convenience stores, and ratio of full-service restaurants to fast-food restaurants in the residence ZIP code were obtained from the US Census Bureau's 1999 ZIP Code Business Patterns files.
After adjusting for BMI, birth weight, family income, sex, mother's education, and race/ethnicity: • The per capita number of fast-food
restaurants was associated with a nonsignificant trend toward faster BMI gain (P<0.10).
• BMI change over 3 y was not significantly associated with density of full-service restaurants.
• See the separate section in this Table (above) for findings related to grocery stores and convenience stores.

Li et al, 2009310
Observational, longitudinal
N=1145 adults, age 50-75 y, in a regionally representative sample of 120 neighborhoods in Portland, Oregon
2006-2007 to 2007-2008 (1 y)
This prospective study examined the relation of fast-food restaurant density and individual-level behaviors with obesity, including weight and waist circumference. Data on fast-food restaurants came from InfoUSA. Covariates included neighborhood characteristics (residential density, median household income, percentage of non-Hispanic black residents, percentage of Hispanic residents) and individual characteristics (age, gender, education, household income, race/ethnicity, tobacco use, employment status, health status, baseline values of BMI, weight, and waist circumference). Anthropometrics were objectively measured at baseline and follow-up.
After adjustment for neighborhood and individual characteristics: • Residents of high-density fast-food
neighborhoods who made weekly visits to fast-food restaurants experienced more increase in weight (+1.40 kg, P<0.05) and waist circumference (2.06 cm, P<0.05) over time, compared with residents of low-density fast-food neighborhoods or those who did not make weekly visits to fast-food restaurants.
Boone-Heinonen et al, 2011289
Observational, longitudinal
N=5115 young US adults, age 18-30, in the CARDIA cohort
1985-1986 to 2000-2001
This prospective study examined the relation of neighborhood fast-food chain, supermarket, and grocery store density (counts per population) with fast-food intake, diet quality, and fruit and vegetable intake, using linked time-varying GIS within 1, 1-3, 3-5, and 5-8 km of home.
After adjustment for individual sociodemographic factors, neighborhood poverty, and sex: • Fast-food store density was associated
with fast-food consumption among low-income respondents, especially at 1-3 km among men.
• See the separate section in this Table (above) for findings related to supermarkets and grocery stores.
Leung et al, 2011299
Observational, longitudinal
N=353 girls, age 6-7 y, recruited from a health maintenance organization in Northern California
2005-2008 This prospective study examined the relation of neighborhood food stores with 3-y risk of overweight/obesity and change in BMI. Per capita density of food stores was identified from data from 2006 InfoUSA, a commercial database. Stores were classified according to industry codes into 9 separate categories, including convenience stores, drug stores, fast-food outlets, farmers’ markets, full-service restaurants, small grocery stores, specialty stores, specific food store venues, and supermarkets. Neighborhoods were assessed at 0.4- and 1.6-km buffers around homes. BMI was measured.
After adjustment for baseline BMI/weight and family sociodemographics: • Within both a 0.4- and 1.6-km buffer,
neither fast-food outlets nor full-service restaurants were associated with 3-y risk of overweight/obesity or change in BMI z score.
• See the separate sections in this Table for findings related to supermarkets and grocery stores (above) and farmers’ markets (below).
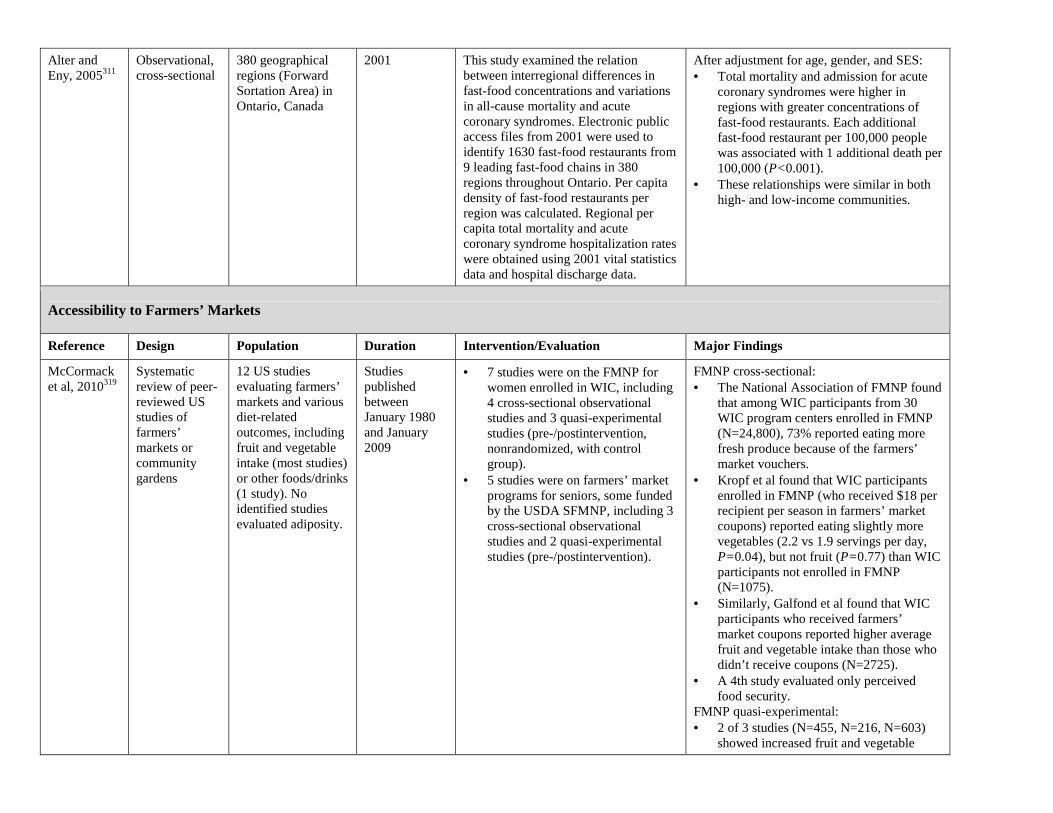
Alter and Eny, 2005311
Observational, cross-sectional
380 geographical regions (Forward Sortation Area) in Ontario, Canada
2001 This study examined the relation between interregional differences in fast-food concentrations and variations in all-cause mortality and acute coronary syndromes. Electronic public access files from 2001 were used to identify 1630 fast-food restaurants from 9 leading fast-food chains in 380 regions throughout Ontario. Per capita density of fast-food restaurants per region was calculated. Regional per capita total mortality and acute coronary syndrome hospitalization rates were obtained using 2001 vital statistics data and hospital discharge data.
After adjustment for age, gender, and SES: • Total mortality and admission for acute
coronary syndromes were higher in regions with greater concentrations of fast-food restaurants. Each additional fast-food restaurant per 100,000 people was associated with 1 additional death per 100,000 (P<0.001).
• These relationships were similar in both high- and low-income communities.
Accessibility to Farmers’ Markets
Reference Design Population Duration Intervention/Evaluation Major Findings
McCormack et al, 2010319
Systematic review of peer-reviewed US studies of farmers’ markets or community gardens
12 US studies evaluating farmers’ markets and various diet-related outcomes, including fruit and vegetable intake (most studies) or other foods/drinks (1 study). No identified studies evaluated adiposity.
Studies published between January 1980 and January 2009
• 7 studies were on the FMNP for women enrolled in WIC, including 4 cross-sectional observational studies and 3 quasi-experimental studies (pre-/postintervention, nonrandomized, with control group).
• 5 studies were on farmers’ market programs for seniors, some funded by the USDA SFMNP, including 3 cross-sectional observational studies and 2 quasi-experimental studies (pre-/postintervention).
FMNP cross-sectional: • The National Association of FMNP found
that among WIC participants from 30 WIC program centers enrolled in FMNP (N=24,800), 73% reported eating more fresh produce because of the farmers’ market vouchers.
• Kropf et al found that WIC participants enrolled in FMNP (who received $18 per recipient per season in farmers’ market coupons) reported eating slightly more vegetables (2.2 vs 1.9 servings per day, P=0.04), but not fruit (P=0.77) than WIC participants not enrolled in FMNP (N=1075).
• Similarly, Galfond et al found that WIC participants who received farmers’ market coupons reported higher average fruit and vegetable intake than those who didn’t receive coupons (N=2725).
• A 4th study evaluated only perceived food security.
FMNP quasi-experimental: • 2 of 3 studies (N=455, N=216, N=603)
showed increased fruit and vegetable

consumption among WIC participants who were given farmers’ market coupons, compared with controls. One successful intervention provided $20 once and the other $10 per week for 6 mo. The intervention showing no effect provided $10 once.
Senior farmers’ market cross-sectional: • 3 small cross-sectional surveys (N=658,
N≈300, N=124) found that program participants reported greater intention to eat more fruits and vegetables or attendance at farmers’ markets because of the program (coupons ranging from $5 to $50 once). No controls.
Senior farmers’ market quasi-experimental: • Both studies evaluated provision of free
market baskets to homes, which does not test neighborhood availability of farmers’ markets.
4 additional studies on community gardens were identified, as summarized in the next section of this Table, below.
Racine et al, 2010320
Observational, cross-sectional
N=179 black women who were pregnant and enrolling in WIC in Washington, DC (N=71), which offers the FMNP, or Charlotte, NC (N=108), which does not
May−June 2007
Women were surveyed about past participation and dietary habits.
Adjusting for city of residence, women who reported prior participation in the FMNP reported higher intake of fruits and vegetables (P<0.01).
Freedman et al, 2011321
Quasi-experimental (pre-/postintervention)
N=221 adults or children participating in a local farmers’ market initiative who completed at least 1 survey
June−August 2008
34 farmers’ markets (average 2 h per week) were held at 4 Boys and Girls Clubs over 1 summer. Educational programs were held at the clubs, youth were directly involved in setting up and running each farmers’ market, and food-related field trips were taken. Vouchers (up to $20) were provided to community members for use at the markets. Effects on attitudes were assessed by surveys.
• Participants reported positive attitudes about the farmers’ markets as both a learning opportunity and exposure to fresh foods for children.
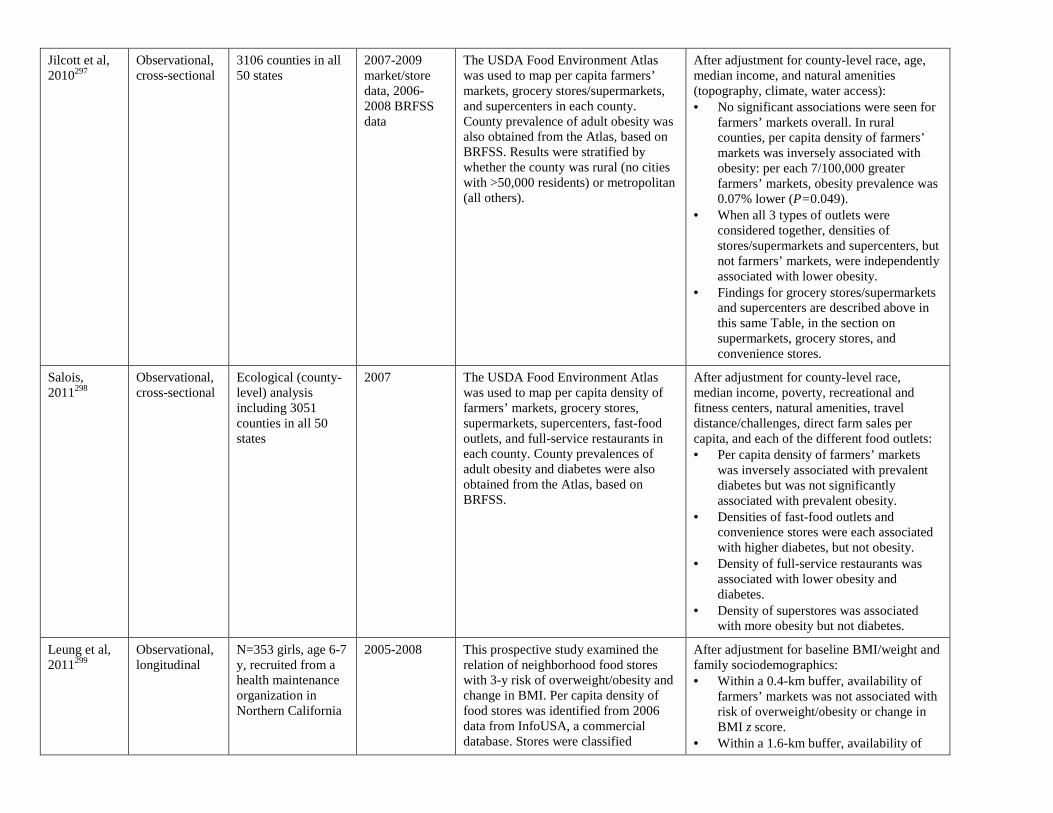
Jilcott et al, 2010297
Observational, cross-sectional
3106 counties in all 50 states
2007-2009 market/store data, 2006-2008 BRFSS data
The USDA Food Environment Atlas was used to map per capita farmers’ markets, grocery stores/supermarkets, and supercenters in each county. County prevalence of adult obesity was also obtained from the Atlas, based on BRFSS. Results were stratified by whether the county was rural (no cities with >50,000 residents) or metropolitan (all others).
After adjustment for county-level race, age, median income, and natural amenities (topography, climate, water access): • No significant associations were seen for
farmers’ markets overall. In rural counties, per capita density of farmers’ markets was inversely associated with obesity: per each 7/100,000 greater farmers’ markets, obesity prevalence was 0.07% lower (P=0.049).
• When all 3 types of outlets were considered together, densities of stores/supermarkets and supercenters, but not farmers’ markets, were independently associated with lower obesity.
• Findings for grocery stores/supermarkets and supercenters are described above in this same Table, in the section on supermarkets, grocery stores, and convenience stores.
Salois, 2011298
Observational, cross-sectional
Ecological (county-level) analysis including 3051 counties in all 50 states
2007 The USDA Food Environment Atlas was used to map per capita density of farmers’ markets, grocery stores, supermarkets, supercenters, fast-food outlets, and full-service restaurants in each county. County prevalences of adult obesity and diabetes were also obtained from the Atlas, based on BRFSS.
After adjustment for county-level race, median income, poverty, recreational and fitness centers, natural amenities, travel distance/challenges, direct farm sales per capita, and each of the different food outlets: • Per capita density of farmers’ markets
was inversely associated with prevalent diabetes but was not significantly associated with prevalent obesity.
• Densities of fast-food outlets and convenience stores were each associated with higher diabetes, but not obesity.
• Density of full-service restaurants was associated with lower obesity and diabetes.
• Density of superstores was associated with more obesity but not diabetes.
Leung et al, 2011299
Observational, longitudinal
N=353 girls, age 6-7 y, recruited from a health maintenance organization in Northern California
2005-2008 This prospective study examined the relation of neighborhood food stores with 3-y risk of overweight/obesity and change in BMI. Per capita density of food stores was identified from 2006 data from InfoUSA, a commercial database. Stores were classified
After adjustment for baseline BMI/weight and family sociodemographics: • Within a 0.4-km buffer, availability of
farmers’ markets was not associated with risk of overweight/obesity or change in BMI z score.
• Within a 1.6-km buffer, availability of

according to industry codes into 9 separate categories, including convenience stores, drug stores, fast-food outlets, farmers’ markets, full-service restaurants, small grocery stores, specialty stores, specific food store venues, and supermarkets. Neighborhoods were assessed at 0.4 and 1.6-km buffers around homes. BMI was measured.
farmers’ markets was inversely associated with overweight/obesity (OR=0.22; 95% CI, 0.05, 1.06) but not with change in BMI z score (P>0.10).
• Convenience stores within 0.4 km were associated with a higher risk of overweight/obesity and increase in BMI z score (see that separate section in this Table above).
• No other significant relations were seen.
Accessibility to Community Gardens
Author, y Design Population Duration Intervention/Evaluation Major Findings
McCormack et al, 2010319
Systematic review of peer-reviewed US studies
4 US studies evaluating community gardens and various diet-related outcomes, including fruit and vegetable intake (most studies) and other foods/drinks (1 study)
Studies published between January 1980 and January 2009
Four observational studies were identified, and 3 of these are described below. The 4th study, by Blair et al, compared 144 gardeners with 67 nongardeners in Pennsylvania.
• Blair et al found that gardeners reported eating more vegetables than nongardeners.
Alaimo et al, 2008322
Observational, cross-sectional
N=766 adult residents of Flint, Michigan, identified by random phone survey
2003 This study examined the relation between household participation in a community garden and fruit and vegetable consumption. Fruit and vegetable intake was measured using the BRFSS questionnaire, and household participation in a community garden was assessed by direct query from the respondent.
After adjustment for demographics, neighborhood participation, and health characteristics: • Adults with a household member who
participated in a community garden ate fruits and vegetables 1.4 more times per day than those who did not participate, and they were 3.5 times more likely to eat fruits and vegetables at least 5 times daily.
Lackey et al, 1998323
Observational, cross-sectional
N=123 gardeners and 123 community controls from a community garden sponsored by the University of Wisconsin Cooperative Extension
1997 This study evaluated a university program that included rental gardens, youth gardens, and gardens designed for food pantry clientele. The evaluation sample included at least 1 typical garden from each category with a minimum of 15 easily accessible clients. Qualitative data were collected (document reviews, participant
• Gardeners reported eating a greater variety of vegetables and more vegetable servings compared with nongardeners.
• Gardeners were also more likely than nongardeners to agree with the statement, “In the past 4 mo, I have eaten a balanced diet most days from the food pyramid (which includes breads/cereals, fruit/vegetables, meat/fish/beans, and

observations at gardens, interviews with program stakeholders). Posttest surveys were administered to 123 gardeners (79% were at least 18 y of age), and 123 matched nongardeners sampled based on individual gardener characteristics, geographic area, and garden type. Participants self-reported vegetable servings eaten in the previous 24 h.
dairy products).”
Johnson and Smith, 2006324
Quasi experimental
N=61 community garden participants in Moses Lake, Washington
2003-2004 This study evaluated a pilot program that aimed to create and support a healthy environment through development of a community garden, as well as walking trails and community breastfeeding facilities. Evaluation surveys were given to community garden participants. Survey details and data collection methods were not described in detail.
• More than half of gardeners reported eating more fruits and vegetables while participating in the garden.
In-Store Availability of Different Foods
Author, y Design Population Duration Intervention/Evaluation Major Findings
Cheadle et al, 1993313
Observational, serial cross-sectional
N≈6000 residents of 11 communities in California and 1 community in Hawaii
2 cross-sectional surveys in 1988 and 1990
In-store surveys were conducted to measure the percentage of shelf space devoted to red meat, low-fat milk products, and dark breads. Dietary intakes were assessed by telephone interview FFQ of ≈500 residents in each community living in the same catchment area as these stores.
In crude (unadjusted) analyses: • Cross-sectionally, positive
correlations were found between individuals’ consumption (days per week) and percentage of shelf space devoted to red meat (r=0.59, P=0.04), reduced-fat milk (r=0.64, P=0.03), and dark bread (r=0.52, P=0.08).
• No significant correlations were found between changes in shelf space and changes in dietary intake over time between 1988 and 1990.
Fisher et al, 1999314
Observational, cross-sectional
N=503 randomly selected stores of 53 ZIP codes and 250 randomly selected residents of 19 of these ZIP codes in 7 New York counties, representing large
1994-1996 This study examined the relation between the proportion of low-fat (skim or 1%) milk in food stores and the presence of low-fat milk at home. Surveys were conducted in randomly selected stores from the same areas as the residents to assess the proportion of all milk on shelves
In crude (unadjusted) analyses: • The proportion of low-fat milk in
stores was directly related to the presence of low-fat milk in households (slope=0.81; 95% CI, 0.58, 1.07).

metropolitan, mid-size urban, and rural areas
that was low-fat. Phone interviews assessed the type of milk present or usually present in the home refrigerator.
Edmonds et al, 2001315
Observational, cross-sectional
N=172 black Boy Scouts, age 11-14 y, in Houston, Texas
Not reported This study evaluated the relation between the boys’ consumption of fruits, vegetables, and juice and local (census tract) availability in grocery stores (absolute amount of shelf space), restaurants (on the menu), and their own homes.
• In analyses adjusting only for census tract black median income, restaurant availability of vegetables and fruit juices was significantly associated with intake of these foods (partial correlations=0.72 and 0.70, respectively, P<0.05 each).
• In both crude (unadjusted) analyses and full multivariable analyses, none of the environmental predictors were significantly associated with intake of any of these foods.
Bodor et al, 2008316
Observational, cross-sectional
N=102 randomly selected households in 4 contiguous census tracts in central New Orleans, Louisiana
2001 This study examined the relation of distance to and linear shelf space in neighborhood supermarkets and fruit and vegetable consumption. Telephone interviews and a modified 24-h recall instrument were used to assess fruit and vegetable consumption.
After adjustment for age, gender, race/ethnicity, income, food assistance participation, car ownership, and distance to the nearest supermarket, associations were only seen for supermarkets very close (within 100 m) to home: • When fresh vegetable shelf space was
>3 m, mean vegetable intake was 4.5±2.4 servings per day, compared with 2.4±1.6 when there was no fresh vegetable shelf space (P<0.05).
• No significant relation was found between shelf space and fruit intake.
Auchincloss et al, 2008317
Observational, cross-sectional
For person-level data, N=2026 adults, age 45-84 y, in the MESA cohort; for area-level data, N=5988 adults living in the same geographic regions in the Community Survey
2004 This study evaluated the relation of neighborhood resources with insulin resistance (homeostasis model assessment index). Data on person-level factors were obtained from clinic examination. Measures of area resources were obtained from a separate, population-based, random-digit−dialing telephone survey. Healthy food resources were derived from self-reported responses to 3 questions (eg, “A large selection of fresh fruits and vegetables is available in my neighborhood”; “A large selection of low-fat foods is
After adjustment for age, sex, family history of diabetes, income, and education: • Greater healthy food resources were
inversely related to insulin resistance, with 15% lower insulin resistance across the interdecile range (90th vs 10th percentile). The association was no longer statistically significant after adjustment for race/ethnicity.
• Findings for neighborhood physical activity resources are described in Supplementary Table 11.
• Greater physical activity resources were inversely related to insulin resistance, with 23% lower insulin

available in my neighborhood”); and physical activity resources from 6 questions (eg, “My neighborhood offers many opportunities to be physically active”; “It is pleasant to walk in my neighborhood”).
resistance across the interdecile range (90th vs 10th percentile). The association remained significant after adjustment for race/ethnicity.
Rose et al, 2009318
Observational, cross-sectional
N=1243 residents of the 28-county area of southeastern Louisiana
2004-2005 This study assessed shelf space for fruits and vegetables and energy-dense snack foods (candies, pastries, cookies, sodas, and salty snacks) in a random sample of 103 urban census tracts in a 28-county area. The neighborhood food environment was evaluated at 500 m, 1 km, and 2 km, from respondents’ homes. Random-digit−dialed phone interviews assessed self-reported height and weight and other sociodemographic variables.
After adjustment for age, gender, race/ethnicity, income, education, and car ownership: • Neighborhood shelf space for fruits
and vegetables was not associated with BMI.
• Neighborhood shelf space for energy-dense snack foods, particularly within 1 km of home, was positively associated with BMI. Each 10-m increase in shelf space was associated with 0.01 higher BMI (P<0.05).
ARIC indicates Atherosclerosis Risk in Communities; FFQ, food-frequency questionnaire; RR, relative risk; CI, confidence interval; PIN, Pregnancy, Infection and Nutrition study; USDA, US Department of Agriculture; RDA, recommended daily allowance; AI, adequate intake; OR, odds ratio; ECLS-K, Early Childhood Longitudinal Study—Kindergarten Class; BMI, body mass index; CVD, cardiovascular disease; SES, socioeconomic status; BRFSS, Behavioral Risk Factor Surveillance System; MESA, Multi-Ethnic Study of Atherosclerosis; AHEI, Alternate Healthy Eating Index; FPM, fats and processed meats; ERS, Economic Research Service; CARDIA, Coronary Artery Risk Development in Young Adults; GIS, geographical information systems; WIC, Women, Infants, and Children Program; SD, standard deviation; RFEI, Retail Food Environment Index; NETS, National Establishment Time-Series; FMNP, Farmers Market Nutrition Program; and SFMNP, Senior Farmers Market Nutrition Program. Note: Reference numbers (eg, Morland et al, 2002278) appearing in this supplementary table correspond with those listed in the reference section of the statement. For the purposes of this supplementary table, these meta-analyses or systematic reviews (see "Author, y" column) are considered the primary citation. Additional studies mentioned in the primary citation may be included in the "Intervention/Exposure" and "Findings" columns. The additional studies can be accessed through the primary citation.