The impact of a quit smoking contest on smoking behaviour in Ontario
51
-
Upload
independent -
Category
Documents
-
view
3 -
download
0
Transcript of The impact of a quit smoking contest on smoking behaviour in Ontario


Table of ContentsChronic Diseases in Canada
a publication of thePublic Health Agency of Canada
David Carle-EllisActing Editor-in-Chief(613) 952-3299
Sylvie StachenkoPrincipal Scientifi c Editor(613) 946-3537
Stephen B HotzAssociate Scientifi c Editor
Robert A SpasoffAssociate Scientifi c Editor
Claire Infante-RivardAssociate Scientifi c Editor
Cathy MarleauGraphic Designer/Desktop Publisher
Francine BoucherGraphic Designer
CDIC Editorial Committee
Jacques BrissonUniversité Laval
Neil E CollishawPhysicians for aSmoke-Free Canada
James A HanleyMcGill University
Clyde HertzmanUniversity of British Columbia
C Ineke NeutelUniversity of OttawaInstitute on Care ofthe Elderly
Kathryn WilkinsHealth Statistics DivisionStatistics Canada
Chronic Diseases in Canada (CDIC) is a quarterly scientifi c journal focussing on current evidence relevant to the control and prevention of chronic (i.e. non-communicable) diseases and injuries in Canada. Since 1980 the journal has published a unique blend of peer-reviewed feature articles by authors from the public and private sectors and which may include research from such fi elds as epidemiology, public/community health, biostatistics, the behavioural sciences, and health services or economics. Only feature articles are peer reviewed. Authors retain responsibility for the content of their articles; the opinions expressed are not necessarily those of the CDIC editorial committee nor of the Public Health Agency of Canada.
Subscription is free upon request.
When notifying us of a change of address,please enclose your address label
Chronic Diseases in CanadaPublic Health Agency of Canada
130 Colonnade RoadAddress Locator 6501G
Ottawa, Ontario K1A 0K9
Fax: (613) 941-3605E-mail: [email protected]
Published by authority of the Minister of Health© Minister of Public Works and Government Services Canada 2006ISSN 0228-8699
Aussi disponible en français sous le titre Maladies chroniques au Canada
Population-based cohort development in Alberta, Canada: A feasibility study
Heather Bryant, Paula J Robson, Ruth Ullman, Christine Friedenreich and Ursula Dawe
51
60
68
77
85
92
94
98
Patients’ opinions on privacy, consent and the disclosure of health information for medical research
Stacey A Page and Ian Mitchell
Statistical disease cluster surveillance of medically treated self-inflicted injuries in Alberta, Canada
Rhonda J Rosychuk, Cynthia Yau, Ian Colman, Don Schopflocher and Brian H Rowe
The impact of a quit smoking contest on smoking behaviour in Ontario
Fredrick D Ashbury, Cathy Cameron, Christine Finlan, Robin Holmes, Ethylene Villareal, Yves Décoste, Tanya Kulnies, Claudia Swoboda-Geen and Boris Kral
Trends in mortality from ischemic heart disease in Canada, 1986-2000
Jinfu Hu, Chris Waters, Ann-Marie Ugnat, Jonathan Horne, Ian Szuto, Marie Desmeules and Howard Morrison
LettersSeasonality of SIDS in Canada
An invitation to develop Ontario’s cancer research platform: Report of the Ontario Cancer Cohort Workshop
Fredrick D Ashbury, Victoria A Kirsh, Nancy Kreiger, Scott T Leatherdale and John R McLaughlin
Calendar of Events
Information for Authors (on inside back cover)
Farewell to Dr. Steve Hotz
On behalf of all those associated with Chronic Diseases in Canada over the past several years, we would like to express our appreciation for the signifi cant contribution of Dr. Steve Hotz to the journal. Dr. Hotz has been one of our associate scientifi c editors, providing expertise on manuscripts that have a behavioural sciences thrust. Dr. Hotz has decided to step down from his associate scientifi c editor post to devote more time to his research, teaching activities and professional practice. We are very grateful to have benefi ted from our colleague’s integrity, exacting standards and extensive knowledge. We are sorry to see him leave.
The Editors
Indexed in Index Medicus/MEDLINE, PAIS (Public Affairs Information Service) and Scopus.
This publication is also available online atwww.phac-aspc.gc.ca/publicat/
cdic-mcc/index.html
Workshop Report

Vol 27, No 2, 2006Chronic Diseases in Canada 51
Author References
Heather Bryant, Paula J Robson, Ruth Ullman, Christine Friedenreich and Ursula Dawe, Division of Population Health and Information, Alberta Cancer Board, Tom Baker Cancer Centre, Calgary, Alberta, Canada Correspondence: Heather Bryant, Alberta Cancer Board, Division of Population Health and Information, Tom Baker Cancer Centre, 1331 – 29th Street NW, Calgary, Alberta, Canada T2N 4N2; fax: (403) 270-3898; e-mail: [email protected]
Abstract
In a climate of increasing privacy concerns, the feasibility of establishing new cohorts to examine chronic disease etiology has been debated. Our primary aim was to ascer-tain the feasibility of enrolling a geographically dispersed, population-based cohort in Alberta. We also examined whether enrolees would grant access to provincial health care utilization data and consider providing blood for future analysis. Using random digit dialling, 22,652 men and women aged 35 to 69 years, without diagnosed cancer, were recruited. Of these, 52.4 percent (N=11,865) enrolled; 84 percent of Alberta communi-ties were represented. Approximately 97 percent of enrolees consented to linkage with health care data, and 91 percent indicated willingness to consider future blood sampling. Comparisons between the cohort and the Canadian Community Health Survey (Cycle 1.1) for Alberta demonstrated similarities in marital status and income. However, the cohort had a smaller proportion who had not fi nished high school, a greater proportion of non-smokers and a higher prevalence of obesity. These fi ndings indicate that establishment of a geographically dispersed cohort is feasible in the Canadian context, and that data linkage and biomarker studies may be viable.
Population-based cohort development in Alberta, Canada: A feasibility studyHeather Bryant, Paula J Robson, Ruth Ullman, Christine Friedenreich and Ursula Dawe
While the value of such cohorts is acknowl-edged, their drawbacks are equally well known. Ongoing cost, of course, is one issue that would have to be addressed in the consideration of developing a full-scale national cohort. In addition, although the cohort design minimizes recall bias, other biases are now known to exist: dietary assessment is hampered to some degree by mis-reporting,1 and there is controversy concerning the impacts of socially desir-able responding on the validity of data obtained from self-administered ques-tionnaires.2-5 Similarly, loss to follow-up over time may also contribute to bias.6 Moreover, quantifying the precise impact of such biases in cohort studies remains challenging. Furthermore, because cohort studies need a large sample size and exten-sive exposure data collection to have suf-fi cient study power, their construction and maintenance is expensive. For etiological hypotheses, investigators must wait for a suffi cient number of cases to be identifi ed
before analysis is worthwhile, delaying results and adding to the expense. This time delay of results makes cohort con-struction an unattractive research endeav-our for investigators who live under the Apublish or perish@ paradigm.
In 1999, the population health research group at the Alberta Cancer Board (ACB) began to explore the feasibility of the con-struction of such a cohort in Canada. There were two underlying themes in the devel-opment of the cohort concept: the creation of a research legacy, identifi ed by our team as a population health laboratory, and the maximization of both short-term and long-term potential benefi ts.
The research legacy term refers to the concept of developing a rich data resource that could be used by current research-ers, but which would be of even more value to researchers who may enter the fi eld in several years, when the cohort is Amaturing@ and disease outcomes become frequent. This resource would be more valuable with increased depth and volume of behavioural, biochemical, socio-demo-graphic and environmental data available on each participant. Thus, collection of exposure information with detailed, vali-dated tools, re-collection of data at reason-able time intervals, individual biological specimens and the potential to link data with complete health care utilization fi les were seen to be key components of such a population laboratory. While it was envi-sioned that the primary focus would be research into cancer etiology, many of the risk factors examined are also potentially important in the etiology of other chronic diseases, thereby ensuring that the cohort would also be valuable for research in other areas.
Introduction
Prospective cohort studies are potentially powerful tools to examine chronic disease etiology. Because they collect exposure information prior to disease diagnosis, they are free from the potential differen-tial biases that may occur recalling this information when cases are compared with controls. Further, because the expo-sure information is collected relatively contemporaneously, rather than having subjects recall distant past exposures, there is potential for increased accuracy of reporting. The high value of these research resources has resulted in the construction of a number of cohorts internationally. It has also resulted in national discussion of the potential for development of a large Canadian cohort for the study of chronic disease.
Key words: Alberta, cohort studies, feasibility studies, questionnaires
Chronic Diseases in CanadaVol 27, No 2, 2006 52
The long-term benefi t of the cohort would be linked most closely to the complete and accurate collection of the information noted above. However, we discussed sev-eral ways in which shorter term outcomes could also be of value. Clearly, a cohort that was representative of the general pop-ulation, rather than one composed of pop-ulation sub-groups defi ned by occupation or educational status, or people recruited as volunteers, could provide more insight into general trends in cancer-related pre-vention and screening behaviours. While we were interested in examining the degree to which a population-based cohort could be constructed, we projected that, even if the cohort was somewhat unrep-resentative with respect to demographic or behavioural characteristics, within-cohort comparisons of predictors of behaviours or behaviour change could still produce valuable insights into cancer control. In addition, such a cohort could provide an opportunity for the evaluation of Anatural policy experiments@ that might occur over its longitudinal course. If, for example, smoke-free public spaces were mandated in some communities and not others over the course of the study, a baseline group would already be in place with recorded smoking behaviours and other character-istics prior to the policy change. By using the rich data available to distinguish the characteristics of smokers who changed their behaviours from those who did not, we could provide excellent analysis of the predictors for success of such policies.
In this paper, we address three questions that relate to the legacy potential and the proba-bility of collecting reasonably geographically representative data from Aaverage@ individu-als. These questions are,
1. Could we enrol a cohort of randomly selected individuals across a dispersed geographic population which could adequately represent the distribution of demographics and health behaviours within a province?
2. What proportion of these individuals, in a world of increasing privacy concerns, would be prepared to give access to health care utilization fi les for further research?
3. What proportion of these individuals would be willing to consider providing a blood sample for storage and future analysis?
This paper reports on the fi ndings related to these questions.
Methods
The target population for the feasibility study was men and women aged 35 to 69 years. Other enrolment criteria were as follows: 1) no known history of cancer other than non-melanoma skin cancer; 2) plans to reside in Alberta for at least one year; and 3) English speaking, to allow for collection of self-report data. Approvals to conduct the feasibility studies were obtained from the ACB and University of Calgary ethics review boards.
Subject selection and enrolment
A two-stage sampling design was used to identify eligible individuals. The fi rst stage used a random digit dial (RDD) procedure.7 Since 97 percent of Alberta households in the year 2000 had at least one telephone line,8 a telephone-based sampling method ensured that almost all households were included in the theoretical sampling frame. The fi rst stage of sampling selected house-holds in the 17 regional health authorities (RHAs) extant in Alberta in 2000, and the second stage selected one eligible adult within each household. A household was defi ned as one or more persons, related or otherwise, who occupy the same private or collective dwelling.9 The sampling and RDD were done by an experienced social research laboratory at the University of Alberta.10
The recruitment for the feasibility compo-nent was done in four waves, in order to evaluate and, if necessary, change proce-dures as a result of early experience in the
study. These four stages are referred to as RDD1 through RDD4, respectively.
First-stage random selection
Standardized procedures were used to ensure methodological and ethical integ-rity of the RDD approach.7 An electronic database of randomly generated telephone numbers, mapped to RHAs, was used for calling purposes. Trained interviewers, working with a computer assisted tel-ephone interviewing (CATI) system and standard script, called selected house-holds to screen for eligible individuals who would be willing to consider enrol-ment into the Alberta Cohort Study (The Tomorrow Project7).
In order to maximize the likelihood of contacting residents in the selected house-holds, calls for RDD1 were made up to 20 times over a variety of times and days of the week before abandoning the number. Because of diminishing returns with sub-sequent calls, this total was reduced to 15 in RDD2 and to 12 calls in each of RDDs 3 and 4. Disproportionate sampling was done to ensure a suffi cient number of par-ticipants from rural and remote regions.
Second-stage random selection
The fi rst adult householder answering the telephone was given a description of the study purpose, eligibility criteria, condi-tions for participation (i.e., voluntary; long term with periodic follow-ups and repeat-ed data requests), and examples of infor-mation asked on baseline questionnaires. In households with more than one poten-tial study participant, the person with the most recent birthday was selected for pos-sible enrolment, to reduce selection bias towards groups more likely to be available to answer the telephone.7
As part of our feasibility exploration, a second household member of the opposite sex was selected for possible enrolment when the fi rst respondent was eligible and interested in considering cohort enrol-ment. This approach was attempted in 2527 households (RDD1) to assess the

Vol 27, No 2, 2006Chronic Diseases in Canada 53
impact on rate of accrual.
At the conclusion of the RDD process, all telephone numbers/households were assigned one of the following codes: Arecruited@ (target respondent was eligi-ble and interested in considering study enrolment); Aineligible@; Aundetermined eligibility@ (efforts at contacting the target householder were unsuccessful and/or a screening interview was not completed); or Arefused@.
Subject enrolment and retention
A self-administered baseline health and lifestyle questionnaire (HLQ) and a detailed consent form were sent by regular mail to individuals interested in study enrolment. Participants were classifi ed as enrolled if they completed and returned the HLQ and the consent form. Approximately three months after enrolment into the study, two additional questionnaires concerning habitual diet and past year physical activ-ity were mailed to participants.
As part of their written consent, partici-pants were asked for permission for data linkage with the Alberta Cancer Registry. They were also asked to voluntarily pro-vide their Alberta Personal Health Number (PHN) and signed authorization allowing the Alberta Cohort Study to request health services utilization data held by Alberta Health and Wellness. Specifi cally, subjects were informed that the study would seek data from Alberta Health concerning types of health care services accessed (defi ned by Abilling codes@), frequency of use of such services and whether services were provided in doctors= offi ces or hospitals. Subjects were invited to consent to periodic linkages for the duration of their participa-tion in the study. Individuals were allowed to participate in the overall study even if they denied access to Alberta Health or to Alberta Cancer Registry data.
Participants were also asked if they would be willing to consider providing a blood sample for study purposes, should they be asked for one in the future. They were also informed that, if such a request were made, a full explanation of the blood collection=s purpose would be provided and that fur-
ther written consent would be required before any sample could be collected.
The fi nal page of the consent form provid-ed subjects with the study=s contact details, and encouraged subjects to use any of sev-eral contact methods if they moved away from the address from which they were originally recruited. Specifi cally, we pro-vided a Achange of address@ form on the study Web site (www.thetomorrowproject.org), as well as toll-free and collect-call telephone numbers, in order to ensure that subjects who moved out of province or out of Canada had access to a variety of free and convenient methods of keeping in contact. In addition, subjects were asked to provide their cellular telephone number and e-mail address (if applicable), as well as contact details for two people outside their household. These contacts would be used in the event that the subject could not be contacted using any other means. Furthermore, regular contact continues to
be maintained with subjects by means of a biannual newsletter, which also serves to provide feedback on study progress and news.
Baseline data collection
Baseline information about lifestyle-relat-ed risk factors and exposures was collected using three self-administered, mailed ques-tionnaires. The instruments were selected on the basis of 1) relevance to factors with potential high attributable risk for cancer and other chronic diseases; 2) the suit-ability/adaptability of the measure for self-administered surveys; and one of the following: 1) previous use in established epidemiologic studies; and/or 2) pub-lished data describing the measure=s psychometric properties.
Health and Lifestyle Questionnaire (HLQ)
The HLQ is a composite of existing items used in other large studies relating to
TABLE 1Number of people recruited and enrolled into the Alberta Cohort Study,
described by the regional health authority (RHA) of residence at time of recruitment
Alberta RHAa
Number of people recruitedb
Number of participants enrolledcResponsed
%Male Female Total
1 Chinook 1,628 360 554 914 56.1
2 Palliser 1,491 376 471 847 56.8
3 Headwaters 1,279 277 411 688 53.8
4 Calgary 3,729 822 1,193 2,015 54.0
5 RHA 5 1,111 252 346 598 53.8
6 David Thompson 1,255 317 419 736 58.6
7 East Central 1,369 302 403 705 51.5
8 Westview 1,559 316 489 805 51.6
9 Crossroads 732 157 217 374 51.1
10 Capital 4,036 807 1,138 1,945 48.2
11 Aspen 1,089 237 332 569 52.2
12 Lakeland 1,434 291 419 710 49.5
13 Mistahia 1,029 218 338 556 54.0
14–17 Northern Regions 911 175 226 401 44.0
Total 22,652 4,907 6,956 11,863e 52.4a RHAs extant in Alberta in 2000.
b Defi ned as eligible and interested in receiving enrolment package (consent form and Health & Lifestyle Questionnaire).
c Defi ned as completed and returned Health & Lifestyle Questionnaire.
d Calculated as number enrolled/number recruited (%).e Excludes two transgender individuals.

Chronic Diseases in CanadaVol 27, No 2, 2006 54
personal health and reproductive his-tory, family history, psychosocial factors, anthropometric measures, use of cancer screening services, smoking behaviour, sun exposure and socio-demographic char-acteristics. Some items were developed for the Alberta Cohort Study if other sources were not available.
Items concerning personal health history, male and female reproductive information, and family history of chronic illness and longevity were adapted from questions used in the Prostate, Lung, Colorectal and Ovarian (PLCO) Screening Trial,11 the Women=s Health Initiative (WHI) Study12 and the 2000/01 Canadian Community Health Survey (CCHS; cycle 1.1).13
Items concerning Pap tests, mammo-grams, clinical breast examination, breast self-examination and PSA tests originated with the CCHS.13 Items about colorectal screening with digital rectal examination, sigmoidoscopy/colonoscopy and stool collection for occult blood testing were adapted from the CCHS and the California Health Interview Survey 2001.14
Questions about tobacco exposure were based on a recommended set of measures for monitoring tobacco use in Canada as developed through the Canadian Workshop on Data for Monitoring Tobacco Use.15 Sun exposure was measured using selected items recommended by the Canadian National Workshop on Measurement of Sun-Related Behaviours for monitoring sun exposure and protective behaviours.16
Social support was measured using ques-tions from the Medical Outcomes Study (MOS)17 questionnaire. Items proposed for the CCHS 2000/2001 were used for meas-uring stress. Spirituality was measured with three items taken from the CCHS and one created for the baseline survey.
Subjects were also provided with detailed instructions and a 183 cm (72 inch) tape measure for obtaining accurate height, buttock and waist measures using a self-administered method that had been tested for reliability and validity.18 Instructions were also given for recording body weight
using a scale accessible to the respondent. The HLQ comprised 32 pages and took an estimated 40 minutes to complete.
Diet History Questionnaire (DHQ)
The DHQ is a cognitive-based food fre-quency questionnaire (FFQ) developed by the US National Cancer Institute (NCI) as a tool for assessing diet over the pre-ceding 12-month interval.19 There is evi-dence that the DHQ was comparable to, or superior to other FFQs that have been used in other large cohort studies.20,21 The instrument, which takes about 60 minutes to complete, has questions about 124 food items and dietary supplements, with addi-tional embedded questions within 44 of these items. In collaboration with the NCI,
changes were made to the questionnaire and nutrient database to account for differ-ences between the US and Canada in food availability, brand names, nutrient compo-sition and fortifi cation practices.22
Past Year Total Physical Activity Questionnaire (PYTPAQ)
The PYTPAQ was based on a question-naire developed to measure lifetime total physical activity (LTPAQ). The LTPAQ is an interviewer-administered questionnaire that provides a reliable lifetime measure of occupational, household and recreational activities from childhood to present.23 Frequency, duration and intensity of all types of activity (i.e., occupational, house-hold, recreational) are recorded to yield
FIGURE 1Numbers of participants enrolled in the Alberta Cohort Study from the
17 regional health authorities (RHAs) extant in the Province of Alberta in 2000
17. Northwestern
14. Peace
13. Mistahia
11. Aspen
8. Westview
6. David Thompson
7. East Central
5. RHA #5
3. Headwaters 2. Pallister
1. Chinook
4. CalgaryHealthRegion
8. Crossroads
10. Capital
12. Lakeland
15. Keeweetinok
16. NorthernLights401
569
805
374
705
598
847
914
688
710
1945
736
2015
556

Vol 27, No 2, 2006Chronic Diseases in Canada 55
measures of expended energy within each type of activity area and an overall meas-ure of the energy cost of physical activity. To produce the PYTPAQ, the LTPAQ was adapted for self-administration and the ref-erence period was changed from lifetime to the 12-month period preceding ques-tionnaire completion. A separate study to evaluate the reliability and validity of the PYTPAQ was also conducted.24
All questionnaires are available on request.
Data handling and analysis
TeleForm7 software (TeleForm V8.1; Verity, Sunnyvale CA USA) was used for automated optical scanning and data cap-ture of HLQ and DHQ data, while PYTPAQ data were entered using Blaise7 software (Westat, Rockville, MD USA). Routine quality checks were performed before and after data entry, and telephone follow-up was used to clarify ambiguous data. HLQ, DHQ and PYTPAQ data were linked by sub-ject identifi cation number, and no subject identifi ers were stored with questionnaire data. To ensure security, all electronic data were stored on servers with limited access, and all fi les were password protected and backed up on a daily basis.
Data cleaning and analyses were done using the SAS7 statistical software program (SAS V9 2003; SAS Institute Inc, Cary NC USA).
ResultsRecruitment and enrolment
The four waves of telephone calling were carried out between October 2000 and June 2002, resulting in 77,327 randomly selected households being contacted. A screening interview to identify eligible res-idents was not completed in 38.9 percent of households; in most of these cases, the person answering the telephone could not be engaged in the interview. A screening interview was completed in 61.1 percent of selected households, and an eligible individual was recruited for possible study enrolment (i.e. willing to consider study participation) in 47.9 percent of these households. The remainder were ineligi-ble and thus excluded for reasons of age outside the target range (89.4 percent); history of cancer (7.2 percent); expecting to move away from Alberta within the fol-lowing year (2.9 percent); and, unable to understand and complete the study mate-rial in English (0.5 percent).
In 2,527 households in RDD1, we attempt-ed to select a second participant of the opposite sex in households where a fi rst person was successfully recruited. As a result, 711 subjects were recruited as Asecond in household@. Of these, 384 (54 percent) enrolled in the cohort; this dou-ble recruitment strategy required, on aver-age, two additional telephone calls to the household. The combined response from eligible fi rst and second contacts was 56.7 percent compared to a response of 47 per-cent in households where only one person was recruited.
Of the 22,652 eligible individuals who were recruited, 52.4 percent (N=11,865) enrolled in the cohort between February 25, 2001 and June 30, 2003. It is estimated that the enrolled sample represents about 32 percent of all potential participants; exact percentages cannot be given as we do not know the eligibility of those who did not complete the screening interview.
The enrolled sample of 11,865 represents about one per cent of the Alberta popula-tion aged 35 to 69 (based on the popula-tion estimate for 2002) and 84 percent of Alberta communities and municipalities are represented. Figure 1 shows regional study enrolment; enrolment outside the major metropolitan areas ranged from 44 percent to 58.6 percent and in the urban areas it was similar at 48.2 percent and 54.0 percent in the Edmonton and Calgary regions, respectively (Table 1). Non-urban participants were selectively overrepre-sented as planned.
Of those enrolled, approximately 88 percent returned completed DHQs and PYTPAQs.
Baseline characteristics of cohort participants
The cohort was made up of 4,907 men (41.4 percent), 6,956 women (58.6 per-cent) and two transgender individuals.
In order to examine whether or not the cohort was similar to the Alberta popula-tion, a comparison was made between the
TABLE 2Comparison of participant baseline characteristics reported in the
Alberta Cohort Study and the Canadian CommunityHealth Survey (CCHS; Cycle 1.1) for the Province of Alberta
AlbertaCohort Study a
Raw data
Alberta Cohort Study-
Weighted b
Canadian Community
Health Survey (1.1) c
N % % %
Marital status Living with a partner 9,059 78.9 76.8 76.4
Household income before tax
<$50K per year 4,330 38.7 35.0 38.2
$50K–79.9K per year 3,383 30.2 29.8 30.8
≥$80K per year 3,480 31.1 35.2 31.0
Education Less than high school 1,435 12.5 10.5 19.3
Completed high school
4,808 41.9 39.2 27.1
Completed post-sec-ondary education
5,229 45.6 50.3 53.6
a Includes only the fi rst person recruited in each household and excludes transgender individuals.
b Refl ects percentage of responses in each category following weighting by regional health authority of residence, age and sex.
c Data for CCHS subjects aged 35–69 years, living in the province of Alberta.

Chronic Diseases in CanadaVol 27, No 2, 2006 56
Alberta cohort respondents and Alberta respondents from the CCHS (cycle 1.1)25 carried out between September 2000 and November 2001. The latter survey has a response rate of about 85.1 percent in Alberta,26 and is commonly used to refl ect population-based estimates of health and behaviours.
Following exclusion of the transgender subjects and those recruited as Asecond in household@, the cohort data were weighted to the CCHS population frequency esti-mate, stratifi ed by sex, age and RHA of residence at the time of recruitment. As shown in Table 2, the cohort sample was comparable to the CCHS sample in terms of marital status and annual household income below and above $50,000; the median family income in Alberta in 2001 was $60,100.27 The proportion of the sam-ples with post-secondary education was similar, but there were fewer individuals in the cohort with less than high school education.
Prior to comparing health behaviours, the cohort sample was further weighted by educational and income levels (Table 3). Even following this adjustment, the cohort group had more non-smokers than the CCHS group and a higher prevalence of obesity (body mass index ≥ 30). In both groups, the majority of women had had at least one Pap smear. For women over 50, a
greater proportion from the cohort reported having had at least one mammogram (94.4 percent versus 85.6 percent). Similarly, for men over 50, prostate specifi c antigen his-tory was higher in the cohort group (54.0 percent versus 43.3 percent).
These comparative analyses were based on Statistics Canada=s Canadian Community Health Survey, Cycle 1.1, Public Use Microdata File, which contains anonymized data collected in the year 2000/2001. All computations on these microdata were car-ried out by staff employed by the Division of Population Health and Information at the Alberta Cancer Board, and the respon-sibility for the use and interpretation of these data is entirely that of the authors.
Consent for health fi le linkage
As part of their written consent, par-ticipants agreed to periodic data linkages with the Alberta Cancer Registry to iden-tify incident cases of cancer. The consent also specifi cally asked participants for authorization to allow the Alberta Cohort Study to request health services utilization data held by the provincial health minis-try (Alberta Health and Wellness); if they agreed, they were asked to provide their PHN. The majority of men (95.8 percent) and women (98.1 percent) consented to this aspect of the study and provided their PHN (Table 4).
Willingness to participate in blood collection studies
A separate form included in the enrolment package asked participants to indicate their willingness to be contacted in the future to consider providing a blood sam-ple for study purposes. Approximately 91 percent of men and women gave a positive response to this proposal (Table 4).
Discussion
One of our primary questions was whether Canadian individuals not affi liated with any particular profession, association or known registries would agree to be part of a long-term prospective study. While cohort studies of this type have been ini-tiated in Europe, there was considerable question as to whether North Americans, in an environment of increasing concern over privacy in the 21st century, would be willing to participate. Our results have shown that enrolment of such a cohort is indeed possible, and that the response rate obtained (32 percent), although lower than would be desirable for simple cross-sectional studies, is comparable to cohort studies elsewhere in the world, recruited in earlier time periods. For example, a Swedish population-based cohort reported 40 percent participation,28 the Utrecht EPIC study reported a 34.5 percent partici-pation rate,29 and the German EPIC study reported enrolment of 22.7 percent in Potsdam and 38.3 percent in Heidelberg.30 Among single-sex cohorts, a national sam-ple of Dutch women had a response rate of 35.5 percent,31 the Iowa Women=s Health Study reported 42 percent enrolment,32 57.1 percent participation was reported in a women=s cohort in Norway33 and 51.3 percent was reported in Sweden.33
Since the main rationale for most cohort studies is the investigation of etiologic hypotheses, such response rates are not of concern for internal validity.34 In fact, even when restricted populations, such as the cohort of women in the Nurses= Health Study, are used as the enrolment sampling frame, about 51 percent of the letters sent resulted in enrolment.35 This has not pre-cluded using these data for the investiga-tion of etiologic hypotheses.
TABLE 3Health related behaviours reported by participants in the
Alberta Cohort Study and the Canadian CommunityHealth Survey (CCHS; Cycle 1.1) for the Province of Alberta
AlbertaCohort Studya
Raw data
Alberta Cohort Study-
Weighted b
Canadian Community
Health Survey (1.1) c
N % % %
Smoking status Non-smoker 8,337 78.2 79.2 71.2
Mammogram ever
Females ≥50yr
2,518 94.2 94.4 85.6
Pap test ever All females 6,247 99.1 99.0 94.6
PSA test ever Males ≥50yr 830 50.3 54.0 43.3
Obesity (BMI ≥ 30) Males 1,148 28.3 25.5 19.4
Females 1,447 24.8 23.5 17.4
a Includes only the fi rst person recruited in each household and excludes transgender individuals.
b Refl ects percentage of responses in each category following weighting by regional health authority of residence, age and sex, and further weighted by household income and educational attainment.
c Data for CCHS subjects living in the Province of Alberta.

Vol 27, No 2, 2006Chronic Diseases in Canada 57
The lower response rates for cohort stud-ies, as opposed to case-control or cross-sectional studies, are hardly surprising given the far higher degree of commitment asked of cohort participants. In our study, we asked participants to be willing to be followed until the age of 85 or until death, and similar commitments are expected in other prospective studies. In fact, we believe that the intensity of the question-naire process used in this fi rst enrolment phase of the study was a useful study component, not unlike the Arun-in@ period used in long-term randomized controlled trial designs.36,37 Other cohort investigators have also noted this potential advantage,30 since those who do enrol are more likely to continue the follow-up over a number of years. Indeed, this possibility has now been corroborated by the results of our fi rst follow-up survey, in which approximately 92 percent of those fully enrolled did com-plete and return the questionnaire. Such a response bodes well for future follow-up.
However, thought has to be given to what degree the cohort data can be used to deter-mine answers to population-based ques-tions. Our data indicate that some caution would need to be used in attempting to use cohort data to refl ect prevalence of health behaviours. There is a slight tendency towards Ahealthy enrolee@ effects in a long-
term study group, and our group had higher non-smoker rates and slightly higher Aever use@ of screening tests. However, the fact that the cohort group had a higher prevalence of obesity than the CCHS group indicates the presence of more than a simple bias. It is possible that some, although not all, of the difference between the two groups refl ects the later secular time period for collecting the cohort data; smoking rates have been decreasing in Alberta, while use of screening tests and obesity rates have been increasing. It is interesting to note that the differences between the two groups in health practices refl ect the same differences in secular trend.
In fact, some would argue that the use of such population-based information can be extrapolated further, to the calculation of population attributable risk and preventa-ble proportions, provided known exposure rates in the general population are applied to the cohort data in question.28,30 It should be noted that even obtaining such point estimates in current cross-sectional studies is becoming more diffi cult; the participa-tion rates for such cross-sectional studies as the Behavioural Risk Factor Surveillance Study, used to gauge health behaviours in the USA, has participation rates of 42.4 percent overall and as low as 24.0 percent in some states.38 Thus, any surveillance of population-based risk factors is likely to be
subject to increased selection pressure in future.
One of the intended applications of this cohort is the ability to observe the out-come of Anatural experiments@. By this we mean that we will have the ability to observe how local changes in policy or environmental conditions affect cohort participants in the affected environment as compared to the Acontrols@ in the stable environments. This particular application of population data will not be affected by the population selection pressure since one will be able to either select matched con-trols or control for potential effect modi-fi ers within the entire design; the same arguments about internal validity apply as when one is using the cohort data to examine etiologic hypotheses. In addition, the fact that we were able to successfully enrol over the entire geographic area of the province, with similar uptake rates around the province, predicts that we will be able to apply the cohort results to monitor such effects in future.
Other recruitment strategies, such as col-laborating with Statistics Canada=s CCHS or using health care insurance fi les, were explored but found to be not feasible. The CCHS-affi liated method would have introduced a selection bias, as consent for cohort enrolment could only be asked for at the conclusion of CCHS interviews, and then only when the interview was concluded face to face. Because Statistics Canada indicated that many interviews were concluded on the telephone, it was decided to try a method where at least the fi rst approach to the individual was car-ried out via random selection. Timeliness issues argued against attempting to use health care insurance fi les. Thus, random digit dialing (RDD) became our primary recruitment method. Because RDD does not depend on telephone directory listings, all households with telephone lines had an equal chance of being called. Since 97 percent of households had at least one tel-ephone line at the time, using a telephone-based, RDD sampling method meant that almost all households were included in the theoretical sampling frame. However, we are now starting to become concerned that the RDD telephone-based recruitment
TABLE 4Alberta Cohort Study: Consent rates for linkage with
provincial health care utilization data, and for future blood studies
Total Na
Provided personal health number and
consent for data linkage% yesb
Willing to be contacted about providing future
blood sample% yesb
Males 35–44 yr 1,806 94.1 89.6
45–54 yr 1,720 96.5 91.6
55–64 yr 1,011 97.5 93.6
65–69 yr 370 96.8 92.2
Total 4,907 95.8 91.3
Females 35–44 yr 2,519 97.9 90.8
45–54 yr 2,398 98.2 93.3
55–64 yr 1,477 98.2 92.0
65–69 yr 562 98.0 90.2
Total 6,956 98.1 91.9
a Total number of participants in each age category (includes participants recruited as >second in household=).
b % of participants within each age category who responded positively to request.

Chronic Diseases in CanadaVol 27, No 2, 2006 58
approach is likely to become less effective in the near future. In the USA, there is grow-ing disquiet concerning declining response rates to RDD methods of contacting poten-tial subjects.39,40 Declining response rates not only raise concerns about the ability of the resulting cohort to refl ect even broadly the characteristics of the general popula-tion, but may also have severe fi scal conse-quences as the length of time and amount of effort required to achieve the desired sample numbers increases. It is therefore possible that other recruitment methods may be evaluated against the RDD experi-ence before future waves of enrolment are undertaken in the Alberta Cohort Study.
While the double recruitment strategy was somewhat effective in increasing the number of potential study subjects, the potential Acost@ of this approach out-weighed the benefi t. That is, a relatively high portion of the RDD1 sample (28.1 percent) shared a household with another person recruited for the study (most often a spouse). If a large proportion of these individuals along with their household partners were to enrol in the study, the potential of having a high degree of corre-lation present in the study data, especially on measures of exposure would outweigh the advantages of using the “second per-son„ strategy. Despite the added effi ciency, the method was not used in subsequent RDD recruitment waves.
There had been considerable media dis-cussion about information privacy con-cerns and the potential ethical challenges surrounding the collection of biologic sam-ples for long-term storage and use prior to and during our study enrolment. In fact, the Offi ce of the Information and Privacy Commissioner was established in Alberta in 1995, presumablyCand in partCto address public concerns in this area. However, the consent for use of personal health information and to be contacted for biologic specimens was extremely high. Undoubtedly, some of this is due to the research-oriented nature of individuals who choose to participate in such a study; those who were uncomfortable with this request may have elected not to participate in the cohort at all. Furthermore, the some-what abstract notion that they may be
contacted in the future to consider provid-ing a blood sample may have encouraged some subjects to respond positively to the request without thinking it through. In order to estimate how many people would provide a sample if asked, we subsequent-ly conducted a small pilot study, which demonstrated that approximately two thirds of those approached would give a 50 mL sample of blood for banking. These samples (N=769) have been processed to provide multiple aliquots of serum, plas-ma, red blood cells and buffy coat, which are being stored at -85°C in mechanical freezers. The planned collection of further blood samples will necessitate expansion of the existing bio-repository and establish-ment of protocols to guide the granting of access to the samples for further research. All further research on the samples will be subject to full ethical approval.
In conclusion, the results of this feasibility study suggest that cohort development in the Canadian context is feasible, and that the potential for future studies using bio-logical samples to determine prevalence of biomarkersCor correlations between reported exposures or disease outcomes with biomarkersCappears to be high. It is our hope that the information in this fea-sibility study will be of use to the much more extensive discussions that will need to take place in proposing the ultimate design, funding and administration of a full-scale cohort.
Acknowledgements
This project was funded by the Alberta Cancer Board=s New Initiative Program. Christine Friedenreich is supported by a CIHR New Investigator award and an AHFMR Scholar award. The authors gratefully acknowledge the input of their colleagues, Ilona Csizmadi, Elizabeth McGregor and Linda Cook, on aspects of study design and review, and Karen Kopciuk and Penny Brasher for statistical advice on weighting of samples. Thanks also to Gwynne Rees and Will Rosner for undertaking the statistical analyses.
Copies of the research instruments are available on request.
References
1. Livingstone MBE, Black AE. Markers of the validity of reported energy intake. J Nutr 2003;133 Suppl 3:895S–920S.
2. Motl RW, McAuley E, DiStefano C. Is social desirability associated with self-reported physical activity? Prev Med 2005;40(6):735–9.
3. Adams SA, Matthews CE, Ebbeling CB, et al. The effect of social desirability and social approval on self-reports of physical activity. Am J Epidemiol 2005;161(4):389–98.
4. Hebert JR, Peterson KE, Hurley TG, et al. The effect of social desirability trait on self-reported dietary measures among multi-ethnic female health center employees. Ann Epidemiol 2001;11(6):417–27.
5. Abba K, Clarke S, Cousins R. Assessment of the potential effects of population changes in attitudes, awareness and beliefs on self-reporting of occupational ill-health. Occup Med (Lond) 2004;54(4):238–44.
6. Kristman V, Manno M, Cote P. Loss to follow-up in cohort studies: how much is too much? Eur J Epidemiol 2004;19(8):751–60.
7. Lavrakas PJ. Telephone Survey Methods Sampling, Selection, and Supervision. 2nd ed. Sage Publications, Inc. 1993.
8. Statistics Canada. Residential Telephone Service Survey (RTSS). 2001
9. Statistics Canada. Definitions, data sources and methods. 2003. Available from: URL: http://www.statcan.ca/english/concepts/stat-unit-def.htm (last accessed 19th December 2005).
10. University of Alberta. Population Research Laboratory, University of Alberta. Available from: URL: http://www.uofaweb.ualberta.ca/prl/ (last accessed 19th December 2005).
11. National Cancer Institute. Prostate, Lung, Colorectal & Ovarian Cancer Screening Trial (PLCO). Available from: URL: http://www3.cancer.gov/prevention/plco/index.html (last accessed 21st December 2005).
12. Women’s Health Initiative Study Group. Design of the Women’s Health Initiative Clincal Trial and Observational Study. Control Clin Trials 1998;19:61–109.

Vol 27, No 2, 2006Chronic Diseases in Canada 59
13. Statistics Canada. Canadian Community Health Survey (CCHS), Questionnaire for Cycle 1.1. Available from: URL http://www.statcan.ca.english/sdds/instrument/3226_Q1_V1_E.pdf (last accessed 21st December 2005).
14. UCLA Center for Health Policy Research, California Department Health Policy Research, Public Health Institute. 2001 California Health Interview Survey Adult Questionnaire.
15. Mills C, Stephens T, Wilkins K. Summary report of the workshop on data for monitoring tobacco use. Health Rep 1994; 6(3):377–87.
16. Lovato C, Shoveller J, Mills C. Canadian national workshop on measurement of sun-related behaviours [Workshop report]. Chronic Dis Can 1999;20(2):96–100.
17. Rand Health. Medical Outcomes Study Questionnaire. Available from: URL: http://www.rand.org/health/surveys/core/ (last accessed 21st December 2005).
18. Kushi LH, Kaye SA, Folsom AR, Soler JT, Prineas RJ. Accuracy and reliability of self-measurement of body girths. Am J Epidemiol 1988;128(4):740–8.
19. National Cancer Institute. Diet History Questionnaire: Available from: URL http://riskfactor.cancer.gov/DHQ/forms/canadian/index.html (last accessed 14th July 2006).
20. Subar AF, Thompson FE, Kipnis V, et al. Comparative validation of the Block, Willett, and National Cancer Institute food frequency questionnaires : the Eating at America’s Table Study. Am J Epidemiol 2001;154(12):1089–99.
21. Thompson FE, Subar AF, Brown CC, et al. Cognitive research enhances accuracy of food frequency questionnaire reports: results of an experimental validation study. J Am Diet Assoc 2002;102(2):212–25.
22. Csizmadi I, Kahle L, Ullman R, et al. Adaptation and evaluation of the National Cancer Institute’s Diet History Questionnaire and nutrient database for use in Canadian populations. Public Health Nutr (in press).
23. Friedenreich CM, Courneya KS, Bryant HE. The lifetime total physical activity questionnaire: development and reliability. Med Sci Sports Exerc 1998;30(2):266–74.
24. Friedenreich CM, Courneya KS, Neilson HK, et al. Reliability and validity of the Past Year Total Physical Activity Questionnaire. Am J Epidemiol 2006; 163(10): 959-70.
25. Statistics Canada. Canadian Community Health Survey Cycle 1.1. 2001. Public Use Microdata File.
26. Béland Y, Dufour J, Hamel M. Preventing non-response in the Canadian community health survey. Proceedings of Statistics Canada’s Symposium, Achieving Data Quality in a Statistical Agency: a Methodological Perspective. 2001. Ottawa, Ontario, Statistics Canada.
27. Census Operations Division, Statistics Canada. Income of Canadian Families. 2001. Available from: URL: http://www23.statcan.ca/english/census01/Products/Analytic/companion/inc./provs.cfm (last accessed 21st December 2005).
28. Manjer J, Carlsson S, Elmstahl S, et al. The Malmo Diet and Cancer Study: represen-tativity, cancer incidence and mortality in participants and non-participants. Eur J Cancer Prev 2001;10(6):489–99.
29. Boker LK, van Noord PA, van der Schouw YT, et al. Prospect-EPIC Utrecht: study design and characteristics of the cohort population. Eur J Epidemiol 2001;17(11): 1047–53.
30. Boeing H, Korfmann A, Bergmann MM. Recruitment procedures of EPIC-Germany. European Investigation into Cancer and Nutrition. Ann Nutr Metab 1999;43(4):205–15.
31. van den Brandt PA, Goldbohm RA, van’t Veer P, Volovics A, Hermus RJ, Sturmans F. A large-scale prospective cohort study on diet and cancer in The Netherlands. J Clin Epidemiol 1990;43(3):285–95.
32. Limburg PJ, Anderson KE, Johnson TW, et al. Diabetes mellitus and subsite-specific colorectal cancer risks in the Iowa Women’s Health Study. Cancer Epidemiol Biomarkers Prev 2005;14(1):133–7.
33. Gram IT, Braaten T, Terry PD, et al. Breast cancer risk among women who start smoking as teenagers. Cancer Epidemiol Biomarkers Prev 2005;14(1):61–6.
34. Szklo M. Population-based cohort studies. Epidemiologic Reviews 1998;20(1):81–90.
35. Barton J, Bain C, Hennekens CH, et al. Characteristics of respondents and non-respondents to a mailed questionnaire. Am J Public Health 1980;70(8):823–5.
36. Lang JM. The use of a run-in to enhance compliance. Stat Med 1990;9(1-2):87–93.
37. Buring JE, Hennekens CH. Cost and efficiency in clinical trials: the U.S. Physicians’ Health Study. Stat Med 1990;9(1-2):29–33.
38. Centers for Disease Control. 2003 Behavioral Risk Factor Surveillance System Summary Data Quality Report. Available from: URL: http://www.cdc.gov/brfss/technical_infodata/2003QualityReport.htm (last accessed 21st December 2005).
39. Allen M, Ambrose D, Halfpenny G, Simmie T. Telephone refusal rates still rising: Results of the 2002 Response Rate Survey. Available from: URL: http://www.pmrs-aprm.com/specialresponse/article01.html (last accessed 21st December 2005).
40. Curtin R, Presser S, Singer E. Changes in telephone survey nonresponse over the past quarter century. Public Opinion Quarterly 2005;69(1):87–98.
Chronic Diseases in CanadaVol 27, No 2, 2006 60
Author References
Stacey A Page and Ian Mitchell, Offi ce of Medical Bioethics, University of Calgary, Calgary, Alberta, Canada Correspondence: Stacey A Page, Offi ce of Medical Bioethics, Rm 93, HMRB, Faculty of Medicine, University of Calgary, 3330 Hospital Drive NW, Calgary, Alberta, Canada T2N 4N1; fax: (403) 283-8524; e-mail: [email protected]
Stacey A Page and Ian Mitchell
Abstract
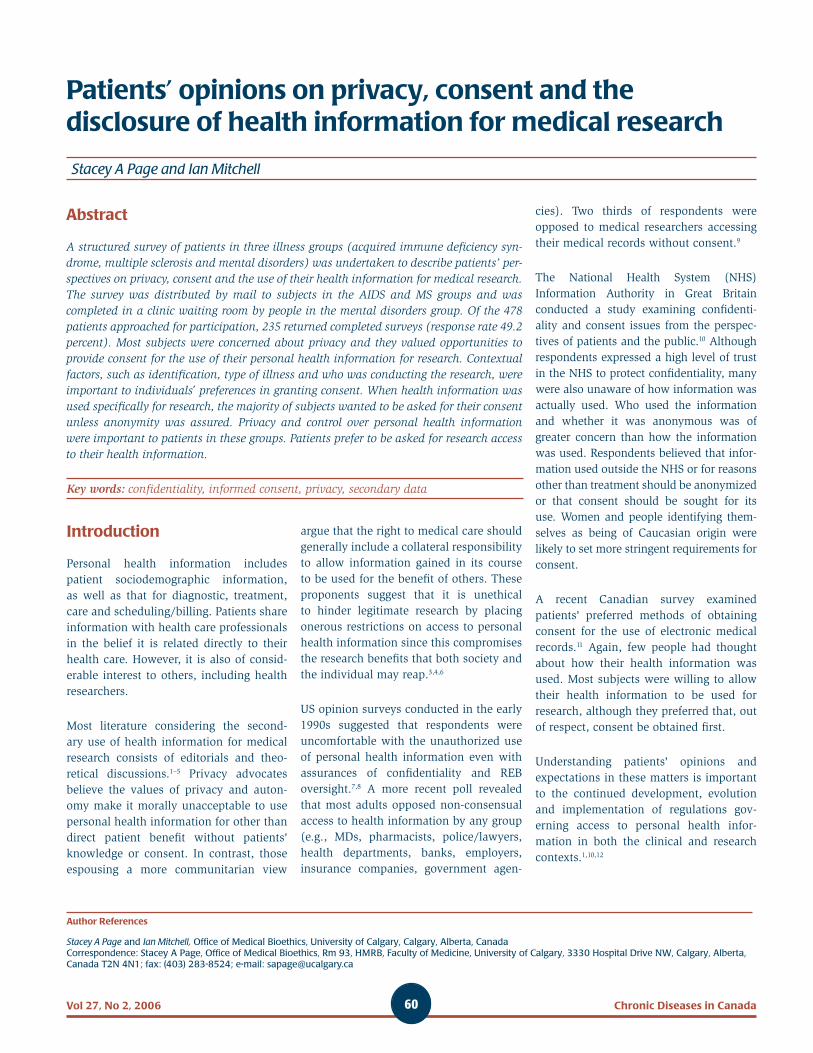
A structured survey of patients in three illness groups (acquired immune defi ciency syn-drome, multiple sclerosis and mental disorders) was undertaken to describe patients’ per-spectives on privacy, consent and the use of their health information for medical research. The survey was distributed by mail to subjects in the AIDS and MS groups and was completed in a clinic waiting room by people in the mental disorders group. Of the 478 patients approached for participation, 235 returned completed surveys (response rate 49.2 percent). Most subjects were concerned about privacy and they valued opportunities to provide consent for the use of their personal health information for research. Contextual factors, such as identifi cation, type of illness and who was conducting the research, were important to individuals’ preferences in granting consent. When health information was used specifi cally for research, the majority of subjects wanted to be asked for their consent unless anonymity was assured. Privacy and control over personal health information were important to patients in these groups. Patients prefer to be asked for research access to their health information.
Key words: confi dentiality, informed consent, privacy, secondary data
argue that the right to medical care should generally include a collateral responsibility to allow information gained in its course to be used for the benefi t of others. These proponents suggest that it is unethical to hinder legitimate research by placing onerous restrictions on access to personal health information since this compromises the research benefi ts that both society and the individual may reap.3,4,6
US opinion surveys conducted in the early 1990s suggested that respondents were uncomfortable with the unauthorized use of personal health information even with assurances of confi dentiality and REB oversight.7,8 A more recent poll revealed that most adults opposed non-consensual access to health information by any group (e.g., MDs, pharmacists, police/lawyers, health departments, banks, employers, insurance companies, government agen-
Introduction
Personal health information includes patient sociodemographic information, as well as that for diagnostic, treatment, care and scheduling/billing. Patients share information with health care professionals in the belief it is related directly to their health care. However, it is also of consid-erable interest to others, including health researchers.
Most literature considering the second-ary use of health information for medical research consists of editorials and theo-retical discussions.1–5 Privacy advocates believe the values of privacy and auton-omy make it morally unacceptable to use personal health information for other than direct patient benefi t without patients= knowledge or consent. In contrast, those espousing a more communitarian view
cies). Two thirds of respondents were opposed to medical researchers accessing their medical records without consent.9
The National Health System (NHS) Information Authority in Great Britain conducted a study examining confi denti-ality and consent issues from the perspec-tives of patients and the public.10 Although respondents expressed a high level of trust in the NHS to protect confi dentiality, many were also unaware of how information was actually used. Who used the information and whether it was anonymous was of greater concern than how the information was used. Respondents believed that infor-mation used outside the NHS or for reasons other than treatment should be anonymized or that consent should be sought for its use. Women and people identifying them-selves as being of Caucasian origin were likely to set more stringent requirements for consent.
A recent Canadian survey examined patients= preferred methods of obtaining consent for the use of electronic medical records.11 Again, few people had thought about how their health information was used. Most subjects were willing to allow their health information to be used for research, although they preferred that, out of respect, consent be obtained fi rst.
Understanding patients= opinions and expectations in these matters is important to the continued development, evolution and implementation of regulations gov-erning access to personal health infor-mation in both the clinical and research contexts.1,10,12
Patients’ opinions on privacy, consent and the disclosure of health information for medical research

Vol 27, No 2, 2006Chronic Diseases in Canada 61
The purpose of this study was to examine perspectives of members of three patient groups regarding consent and the disclo-sure of health information for medical research. Its conduct was approved by the Conjoint Health Research Ethics Board, University of Calgary.
MethodsSample
Approximately 200 adults from each of three patient groups (people with AIDS, a mental disorder or multiple sclerosis) were approached to participate.
Instruments
A fi ve-page, fi xed-choice questionnaire was developed for the purpose of this study based on a literature review and consultation with members of each patient group. The questionnaire was locally peer reviewed by experts in research eth-ics, law and privacy. A small number of individuals from each patient group were asked to review the questionnaire. Recommendations were incorporated into a subsequent version.
Questions focused on sociodemograph-ics, experience with medical research, and opinions and experiences relating to privacy, health information and medical research. Subjects were invited to make additional comments about the use of personal health information for medical research. Questionnaire completion was anonymous.
Procedure
The procedure for administering the ques-tionnaire varied slightly between the three participating organizations and refl ected differences in client characteristics, interim response rates and organizational human resources.
AIDS support agency
A community-based organization providing supportive resources for people with AIDS mailed the survey package (covering letter, questionnaire, postage-paid return enve-lope) to all clients with contact information in its database (N=200) in late November,
2003. Approximately six weeks later, survey recipients received a post card reminder and, two weeks after that, a second questionnaire package. Posters promoting survey participa-tion were placed on the organization=s bul-letin boards.
Inner city mental health clinic
This clinic serves an outpatient population with a range of mental disorder diagnoses. At the time of questionnaire distribu-tion, the clinic served approximately 450 clients. Consecutive patients presenting to the clinic reception over a fi ve-month period beginning in November 2003 were asked if they would be willing to com-plete the questionnaire. If they agreed, clients were given the survey package and asked to return it before leaving the clinic. Clients were excluded if they were actively psychotic.
Multiple sclerosis support agency
A community-based organization provid-ing supportive services to clients with multiple sclerosis mailed a survey package to 200 of 751 active clients in its database in November 2003. Every third client was selected until a total of 200 was reached. Approximately eight weeks later, a second questionnaire package was mailed.
Analyses
Data were analyzed using STATA 6.13 Descriptive statistics were used to sum-marize responses from each patient group as appropriate. Thirteen items addressing opinions on consent (see Table 3) were used to construct an individual Aconsent index@. These items examined whether or not respondents believed individual consent should be obtained for medical research using their health information under a variety of conditions. Responses indicating that consent should be obtained were scored +1, those indicating con-sent need not be obtained were scored B1 and those indicating the respondent was unsure were scored 0. These items were summed for each respondent. Positive sums characterized those who more often believed consent was necessary while neg-ative sums characterized those who did not believe consent was always necessary. Respondents with a score of zero were considered undecided. This method iden-tifi ed two groups of respondents holding relatively strong opinions on consent and access to personal health information for medical research. Multiple logistic regres-sion methods were used to identify factors predictive of these perspectives (alpha = 0.05). Demographic characteristics (age,
FIGURE 1Consent index of study participants: Distribution of participants’
individual summary scores for items in Table 3.Positive integers indicate preference for consent
0
0,05
0,1
0,15
0,2
0,25
Summary score
Pro
port
ion
-13 -11 -9 -7 -5 -3 -1 1 3 5 7 9 11 13

Chronic Diseases in CanadaVol 27, No 2, 2006 62
sex, marital status, employment status, education, income, research experi-ence and illness group) were considered. Backwards, stepwise regression was per-formed with the resulting models evalu-ated using the likelihood ratio chi-square test. Textual comments were summarized using content analysis.
ResultsSubjects
Questionnaires were returned by 244 peo-ple. Nine returns had substantial miss-ing data and were excluded. The overall response rate was therefore 235/478 (49.2 percent). The response rate varied signifi -cantly by group.
AIDS patient group
Of the 200 surveys sent out, 78 were returned as undeliverable. Twenty-six ques-tionnaires were returned for a response rate of 21 percent (26/122).
Mental disorders patient group
One hundred and eighty-seven people were approached for survey participation. Seventeen people were too ill to participate and were excluded (possible N=170). Two people returned a questionnaire with exces-sive missing data and 82 people refused. Eighty-six useable questionnaires were returned (response rate 86/170: 51 percent).
Multiple sclerosis patient group
Twelve of 200 surveys were returned as undeliverable. One hundred and thirty surveys were returned, of which seven had excessive missing data. Thus, 123 useable questionnaires were received for a response rate of 65 percent (123/188).
Sociodemographic characteristics are given in Table 1.
Opinions and experiences about privacy and health information
Patients from all three groups were most concerned with the privacy of their fi nan-cial and health information, whereas the privacy of their religious and politi-cal beliefs concerned them least. Across groups, the majority of patients (96 to 100 percent) believed people should be able to access their own health information. However, few had tried to do so.
From a list of people/organizations, patients were asked to identify those whom they felt could access their health information with-out consent. As Table 2 shows, respondents felt that physicians involved in their care were the only ones who should be able to access their health information without their consent. Most patients believed all others, including spouses and other close relatives, should have access to such information only with consent.
TABLE 1Sociodemographic characteristics of
paticipants by patient group
Patient groups
CharacteristicAIDS
N (%)
Mental disorders
N (%)
Multiple sclerosisN (%)
TotalN (%)
Sex
Male 22 (84.6) 33 (38.4) 31 (25.2) 86 (36.6)
Female 4 (15.4) 53 (61.6) 92 (74.8) 149 (63.4)
Age group
20–39 9 (34.6) 39 (45.4) 20 (16.3) 68 (28.9)
40–59 15 (57.6) 37 (43.0) 77 (62.5) 129 (54.9)
≥ 60 1 (3.9) 7 (8.1) 26 (21.2) 34 (14.5)
≥ Unknown 1 (3.9) 3 (3.5) 0 4 (1.7)
Currently working?
No 19 (73.1) 59 (68.6) 96 (78.1) 174 (74.0)
Yes 7 (26.9) 27 (31.4) 27 (22.0) 61 (26.0)
Education
< Grade 12 5 (19.2) 20 (23.3) 14 (11.4) 39 (16.6)
Grade 12 3 (11.5) 15 (17.4) 17 (13.8) 35 (14.9)
Attended/fi nished post secondary 18 (69.2) 47 (54.6) 91 (74.0) 156 (66.4)
Refused to answer 0 4 (4.7) 1 (0.8) 5 (2.1)
Marital status
Single* 24 (92.3) 67 (77.9) 46 (37.4) 137 (58.3)
Partnered (common-law, married) 2 (7.7) 19 (22.1) 77 (62.6) 98 (41.7)
Annual gross income
< $20,000 12 (46.2) 34 (39.5) 28 (22.8) 74 (31.5)
$20,000 – $39,999 8 (30.8) 14 (16.3) 21 (17.1) 43 (18.3)
$40,000 – $59,999 1 (3.9) 7 (8.1) 15 (12.2) 23 (9.8)
$60,000 – $79,999 0 4 (4.7) 17 (13.8) 21 (8.9)
≥ $80,000 0 1 (1.2) 10 (8.1) 11 (4.7)
Don=t know/refused to answer 5 (19.3) 26 (30.3) 32 (26.1) 63 (26.9)
Previous experience with medical research
Yes 15 (57.7) 29 (33.7) 83 (67.5) 127 (54.0)
No 9 (34.6) 43 (50.0) 33 (26.8) 85 (36.2)
Not sure 2 (7.7) 14 (16.3) 7 (5.7) 23 (9.8)
* Includes never married, separated, divorced and widowed.

Vol 27, No 2, 2006Chronic Diseases in Canada 63
Contextual factors infl uencing need for consent to be obtained
Subjects were given the following scenario and asked if they felt that consent should be required to use their personal health information. It was emphasized that the question pertained to whether consent should be obtained, not whether they would actually grant consent.
AMedical researchers at a university are conducting a study about a medical condi-tion that has affected you. They would like to use your personal health information in their study. This information is stored with your name on it.@
Subsequently, a number of variables in this scenario were changed and in each case subjects were asked if their consent needed to be obtained. These results appear in Table 3.
Across conditions, there was variation in the proportions of subjects needing con-sent to be sought. Except in one variation of the scenario, the majority of subjects believed that consent should be required to use their health information for medical research. Subjects demonstrated greatest consensus on this when it was possible to identify the person whose information was used (>78 percent across groups believed
consent was needed) and when the infor-mation was sensitive in nature (>84 per-cent across groups believed consent was needed). Subjects were most undecided about the need to seek consent when doing so was not feasible for the researchers (17 percent not sure). The only condition under which the majority of respondents believed consent for personal informa-tion access did not need to be sought was when the information was anonymous (63 percent seeking of consent not required).
The items in Table 3 were used to con-struct the consent index, as described ear-lier. Scores on the consent index revealed that for the sample as a whole, 184 (78.3 percent) were consent advocatesCmore often of the opinion that consent was necessary for access to personal health information. The difference in proportions between patient groups was not signifi cant (Pearson chi2 = 3.5; p= 0.17). The range of scores determined for the consent index is shown in Figure 1.
Sex and employment status were the only factors found to predict consent support. Specifi cally, women and those who were employed were more likely to be consent advocates ([OR=1.96; 95% CI: 1.04-3.71] and [OR=2.29; 95% CI: 1.00-5.25], respectively).
Opinions about health research
Subjects rated on a fi ve-point Likert scale the extent to which they agreed or disa-greed with six statements about health research, and when consent for research access to personal health information should be required. Since illness group was not found to infl uence opinion on consent and the disclosure of health infor-mation for research purposes, the data for the three groups were combined. These results are shown in Table 4.
Textual comments
Nineteen people made additional com-ments relating to privacy issues. Most of these comments refl ected concern for pri-vacy and emphasized the need for consent to be obtained prior to the use of personal health information for medical research.
Some of the comments are included below:
AI strongly believe that a person=s medical history must be protected, as this informa-tion could be harmful if obtained by oth-ers who could use it in a damaging way.@ (resp 96)
AI am more interested in doing research if I am being interviewed or answering ques-tions. I am somewhat leery of having my info out there accessible to many people. Somehow there is always a trust issue there Y it is much easier to trust if you are involved and meet someone involved in the research. The idea of any medical pro-fessional accessing my info bothers me.@ (resp 233)
ABasically, I believe a person should be asked always. Personally, in most situa-tions I would say >yes=, but I should always be asked.@ (resp 50)
Discussion
Patients are clearly concerned about the privacy and security of their personal health information. Most respondents preferred that their consent be obtained before using their information for health
TABLE 2Access to health information without consent by various stakeholders:
Number and percentages of patients who would agree to it, by patient group
Patient groups
AIDSN (%)
Mental disorders
N (%)
Multiple sclerosisN (%)
TotalN (%)
Spouse/partner 4 (15.4) 18 (20.9) 57 (46.3) 79 (33.6)
Close relatives 6 (23.1) 26 (30.2) 35 (28.5) 67 (28.5)
Physicians involved in your care 24 (92.3) 71 (82.6) 108 (87.8) 203 (86.4)
Physicians not involved in your care 4 (15.4) 6 (7.0) 11 (8.9) 21 (8.9)
Medical researchers 8 (30.8) 28 (32.6) 42 (34.2) 78 (33.2)
Pharmacists 8 (30.8) 29 (33.7) 24 (19.5) 61 (26.0)
Drug companies 2 (7.7) 5 (5.8) 3 (2.4) 10 (4.3)
Your employer 1 (3.9) 7 (8.1) 2 (1.6) 10 (4.3)
Your insurance company 2 (7.7) 10 (11.6) 7 (5.7) 19 (8.1)
The government 2 (7.7) 8 (9.3) 4 (3.3) 14 (6.0)

Chronic Diseases in CanadaVol 27, No 2, 2006 64
TABLE 3The infl uence of different factors on patients’ consent preferences
for medical research, by patient group
Factor Patient groups
“Would you like to be asked for your consent if . . . ”AIDS
N (%)
Mentaldisorders
N (%)
Multiple sclerosisN (%)
TotalN (%)
. . . the information is stored with your name on it (i.e., you could be identifi ed).
Yes 23 (88.5) 75 (87.2) 97 (78.9) 195 (83.0)
No 3 (11.5) 9 (10.5) 23 (18.7) 35 (14.9)
Unsure 0 2 (2.3) 3 (2.4) 5 (2.1)
. . . the medical condition is something very serious (e.g., cancer, heart disease, Alzheimer=s disease).
Yes 21 (80.8) 53 (61.6) 88 (71.5) 162 (68.9)
No 4 (15.4) 27 (31.4) 28 (22.8) 59 (25.1)
Unsure 1 (3.9) 6 (7.0) 7 (5.7) 14 (6.0)
. . . the medical condition is something relatively minor (e.g., ear infection, muscle strain, headache).
Yes 18 (69.2) 60 (69.8) 79 (64.2) 157 (66.8)
No 7 (26.9) 24 (27.9) 41 (33.3) 72 (30.6)
Unsure 1 (3.9) 2 (2.3) 3 (2.4) 6 (2.6)
. . . the medical condition is something Asensitive@ (e.g., sexual problems, sexually transmitted disease, mental illness).
Yes 22 (84.6) 80 (93.0) 106 (86.2) 208 (88.5)
No 3 (11.5) 4 (4.7) 14 (11.4) 21 (8.9)
Unsure 1 (3.9) 2 (2.3) 3 (2.4) 6 (2.6)
. . . the research is likely to help you directly.
Yes 21 (80.8) 69 (80.2) 91 (74.0) 181 (77.0)
No 4 (15.4) 12 (14.0) 28 (22.8) 44 (18.7)
Unsure 1 (3.9) 5 (5.8) 4 (3.3) 10 (4.3)
. . . although the research will not help you, it is likely to help others.
Yes 18 (69.2) 68 (79.1) 87 (70.7) 173 (73.6)
No 7 (26.9) 13 (15.1) 31 (25.2) 51 (21.7)
Unsure 1 (3.9) 5 (5.8) 5 (4.1) 11 (4.7)
. . . the information can be obtained by questioning another member of your family.
Yes 23 (88.5) 69 (80.2) 92 (74.8) 184 (78.3)
No 3 (11.5) 12 (14.0) 21 (17.1) 36 (15.3)
Unsure 0 5 (5.8) 10 (8.1) 15 (6.4)
. . . the information is in a database and is identifi ed only by a number. That is, the information is not linked directly to your name and your identity will remain unknown to the researchers.
Yes 8 (30.8) 35 (40.7) 34 (27.6) 77 (32.8)
No 17 (65.4) 45 (52.3) 85 (69.1) 147 (62.6)
Unsure 1 (3.9) 6 (7.0) 4 (3.3) 11 (4.7)
. . . the researchers have assured you that your information is secure. Although your identity will be known to them, they will keep this information secure and your identity will never be revealed to others outside the research team.
Yes 15 (57.7) 62 (72.1) 79 (64.2) 156 (66.4)
No 9 (34.6) 22 (25.6) 38 (30.9) 69 (29.4)
Unsure 2 (7.7) 2 (2.3) 6 (4.9) 10 (4.3)
. . . the information must be obtained from another 5,000 patients like yourself. The researchers have stated that getting consent from everybody is not feasible and they will not be able to carry out the research if they have to get consents.
Yes 15 (57.7) 49 (57.0) 57 (46.3) 121 (51.5)
No 10 (38.5) 22 (25.6) 42 (34.2) 74 (31.5)
Unsure 1 (3.9) 15 (17.4) 24 (19.5) 40 (17.0)

Vol 27, No 2, 2006Chronic Diseases in Canada 65
research. Although the response rates by the patients with mental disorders and the patients with multiple sclerosis were reasonable, non-response bias is a threat to the generalizability of these fi ndings. In particular, the AIDS patient group had a very low response rate. This was likely due to the transient nature of the population served by this community-based organiza-tion, evidenced by the high proportion of questionnaires returned as undeliverable. Those who responded from this group did, however, express views similar to those of individuals in the other two groups.
Access to health information
Respondents felt that soley the physi-cians directly involved in their health care should be able to access patient per-sonal health information without consent. This refl ects the fi duciary nature of the physician-patient relationship, in which patients provide intimate details about their physical and mental health based on the assumptions that information will be kept confi dential and that it will be used for purpose of providing care. This is con-sistent with previous fi ndings indicating that patients value the inter-professional exchange of their health information and view such disclosure as vital to their care.14
Not surprisingly, treatment has been rated as the most important use of health infor-mation by patients.10 When asked about their physicians having access to health information for research, the proportion of patients indicating they would agree to waive the requirement for consent fell considerably from the levels reached in the clinical circumstance.
For all other third parties, most respondents would deny access to their health informa-tion without consent, a view that strength-ened as the described relationship with the third party grew more remote. Consistent with fi ndings from previous studies,7,11,15 a majority of respondents objected to the use of their health information for research without consent.
Conditions that infl uenced need for consent
Across most items, the majority (63 to 89 percent) felt their consent should be sought when using their health informa-tion for medical research. Variation in these proportions was observed, how-ever, indicating that contextual factors are important to individuals. Respondents were most likely to shift their views from Arequiring@ to Awaiving@ consent when the information sought was anonymous
and individual identifi cation was impos-sible. Nevertheless, one third of respond-ents maintained the perspective that their consent be required even if the data were unidentifi able.
A similar, though smaller, shift occurred when researchers presented the situation where obtaining consent would not be feasible and the research could not pro-ceed if individual consents were needed. Moreover, a substantial proportion of respondents were undecided on this issue. Possibly, further details on other condi-tions of the research would be necessary for subjects to come to an opinion under this condition.
Assurances that confi dentiality would be maintained or that an REB had reviewed and approved the research did not alter the major-ity view that consent should be sought. Even with the provision that the research might directly benefi t them or others, most respond-ents still believed their consent for use of per-sonal information should be requested.
Opinions on consent and medical research
Most respondents were Aconsent advo-cates@ around the issue of use of personal health information for medical research.
TABLE 3 (continued)The infl uence of different factors on patients’ consent preferences
for medical research, by patient group
Factor Patient groups
“Would you like to be asked for your consent if . . . ”AIDS
N (%)
Mentaldisorders
N (%)
Multiple sclerosisN (%)
TotalN (%)
. . . your own doctor is conducting the research.
Yes 13 (50.0) 58 (67.4) 76 (61.8) 147 (62.6)
No 13 (50.0) 25 (29.1) 44 (35.8) 82 (34.9)
Unsure 0 3 (3.5) 3 (2.4) 6 (2.6)
. . . a drug company is conducting the research.
Yes 19 (73.1) 74 (86.1) 102(82.9) 195 (83.0)
No 4 (15.4) 11 (12.8) 17 (13.8) 32 (13.6)
Unsure 3 (11.5) 1 (1.2) 4 (3.3) 8 (3.4)
. . . a research ethics board, made up of doctors, lawyers, nurses, research experts and ordinary people from the community, has looked at the research proposal. They have decided it is an important study and will not cause you any harm.
Yes 16 (61.5) 57 (66.3) 86 (69.9) 159 (67.7)
No 10 (38.5) 20 (23.3) 26 (21.1) 56 (23.8)
Unsure 0 9 (10.5) 11 (8.9) 20 (8.5)

Chronic Diseases in CanadaVol 27, No 2, 2006 66
Nevertheless, almost one third of respond-ents felt that it would be suffi cient to sim-ply be informed that their information was being used for research, paralleling earlier Canadian fi ndings.11
Respondents were more in favour of pro-viding consent for each new research project than of giving blanket consent for research purposes in general. Similarly, the majority of respondents in previous sur-veys preferred to give consent each time their health information was accessed, whether this was for treatment or other purposes.7,10
As previously described, even when pro-vided with the assurance their data was not associated with their name and that their identity would remain unknown, 33 percent of the respondents believed researchers should be required to obtain their consent before using their health information for medical research (e.g., item 8, Table 3). In contrast, when this question was presented more generally (e.g., item 2, Table 4), the proportion of respondents requiring consent increased to 46 percent and an increasing proportion were unsure. It may be that respondents needed the additional detail provided in
the fi rst presentation of the question in order to provide a response. Alternatively, the fi rst question may have refl ected a more personal response, while the latter, more conservative, response refl ected what they perceived should happen in society generally. Ambiguities and inconsistencies in patient reports in this area have been reported previously.11
Conclusion
The secondary use of personal health information for research has provoked much discourse, centering on the balance between individual rights and societal ben-efi t.1–5,16–18 Privacy and autonomy are core values in the population, refl ected in the expressed concerns around use and disclo-sure of personal information of any sort. These fi ndings indicate that respecting these rights in a research context means requiring consent for research access to health information. However, the com-munity also values the benefi ts that accrue to individuals and society from medical research. These fi ndings suggest that this valuing does not extend to a widespread willingness to trade loss of privacy for the public good.
Previous research that has shown that people have little awareness of how per-sonal health information is used,10,11 and it is possible that this lack of understanding is what mediates the reluctance to allow greater access to personal health informa-tion. There may be a need for public edu-cation to foster trust in the health research process and to provide the public with a broader, societal perspective on the uses of personal health information. Future studies should focus on understanding the rationale behind the public’s perspectives.
For their part, researchers must be sensi-tive to the public=s desire to control the use of their individual health information. Research ethics boards in Alberta and elsewhere have the legislative and insti-tutional authority to permit researchers access to identifi able information without individual consent under certain condi-tions. These include factors directly related to the study, such as risk being minimal and study outcomes being in the public=s interest. Consent may also be waived if, in addition to the previous considerations, the process of obtaining consent is deemed to be unreasonable or impractical.4,16,19–22 What actually constitutes unreasonable-ness or impracticality is often unclear and may be a consequence, in part and in some cases, of insuffi cient resources. Increasing the budget amounts dedicated to obtaining individual consents is a potential means of addressing this issue.
Acknowledgements
This study was supported by funding from the Calgary Health Region.
The authors sincerely appreciate the time and effort of those who participated in this study and also of Dr. Michael King, for his thoughtful review of the manuscript.
TABLE 4Opinions on matters of
research and consent of three sampled groups (combined)
Issue
Agree/strongly
agreeN (%)
NeutralN (%)
Disagree/strongly disagreeN (%)
Research using individually identifi ed health information is important to the development of medical care.
114 (48.5) 58 (24.7) 52 (22.1)
Researchers should be able to use unidentifi -able personal health information without a person=s consent.
80 (34.0) 43 (18.3) 109 (46.4)
Researchers must always get a person=s con-sent to use identifi able health information.
182 (77.4) 28 (11.9) 22 (9.4)
Consent to use health information should be obtained each time a new research project is starting.
165 (70.2) 32 (13.6) 34 (14.4)
Consent to use health information need only be obtained once for all future research projects.
53 (22.5) 37 (15.7) 142 (60.5)
People should be informed that their health information is being used: They do not have to give consent.
70 (38.3) 33 (14.0) 106 (45.1)

Vol 27, No 2, 2006Chronic Diseases in Canada 67
References
1. Al-Shahi R, Warlow C. Using patient-identifiable data for observational research and audit. BMJ 2000;321(1031):1032.
2. Anderson R. Undermining data privacy in health information: new powers to control patient information contribute nothing to health. BMJ 2001;322:443–4.
3. Doll R, Peto R. Rights involve responsibilities for patients. BMJ 2001;322:730.
4. Korn D. Medical information privacy and the conduct of biomedical research. Academic Medicine 2000;75(10):963–8.
5. Verity C, Nicoll A. Consent, confidentiality and the threat to public health surveillance. BMJ 2002;324:1210–13.
6. Goodwin C. Personal privacy v. public health. New Scientist 1993;25–7.
7. Louis Harris & Associates. Harris-Equifax health information privacy survey. 1993.
8. Louis Harris & Associates. Harris-Equifax consumer privacy survey. 1994.
9. The Gallup Organization. Public attitudes towards medical privacy. Available at www.forhealthfreedom.org/Gallupsurvey/IHF-Gallup.pdf, (accessed March 21, 2006).
10. National Health System Information Authority in conjunction with The Consumer’s Association and Health Which? Share with care! Peoples’ views on consent and confidentiality of patient information. 2002-1A-1099. UK, Crown.
11. Willison DJ, Keshavjee K, Nair K, Goldsmith C, Holbrook AM. Patient consent preferences for research uses of information in electronic medical records: interview and survey data. BMJ 2003;326: 373–7.
12. Kotalik JF, Holloway G, Woodbeck H. The creation of a database for cancer screening: is the consent of the clients required? Cancer Prev Contr 1999;3(2):119–24.
13. STATA 6. College Station, TX: Stata Corporation, 1999.
14. Tracy CS, Drummond N, Ferris LE, Globerman J, Hebert PC, Pringle DM et al. To tell or not to tell? Professional and lay perspectives on the disclosure of personal health information in community-based dementia care. Can J Age 2004;23(3): 203–15.
15. Institute of medicine (IOM). Health data in the information age. Washington DC: National Academy Press, 1994.
16. Caulfield T, Outerbridge T. DNA databanks, public opinion and the law. Clin Invest Med 2002;25(6):252–6.
17. Etzioni A. Medical records: enhancing privacy, preserving the common good. Hastings Center Report 1999;29(2):14–23.
18. Gostin LO. Health information: reconciling personal privacy with the public good of human health. Health Care Analysis 2001;9:321–35.
19. Government of Alberta. Health Information Act. RSA 2000, c. H-5, ss. 48–56.
20. Coulter DM. Privacy issues and the monitoring of sumatriptan in the new Zealand Intensive Medicines Monitoring Programme. Pharmacoepi Drug Safety 2001;10:663–7.
21. Duszynski KM, Beilby JJ, Marley JE, Walker DC, Pratt NL. Privacy considerations in the context of an Australian observational database. Pharmacoepi Drug Safety 2001;10:587–94.
22. Gostin LO, Hodge Jr JG, Valdiserri RO. Informational privacy and the public’s health: the model state public health privacy act. Am J Pub Health 2001;91(9):1388–92.

Chronic Diseases in CanadaVol 27, No 2, 2006 68
Author References
Rhonda J Rosychuk, Department of Pediatrics, University of Alberta, Edmonton, Alberta, CanadaCynthia Yau, Canadian VIGOUR Centre, University of Alberta, Edmonton, Alberta, CanadaIan Colman, Department of Psychiatry, University of Cambridge, Cambridge, United KingdomDon Schopfl ocher, Alberta Health and Wellness, Government of Alberta, Edmonton, Alberta, CanadaBrian H Rowe, Department of Emergency Medicine, University of Alberta, Edmonton, Alberta, CanadaCorrespondence: Rhonda J Rosychuk, Department of Pediatrics, University of Alberta, 9423 Aberhart Centre, 11402 University Avenue, Edmonton, Alberta, Canada T6G 2J3; fax: (780) 407-6435; e-mail: [email protected]
Rhonda J Rosychuk, Cynthia Yau, Ian Colman, Don Schopfl ocher and Brian H Rowe
Abstract
Routine surveillance of cases of disease can highlight geographic regions that need fur-ther study and intervention. Statistical disease cluster detection methods are one way to statistically assess the number of cases in administrative areas. Traditionally, disease cluster detection methods are used to monitor the incident cases of disease. We review a statistical cluster detection method that is applicable for regions with diverse admin-istrative area population sizes. We apply the method to assess clustering of self-infl icted injury presentations to emergency departments in Alberta, Canada. Analyses focus on the pediatric population and are adjusted by the age and gender distributions of sub-regional health authorities. Fifteen clusters of self-infl icted injuries are identifi ed and, based on age and gender distributions, the clusters are not likely chance occurrences. We believe that these clusters represent areas of excessive self-infl icted injury and that special intervention programs should be considered.
Key words: emergency service, hospital, injuries, space-time clustering, wounds
both. The aggregation of cases are referred to as Aclusters@. These detection methods can involve general or focused testing.1
General tests identify any clusters with ele-vated cases, whereas focused tests identify areas of excess cases near potential point sources of inXuence, such as environmen-tal contaminants.
Traditionally, statistical disease cluster detection methods are exploratory tools that have been developed for and applied to disease incidence data. Examples include identiWcation of clusters of squamous cell carcinoma,2 leukemia,1, 3B5 various cancers,6
serious cardiac birth defects7 and child-hood diabetes.8
There are a variety of methods available that are suitable for testing speciWc hypotheses in particular data situations. For identify-ing the most likely cluster in a geographic
area, tests by Turnbull et al.4 and Kulldorff and Nagarwalla6 can be used. On the other hand, Besag and Newell1 and Tango10
pro-vide methods that are designed to identify regions with a tendency to cluster. For an overview of these methods and the more general topic of disease mapping, readers are directed to Lawson et al.11
In this paper, we apply one statistical dis-ease cluster technique in a non-traditional way. The deWnition of a case is based on a presentation of a self-inXicted injury to an emergency department (ED). These injuries are often referred to as Asuicide attempts@ and are relatively common ED presentations. Three to fi ve percent of individuals indicate they have attempted suicide in their lifetime.12 Individuals who harm themselves may suffer from a vari-ety of problems including abuse, chronic illness, psychiatric disorders and Wnancial diffi culties.13B18
As these individuals are at risk for further self-inXicted injuries and suicide,19,20 iden-tiWcation of geographic areas of excess self-inXicted injuries can be an important Wrst step in directing research efforts and interventions to high-risk populations. Our analyses incorporate the age and gen-der distributions of sub-Regional Health Authorities (sRHAs) to identify clusters of medically treated self-inXicted injuries.
Materials and methodsStudy population
The study population represented all 785,079 individuals under 18 years of age
Introduction
Health authorities are often alerted to areas of suspected high disease rates by medical personnel and members of the general public. Investigations, costly in time and resources, are likely to produce false alarms. Even in the absence of local reports, public health offi ces routinely monitor regions for new cases of illness and disease. This surveillance can identify geographic regions where further investi-gations or interventions can be focused. Statistical disease cluster detection meth-ods are one way to assess if any geograph-ic regions have more cases than could be expected by chance alone.
Statistical disease cluster detection meth-ods identify regions with excessive cases either in space (i.e., close to each other), over time (i.e., temporal proximity) or
Statistical disease cluster surveillance of medically treated self-infl icted injuries in Alberta, Canada

Vol 27, No 2, 2006Chronic Diseases in Canada 69
residing in the western Canadian prov-ince of Alberta between April 1, 1998 and March 31, 1999. Health care is the respon-sibility of a government ministry called Alberta Health and Wellness. The prov-ince was divided into nine Regional Health Authorities that served as administrative units for the delivery of health services and which were further sub-divided into 68 sRHAs21 (Figure 1). The sRHA population sizes ranged from 2,658 to 36,632 individ-uals (Figures 2a and 2b). The two major metropolitan centers, Calgary and Capital, had the highest populations and the small-est geographical regions. Conversely, the geographically large sRHAs had sparse population counts.
Data
The Ambulatory Care ClassiWcation System (ACCS) was established by Alberta Health and Wellness in 1997 and was the fi rst of its kind in Canada. ACCS is an exten-sive database which records augmented information on all services provided by hospitals on an outpatient basis, including ED presentations to acute care hospitals. This replaced an older limited data set which was collected through the Hospital Reporting System of the Canadian Institute for Health Information. Since the ACCS is used to assign funding to Regional Health Authorities for emergency care, there is a strong incentive to insure that the sys-tem is accurate. The history of the system and its validation are detailed by Alberta Health and Wellness.22
ACCS contained 1.5 million records dur-ing the study period. All records of ED presentations were coded with up to Wve diagnoses using the International ClassiWcation of Diseases, 9th revision, Clinical ModiWcation,23 by trained medical records nosologists as part of the data col-lection procedure.
For each individual, ACCS includes a unique lifetime identiWer, which allows the record to be linked to the Alberta Health Care Insurance Plan Stakeholder Registry to retrieve demographic information. The ACCS records and the Stakeholder Registry were linked to create a research data set. The Alberta Health Care Insurance Plan charges a premium for health care insur-ance. As a result, there is a strong moti-vation to maintain the accuracy of the database. Comparisons of population esti-mates between the Stakeholder Registry and the Canadian Census have been made and show that the Registry functions as a dynamic population registry. Statistics Canada now uses the Registry populations to adjust the census population estimates for intercensal projections.24
The research data set included the age, gender, health care insurance premium subsidy status, sRHA of residence, and number of ED presentations for each patient as well as other detailed informa-tion about each presentation, such as the date and time of the encounter. The self-infl icted injury presentations used in the
analysis are based on External Causes of Injury codes E950 to E959 (ASuicide and Self-InXicted Poisoning@, ASuicide and Self-InXicted Injury@). The median number of self-infl icted injuries per person was one (range 1 to 18). Individuals may present with more than one self-infl icted injury during the study period; we restrict our analyses and defi ne Aa case@ as an indi-vidual with at least one self-infl icted inju-ry. There were 827 pediatric cases in the province and the number of cases in each sRHA ranged between 0 and 45 (Figure 2). A full description of the self-infl icted injury ACCS data appears in Colman et al.25
For each sRHA, the population, a popula-tion-based centroid and the intercentroid distances were calculated. The mid-year population sizes were stratiWed by age, gender and subsidy status for each sRHA. Key to the disease clustering technique is a simpliWed spatial relationship provided by a nearest neighbour (NN) matrix. For a sRHA, its fi rst nearest neighbour is the sRHA located the shortest distance away, the second nearest neighbour is the sRHA within the next shortest distance, and so on. The distance between any two sRHAs determined the Euclidean distanceCthat distance Aas the crow Xies@ between the centroids of the sRHAs. All analyses are based on sRHA of residence, although we recognize that individuals may seek care from EDs outside their sRHA of residence.
Table 1 provides demographic summaries for the population and cases. The analysis was conducted with 18 age groups based on the year of age (0, 1, 2, . . . , 17).
Statistical disease cluster detection method
We focus our description and analyses on Le et al.=s cluster-testing algorithm,7
based on a test by Besag and Newell.1
The Besag and Newell technique individu-ally tests sRHAs to see if every person is equally likely to acquire the Adisease@ independently of other cases and the loca-tion of their residence. Since our focus is on clustering in the entire province, we chose a method that detects sRHAs with the tendency to cluster and also tests each sRHA. In addition, the method has
TABLE 1Gender proportions, age medians and age interquartile ranges of cases
of medically treated self-infl icted injury in the populationof Albertans under 18 years of age
Pediatric population N = 785,079
Gender Males 402,394 (51.3%)
Females 382,685 (48.7%)
Age (years) Median 9
Interquartile range 4 to 13
Pediatric cases N = 827
Gender Males 255 (30.8%)
Females 572 (69.2%)
Age (years) Median 16
Interquartile range 14 to 17
Data collected between April 1, 1998 and March 31, 1999.

Chronic Diseases in CanadaVol 27, No 2, 2006 70
several appealing features, such as ease of understanding, straightforward covari-ate adjustment, overall testing capability, analogous focused test version and statis-tical appropriateness.
The method requires knowing the popula-tion and the number of cases in each sRHA as well as the nearest neighbour matrix. StratiWcation by important demographic variables, such as age and gender, is easily done. For sRHA i, let ciag and niag denote the number of self-infl icted injuries and population, respectively, from group a and gender g, a = 0,...,17, g = 1,2, i=1,Y,68. The total number of self-infl icted injuries is
by age group and sex and similarly, the total popula-
tion in the province by these categories is
The method tests for a particular cluster size, k. The observed test statistic, , is the number of sRHAs that must be added to sRHA i in order to have at least k cases. The population of sRHA i with its near-est neighbours stratiWed by age group and gender is calculated, miag. In a rare dis-ease, the signiWcance level is approximated by a Poisson distribution with the p-value determined as
w h e r e
Small indicates that k cases are nearby and refl ects the degree of clustering. This testing is done for each sRHA separately and statistically signifi cant sRHAs are called “clusters”.
Since population sizes differ substantially from one sRHA to another, one cluster size may not be appropriate for all sRHAs. Instead, the cluster size can be based on the sRHA=s population and its nearest neighbours= population through a testing algorithm.7 For sRHA i, the cluster size ki0 is chosen such that ki0 1 is the 95th percentile of the Poisson distribution with mean λi0. This cluster size can be inter-preted as the minimum number of cases necessary to get a signiWcant cluster at the fi ve percent level, based on the popula-tion in sRHA i. If the test is insigniWcant, a new cluster size, ki1, is chosen, similarly
based on λ i1. Hence, the algorithm is com-posed of a sequence of tests at cluster sizes ki0,ki1,ki2 ....
Practically speaking, some small number of tests can be chosen and if a cluster is not found at lower cluster sizes, larger cluster sizes can then be tested. In our applica-tion, we test at kiw for w= 0,1,2,3 and refer to this approach as AmodiWed Besag and Newell@.
The clustering technique can also provide an overall assessment of clustering based on simulation. This aspect is particularly important when many tests are conducted in the testing algorithm. For the over-all assessment, cases are simulated and allocated to sRHAs based on population proportions. The analyses are repeated on the simulated data in the same manner as was done for the original data and the number of clusters identiWed is recorded.
c·ag= ∑ =
68
1i iagc
n·ag = ∑ =
68
1i iagn .
!/)exp(1
1
0
x
iix
k
x
∑−
=
−− λλ (1)
.
FIGURE 1 Alberta sub-Regional Health Authorities (sRHAs)
agaga g agiincm ••= =∑ ∑= /
17
0
2
1λ

Vol 27, No 2, 2006Chronic Diseases in Canada 71
When case data are simulated many times, an overall clustering p-value is calculated, representing the number of simulations that had at least as many clusters as the original data.
Ethics approval
This project was part of an ED Atlas project, which examined a variety of diseases pre-senting to EDs over a number of years. The projects and analyses were approved by the University of Alberta Ethics Review Panel. No patient contacts were made and no informed consent was obtained. Patient identiWers were scrambled prior to off-site transfer to protect privacy and ensure anonymity.
Results
The results of the cluster detection tests for each sRHA are presented in Table 2. The Regional Health Authority names are provided as well as sRHA identifi cation numbers (IDs) to ease discussion. For each sRHA, the results are presented for the cluster size kw, based on the population of the sRHA and its w nearest neighbours. The number of nearest neighbours, , that must be combined to have at least kw cases is presented as well as the IDs of the combined nearest neighbours (NNs). The actual number of cases in the sRHA and its nearest neighbours are denoted by o and the expected number (and Poisson mean used for testing) is λ. The ratio of the observed-to-expected numbers of cases are provided as a comparison. The p-value associated with each sRHA is listed and a double asterisk highlights p < 0.05. The simulation-based overall p-value associ-ated with the number of clusters identifi ed is ps = 0.007.
The analysis identiWes 15 sRHAs as clusters for individuals presenting with self-infl ict-ed injuries. For Chinook 2 (R102) to be identiWed as a cluster, it needed at least 26 cases. With 31 cases in this sRHA, it quali-fi es as a signiWcant cluster. Chinook 3 is identifi ed as a cluster when it is combined with Chinook 2. Similarly, when these two sRHAs are combined with Chinook 4, this becomes a cluster. Pallisar 6 is a cluster on its own and when it is combined with
Pallisar 7. David Thompson 24, 26 and 29 have enough cases to be clusters on their own. David Thompson 26 has 2.79 times more cases than expected. When David Thompson 28 and 30 are combined with David Thompson 29, they, too, become signifi cant. East Central 38 needs at least 27 cases to be considered a cluster; 38 are observed when it is combined with its fi rst nearest neighbour, David Thompson 26. David Thompson 27, when combined with its fi rst two nearest neighbours, has 1.75 times more cases than expected by
its age and gender distribution; it thus is identifi ed as a cluster. Capital 41 and 42 are clusters on their own but Capital 45 needs to be combined with Capital 47 and 41 to be detected as a cluster. No other sRHAs had enough cases to be clusters by themselves nor when combined with their fi rst, second or third NNs. Hence, >3 for these sRHAs and the associated combined population sizes are large enough for the p-values to be insignifi cant.
FIGURES 2a and 2bPopulation and case counts of medically treated self-infl icted injuries in
Albertans under 18 years of age for each sub-regional health authority (sRHA)
Data collected between April 1, 1998 and March 31, 1999.

Chronic Diseases in CanadaVol 27, No 2, 2006 72
TABLE 2Medically treated self-infl icted injury clustering results of Albertans under 18 years of age by regional health authority (RHA),
stratifi ed by age group and gender.* Nearest neighbour IDs (NNs) are provided for signifi cant sRHAs.
RHA and sub-RHA ID number i w kw NNs o λ ο /λ p
Chinook 1 3 53 4 57 57.1 1.00 0.724
2 0 26 0 31 17.6 1.76 0.036 **
3 1 33 1 2 34 24.0 1.42 0.047 **
4 2 39 2 3,2 39 29.3 1.33 0.050 **
5 3 51 4 53 46.7 1.13 0.285
Pallisar 6 0 21 0 21 14.0 1.50 0.048 **
7 1 29 1 6 29 20.3 1.43 0.041 **
8 3 36 5 45 46.4 0.97 0.950
Calgary 9 3 66 5 73 90.3 0.81 0.997
10 3 59 4 74 83.9 0.88 0.998
11 3 99 4 107 110.7 0.97 0.878
12 3 92 4 119 114.1 1.04 0.985
13 3 104 5 108 114.3 0.95 0.843
14 3 96 6 121 134.6 0.90 1.000
15 3 121 6 121 134.6 0.90 0.889
16 3 100 4 101 102.7 0.98 0.618
17 3 78 6 121 134.6 0.90 1.000
18 3 81 5 88 106.2 0.83 0.995
19 3 73 5 82 94.0 0.87 0.989
20 3 75 5 82 94.0 0.87 0.981
21 3 110 5 118 117.6 1.00 0.770
22 3 99 4 99 98.6 1.00 0.497
21 3 99 4 99 98.6 1.00 0.497
David Thompson 24 0 12 0 13 6.3 2.06 0.028 **
25 3 54 5 76 65.9 1.15 0.941
26 0 18 0 32 11.5 2.79 0.045 **
27 2 35 2 28,26 44 25.2 1.75 0.036 **
28 1 37 1 29 41 27.2 1.51 0.043 **
29 0 27 0 33 19.0 1.74 0.047 **
30 1 39 1 29 40 29.2 1.37 0.047 **
31 3 62 5 69 75.6 0.91 0.951
32 3 49 7 71 78.0 0.91 1.000
33 3 38 5 39 40.4 0.97 0.669
East Central 34 3 50 5 55 65.1 0.85 0.977
35 3 34 4 37 43.4 0.85 0.939
36 3 34 6 47 56.7 0.83 1.000
37 3 25 6 61 49.6 1.23 0.988
38 1 27 1 26 38 18.9 2.01 0.046 **

Vol 27, No 2, 2006Chronic Diseases in Canada 73
Note that the signiWcant p-values are gen-erally close to 0.05 because of the testing algorithm used. The p-value is based on the cluster size tested and not the number of cases observed. For example, Chinook 2 was tested at a cluster size of 26 cases though 31 cases were actually observed.
When tested at the cluster size of 26, the p-value is 0.036. Had a cluster size of 31 been tested, the test statistic would remain the same but the p-value would be 0.002. However, a larger cluster size of 31 could not be chosen a priori without knowing the actual number of cases in Chinook 2.
The testing algorithm determines cluster sizes based on the population distribution and not the observed cases in an sRHA.
The cluster sizes were calculated to be the minimum value necessary to achieve sig-nifi cance at the 0.05 level. For Chinook 2,
TABLE 2 (continued)Medically treated self-infl icted injury clustering results of Albertans under 18 years of age by regional health authority (RHA),
stratifi ed by age group and gender.* Nearest neighbour IDs (NNs) are provided for signifi cant sRHAs.
RHA and sub-RHA ID number i w kw NNs o λ ο /λ p
Capital 39 3 70 4 81 73.4 1.10 0.671
40 3 70 4 83 67.7 1.23 0.406
41 0 18 0 23 10.9 2.11 0.030 **
42 0 19 0 24 11.8 2.04 0.032 **
43 3 73 4 91 70.4 1.29 0.395
44 3 84 4 84 80.0 1.05 0.340
45 2 55 2 47,41 64 42.8 1.50 0.040 **
46 3 68 4 83 65.4 1.27 0.390
47 3 68 4 83 65.4 1.27 0.390
48 3 81 4 86 78.3 1.10 0.397
49 3 78 4 90 74.9 1.20 0.374
50 3 81 4 86 78.3 1.10 0.397
51 3 83 5 87 84.4 1.03 0.576
52 3 79 6 98 107.1 0.92 0.998
53 3 80 5 102 91.1 1.12 0.889
54 3 69 4 71 74.9 0.95 0.769
55 3 70 5 76 84.8 0.90 0.955
Aspen 56 3 41 4 47 43.0 1.09 0.642
57 3 74 6 91 106.1 0.86 1.000
58 3 58 5 64 70.7 0.91 0.946
59 3 53 4 61 63.3 0.96 0.916
Peace 60 3 45 8 51 62.2 0.82 0.991
61 3 44 8 47 62.2 0.76 0.994
62 3 44 5 48 53.7 0.89 0.922
63 3 47 5 48 53.7 0.89 0.838
64 3 47 5 48 53.7 0.89 0.838
Northern Lights 65 3 21 5 26 29.0 0.90 0.948
66 3 21 5 26 29.0 0.90 0.948
67 3 21 5 34 35.1 0.90 0.996
68 3 60 4 63 59.8 1.05 0.506
*ps = 0.007 – The simulation-based overall p-value associated with number of identifi ed clusters.
** p < 0.05
Data collected between April 1, 1998 and March 31, 1999.

Chronic Diseases in CanadaVol 27, No 2, 2006 74
the cluster size was calculated to be 26. Hence, all of the signifi cant clusters have p-values close to 0.05. How close the p -value is to 0.05 depends on the dis-creteness of the Poisson distribution. A signifi cant p-value needs to be interpreted with the observed to expected ratio to reXect the degree of clustering. For example, Chinook 3 (when combined with Chinook 2) and David Thompson 29 both have p = 0.047 with observed to expected ratios 1.42 and 1.74, respectively. The latter ratio would suggest more clustering than the former, even though the p-values are identical.
Additionally, the testing algorithm also does not allow a signiWcant cluster to be tested at larger cluster sizes. Capital 41 is signiWcant when tested at a cluster size determined by its population but is not tested at a cluster size determined by its population and its Wrst nearest neighbour, its second nearest neighbour, and so on.
Since provincial self-infl icted injury rates are used in the p-value calculation through λ, it is surprising that 15 of 68 sRHAs are identiWed as clusters. In 1000 simulated data sets, seven had at least 15 clusters identiWed (ps = 0.007). These simulations suggest that it is unlikely to identify 15 clusters by chance alone.
Note that when sRHAs had to be combined with neighouring sRHAs to form clusters (Chinook 2,3; Pallisar 7; David Thompson 27,28,30; East Central 38; Capital 45), they were combined with sRHAs that were clusters by themselves. In particular, no sRHAs that were insignifi cant individually were signifi cant when combined together. Such a situation can occur in practice and did occur during the simulations. However, since all of the clusters identi-fi ed in our analysis were based on combi-nations of individually identifi ed clusters (Chinook 2; Pallisar 6; David Thompson 24, 26, 29; Capital 41, 42), we examined the gender and age-adjusted rates for each sRHA (Table 3). Most of these individual clusters (Chinook 2; David Thompson 24, 26, 29; Capital 41, 42) had 95 percent con-fi dence intervals26 for adjusted rates above the provincial rate. However, the 95 per-cent confi dence interval for the adjusted
rate of Pallisar 6 did include the provincial rate. Thus, Pallisar 6 would not be iden-tifi ed as an area with signifi cantly higher rates when examining only its adjusted confi dence interval.
Discussion
We identiWed 15 clusters of sRHAs with statistically signiWcant excess self-infl icted injury cases that could not be explained
by differences in age and gender distribu-tion. Simulations based on sRHA age and gender distributions suggested that these clusters are not likely chance occurrences. The diversity in Alberta=s sRHA population sizes, as with other large regional jurisdic-tions, warranted a method that had the capability of incorporating such diverse sizes as well as the age- and gender-distri-bution differences within each sRHA.
TABLE 3Population, cases and gender-age adjusted rates of medically treated self-
infl icted injuries per 1,000 pediatric population under 18 years of age for selected Alberta sub-Regional Health Authorities (sRHAs)*
RHA and sub-RHA ID number Cases PopulationAdjusted
rate95% confi dence
interval
Chinook 2 31 16,055 1.83 1.24, 2.62 *
Pallisar 6 21 13,015 1.58 0.98, 2.43
Calgary 14 22 25,911 0.83 0.52, 1.26
16 45 36,632 1.25 0.91, 1.68
17 19 19,242 1.06 0.64, 1.66
21 16 16,855 1.08 0.62, 1.77
22 27 25,818 1.00 0.66, 1.47
23 45 35,813 1.27 0.92, 1.70
David Thompson 24 13 5,671 2.16 1.15, 3.77 *
26 32 10,989 2.95 2.01, 4.12 *
29 33 17,732 1.83 1.26, 2.58 *
Capital 39 17 14,104 1.08 0.64, 1.78
41 23 11,572 2.20 1.39, 3.32 *
42 24 12,327 2.11 1.35, 3.18 *
44 25 19,082 1.35 0.88, 2.01
45 22 16,989 1.34 0.84, 2.04
47 19 12,822 1.34 0.81, 2.14
50 27 27,912 0.95 0.63, 1.39
51 19 19,610 0.89 0.54,1.43
Aspen 58 17 12,445 1.43 0.83, 2.31
59 18 18,178 1.02 0.61, 1.62
Northern Lights 68 17 11,674 1.38 0.81, 2.24
Province (combined) 827 785,079 1.05
* The sRHAs presented have more than 15 cases or have rates signifi cantly higher than the provincial rate.Data collected between April 1, 1998 and March 31, 1999.

Vol 27, No 2, 2006Chronic Diseases in Canada 75
These clusters may, in fact, represent areas of excess self-infl icted injuries or may be false clusters that are identiWed because of differing distributions of unmeasured variables key to the development of self-infl icted injury. We believe, however, that these clusters represent areas of excess self-infl icted injuries, and special interven-tion programs should be considered for them. Any variable whose distribution dif-fers among sRHAs would provide a poten-tial explanation of observed clustering. For example, it is known that some of the sRHAs forming clusters have populations with higher proportions of aboriginals, a group that has been identiWed as hav-ing higher rates of self-infl icted injury.27
Another possibility might be differing regional distributions of income level.
There are several limitations to the analysis presented. The method has been generally applied to very small areas where several might have to be combined to identify a cluster of size 5, 10 or 15. The majority of sRHAs we dealt with were from relatively large geographic areas and the cluster detection method has a restricted ability to detect very small-sized clusters. On the other hand, the modifi ed Besag and Newell approach is appealing because it removes the need to specify the cluster size a pri-ori and enables areas to be combined for testing.
That being said, the appeal of the modi-fi ed Besag and Newell approach is dimin-ished slightly when, in analyses like ours, signifi cant sRHAs that were not clusters on their own were only signifi cant when combined with sRHAs that were. The com-bining and testing of different sRHAs pre-vents a straightforward, two-dimensional graphical presentation of self-infl icted injury clusters. The geographic areas can have relatively large populations and the cluster sizes can be larger than 100. The geographic areas were created by the pro-vincial health agency and analyses based on sRHAs could change if the data were aggregated into different geographic areas. This possibility is referred to as the “modi-fi able areal unit problem”28 and is a con-cern for any surveillance study. As such, researchers should avoid making inferenc-es about individuals based on aggregate
data.29 Here, the analysis was simpliWed by our deWnition of a case as being an indi-vidual with at least one self-infl icted injury during the study period. The cluster detec-tion method used by our study could not incorporate the possibility of multiple self-infl icted injuries per person. However, a method that could use such correlated data may identify other clusters where multiple self-infl icted injuries are occurring.
These cluster analyses are a relatively rapid and effi cient exploratory method to statistically identify areas with excess cases. The modifi ed Besag and Newell method requires minimal information on the cases and population within admin-istrative areas, permits the detection of statistically signiWcant clusters when popu-lation sizes are diverse, incorporates age- and gender-distribution differences, auto-mates the cluster size choice and provides an assessment of global clustering. While there may be several explanations for the excesses detected, this analysis can be used to answer local reports and direct fur-ther investigations into identiWed sRHAs. Further analyses could be performed with other cluster detection methods on speciWc types of injuries within the deWnition of self-infl icted injury, and on smaller admin-istrative areas, if available. Public health offi cials and health authority administra-tors could further use these results with their current knowledge of self-infl icted injury to more appropriately focus self-infl icted injury prevention interventions.
Acknowledgements
Rhonda J Rosychuk is supported by the Alberta Heritage Foundation for Medical Research (AHFMR; Edmonton, AB) as a population health investigator. Brian H Rowe is supported by the Canadian Institute of Health Research (CIHR; Ottawa, ON) as a Canada research chair. The authors would like to thank Alberta Health and Wellness for providing the data. This work was completed as a sub-study of the ED Atlas Group. Other members of the group, not listed as authors, are BR Holroyd, M Bullard, TP Klassen, D Johnson, W Craig, C Spooner, D Voaklander, N Yiannakoulias and L Svenson.
References
1. Besag J, Newell J. The detection of clusters in rare diseases. Journal of the Royal Statistical Society, Series A 91; 154:143B55.
2. Whittemore AS, Friend N, Brown BW, Holly EA. A test to detect clusters of disease. Biometrika 1987;74:631B5.
3. Openshaw S, Charlton M, Craft AW, Birch JM. Investigation of leukaemia clusters by use of a geographical analysis machine. Lancet 1988;331:272B3.
4. Turnbull BW, Iwano EJ, Burnett WS, Howe HL, Clark LC. Monitoring for clusters of disease: Applications to leukemia incidence in Upstate New York. American Journal of Epidemiology 1990;132:S136B43.
5. Waller LA, Turnbull BW. The effects of scale on tests for disease clustering. Statistics in Medicine 1993;12:1869B84.
6. Kulldorff M, Nagarwalla N. Spatial disease clusters: Detection and inference. Statistics in Medicine 1995;17:799–810.
7. Le ND, Petkau AJ, Rosychuk RJ. Surveillance of clustering near point sources.Statistics in Medicine 1996;15:727B40.
8. Shaw GM, Selvin S, Swan SH, Merrill D, Schulman J. An examination of three spatial disease clustering methodologies. International Journal of Epidemiology 1988;17:913B19.
9. Chetwynd AG, Diggle PJ, Marshall A. Investigation of spatial clustering from individually matched case-control studies. Biostatistics 2001;2:277B93.
10. Tango T. A class of test for detecting “general” and “focused” clustering of rare diseases. Statistics in Medicine 1995;14:2323–34.
11. Lawson A, Biggeri A, Böhning D, Lesaffre E, Viel J-F, Bertollini R, editors. Disease Mapping and Risk Assessment for Public Health. West Sussex, UK: John Wiley & Sons Ltd., 1999.

Chronic Diseases in CanadaVol 27, No 2, 2006 76
12. Weissman MM, Bland RC, Canino GJ, Greenwald S, Hwu HG, Joyce PR, Karam EG, Lee CK, Lellouch J, Lepine JP, Newman SC, Rubio-Stipec M, Wells JE, Wickramaratne PJ, Wittchen HU, Yeh EK. Prevalence of suicide ideation and suicide attempts in nine countries. Psychological Medicine 1999;29:9B17.
13. Dyck RJ, Bland RC, Newman SC, Orn H. Suicide attempts and psychiatric disorders in Edmonton. Acta Psychiatrica Scandinavica, Supplementum 1988;338: 64B71.
14. Thompson AH, Bland RC. Social dysfunction and mental illness in a community sample. Canadian Journal of Psychiatry 1995;40:15B20.
15. Suominen K, Henriksson M, Suokas J, Isometsa E, Ostamo A, Lonnqvist J. Mental disorders and comorbidity in attempted suicide. Acta Psychiatrica Scandinavica 1996;94:234B24.
16. Goldney RD. A global view of suicide behaviour. Emergency Medicine (Fremantle, W.A.) 2002;14:24B34.
17. Morgan HG, Burns-Cox CJ, Pocock H, Pottle S. Deliberate self-harm: clinical and socio-economic characteristics of 368 patients. British Journal of Psychiatry 1975;127:564B74.
18. Colman I, Newman SC, Schopflocher D, Bland RC, Dyck RJ. A multivariate study of predictors of repeat parasuicide. Acta Psychiatrica Scandinavica 2004;109:306–12.
19. Harris EC, Barraclough B. Excess mortality of mental disorder. British Journal of Psychiatry 1998;173:11B53.
20. Owens D, Horrocks J, House A. Fatal and non-fatal repetition of self-harm: systematic review. British Journal of Psychiatry 2002; 181:193B9.
21. Ellehoj E, Schopflocher DP. Calculating Small Area Analysis: Definition of Sub-regional Geographic Units in Alberta. Edmonton, Canada: Alberta Health and Wellness, 2003. (http://www.health.gov.ab.ca/resources/publications/pdf/GeosubRHA.pdf).
22. Ambulatory Care in Alberta Using Ambulatory Care Classification System Data. Edmonton, Canada: Alberta Health and Wellness, 2004. (http://www.health.gov.ab.ca/resources/publications/pdf/ACCSreportAug04.pdf).
23. International ClassiWcation of Diseases, 9th revision, 3rd ed, Clinical ModiWcation. Los Angeles, CA: Practice Management Information Corporation, 1989.
24. Population and Projections: Models and Methods. Edmonton, Canada: Alberta Health and Wellness, 1998. (http://www.health.gov.ab.ca/resources/publications/pdf/models.PDF).
25. Colman I, Yiannakoulias N, SchopXocher D, Svenson LW, Rosychuk RJ, Rowe BH for the ED Atlas Group. A population-based study of medically treated self-inXicted injuries. Canadian Journal of Emergency Medicine, 2004; 6:313–20.
26. Fay MP, Feuer EJ. Confidence intervals for directly standardized rates: A method based on the gamma distribution. Statistics in Medicine 1997;16:791–801.
27. Cardinal JC, SchopXocher DP, Svenson LW, Morrison KB, Laing L. First Nations in Alberta: A focus on health service use. Edmonton, Canada: Alberta Health and Wellness, 2004.
28. Openshaw S, Taylor PJ. A million of so correlation coefficients: Three experiments on the modifiable areal unit problem. In Statistical Applications in the Spatial Sciences. London: Pion, 1979.
29. Waller LA, Gotway CA. Applied Spatial Statistics for Public Health Data. New Jersey: John Wiley and Sons, 2004.

Vol 27, No 2, 2006Chronic Diseases in Canada 77
Author References
Fredrick D Ashbury, PICEPS Consultants, Inc.; Department of Health Policy, Management and Evaluation, University of Toronto, Ontario, CanadaCathy Cameron, PICEPS Consultants, Inc., Ajax, Ontario, CanadaChristine Finlan, Peterborough County - City Health Unit, Peterborough, Ontario, CanadaRobin Holmes, Robin Holmes, Project Management and Communications, Toronto, Ontario, CanadaEthylene Villareal, City of Toronto, Toronto Public Health, Toronto, Ontario, CanadaYves Décoste, Leeds Grenville and Lanark District Health Unit, Tri-Health Tobacco Team, Ontario, CanadaTanya Kulnies, Halton Region Health Department, Ontario, CanadaClaudia Swoboda-Geen, Simcoe County District Health Unit, Ontario, CanadaBoris Kralj, PICEPS Consultants, Inc.; Ontario Medical Association, Toronto, Ontario, CanadaCorrespondence: Fred Ashbury, PICEPS Consultants, Inc., 700 Finley Avenue, Unit 5, Ajax, Ontario, Canada L1S 3Z2; fax: (360) 935-9731; e-mail: [email protected]
Introduction
Smoking is a signifi cant, preventable cause of death and disease worldwide.1 Smoking has been identifi ed as a signifi cant risk fac-tor for many forms of cancer, cardiovascular diseases, respiratory diseases, diabetes mel-litus and adverse pregnancy outcomes. In 2001, approximately one out of every four people over the age of 18 living in Ontario smoked daily or occasionally.2 It is estimated that 15,969 Ontarians died in 1998 from a smoking-related disease.1
Smoking cessation is diffi cult, due to the addictive properties of nicotine, especially for longer-term smokers.3,4,5 Different meth-
ods to quit smoking have evolved over the past few decades. Some of the more success-ful strategies include nicotine replacement therapies (Athe patch@, gum, inhalers and nasal sprays), smoking cessation programs that offer counseling and teach stress man-agement, and other coping strategies includ-ing telephone counseling, prescription medi-cations to help control cravings and self-help quitting methods. Quitting Acold turkey@ (i.e., no intervention) has been described to be a successful strategy by some former smok-ers; however, only a very small percentage sustain cessation.6,7,8 A Abuddy@ to provide social support has also been a successful method for smoking cessation.9,10
Evaluations of smoking cessation contests have shown how they facilitate the link between intentions to quit and a cessation attempt.11,12 Post-contest quit rates between 10 and 35 percent have typically been demonstrated.15,20,21,22 These Aquit and win@ contests originated in the United States. In the mid-1980s, Elder and colleagues implemented a lottery to stimulate par-ticipation in the AUp in Smoke@ smoking-cessation initiatives.13 The evaluation of the lottery revealed that, of the 103 enrollees, seven percent of smokers had quit at the three-month follow-up. Nevertheless, the Pawtucket Heart Health Program adopted the quit and win contest approach and, at one month, reported that one in fi ve smok-ers had quit. Elder et al. concluded that lot-teries were effective to recruit participants into community-wide smoking cessation programs. Lai and colleagues adapted a quit and win contest for implementation in a Vietnamese community in California. Of the 89 contest participants, 84.2 percent self-reported abstinence at six months.14 The authors did not report any signifi cant predictors of this high abstinence rate, but they concluded that quit and win contests can be adapted to different cultures suc-cessfully. Of 802 participants in a smoking cessation contest promoted to two million residents of San Diego County, California, 35 percent reported they were smoke-free at two months.15 The authors reported that television promotion was the most effec-tive medium, and contest enrollment was somewhat higher for those who received
The impact of a quit smoking contest on smoking behaviour in OntarioFredrick D Ashbury, Cathy Cameron, Christine Finlan, Robin Holmes, Ethylene Villareal, Yves Décoste, Tanya Kulnies, Claudia Swoboda-Geen and Boris Kralj
Abstract
Community-based smoking cessation initiatives target large numbers of people, are highly visible and have the potential for great impact. Ontario’s Quit Smoking (2002) Contest was evaluated one year after its implementation to measure behaviour change among adult smokers participating in the contest. The registration database of 15,521 contest participants provided the basis for a random sample of 700 participants throughout Ontario who were contacted for a follow-up telephone survey. A total of 347 surveys were completed, of which 60 percent were women. Almost one third (31.4 percent) of the survey respondents reported that they had not smoked since the start of the contest. Participation in the contest also may have delayed relapse by as much as fi ve months for 31.3 percent of respondents who resumed smoking. Older respondents, men, those who had previously attempted to quit and people who said their cessation Abuddy@ was helpful were more likely to stop smoking.
Key words: cessation, contests, health behaviour, health promotion, incentives, smoking, tobacco control

Chronic Diseases in CanadaVol 27, No 2, 2006 78
a promotional fl yer compared to those who heard of the contest through other sources.
Incentive-based cessation programs have been adapted in several jurisdictions internationally. For example, in the fall of 1986, the North Karelia Project in Finland, in cooperation with Finnish national tel-evision, arranged a nation-wide, televised smoking cessation program and coincident contest, offered in eight parts. The results of a national survey16 showed that 7.7 percent of those who smoked and had watched at least one of the eight parts of the program reported they had tried to quit smoking (the national rate was 7.5 percent). At six months, just over one in fi ve persons who smoked and resided in North Karelia (22 percent) reported they had quit (17 percent nationally). In 1988, Sweden implemented a national quit and win contest that attract-ed 12, 840 participants.17 A panel of 557 randomly selected participants responded to a self-report survey at 12 months post contest. One in fi ve (21 percent) reported they had been tobacco-free for the entire year. Another nine percent had relapsed but quit again and were tobacco-free at 12 months. Sun and colleagues18 evaluated the International Quit and Win =96 con-tests of China and Finland and compared results of the two countries (a total of 25 countries participated). Of those who par-ticipated in China (N=13,848), more than one third (38 percent) had been abstinent at one year, compared to only12 percent of Finnish participants (N= 6,038 partici-pants). China=s comparatively better suc-cess at 12 months is attributed to greater measures to maintain cessation, compared to the Finnish maintenance initiatives. The authors suggested that countries with comparatively less experience in anti-smoking policy development programming will need different strategies to facilitate the implementation of smoking-cessation interventions.
Quit and win contests promote under-standing of the different methods of smok-ing cessation identifi ed above, including access to information and resources to encourage cessation, identifying a Abuddy@ and other social support mechanisms.
These considerations informed the design of Ontario=s Quit Smoking 2002 Contest (and subsequent contest planning). Smoking cessation rates were signifi cantly better among individuals who had chosen to identify a support person compared to those who did not, according to Pirie and colleagues.19 The relationship of the sup-port person to the participant (e.g., family member, friend, relative, colleague) did not infl uence the probability of quitting smok-ing. Having a support person was particu-larly important for those people who had a spouse who smoked. This fi nding high-lights the importance of contest provisions of incentives to smokers to identify a sup-port person for their quit attempt. Bains and colleagues20 reported on the evaluation of a contest in eastern Ontario. They meas-ured the smoker=s motivation to quit using the stages-of-change model. The authors determined that smokers who were in the action stage were six times more likely to have quit smoking than those in all other stages combined (although the signifi cant test result was borderline). No other socio-demographic or smoking factors were pre-dictive of cessation. A study of a quit and win contest in Quebec21 demonstrated that persons who had successfully quit rated the social support they received from their buddy to be more useful than persons who had relapsed. These Abuddies@ included non-smoking family members, friends and colleagues. Overall, 72.4 percent of respondents indicated that social support was important in their quit attempt. The majority of the smokers (60 percent) chose to quit without the assistance of any aids other than the social support of the buddy. There was no difference in the perceived utility of the social support between those who did and those who did not use phar-macological aids. A community-based cessation program in Olmsted County, Minnesota reported that 11 percent of the 304 contest participants were abstinent at one year, based on a self-report survey.22 They found that having a person enrolled in the contest to support the person who smoked, an absence of other people who smoked where they resided and educa-tional attainment beyond high school were signifi cant predictors of abstinence.
Ontario=s third annual smoking cessation contest was launched in October 2002. Paid television and radio media were used to promote the contest provincially. In addi-tion, community-based contest promotions utilized a variety of promotional strategies, including newspapers, billboards and direct mailings. Entrants registered by mail, fax and on the contest Web site. Eligibility for the contest was restricted to Ontario resi-dents, 19 years of age or older, who were daily smokers. Contest registrants were required to sign up a non-smoking buddy, pledge to quit smoking for a minimum of four weeks (October 14th to November 11th) for a chance to win a prize. Potential win-ners were drawn randomly from the list of contest registrants. The potential winners participated in an interview followed by a urine test to measure cotinine in order to confi rm their smoke-free status. In addi-tion, the registrant=s buddy was interviewed prior to the urine test. Winners also agreed to participate in the media announcement regarding the awarding of prizes. This public process discouraged false represen-tation by contest participants. The purpose of this paper is to report on the results of the contest evaluation at 12 months post-registration. The objectives of the evalua-tion were to measure the potential impact of Ontario=s 2002 Quit Smoking Contest at one year post-implementation; to measure the effectiveness of different strategies to promote the quit smoking contest; and to quantify contest participants= main smok-ing cessation concerns. .
Methods
The three evaluation objectives (program effect, promotion strategies and cessation issues) were measured using a telephone survey of randomly selected contest participants. Demographic and smok-ing behaviour data were captured on the contest registration form. The telephone survey methodology followed the design described by Dillman.23 The self-report survey was modifi ed from a pre-exist-ing tool used in earlier evaluations of the Ontario contest. The modifi cations were based on input from the contest team and included modest changes in wording, the

Vol 27, No 2, 2006Chronic Diseases in Canada 79
addition of a seven-day point prevalence measure and a question to quantify quit attempts.24 This revised survey was pilot tested among 11 randomly selected contest participants and was fi nalized with minor changes.
While many of the questions used in the survey were closed ended, some ques-tions allowed the respondent to provide answers in her/his own words, which were reviewed and coded at the time of data entry. As part of the quality control procedure, all surveys were reviewed for completeness prior to data entry. Half of the surveys were extracted and verifi ed to ensure accuracy in data entry. Analyses were conducted using SPSS version 11.5 for Windows.25
Five trained interviewers conducted the surveys during the period November 17 through December 18, 2003. Interviews took approximately ten minutes to com-plete. Interviewers were instructed to make at least four attempts on different occasions to contact a potential respond-ent identifi ed on the contact list before abandoning the attempt. Periodic follow-up was scheduled with the interviewers to ensure consistency in interview delivery and data collection.
A power analysis was done during the study planning stage to anticipate the likelihood that the contest would yield a signifi cant effect. The sample size was cal-culated based on cessation rates achieved in earlier Ontario contests and smoking cessation contests in other jurisdictions compared to Ontario=s spontaneous quit rate, which was reported to be just under ten percent in 2001.26 Quit rates from other contests were reviewed to estab-lish one for the Ontario contest. Using a conservative approach, a 17 percent quit rate was selected, which was based on Finland=s contest experience. In order to test the null hypothesis that the propor-tion positive in the population is 0.100, the criterion for signifi cance (alpha) was set at 0.01. The test was two tailedCpermitting interpretation of an effect in either direc-tion. Therefore, using STATA software, and assuming a one-sample comparison
of a proportion to hypothesized value, the estimated sample size of 321 contest par-ticipants gives 90 percent power to detect a difference between the proportion of 10 percent (spontaneous quit rate) and the alternative proportion of 17 percent.
Descriptive analysis was supplemented by a multivariate analysis using logistic regression to study the determinants of the likelihood or probability of a survey respondent quitting smoking. The depend-ent variable was set up as a binary (i.e., 0-1) dummy variable equal to 1 for those survey respondents who reported that they stopped smoking. It was set equal to 0 for those respondents who had not stopped smoking.
Based on examination of correlation coef-fi cients and existing literature, a number of potential explanatory variables for smok-ing cessation available in the survey were selected and entered simultaneously for the regression modeling exercise. In order to compare smoking cessation across gen-der, the variable Amale@ was created and set equal to 1 for male survey respondents and otherwise set equal to 0. Hence, the reference category in this case is females. For education, Ahigh school@ was the refer-ence category, and for the help provided by a buddy, Anot at all helpful@ was the refer-ence category. For those respondents who had previously attempted to quit smoking, the reference group is those who had not made previous attempts. Similarly, for those who reported receiving support from others, their reference category was not receiving support from others. Finally, the two other potential determinants of smok-ing cessation modeled, Aage@ and Ayears smoking@, are continuous variables whose impact was modeled as a linear function. Model estimation was performed with the STATA SE version 8 statistical analysis soft-ware package.
ResultsSurvey response rate
According to experiences of earlier Ontario quit smoking contest evaluations, approxi-mately 50 percent of individuals contacted to participate in the evaluation would be
expected to agree to participate in the tel-ephone survey. A random sample of 700 contest participants was extracted from the registration database to ensure the required sample size (321 respondents). The sample of 700 was generated randomly using SPSS from the complete registrant database of 15,521 persons.
Of the original sample of 700, four indi-viduals were dropped (one duplicate record, two individuals residing at the same address as two others were randomly removed, and one person was a Abuddy@). There were 200 people who could not be reached due to incorrect telephone num-bers (N=107), who were away or deceased or had no recall of participation (N=18), or, as per the protocol, who were still unreachable after four attempts (N=75). Forty-seven individuals refused to partici-pate in the survey.
A total of 348 interviews were completed and one survey was dropped from the analysis as less than 50 percent of the questions had a response, leaving a total of 347 completed interviews for analysis. The survey response rate was 58.3 percent. This calculation is based on the following formula: # completed surveys / [# completed surveys + # incom-plete surveys + # refused + # attempted and not reached ] = 348 / [348 + 1 + 47 + 200] = 0.583.
Respondent profi le
The survey respondents were not statisti-cally different from the individuals in the contest registrant database (see Table 1) in terms of age, sex, education and prior smoking behaviour (e.g., amount smoked daily and number of years smoking). Over half (60 percent) of the surveys were com-pleted by women. The mean age of survey respondents was 42 years (median = 41 years) and half (49 percent) of the sur-vey respondents had some form of post-secondary education (community college or university). With respect to smoking behaviour, 42.4 percent reported smoking more than 20 cigarettes per day prior to the contest and the mean number of years that they had smoked was 21 (median = 20 years).

Chronic Diseases in CanadaVol 27, No 2, 2006 80
The following fi ndings are presented based on the three evaluation objectives: contest effect, promotion strategies and cessation concerns/issues.
Effect of contest
Three criteria were used to measure the effect of the contest:
1. the percentage of evaluation par-ticipants who self-reported they had stopped smoking;
2. the amount of time lapsed between smoking cessation and relapse; and,
3. the percentage of evaluation par-ticipants who self-reported they were smoking less than prior to the start of the contest.
Almost one third (31.4%; N=109; 95% CI = 0.2650 B 0.3632) of the study par-ticipants reported they had not smoked since the start of the contest. This suc-cess rate is signifi cantly higher than the 17 percent quit rate reported by Finland=s contest experience (p = 0.00001). Of the 238 survey respondents who smoked since the contest started, eight percent said they were unable to quit during the contest. Another 9.7 percent said they had resumed smoking, but were not able to recall when they started smoking again. Of those who could recall when they resumed smoking (N=196), 12.8 percent resumed smok-ing in October 2002, 20 percent resumed smoking in November 2002, another 20 percent resumed smoking in December 2002, 15.9 percent resumed smoking in January 2003, and almost one third (31.3 percent) resumed smoking in February 2003 or later.
We compared those survey respondents who quit smoking and those who contin-ued to smoke according to sex, age, educa-tion, amount smoked and length of time smoked. We found no statistically signifi -cant differences across any of these strata.
Both those who stopped smoking and those who continued to smoke or relapsed were asked to describe the methods they used to try to stop smoking. Sixty-one per-cent of those who had continued to smoke or relapse had made at least one serious quit attempt since the end of the contest period. Non-intervention methods (e.g., quitting cold turkey or no method used) and intervention methods (e.g., nicotine patch or gum, anti-depressants) were reported. The data suggest that those who quit were somewhat more likely to use a non-intervention approach (e.g., cold tur-key), compared to those who continued to smoke or relapsed and attempted to quit (51.4 vs. 40 percent). In comparing the two groups according to intervention strategies, those who continued to smoke or relapse reported using the patch to try to quit more often than those who were successful in quitting. This may suggest that those still struggling to quit are more likely to have perceived a need to try direct
TABLE 1Comparison of Ontario 2002 Quit Smoking Contest registrants and
survey respondents at 12 months post-registration by sex, age, education,and tobacco consumption and history
Characteristic
Registrants(N=14,824)
%
Survey respondents
(N=347)% p-value
Sex 0.2807
Females 57.0 59.9
Males 43.0 40.1
Age 0.0570
< 30 24.1 18.4
30 B 39 26.2 26.8
40 B 49 27.4 31.2
50 B 59 13.2 16.0
60 B 69 3.9 2.3
70 + 5.2 5.2
Education 0.6100
High school 48.4 51.0
Community college 35.7 33.4
University 15.9 15.6
Number of cigarettes smoked per day 0.1020
1 – 5 6.8 3.5
6 – 10 15.5 16.7
11 – 20 37.0 37.5
20 + 40.7 42.4
Years smoking 0.3680
< 5 5.6 4.3
5 B 10 20.1 18.5
11 B 15 14.7 12.1
16 B 20 17.0 17.3
21 B 25 13.3 15.8
26 B 30 13.0 13.0
31 B 35 6.8 9.2
> 35 9.5 9.8

Vol 27, No 2, 2006Chronic Diseases in Canada 81
interventions to help them stop smoking. Another possible explanation for the dif-ference in types of techniques employed by quitters and continuers is that the con-tinuing group may be heavier smokers.
Of the participants who were still smoking at the time of the interview, 49.8 percent (N=100) reported they were smoking fewer cigarettes, compared to the amount smoked prior to the contest. Another 43.8 percent (N=88) said they were smoking the same amount as they had smoked before participating in the contest, and only 13 people (6.5 percent) reported they were smoking more cigarettes than before the contest.
The survey also measured the extent to which those who continued to smoke were contemplating a quit attempt. Nearly two thirds (65 percent) said they planned to quit smoking in the next 30 days and 92 percent indicated that they planned to quit smoking within the following six months.
Promotional strategies
Ontario=s Quit Smoking 2002 Contest was promoted through a wide variety of media, including television, newspapers, radio, brochures, posters and other strate-gies used by public health professionals at the community level throughout Ontario. Study participants were asked, without disclosing the types of strategies used by the contest, to recall which promotional method was most important in motivat-ing them to enter the contest. Television, radio and newspapers were each equally effective (14 percent of respondents, respectively) as strategies to recruit people to participate in the contest. These pro-motional strategies were followed closely by Aword-of-mouth/friends@ (13 percent), fl yers (9.2 percent) and the Internet (9.2 percent). About six percent of the respond-ents could not remember any specifi c pro-motional method.
Interestingly, more than half of the respondents (53.7 percent) said that the opportunity to win a prize by entering the contest was not at all or not very impor-tant in their decision to enter the contest.
Only about one out of fi ve (21 percent) of the study participants reported that the prize was important or very important in motivating them to enter the contest. In fact, nearly two thirds (64.3 percent) of respondents reported that they didn=t know which prize was most appealing (the list of potential prizes was not read aloud to respondents during the interview). Of the prizes available, about one in fi ve (21.6 percent) said the car was the most appeal-ing. There was no signifi cant relationship between outcome (i.e., smoking cessation) and the importance or interest in the prize offered (chi square(5)=4.63, p = 0.463).
Cessation issues
Two thirds of the contest participants continued to smoke or relapsed after con-test registration. Respondents were asked which factors infl uenced them to continue to smoke or resume smoking following the contest. The main reason cited for smok-ing was Astressful situations@, according to one third of the respondents. Other fac-tors included fi nding themselves in social situations where others were smoking (14 percent), the impact of withdrawal symp-toms (12 percent), and for 6.4 percent of respondents, drinking alcohol was accom-
panied by smoking as part of their behav-ioural pattern.
All contest participants were required to sign up a buddy. Importantly, half (52 per-cent) said the buddy was helpful or very helpful in their efforts to stop smoking. In addition, there was no statistically sig-nifi cant difference in the perceived help-fulness of a buddy to stop smoking when comparing those who had quit with those who continued to smoke or relapsed.
Contest participants were also asked to describe any sources of social support they received in their efforts to stop smoking. Respondents could provide more than one answer. Nearly one quarter (23 percent) of the respondents said they did not receive any support from others. In contrast, 61 percent reported that family members provided support to quit smoking, and more than one third (38 percent) said that friends and co-workers supported them. About fi ve percent of the study partici-pants said health professionals provided them with support to quit smoking.
It is worth noting that 63 percent of the study participants reported that they sug-
TABLE 2Likelihood of quitting smoking of Ontario 2002 Quit Smoking Contest survey
respondents by age, sex, quitting history and perceivedbuddy helpfulness – Logistic regression model
Odds ratioRobust standard
error p-value
Age 1.0191** 0.0106 0.075
Sex [Female]:
Male 1.5374** 0.2426 0.076
Tried quitting before [No]:
Yes 2.0857** 0.4223 0.082
Helpful buddy [Not at all helpful]:
Not very helpful 0.7889 0.4873 0.627
Somewhat helpful 1.4017 0.3979 0.396
Helpful 2.4099* 0.3810 0.021
Very helpful 1.2775 0.3449 0.484
Log likelihood - 207.54
Sample size 347
* Signifi cant at 5% level.
** Signifi cant at 10% level.
The comparison group is shown in italics and square parentheses [ ].

Chronic Diseases in CanadaVol 27, No 2, 2006 82
gested entering the contest to other smok-ers. More than 9 out of 10 respondents (91 percent) said they would recommend this same type of contest to other smokers who are trying to stop smoking.
We learned from additional feedback made by study participants that they would prefer to have more follow-up, includ-ing additional information about avail-able support, and the results of this and other cessation contests and programs. Communication with contest participants, therefore, is regarded highly. Apparently, more frequent communications and pro-gram content would add value as support to the participants.
Table 2 presents the results of the multivar-iate logistic regression model of the proba-bility of quitting smoking. As noted earlier, the model included a number of potential explanatory variables collected by the sur-vey, but in this table we present results for only those explanatory variables with p < 0.10. The likelihood of stopping smok-ing is positively related to the individual=s age; older individuals are more likely to stop smoking than are younger ones (odds ratio=1.019, p = 0.075). In addition, males are more likely than females to stop smoking (odds ratio=1.537, p = 0.076). Individuals who previously attempted to quit smoking were more likely to stop smoking (odds ratio=2.086, p = 0.082). Study participants who reported that their buddy was Ahelpful@ were more likely to stop smoking, relative to those whose buddy was considered Anot at all help-ful@ (odds ratio=2.410, p = 0.021). Given the statistical signifi cance levels of these results, some may regard these fi ndings as only being suggestive. Other variables, such as education level and the length of time smoking, had no statistically signifi -cant impact on the likelihood of quitting smoking.
Discussion
Nearly one out of three contest partici-pants who responded to the survey (31.4 percent) reported they had stopped smok-ing since the contest began and an addi-tional 35 (14.8 percent) said they had since
stopped smoking. Assuming the quit rate is the effect of the contest, the potential impact of this contest for Ontario=s smok-ing population can be calculated. This is only an assumption and other assump-tions are possible. For example, some may argue that attributing the full amount of the quit rate to the contest is excessive due to factors such Aselection@ or Avolunteer@ effects among contest registrants, which may bias the results. A more conservative approach, and the one we will adopt, is to use the lower bounds of the 95 per-cent confi dence interval of the quit rate, 26.5 percent, rather than the 31.4 percent point estimate. The more than 15,000 par-ticipants who registered for the contest in 2002 represent about one percent of adult smokers in Ontario. By combining the reg-istration rate with the lower bounds of the quit rate, it can be extrapolated that 1 in 377 adult smokers were motivated to quit because of the contest.
Nearly half of the people surveyed report-ed that the possibility of winning a prize did not infl uence their decision to enter the contest. Nevertheless, the contest itself represents an important opportunity for smokers who were contemplating quitting. The participants were motivated to enter the contest to quit smoking and improve their health. Winning a prize may be sec-ondary to these motivations.
While the smoking cessation rate of 31.4 percent is within the range of quit rates
reported in published studies evaluat-ing incentive-based cessation programs, a large proportion of respondents were not successful in quitting. This under-scores the challenges of smoking cessation among even highly motivated individuals, as Bains and colleagues reported in their evaluation of a more geographically lim-ited quit smoking contest.18
The contest may have contributed to a delay in smoking relapse until February 2003 for nearly one third of the contest participants who had resumed smoking, although we were unable to fi nd any com-parable data on the rate at which quitters relapse in the absence of a smoking cessa-tion program. This period of delay, approx-imately four months from the start of the contest, may be an important window of opportunity, in which follow-up rein-forcement strategies could be introduced to sustain a quit attempt. However, it is noteworthy that a slightly higher propor-tion of those who continued to smoke or who relapsed, reported they smoked more than 20 cigarettes per day (although this is not statistically signifi cant). Perhaps this group comprises a higher proportion of people who could be considered heavily addicted to tobacco.
More than four out of ten people surveyed who had continued to smoke or who relapsed during the contest reported they smoked fewer cigarettes after the contest than before it. Other studies of incentive
TABLE 3Comparison of respondents to Canadian Tobacco Use Monitoring Survey
(CTUMS) and Ontario 2002 Quit Smoking Contest survey respondents,aged 25 years and over, by sex and age
Characteristic
CTUMS (N=1,536,580)
%
Survey respondents (N=310)
% p-value
Sex 0.00001
Females 46.1 59.7
Males 53.9 40.3
(N=1,744,930)%
(N=345)%
Age (years) 0.1040
20 B 24 13.1 10.1
25 B 44 52.4 50.7
45 + 34.5 39.1

Vol 27, No 2, 2006Chronic Diseases in Canada 83
smoking cessation programs have demon-strated a similar reduction. A controlled study of a quit and win contest in Kentucky reported a statistically signifi cant differ-ence in the reduction of the number of cigarettes smoked in favour of participants in the treatment group.28
The results of this study are based on responses to a self-report survey. Biochemical verifi cation of smoking ces-sation was not possible due to resource limitations. It is worth noting, however, that an expert work group formed by The Society for Research in Nicotine and Tobacco recently reported that biochemi-cal validation is not necessary in the case of interventions for general populations of adult smokers.29 In addition, population surveys have shown that self-report smok-ing status is generally accurate among smokers.30,31,32,33
It is important to note that the study partic-ipants in the evaluation of the Ontario Quit Smoking 2002 Contest were not incented (fi nancially or otherwise) to complete a survey. Also, contest prizes were awarded and communicated to participants sev-eral months prior to the interview, and, as such, should not impact participants= responses. There is no evidence to sug-gest an adjustment to the self-report rate is required, when measuring smoking cessa-tion in incentive-based programs. If there is a perception that an adjustment to self-reported quit rates is necessary for evalu-ations of smoking contests, no published studies were found to give direction in the amount of adjustment required.
The evaluation design did not include a formal control group due to resource limi-tations. Documents on surveys of smokers conducted in Ontario were used to compare the respondent sample to the samples in these surveys (e.g., Canadian Tobacco Use Monitoring Survey B [CTUMS], Canadian Community Health Survey [CCHS] and the Ontario Tobacco Research Unit [OTRU] monitoring reports). Some of these data were not broken down by province. In addition, many of the demographic and smoking behaviour variables were defi ned differently than those variables collected
in the registration database (e.g., previous quit attempts, number of cigarettes smoked per day) and as such, opportunities for comparison were limited. It was possible to compare the respondents with data from the CTUMS27 with respect to age and sex distribution. As Table 3 shows, the sex distribution of participants in the evalua-tion was signifi cantly different than that of the general population of Ontario smokers, as reported in the CTUMS. However, there was no signifi cant difference with respect to age between respondents in either sur-vey. These fi ndings are consistent with the evaluation of other quit smoking contests.
Finally, the timing of a quit smoking con-test could be an important factor infl uenc-ing smoking cessation. Contest partici-pants suggested that contests offered late in a calendar year could be infl uenced by the fact that this time of year is particularly stressful (preparing for the holiday sea-son), resulting in higher rates of relapse or delayed cessation. Also, it is possible that the high percentage of respondents who Aplanned@ to quit in the near future may be the result of the timing of the evaluation. People participated in this evaluation dur-ing late November through mid-December. Perhaps they were Apredicting@ their reso-lutions to stop smoking to coincide with the onset of a new year.
Conclusions
The Ontario Quit Smoking 2002 Contest was successful in helping a signifi cant proportion of smokers quit and remain abstinent at 12 months. In addition, the research revealed the contest may have contributed to delaying relapse by sev-eral months in individuals who resumed smoking. This was an unexpected subset of smokers who reported heavier daily smoking. Experience and data suggest this group requires more investigation to identify better strategies that would reinforce cessation. Overall, contests that reinforce multiple strategies and aids for smoking cessation, such as they exist in Ontario, can attract a large number of par-ticipants and are an effective public and community health intervention.
Acknowledgements
The authors wish to thank Joan Burton, Industrial Accident Prevention Association. In addition, we wish to acknowledge: Paul MacDonald, Department of Health Studies and Gerontology, University of Waterloo, for his guidance and documentation on smoking cessation rates in self-report surveys; Roberta Ferrence, Director, The Ontario Tobacco Research Unit, University of Toronto, particularly for direction on smoking cessation questionnaire resourc-es and related documents; Ellen J Hahn, Fellow, Robert Wood Johnson Foundation Developing Leadership in Reducing Substance Abuse, and Mary Kay Rayens, both of the College of Nursing University of Kentucky, for sharing reports and results from the Kentucky smoking cessa-tion contest, ATesting the Effect of a Multi-Component, Statewide Tobacco Cessation Contest@. Finally, we would also like to thank the women and men who kindly gave of their time to participate in the evaluation of the contest.
References
1. Makomaski Illing EM, Kaiserman MJ. Mortality attributable to tobacco use in Canada and its regions, 1998. Can J Public Health 2004;95(1):38–44.
2. Ontario Tobacco Research Unit. Indicators of Progress. [Special Reports: Monitoring the Ontario Tobacco Strategy, 2001/2002 (Vol. 8, Pt 3)]. Toronto, ON: Ontario Tobacco Research Unit.
3. Seersholm N, Nielsen NH, Tonnesen P. Self-reported smoking habits, biochemical markers, and nicotine dependence in a sample of the Danish population. J R Soc Health 1999;119(2):92–6.
4. John U, Meyer C, Hapke U, Rumpf HJ, Schumann A. Nicotine dependence, quit attempts, and quitting among smokers in a regional population sample from a country with a high prevalence of tobacco smoking. Prev Med. 2004 Mar;38(3):350–8.
5. Kalant H. Nicotine as an addictive substance. In R Ferrence, J Slade, R Room and M Pope (eds.), Nicotine and Public Health. Washington DC: American Public Health Association, 2000:117–34.

Chronic Diseases in CanadaVol 27, No 2, 2006 84
6. Hughes JR, Gulliver SB, Fenwick JW, Valliere WA, Cruser K, Pepper S, Shea P, Solomon LJ, Flynn BS. Smoking cessation among self-quitters. Health Psychol 1992; 11: 331–4
7. Cohen S, Lichtenstein E, Prochaska JO, Rossi JS, Gritz ER, Carr CR, Orleans CT, Schoenbach VJ, Biener L, Abrams D, et al. Debunking myths about self-quitting. Evidence from 10 prospective studies of persons who attempt to quit smoking by themselves. Am Psychol 1989;44(11):1355–65
8. Fiore MC, Novotny TE, Pierce JP, Giovino GA, Hatziandreu EJ, Newcomb PA, Surawicz TS, Davis RM. Methods used to quit smoking in the United States. JAMA 1990;263:2760–5
9. May S, West R. Do social support interventions (“buddy systems”) aid smoking cessation? A review. Tob Control 2000;9(4):415–22.
10. West R, Edwards M, Hajek P. A randomized controlled trial of a “buddy” systems to improve success at giving up smoking in general practice. Addiction 1998;93(7):1007–11.
11. Chapman S, Smith W, Mowbray G, Hugo C, Egger G. Quit and win smoking cessation contests: how should effectiveness be evaluated? Prev Med. 1993;22(3):423–32
12. Leinweber CE, Macdonald JM, Campbell HS. Community smoking cessation con- tests: an effective public health strategy. Can J Public Health 1994;85(2):95–8
13. Elder JP, McGraw SA, Rodrigues A, Lasater TM, Ferreira A, Kendall L, Peterson G, Carleton RA. Evaluation of two community-wide smoking cessation contests. Prev Med 1987;16(2):221–34.
14. Lai KQ, McPhee SJ, Jenkins CN, Wong C. Applying the quit & win contest model in the Vietnamese community in Santa Clara county. Tob Control 2000;9(Suppl 2):II56–9.
15. Elder JP, Campbell NR, Mielchen SD, Hovell MF, Litrownik AJ. Implementation and evaluation of a community-sponsored smoking cessation contest. Am J Health Promot 1991;5(3):200–7.
16. Korhonen HJ, Niemensivu H, Piha T, Koskela K, Wiio J, Johnson CA, Puska P. National TV smoking cessation program and contest in Finland. Prev Med 1992;21(1):74–87
17. Tillgren P, Haglund BJ, Ainetdin T, Holm LE. Who is a successful quitter? One-year follow-up of a National Tobacco Quit and Win Contest in Sweden. Scand J Soc Med 1995;23(3):193–201
18. Sun S, Korhonen T, Uutela A, Korhonen HJ, Puska P, Jun Y, Chonghua Y, Zeyu G, Yonghao W, Wenqing X. International Quit and Win 1996: comparative evaluation study in China and Finland. Tobacco Control 2000;9(3):303–9
19. Pirie PL, Rooney BL, Pechacek TF, Lando HA, Schmid LA. Incorporating social support into a community-wide smoking-cessation contest. Addict Behav 1997;22(1):131–7
20. Bains N, Pickett W, Laundry B, Mecredy D. Predictors of smoking cessation in an incentive-based community intervention. Chronic Diseases in Canada 2000; 21(2):54–61.
21. Gomez-Zamudio M, Renaud L, Labrie L, Masse R, Pineau G, Gagnon L. Role of pharmacological aids and social supports in smoking cessation associated with Quebec’s 2000 Quit and Win campaign. Prev Med 2004;38(5):662–7.
22. Croghan IT, O’Hara MR, Schroeder DR, Patten CA, Croghan GA, Hays JT, Dale LC, Bowen D, Kottke T, Hurt RD. A community-wide smoking cessation program: Quit and Win 1998 in Olmsted county. Prev Med 2001;33(4):229–38
23. Dillman DA. Mail and telephone surveys. New York: John Wiley and Sons, 1978.
24. Ontario Tobacco Research Unit. Available from: http://www.otru.org/
25. Statistical Package for the Social Sciences (SPSS), version 11.5 for Windows, SPSS Inc., 1989–2002.
26. Statistics Canada, Canadian Community Health Survey, 2000/01. Available from: http://www.statcan.ca/english/freepub/ 82-577-XIE/00203/rtables.htm
27. Canadian Tobacco Use Monitoring Survey, February-December 2002. Available from: http://www.hc-sc.gc.ca/hecs-sesc/tobacco/research/ctums/index.html
28. Hahn EJ, Rayens MK, Warnick TA. A controlled trial of quit and win in a tobacco growing state. Final Report. (manuscript under review).
29. Hughes JR, Keely JP, Niaura RS, Ossip-Klein DJ, Richmond RL, Swan GE. Measures of abstinence in clinical trials: issues and recommendations. Nicotine Tob Res 2003;5(4):603.
30. Caraballo RS, Giovino GA, Pechacek TF, Mowery PD. Factors associated with discrepancies between self-reports on cigarette smoking and measured serum cotinine levels among persons aged 17 years or older: Third National Health and Nutrition Examination Survey, 1988-1994. Am J Epidemiol 2001;153(8):807–14
31. Wagenknecht LE, Burke GL, Perkins LL, Haley NJ, Friedman GD. Misclassification of smoking status in the CARDIA study: a comparison of self-report with serum cotinine levels. Am J Public Health 1992;82(1):33–6.
32. Velicer WF, Prochaska JO, Rossi JS, Snow MG. Assessing outcome in smoking cessation studies. Psychol Bull 1992;111(1):23–41
33. Luepker RV, Pallonen UE, Murray DM, Pirie PL.Validity of telephone surveys in assessing cigarette smoking in young adults. Am J Public Health 1989;79(2):202–4

Vol 27, No 2, 2006Chronic Diseases in Canada 85
Trends in mortality from ischemic heart disease in Canada, 1986–2000
Abstract
This study examined trends in ischemic heart disease (IHD) mortality rates in Canada from 1986 to 2000, including analyses at the county level. The study population comprised Canadians aged 35 and over. Age-standardized mortality rates (ASMRs) were computed. Linear regression and Poisson regression were used to calculate average annual percent-age change (AAPC) by age, sex, county and province. A substantial decrease in mortality rates was observed in those aged 35 and over for both sexes; the AAPC indicated a decline of 3.44 percent for males and 3.42 percent for females. The ASMRs were plotted for three time periods; the rates increased with each successive age group and decreased with each consecutive time period for both sexes. A signifi cant decline in the IHD mortality rate was found in 47.2 percent and 46.9 percent of the counties among males and females, respec-tively; those counties had a statistically signifi cant lower prevalence of daily smoking in both genders, and obese in females only. Only two counties showed a signifi cant increase in the ASMRs of IHD in males and females, respectively. Enhanced prevention and control strategies should be considered to address IHD in countries where more modest decreases (or no decrease at all) in IHD mortality have been observed.
Jinfu Hu, Chris Waters, Ann-Marie Ugnat, Jonathan Horne, Ian Szuto, Marie Desmeules and Howard Morrison
Key words: Canada, ischemic heart disease, mortality
Author References
Jinfu Hu, Chris Waters, Ann-Marie Ugnat, Jonathan Horne, Ian Szuto, Marie Desmeules and Howard Morrison, Centre for Chronic Disease Prevention and Control, Public Health Agency of Canada Correspondence: Jinfu Hu, Centre for Chronic Disease Prevention and Control, Public Health Agency of Canada, AL 6701A, Ottawa, Ontario, Canada K1A 0B7; fax: (613) 941-2623; e-mail: [email protected]
Introduction
Cardiovascular disease is the leading cause of death in Canada, accounting for almost one third of all deaths each year. In 1982, 60 percent of the deaths attributed to car-diovascular disease (CVD) were caused by ischemic heart disease (IHD),1 by 2003, this had fallen to 55 percent.2 Coronary heart disease (CHD) mortality rates have decreased in many countries,3–6 including Canada.3,4 However, the mortality from IHD in Canadian counties has not been reported yet.
The purpose of this paper is to examine trends in the Canadian mortality rates of IHD from 1986 to 2000 and to address the decline in mortality at the national, pro-vincial or territorial and county (census division) levels.
Methods
Data on mortality from IHD (ICD-9 codes 410–414 and ICD-10 in 2000) were provided by Statistics Canada from annual Canadian mortality fi les.7 The data contained infor-mation on age, sex, and province and county of residence for the entire study period (1986–2000). Population counts were obtained from the Canadian Census.8 Age-standardized mortality rates (ASMRs) were computed using the 1991 Canadian population as the standard.
The study population included Canadians aged 35 and over. ASMRs were computed at three levels of geographic aggrega-tion: Canada; the provinces and ter-ritories (Newfoundland and Labrador, Prince Edward Island, Nova Scotia, New Brunswick, Quebec, Ontario, Manitoba, Saskatchewan, Alberta, British Columbia;
Yukon Territory, Northwest Territories); and counties. We compared ASMRs cal-culated over a fi ve-year period by sex for 1986–1990, 1991–1995 and 1996–2000.
Linear regression was used to determine the average annual percentage change (AAPC) in mortality rates by age, sex and province. Poisson regression was used to calculate the AAPC by sex and county. The AAPC values were computed by fi tting a model that assumed a constant rate of change in the ASMRs. That is, a linear or Poisson model was applied to the ASMRs after logarithmic transformation. Because of the generally small number of deaths in each county, Poisson regression mod-els (the log of the age-specifi c rates) were used. Ninety-fi ve percent confi dence inter-vals (CIs) for the AAPC were calculated by province only. Trends were investigated by ten-year age groups (35–44, 45–54, 55–64, 65–74, 75–84, 85+) and for the summary grouping (35+).
The Canadian Community Health Survey, Cycle 1.1 (CCHS in 2000–01) data were used to examine the difference between the AAPC and risk factors.9 The present study was restricted to individuals aged over 35. The counties were categorized based on the quintile cutoff point defi ned by AAPC in IHD mortality. The prevalence of each factor among counties was aver-aged in each AAPC category.
For further analysis of risk factors in coun-ties, the fi rst through the fourth quintiles were grouped as group 1; the fi fth quin-tile was group 2. P-values for differences between the two groups were calculated using CCHS bootstrap weights. A nor-

Chronic Diseases in CanadaVol 27, No 2, 2006 86
FIGURE 1Age-standardized* mortality rates (per 100,000)
of ischemic heart disease by sex(Canada, 1986–2000)
TABLE 1Average annual percentage change in age-standardized mortality rates of
ischemic heart disease by sex and province, ages 35 and over(Canada, 1986–2000)
Males Females
Province/territory
Mortality rate per 100,000 AAPC 95% CI
Mortality
rate per
100,000 AAPC 95% CI
Newfoundland & Labrador 531.25 -2.37 -3.20, -1.53 292.15 -2.70 -3.25, -2.00
Prince Edward Island 506.26 -3.53 -4.96, -2.08 245.59 -2.45 -3.74, -1.13
Nova Scotia 466.55 -3.70 -4.33, -3.07 224.22 -4.04 -4.52, -3.48
New Brunswick 436.07 -4.14 -4.92, -3.36 225.01 -3.83 -4.39, -3.34
Quebec 455.87 -3.56 -3.95, -3.16 230.60 -3.16 -3.99, -2.92
Ontario 458.9 -3.54 -3.94, -3.14 244.76 -3.48 -3.73, -3.19
Manitoba 440.53 -2.34 -2.73, -1.96 221.42 -2.63 -3.31, -1.90
Saskatchewan 405.53 -3.03 -3.63, -2.41 192.09 -3.47 -3.84, -2.77
Alberta 405.72 -2.68 -3.12, -2.24 208.44 -2.41 -2.65, -1.64
British Columbia 365.54 -3.66 -3.99, -3.33 183.62 -3.95 -4.23, -3.50
Yukon Territory 400.89 -8.14 -14.36, -1.48 183.76 -3.99 -8.56, 1.90
Northwest Territories 243.48 -0.65 -4.08, -2.90 92.93 0.76 -6.30, 8.28
Canada 438.99 -3.44 -3.74, -3.10 226.81 -3.42 -3.66, -3.18
AAPC = average annual percentage change.CI = confi dence interval.
mal distribution one-tailed test for higher proportions of risk factors in group 2 was performed. Three risk factors (i.e., daily smoking, obesity and low income) for IHD were selected from other Canadian stud-ies. All statistical analyses were performed using SAS software.
Results
Figure 1 shows a substantial decrease in annual Canadian mortality rates of IHD among men and women aged 35 and over. The ASMRs fell from 581.1 per 100,000 in 1986 to 345.9 per 100,000 in 2000 among males, and from 299.3 per 100,000 in 1986 to 177.4 per 100, 000 in 2000 among females.
For the entire 1986-2000 period, the overall ASMRs of IHD for Canadians aged 35 and over were 439.0 per 100,000 among males and 226.8 per 100,000 among females (Table 1). The highest provincial rates dur-ing this period were found among men and women in Newfoundland and Labrador (531.3 per 100,000 and 292.2 per 100,000, respectively). The AAPC indicated a sig-nifi cant national decline of 3.4 percent for both genders between 1986 and 2000. On
average, the signifi cant decreases in rates were greater than 3.4 percent per year
among men in Prince Edward Island, Nova Scotia, New Brunswick, Quebec, Ontario, British Columbia and Yukon Territories, and among women in Nova Scotia, New Brunswick, Ontario, Saskatchewan, British Columbia and Yukon Territories.
The IHD mortality rates within ten-year age groups were plotted for three time periods within the complete study period. For both sexes, the ASMRs increased with each successive age group. Mortality increased sharply for the 75-and-over age groups and the highest rates were observed among those aged 85 and over. On the other hand, the rates decreased with each consecutive time period. For each age group, the low-est ASMRs occurred in the most recent time period (1996–2000) among both men and women.
Table 2 presents the ASMRs and AAPC by sex and age for the complete study period (1986–2000). The ASMRs of IHD sig-nifi cantly increased with each age group among both sexes, particularly for those aged 75 and older. Once again, the high-

Vol 27, No 2, 2006Chronic Diseases in Canada 87
FIGURE 2Age-standardized mortality rates (per 100,000) of
ischemic heart disease by age, sex and fi ve-year period(Canada, 1986–2000)
Mor
talit
y ra
tes p
er 1
00,0
00
5000
4000
3000
2000
1000
0
Age groups
35-44 45-54 55-64 65-74 75-84 85+
86-90 Males
86-90 Females
96-00 Males
96-00 Females
91-95 Males
91-95 Females
TABLE 2Average annual percentage change in age-standardized
mortality rates of ischemic heart disease bysex and age (Canada, 1986–2000)
Age groups Males Female
Mortality rate per 100,000 AAPC
Mortality rate per 100,000 AAPC
35-44 20.73 -4.59* 3.94 -1.26
45-54 90.28 -5.07* 19.06 -4.58*
55-64 302.84 -4.91* 88.66 -4.91*
65-74 783.88 -4.39* 319.15 -8.81*
75-84 1,918.92 -2.98* 1,081.31 -3.65*
85+ 4,290.01 -1.68* 3,441.88 -2.04*
35+ 438.98 -3.44* 226.81 -3.42*
AAPC = average annual percentage change.
* p ≤ 0.01.
est rates were observed among those aged 85 and over (4,290.0 per 100,000 for males and 3,441.9 per 100, 000 for females). The AAPC showed a signifi cant decline of 4.4 percent or more for males aged 35 to 74 and of 4.5 percent or more for females aged 45 to 74. In the 85-and-over age group, the average annual decreases were only 1.7 percent and 2.0 percent among men and women, respectively.
Figure 3 and 4 (not included here for tech-nical reasons, but available by request) show maps of average annual percent-age change in age-standardized mortality rates of IHD among males and females, aged 35 and over, by counties, between 1986–2000. The AAPC was categorized into three levels: the less-than-the-national AAPC (-15.149, -3.443); the less-than-0-and-larger-or-equal-to-the-national AAPC (-3.442, 0.000); and larger than 0 (0.001, 11.844) for males, and correspondingly for females (-33.884, -3.419), (-3.418, 0.000) and (0.001, 17.561). Each of the three cat-egories was sub-divided into two sub-cat-egories—signifi cant and not signifi cant—based on decreasing or increasing levels (i.e., p ≤ 0.05). We used the 1996 cen-sus division boundaries.10 The AAPC for four counties in females, Stikine Region, BC (5,957), Baffi n Region, NWT (6,104), Keewatin Region, NWT (6,105), Kitikmeot
Region, NWT (6,108) were not included in Figures 3 and 4 because of insuffi cient data.
For males, 47.2 percent of counties sig-nifi cantly decreased in IHD mortality relative to the national AAPC. The AAPC showed a signifi cant decline of 6.5 per-cent or more in the following counties: Les Mitis, QC (2,411), L’île-d’Orleans, QC (2,420), La Haute-cote-Nord, QC (2,495), Skeena-Queen Charlotte Regional Di, BC (5,947), Yukon, YK (6,001), and Keewatin Region, NWT (6,105). There were 50.7
percent of counties whose AAPC did not reach the national level. Two percent of counties showed increased IHD mortality rates. In particular, the IHD mortality rate of Division No. 16, AB (4,816) increased signifi cantly.
For females, 46.9 percent of counties showed a signifi cant decrease in IHD mor-tality relative to national AAPC. The AAPC indicated a signifi cant decline of 6.5 per-cent or more in La Matapedia, QC (2,407), Matane, QC (2,408), Matawinie, QC (2,462) and Division No. 10, MB (4,610). Forty-six (nine percent) of counties did not reach to the national AAPC and 4.1 percent of counties increased in IHD mortality. Specifi cally, one county, Division No.23, MB (4,623), signifi cantly increased in IHD mortalit. Note that the majority of coun-ties with the largest decreases in IHD rates (occurring in both sexes) were in Quebec. Detailed AAPC and age-standardized mor-tality rates in IHD by sex and county are obtainable by writing to the corresponding author of this article.
Table 3 shows the average prevalence of three characteristics/risk factors of counties, according to the AAPC distribution by quin-tile among males and females, respectively. For males, counties with a signifi cant decline of IHD rates had a lower prevalence of daily smoking (p < 0.0005). For females, counties with signifi cant decreases in IHD rates had a lower prevalence of obesity (p = 0.0001) and daily smoking (p = 0.001). No difference in

Chronic Diseases in CanadaVol 27, No 2, 2006 88
TABLE 3Average prevalence of county characteristics/risk factors based on AAPC
in age-standardized mortality of IHD by sex(Canada, 1986–2000)
Quintiles (AAPC)
Risk factor/characteristic
I (decreasing)
II III IV V(increasing) p-value1
Males≤ -4.0708
(N=56)
> -4.0708 ≤ -3.735
(N=57)
> -3.735 ≤ -2.949
(N=58)
> -2.949 ≤-1.964
(N=57)
> -1.964
(N=57)
Daily smoking (%) 23.7 22.0 23.3 24.7 26.7 < 0.0005
Obesity (%) 17.3 16.9 16.5 17.8 20.9 0.44
Low income rate (%) 6.7 8.9 9.1 7.8 9.2 0.26
Females≤ -4.581
(N=56)> -4.581 ≤ -3.66
(N=56)> -3.66 ≤ -2.97
(N=56)> -2.97 ≤ -2.111
(N=57)> -2.111(N=57)
Daily smoking (%) 19.6 17.9 18.6 21.7 21.8 < 0.001
Obesity (%) 15.9 18.5 16.3 20.1 20.3 < 0.0001
Low income rate (%) 12.9 12.2 13.9 13.8 13.7 0.92
AAPC = Annual average percent change.Note: The data from three counties (area codes 2120, 2444 and 4623) in males and two counties (area codes 2420 and 2444) in females were not available for analysis.1 p-value measures the probability that quintiles have different proportions of risk factors.
low-income rates were observed in females or males. A detailed distribution of the AAPC in IHD by quintile and province is shown in Appendix 1.
Discussion
Our results show that mortality rates of IHD in Canada decreased on average by 3.4 percent per year for both males and females between 1986 and 2000. Signifi cant decreases were also observed within each ten-year age group. Almost one half of all counties experienced signifi cant declines in the IHD mortality rate. However, two counties had signifi cantly increased rates among males and females.
Mortality from IHD has been declining steadily worldwide over the past several decades.3,5,6 The results from the WHO MONICA project indicated that two thirds of the decline in CHD mortality may be attributed to decreases in coronary event attack rates, and one third to decreasing trends in case fatality.11 Other studies also have reported declining incidence of acute myocardial infarction as well as improved secondary prevention, treatment and sur-vival.12,13 It is estimated that 25 percent of the decline in CHD mortality in the United States between 1980 and 1990 was due to
efforts in primary prevention, 29 percent to secondary prevention and 43 percent to improvements in treatment.14 A twenty-year population-based study indicated that the decline was signifi cantly greater for in-hopital CHD deaths than for sudden cardiac deaths.15
The decreases in IHD rates which we found refl ect those reported in other Canadian studies;4,16 mortality reductions appear to be due to a decreasing incidence of acute myocardial infarction (AMI) and to improve-ment in cardiovascular treatment and care in Canada.4,17 Canadian and provincial/teritorial utilization of evidence-based medications for treatment of AMI increased in 1999-2002.18 Improvements in patient survival after AMI have been reported in British Columbia,19 Alberta20 and Ontario.21
The decline in IHD mortality can also be attributed to a reduction in risk factors. Studies from Great Britain, the United States and Australia have estimated that 30 to 75 percent of the observed decline in death rates from IHD was related to changes in lifestyle, which reduced the three major risk factors—hypertension, cigarette smoking and diet.22,23 However, a recent follow-up study to evaluate the association of risk-factor time trends with
CHD declines in Israeli males indicated that traditional risk factors appeared to play a limited role in the declining rates of CHD mortality.24 In Canada, another follow-up study indicated that community and hos-pital factors explained no more than seven percent of the variation in the risk-adjust-ed outcomes across hospitals or regions.25 Finally, a cross-sectional study in Scotland reported that conventional IHD risk factors do not explain the comparatively high rate of IHD.26
Cigarette smoking is one of the major risk factors for the development of CHD and is the major cause of preventable death in Canada. Results from the Canadian Community Health Survey, Cycle 1.1 (CCHS in 2000–01) indicated that health regions with high IHD mortality had a sta-tistically signifi cant higher prevalence of daily smoking.27 Our results also indicated that counties with smaller decreases in IHD mortality had a signifi cantly higher preva-lence of daily smoking in both men and women. The proportion of Canadians aged 15 years or older that smoke cigarettes on a daily basis has fallen from 39 percent in 1977 to 24 percent in 1996–97.28
Our results show that counties with more modest decreases in IHD mortality rates

Vol 27, No 2, 2006Chronic Diseases in Canada 89
also had a higher proportion of their popu-lations classifi ed as low income. Socio-economic status has been demonstrated in previous studies to have a pronounced effect on access to specialized cardiac services. In subjects living in low-income areas In Ontario, there have been sharply higher mortality rates observed one year subsequent to hospitalization for AMI.29 In another study, health regions with high IHD mortality in Canada were shown to be associated with a low-income rate and a lower prevalence of post secondary edu-cation.27 Low socio-economic status can also exert a strong adverse infl uence on cardiovascular risk factors—for example, smoking habits, cholesterol level and blood pressure.30 A large American cohort study showed that the risk of death from CVD and other disease for both men and women increased proportionately through a classifi cation range of moderate to severe overweight.31 In Canada, obesity rates have increased over the last decade.32
As for hypertension, the CCHS (2000–01) self-reported prevalence in Canada is 13.0 percent.33 Filate et al. showed that regions in Canada with high IHD mortality also had a statistically signifi cant higher preva-lence of high blood pressure.27
Our results should be interpreted with caution. Population lifestyle changes and improvements in treatment and care may have contributed to the markedly declin-ing mortality from IHD in Canada during the period 1986–2000 and it is possible that observed differential AAPC results can be explained by changes in risk fac-tors. However, it must be admitted that there was not suffi cient risk factor data to fully evaluate the association of risk fac-tor longitudinal trends with IHD decline; we used only a single data point from a relatively recent source (CCHS, 2000–01). Thus our results indicate avenues for further research. Moreover, some of our observed differences in mortality at the county level may be the result of chance alone, particularly when a large number of comparisons are made.
Acknowledgements
The authors gratefully acknowledge Statistics Canada for providing the annual Canadian mortality data to Health Canada from the Canadian Vital Statistics databas-es. The cooperation of the provincial and territorial vital statistics registries, who supply the data to Statistics Canada, is also gratefully acknowledged.
References
1. Nicholls E, Nail C, William LM, Moen J, Mao Y. Cardiovascular disease in Canada. Ottawa: Statistics Canada and Health and Welfare Canada, 1986.
2. Orius (database). Ottawa: Public Health Agency of Canada, 2006.
3. Statistics Canada. How healthy are Canadians? Health Reports (Catalogue 82-003) 2002;13 (Suppl).
4. Brophy JM. The epidemiology of acute myocardial infarction and ischemic heart
disease in Canada:data from 1976–1991. Can
J Cardiol 1997;13:474–8.
5. Beaglehole R, Stewart AW, Jackson R, et al. Declining rates of coronary heart disease
in New Zealand and Australia, 1983–1993.
Am J Epidemiol 1997;145:707–13.
6. Hellermann JP, Reeder GS, Jacobsen SJ, et al. Longitudinal trends in the severity of acute myocardial infarction:a population study in Olmsted County, Minnesota. Am J
Epidemiol 2002;156:246–253.7.
7. Statistics Canada. Causes of death. Ottawa: Health Statistics Division, Statistics
Canada, 2004. (Catalogue 84–208–XIE)
8. Statistics Canada. Census division populations. Annual demographic statistics 2002. Ottawa: Demography Division, Statistics Canada,
2003. (Catalogue 91–213–XPB)
9. Statistics Canada. Canadian Community
Health Survey, 2000–2001, Share file. Ottawa: Health Statistics Division, Statistics Canada, 2002.
10. Statistics Canada. Standard Geographical Classification SGC, Vol.1. The classification. Ottawa: Statistics Canada, 1996. (Catalogue
No. 12-571–XPB)
11. Tunstall-Pedoe H, Kuulasmaa K, Mahonen M, et al. for the WHO Monica project. Contribution of trends in survival and coronary rates to changes in coronary heart
disease mortality: 10–year results from the 37 WHO MONICA project populations. Lancet
1999;353:1547–57.
12. Rosamond WD, Chambless LE, Folsom AR, et al. Trend in the incidence of myocardial infarction and in mortality due to coronary
heart disease, 1987–1994. N Engl J Med
1998;39:861–7.
13. Hammar N, Alfredsson L, Rosen M, et al. A national record linkage to study acute myocardial infarction incidence and case fatality in Sweden. Int J Epidemiol 2001;30
Suppl 1:S30–34.
14. Hunink MG, Goldman L, Tosteson AN, et al. The recent decline in mortality from
coronary heart disease, 1980–1990. The effect of secular trends in risk factors and
treatment. JAMA 1997;277:535–42.
15. Goraya TY, Jacobsen SJ, Kottke TE, et al. Coronary heart disease death and sudden
cardiac death: A 20–year population-based
study. Am J Epidemiol 2003;157:763–770.
16. The Nova Scotia-Saskatchewan Cardio- vascular Disease Epidemiology Group. Trend in incidence and mortality from acute myocardial infarction in Nova Scotia and Saskatchewan, 1974 to 1985. Can J
Cardiol 1992;8:253–8.
17. Pilote L, Lavoie F, Ho V, Eisenberg M. Changes in the treatment and outcomes of acute myocardial infarction in Quebec,
1988–1995. CAMC 2000;163:31–36.
18. Jackevicius CA, Alter D, Cox J, et al. Acute treatment of myocardial infaction in Canada
1999–2002. Can J Cardiol 2005;21:145–52.
19. Pate GE, Humphries KH, Izadnegahdar M, et al. Population rates of invasive cardiac
procedures in British Columbia, 1995–2001. Can J Cardiol 2004;20:712–6.

Chronic Diseases in CanadaVol 27, No 2, 2006 90
20. Quan H, Cujec B, Jin Y, Johnson D. Acute myocardial infaction in Alberta :temporal
changes in outcomes, 1994–1999. Can J
Cardiol 2004;20:213–9.
21. Naylor CD, Slanghter PM. Cardiovascular Health and Services in Ontario. Toronto: Institute for Clinical Evaluative Sciences, 1999.
22. Sytkowski PA, Kannel WB, D’Agostino RB. Changes in risk factors and the decline in mortality from cardiovascular disease. The Framingham heart study. N Engl J Med
1990;322;1635–41.
23. Dwyer T, Hetzel BS. A comparison of trends of coronary heart disease mortality in Australia, USA and England and Wales with reference to three major risk factors—hypertension, cigarette smoking and diet.
Int J Epidemiol 1980;9:65–75.
24. Gerber Y, Dankner R, Chetrit A, et al. The role of risk factor time trends in the steep decline of CHD mortality between two Israeli cohort studies. Prev Med
2005;41:85–91.
25. Alter DA, Austin PC, Tu JV. Community factors, hospital characteristics and inter-regional outcome variations following acute myocardial infarction in Canada.
Can J Cardiol 2005;21:247–55.
26. Mitchell R, Fowkes G, Blane D, Bartley M. High rates of ischemic heart disease in Scotland are not explained by conventional risk factors. J epidemiol community Health
2005;59;567–7.
27. Filate WA, Jonathan HL, Kennedy CC, Tu JV. Regional variations in cardiovascular mortality in Canada. Can J Cardio
2003;19:1241–8.
28. Health Canada. The changing face of heart disease and stroke in Canada 2000. Ottawa: The Heart and Stroke Foundation of Canada, 1999:25.
29. Alter DA, Naylor CD, Austin P, Tu JV. Effects of socioeconomic status on access to invasive cardiac procedures and on mortality after acute myocardial infarction.
N Engl J Med 1999;341:1359–67.
30. Roger VL, Jacobsen SJ, Weston S, et al. Trends in the incidence and survival of patients with hospitalized myocardial infarction, Olmsted County, Minnesota, 1979 to 1994. Ann Intern Med
2002;136:341–8.
31. Calle EE, Thun MJ, Petrelli JM, et al. Body-mass index and mortality in a prospective cohort of U.S. adults. N Engl J Med
1999;341:1097–1105.
32. Katzmarzyk PT. The Canadian obesity epidemic: An historical perspective. Obes
Res 2002;666–74.
33. Tanuseputro P, Manuel DG, Leung M et al. Risk factors for cardiovascular disease in
Canada Can J Cardio 2003;19:1249–59.

Vol 27, No 2, 2006Chronic Diseases in Canada 91
Appendix 1Distribution of AAPC in ischemic heart disease by quintile and province, ages 35 and over (Canada, 1986–2000)
Province/territory
Quintile
I (decreasing)
II III IV V (increasing) Total
N % N % N % N % N %
Males
Newfoundland &Labrador
0 0.0 0 0.0 1 10.0 4 40.0 5 50.0 10
Prince Edward Island 1 33.3 0 0.0 1 33.3 1 33.3 0 0.0 3
Nova Scotia 2 11.1 5 27.8 6 33.3 3 16.7 2 11.1 18
New Brunswick 4 26.7 7 46.7 2 13.3 1 6.7 1 6.7 15
Quebec 30 30.3 24 24.2 17 17.2 12 12.1 16 16.2 99
Ontario 4 8.2 11 22.4 14 28.6 14 28.6 6 12.2 49
Manitoba 4 17.4 1 4.3 2 8.7 7 30.4 9 39.1 23
Saskatchewan 5 27.8 2 11.1 3 16.7 5 27.8 3 16.7 18
Alberta 1 5.3 4 21.1 4 21.1 4 21.1 6 31.6 19
British Columbia 5 17.9 3 10.7 8 28.6 6 21.4 6 21.4 28
Yukon 1 100.0 0 0.0 0 0.0 0 0.0 0 0.0 1
Northwest Territories 1 20.0 0 0.0 0 0.0 0 0.0 4 80.0 5
Total 58 58 58 57 58 288
Females
Newfoundland &Labrador
0 0.0 1 10.0 1 10.0 5 50.0 3 30.0 10
Prince Edward Island 0 0.0 0 0.0 1 33.3 1 33.3 1 33.3 3
Nova Scotia 6 33.3 6 33.3 2 11.1 3 16.7 1 5.6 18
New Brunswick 3 20.0 5 33.3 3 20.0 2 13.3 2 13.3 15
Quebec 26 26.3 19 19.2 18 18.2 16 16.2 20 20.2 99
Ontario 5 10.2 13 26.5 14 28.6 9 18.4 8 16.3 49
Manitoba 7 30.4 1 4.3 5 21.7 2 8.7 8 34.8 23
Saskatchewan 4 22.2 5 27.8 2 11.1 6 33.3 1 5.6 18
Alberta 1 5.3 2 10.5 2 10.5 4 21.1 10 52.6 19
British Columbia 4 14.8 4 14.8 8 29.6 8 29.6 3 11.1 27
Yukon 0 0.0 1 100.0 0 0.0 0 0.0 0 0.0 1
Northwest Territories 0 0.0 0 0.0 0 0.0 1 50.0 1 50.0 2
Total 56 57 56 57 58 284
AAPC = average annual percentage change
Note: Four counties were removed because of insuffi cient data for females.

Chronic Diseases in CanadaVol 27, No 2, 2006 92
Letter
Dear Editor,
Rusen et al.1 recently claimed to have detected a change in the seasonal pattern of SIDS deaths in Canada, following a recom-mendation that infants should be placed in a supine sleeping position instead of prone. Their conclusion is based on a comparison of the association of cause of post-neonatal deaths (SIDS versus non-SIDS) and season (four quarters of the year) in 1985-89 vs. 1994–98. Rusen’s interpretation was chal-lenged in a new analysis by Mage,2 who concluded that there had been no change in the seasonal pattern of SIDS.
In my opinion, the analyses by Rusen and Mage are both problematic because they do not address the most relevant epide-miologic question, which is whether the seasonal pattern of SIDS has changed over time in comparison to non-SIDS. Also, there remain methodological issues, which are outlined below.
Rusen’s position is based on the fact that the association between season and cause of death is statistically signifi cant in 1985-89, whereas in 1994-98 it is not signifi -cant. Unfortunately, I believe that type of comparison is invalid, because statistical signifi cance is infl uenced not only by the strength of the association under study, but also by the sample sizes involved. There are considerably more deaths in 1985-89 than in 1994-98 (in fact, 61 percent more). Therefore, even if the seasonal pattern had remained exactly the same, we would expect to fi nd a smaller p-value in the earlier time period—and that is what was actually observed. Because of the artifact of sample size, it is invalid to infer possible changes in seasonality from a comparison of p-values in this way.
Mage’s own criticism of Rusen’s position is actually based on somewhat different concerns. Mage correctly points out that Rusen’s analysis does not adequately test
the change in seasonal pattern because there could have been changes in either or both of the non-SIDS and SIDS death rates. In particular, it is possible that the non-SIDS seasonal distribution has changed while the pattern of SIDS deaths has not. Mage’s own analysis compared the frequencies of SIDS deaths by season in the two time periods, ignoring the data from non-SIDS deaths. He also examined the fi t of SIDS frequencies to predictions from a model based on external data. Non-signifi cance occurred in the fi rst compari-son and non-signifi cant deviations were found between the observed and predicted frequencies for both time periods. Mage therefore concluded that there has been no change in the seasonal pattern. (Even after Mage’s criticism was published, Rusen et al.3 re-iterated and continued to defend their method of analysis and the original interpretation).
By electing to analyse data only from SIDS deaths, Mage ignores the possibility of seasonal changes in infant mortality more generally. If such changes had happened, it would then be inappropriate to attribute any change in the seasonal pattern of SIDS to factors such as the recommendation on infant sleeping position.
Mage argues that the non-signifi cant deviations of the SIDS frequencies from model predictions in each time period are evidence that the same seasonal pattern applies to both periods. In my opinion, this approach again falls into the trap of implicit comparisons of p-values and it does not provide any direct evaluation of possible differences in the seasonal pat-tern between periods.
A re-analysis
I feel that it is more appropriate to study the proportion of all deaths that are due to SIDS and to take the overall effects of sea-sons into account. Specifi cally, we should
determine if the seasonal pattern of SIDS deaths has changed, relative to the pat-tern of non-SIDS deaths. To achieve this objective, I fi tted a log-linear model to the data (as shown in Table 1), including the following: main effects for season, time period and cause of death; three two-factor interactions between these three variables; and one three-factor interaction.
The main effects take into account the unequal numbers of deaths observed in the various levels of each factor. For example, the main effect of period allows for the clearly larger number of deaths in 1985–89 compared to 1994–98. The two-factor interactions represent associations between pairs of variables. For instance, the interaction between season and period refl ects the overall changes in the sea-sonality of post-neonatal mortality, but without regard to specifi c causes of death. Finally, the three-factor interaction exam-ines whether the seasonal pattern of the SIDS to non-SIDS ratio has changed over time, which is the effect of primary inter-est here.
An informal examination of the data reveals that there are considerably more deaths in the earlier time period in both the SIDS and non-SIDS categories. Overall mortality appears slightly lower in the summer dur-ing both time periods. The percentage of deaths due to SIDS appears slightly higher in the winter and spring, and lower in the more recent time period.
A likelihood ratio test for the three-fac-tor interaction was not signifi cant (p = 0.93), indicating that there has been no meaningful change in the seasonal pat-tern of SIDS over time, compared to other causes of death. The two-factor associa-tions of period and season with cause of death were both signifi cant (p = 0.02 and p = 0.02), suggesting that the proportion of deaths from SIDS fell signifi cantly over time (36 percent in 1985–89 vs. 31 per-
Seasonality of SIDS in Canada

Vol 27, No 2, 2006Chronic Diseases in Canada 93
cent in 1994–98), and there was a rela-tive excess of SIDS during the winter and spring. The association of period with sea-son was not signifi cant (p = 0.13), giving only weak evidence that the seasonal vari-ation in overall mortality has changed (in the direction of less pronounced seasonal differences in 1994–98).
In summary, I conclude that although the proportion of SIDS deaths has varied between periods and between seasons, there has been no change in the sea-sonal pattern of SIDS deaths over time, compared to the changes experienced in overall post-neonatal mortality risk. This contradicts Rusen’s original conclusion, but agrees with Mage (although for dif-ferent reasons). My analytic approach has the advantage of taking other changes in post-neonatal mortality risk into account, whereas Mage’s neglects data on other causes of death entirely. Although my con-clusion qualitatively agrees with Mage in these particular data, in general I believe it is preferable to take the appropriate epi-demiologic denominators (in this example, total deaths) into account.
SD WalterDepartment of Clinical Epidemiology and BiostatisticsMcMaster UniversityHamilton, Ontario, [email protected]
References
1. Rusen ID, Liu S, Sauve R, Joseph KS, Kramer MS. Sudden infant death syndrome in Canada: Trends in rates and risk factors, 1985-1998. Chronic Dis Can. 2004 Winter; 25(1):1–6.
2. Mage DT. Seasonality of SIDS in Canada between 1985–1989 and 1994–1998. Chronic Dis Can. 2005 Fall; 26(4):121–2.
3. Rusen ID. Letter (reply to Mage). Chronic Dis Can. 2005 Fall; 26(4):123.
Cause of death, 1985–89 Cause of death, 1994–98
Season SIDS Non-SIDS Total SIDS Non-SIDS Total
Winter (Jan-Mar) 331 (36%*) 590 (64%) 921 (28%)+ 173 (33%*) 352 (67%) 525 (25%)+
Spring (Apr-Jun) 283 (36%) 510 (64%) 793 (24%) 169 (31%) 371 (69%) 540 (26%)
Summer (Jul-Sep) 229 (31%) 502 (69%) 731 (22%) 139 (30%) 330 (70%) 469 (23%)
Autumn (Oct-Dec) 282 (31%) 622 (69%) 904 (27%) 155 (28%) 390 (72%) 545 (26%)
Total 1,125 (36%) 2,224 (64%) 3,349 (100%) 636 (31%) 1,443 (69%) 2,079 (100%)
TABLE 1Post-neonatal SIDS and non-SIDS deaths in Canada,
1985–89 and 1994–98
* Percentage of all deaths that are due to SIDS, by season.
+ Percentage indicates seasonal distribution of all deaths.

Chronic Diseases in CanadaVol 27, No 2, 2006 94
Introduction
An emerging commitment among the Canadian government and funding agen-cies, and the scientifi c and clinical commu-nities to reduce the growing cancer burden will enable enhancement in etiologic dis-covery, knowledge translation and control of cancer. Toward this end, the value of a large, longitudinal cancer research plat-form has become well recognized. Such a population-based and integrative program enables a wide range of innovative and high impact studies that relate to cancer prevention, early detection and outcomes. A group of multidisciplinary, experienced scientists and public health professionals (Appendix 1) met in a workshop on March 20-21, 2006 to take the fi rst steps towards developing the research program.
The workshop goals were 1) to begin to develop the vision, direction and strategies for an integrated cancer research plan for Ontario; 2) to establish a transdisciplinary team of accomplished researchers from across Ontario to develop the research plan; 3) to determine the structures and processes needed to design a program; 4) to defi ne the required developmental work; 5) to understand the available methods and the ones which will need to be devel-oped; and 6) in broad terms, to identify the content of pilot and feasibility studies.
Participants were sent a draft proposal for a two-year research initiative (i.e., as the fi rst phase of a large-scale cancer research plan for Ontario). An overview of key cancer cohort initiatives and selected read-ings1-4 were also provided to participants.
Dr. Robert Hiatt gave the keynote address, “Cohorts: A vehicle for transdisciplinary science”, followed by a moderated panel discussion to identify key considerations in developing an Ontario plan. Facilitated breakout groups organized by themes—community, epidemiology, genomics and health services—addressed specifi c ques-tions related to research planning. Dr. John Potter presented “Towards the last cohort” and an all-delegate discussion focused on key considerations for the research plan, opportunities and recommendations.
Discussion
Dr. Hiatt discussed the international can-cer research agenda and opportunities for enhancing large-scale science as well as identifi ng existing cohorts and discussing the role of cancer consortia. He refl ected on the importance of transdiciplinary thinking and presented a research frame-work to address determinants of health and health disparities.
Dr. Hiatt stated that trandisciplinary sci-ence was relevant because a large popu-lation cohort is a platform for answering
many different questions encompassing multiple disciplines; because the evidence derived from a major cohort study seeks application to a variety of settings; because knowledge exchange and uptake will require buy-in by organizations, govern-ments and systems, and; fi nally, because a cohort study requires broader scope in planning and broad-based support. While a transdisciplinary approach may present obstacles— requiring larger fi nancial com-mitment, logistical constraints, issues around tenure and merit review—this approach may contribute effectively to reduce the burden of cancer.
Dr. Potter’s presentation focused on genet-ic susceptibilities and environmental expo-sures in cancer etiology. Rates of cancer vary 10- to 200-fold across different geo-graphic locations around the world, and over 50 years we have seen up to ten-fold differences in rates within a geographic location. These differences can only be explained by differences in environmental exposures or interactions between genes and exposures.
Soon we will be able to characterize geno-types and haplotypes with increasing pre-cision and effi ciency, and we should be collecting high-quality information about both people and their exposure histories, biospecimens and information about dis-ease outcomes. Also, better molecular characterization of cancer subtypes allows
An invitation to develop Ontario’s cancer research platform: Report of the Ontario Cancer Cohort WorkshopFredrick D Ashbury, Victoria A Kirsh, Nancy Kreiger, Scott T Leatherdale and John R McLaughlin
Workshop Report
Author References
Victoria A Kirsh, Scott T Leatherdale, John R McLaughlin, Division of Preventive Oncology, Cancer Care Ontario; Department of Public Health Sciences, Toronto, On-tario, CanadaNancy Kreiger, Division of Preventive Oncology, Cancer Care Ontario; Departments of Public Health Sciences, Nutritional Sciences, and Health Policy, Management and Evaluation, University of Toronto, Ontario, CanadaFredrick D Ashbury, Department of Health Policy, Management and Evaluation, University of Toronto, Ontario; PICEPS Consultants, Inc., Ajax, Ontario, Canada Correspondence: Victoria A Kirsh, Division of Preventive Oncology, Cancer Care Ontario, Toronto, Ontario, Canada M5G 2L6; fax: (416) 971-9800; e-mail: [email protected]

Vol 27, No 2, 2006Chronic Diseases in Canada 95
fi ndings to be related to exposure, genetics and therapeutic responses. Homogeneous disease subsets may be associated with particular exposures and may carry differ-ent responses to therapy and prognoses.
Dr. Potter concluded that the time has come to establish new cohorts, possibly under-taken as an international collaboration. The danger is having the right technology in place to do high through-put genome sequencing and proteomics on very large populations, but without the requisite study infrastructure to best exploit those gains.
Following the speakers’ addresses, delegates contemplated several important questions:
Do we build on existing studies or develop a new cohort?
Building on existing cohorts means limit-ing the breadth and depth of data to the lowest common denominators. In addi-tion, many extant cohorts have limited ethno-racial heterogeneity, limiting poten-tially relevant studies of genetic variation or variation in environmental exposures. The age of existing cohort members limits questions; many of the cohorts have older-aged participants and outcomes of interest may already have occurred.
In contrast, while developing a new cohort requires substantial resources, it permits the greatest opportunity to address impor-tant research questions. Improved meas-urement, multigenerational approaches and a focus on younger people could ultimately lead to unique preventive inter-ventions to reduce disease rates and yield savings in health care costs.
What is the added value of an Ontario-based cohort study?
Ontario has many advantages for hosting such an initiative, including the existence of a high-quality cancer registry, substan-tial record-linkage capability, technological advances in data collection and retrieval, and access to administrative databases that will assist in the detection of out-comes and patterns of health services uti-lization in the population. Blending an etiological and discovery focus with policy
studies that have public health implica-tions will advance such a cohort to the forefront of fostering new discoveries and applying knowledge to the Ontario popula-tion. Its value to government and health system decision makers would thereby be enhanced.
How important is it to incorporate uniform procedures and measures across studies?
Uniformity allows data sharing and con-sortium development that extends beyond Ontario, and increases utility in answering questions of global import. Uniform pro-cedures of tissue collection may be more important than uniform questionnaire and other self-reported exposure data, since these latter must vary to cover the expo-sures relevant to the population under study (e.g., food frequency questionnaires which need to be tailored to the foods actually available).
Should the project be limited to cancer-relevant data or should it include data for understanding other diseases as well?
A strong consensus emerged regarding the need for breadth in data collection, to allow for the eventual analysis of disease outcomes in addition to cancer. Many of the biological processes (e.g., cell prolif-eration, infl ammation, apoptosis, cell sign-aling) have relevance to many diseases. In addition, exposures of interest are common across the major diseases, or could be col-lected at little marginal cost once a cohort is assembled. Finally, interest in funding such an endeavour may be increased with broader scope and cohort participants may be more readily recruited.
Will the cohort support population intervention studies?
Incorporating analyses of natural experi-ments that might occur during the life of the cohort (e.g., initiatives from the pub-lic health units, local smoking cessation programs) was discussed. The drawbacks of evaluating direct interventions relate to data collection biases and potential increased respondent burden.
How does this cohort project map onto needs of future funders?
The leadership and governance of the program should include a scientifi c and a health impact focus. In the short term, there are two complementary directions: to identify leaders who can interact with or represent stakeholders, and who can nego-tiate with potential funders; and to iden-tify leaders to lead the development of the overall platform and subsequent research proposals. These two groups of leaders are not mutually exclusive and must fully engage with each other.
Recommendations
The workshop strongly recommended a large-scale, longitudinal cohort that serves as an integrated cancer research platform in Ontario. A strong multidisciplinary team of experienced researchers from across Ontario supported the concept and is will-ing to collaborate to establish this major initiative. The workshop also underscored that transdisciplinary science is the key to leveraging maximum value from a cohort enterprise. This means inclusion of—and meaningful interaction between—scientists and public health leaders with multiple disciplinary backgrounds, working in the context of a population health laboratory. Substantial enthusiasm and commitment exist within the community of science and public health practitioners; the main challenges are sustaining required levels of interest and funding as developmental work evolves.
Developmental and pilot studies and pre-liminary explorations are needed to fi ll knowledge gaps and to demonstrate the optimal ways to proceed. Preliminary activities will relate to,
• environmental scans of major research platforms in order to identify organiza-tional and governance structures which yield streamlined management with maximal effi ciencies and participation, as well as maximal data utilization;
• methods for recruitment and retention of minority and often marginalized pop-ulations, including Ontario’s aboriginal

Chronic Diseases in CanadaVol 27, No 2, 2006 96
communities, non-English speaking immigrants and homeless people;
• literature reviews to identify optimal methods for collecting information on behavioural and biological measures of exposure and outcome;
• exploration of technological develop-ments which may facilitate information collection from large numbers of cohort participants;
• outreach to industrial and other private-sector partners to delineate the commer-cial value of this undertaking and identify mutually benefi cial research areas;
• evaluation of sampling options.
Working groups are required to complete the preliminary developmental work to implement selected pilot studies and to begin writing the application for fund-ing in the areas of, for example, exposure measurement, sampling and handling of biospecimens. The broad scientifi c com-munity is invited to participate, including people working in the areas of epidemi-ology, biostatistics, public health, clini-cal research, technology transfer, history, economics, geography, anthropology, sociology and political science. The fi rst year will involve identifying committed individuals (or teams), developing a gov-ernance structure, identifying a leadership team, creating working groups to focus on protocol development, identifying individual(s) responsible for liaison efforts with potential funding agencies and stake-holders, and selecting staff to assist the protocol development. The developmental phase requires completion of pilot stud-ies and environmental scans, selection of data collection methodologies, selection of research centres and assessments of infra-structure requirements, and development of a detailed protocol. Governance and leadership structures will ensure that the work proceeds in a timely and scientifi -cally sound fashion. A scientifi c advisory board will help to infuse the necessary breadth of vision, capitalize on transdis-ciplinary opportunities and develop fund-raising plans.
This is an ambitious program of work. However, the potential is great for gener-ating new research knowledge, for provid-ing avenues for innovation and economic development and for affecting public health and health policy.
Acknowledgements
This workshop was funded by the OCRN. Thanks are due to Dr. Bob Phillips and Ms. Michelle Noble for their help in making the workshop possible. The organizers also wish to thank Drs. Roy Cameron, Heather Bryant, Julian Little and Lawrence Paszat for facilitating the breakout group discus-sions. Thanks also to the participants who came from all parts of Ontario to discuss this important initiative, and who pro-vided such valuable feedback and advice. The authors acknowledge the help of the staff in the Research Unit of the DPO at CCO: the small group note-takers of Mr. Peter Campbell, Ms. Vicki Nadalin and Ms. Jocelyn Strath, and the administrative and organizational assistance of Ms. Petya Pisan.
References
1. Best A, Hiatt RA, Cameron R, Rimer BK, Abrams DB. The evolution of cancer control research: an international perspective from Canada and the United States. Cancer Epidemiol Biomarkers Prev 2003;12:705–12.
2. Hayes RB, Sigurdson A, Moore L, et al. Mutation Res 2005;592:147–54.
3. Potter JD. Toward the last cohort. Cancer Epidemiol Biomarkers Prev 2004;13(6):895–7.
4. Prentice RL, Willett WC, Greenwald P, et al. Nutrition and physical activity and chronic disease prevention: research strategies and recommendations. J Natl Cancer Inst 2004;96(17):1276–87

Vol 27, No 2, 2006Chronic Diseases in Canada 97
Appendix 1List of participants
Irene AndrulisOntario Cancer Genetics NetworkCancer Care Ontario
Michael ArcherNutritional SciencesFaculty of Medicine University of Toronto
Kristan AronsonCommunity Health & EpidemiologyQueen’s University
Fred AshburyPICEPS Consultants, Inc.
Nicholas BirkettEpidemiology & Community MedicineUniversity of Ottawa
Laurent BriollaisSamuel Lunenfeld Research InstituteMount Sinai Hospital
Patrick BrownDivision of Preventive OncologyCancer Care Ontario
K Stephen BrownStatistics & Actuarial ScienceUniversity of Waterloo
Heather BryantAlberta Cancer Board
Roy CameronCentre for Behavioural Research & Program Evaluation (NCIC/CCS) University of Waterloo
Anna ChiarelliDivision of Preventive OncologyCancer Care Ontario
Michelle CotterchioDivision of Preventive OncologyCancer Care Ontario
Roger DeeleyDivision of Cancer Biology & GeneticsQueen’s University
Mark DobrowHealth Policy ResearchCancer Care Ontario
Ahmed El-SohemyNutritional SciencesFaculty of Medicine University of Toronto
Gail EyssenPublic Health SciencesUniversity of Toronto
Kevin M GoreySchool of Social WorkUniversity of Windsor
Tony HanleyNutritional SciencesUniversity of Toronto
Shelley A HarrisEpidemiology & Community HealthVirginia Commonwealth University
Robert A HiattUCSF Comprehensive Cancer Center
Eric HolowatyInformatics Research & DevelopmentCancer Care Ontario
David JenkinsNutritional SciencesUniversity of Toronto
Vicki KirshDivision of Preventive OncologyCancer Care Ontario
Julia KnightSamuel Lunenfeld Research InstituteMount Sinai Hospital
Nancy KreigerDivision of Preventive OncologyCancer Care Ontario
Robert LafrenieRegional Cancer Program, Northeastern Ontario Regional Cancer Centre
Scott LeatherdaleDivision of Preventive OncologyCancer Care Ontario
Nancy LightfootNorthern Ontario School of Medicine
Julian LittleEpidemiology & Community Medicine University of Ottawa
Loraine MarrettDivision of Preventive OncologyCancer Care Ontario
Ian McKillopFaculty of Applied Health SciencesUniversity of Waterloo
John McLaughlinDivision of Preventive OncologyCancer Care Ontario
Howard MorrisonCentre for Chronic Disease Prevention & ControlPublic Health Agency of Canada
Cam MustardPublic Health Sciences University of Toronto
Steven NarodCentre for Research in Women’s HealthUniversity of Toronto
Larry PaszatScientistInstitute for Clinical and Evaluative Sciences
Michael PollakDepartment of OncologyMcGill University
Paul RitvoDivision of Preventive OncologyCancer Care Ontario
Paula RobsonPopulation Health and InformationAlberta Cancer Board
Greg RossNorthern Ontario School of Medicine

Chronic Diseases in CanadaVol 27, No 2, 2006 98
Calendar of Events
26-29 October 2006Berlin, Germany
The World Congress on Controversies in Obesity, Diabetes and Hypertension
e-mail: [email protected]<www.codhy.com>
3-6 December 2006Winnipeg, ManitobaCanada
Public Health Agency of Canada7th Canadian Immunization Conference
e-mail: [email protected]<www.phac-aspc.gc.ca/cnic-ccni/index.html>
3-7 December 2006Cape Town, South Africa
International Diabetes Federation19th World Diabetes Congress
e-mail: [email protected]<www.idf2006.org>

Chronic Diseases in Canada (CDIC) is a quarterly scientifi c journal focussing on the prevention and control of non-com-municable diseases and injuries in Canada. Its feature articles are peer reviewed. The content of articles may include research from such fi elds as epidemiology, pub-lic/community health, biostatistics, the behavioural sciences, and health services or economics. CDIC endeavours to fos-ter communication on chronic diseases and injuries among public health practi-tioners, epidemiologists and researchers, health policy planners and health educa-tors. Submissions are selected based on scientifi c quality, public health relevance, clarity, conciseness and technical accu-racy. Although CDIC is a publication of the Public Health Agency of Canada, contributions are welcomed from both the public and private sectors. Authors retain responsibility for the contents of their papers, and opinions expressed are not necessarily those of the CDIC editorial committee nor of the Public Health Agency of Canada.
Article Types
Peer-reviewed Feature Article: Maximum 4,000 words for main text body (exclud-ing abstract, tables, fi gures, references) in the form of original research, surveillance reports, meta-analyses or methodological papers.
Status Report: Describe ongoing national programs, studies or information systems bearing on Canadian public health (maxi-mum 3,000 words). Abstract not required.
Workshop/Conference Report: Summa-rize signifi cant, recently held events relating to national public health (maximum 1,200 words). Abstract not required.
Cross-Canada Forum: For authors to present or exchange information and opin-ions on regional or national surveillance fi ndings, programs under development or public health policy initiatives (maximum 3,000 words). Abstract not required.
Letter to the Editor: Comments on arti-cles recently published in CDIC will be considered for publication (maximum 500 words). Abstract not required.
Book/Software Review: Usually solic-ited by the editors (500B1,300 words), but requests to review are welcomed. Abstract not required.
Submitting Manuscripts
Submit manuscripts to the Editor-in-Chief, Chronic Diseases in Canada, Public Health Agency of Canada 130 Colonnade Road, CDIC Address Locator: 6501G, Ottawa, Ontario K1A 0K9, e-mail: [email protected].
Since CDIC adheres in general (section on illustrations not applicable) to the “Uniform Requirements for Manuscripts Submitted to Biomedical Journals” as approved by the International Committee of Medical Journal Editors, authors should refer to this document for complete details before submitting a manuscript to CDIC (see <www.cma.ca> or Can Med Assoc J 1997;156(2):270B7).
Checklist for Submitting Manuscripts
Cover letter: Signed by all authors, stating that all have seen and approved the fi nal manuscript and have met the authorship including a full statement regarding any prior or duplicate publication or submis-sion for publication.
First title page: Concise title; full names of all authors and institutional affi liations; name, postal and e-mail addresses, tele-phone and fax numbers for corresponding author; separate word counts for abstract and text.
Second title page: Title only; start page numbering here as page 1.
Abstract: Unstructured (one paragraph, no headings), maximum 175 words (100
for short reports); include 3B8 key words (preferably from the Medical Subject Headings (MeSH) of Index Medicus).
Text: Double-spaced, 1 inch (25 mm) margins, 12 point font size.
Acknowledgements: Include disclosure of fi nancial and material support in acknowl-edgements; if anyone is credited in acknowl-edgements with substantive scientifi c contri-butions, authors should state in cover letter that they have obtained written permission.
References: In AVancouver style@ (consult a recent CDIC issue for examples); num-bered in superscript in the order cited in text, tables and fi gures; listing up to six authors (fi rst three and Aet al.@ if more); without any automatic reference number-ing feature used in word processing; any unpublished observations/data or person-al communications used (discouraged) to be cited in the text in parentheses (authors responsible for obtaining written permis-sion); authors are responsible for verifying accuracy of references.
Tables and Figures: Send vector graph-ics only. Each on a separate page and in electronic fi le(s) separate from the text (not imported into the text body); as self- explanatory and succinct as possible; not too numerous; numbered in the order that they are mentioned in the text; explanatory material for tables in footnotes, identifi ed by lower-case superscript letters in alpha-betical order; fi gures limited to graphs or fl ow charts/templates (no photographs), with software used specifi ed and titles/footnotes on a separate page.
Number of copies: If submitting by mail, one complete copy, including tables and fi gures; one copy of any related supple-mentary material, and a copy of the manu-script on diskette. If submitting by e-mail to [email protected], please fax or mail the covering letter to the address on the inside front cover.
CDIC: Information for Authors