Performance of the AOAC use-dilution method with targeted ...
Upload
independentCategory
view
1download
0
RAPID COMMUNICATIONS IN MASS SPECTROMETRY
Rapid Commun. Mass Spectrom. 2010; 24: 1093–1104
) DOI: 10.1002/rcm.4487
Published online in Wiley InterScience (www.interscience.wiley.comQuantitative analysis of low-abundance peptides in
HeLa cell cytoplasm by targeted liquid chromatography/
mass spectrometry and stable isotope dilution:
emphasising the distinction between peptide detection
and peptide identification
Thierry Le Bihan1*, Ramon Grima1, Sarah Martin1, Thorsten Forster1 and Yann Le Bihan2
1Centre for Systems Biology at Edinburgh, School of Biological Sciences, The University of Edinburgh, Edinburgh, UK2CRIQ Direction de l’ecoefficacite industrielle et de l’environnement, Quebec, Canada
Received 26 November 2009; Revised 26 January 2010; Accepted 28 January 2010
*CorrespoEdinburgSchool oThe KingE-mail: th
We present the application of a targeted liquid chromatography/mass spectrometry (LC/MS)
approach developed on a linear ion trap for the evaluation of the abundance of cytoplasmic proteins
from a HeLa cell extract. Using a standard data-dependent approach, we identified some specific
peptides from this extract which were also commercially available in their AQUA form (use for
absolute quantitation). For some of the peptides, we observed a non-linear response between the
intensity and the added quantity which was then fitted using a quadratic fit. All AQUA peptides
spiked into a mix of 3mg of the HeLa cell digest extract were detected down to 16 fmol. We placed an
emphasis on peptide detection which, in this study, is performed using a combination of properties
such as three specific Q3-like ion signatures (for a given Q1-like selection) and co-elution with the
AQUA peptide counterparts. Detecting a peptide without necessarily identifying it using a search
engine imposes less constraint in terms of tandem mass (MS/MS) spectra purity. An example is
shownwhere a peptide is detected using those criteria but could not be identified byMascot due to its
lower abundance. To complement this observation, we used a cross-correlation analysis approach in
order to separate two populations ofMS/MS fragments based on differences in their elution patterns.
Such an approach opens the door to new strategies to analyse lower intensity peptide fragments. An
in silico analysis of the human trypsinosome allows the evaluation of how unique are the sets of
features that we are using for peptide detection. Copyright # 2010 John Wiley & Sons, Ltd.
A major issue of using a data-dependent approach in liquid
chromatography/mass spectrometry (LC/MS) mode which
is based on selecting the most intense peaks at a given time is
its limitation to cope with screening complex samples
characterised by large dynamic range. Recent improvements
in different mass spectrometric instruments, either in their
data acquisition speed or in the dynamic range they can
tackle, have contributed largely to encourage large-scale
studies.1–4
Significant increase in proteome coverage has been
achieved by combining the use of improved mass spec-
trometry instruments with various fractionation strategies
such as protein or peptide fractionation and gas-phase
fractionation.5–7 However, the gain in the number of proteins
identified and ideally quantified is done at the expense of
longer LC/MS acquisitions and tedious data analysis. Such a
situation imposes an important constraint for designing
ndence to: T. Le Bihan, Centre for Systems Biology ath, School of Biology, The University of Edinburgh,f Biological Sciences, Room 2.12 C.H. Waddington,s Buildings, Mayfield Road, Edinburgh EH9 3JR, [email protected]
more elaborate studies. Some of the resulting drawbacks are
the difficulty in characterising large amounts of biological
replicates, to design complex time course studies and to
simply probe a given proteome under stress with various
perturbations.
Other approaches involve targeting specific peptides using
prediction tools.8–11 Recently, there has been a resurgence of
established MS-based approaches such as the multiple reaction
monitoring (mrm) and selected reaction monitoring (srm)
scanning modes to detect lower abundance species.4,12–14
Several bioinformatics tools have been recently developed in
order to help to choose sets of adequate transitions.15,16
These approaches have been adapted to modern proteo-
mic constraints, i.e. the need to identify a peptide using a
search engine (e.g. MIDAS17) or simply adapting MS
scanning methods to different types of instrument like an
ion trap.18 The advantage of using an ion trap to fragment a
given mass range allows one to acquire continuously in time
precursor ion spectra that can be subsequently used for
identification using a search engine. Moreover, the basepeaks
of specific fragment/transition ions can be extracted and
then reconstituted to give the equivalent of a srm/mrm
Copyright # 2010 John Wiley & Sons, Ltd.

1094 T. Le Bihan et al.
signal post-acquisition. Although a MIDAS approach has
certain advantages, it allows one to identify only fragmented
peptides that generate the most intense signal at a given time.
It is a limiting factor which impedes the detection of lower
abundance peptides.
In this study, we use an adaptation of the targeted-MS
developed initially by Arnott et al.18 by combining the
product of three fragment transitions in order to improve the
selectivity of the pseudo-mrm assay. From a data-dependent
analysis of the HeLa cell cytoplasm extract digest, we
identified a few peptides which were also commercially
available in their AQUA form. A peptide detection method
based on a selected combination of properties such as their
mass-to-charge ratio, their retention time and the combi-
nation of the profile intensity of some of the MS/MS
fragments is presented and validated with a pool of 1295
identified peptides.
Such an approach allows us to detect low-abundance
peptides which are either not intense enough at any time to
generate a defined MS/MS fragmentation pattern or are
simply masked by more abundant species impeding their
identification by a conventional search engine. The use of the
combination of properties increases the level of detection
when peptide separation is limited. An example is shown of
a peptide which is not identified by Mascot but the elution
profile of its several fragments can be extracted and
separated from a stronger contaminant. By using a cross-
correlation analysis approach, it is possible to separate at
least two populations of fragments from various origins
eluting with a difference of approximately 8 s.
EXPERIMENTAL
MaterialsAcetonitrile and water used for LC/MS/MS analysis or
sample preparation were of HPLC quality (Fisher, UK).
Formic acid (FA) was Suprapure (98–100%, Merck, Darm-
stadt, Germany) and trifluoroacetic acid (TFA) was 99%
purity sequencing grade (Sigma, UK). All peptides and
AQUA peptides were purchased from Sigma UK.
All other chemicals used in the preparation of the samples
were of reagent grade or better, unless specified. Sequencing-
grade modified porcine trypsin was purchased from
Promega (Roche, UK). All protein and peptide standards
were of >95% purity from Sigma (St. Louis, MO, USA). All
connector fittings were from Upchurch Scientific or Valco
(purchased from RESTEK UK). HeLa cell cytoplasmic
extracts were obtained commercially from Dundee Cell
Products Ltd. (UK). The cell count estimated to 2.75e7 cell/
mg (�10%) was measured using a hemocytometer and cell
viability was checked using trypan blue.
Sample preparationA small fraction of the HeLa cell cytoplasm extract was
quantified using a Bradford assay and the overall cell extract
was estimated to 1 mg. The extract was diluted in water up to
300mL and protease inhibitors were added according to the
supplier (Roche, UK). To the extract, we added 125mL urea
(8 M), 25mL ammonium bicarbonate (1 M), 25mL dithio-
threithol (200 mM), left it to stand for 30 min at room
Copyright # 2010 John Wiley & Sons, Ltd.
temperature and then added 25mL iodoacetamide (500 mM)
and 20mg trypsin, and left this to digest overnight. Samples
were split into aliquots and stored at �808C.
High-performance liquid chromatography(HPLC) and mass spectrometryMicro-HPLC/MS/MS analyses were performed using an on-
line system consisting of a micro-pump Agilent 1200 binary
HPLC system (Agilent, UK) coupled to a hybrid LTQ-
Orbitrap XL instrument (Thermo-Fisher, UK). The LTQ was
controlled through Xcalibur 2.0.7 and LTQ Orbitrap XL
MS2.4SPI. Capillary Picotip columns (10 cm� 360mm
o.d.� 75mm i.d.) with a 15mm tip opening and fitted with
a borosilicate frit were purchased from New Objective
(Presearch, UK). Fused-silica tubing was purchased from
Composite Metal (UK).
The reversed-phase bulk material used in this study was
5mm Pursuit C18 obtained from Varian (UK). Buffer A was
97.5% H2O, 2.5% acetonitrile, 0.1% FA, and buffer B was 90%
acetonitrile, 10% H2O, 0.025% TFA, 0.1% FA. The HPLC
system was used in low consumption mode to reduce solvent
consumption. For all measurements, 8mL of sample was
injected using an Agilent micro-WPS autosampler at 5mL/
min. After sample loading, the flow rate across the column
was reduced to approximately 100–200 nL/min using a
vented column arrangement.19,20
Samples were analysed on either a 2 h gradient for data-
dependent analysis (1survey scan in FT mode at 60 k
resolution followed by 3 MS/MS in IT mode) or 1 h gradient
for targeted MS/MS in IT mode only. For the 1 h, the solvent
gradient program was as follows: 0% buffer B (0–6 min), 0–
5% buffer B (6–8 min), 5–15% buffer B (8–18 min), 15–35%
buffer B (18–40 min), 35–100% buffer B (40–48 min), followed
by 100% buffer B for 9 min and back to 0% buffer B for 3 min.
The timing for the 2 h was simply doubling of the steps for
the 1 h gradient.
Prior to each LC/MS micro-LC/MS/MS analysis, a
column/pre-column wash and conditioning step consisting
of 1 h gradient of 0–100% buffer B over 20 min followed by an
isocratic conditioning step at 0% buffer B over 40 min was
performed. The MS instrument transmission was optimised
using mostly the þ1 charge state of the standard peptide
MRFA (Sigma, UK), in static nanospray mode (Proxeon,
Denmark). The ESI voltage was set at 1.7 kV and the interface
temperature set at 2008C for all measurements.
In data-dependent mode, the MS acquisition settings were
as follows: a single FT scan at a resolution of 60k in profile
mode (400–2000 Th) was first performed without the lock
mass function, followed by three data-dependent MS/MS
scans of the three most intense ions in LTQ centroid mode
with a window of 2 Th. Selected MS/MS precursor ion data
were excluded for 180 s and the exclusion list was set at 500
for a narrow isolation width of 0.05 Th. The maximum fill
time and target value were 200 ms, 200 ms, 1� 106 and 1� 104
ions for the FT survey scan and IT MS2, respectively.
All targeted MS/MS experiments were performed in the
ion trap mode with 60 min LC/MS gradient. Up to ten MS/
MS transitions were followed without the need to introduce
different segments in the MS method. A narrow isolation
width of 3 Th for each transition was considered.
Rapid Commun. Mass Spectrom. 2010; 24: 1093–1104
DOI: 10.1002/rcm
Analysis of low-abundance peptides in HeLa cell cytoplasm 1095
Data processingMascot Generic Format (MGF) input files were generated
with the EXTRACT_MSN tool (Bioworks 3.3, ThermoQuest
Corp, San Jose, CA), and merged with the precursor
grouping option disabled. Spectra containing less than ten
fragment data points were discarded. MS/MS data were
searched using Mascot version 2.2 (Matrix Science Ltd., UK)
against a human subset of IPI UniProt database (EBI) (March
2008) version 3.42 with 72340 sequences.
All basic Mascot searches were performed using a
maximum missed-cut value of 1, mass modifications
can be found on-line.21 These are a variable methionine
oxidation modification (þ15.994915Da), S,T,Y phosphoryl-
ation (þ79.966331), and fixed cysteine carbamidomethyl-
ation modification (þ57.021464 Da). The precursor mass
tolerance was set to 12 ppm and a MS/MS tolerance of 0.4 Th
was considered. The significance threshold p was set at
below 0.05 using the MudPIT scoring scheme. The false
discovery rate based on a decoy database was below 2%.
Extraction of the semi-quantitative emPAI factor22 used in
this study was the output value obtained directly from
Mascot.
Specific searches on the targeted MS/MS experiments
were also performed. They were done in order to identify the
targeted peptide as well as potential contaminants having a
similar mass range or retention time. In those specific cases
we used a narrow isolation width for MS/MS around 3 Th
and 0.4 Th for the MS/MS fragment. Semi-trypsin was
selected in order to increase the chance to identify some of
the potential contaminants. For those particular searches, we
considered only the highest ranking peptide hits identified at
a specific retention time (RT) (close to the elution time of the
AQUA peptide form). To confirm the targeted peptide
identification, we use the RT information measured for the
AQUA peptide form.
Extraction of the pseudo-mrm signal was performed post-
acquisition as follows. For a given peptide a series of three
specific fragments are selected. The choice of those fragments
is defined empirically and roughly they are: high intensity
fragments, at least one fragment has to be of a mass higher
than the selected precursor ion, mostly b and y ions. We
selected the same fragment type from the targeted peptide
and the AQUA form. Exploration of the best combination of
three fragments was done using the AQUA peptide at
different concentrations and tested by trial and error with the
criterion that it should generate a unique signal with the best
limit of detection. Confirmation of the fragment assignment
was done using Protein prospector from UCSF. The three
selected fragments were then extracted as basepeak from the
filtered specific MS/MS spectrum and exported directly into
Excel where, for a selected mass range, the product of the
three transitions was performed for each time point.
Cross-correlation analysisThe raw time series data consists of three columns: time,
mass-to-charge ratio (m/z) and intensity. The data are filtered
according to mass such that for each specific fragment one
obtains the variation of intensity with time. The mass filter is
set to �0.5 Th about the expected m/z for a particular
fragment. This procedure is repeated for 12 selected
Copyright # 2010 John Wiley & Sons, Ltd.
fragments: C1 to C6 (refers to the fragment associated with
the contaminant) and to P1 to P6 (refers to the fragment
associated to the targeted peptide). To compute the
correlation coefficient for two different fragments, one first
eliminates data entries for times which are present in one
peptide time series but not in the other and then computes
the desired coefficient using the Excel function correl(ar-
ray1,array2).
Protein organelle localisation was obtained from Go-
Miner.23 In the case of a small subset of proteins either not
recognised or without any localisation assigned, we
manually curated this set using Genecard24 as well as the
Harvester.25
In silico analysisA subset of peptides identified from a 1 h run by Mascot was
exported into a csv format where a few parameters were
extracted such as the sequence information, score, mass and
the time at which each peptide was identified. A hydro-
phobic scale based on peptide sequence was then built in a
similar way as previously described.8 Each peptide fragment
assignment and intensity was obtained after data was parsed
into MaxQuant (version 1.0.13.8). An experimental subset of
1295 peptides was used and compared to an in silico human
trypsinosome. This experimental subset of 1295 peptides
corresponds to all peptides from Mascot having at least a
score of 20 and that was also retained in MaxQuant. The in
silico analysis of the human trypsinosome was done using R
(version 2.9.1). For each peptide we calculated their ratio
mass/charge as 2þ and 3þ, their hydrophobicity RTcalc, and
we generate their theoretical b and y fragment ions.
An overall description of the experimental design in this
study is presented in Fig. 1. Two different HeLa cell
cytoplasm extract digests were prepared and characterised
by LC/MS. The first one was done to identify peptides which
are available in their AQUA form. On the second digest, the
number of cell equivalents was preliminary determined
prior to digest and we performed the quantitation using
AQUA peptides.
RESULTS AND DISCUSSION
Experimental analysis
HeLa cell cytoplasm extracts analysis and AQUApeptide characterisationThe HeLa cell cytoplasm extract was trypsinised using a
standard in-solution digest method and analysed by LC/MS
using a data-dependent approach. The protein composition
of the cytoplasm was analysed by LC/MS as described in the
Experimental section and searched against an IPI database
using Mascot. The false discovery rate using a decoy
database search was below 2% for a p value of 0.05. For
an initial digest, a total of 825 proteins were identified under
those conditions. Under more stringent conditions; i.e. two
peptides per protein having at least a Mascot score of 20, a
total of 625 proteins were identified. The list of generated
proteins was analysed using GoMiner for protein localisation
(see Table 1). Of the 625 proteins from this digest 1, 80% (500
proteins) were reported to have a cytoplasm localisation; the
Rapid Commun. Mass Spectrom. 2010; 24: 1093–1104
DOI: 10.1002/rcm

Figure 1. Flow chart description of the experimental design of this study. The first digest was analysed in data-dependent mode
(DD) which consists of one survey scan in FT mode 60 k resolution and three MS/MS scans in IT mode. A list of identified
proteins and peptide was then generated. The cell extract for the second digest was more characterised (cell number equivalent
was determined). The second digest was used for peptide quantitation using AQUA peptides.
1096 T. Le Bihan et al.
second higher fraction was for the nucleus with 10–14.5%
and a similar observation for the second cytoplasm extract
digest from HeLa cell. This observation regarding protein
origin confirms that the cytoplasm extract we are using in
this study is a good representation of the proteins that can be
found in this organelle.
From the list of identified peptides from this first HeLa cell
cytoplasm extract digest we have identified a small subset of
peptides which are also already commercially available in
their AQUA peptide forms. Having determined a precise
mass accuracy for each peptide by the Orbitrap increases the
level of confidence for choosing the corresponding AQUA
peptides.
A total of seven commercially available AQUA peptides
were identified. Two of them were rejected for the following
reasons. The sequence IGPLGLsPK associated to 60S
ribosomal protein L12 (RPL12 or IPI00024933) is available
Copyright # 2010 John Wiley & Sons, Ltd.
in its phosphorylated form which is probably not a major
component in our study. The sequence TNQIGTVNDR
associated to IPI00024660 isoform 1 of uncharacterised
protein KIAA0174 (protein rank 821) was identified with
only one peptide and was then not retained due to its
relatively low abundance and also for a poor-quality MS/MS
spectra.
Of the five available AQUA peptides, the sequence
FYEEVHDLER, associated to NAP1L1 nucleosome
assembly protein 1-like 1 (IPI00023860), ranked 137 out of
825 proteins, was identified and kept. The MS/MS spectrum
associated with this sequence has a Mascot score of 26,
but the protein was identified with at least eight other
different peptides. Both the sequences TPAQFDADELR and
GTDVNVFNTILTTR associated to ANXA1 annexin A1
ranked 21 out of 825 and finally the sequences GALQNII-
PASTGAAK and LVINGNPITIFQER associated to GAPDH
Rapid Commun. Mass Spectrom. 2010; 24: 1093–1104
DOI: 10.1002/rcm

Figure 2. Signal intensity for an isolation width of 3 Th
around 710.4 Th (Q1 like) associated with the AQUA peptides
GALQNIIPASTGAAK� spiked at 20 fmol into a cytoplasm
HeLa cell extract digest. Three different basepeak chromato-
gram curves for different ‘Q3-like’ selection: (A) basepeak for
597.3 Th (b6), (B) basepeak for 823.5 Th (y9), (C) basepeak
for 936.5 Th (y10), and (D) intensity product (A�B�C)0.333. The
peak at 37.3 min associated with this peptide is not the most
intense ion for a 1 h LC/MS run in (A) and (C). The intensity
product of the three curves increases the specificity of the
AQUA peptide signal in (D).
Table 1. Number of protein identified in the cytoplasm extract
and their putative localisation
Digest 1 Digest 2
total protein ID 629 (825) 607 (823)% cytoplasm 80.0 76.6% nuclear 10.7 14.5% plasma membrane 0.8 0.8% other organelle 3.7 4.8% unknown 5.0 3.2
Analysis of low-abundance peptides in HeLa cell cytoplasm 1097
glyceraldehyde-3-phosphate dehydrogenase IPI00219018
ranked 15 out of 825 were kept. All these three proteins
were identified with more than one peptide in digest 1.
Although the instrument of choice for a targeted mrm
assay is a hybrid triple quadrupole linear ion trap type of
instrument, various studies have been conducted using an
ion trap.18,26 The method consists of acquiring product ion
spectra of a targeted peptide referring to Q1-like selection.
The Q3-like signal is reconstituted post-acquisition. This
approach allows one to choose the optimum Q3-like signal
after LC/MS acquisition as well as to combine various
specific Q3-like transitions in order to improve the unique-
ness of the assay.
The signal intensity for an isolation width of 3 Th around
710.4 Th (Q1 like) associated with the AQUA peptide
GALQNIIPASTGAAK spiked at 16 fmol into the cytoplasm
HeLa cell extract digest is illustrated in Fig. 2. There are three
different basepeak chromatogram curves for different Q3-
like selection as detailed in the legend of Fig. 2. For all the
three selected fragments, the basepeak signals show various
transitions; however, one signal is present in all three curves
around 37.3 min N with S/N varying between 10 for Q3 like
of 597.3 Th to a S/N ratio of 90 for 823.5 Th. The pseudo-mrm
signal shown in Fig. 2(D) is the result of the intensity product
at a given time of the three signals measured in
Figs. 2(A), 2(B) and 2(C). However, in this specific case,
the final product is relatively close to the signal detected in
Fig. 2(B). The intensity product of the three curves slightly
increases the specificity of the peptide signal detection.
Table 2 lists information about the selected peptides and
their AQUA counterparts. All the AQUA peptides were also
analysed individually in static nanospray in order to ensure
that we are indeed characterising the right peptide. An
example is shown in Supplementary Fig. S1 (see Supporting
Information) regarding the sequence FYEEVHDLER. All of
the analysed fragmented AQUA peptides in MS/MS were
confirmed using Protein Prospector. Their fragmentation
patterns were compared to the counterpart natural peptides;
in addition, we monitored their optimum charge state for
maximum intensity. As also illustrated in Table 2 for both the
AQUA and natural forms of a given peptide, we chose the
same three fragment, ‘Q3 like’, in order to acquire a
comparable pseudo-mrm signal for both counterparts.
Pseudo-mrm quantitation assay on HeLa cell cytoplasmextractVarious quantities of the AQUA peptide mix were added to
the HeLa cell cytoplasm extract digest 2 (see Experimental
section). For this study, we used 6600 and 32000 cell
Copyright # 2010 John Wiley & Sons, Ltd.
equivalents for the HeLa cell cytoplasm extract. The injected
quantity of the AQUA peptides mix was 0, 16, 48, 160 and 480
fmol and all experiments were performed in duplicate. As
illustrated in Supplementary Fig. S1 (see Supporting
Information), extraction of the normalised pseudo-mrm
signal for both the natural form of the peptide and its AQUA
counterpart for a given LC/MS run co-elute with no
discernable time lag confirming that we are characterising
the right peptide through the use of the AQUA peptide form.
The relationship between the pseudo-mrm signal as a
function of the different AQUA peptide quantities was
examined in duplicate. A recapitulative summary of this
information is presented in Table 3.
Two out of the five AQUA peptides do not have a pseudo-
mrm linear response in relation to the added quantity (see
also Fig. 3(B)). For the lower concentration of the AQUA
peptide LVINGNPITIFQER at 812.5 Th a smaller intensity
response is observed and seems to increase significantly from
160 fmol and upwards.
Rapid Commun. Mass Spectrom. 2010; 24: 1093–1104
DOI: 10.1002/rcm
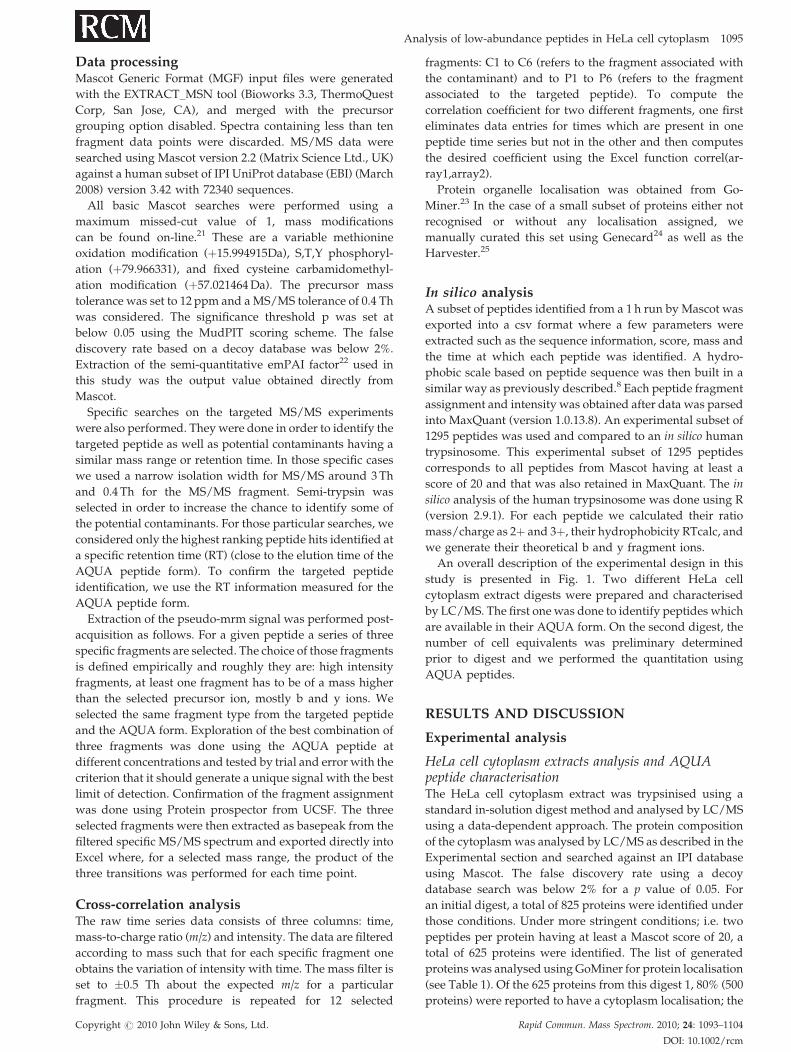
Table 2. Targeted proteins and their signature ions
Protein IDProteinname Selected sequence
Mascot Dmass PeptideZ
Pseudo-mrm transition RT
score Da form Q1 like Q3 likemeas.(min)
calc.(min)
y5 y4 yþ212
IPI00219018 GAPDH LVINGNPITIFQER 84 �0.0012 natural form 2 807.4 1003.5 579.3 701.4 46.3 44.4LVINGNPITIFQER� AQUA form 2 812.5 1013.6 589.3 706.5
b6 y9 y10IPI00219018 GAPDH GALQNIIPASTGAAK 38 �0.0005 natural form 2 706.4 597.3 815.5 928.5 37.2 35.3
GALQNIIPASTGAAK� AQUA form 2 710.4 597.3 823.5 936.5y4 y7 y8
IPI00218918 ANXA1 GTDVNVFNTILTTR 64 �0.0018 natural form 2 775.9 490.3 818.5 965.6 46.6 40.2GTDVNVFNTILTTR� AQUA form 2 780.9 500.3 828.5 975.6
yþ210
y6 y7IPI00218918 ANXA1 TPAQFDADELR 54 �0.001 natural form 2 631.8 581.5 718.3 865.4 31.9 33.1
TPAQFDADELR� AQUA form 2 636.8 586.5 728.4 875.4y6 y7 y8
IPI00023860 NAP1L1 FYEEVHDLER 26 �0.0009 natural form 2 668.8 768.4 897.4 1026.4 30.5 33.7FYEEVHDLER� AQUA form 2 673.8 778.4 907.5 1036.5
1098 T. Le Bihan et al.
Probing the underlying reasons behind the non-
linear response for peptides LVINGNPITIFQER and
GTDVNVFNTILTTR is beyond the scope of this paper.
There is definitely an important difference between the
pseudo-mrm assay done on an ion trap compared to a real-
mrm assay performed on a triple quadrupole mass
spectrometer. The observed non-linearity between the MS
signal and the quantity for some peptides could be due to the
fact that the signal intensity in an ion trap is calculated from
Figure 3. Variable amount of the AQUA peptide from 0, 16, 48
at 636.8 Th spiked in 132 000 cell equivalents of HeLa cell cytop
(B) LVINGNPITIFQER at 812.5 Th spiked in 6600 cell equivale
Th). The LC gradient was 60 min and all the LC/MS runs were pe
respectively.
Copyright # 2010 John Wiley & Sons, Ltd.
the time it takes to fill the trap up to a target value. One major
difference observed for these two peptides compared to the
other peptides is at lower quantity (48 fmol), even at their
maximum intensity, the target value for filling the ion trap is
not reached (result not shown). A different strategy would be
to reduce the ion target value and increase the number of
microscans but we have to expect that the dynamic range for
an ion trap for such an assay is lower than for a triple
quadupole mass spectrometer. In order to minimise the
, 160 and 480 fmol of (A) the AQUA form TPAQFDADELR
lasm extract (natural form in open circle at 631.8 Th) and
nts of HeLa cell cytoplasm extract (natural form at 807.4
rformed in duplicate. (C, D) Log-log scales of (A) and (B),
Rapid Commun. Mass Spectrom. 2010; 24: 1093–1104
DOI: 10.1002/rcm
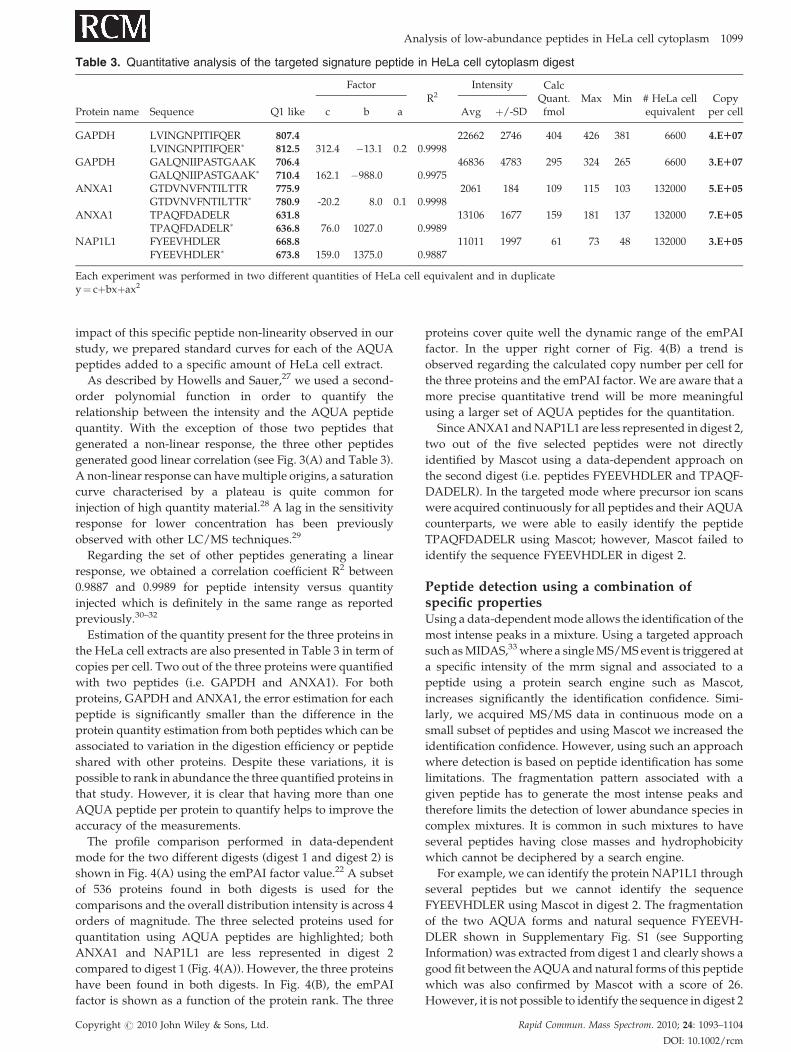
Table 3. Quantitative analysis of the targeted signature peptide in HeLa cell cytoplasm digest
Protein name Sequence Q1 like
Factor
R2
Intensity CalcQuant. Max Min # HeLa cell Copy
per cellc b a Avg þ/-SD fmol equivalent
GAPDH LVINGNPITIFQER 807.4 22662 2746 404 426 381 6600 4.ER07LVINGNPITIFQER� 812.5 312.4 �13.1 0.2 0.9998
GAPDH GALQNIIPASTGAAK 706.4 46836 4783 295 324 265 6600 3.ER07
GALQNIIPASTGAAK� 710.4 162.1 �988.0 0.9975ANXA1 GTDVNVFNTILTTR 775.9 2061 184 109 115 103 132000 5.ER05
GTDVNVFNTILTTR� 780.9 -20.2 8.0 0.1 0.9998ANXA1 TPAQFDADELR 631.8 13106 1677 159 181 137 132000 7.ER05
TPAQFDADELR� 636.8 76.0 1027.0 0.9989NAP1L1 FYEEVHDLER 668.8 11011 1997 61 73 48 132000 3.ER05
FYEEVHDLER� 673.8 159.0 1375.0 0.9887
Each experiment was performed in two different quantities of HeLa cell equivalent and in duplicatey¼ cþbxþax2
Analysis of low-abundance peptides in HeLa cell cytoplasm 1099
impact of this specific peptide non-linearity observed in our
study, we prepared standard curves for each of the AQUA
peptides added to a specific amount of HeLa cell extract.
As described by Howells and Sauer,27 we used a second-
order polynomial function in order to quantify the
relationship between the intensity and the AQUA peptide
quantity. With the exception of those two peptides that
generated a non-linear response, the three other peptides
generated good linear correlation (see Fig. 3(A) and Table 3).
A non-linear response can have multiple origins, a saturation
curve characterised by a plateau is quite common for
injection of high quantity material.28 A lag in the sensitivity
response for lower concentration has been previously
observed with other LC/MS techniques.29
Regarding the set of other peptides generating a linear
response, we obtained a correlation coefficient R2 between
0.9887 and 0.9989 for peptide intensity versus quantity
injected which is definitely in the same range as reported
previously.30–32
Estimation of the quantity present for the three proteins in
the HeLa cell extracts are also presented in Table 3 in term of
copies per cell. Two out of the three proteins were quantified
with two peptides (i.e. GAPDH and ANXA1). For both
proteins, GAPDH and ANXA1, the error estimation for each
peptide is significantly smaller than the difference in the
protein quantity estimation from both peptides which can be
associated to variation in the digestion efficiency or peptide
shared with other proteins. Despite these variations, it is
possible to rank in abundance the three quantified proteins in
that study. However, it is clear that having more than one
AQUA peptide per protein to quantify helps to improve the
accuracy of the measurements.
The profile comparison performed in data-dependent
mode for the two different digests (digest 1 and digest 2) is
shown in Fig. 4(A) using the emPAI factor value.22 A subset
of 536 proteins found in both digests is used for the
comparisons and the overall distribution intensity is across 4
orders of magnitude. The three selected proteins used for
quantitation using AQUA peptides are highlighted; both
ANXA1 and NAP1L1 are less represented in digest 2
compared to digest 1 (Fig. 4(A)). However, the three proteins
have been found in both digests. In Fig. 4(B), the emPAI
factor is shown as a function of the protein rank. The three
Copyright # 2010 John Wiley & Sons, Ltd.
proteins cover quite well the dynamic range of the emPAI
factor. In the upper right corner of Fig. 4(B) a trend is
observed regarding the calculated copy number per cell for
the three proteins and the emPAI factor. We are aware that a
more precise quantitative trend will be more meaningful
using a larger set of AQUA peptides for the quantitation.
Since ANXA1 and NAP1L1 are less represented in digest 2,
two out of the five selected peptides were not directly
identified by Mascot using a data-dependent approach on
the second digest (i.e. peptides FYEEVHDLER and TPAQF-
DADELR). In the targeted mode where precursor ion scans
were acquired continuously for all peptides and their AQUA
counterparts, we were able to easily identify the peptide
TPAQFDADELR using Mascot; however, Mascot failed to
identify the sequence FYEEVHDLER in digest 2.
Peptide detection using a combination ofspecific propertiesUsing a data-dependent mode allows the identification of the
most intense peaks in a mixture. Using a targeted approach
such as MIDAS,33 where a single MS/MS event is triggered at
a specific intensity of the mrm signal and associated to a
peptide using a protein search engine such as Mascot,
increases significantly the identification confidence. Simi-
larly, we acquired MS/MS data in continuous mode on a
small subset of peptides and using Mascot we increased the
identification confidence. However, using such an approach
where detection is based on peptide identification has some
limitations. The fragmentation pattern associated with a
given peptide has to generate the most intense peaks and
therefore limits the detection of lower abundance species in
complex mixtures. It is common in such mixtures to have
several peptides having close masses and hydrophobicity
which cannot be deciphered by a search engine.
For example, we can identify the protein NAP1L1 through
several peptides but we cannot identify the sequence
FYEEVHDLER using Mascot in digest 2. The fragmentation
of the two AQUA forms and natural sequence FYEEVH-
DLER shown in Supplementary Fig. S1 (see Supporting
Information) was extracted from digest 1 and clearly shows a
good fit between the AQUA and natural forms of this peptide
which was also confirmed by Mascot with a score of 26.
However, it is not possible to identify the sequence in digest 2
Rapid Commun. Mass Spectrom. 2010; 24: 1093–1104
DOI: 10.1002/rcm
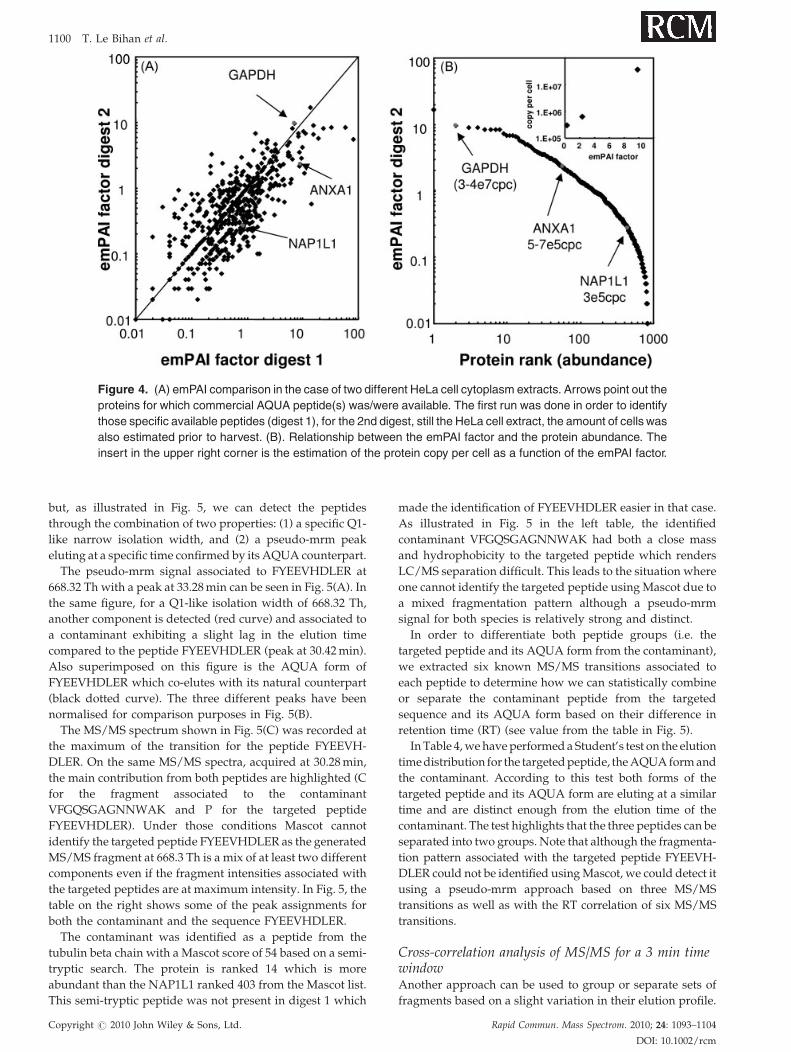
Figure 4. (A) emPAI comparison in the case of two different HeLa cell cytoplasm extracts. Arrows point out the
proteins for which commercial AQUA peptide(s) was/were available. The first run was done in order to identify
those specific available peptides (digest 1), for the 2nd digest, still the HeLa cell extract, the amount of cells was
also estimated prior to harvest. (B). Relationship between the emPAI factor and the protein abundance. The
insert in the upper right corner is the estimation of the protein copy per cell as a function of the emPAI factor.
1100 T. Le Bihan et al.
but, as illustrated in Fig. 5, we can detect the peptides
through the combination of two properties: (1) a specific Q1-
like narrow isolation width, and (2) a pseudo-mrm peak
eluting at a specific time confirmed by its AQUA counterpart.
The pseudo-mrm signal associated to FYEEVHDLER at
668.32 Th with a peak at 33.28 min can be seen in Fig. 5(A). In
the same figure, for a Q1-like isolation width of 668.32 Th,
another component is detected (red curve) and associated to
a contaminant exhibiting a slight lag in the elution time
compared to the peptide FYEEVHDLER (peak at 30.42 min).
Also superimposed on this figure is the AQUA form of
FYEEVHDLER which co-elutes with its natural counterpart
(black dotted curve). The three different peaks have been
normalised for comparison purposes in Fig. 5(B).
The MS/MS spectrum shown in Fig. 5(C) was recorded at
the maximum of the transition for the peptide FYEEVH-
DLER. On the same MS/MS spectra, acquired at 30.28 min,
the main contribution from both peptides are highlighted (C
for the fragment associated to the contaminant
VFGQSGAGNNWAK and P for the targeted peptide
FYEEVHDLER). Under those conditions Mascot cannot
identify the targeted peptide FYEEVHDLER as the generated
MS/MS fragment at 668.3 Th is a mix of at least two different
components even if the fragment intensities associated with
the targeted peptides are at maximum intensity. In Fig. 5, the
table on the right shows some of the peak assignments for
both the contaminant and the sequence FYEEVHDLER.
The contaminant was identified as a peptide from the
tubulin beta chain with a Mascot score of 54 based on a semi-
tryptic search. The protein is ranked 14 which is more
abundant than the NAP1L1 ranked 403 from the Mascot list.
This semi-tryptic peptide was not present in digest 1 which
Copyright # 2010 John Wiley & Sons, Ltd.
made the identification of FYEEVHDLER easier in that case.
As illustrated in Fig. 5 in the left table, the identified
contaminant VFGQSGAGNNWAK had both a close mass
and hydrophobicity to the targeted peptide which renders
LC/MS separation difficult. This leads to the situation where
one cannot identify the targeted peptide using Mascot due to
a mixed fragmentation pattern although a pseudo-mrm
signal for both species is relatively strong and distinct.
In order to differentiate both peptide groups (i.e. the
targeted peptide and its AQUA form from the contaminant),
we extracted six known MS/MS transitions associated to
each peptide to determine how we can statistically combine
or separate the contaminant peptide from the targeted
sequence and its AQUA form based on their difference in
retention time (RT) (see value from the table in Fig. 5).
In Table 4, we have performed a Student’s test on the elution
time distribution for the targeted peptide, the AQUA form and
the contaminant. According to this test both forms of the
targeted peptide and its AQUA form are eluting at a similar
time and are distinct enough from the elution time of the
contaminant. The test highlights that the three peptides can be
separated into two groups. Note that although the fragmenta-
tion pattern associated with the targeted peptide FYEEVH-
DLER could not be identified using Mascot, we could detect it
using a pseudo-mrm approach based on three MS/MS
transitions as well as with the RT correlation of six MS/MS
transitions.
Cross-correlation analysis of MS/MS for a 3 min timewindowAnother approach can be used to group or separate sets of
fragments based on a slight variation in their elution profile.
Rapid Commun. Mass Spectrom. 2010; 24: 1093–1104
DOI: 10.1002/rcm
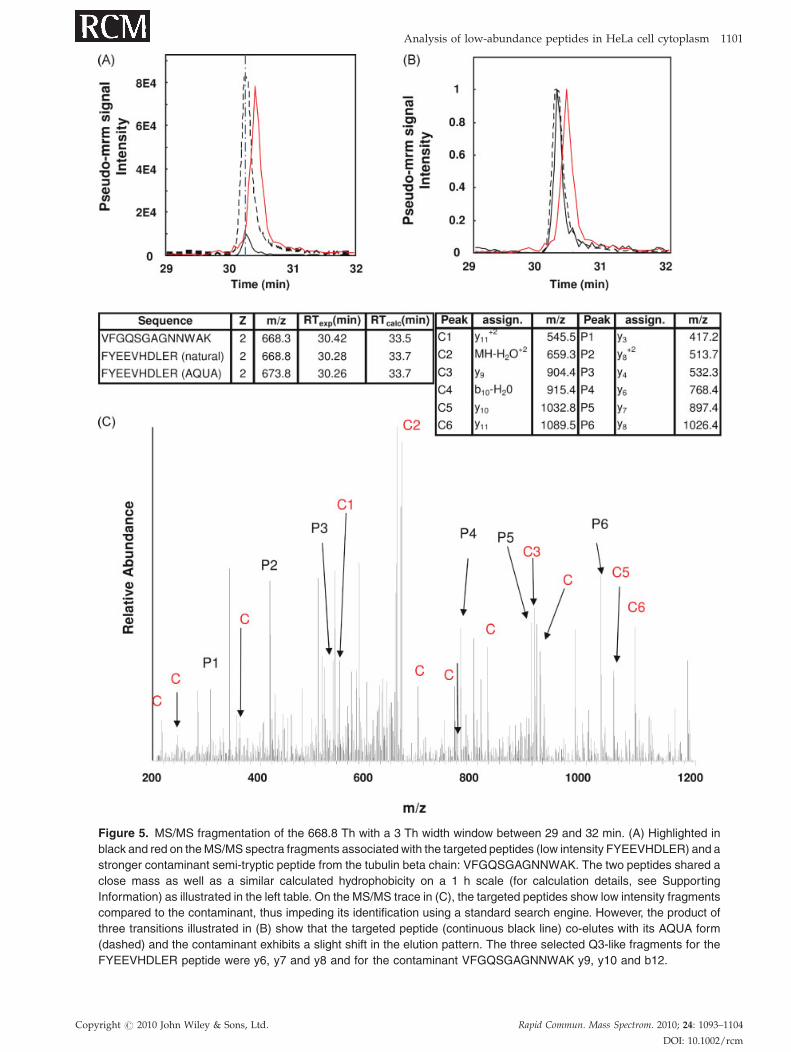
Figure 5. MS/MS fragmentation of the 668.8 Th with a 3 Th width window between 29 and 32 min. (A) Highlighted in
black and red on the MS/MS spectra fragments associated with the targeted peptides (low intensity FYEEVHDLER) and a
stronger contaminant semi-tryptic peptide from the tubulin beta chain: VFGQSGAGNNWAK. The two peptides shared a
close mass as well as a similar calculated hydrophobicity on a 1 h scale (for calculation details, see Supporting
Information) as illustrated in the left table. On the MS/MS trace in (C), the targeted peptides show low intensity fragments
compared to the contaminant, thus impeding its identification using a standard search engine. However, the product of
three transitions illustrated in (B) show that the targeted peptide (continuous black line) co-elutes with its AQUA form
(dashed) and the contaminant exhibits a slight shift in the elution pattern. The three selected Q3-like fragments for the
FYEEVHDLER peptide were y6, y7 and y8 and for the contaminant VFGQSGAGNNWAK y9, y10 and b12.
Copyright # 2010 John Wiley & Sons, Ltd. Rapid Commun. Mass Spectrom. 2010; 24: 1093–1104
DOI: 10.1002/rcm
Analysis of low-abundance peptides in HeLa cell cytoplasm 1101

Table 4. Student test on the RT distribution for the natural and AQUA form of FYEEVHDLER and the contaminant
VFGQSGAGNNWAK
Peptidescomparison
Degree offreedom
Student test
ConclusionTtheor a¼ 0.05 Tcalc
1 vs. 2 10 2.23 1.92 Acceptance of the equality hypothesis of the RTmax value for an a¼ 0.051 vs. 3 10 2.23 11.77 Rejection of the equality hypothesis of the RTmax for an a¼ 0.052 vs. 3 10 2.23 15.88 Rejection of the equality hypothesis of the RTmax for an a¼ 0.05
1 FYEEVHDLER2 FYEEVHDLER (AQUA form)3 VFGQSGAGNNWAK (contamination)
Note: Hypothesis: Normal distribution of RTmax
Figure 6. Cross-correlationanalysis forselectedsets of identified fragments for a Q1-likeof668.8Thbetween
29 and 32 min time window. (A) Table showing the magnitude of the correlation coefficient for the time series of
the selected fragment pairs and (B) colour density plot of the correlation coefficient data shown in the table
above.
1102 T. Le Bihan et al.
Such approaches have been used with other types of
spectroscopy like infrared, Raman or NMR, and referred
to as two-dimensional correlation spectroscopy obtained by
cross-correlation analysis.34 Such a tool has been previously
used to detect similarity across different spectra in order to
Copyright # 2010 John Wiley & Sons, Ltd.
define an optimal set of transitions to represent a peptide by
an MRM type of assay.35 Applied to our particular case,
group of fragments that co-elute will generate a correlation
signal. In Fig. 6 the time window is limited to 3 min (from 29
to 32 min) and only 12 fragments are interrogated (6 from the
Rapid Commun. Mass Spectrom. 2010; 24: 1093–1104
DOI: 10.1002/rcm

Figure 7. Number of associated peptides out of the exper-
imental pool of 1295 peptides in bin of 1. (A) The sets of similar
features are an m/z of �1.5 Th, a calculated hydrophobicity
of �8.2 min and at least three MS/MS fragments in common.
(B) The conditions are similar except that the rule for similar
fragments is more stringent; we looked at the most intense
experimental b/y ion where at least one of the fragments has a
mass/charge ratio higher than the precursor ion and we
eliminate any fragment ion shorter than b3 or y3. Those were
the criteria used for the pseudo-mrm experiments performed
in this study.
Analysis of low-abundance peptides in HeLa cell cytoplasm 1103
targeted peptides P1 to P6 and 6 from the identified
contamination C1 to C6). Ideally, such a procedure can be
extended and optimised to longer time windows in an
automated manner where each of the fragments are
interrogated against each other and clustered based on their
correlation factor. However, such a global analysis is beyond
the scope of this work.
The average cross-correlation pairing extracted from Fig.
6(A) for P-P fragments was 0.77� 0.23 while for the C-C
fragments the cross-correlation was 0.93� 0.06. A lower
cross-correlation for a C-P pair of 0.36� 0.17 has been
measured. A more detailed analysis of those cross-corre-
lations is illustrated in Fig. 6(B) where the dark green zone is
associated with strong correlation while the white area
implies lack of correlation. The fragment p3 (associated with
the y4 ion from the targeted peptide) has in general a lower
correlation with the rest of the P fragments whilst the
fragment p5 (ion y7 at 897.4 Th for the targeted peptide)
shows some level of cross-correlation with the fragments c3,
c4, c5 and c6. A more in-depth analysis of the fragmentation
pattern of the contaminant peptides VFGQSGAGNNWAK
highlights the possibility of a fragment with multiple loss of
b10-H2O-NH3 at approx. 897.4 Th which could explain this
higher correlation value between p5 and the C group.
In silico human proteome digest and interrogation basedon using the concept of combination of propertiesThe concept of combining mass and retention time as a tool to
interrogate different proteomes has been described pre-
viously.36 In Supplementary Fig. S3 (see Supporting Infor-
mation), we illustrate a global representation of the tryptic
digest for the human proteome defined in the following space:
mass/charge as a function of the calculated elution time. The
elution time was calculated using the measured 1 h hydro-
phobic scale (see Supplementary Fig. S4, Supporting Infor-
mation). The space coverage is quite similar to that previously
reported.36 Short peptides are more dominant with an elution
time centered around 30 min in our case.
As the retention time and a given mass are not enough to
identify a given peptide, we introduce the use of at least three
specific MS/MS fragments. A total of 1295 peptides
identified from a 1 h LC/MS run were interrogated against
the human trypsinosome.
For each of the experimental 1295 peptides we extracted
their mass/charge as a double and triple charge, the time
where they were selected for MS/MS (close to the RT), and
we also extracted their identified MS/MS fragments. We use
the combination of RT and mass/charge ratio to identify in
the overall in silico trypsinosome how many peptides could
also fit those criteria. We use this set of RT �8.2 min (95%
confidence for peptide elution time prediction) and sharing
an m/z value within a window of �1.5 Th (either as a 2þ and
3þ) with the experimental set of peptides. Such an m/z
window is similar to the one used in our pseudo-mrm assay.
An additional constraint was also imposed to complete the
set of combinations of properties each set of paired
experimental and in silico peptides should have: any three
y or b fragments in common. The pairing result is shown in
Fig. 7(A). On average each experimental peptide under these
conditions fits at least 20 of the in silico peptides. The lack of
Copyright # 2010 John Wiley & Sons, Ltd.
specificity in this case is due amongst other things to a shared
similarity at the level of the low mass fragment (b1, b2, b3 or
y1, y2, y3) which are not specific enough as a unique feature;
such an observation is detailed in Sherman et al.37
In Fig. 7(B) we use a more stringent criterion, i.e. the most
intense experimental b/y ion where at least one of the
fragments has a mass/charge ratio higher than the precursor
ion and we eliminate any fragment ion with shorter sequence
than b3 or y3. Those were also the criteria used for the
pseudo-mrm experiments in this study. In Fig. 7(B) of the
pool of 1295 peptides 61 peptides under these conditions did
not return any sequence and only three more peptides were
incorrectly identified which means that more than 95% of the
peptides were correctly identified. Of the 1295 peptides, a
total of 1027 peptides generate a unique corresponding good
sequence which represents approximately 80% of them and
an average of 1.26 in silico peptide per experimental one. As a
consequence only 20% of the peptides generate more than
one possibility with these criteria of �1.5 Th mass/charge
range, a calculated hydrophobicity of �8.2 min and the
above set of rules to select three MS/MS fragments.
Additionally, such an approach can be used to increase the
specificity of the selected peptide having unique features not
from a sequence point of view but rather from its
physicochemical behaviour. As an example, the sequence
FQIATVTEK shared with at least 30 other tryptic peptides a
similar hydrophobicity, mass/charge and high stringent
fragmentation pattern.
By using a basic in silico analysis of peptide properties we
show that it is possible to correctly identify a peptide with a
minimal level of information such as its mass, its hydro-
phobicity (expressed in elution time RT), and three specific
Rapid Commun. Mass Spectrom. 2010; 24: 1093–1104
DOI: 10.1002/rcm
1104 T. Le Bihan et al.
b/y fragments. In this interrogation mode we did not include
the use of an AQUA peptide which adds another level of
confirmation (i.e. co-elution can be monitored in the range of
a few seconds) and reduces drastically the need to confirm
peptide hits by a search engine.
CONCLUSIONS
In this study we have used a linear ion trap in a pseudo-mrm
mode as an effective tool for targeted absolute quantitative
proteomics. We also present a new way of generating a
pseudo-mrm signal which is performed post-acquisition by
combining the intensity product of at least three fragment
transitions in order to increase the specificity of the signal.
Using different approaches we have shown that it is possible
to detect a given peptide without necessarily identifying it
using a search engine such as Mascot. Peptide identification
using Mascot implies that at a given time its fragments
generate a signal that is high enough to be the dominant one.
However, such a situation limits the dynamic range of peptide
detectability. Definition of a set of unique features that can be
used to detect a given peptide is therefore attractive. In this
study, we used a combination of various features such as a
given retentiontime (similar to its AQUA form),and co-elution
of three fragments for a small Q1-like window. We interrogate
in a relatively simple manner the human proteome in order to
validate the uniqueness ofcombiningspecificproperties. From
the set of 1295 peptides only 61 peptides did not generate a
correct in silico match which can be due to the range of the
calculated hydrophobicity (a window of �8.2 min generates
an interval of 95% confidence). Interestingly, more than 80% of
the peptide generate a single hit which helps support the fact
that peptide detection based only on specific combination of
properties is possible without the need to use a search engine
like Mascot.
We also explored the use of cross-correlation analysis in
order to highlight the elution pattern of a group of peptide
fragments from two different peptides sharing similar mass
and hydrophobicity. We showed that it is possible to clearly
separate most of the fragments from both peptides which are
co-eluting with 8 s difference. In this study, we used two
different approaches in order to assess the mixed population of
peptide fragments; t-test and cross-correlation analysis. Both
methods confirm that we have a mixed population of
fragments. The visual aspect of the cross-correlation analysis
approach allows rapid detection of some potential outlayers
such as multiple fragments from different peptides but having
a similar mass. Another interesting aspect of the cross-
correlation analysis approach is related to the fact that it can be
used to decipher the various fragments without any prior
knowledge of their origin, in contrast to the t-test. Cross-
correlation analysis as a tool to segregate fragments based on a
slight difference in their elution pattern could potentially be
applied to larger mass and time ranges, although this will
definitely present a computational challenge.
SUPPORTING INFORMATION
Additional supporting information may be found in the
online version of this article.
Copyright # 2010 John Wiley & Sons, Ltd.
AcknowledgementsWe are grateful to Dr Natasha Savage who generated the
in silico digest of all human protein. TLB, SM and TF are
funded by the CSBE Centre for Integrative and Systems
Biology. The Centre for Systems Biology at Edinburgh (CSBE)
is a Centre for Integrative Systems Biology (CISB) funded by
BBSRC and EPSRC; reference BB/D019621/1. RG is funded by
the Scottish Universities Life Sciences Alliance (SULSA).
REFERENCES
1. Oppermann FS, Gnad F, Olsen JV, Hornberger R, Greff Z,Keri G, Mann M, Daub H. Mol. Cell. Proteomics. 2009; 8: 1751.
2. Cantin GT, Yi W, Lu B, Park SK, Xu T, Lee JD, Yates JR 3rd.J. Proteome Res. 2008; 7: 1346.
3. Babu M, Krogan NJ, Awrey DE, Emili A, Greenblatt JF.Methods Mol. Biol. 2009; 548: 187.
4. Picotti P, Bodenmiller B, Mueller LN, Domon B, AebersoldR. Cell 2009; 138: 795.
5. Valentine SJ, Plasencia MD, Liu X, Krishnan M, Naylor S,Udseth HR, Smith RD, Clemmer DE. J. Proteome Res. 2006; 5:2977.
6. Whitelegge JP. Plant Physiol. Biochem. 2004; 42: 919.7. Chen EI, Hewel J, Felding-Habermann B, Yates JR 3rd. Mol.
Cell. Proteomics. 2006; 5: 53.8. Le Bihan T, Robinson MD, Stewart II, Figeys D. J. Proteome
Res. 2004; 3: 1138.9. Fusaro VA, Mani DR, Mesirov JP, Carr SA. Nat. Biotechnol.
2009; 27: 190.10. Chen VC, Chou CC, Hsieh HY, Perreault H, Khoo KH.
J. Mass Spectrom. 2008; 43: 1649.11. Claassen M, Aebersold R, Buhmann JM. Bioinformatics 2009;
25: 154.12. Locke SJ, Leslie AD, Melanson JE, Pinto DM. Rapid Commun.
Mass Spectrom. 2006; 20: 1525.13. Kuhn E, Wu J, Karl J, Liao H, Zolg W, Guild B. Proteomics
2004; 4: 1175.14. Schmidt A, Claassen M, Aebersold R. Curr. Opin. Chem. Biol.
2009; DOI: 10.1016/j.cbpa.2009.08.016.15. Mead JA, Bianco L, Bessant C.Proteomics 2010, PMID: 20077412.16. Sherwood CA, Eastham A, Lee LW, Peterson A, Eng JK,
Shteynberg D, Mendoza L, Deutsch EW, Risler J, Tasman N,Aebersold R, Lam H, Martin DB. J. Proteome Res. 2009; 8: 4396.
17. Mollah S, Wertz IE, Phung Q, Arnott D, Dixit VM, Lill JR.Rapid Commun. Mass Spectrom. 2007; 21: 3357.
18. Arnott D, Kishiyama A, Luis EA, Ludlum SG, Marsters JC Jr,Stults JT. Mol. Cell. Proteomics 2002; 1: 148.
19. Licklider LJ, Thoreen CC, Peng J, Gygi SP. Anal. Chem. 2002;74: 3076.
20. Le Bihan T, Duewel HS, Figeys D. J. Am. Soc. Mass Spectrom.2003; 14: 719.
21. www.unimod.org.22. Ishihama Y, Schmidt T, Rappsilber J, Mann M, Hartl FU,
Kerner MJ, Frishman D. BMC Genomics 2008; 9: 102.23. http://discover.nci.nih.gov/gominer/.24. http://www.genecards.org/.25. http://harvester.fzk.de/harvester/.26. Izrael-Tomasevic A, Phu L, Phung QT, Lill JR, Arnott D.
J. Proteome Res. 2009; 8: 3132.27. Howells L, Sauer MJ. Analyst 2001; 126: 155.28. Shi G. Rapid Commun. Mass Spectrom. 2003; 17: 202.29. Zhang T, Brajter-Toth A. Anal. Chim. Acta 2001; 442: 97.30. Keshishian H, Addona T, Burgess M, Kuhn E, Carr SA. Mol.
Cell. Proteomics 2007; 6: 2212.31. Kay RG, Gregory B, Grace PB, Pleasance S. Rapid Commun.
Mass Spectrom. 2007; 21: 2585.32. Anderson L, Hunter CL. Mol. Cell. Proteomics 2006; 5: 573.33. Unwin RD, Griffiths JR, Leverentz MK, Grallert A, Hagan
IM, Whetton AD. Mol. Cell. Proteomics 2005; 4: 1134.34. Noda I, Ozaki Y. Two-dimensional Correlation Spectroscopy:
Applications in Vibrational and Optical Spectroscopy. JohnWiley: Chichester, 2004.
35. Jiu J, Hewel JA, Fong V, Chan Shen Yue M, Emili A. Clin.Proteomics 2009; 5: 3.
36. Norbeck AD, Monroe ME, Adkins JN, Anderson KK, DalyDS, Smith RD. J. Am. Soc. Mass Spectrom. 2005; 16: 1239.
37. Sherman J, McKay MJ, Ashman K, Molloy MP. Proteomics2009; 9: 1120.
Rapid Commun. Mass Spectrom. 2010; 24: 1093–1104
DOI: 10.1002/rcm
Copyright © 2022 FDOKUMEN