Performance of the AOAC use-dilution method with targeted ...

OPEN JOURNAL OF CHEMICAL ENGINEERING AND SCIENCEIn Press
OPEN JOURNAL OF CHEMICAL ENGINEERING AND SCIENCE
An Improved Flammability Diagram forDilution and Purge on Gas MixturesTingguang Ma*, Michael D. Larraaga499 Cordell South, Stillwater, OK 74075
*Corresponding author: [email protected]
Abstract:Flammability diagrams are frequently used for guiding dilution and purge operations. HereJones diluted flammability diagram is further developed to include the theoretical envelope andanalytical dilution/purge lines. A thermal explanation is provided for this theoretical flammabilitydiagram. With theoretical dilution/purge curves, this diagram provide the same results asthose from Zabetakis tertiary diagram. Comparing with experimental diagram, this theoreticalapproach is more conservative and has the advantages of flexibility on various fuel/diluents.Practical problems are solved to demonstrate the utility and the equivalency with existing tertiarydiagrams. It will be an important tool for guiding both educational and industrial practices.
Keywords:Flammability Diagram; Thermal Balance Method; Dilution; Purge; Analytical Flammability
1. INTRODUCTION
As a precaution against potential explosions, flammability diagram plays an important role on guidingsafe operations on flammable gas mixtures, especially through dilution and purge. Depending onapplication fields, there are four types of flammability diagrams proposed in history with differentemphasis on standard flammability diagram [1], Cowards explosive triangle [1], Jones diluted flammabilitydiagram [2] and Zabetakis tertiary diagrams [3]. Standard flammability diagram uses diluent as input,fuel as output, focusing the role of a diluent. It is most useful to display the effectiveness of a diluent,so widely used in the field of suppression [4, 5]. Jones diluted flammability diagram uses diluent/fuelratio as input, sum of fuel and diluent as output to present the flammable state of a composition. It wasoriginally proposed to guide dilution, while it is more used to present the flammability of a diluted fuel.Application of Le Chateliers rule with a diluent involved need such a diagram, which was summarizedby Zhao [6]. Cowards explosive triangle displays the oxygen requirement as a result of fuel inputs. Therole of a diluent is implicitly embedded. It has some advantages on complex gases, where oxygen plays avital role on controlling energy release. Recently, this diagram was tailored to include the impact of avariable oxygen background [7]. Only Zabetakis tertiary diagram has three axis to display changes in fuel,oxygen and nitrogen separately, so it has the advantages for gas handling, with clearly-defined criticalpoints, such as LOC (limiting oxygen concentration), OSFC (out-of-the-service fuel concentration), ISOC(In-service oxygen concentration), etc. [8]. Since it has the widest coverage on all possibilities, it gainsthe position as a universal tool with wide industrial acceptance [9].
1
An Improved Flammability Diagram for Dilution and Purge on Gas Mixtures
Generally, a good flammability diagram should meet the following goals: coverage, intuitiveness(simplicity), and convenience. In terms of coverage, Cowards explosive triangle has some advantageover others, since it changes all fuels into an oxygen limit, it is advantageous to deal with complex gases,such as those encountered in a mine fire. For intuitiveness, Zabetakis tertiary diagram is the best method,since no conversion is necessary to read data directly from the diagram. It is widely used for guidinggas-handling operations. Industry practice involves various dilution and purge operations, so the dilutionratio is preferred as the controlling variable, which places the Jones diluted flammability diagram in abetter position.
One of the challenges of most flammability diagrams is that historical data are presented in variousforms, so the availability of suitable data is the major limiting factor for a certain diagram. Here, theJoness flammability diagram is derived from a thermal theory. It removes the need for experimentaldata on various combination of fuel /diluent /oxygen. Since all diagrams are equivalent, the theoreticalflammability diagram will provides the same guidance function as other diagrams, though all methods areequivalent to each other if the experimental data are available.
Here is the organization of this work. Since the theory has been developed elsewhere, applicationsto dilution and purge will be presented here. The flammability diagrams for some fuels are developedfirst. The thermal nature of flammability diagrams is discussed next. Then dilution and purge curves arederived and displayed. Finally, several problems are solved to show the utility and the coverage of thistheoretical flammability diagram.
2. THEORY DEVELOPMENT
2.1 The theoretical flammability diagram
The backbone of the theoretical flammability diagram is the thermal balance method, which is developedin a series of papers [10–12]. It has been applied to suppression engineering [13], mine gas safety [7]and clean-gas burning technologies [14]. Generally, only three inputs (Co, Ho, QF ) for the fuel plus oneinput for the diluent (QD) are needed to develop the flammability envelope for a fuel [11]. For a pure fuelburning in air, the flammability envelope is bounded by two lines, LFL line (equation 1) and UFL line(equation 2).
xL =1
1+ COHO1+R −
QF1+R −
QDR1+R
(1)
xU =λ ·HO−Qm
λ ·HO−Qm + QF1+R + QD·R
1+R
(2)
Here QF and Ho are derived from LFL and UFL, which can be looked as fundamental thermal propertiesor the thermal signature of the fuel. QD is the quenching potential of the diluents, QD = 0.992 for nitrogen,and QD = 1.75 for carbon dioxide. Qm = λ ·Q0 +(1−λ ) ·QN is the quenching potential of oxygenmodified air. If the oxygen fraction λ is 0.2095 for normal air, then Qm = 1. Details of the derivation canbe found in Ma [11].
Coward and Jones [15] provide the flammability diagrams for 6 fuels. For each fuel, the theoreticalflammability envelope can be reconstructed. They are compared in Figure 1 .
Figure 1 shows the flammability envelopes for 6 fuels using different diluents (nitrogen and carbondioxide). Saturated hydrocarbon (methane & ethane) fuels are better predicted, while unsaturatedhydrocarbons are poorly predicted near the inertion. The major source of error comes from the assumption
2

OPEN JOURNAL OF CHEMICAL ENGINEERING ANDSCIENCE
(a) Hydrogen (b) Carbon monoxide
(c) Methane (d) Ethane
(e) Propene (f) Cyclopropane
Figure 1. Theoretical flammability diagrams for pure fuels.
on a constant flame temperature, while initial measurement (some UFLs in the early days were significantlydifferent from its current value, for example, see Figure 1(a) .) and the incomplete reaction at the upperlimits also contributes to the deviation. Macek [16] has observed that while most flammability envelopesdevelop along the stoichiometric line, some chemicals have an envelope tilted upwards, toward thestoichiometric line for carbon monoxide production. So there is a possibility that the experimentalenvelope will skew outside the theoretical envelope. This is the uncertain part difficult to model with asimple chemical reaction scheme.
Though not limited to any fixed flame temperature, the theoretical envelopes are based on a constanttemperature threshold on ignition. If the flame temperature is raised (commonly at extinction), the inertionrequirement is less than theoretic requirement. So the inertion requirement is always smaller than thetheoretical value, which gives the theoretical envelope a conservative nature on inertion. Only when we areusing the fuel as a diluent, the incomplete reaction and the UFL boundary become significant. However,there is not many industrial practices using fuel as a diluent. So theoretical flammability diagrams arealways conservative at guiding dilution operations.
3

An Improved Flammability Diagram for Dilution and Purge on Gas Mixtures
2.2 A thermal explanation to the flammability diagram
Currently, there is no simple method to estimate the flammability limits, except Le Chateliers rule andits variations. The important reason preventing a generic theory from being proposed is the belief thatflame can propagate indefinitely in the mixture. Any heat losses, by conduction, convection or radiationfrom the flame and radical losses due to diffusion and convection may be the cause of flame extinction.The discussion on flame stability masks the thermal nature of an ignition, where the majority of heatproduction is absorbed by the mass of all constituents in reaction.
In this work, flammability problem is approached more like a thermal balance problem at ignition. Soflammability is estimated as the ability to keep sustained ignition. Though assumptions on fast reactionand complete chemistry introduce significant errors, especially at UFL side, it is still a simple methodcomparable with Le Chateliers rule [10]. In addition, it can deal with diluent and temperature in aconsistent way, which Le Chateliers rule cannot. The success of this method lies on the binary view ofconstituents in a reaction, either heating or absorbing.
Here we can have a thermal check on flammability. Two variables are introduced to explain thecontribution of the fuel and the oxygen respectively. The fuel controls the energy release in the fuel-leanzone, while the oxygen controls the energy release in the fuel-rich zone.
HQR1 =COHOxF
QF xF +QOxO +QDxD=
fuelheatingpotentialmixturequenchingpotential
(3)
HQR2 =HO · xO
QF xF +QOxO +QDxD=
oxidizerheatingpotentialmixturequenchingpotential
(4)
If HQR1 > 1 , the fuel heating potential is more than the mixture quenching potential, which meansfuel is sufficient to burn, or x > xL .
If HQR2 < 1 , the oxygen heating potential is more than the mixture quenching potential, which meansoxygen is sufficient to burn, or x < xU .
The total energy release is limited by both fuel and oxygen, or the smaller of the two, as shown inequation (5). The distribution of HQR in the flammability domain is shown in Figure 2 .
HQR = min(HQR1,HQR2) (5)
If HQR > 1 , the fuel or oxygen-based heating potential is more than the mixture quenching potential,which means the mixture is flammable, or xL < x < xU . So the flammability envelope is controlled byHQR = 1 , as shown in Figure 2 (d).
Basically, the flammability envelope covers the region where the heating potential is larger than thequenching potential of the mixture. Using HQR=1 to get the iso-contour line, the resulting peninsula isthe theoretical flammability envelope in the diluted flammability diagram (see Figure 1(b) ).
2.3 Flammable state of a mixture
In addition, lines of xL , xU and RLU will divide the flammability diagram in to 4 zones of interests,dangerous (including rich/lean/flammable & explosive), non-flammable (inerted), non-explosive (diluted),and non-flammable & non-explosive (diluted & inerted), which are clearly shown in Figure 3 . Here dilu-tion is specifically referred as the concentration drop, no matter what diluent is used, while inertion means
4

OPEN JOURNAL OF CHEMICAL ENGINEERING ANDSCIENCE
Figure 2. The distribution of HQR in the flammability domain for carbon monoxide.
Figure 3. Four zones in a flammability diagram [17].
the quenching potential of a diluent is included. For details about the difference between flammabilityand explosibility, see [17].
Most safe operations on a mixture require that the operation point should be not only lower than LFL,but also into the non-explosive region. This places a high demand on the inertion point, which is the crosspoint of LFL and UFL lines. Theoretical inertion point is controlled by equation (6) & (7). These twocritical values determine the boundary of a safe zone (non-flammable or non-explosive) in Figure 3 .
5

An Improved Flammability Diagram for Dilution and Purge on Gas Mixtures
Table 1. Experimental and theoretical inertion point for different fuels.
Fuel Exp. RLU Exp. xLU The. RLU The. xLU
Benzene 21.18 0.43 40.06 0.54
Butadiene 17.37 0.50 22.93 0.48
Butane 17.55 0.43 23.72 0.44
Carbon Monoxide 4.08 0.73 4.61 0.70
cyclopropane 13.75 0.46 19.34 0.49
Ethane 12.88 0.47 15.61 0.50
Ethylene 13.16 0.52 21.68 0.62
Hexane 25.93 0.44 37.29 0.46
hydrogen 16.42 0.76 21.57 0.91
methane 5.77 0.42 9.44 0.52
Pentane 22.60 0.45 32.50 0.47
propylene 15.14 0.46 19.34 0.49
RLU =λ ·COH2
O−COHO−λ ·HOQF
λ ·HO ·QD(6)
xLU =1
1+ COHO1+RLU
− QF1+RLU
− QDRLU1+RLU
(7)
A comparison of experimental and theoretical inertion points for 12 fuels is shown in Table 1 .Comparing with experimental data, all theoretical inertion point except carbon monoxide lies to the rightand the above of the experimental data. So the safe operations based on the theoretical inertion point arealways more conservative than the experimental inertion point, which is also displayed in Figure 1 . Thisgives the theoretical envelope an advantageous position if no experimental data is available.
3. Safe Operations on a mixture
3.1 Dilution
Historically, dilution and purge are not well defined. Dilution usually is used to drop the concentrationby adding a diluent. However, purge is also to drop the concentration by adding a diluent. Here for atertiary mixture, if one concentration is changed along with another, this is dilution. If one concentrationis changed by simultaneously changing another two, this is a purge process. So purge involves threespecies, while dilution involves only two species. Purge involves a compartment, while dilution happensfor a flow stream, where the concentration of any species can be controlled freely. Dilution process willleave one species concentration constant, while all concentrations will change in a purge process.
Based on this definition, one concentration change by dilution is realized through reversing anotherconcentration. Here we have 3 combinations, diluent/air, fuel/air, and diluent/fuel. Their dilution curvesare controlled by the following curves.
For the diluent/air dilution:xm = xF,0 · (1+R) (8)
For the fuel/air dilution:
6

OPEN JOURNAL OF CHEMICAL ENGINEERING ANDSCIENCE
Figure 4. Dilution operation in the flammability diagram.
xm = xD,0 ·(
1+1R
)(9)
For the fuel/diluent dilution:xm = xF,0 + xD,0 =C (10)
All 3 operations based on equations (8-10) are shown in Figure 4 .
3.2 Purge
Comparing with two-species operation by dilution, a purge process always involves 3 species. Addingone species will always change another two.
For the purge process by the diluent:
xm =xF,0 · (1+R)
R · xF,0 +1− xD,0(11)
For the purge process by the fuel:
xm =xD,0 · (1+R)
R(1− xF,0)+ xD,0(12)
For the purge process by the air:R = R0 (13)
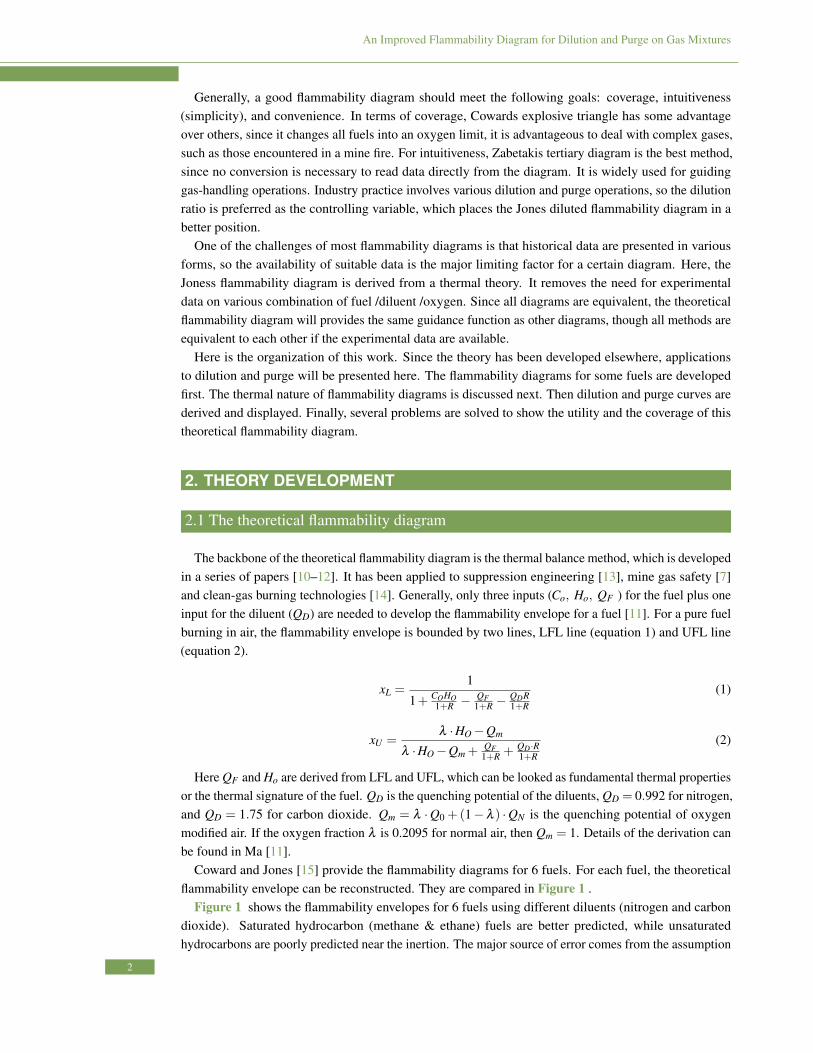
Combining these three curves into the flammability diagram, we have the purge operation curves asshown in Figure 5 .
7
An Improved Flammability Diagram for Dilution and Purge on Gas Mixtures
Figure 5. Purge operation in the flammability diagram
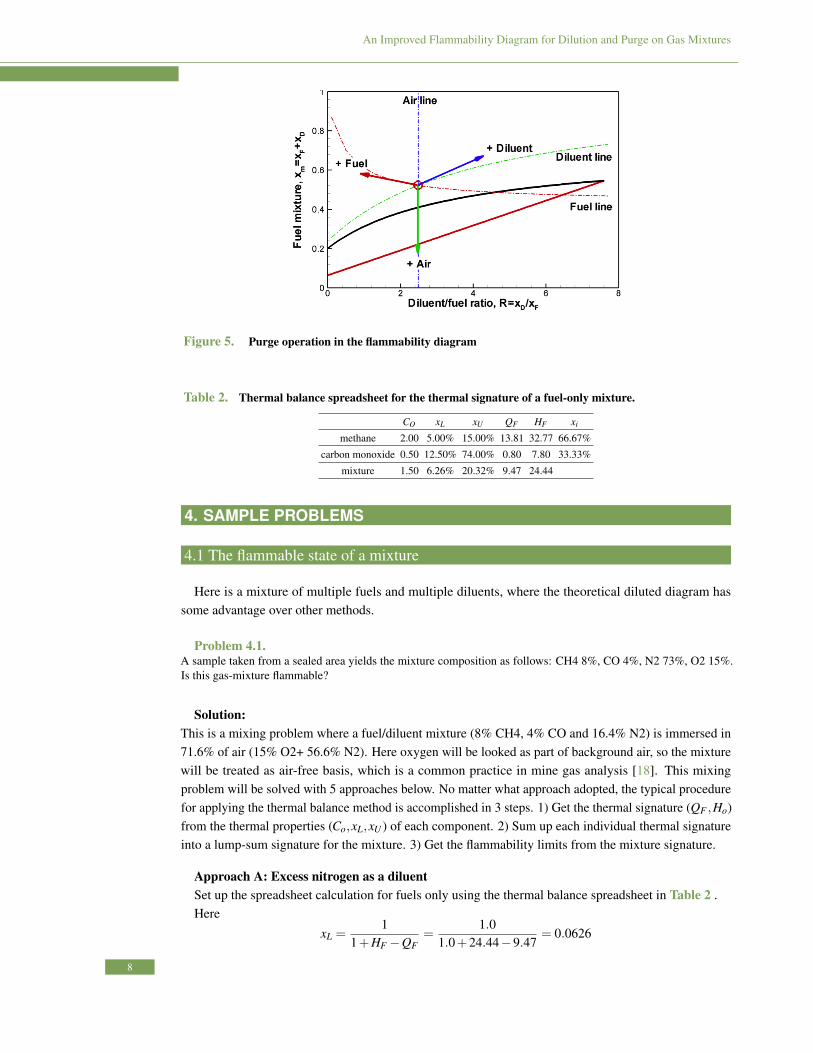
Table 2. Thermal balance spreadsheet for the thermal signature of a fuel-only mixture.
CO xL xU QF HF xi
methane 2.00 5.00% 15.00% 13.81 32.77 66.67%
carbon monoxide 0.50 12.50% 74.00% 0.80 7.80 33.33%
mixture 1.50 6.26% 20.32% 9.47 24.44
4. SAMPLE PROBLEMS
4.1 The flammable state of a mixture
Here is a mixture of multiple fuels and multiple diluents, where the theoretical diluted diagram hassome advantage over other methods.
Problem 4.1.A sample taken from a sealed area yields the mixture composition as follows: CH4 8%, CO 4%, N2 73%, O2 15%.Is this gas-mixture flammable?
Solution:This is a mixing problem where a fuel/diluent mixture (8% CH4, 4% CO and 16.4% N2) is immersed in71.6% of air (15% O2+ 56.6% N2). Here oxygen will be looked as part of background air, so the mixturewill be treated as air-free basis, which is a common practice in mine gas analysis [18]. This mixingproblem will be solved with 5 approaches below. No matter what approach adopted, the typical procedurefor applying the thermal balance method is accomplished in 3 steps. 1) Get the thermal signature (QF ,Ho)from the thermal properties (Co,xL,xU ) of each component. 2) Sum up each individual thermal signatureinto a lump-sum signature for the mixture. 3) Get the flammability limits from the mixture signature.
Approach A: Excess nitrogen as a diluentSet up the spreadsheet calculation for fuels only using the thermal balance spreadsheet in Table 2 .Here
xL =1
1+HF −QF=
1.01.0+24.44−9.47
= 0.0626
8

OPEN JOURNAL OF CHEMICAL ENGINEERING ANDSCIENCE
Figure 6. Excess nitrogen is serving as a diluent and as part of a fuel.
xU =λ ·HO−1
λ ·HO−1+QF=
0.2095×16.30−1.00.2095×16.30−1.0+9.47
= 0.2032
However, this is a fuel mixture burning in air, so we have to include excess nitrogen. Here toinclude the impact of excess nitrogen (16.4%), we need a diluent/fuel ratio in this treatment, whereR=16.4%/12%=1.367. So we have the projected flammable range for such a fuel/diluent mixture calculatedbelow.
xL =Qm
Qm + COHO1+R −
QF1+R −
QDR1+R
=1.0
1.0+ 24.441.367+1 −
9.471.367+1 −
0.992×1.3671.367+1
= 0.143
xU =λ ·HO−Qm
λ ·HO−Qm + QF1+R + QD·R
1+R
=0.2095×16.30−1.0
0.21×16.3−1.0+ 9.471.367+1 +
0.992×1.3671.367+1
= 0.344
Now the measured concentration of fuel/diluent is xm = 28.4% = 8%+4%+16.4% , within the rangeof 14.3∼34.4%, so this mixture is flammable. In this approach, nitrogen is truly serving as a diluent.
The graphical representation of the above calculations is shown in Figure 6 .
Approach B: Excess nitrogen as part of a pseudo fuel.This approach includes the excess nitrogen as part of a pseudo fuel, as shown in Table 3 .
Table 3. Thermal balance spreadsheet with nitrogen as part of the fuel mixture.
CO xL xU QF HF xi
methane 2.00 5.00% 15.00% 13.81 32.81 28.16%
carbon monoxide 0.50 12.50% 74.00% 0.80 7.80 14.08%
Nitrogen 0.99 57.57%
mixture 0.65 14.26% 34.40% 4.60 10.61 100 %
Here with the excess nitrogen as part of the fuel, the flammable range is directly calculated, as shownalso in Figure 6 .
xL =1
1+HF −QF=
1.01.0+10.61−4.6
= 0.1426
9

An Improved Flammability Diagram for Dilution and Purge on Gas Mixtures
Table 4. Thermal balance spreadsheet for a fuel mixture burning in oxygen-modified air.
CO xL xU QF HF xi
methane 2.00 5.00% 15.00% 13.8 32.77 66.67%
carbon monoxide 0.50 12.50% 74.00% 0.80 7.80 33.33%
mixture 1.50 6.37% 15.5% 9.47 24.44
xU =λ ·HO−1
λ ·HO−1+QF=
0.2095×16.3−1.00.2095×16.30−1.0+4.6
= 0.344
Current measurement of the fuel/diluent mixture is 28.4%, which is within the flammable range of14.26∼34.4 %, so this mixture is flammable. The flammable state of this mixture is shown (see Figure 6).
Approach C: Excess nitrogen as part of oxygen-modified air.Here, two fuels are burning in the oxygen-modified air, with the excess nitrogen serving as part
of background oxidizer. This spreadsheet is almost the same as Table 2 , however, the nitrogen is adiluent in Table 2 , while nitrogen is part of air in Table 4 , so λ = 0.2095 is used in Table 2 , whileλ = 0.15/(0.15+0.73) = 0.17 is used in Table 4 and below.
Here with a modified oxygen level, we have Qm = λQO+(1−λ )QN = 0.17×1.046+0.83×0.992 =
1.0012 . Using oxygen-modified flammability equation with R=0 (no diluent in this case), the flammablerange is estimated as:
xL =Qm
Qm + COHO1+R −
QF1+R −
QDR1+R
=1.0012
1.0012+1.5×16.12−9.47= 0.0637
xU =λ ·HO−Qm
λ ·HO−Qm + QF1+R + QD·R
1+R
=0.17×16.12−1.0012
0.17×16.12−1.0012+9.47= 0.155
Figure 7. Excess nitrogen is serving as the background air (or part of the oxidizer).
Current measurement of the fuel is 12%, which is within the flammable range of 6.37∼15.5 %, so thismixture is flammable. The flammable state of this mixture is shown in the oxygen-modified flammabilitydiagram (Figure 7 ).
10

OPEN JOURNAL OF CHEMICAL ENGINEERING ANDSCIENCE
Table 5. 8% methane is grouped with some (8%) excess nitrogen
CO xL xU QF HF xi
methane 2.00 5.00% 15.00% 13.81 32.81 50.00%
Nitrogen 0.99 50.00 %
1.00 10.00% 24.77% 7.40 16.40 100.00%
Table 6. 4% CO is grouped with the rest (8.4%) excess nitrogen
CO xL xU QF HF xi
CO 0.50 12.50% 74.00% 0.80 7.80 32.36%
Nitrogen 0.99 67.74 %
0.16 38.67% 70.93% 0.93 2.51 100.00%
Approach D: Classical method using Le Chateliers principleThe standard (classical) approach for multiple fuels with at least one diluent in air is to group the
fuel/diluent into a pseudo-fuel, then apply Le Chateliers principle to find the flammable state of themixtures. In industry, the grouping process is released with Jones diluted flammability diagram. Herewithout experimental data, the thermal balance method is applied twice to find the modified flammablerange of the two pseudo fuels. First, 8% methane is grouped with 8% excess nitrogen to form a dilutedmethane, with a flammable range of 10%∼24.77% (Table 5 ). Next, 4% carbon monoxide is grouped with8.4% excess nitrogen to form a diluted carbon monoxide, with a flammable range of 38.67%∼70.93%(Table 6 ).
Here is the Le Chateliers principle.0.160.10 +
0.1240.3867 = 1.92 > 1,⇒ This means the mixture is above its lower flammable limit.
0.160.2477 +
0.1240.7093 = 0.82 < 1,⇒ This means the mixture is below its upper flammable limit.
Based on these two criteria, the mixture is flammable.
Approach E. using Heating-Quenching RatioThe simplest way to find the mixture flammable state is to compute and compare heating/quenching
potential ratio directly. Using values in Table 2 , we have
HQR1 =COHOxF
QF xF +QOxO +QDxD=
32.81×0.08+7.8× .0413.81×0.08+0.8×0.04+0.992×0.164+1×0.716
= 1.457 > 1
This means the fuel-based energy release is sufficient to bring about ignition, or the mixture is above itsLFL.
HQR2 =HO · xO
QF xF +QOxO +QDxD=
16.3×0.1513.81×0.08+0.8×0.04+0.992×0.164+1×0.716
= 1.213 > 1
This means oxygen-based energy release is sufficient to bring about ignition, or the mixture is below itsUFL.
Based on the above criteria, the mixture is within its flammable zone, or the mixture is flammable.
11

An Improved Flammability Diagram for Dilution and Purge on Gas Mixtures
4.2 Dilution problems
Problem 4.2.A 1 kg/s flow of methane is being dumped into the atmosphere. How much nitrogen must be mixed with methaneto avoid a flammable mixture in the open?
Solution:The thermal signature of methane is computable from its flammability limits [10].
HO =xU − xL
CO · xU · xL− (1−xU )·xL4.773
=0.15−0.05
2×0.15×0.05−0.2095× (1−0.15)×0.05= 16.38
QF = 1− 1xL
+COHO = 1− 10.05
+2×16.38 = 13.94
Apply equation 6 for the limiting R, we have :
RLU =0.2095 ·COH2
O−COHO−0.2095 ·HOQF
0.2095 ·HO ·QD= 9.34
The mass flow rate of Nitrogen should be corrected by molecular weight.
mN2 = mF ·R ·MWN2
MWCH4
= 1×9.3× 2816
= 16.3kg/s
Figure 8. Dilution requirement for pure methane.
Note Beyler got R = 0.82/0.18 = 4.56 from reading the experimental diagram, while the same dataproduce R=6=0.857/0.143 in Figure 8 . The difference is small, probably caused by reading diagrams.If the diluent is replaced with Carbon Dioxide, the critical diluent/fuel ratio is 5.4 (theoretical) and 3.3(experimental) respectively. All important numbers can be read from Figure 8 above.
If using the theoretical flammability diagram, the inertion ratio is always larger than experimental value,since a constant flame temperature is implicitly assumed in deriving the theoretical envelope. It alsobrings some safety margins for safe operations, where conservativeness is always welcomed.
Problem 4.3.If a stream of diluted methane (30% of fuel with 70% of nitrogen, 1 m3/sec) is released into the air. How muchnitrogen is further needed to inert the stream?
12

OPEN JOURNAL OF CHEMICAL ENGINEERING ANDSCIENCE
Solution:This problem is unique that the air supply is controlled at 70% in the reaction system. This means the
dilution is a straight horizontal line. For the diluted fuel with a fuel fraction of , the thermal signature ofthe mixture is calculated as
QF,m = α ·QF +(1−α) ·QD
Note, HF,m = α ·HF and CO,m = α ·CO, but HO,m = HF,m/CO,m = HO , the oxygen based heat releasewill be independent of fuel fraction. This is a common mistake in applying the thermal balance method.Oxygen calorimetry is dependent on fuel type, not on fuel quantity.
Using the new properties, the flammability diagram is reconstructed using equation 1 and 2 in Figure 9.
Figure 9. The flammability diagram for nitrogen-diluted fuel (fuel fraction =0.3).
If diluted with nitrogen, the targeting diluent fuel ratio should be RLU = 2.161 . That means a streamof 2.161 m3/sec of nitrogen is enough to inertise the diluted fuel stream. The final fuel concentration is30%/(2.161+1)=9.5%.
If diluted with carbon dioxide, the targeting diluent fuel ratio should be RLU = 1.225 . That means astream of 1.225 m3/sec of nitrogen is enough to inertise the diluted fuel stream. The final fuel concentrationis 30%/(1.225+1)=13.5%.
For any fuel/diluent mixture, the location of inertion point tells the inertion requirement. The fuelmixture should be inerted to the inertion point to reach the non-flammable state.
Problem 4.4.A 1 kg/s flow of 30% methane/air mixture is being dumped into the atmosphere. How much nitrogen must be mixedwith methane to avoid a flammable mixture in the open?
Solution:Reconstruct the flammability diagram using thermal properties as previous problems.Since the initial fuel fraction is 0.3, lower than the inertion point, the fuel mixture will be diluted to the
lean state, instead of the inerted state. Using equation 6, we have:
R =x0COHO− x0QF + x0−1
x0QD +1− x0=
0.3×2×16.38−0.3×13.94+0.3−10.3×0.992+1−0.3
= 4.96
13

An Improved Flammability Diagram for Dilution and Purge on Gas Mixtures
Figure 10. Graphical representation of a dilution process.
The required mass flow rate of nitrogen should be corrected by molecular weight.
mN2 = mF ·R ·MWN2
MWmix= 1×4.96× 28
16×0.3+28.84×0.7= 5.56kg/s
For carbon dioxide, the above calculation is updated with QD = 1.75, then we get R = 4.04, mco2 =
7.11kg/s . This shows that less volume, or more mass is needed if a heavier thermal agent is adopted toinertise the fuel. The above process can be demonstrated graphically in Figure 10 .
4.3 Purge problems
Problem 4.5.A methane leak fills a 200 m3 room until the methane concentration is 30 percent by volume. How much nitrogenis needed to dilute the fuel so there is no danger of explosion? [4].
Solution:1. Using the thermal signature Co = 2, Ho = 16.38, Ho = 13.94 to construct the flammability diagram.
The inertion point is found at (9.434, 0.520).2. Applying the purge equation into the diagram as xm =
(1+R)·xF,0R·xF,0+1−xD,0
.The ending point of the purge process is (9.434, 0.817), or the fuel concentration is
0.817/(1+9.434)=0.0783.The total volume of needed nitrogen is a function of initial room volume. Assume the room is
always well-mixed, so the volume needed to decrease the fuel concentration VN2 = −V0 · ln(
xFxF,0
)=
−200× ln( 0.0783
0.3
)= 268.6m3.
This value (xF = 0.0783) is a little small compared to Beylers estimation [4]. However, he usedexperimental data, where the inertion line is located at R = 6 (see Figure 1(c) and Figure 11 ). Usingthis inertion limit, the limiting fuel fraction is calculated as xF = (1+6)×0.3
6×0.3+1−0 = 0.107 , which is close toBeylers value of 0.13 via reading the tertiary diagram directly. Major points for above calculations aredisplayed in Figure 11 .
Problem 4.6.Given the flammable state of a mixture shown in Problem 4.1, find the purge requirement to reach safety.
14

OPEN JOURNAL OF CHEMICAL ENGINEERING ANDSCIENCE
Figure 11. The flammability diagram with the purge line.
Solution:For the mixture in Figure 1 , which is a typical gas sample from a mine fire, it is impossible to control
two species at the same time, so purge is resorted to manipulate the concentration to reach the safe state.However, we have 3 choices for purge, purge by air, purge by a diluent and purge by a fuel. Their purgecurves are shown in Figure 12 .
Figure 12. Purge operations on the flammable mixture from a mine fire.
If purged with air, the sample point should move down to (R5,x5), to reach the lean state.If purged with the same fuel (66.67% CH4+33.33% CO), the sample point will move up to (R4,x2), to
reach the non-flammable state.If purged with the same diluent (nitrogen), the sample point will first move to (R1,x1), to reach the
rich state. However, this is not safe enough. So the purge should stop at least near (R2,x2), to reach thenon-flammable state. Since the non-flammable state still has the danger of crossing the flammable zonewhen diluted with air, the purge should stop at (R3,x3), to reach the non-explosive state. After that, themixture is both non-flammable and non-explosive, so it is really safe.
Note all points in Figure 12 are computable with analytical solutions, since all curves there aretheoretically derived.
15

An Improved Flammability Diagram for Dilution and Purge on Gas Mixtures
5. COMPARISON WITH THE TERTIARY DIAGRAM
This diagram is in essence equivalent to the tertiary diagram if the experimental data are used. However,since it can show the purge process graphically and analytically, it is more useful than tertiary diagrams.
As the only generic method in textbooks, the tertiary diagram has the following advantages:a. The states of fuel/oxygen/nitrogen are directly readable from respective axis.b. With a separate oxygen axis, the Limiting Oxygen Concentration can be presented as a tangent point
and easily recognizable.c. With a full coverage of oxygen, it can deal with flammability limits of variable-oxygen background.A typical tertiary diagram [4] for guiding dilution and purge operations is shown in Figure 13 (a). A
theoretical diluted flammability diagram is paralleled in Figure 13 (b) to show the important points indilution process. Both purge processes start with 30% Methane in air.
Figure 13. Analogy between the tertiary diagram [4] and the diluted flammability diagram
Figure 13 shows that the tertiary diagram and the diluted diagram are equivalent in purge process.
Generally, the tertiary diagram has the following shortcomings:
16

OPEN JOURNAL OF CHEMICAL ENGINEERING ANDSCIENCE
a) Triangle diagram needs special training for reading graphs, since orthogonal coordinates are morefrequently used.
b) Since oxygen occupies only 21% of air, the valid flammability zone of interest is usually a smallfraction of the total zone. This leads to a significant reading error, especially on the triangular axes.
c) Difficult to display analytical curves in a triangle system while a conversion is always needed.d) Difficult when multiple fuel or diluents are involved. Experimental work is necessary for each fuel
combination.e) Not all fuels have their flammability data available to present in the diagram.
In comparison, the diluted flammability diagram in this work has the following advantagesa) No dependence on external experimental data. Only thermal properties are required to construct the
theoretical envelope, which is always conservative compared to the experimental envelope.b) Orthogonal coordinate system allows all curves analytically presented, no special conversion is
necessary.c) Multiple fuels or species only change the thermal signature of the fuel, which is easily manipulated
using a spreadsheet.d) Only the flammability zone under normal air is considered, so reading error is smaller. Oxygen level
is a variable changing the shape of envelope, so its capability dealing with oxygen-variable environmentis preserved.
However, this diluted flammability diagram still has the following shortcomings.a) The coordinate system is a little complex; a devolving step is needed to separate the concentrations
of fuel and diluent.b) Though conservative, the theoretical envelope may generate a purge requirement much larger than
needed, due to its inherent assumption on a constant flame temperature.c) Because of the analytical functions involved and the dependence on initial state, each sample needs
a dynamically generated purge curve. Though every point is directly hand-calculable, some kind ofcomputing platform is preferred to better utilize this diagram.
6. CONCLUSION
This is a summary and an application of the thermal balance method on solving practical mixingproblems. The diluted flammability diagram (or Jones diagram) is theoretically derived with analyticalsolutions for flammability envelope and various diluting operations. Problems on flammable state, dilutionand purge are solved to show the utility of the theory.
Derived from the thermal balance method, this diagram inherits the flexibility in dealing with multiplefuels, multiple diluents and/or variable oxygen. So this diagram is universal in dealing with all possiblefuel/diluent/oxygen combinations. As everything is analytically derived, it has the potential to replace allflammability diagrams in use today. It will be a good tool for both educational and industrial practices.
NOMENCLATURE & SUBSCRIPTS
CO, the oxygen coefficient in a reaction, dimensionlessHO, the heating potential of oxygen based on air, dimensionlessHF , the heating potential of fuel based on air, dimensionless, HF =COHO
LFL, Lower Flammability Limit (volume ratio), % or dimensionless17

An Improved Flammability Diagram for Dilution and Purge on Gas Mixtures
QD, the quenching potential of diluent based on air, dimensionlessQF , the quenching potential of fuel based on air, dimensionlessQO, the quenching potential of oxygen based on air, dimensionless,UFL, Upper Flammability Limit (volume ratio), % or dimensionlessxL , Lower Flammability Limit (volume ratio),xU , Upper Flammability Limit (volume ratio),R, diluent/fuel volumetric ratioL, lower flammable limitU , upper flammable limitLU , inertion pointD, diluent-based potential to air potentialF , fuel-based potential to air potentialO, oxygen-based potential to air potential0, initial state/concentration
References
[1] H. Coward and G. Jones, “Limits of flammability of gases and vapors. pittsburgh, pa: Us departmentof the interior, bureau of mines,” Bulletin, vol. 503, 1952.
[2] G. Jones and R. Kennedy, “Prevention of gas explosions by controlling oxygen concentration,”Industrial & Engineering Chemistry, vol. 27, no. 11, pp. 1344–1346, 1935.
[3] M. G. Zabetakis, “Flammability characteristics of combustible gases and vapors,” tech. rep., DTICDocument, 1965.
[4] C. Beyler, “Sfpe handbook of fire protection engineering, chapter flammability limits of premixedand diffusion flames,” National Fire Protection Association, Quincy, Massachusetts,, 2002.
[5] P. J. DiNenno et al., “Halon replacement clean agent total flooding systems,” The SFPE Handbookof Fire Protection Engineering, p. 7, 2002.
[6] F. Zhao, Experimental measurements and modeling prediction of flammability limits of binaryhydrocarbon mixtures. PhD thesis, Texas A&M University, 2008.
[7] T. Ma and M. Larranaga, “Theoretical flammability diagram for analyzing mine gases,” Fire Tech-nology, pp. 1–16.
[8] V. Schroder and M. Molnarne, “Flammability of gas mixtures: Part 1: Fire potential,” Journal ofhazardous materials, vol. 121, no. 1, pp. 37–44, 2005.
[9] D. A. Crowl and J. F. Louvar, Chemical process safety: fundamentals with applications. PearsonEducation, 2001.
[10] T. Ma, “A thermal theory for estimating the flammability limits of a mixture,” Fire Safety Journal,vol. 46, no. 8, pp. 558–567, 2011.
[11] T. Ma, “A thermal theory for flammability diagrams guiding purge and inertion of a flammablemixture,” vol. 32, no. 1, p. 7, 2013.
[12] T. Ma, “Flammable state and dilution requirement in the theoretical flammability diagram,” ProcessSafety Progress, 2013.
[13] T. Ma, Q. Wang, and M. D. Larranaga, “From ignition to suppression, a thermal view of flammabilitylimits,” Fire Technology, pp. 1–19.
[14] T. Ma, “Flammability diagrams for clean combustion technologies,” Fire Technology, 2013.[15] H. F. Coward and G. W. Jones, “Limits of flammability of gases and vapors,” tech. rep., DTIC
Document, 1952.
18

OPEN JOURNAL OF CHEMICAL ENGINEERING ANDSCIENCE
[16] A. MACEK, “Flammability limits: a re-examination,” Combustion Science and Technology, vol. 21,no. 1-2, pp. 43–52, 1979.
[17] T. Ma, “Flammability and explosibility in flammability diagrams,” Fire and Materials, 2013.[18] S. H. Ash and E. Felegy, “Analysis of complex mixtures of gasess,” tech. rep., Bureau of Mines,
1948.
19
Copyright © 2022 FDOKUMEN