Assessing of Losses and Dilution Impact on the Cost Chain
18
sustainability Article Assessing of Losses and Dilution Impact on the Cost Chain: Case Study of Gold Ore Deposits Mikhail Marinin 1 , Oksana Marinina 1, * and Radoslaw Wolniak 2 Citation: Marinin, M.; Marinina, O.; Wolniak, R. Assessing of Losses and Dilution Impact on the Cost Chain: Case Study of Gold Ore Deposits. Sustainability 2021, 13, 3830. https:// doi.org/10.3390/su13073830 Academic Editor: George Banias Received: 11 March 2021 Accepted: 28 March 2021 Published: 31 March 2021 Publisher’s Note: MDPI stays neutral with regard to jurisdictional claims in published maps and institutional affil- iations. Copyright: © 2021 by the authors. Licensee MDPI, Basel, Switzerland. This article is an open access article distributed under the terms and conditions of the Creative Commons Attribution (CC BY) license (https:// creativecommons.org/licenses/by/ 4.0/). 1 Saint Petersburg Mining University, 199106 Saint Petersburg, Russia; [email protected] 2 Silesian University of Technology, 44-100 Gliwice, Poland; [email protected] * Correspondence: [email protected] Abstract: The conditions of declining gold grade in the ore, increasing depth of excavation, and de-creasing unallocated stock of deposits make it necessary to develop efficient solutions for the mine-to-mill process, which have to be adapted to each specific mining plant and will optimizes production costs. Current research focuses on a case study that demonstrates how indicators of mining losses and dilution influence the variation of costs chain in the production cycle. The article examines the topical issue of determining the effects at the mine-to-mill stages due to changes in losses and dilution. The author’s approach to the formation of a mine-to-mill cost chain is proposed by integrating several cost estimation methods into the general cost estimation methodology. The estimation methodology is a compilation of factor analysis and cost engineering methods that take into account the change in costs due to the variation of losses and dilution. It was proven that with variations in losses and dilution, cost savings arise due to changes in the volume of work on ore averaging, ore transportation, and beneficiation. For the case of the Kuranakh ore field, there are no effects at the mining stage. The use of internal reserves by means of managing ore quality parameters allows reducing the costs per ton of processed rock mass along the entire production chain. Keywords: cost optimization; mine-to-mill; mineral losses; dilution; average grade; quarry; gold mining 1. Introduction Modern gold mining companies in Russia and worldwide come across problems of production costs optimization caused by severe price competition on the one hand and deteriorating mining and geological conditions on the other, including declining gold grade in the ore, increasing depth of excavation, decreasing unallocated stock of deposits, etc. Just a few mining companies can change the situation by means of extensive pro- duction development, namely due to acquisition of new deposits, application of high- performance equipment and modern technologies. Therefore, mining companies tend to pay more attention to internal reserves of efficient subsoil use and optimal resource consumption, based on continuous planning, analysis and control of the production pro- cess, starting from extraction of mineral resources and finishing with their processing (Mine-to-Mill process) [1–5]. That is why, presently, there is a need to develop efficient solutions of the mine-to-mill process, which has to be adapted to each specific mining plant. The idea of the mine-to- mill concept is that metal production is a chain of interconnected processes (extraction— transportation—communition—processing), and completion of each stage affects the fol- lowing ones. Therefore, input engineering parameters of the previous process determine technological and economic indicators of the succeeding one, i.e., expenditure chain of the production cycle. Engineering parameters include a wide range of factors that depend on geology, mining method and technique, grain composition of the rock mass, transportation schemes, technology of ore blending, etc. This research focuses on a case study that demonstrates Sustainability 2021, 13, 3830. https://doi.org/10.3390/su13073830 https://www.mdpi.com/journal/sustainability
-
Upload
khangminh22 -
Category
Documents
-
view
0 -
download
0
Transcript of Assessing of Losses and Dilution Impact on the Cost Chain

sustainability
Article
Assessing of Losses and Dilution Impact on the Cost Chain:Case Study of Gold Ore Deposits
Mikhail Marinin 1, Oksana Marinina 1,* and Radosław Wolniak 2
�����������������
Citation: Marinin, M.; Marinina, O.;
Wolniak, R. Assessing of Losses and
Dilution Impact on the Cost Chain:
Case Study of Gold Ore Deposits.
Sustainability 2021, 13, 3830. https://
doi.org/10.3390/su13073830
Academic Editor: George Banias
Received: 11 March 2021
Accepted: 28 March 2021
Published: 31 March 2021
Publisher’s Note: MDPI stays neutral
with regard to jurisdictional claims in
published maps and institutional affil-
iations.
Copyright: © 2021 by the authors.
Licensee MDPI, Basel, Switzerland.
This article is an open access article
distributed under the terms and
conditions of the Creative Commons
Attribution (CC BY) license (https://
creativecommons.org/licenses/by/
4.0/).
1 Saint Petersburg Mining University, 199106 Saint Petersburg, Russia; [email protected] Silesian University of Technology, 44-100 Gliwice, Poland; [email protected]* Correspondence: [email protected]
Abstract: The conditions of declining gold grade in the ore, increasing depth of excavation, andde-creasing unallocated stock of deposits make it necessary to develop efficient solutions for themine-to-mill process, which have to be adapted to each specific mining plant and will optimizesproduction costs. Current research focuses on a case study that demonstrates how indicators ofmining losses and dilution influence the variation of costs chain in the production cycle. The articleexamines the topical issue of determining the effects at the mine-to-mill stages due to changes inlosses and dilution. The author’s approach to the formation of a mine-to-mill cost chain is proposedby integrating several cost estimation methods into the general cost estimation methodology. Theestimation methodology is a compilation of factor analysis and cost engineering methods that takeinto account the change in costs due to the variation of losses and dilution. It was proven that withvariations in losses and dilution, cost savings arise due to changes in the volume of work on oreaveraging, ore transportation, and beneficiation. For the case of the Kuranakh ore field, there are noeffects at the mining stage. The use of internal reserves by means of managing ore quality parametersallows reducing the costs per ton of processed rock mass along the entire production chain.
Keywords: cost optimization; mine-to-mill; mineral losses; dilution; average grade; quarry; gold mining
1. Introduction
Modern gold mining companies in Russia and worldwide come across problems ofproduction costs optimization caused by severe price competition on the one hand anddeteriorating mining and geological conditions on the other, including declining gold gradein the ore, increasing depth of excavation, decreasing unallocated stock of deposits, etc.
Just a few mining companies can change the situation by means of extensive pro-duction development, namely due to acquisition of new deposits, application of high-performance equipment and modern technologies. Therefore, mining companies tendto pay more attention to internal reserves of efficient subsoil use and optimal resourceconsumption, based on continuous planning, analysis and control of the production pro-cess, starting from extraction of mineral resources and finishing with their processing(Mine-to-Mill process) [1–5].
That is why, presently, there is a need to develop efficient solutions of the mine-to-millprocess, which has to be adapted to each specific mining plant. The idea of the mine-to-mill concept is that metal production is a chain of interconnected processes (extraction—transportation—communition—processing), and completion of each stage affects the fol-lowing ones. Therefore, input engineering parameters of the previous process determinetechnological and economic indicators of the succeeding one, i.e., expenditure chain of theproduction cycle.
Engineering parameters include a wide range of factors that depend on geology,mining method and technique, grain composition of the rock mass, transportation schemes,technology of ore blending, etc. This research focuses on a case study that demonstrates
Sustainability 2021, 13, 3830. https://doi.org/10.3390/su13073830 https://www.mdpi.com/journal/sustainability
Sustainability 2021, 13, 3830 2 of 18
how indicators of mining losses and dilution (extraction stage parameters) influencevariation of costs in the production cycle [6,7].
Case study: Kuranakh ore field contains 11 deposits: Severnoye, Porfirovoye, Tsentral-noye, Yakutskoye, Bokovoye, Pervukhinskoe, Kanavnoe, Delbe, Dorozhnoye, Yuzhnoye,Novoye its total area is around 1500 km [8]. The gold reserves at the deposits of theKuranakh group included: explored (ABC1 categories)—78.6 tons, preliminary estimated(C2)—6.8 tons, with an average gold grade in the ore of 1.58–2.83 g/t (average for alldeposits—2.01 g/t) [9,10]. The study considers two mining conditions: base-case scenarioand project scenario. The base-case scenario implies the actual conditions of the Kuranakhore field development. Such factors as relatively small reserves, complex morphologyand non-compact arrangement of ore bodies, which are significantly remote from eachother and from concentration plants (up to 20 km), cause scattered (decentralized) miningoperations and require increased transport standards, additional costs for the constructionand maintenance of open pit roads, dump facilities, industrial sites.
Extremely uneven mineralization and distribution of metal content, frequent intermit-tency of ore and waste rocks in ore bodies and deposits require additional costs for in-mineexploration, testing of blast boreholes, ore blending prior to its processing (organizationand maintenance of an in-between stockpile) and selective mining of industrial, cut-offgrade (poor) ores and waste rocks.
If we assume that we change technological parameters, for example, we use selectivemining, then first of all we increase the content in industrial reserves and reduce lossesand dilution. This allows us to accept the project scenario. The indicators of the base-caseand project scenarios differ in the characteristics of losses and dilution: base-case scenario:losses are 3.1% with the ore grade of 0.9 g/t; dilution is 17% with the grade of 0.2 g/t;project scenario: losses are 2.1% with the ore grade of 0.9 g/t; dilution is 13% with thegrade of 0.2 g/t.
Basing on factor analysis and method of value engineering, a methodology is devel-oped that allows detecting cost economy in the process of production, which arises dueto the influence of losses and dilution factors. The goal of this approach is to estimate thepossibility of intensive development for gold mining companies using internal reserves ofcost minimization per ton of processed ore. Effect of cost minimization due to variation oflosses and dilution parameters (initial parameters of the extraction process) is manifestedas changes in gold grade of the extracted rock mass, changes in the amounts of ore blendingand transportation, changes in the amount of ore processing.
1.1. Mine-to-Mill Concept
Mine-to-Mill (translated from English as “from mine to factory”) is a methodology thatfocuses on the development of an integrated strategy for optimizing production, crushingof ore, as well as its further grinding, in order to reduce costs per ton of ore and increaseprofitability of production.
Mine-to-mill links aspects of mining industry to mineral processing. The goal of thislinking is optimization of all processing stages. When the concept is effectively imple-mented, it can bring huge productivity gains in the range of 10–20% [11].
Therefore, starting in the 1990s, the concept of “Mine-to-Mill” was formed, which isbased on the task of effectively combining the processes of extraction and enrichment, aswell as on the total cost of production instead of the cost of individual operations. The firstsimulation studies and research projects, based on the mine-to-mill concept, started in the2000s. From the 2010s the mine-to-mill concept has been used as a production tool and anongoing population of block model with orebody and processing parameters [11].
According to McCaffery [12], mine-to-mill is really just a code for making effort andputting the processes in place to record, in an accessible format, an understanding ofthe orebody, how changes in the orebody and operating practice drive productivity andproduction, and understanding the operating parameters in the mine and mill, which canbe manipulated to improve productivity and operating costs.

Sustainability 2021, 13, 3830 3 of 18
The other definition, made by Adel, is concentrated on energy consumption. In hisconcept, mine-to-mill is a holistic approach to the optimization of mining and process-ing operations. It attempts to minimize energy consumption of particle size reductionprocesses [13].
Another definition was made by Scott. According to him, mine-to-mill is an improve-ment that involves optimizing the chain of rock breakage process from the in situ rock inthe mine to the output of the concentrator [14].
Development of the mine-to-mill concept was carried out by foreign studies in theframework of the following issues:
n Simulation studies on the relationship between fragmentation and throughput of aSAG mill [15,16];
� Ore hardness indicators [17] and geotechnical parameters in mine block models andsubsequent optimization of mill productivity [18];
� Integrated communication modeling systems for blasting, grinding and flotation [19,20].
Many researchers tried to develop a methodology to analyze and optimize the wholeproduction process in the mine [21]. For example, they introduced the concept of a holisticapproach to mine-to-mill process optimization. Using this concept, authorities of thecompany could achieve an increase in profitability [22]. Those mine-to-mill optimizationconcepts were based on many case studies, for example, open pit mining [23] or pit-to-plantoperations [24].
The ultimate goal of mine-to-mill optimization is to improve the energy efficiency ofrock breakage by optimizing blast fragmentation [25,26]. Crushing and grinding in themines are some of the most energy-intensive processes in the industry. Rock breakagecomprises of about 30–60% of total energy consumption in the mines. Because of that,this process impacts not only energy consumption, but total mine productivity. An im-provement of this process can be made using mine-to-mill optimization [27]. The commongoal of many mine-to-mill studies is whole mill performance [28–30], but some authorsconcentrate on drilling and blasting performance [31–33].
The use of the mine-to-mill concept is very beneficial for organizations. First, wecan achieve many productivity benefits using it. Analyses were made in many countriesincluding Canada, Argentina, Papua New Guinea, Australia, USA, Indonesia, Peru, Chile,Laos, Ghana, Mali, and Mongolia; these found the product increase to be mainly at 10–20%,but in some cases up to 60% [34,35].
Using assets available in the organization, we can maximize production volumeand minimize the cost per ton. Because of this concept, we can establish the integratedmining strategy and processing strategy. This strategy should be tailored to particularorganizations. Using this concept, and integrating all company activities we can achievesubstantial saving. Other important benefits of mine-to-mill implementation are connectedwith the production process itself [36]. Some studies also note the possibility of energybenefits achieved from mine-to-mill implementation [37,38]. Using it, we can improve theblasting fragmentation and also improve downstream processing performance. The finerore fragmentation leads to following positive impacts of the concept’s implementation [39]:increasing haulage and shovel productivity, decreasing of the wear rates in shovel compo-nents and decreasing of wear rates in the case of rock breaker and primary crusher wearcomponents. Using the mine-to-mill concept leads to introduction of the measurementof many processes within the organization. The measurement leads to understanding ofwhat actually is most important. In this way, we could provide the greater predictability ofthe process. The proper measurement system can bring also other benefits because of thepossibility of throughput forecasting and geometallurgical modeling [5].
Besides many benefits connected with the mine-to-mill concept has also some weak-nesses and problems with the implementation of the process. The first problem is con-nected with over-simplification of the concept. Because the whole mine-to-mill conceptis very complex some organizations tend to concentrate only on selected aspects. Thisover-simplification is sometimes based on the statement that in the mine the increase of

Sustainability 2021, 13, 3830 4 of 18
explosive consumption can lead to entire chain value optimization, because of that orga-nization’s tendency not to increase blast intensity. We can note that some organizationshave problems with mine-to-mill concept’s reconciliation over longer period of time. Thoseproblems can follow poor reconciliation between the mill and grade control prediction [40].Sometimes, there is some incorrectness in the application of resource modeling methods itcan lead to poor analysis of a mill capacity at the first stage of operations [41].
In Table 1, we summarize the main strengths/benefits of the mine-to-mill conceptimplementation and the weaknesses/problems with it. We think that benefits of the mine-to-mill implementation prevail, as the weaknesses are connected mainly not with theconcept itself but with the bad implementation on the part of the organization. We thinkthat to achieve benefits and to avoid problems organization should implement the conceptin complex, holistic way. Without such an approach, we can spot some problems whichcan lead to weaknesses with the concept’s implementation.
Table 1. Strengths/benefits and weaknesses/problems of mine-to-mill concept implementation. Sources: [4,5,35–41].
Strengths/Benefits Weaknesses/Problems
X Productivity benefitsX Maximization of production/performance improvementX Minimization of the cost per toneX Establishment of the integrated mining strategy adjusted
to organizationX Potential for optimization of blasting fragmentationX Energy benefitsX Achievement of substantial savingsX Downstream processing performanceX Introduction of measurementX Throughput forecasting and geometallurgical modeling
X Over-simplification of the conceptX Organization not increase blast intensityX Problems with concept’s reconciliation over longer period
of timesX Incorrectness in the application of resource modeling
methods
1.2. Quality Control: Losses, Dilution, Average Grade of the Valuable Component
Gold ore mining is very beneficial from an economic point of view. However, inorder to maximize profits, recovery of products needs optimization [42]. A very impor-tant factor in this process is the impact of particular ore type and its characteristics onthe head grade [43]. In gold processing, all mining and processing operations involveseries of sequential stages. Those stages should be complementary, and one operation isaffecting another one. To achieve optimization of the whole process, it is not sufficient tooptimize each function separately. The whole process of ore extraction should be takeninto consideration.
We can distinguish two types of mine-to-mill integration. One is operational and thesecond one is physical [44].
Operational integration concentrates on:
• use of drill and shovel technologies to monitor processes,• optimization of blast fragmentation,• optimization of communition processes,• improvement of monitoring in the factory, especially of the handling system in the pit
and ore.
Physical integration concentrates on:
• fragment size classification,• improvements of grade control,• sorting,• improvement of mill feed grades.
At present, it is not easy to find detailed information on ore losses and dilution in themines worldwide, especially in case of gold mines.

Sustainability 2021, 13, 3830 5 of 18
Figure 1 demonstrates a theoretical model of mine-to-mill integration for a goldmine based on the Xingwana concept [45]. In this model, three main components of theintegration of mine-to-mill can be distinguished: fragmentation, ore loss and dilution.Their main characteristics are described in Table 2.
Sustainability 2021, 13, x FOR PEER REVIEW 5 of 19
• improvement of monitoring in the factory, especially of the handling system in the pit and ore. Physical integration concentrates on:
• fragment size classification, • improvements of grade control, • sorting, • improvement of mill feed grades.
At present, it is not easy to find detailed information on ore losses and dilution in the mines worldwide, especially in case of gold mines.
Figure 1 demonstrates a theoretical model of mine-to-mill integration for a gold mine based on the Xingwana concept [45]. In this model, three main components of the integra-tion of mine-to-mill can be distinguished: fragmentation, ore loss and dilution. Their main characteristics are described in Table 2.
Figure 1. Theoretical model of mine-to-mill integration in a gold mine. Source: [45].
Table 2. Main components of mine-to-mill integration in a gold mine. Sources: [45–53].
Component Characteristics
Fragmentation
Fragmentation can be defined as the size distribution of rock fragments. The fragmentation is dependent on factors such as rock properties, charge patterns, specific drill spacing, gas explosion pressure and prop-erties of explosives. Blasting is used to produce rock fragments that are manageable. It is im-portant to easy clean them, handle, load, or crush. Those processes are used to minimize total production cost per ton blasted.
Ore loss
The process of ore movement is realized by means of face cleaning, blasting, loading, and scraping. In some cases, realization of those pro-cesses leads to ore loss. Ore losses can be defined as any unrecoverable economic ore, which is left inside the stope, or which is not recovered, using mineral processing system. This is broken ore, which was called by mine measuring methods, but for now was not removed and not incorporated in the accounting sys-tem. Also, ore losses occur when some valuable material is misclassified, for example, as a waste and is sent to waste dumps.
Figure 1. Theoretical model of mine-to-mill integration in a gold mine. Source: [45].
Table 2. Main components of mine-to-mill integration in a gold mine. Sources: [45–53].
Component Characteristics
Fragmentation
Fragmentation can be defined as the size distribution of rock fragments. The fragmentation isdependent on factors such as rock properties, charge patterns, specific drill spacing, gas explosionpressure and properties of explosives.Blasting is used to produce rock fragments that are manageable. It is important to easy clean them,handle, load, or crush. Those processes are used to minimize total production cost per ton blasted.
Ore loss
The process of ore movement is realized by means of face cleaning, blasting, loading, and scraping.In some cases, realization of those processes leads to ore loss. Ore losses can be defined as anyunrecoverable economic ore, which is left inside the stope, or which is not recovered, using mineralprocessing system.This is broken ore, which was called by mine measuring methods, but for now was not removed andnot incorporated in the accounting system. Also, ore losses occur when some valuable material ismisclassified, for example, as a waste and is sent to waste dumps.
Ore dilution
When the material is broken from the stope, it is a mixture of waste rock and reef. The proportionbetween waste and reef depends on many factors, such as waste width, reef width, intrusions, faultsand also mining practices, in particular ore mine. Dilution may be an effect of low-grade materialmixing or waste mixing with the ore. This can occur during the operation and then be sent intoprocessing. The effect is reduction of the ore value and waste of material.We can quantify dilution as the ratio of tonnage of waste mined, which was sent to the mill, to thewhole tonnage of ore plus whole waste milled. It can be expressed as percentage:Dilution= Waste tons
Ore plus waste tons × 100
Modern studies of assessing the impact of losses and dilution on the economic effi-ciency of mining companies are focused on defining technological tasks and do not considerin its entirety the possibility of reducing costs along the technological chain.
One of the methodologies used in the process is the Process Integration and Optimi-sation (PIO) methodology, developed in Metso Minerals Process technology Asia-Pacific.This methodology is based on the following steps [54]:
• Delineation and characterization of main domains, based on rock strength and struc-ture. At this stage an organization can use many measurement techniques, which arestatistically representative.
Sustainability 2021, 13, 3830 6 of 18
• Establishment of process constraints, such as: damage and control, wall stability,presence of water, muckpile characteristics, ore dilution, size of mining equipment,process bottlenecks, power of crushing, and mining equipment.
• Definition of downstream requirements, which are key to the process and developmentof proper drilling or blasting strategies for each domain.
• Usage of proven software tools, simulations, and predictive models to establish goodlevel of operating and control strategy to increase and maximize overall profit fromthe mill.
• Implementation and monitoring of integrated operating strategies and establishmentof proper standards, for example, quality standards.
• Analysis of data and results.• Implementation and maintenance of obtained benefits in the long term perspective.
Based on his concept, Metso Minerals Process technology Asia-Pacific optimized andincreased efficiency of their processes in each domain.
In one of the first studies on the mine-to-mill concept, authors described its use at anoperating quarry. The effects were based on the improvement of systematic assessment ofcrushing and screening processes, as well as on the improvement of performance in sizedistribution and particle shape of the final products [55].
In his paper [56], Pease, J.D., described positive effects of using this concept in lead-zinc operations. The result of mine-to-mill implementation was lower tonnage of ore, whichwas mined and processed at the plant. They also noted improvement in controllabilityand better metallurgical performance of the flotation circuit. Besides, the authors observedimproved economics of the operations in the company.
Many studies were conducted in organizations such as KCGM in Western Australia,Porgera in Papua New Guinea, Highland Valley in British Columbia, and Cadia Hill in NewSouth Wales. Improvements in the mill throughput were in the range of 10–15% [57–60].For example, in KCGM it was 14%, in Porgera—15%, in Highland Valley—10% and inCadia Valley—14%.
A very interesting study, made by Erkayaoglu and Dessureault, showed positiveeffects of mine-to-mill implementation in case of data warehousing and data mining [61].They showed that each stage in the value chain of the mine process had parameters thataffected product quality. Using real-time data in warehousing and data mining, we canhelp decision makers in the organization and improvement of mine-to-mill value chain.
A new case of mine-to-mill optimization was described on the example of hard-rockmine by Junhyok and Kwangmin. Their study shows that it is possible to use drillingperformance data as a part of mine-to-mill efforts. It can be useful to determine an optimalblast energy design by determination of target fragmentation and due to controlling of theblast fragmentation [27].
Modern studies on the assessment of how ore losses and dilution affect economicefficiency of mining companies focus on definition of engineering tasks and do not givecomprehensive consideration to the possibilities of cost reduction in the production chain.This research suggests an approach, which integrates cost indicators throughout the wholeproduction cycle from ore extraction to its processing, as well as ore quality criteria. Whatis understood under quality is the combination of product properties that meet the stan-dards and technical conditions (e.g., grade of valuable components and impurities, graincomposition, ore processability, etc.). In this research, the input parameter is the grade ofthe valuable component (gold) in the ore at the stages of extraction, transportation, andprocessing. The grade of the valuable component is estimated basing on the parameters ofmining losses and dilution [62,63].
Product quality management is a complex of organizational, technical, and economicmeasures that exert a goal-oriented influence on the product quality. The process of mineralproduct quality management is composed of multiple stages. First the deposit is outlined;directions and procedure of mining development are selected. The possibilities of qualitymanagement are to a great extent defined by the system of mining. The quality of mineral

Sustainability 2021, 13, 3830 7 of 18
resources is directly affected during ore extraction, transportation, production, storage,and shipment to the consumer. At the same time, control activities, which can improve thequality of mineral resources in the process of mining, are relatively limited (an increase inproduct concentration in the initial raw material is mostly achieved either by enrichmentor by primary processing). They include reduction of dilution and losses by improvingthe technology and organization of mining operations and by application of new technicalmeans of mining production. Absolute increase or decrease in the average grade of acomponent in the extracted material is achieved by mineral reserves management—rationalengagement of richer or poorer ores [64–66].
Foreign researchers in the area of ore quality assessment Abdollahisharif, J. et al. [67],Barr, D. [68], Beck, D. [69], Hall, B. [70], Rendu, J.M [71], Bootsma, M.T. et al. [72], andAhmadi, M.R., Bazzazi, A.A. [73] focused on the calculation of cut-off grade (CG) toestimate the efficiency of resource development, which is predetermined by the necessity tooptimize extraction strategy taking into account market volatility. Studies associated withthe analysis of the impact that losses and dilution exert on the ore quality in publications byWhillans, P.T. [74], Elbrond, J. [75], and Hassan, Z. Harraz [76] are limited to engineeringestimations and do not take into account economic aspects.
Mining companies in Russia and most CIS countries in their CG calculations relyon the main provisions of the Methodology [77] and have no right to set their own CGvalues for ore samples and mining blocks. In case of necessity, they can only presentand approve techno-economic assessment (TEA) of exploitation conditions, applicableto a certain subsoil area; they can be extended to the next term, but only after approvalof the State Commission on Mineral Reserves (GKZ). The method of CG estimation inthe Russian practice differs from the international one; as explained in the studies byKapustin, Yu.A. [78], Nesis, N. [79], Fomin, S.I. [6], Rudenko, V.V. [80], it is designed toserve institutional interests and does not allow companies to use this tool in their short-term planning. In Russia for the planning of mining operations, companies use severalcharacteristics, describing the grade of the valuable component (metal in the ore): cut-off grade in the subsoil (CGsubsoil), used for mineral resources estimation; content in theextracted diluted ore (Core); metal content sent to the mill (CMill) [81].
2. Materials and Methods
The problem, stated in the paper, is associated with estimation of how losses anddilution parameters impact the costs of gold extraction and processing in case of openpit mining in the ore field, containing a group of deposits. Changes in the structure oflosses and dilution determine the ratio between the amounts of production and overburdenremoval, as well as average grade of the ore, which affect the entire technological chainstarting from ore extraction and finishing with its processing, including all the processesin-between, such as transportation and stacking.
Research design:
1. The ‘Introduction’ section reviews theoretical foundations of such terms as qualitycontrol, losses, dilution, average and cut-off grades of mineral raw materials. Themain references are presented, which reflect the aim and objectives of the mine-to-millconcept.
2. The ‘Results’ section demonstrates the research method, which includes stages thatestimate how losses and dilution indicators influence the costs of gold extraction andprocessing in open-pit mining. Study materials include commercial reserves and goldgrade in the group of gold deposits at Kuranakh ore field. The assessment method isa compilation of several guidelines: estimation of the average metal content in theextracted ore; the estimation of Owing and Operating [82]; evaluating the efficiency ofmining and processing by reducing costs. Section contains the following calculationsof mine-to-mill chain:
• Estimation and analysis of average grade of the valuable component in the ore,considering changes in the indicators of losses and dilution;

Sustainability 2021, 13, 3830 8 of 18
• Economic effect from reduction of operating costs on ore transportation from thequarry to the processing plant due to changes in the amount of ore stacking;
• Justification of techno-economic indicators of gold processing plant (GPP) per-formance.
3. The ‘Discussion’ section describes the main possibilities and limitations of the sug-gested approach to losses and dilution estimation, demonstrates case studies of goldmining companies, applying mine-to-mill approaches.
Case study: Kuranakh ore field contains 11 deposits: Delbe, Kanavnoye, Yakutskoye,Dorozhnoye, Tsentralnoye, Porfirovoye, Bokovoye, Severnoye, Yuzhnoye, Yuzhnoye, andNovoye [8].
To estimate average metal content in the extracted ore, the following values of com-mercial and non-commercial reserves were taken for the Kuranakh ore field (Table 3).
Table 3. Values and structure of commercial reserves of the deposits at Kuranakh ore field. Source: [8–10].
Deposit Share in the Structure of CommercialReserves of Kuranakh Field, %
Characteristics of Commercial Reserves
Ore, Thousand Tons Au Grade, g/t Au, kg
Delbe 25.60 38,149.63 1.35 51,502.00Kanavnoye 18.20 27,122.00 1.21 32,817.62Yakutskoye 14.70 21,906.23 1.24 27,163.73Dorozhnoye 11.00 16,392.42 1.19 19,506.98Tsentralnoye 10.10 15,051.22 1.51 22,727.35Porfirovoye 5.80 8643.28 2.44 21,089.59Bokovoye 5.00 7451.10 1.62 12,070.78Severnoye 4.50 6705.99 1.23 8248.37
Pervukhinskoye 3.20 4768.70 1.19 5674.76Yuzhnoye 1.80 2682.40 1.28 3433.47Novoye 0.10 149.02 1.42 211.61TOTAL 100.00 149,022.00 1.37 204,446.26
Indicators of losses and dilution are examined under two scenarios:
• base-case scenario: losses are 3.1% with the ore grade of 0.9 g/t; dilution is 17% withthe grade of 0.2 g/t;
• project scenario: losses are 2.1% with the ore grade of 0.9 g/t; dilution is 13% with thegrade of 0.2 g/t.
The base-case scenario implies actual conditions of gold mining company operation,taking into account existing regulations on the estimation of losses and dilution.
The project scenario provides variations in the indicators of losses and dilution andimplies that their values should be as close as possible to the regulatory limits.
Project scenario is distinguished from the base-case one by a 1% loss reduction. Esti-mation of dilution, associated with loss reduction, is based on the methodology [62,83,84],which takes into account variable conditions of ore losses in the near-contact zone andpinch-outs, ore losses in waste disposal dumps in the process of overburden removal, etc.
Estimation of the average grade of the valuable component involves calculation ofspecific amounts of metal under base-case and project scenarios in the group of deposits atKuranakh ore field basing on their structure in the total reserves. The analysis is based oncomparison between the grade and yield of metal by varying the indicators of losses anddilution under different scenarios.
3. Results
The estimation methodology is a compilation of factor analysis and cost engineeringmethods that take into account the change in costs due to the variation of losses anddilution, Figure 2. It consists of several stages:
Sustainability 2021, 13, 3830 9 of 18
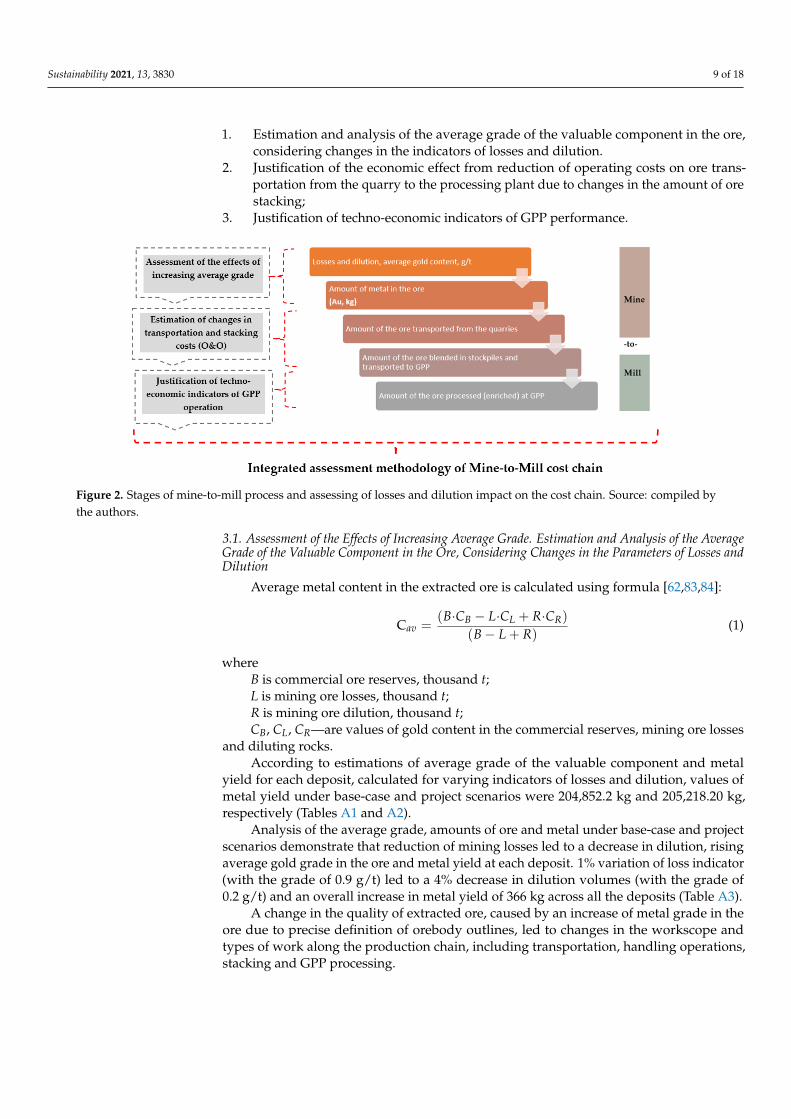
1. Estimation and analysis of the average grade of the valuable component in the ore,considering changes in the indicators of losses and dilution.
2. Justification of the economic effect from reduction of operating costs on ore trans-portation from the quarry to the processing plant due to changes in the amount of orestacking;
3. Justification of techno-economic indicators of GPP performance.
Sustainability 2021, 13, x FOR PEER REVIEW 9 of 19
Indicators of losses and dilution are examined under two scenarios: • base-case scenario: losses are 3.1% with the ore grade of 0.9 g/t; dilution is 17% with
the grade of 0.2 g/t; • project scenario: losses are 2.1% with the ore grade of 0.9 g/t; dilution is 13% with the
grade of 0.2 g/t. The base-case scenario implies actual conditions of gold mining company operation,
taking into account existing regulations on the estimation of losses and dilution. The project scenario provides variations in the indicators of losses and dilution and
implies that their values should be as close as possible to the regulatory limits. Project scenario is distinguished from the base-case one by a 1% loss reduction. Esti-
mation of dilution, associated with loss reduction, is based on the methodology [62,83,84], which takes into account variable conditions of ore losses in the near-contact zone and pinch-outs, ore losses in waste disposal dumps in the process of overburden removal, etc.
Estimation of the average grade of the valuable component involves calculation of specific amounts of metal under base-case and project scenarios in the group of deposits at Kuranakh ore field basing on their structure in the total reserves. The analysis is based on comparison between the grade and yield of metal by varying the indicators of losses and dilution under different scenarios.
3. Results The estimation methodology is a compilation of factor analysis and cost engineering
methods that take into account the change in costs due to the variation of losses and dilu-tion, Figure 2. It consists of several stages: 1. Estimation and analysis of the average grade of the valuable component in the ore,
considering changes in the indicators of losses and dilution. 2. Justification of the economic effect from reduction of operating costs on ore transpor-
tation from the quarry to the processing plant due to changes in the amount of ore stacking;
3. Justification of techno-economic indicators of GPP performance.
Figure 2. Stages of mine-to-mill process and assessing of losses and dilution impact on the cost chain. Source: compiled by the authors.
3.1. Assessment of the Effects of Increasing Average Grade. Estimation and Analysis of the Average Grade of the Valuable Component in the Ore, Considering Changes in the Parameters of Losses and Dilution
Average metal content in the extracted ore is calculated using formula [62,83,84]:
Figure 2. Stages of mine-to-mill process and assessing of losses and dilution impact on the cost chain. Source: compiled bythe authors.
3.1. Assessment of the Effects of Increasing Average Grade. Estimation and Analysis of the AverageGrade of the Valuable Component in the Ore, Considering Changes in the Parameters of Losses andDilution
Average metal content in the extracted ore is calculated using formula [62,83,84]:
Cav =(B·CB − L·CL + R·CR)
(B − L + R)(1)
whereB is commercial ore reserves, thousand t;L is mining ore losses, thousand t;R is mining ore dilution, thousand t;CB, CL, CR—are values of gold content in the commercial reserves, mining ore losses
and diluting rocks.According to estimations of average grade of the valuable component and metal
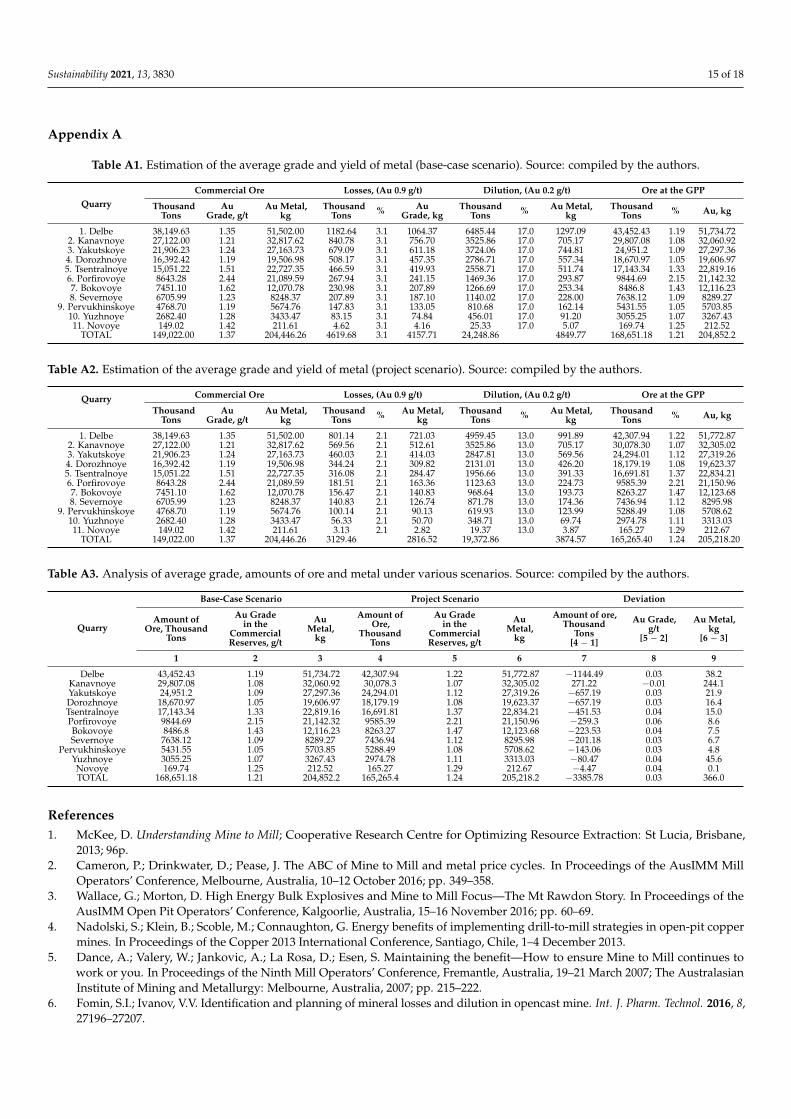
yield for each deposit, calculated for varying indicators of losses and dilution, values ofmetal yield under base-case and project scenarios were 204,852.2 kg and 205,218.20 kg,respectively (Tables A1 and A2).
Analysis of the average grade, amounts of ore and metal under base-case and projectscenarios demonstrate that reduction of mining losses led to a decrease in dilution, risingaverage gold grade in the ore and metal yield at each deposit. 1% variation of loss indicator(with the grade of 0.9 g/t) led to a 4% decrease in dilution volumes (with the grade of0.2 g/t) and an overall increase in metal yield of 366 kg across all the deposits (Table A3).
A change in the quality of extracted ore, caused by an increase of metal grade in theore due to precise definition of orebody outlines, led to changes in the workscope andtypes of work along the production chain, including transportation, handling operations,stacking and GPP processing.

Sustainability 2021, 13, 3830 10 of 18
3.2. Justification of the Economic Effect from Reduction of Operating Costs on Ore Transportationfrom the Quarry to the Processing Plant Due to Changes in the Amount of Ore Stacking
Methodological recommendations for justification of the economic effect from reduc-tion of operating costs on ore transportation have to take into account process procedures atGPP, working with the ore, blended (averaged) with respect to its lithological composition.For the conditions of current experiment, threshold gold grade in the ore was taken as1.21 g/t.
Blending conditions at the stockpile are regulated by the flows, simultaneously comingfrom different gold deposits of Kuranakh ore field in accordance with annual plans andschedule of mining development.
Economic efficiency of measures, increasing gold grade in the ore due to variation ofloss and dilution indicators, is estimated using the method based on value engineeringof ore transportation and blending processes. Its economic effect lies in the economy ofoperating costs due to decreasing amounts of ore stacking and blending.
Handling expenses are based on the estimation of specific owning and operating costsof the equipment at the stage of stacking. They include:
• fixed operating costs, amortization expenses;• labor costs of machine operators section (team), calculated using either actual (forecast)
production rates or existing tariff rates of respective pay grades, taking into accountallowances, perks, bonuses, and other extra payments;
• costs of high-wear parts replacement;• costs of fuel, lubricants, and hydraulic fluids;• repair and machine maintenance costs.
Ore transportation costs are calculated using formula [82]:
Ctr = T1tr + T2
tr + T3tr (2)
where C1tr is the price of ore transportation from the quarry to the stockpile (stage 1),
rub/tkm;T2
tr is the price of ore stacking and blending (stage 2), rub/t;T3
tr is the price of ore loading and transportation from the stockpile to GPP hopper(stage 3), rub/tkm.
Tjtr = TCOij/Qij (3)
where TCOij is total cost of owning and operating [82] ith type of equipment at jthstage, rub;
Qij is a workscope of ith equipment at jth stage, t.
TCOij =J
∑ Oij + Cij (4)
where Oij is owning cost of ith type of equipment at jth stage, rub/hr;Qij is amount of ore transportation by ith type of equipment at jth stage, tkm;Cij is total operating cost of ith type of equipment at jth stage, rub.The costs are conditionally variable and depend on the volume of ore. Owning and
operating costs of a machine vary widely, as they depend on many factors: the nature ofthe work performed by the machine, the length of ownership, local prices for fuels andlubricants, operator costs, repair and maintenance costs, and transportation costs from thefactory, interest rates, etc.
Owning cost (O) equals a sum of initial (remaining) value of the equipment (includingaccessories) (P), interest expenses (Oe), insurance charges (Or) and property tax (Ok).
O = P + Oe + Or + Ok (5)

Sustainability 2021, 13, 3830 11 of 18
Calculations of owning and operating costs are based on the actual terms of ownershipand total productive life of the equipment.
Total operating cost (C) is a sum of the following cost items: fuel (Cf), tires (Ct (x)),scheduled maintenance (CSM), repair (Crep), high-wear parts (CHWP) and planned payrollbudget (CPB):
C = Cf + Ct (x) + CSM + Crep + CHWP + CPB (6)
Logistics of quarry-haulage traffic includes:
• transportation of ore extracted in the quarry to the intermediate stockpile for blending;• transportation of non-commercial ores and their storage in special low-grade stock-
piles;• transportation of ore to the GPP hopper.
Figure 3 depicts a simplified flow chart of ore transportation from the quarry to theintermediate stockpile for blending and to the GPP receiving hopper.
According to the flow chart in Figure 3, transportation of the valuable componentfrom the quarries to the intermediate stockpile is carried out using heavy trucks, then ablended rock mass with a standard (for the GPP) grade of gold is formed in the stockpile,averaged ore is rehandled by the loaders and transported to the GPP receiving hopper.The stages of transportation, blending and stacking use different types of equipment andvehicles.
The cost of ore transportation is defined as a sum of tariffs across the stages ofore transition from the quarries to the intermediate stockpile and GPP. On a premise ofincreasing gold grade in the ore (due to changes in loss and dilution values), it is assumedthat the number of blending, stacking, and partial rehandling operations will decrease.This implies reduction of operating costs due to changes in the workscope (Qij) at thestages of ore transportation, stacking and blending.
Costs of stage 2—rehandling and formation of an intermediate stockpile—are notincluded in the transportation costs, a calculation unit of handling operations is 1 t of cargoor 1 hr of operations. Based on the assumption that it is possible to transport a part ofthe ore mass to the GPP excluding the blending stage, the economy of operating costsforms due to changes in the workscope at stages 2 and 3 (Figure 3)—ore blending and itstransportation to the GPP.
Sustainability 2021, 13, x FOR PEER REVIEW 12 of 19
ore mass to the GPP excluding the blending stage, the economy of operating costs forms due to changes in the workscope at stages 2 and 3 (Figure 3)—ore blending and its trans-portation to the GPP.
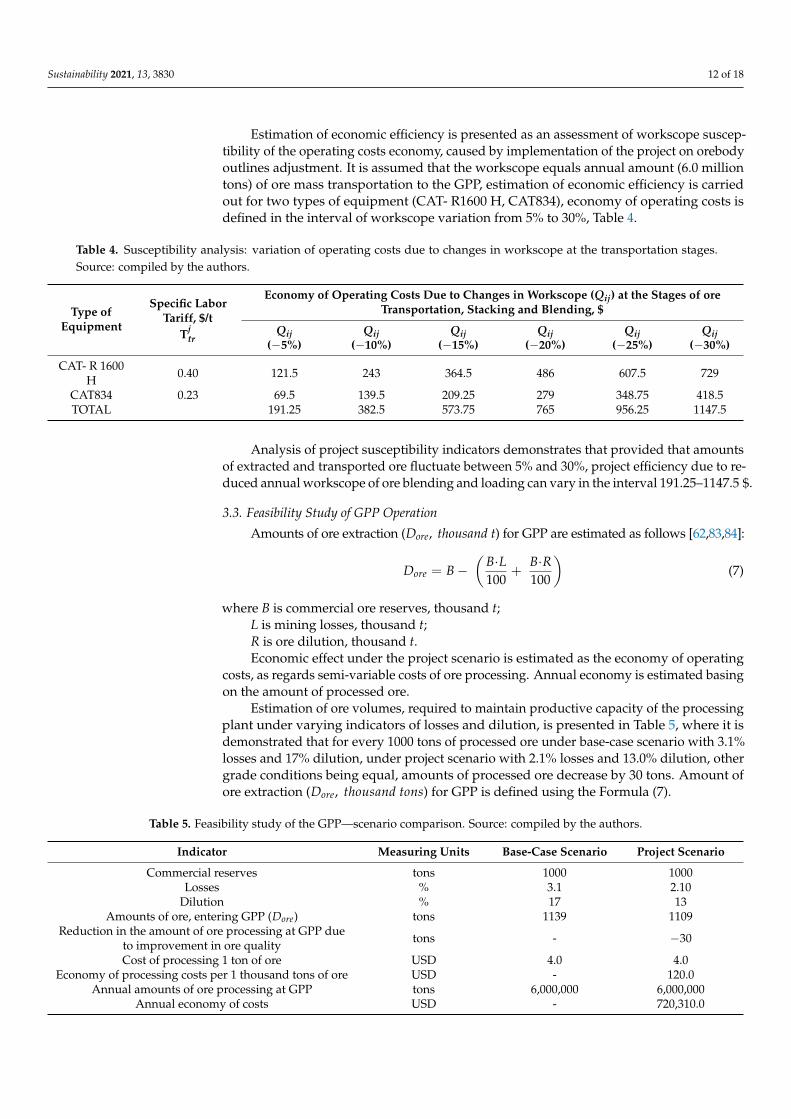
Estimation of economic efficiency is presented as an assessment of workscope sus-ceptibility of the operating costs economy, caused by implementation of the project on orebody outlines adjustment. It is assumed that the workscope equals annual amount (6.0 million tons) of ore mass transportation to the GPP, estimation of economic efficiency is carried out for two types of equipment (CAT- R1600 Н, CAT834), economy of operating costs is defined in the interval of workscope variation from 5% to 30%, Table 4.
Figure 3. Costs chain of the production cycle. Simplified flow chart of ore transportation from the quarry to the interme-diate stockpile for blending and to the GPP receiving hopper. Source: compiled by the authors.
Table 4. Susceptibility analysis: variation of operating costs due to changes in workscope at the transportation stages. Source: compiled by the authors.
Type of Equipment Specific Labor
Tariff, $/t 𝐓𝒕𝒓𝒋
Economy of Operating Costs Due to Changes in Workscope (𝑸𝒊𝒋) at the Stages of ore Transportation, Stacking and Blending, $ 𝑸𝒊𝒋
(−5%) 𝑸𝒊𝒋
(−10%) 𝑸𝒊𝒋
(−15%) 𝑸𝒊𝒋
(−20%) 𝑸𝒊𝒋
(−25%) 𝑸𝒊𝒋
(−30%) CAT- R 1600 Н 0,40 121.5 243 364.5 486 607.5 729
CAT834 0,23 69.5 139.5 209.25 279 348.75 418.5 TOTAL 191.25 382.5 573.75 765 956.25 1147.5
Analysis of project susceptibility indicators demonstrates that provided that amounts of extracted and transported ore fluctuate between 5% and 30 %, project efficiency due to reduced annual workscope of ore blending and loading can vary in the interval 191.25—1147.5 $.
3.3. Feasibility Study of GPP Operation Amounts of ore extraction ( 𝐷 , 𝑡ℎ𝑜𝑢𝑠𝑎𝑛𝑑 𝑡 ) for GPP are estimated as follows
[62,83,84]: 𝐷 = 𝐵 − 𝐵 ∙ 𝐿 100 + 𝐵 ∙ 𝑅 100 (7)
Figure 3. Costs chain of the production cycle. Simplified flow chart of ore transportation from the quarry to the intermediatestockpile for blending and to the GPP receiving hopper. Source: compiled by the authors.
Sustainability 2021, 13, 3830 12 of 18
Estimation of economic efficiency is presented as an assessment of workscope suscep-tibility of the operating costs economy, caused by implementation of the project on orebodyoutlines adjustment. It is assumed that the workscope equals annual amount (6.0 milliontons) of ore mass transportation to the GPP, estimation of economic efficiency is carriedout for two types of equipment (CAT- R1600 H, CAT834), economy of operating costs isdefined in the interval of workscope variation from 5% to 30%, Table 4.
Table 4. Susceptibility analysis: variation of operating costs due to changes in workscope at the transportation stages.Source: compiled by the authors.
Type ofEquipment
Specific LaborTariff, $/t
Tjtr
Economy of Operating Costs Due to Changes in Workscope (Qij) at the Stages of oreTransportation, Stacking and Blending, $
Qij(−5%)
Qij(−10%)
Qij(−15%)
Qij(−20%)
Qij(−25%)
Qij(−30%)
CAT- R 1600H 0.40 121.5 243 364.5 486 607.5 729
CAT834 0.23 69.5 139.5 209.25 279 348.75 418.5TOTAL 191.25 382.5 573.75 765 956.25 1147.5
Analysis of project susceptibility indicators demonstrates that provided that amountsof extracted and transported ore fluctuate between 5% and 30%, project efficiency due to re-duced annual workscope of ore blending and loading can vary in the interval 191.25–1147.5 $.
3.3. Feasibility Study of GPP Operation
Amounts of ore extraction (Dore, thousand t) for GPP are estimated as follows [62,83,84]:
Dore = B −(
B·L100
+B·R100
)(7)
where B is commercial ore reserves, thousand t;L is mining losses, thousand t;R is ore dilution, thousand t.Economic effect under the project scenario is estimated as the economy of operating
costs, as regards semi-variable costs of ore processing. Annual economy is estimated basingon the amount of processed ore.
Estimation of ore volumes, required to maintain productive capacity of the processingplant under varying indicators of losses and dilution, is presented in Table 5, where it isdemonstrated that for every 1000 tons of processed ore under base-case scenario with 3.1%losses and 17% dilution, under project scenario with 2.1% losses and 13.0% dilution, othergrade conditions being equal, amounts of processed ore decrease by 30 tons. Amount ofore extraction (Dore, thousand tons) for GPP is defined using the Formula (7).
Table 5. Feasibility study of the GPP—scenario comparison. Source: compiled by the authors.
Indicator Measuring Units Base-Case Scenario Project Scenario
Commercial reserves tons 1000 1000Losses % 3.1 2.10
Dilution % 17 13Amounts of ore, entering GPP (Dore) tons 1139 1109
Reduction in the amount of ore processing at GPP dueto improvement in ore quality tons - −30
Cost of processing 1 ton of ore USD 4.0 4.0Economy of processing costs per 1 thousand tons of ore USD - 120.0
Annual amounts of ore processing at GPP tons 6,000,000 6,000,000Annual economy of costs USD - 720,310.0
Sustainability 2021, 13, 3830 13 of 18
Reduced losses of the mineral product will lead to variation in the amount of processedore due to changes in the structure of ore inventory. Economic effect under the projectscenario is generated as a result of operating costs economy, as regards semi-variable costsof ore processing, and reaches 1200 USD/t at the cost of ore processing 4 USD/t. Annualsavings on processing of 6000 thousand tons of ore reach 720,310.0 USD.
4. Discussion
From the model above it follows that the changes in the structure of loss and dilutionparameters determine the balance of volumes of production and overburden removal andthe value of the average grade in the ore. Changes in the structure of losses and dilutionhave an impact on the operation of the entire technological chain, from the extraction stageto ore processing, including intermediate processes: transportation and stacking.
The main results obtained in this research confirm that for a gold company there is apossibility of intensive development through use of internal reserves of minimizing costsper 1 ton of processed ore. It is proved that the effect of cost minimization and increasein profits is achieved by variation of loss and dilution parameters and is manifested aschanges in gold grade of the extracted rock mass, changes in the amounts of ore blendingand transportation, and reduction in the amount of ore processing. These results confirm thepossibility of using the proposed methodology in order to assess the impact of technologicalfactors on the production chain of costing. The estimation methodology proposed in thestudy can be applied as a basis for modeling under operating conditions of other miningcompanies.
Results of research can be used in engineering surveys for justification of technologicalparameters in drilling and blasting (D&B) projects, e.g., estimation of rock mass graincomposition, definition of orebody outlines, etc. Precise estimation of loss and dilutionparameters, as well as average grade of the ore flow, allows reaching a significant effect alongthe production chain, as proved in the study; it can become a reserve for increasing efficiencyof gold mining companies, taking into account limited possibilities of extensive growth.
The advantage of the proposed method is that it integrates ore quality indicators andcost indicators of the whole technological cycle from extraction to processing.
The following conditions serve as restrictions for the research:
• The estimation method is invalid for complex deposits. Exploitation of complexdeposits implies extraction of both main and associated minerals. As an outcome ofmine-to-mill process, there are several types of products, e.g., commercial productsof a complex gold ore deposit may include gold, silver, copper. This complicatesestimation of operating and capital costs due to different prices of commercial productsand different costs of their treatment.
• Estimation method is developed for specific logistical conditions of Kuranakh ore fielddeposits. Therefore, it requires adjustment in case it is applied at other deposits.
• The method considers the impact of only two technological parameters (losses anddilution) on the mine-to-mill chain. Other factors, dependent on geology, miningmethod and technique, grain composition of the rock mass, environmental cost, etc.,are not taken into account.
In future studies, an extended set of factors will provide a more detailed assessmentof the process; however, considering specific characteristics and unique nature of eachdeposit, the obtained results will only be of value on a case-by-case basis.
5. Conclusions
The goal of this research was to develop a methodological approach to the assessmentof the influence that engineering factors exert on the production chain of costing from oreextraction to its processing. The following objectives were assigned in the study:
• theoretical analysis and identification of strengths and weaknesses of the mine-to-mill concept, justification of the absence of thoroughly developed methodologicalfoundations for the efficiency assessment of ore extraction parameter control;

Sustainability 2021, 13, 3830 14 of 18
• development of guidelines for the assessment of how losses and dilution indicatorsinfluence the costing chain from ore extraction to its processing;
• practical evaluation of the guidelines for the case of gold ore deposits.
Based on the formulated objectives, the research justifies:
• the principle of economic assessment, based on continuous planning, analysis, andcontrol of the production process from the stage of ore extraction to the treatment ofthe mineral product (mine-to-mill);
• the method of economic assessment as a compilation of factor analysis and valueengineering, which takes into account the economy of operating costs due to variationof losses and dilution parameters throughout the whole production chain;
• results of economic assessment of how losses and dilution impact the indicators ofoperating costs (in a case study of the group of gold ore deposits), manifested aschanges in the gold grade of the extracted rock mass, changes in the amounts of oreblending and transportation, decrease in the amount of ore processing.
The paper proves that changes in the structure of losses and dilution define the ratiobetween the amounts of production and overburden removal, as well as value of averagegrade in the ore, which affect functioning of the entire production chain, including thestages of ore transportation, blending (stacking) and processing. Estimation of the averagegrade of the valuable component includes calculation of specific metal amounts, based onthe structure of total reserves, as well as comparison between the grade and yield of metaldue to variations in the indicators of losses and dilution.
The main results of empirical study show that a decrease in the losses of mineralproduct will lead to variation in the amount of ore processing due to changes in thestructure of ore inventory. Changes in the values of ore losses and dilution (3.1% losses and17% dilution under base-case scenario; 2.1% losses and 13.0% dilution under the projectscenario) result in a 30 ton decrease in the amounts of processed ore. Under the projectscenario, the economic effect takes place due to economy of operating costs, as regardssemi-variable costs of ore processing.
The cost of ore transportation is defined as a sum of tariffs across the stages ofore transition from the quarries to the intermediate stockpile and GPP. From a premiseof increasing gold grade in the ore, transported from the quarry and the intermediatestockpile, it is assumed that the amounts of ore blending, stacking and partial rehandlingoperations will decrease.
Estimation of economic efficiency is presented as an assessment of workscope sus-ceptibility of the operating costs economy, caused by implementation of the project onorebody outlines adjustment. Analysis of project susceptibility indicators demonstratesthat provided that amounts of extracted and transported ore fluctuate between 5% and30%, project efficiency due to reduced annual workscope of ore blending and loading canvary in the range of 191.25–1147.5$.
Author Contributions: Conceptualization, M.M. and O.M.; methodology, M.M. and O.M.; software,M.M. and O.M.; validation, M.M. and O.M. and R.W.; formal analysis, M.M. and O.M.; investigation,M.M. and O.M. and R.W.; resources, M.M. and O.M.; writing—original draft preparation, M.M. andO.M.; writing—review and editing, R.W.; visualization, M.M. and O.M.; supervision, R.W. All authorshave read and agreed to the published version of the manuscript.
Funding: This research received no external funding.
Institutional Review Board Statement: Not applicable.
Informed Consent Statement: Not applicable.
Acknowledgments: Special thanks for providing valuable guidance and financial support to therector of St. Petersburg Mining University Litvinenko V.S.
Conflicts of Interest: The authors declare no conflict of interest regarding the results.
Sustainability 2021, 13, 3830 15 of 18
Appendix A
Table A1. Estimation of the average grade and yield of metal (base-case scenario). Source: compiled by the authors.
QuarryCommercial Ore Losses, (Au 0.9 g/t) Dilution, (Au 0.2 g/t) Ore at the GPP
ThousandTons
AuGrade, g/t
Au Metal,kg
ThousandTons % Au
Grade, kgThousand
Tons % Au Metal,kg
ThousandTons % Au, kg
1. Delbe 38,149.63 1.35 51,502.00 1182.64 3.1 1064.37 6485.44 17.0 1297.09 43,452.43 1.19 51,734.722. Kanavnoye 27,122.00 1.21 32,817.62 840.78 3.1 756.70 3525.86 17.0 705.17 29,807.08 1.08 32,060.923. Yakutskoye 21,906.23 1.24 27,163.73 679.09 3.1 611.18 3724.06 17.0 744.81 24,951.2 1.09 27,297.364. Dorozhnoye 16,392.42 1.19 19,506.98 508.17 3.1 457.35 2786.71 17.0 557.34 18,670.97 1.05 19,606.975. Tsentralnoye 15,051.22 1.51 22,727.35 466.59 3.1 419.93 2558.71 17.0 511.74 17,143.34 1.33 22,819.166. Porfirovoye 8643.28 2.44 21,089.59 267.94 3.1 241.15 1469.36 17.0 293.87 9844.69 2.15 21,142.327. Bokovoye 7451.10 1.62 12,070.78 230.98 3.1 207.89 1266.69 17.0 253.34 8486.8 1.43 12,116.238. Severnoye 6705.99 1.23 8248.37 207.89 3.1 187.10 1140.02 17.0 228.00 7638.12 1.09 8289.27
9. Pervukhinskoye 4768.70 1.19 5674.76 147.83 3.1 133.05 810.68 17.0 162.14 5431.55 1.05 5703.8510. Yuzhnoye 2682.40 1.28 3433.47 83.15 3.1 74.84 456.01 17.0 91.20 3055.25 1.07 3267.4311. Novoye 149.02 1.42 211.61 4.62 3.1 4.16 25.33 17.0 5.07 169.74 1.25 212.52
TOTAL 149,022.00 1.37 204,446.26 4619.68 3.1 4157.71 24,248.86 4849.77 168,651.18 1.21 204,852.2
Table A2. Estimation of the average grade and yield of metal (project scenario). Source: compiled by the authors.
Quarry Commercial Ore Losses, (Au 0.9 g/t) Dilution, (Au 0.2 g/t) Ore at the GPP
ThousandTons
AuGrade, g/t
Au Metal,kg
ThousandTons % Au Metal,
kgThousand
Tons % Au Metal,kg
ThousandTons % Au, kg
1. Delbe 38,149.63 1.35 51,502.00 801.14 2.1 721.03 4959.45 13.0 991.89 42,307.94 1.22 51,772.872. Kanavnoye 27,122.00 1.21 32,817.62 569.56 2.1 512.61 3525.86 13.0 705.17 30,078.30 1.07 32,305.023. Yakutskoye 21,906.23 1.24 27,163.73 460.03 2.1 414.03 2847.81 13.0 569.56 24,294.01 1.12 27,319.264. Dorozhnoye 16,392.42 1.19 19,506.98 344.24 2.1 309.82 2131.01 13.0 426.20 18,179.19 1.08 19,623.375. Tsentralnoye 15,051.22 1.51 22,727.35 316.08 2.1 284.47 1956.66 13.0 391.33 16,691.81 1.37 22,834.216. Porfirovoye 8643.28 2.44 21,089.59 181.51 2.1 163.36 1123.63 13.0 224.73 9585.39 2.21 21,150.967. Bokovoye 7451.10 1.62 12,070.78 156.47 2.1 140.83 968.64 13.0 193.73 8263.27 1.47 12,123.688. Severnoye 6705.99 1.23 8248.37 140.83 2.1 126.74 871.78 13.0 174.36 7436.94 1.12 8295.98
9. Pervukhinskoye 4768.70 1.19 5674.76 100.14 2.1 90.13 619.93 13.0 123.99 5288.49 1.08 5708.6210. Yuzhnoye 2682.40 1.28 3433.47 56.33 2.1 50.70 348.71 13.0 69.74 2974.78 1.11 3313.0311. Novoye 149.02 1.42 211.61 3.13 2.1 2.82 19.37 13.0 3.87 165.27 1.29 212.67
TOTAL 149,022.00 1.37 204,446.26 3129.46 2816.52 19,372.86 3874.57 165,265.40 1.24 205,218.20
Table A3. Analysis of average grade, amounts of ore and metal under various scenarios. Source: compiled by the authors.
Quarry
Base-Case Scenario Project Scenario Deviation
Amount ofOre, Thousand
Tons
Au Gradein the
CommercialReserves, g/t
AuMetal,
kg
Amount ofOre,
ThousandTons
Au Gradein the
CommercialReserves, g/t
AuMetal,
kg
Amount of ore,Thousand
Tons[4 − 1]
Au Grade,g/t
[5 − 2]
Au Metal,kg
[6 − 3]
1 2 3 4 5 6 7 8 9
Delbe 43,452.43 1.19 51,734.72 42,307.94 1.22 51,772.87 −1144.49 0.03 38.2Kanavnoye 29,807.08 1.08 32,060.92 30,078.3 1.07 32,305.02 271.22 −0.01 244.1Yakutskoye 24,951.2 1.09 27,297.36 24,294.01 1.12 27,319.26 −657.19 0.03 21.9Dorozhnoye 18,670.97 1.05 19,606.97 18,179.19 1.08 19,623.37 −657.19 0.03 16.4Tsentralnoye 17,143.34 1.33 22,819.16 16,691.81 1.37 22,834.21 −451.53 0.04 15.0Porfirovoye 9844.69 2.15 21,142.32 9585.39 2.21 21,150.96 −259.3 0.06 8.6Bokovoye 8486.8 1.43 12,116.23 8263.27 1.47 12,123.68 −223.53 0.04 7.5Severnoye 7638.12 1.09 8289.27 7436.94 1.12 8295.98 −201.18 0.03 6.7
Pervukhinskoye 5431.55 1.05 5703.85 5288.49 1.08 5708.62 −143.06 0.03 4.8Yuzhnoye 3055.25 1.07 3267.43 2974.78 1.11 3313.03 −80.47 0.04 45.6Novoye 169.74 1.25 212.52 165.27 1.29 212.67 −4.47 0.04 0.1TOTAL 168,651.18 1.21 204,852.2 165,265.4 1.24 205,218.2 −3385.78 0.03 366.0
References1. McKee, D. Understanding Mine to Mill; Cooperative Research Centre for Optimizing Resource Extraction: St Lucia, Brisbane,
2013; 96p.2. Cameron, P.; Drinkwater, D.; Pease, J. The ABC of Mine to Mill and metal price cycles. In Proceedings of the AusIMM Mill
Operators’ Conference, Melbourne, Australia, 10–12 October 2016; pp. 349–358.3. Wallace, G.; Morton, D. High Energy Bulk Explosives and Mine to Mill Focus—The Mt Rawdon Story. In Proceedings of the
AusIMM Open Pit Operators’ Conference, Kalgoorlie, Australia, 15–16 November 2016; pp. 60–69.4. Nadolski, S.; Klein, B.; Scoble, M.; Connaughton, G. Energy benefits of implementing drill-to-mill strategies in open-pit copper
mines. In Proceedings of the Copper 2013 International Conference, Santiago, Chile, 1–4 December 2013.5. Dance, A.; Valery, W.; Jankovic, A.; La Rosa, D.; Esen, S. Maintaining the benefit—How to ensure Mine to Mill continues to
work or you. In Proceedings of the Ninth Mill Operators’ Conference, Fremantle, Australia, 19–21 March 2007; The AustralasianInstitute of Mining and Metallurgy: Melbourne, Australia, 2007; pp. 215–222.
6. Fomin, S.I.; Ivanov, V.V. Identification and planning of mineral losses and dilution in opencast mine. Int. J. Pharm. Technol. 2016, 8,27196–27207.

Sustainability 2021, 13, 3830 16 of 18
7. Holodnyakov, G.A.; Vajnonen, N.S. Efficiency Criterion of Open-Pit Mining of Complex Deposits in the Process of DefiningQuarry Boundaries. Min. Inf. Anal. Bull. 2013, 12, 52–55.
8. Potekhin, G.N.; Vohmin, S.A.; Chustugeshev, V.M.; Grigor’ev, R.V. The Practice of Design and Development of Quarries at GoldOre Deposits of Kuranakh Ore Field. Min. Inf. Anal. Bull. 2011, 196–215. Available online: https://cyberleninka.ru/article/n/opyt-proektirovaniya-i-razrabotki-karierov-na-zolotorudnyh-mestorozhdeniyah-kuranahskogo-rudnogo-polya/viewer (ac-cessed on 31 August 2020).
9. Konstantinov, M.M. (Ed.) Gold Ore Deposits of Russia. Moscow; Moscow, Russia, 2010; p. 349. Available online: http://www.geokniga.org/books/2772 (accessed on 31 August 2020).
10. Minerals and Deposits of Russia and Neighboring Countries. Available online: https://webmineral.ru/deposits/item.php?id=523 (accessed on 31 August 2020).
11. McKee, D.J. Understanding Mine to Mill. The Cooperative Research Centre for Optimising Resource Extraction (CRC ORE). 2013.Available online: https://www.911metallurgist.com/C/What-is-mine-to-mill.pdf (accessed on 31 August 2020).
12. McCaffery, K.; Mahon, J.; Arif, J.; Burger, B. BatuHijau—Controlled mine blasting and blending to optimise process productionat BatuHijau. SAG2006—Circuit Design. In Proceedings of the International Conference on Autogenous and SemiautogenousGrinding Technology, Vancouver, BC, Canada, 24–28 September 2006.
13. Adel, G.; Smith, B.; Kojovic, T.; Thornton, D.; Richardson, J.M. Application of mine to mill optimization to the aggregate industry.In Proceedings of the SME Annual Meeting, St. Louis, MO, USA, 26–29 March 2006. SME of AIME.
14. Scott, A.; Morrell, S.M.; Clark, D. Tracking and quantifying value from mine to mill improvement. In Proceedings of the ValueTracking Symposium: Brisbane, Australia, 2002; Australasian Institute of Mining and Metallurgy: Melbourne, Australia, 2002; pp.77–84.
15. Smith, M.L.; Prisbrey, K.A.; Barron, C.L. Blasting design for improved SAG mill productivity. In Proceedings of the SME AnnualMeeting, Reno, NV, USA, 15–18 February 1993; pp. 93–115.
16. McKee, D.J.; Chitombo, G.; Morrell, S. The relationship between fragmentation in mining and comminution circuit throughput.Miner. Eng. 1995, 8, 1265–1274. [CrossRef]
17. Amelunxen, P.; Bennett, C.; Garreston, P.; Mertig, H. Use of geostatistics to generate an orebody dataset and to quantify therelationship between sample spacing and the precision of the throughput predictions. In Proceedings of the SAG 2001; Universityof British Columbia: Vancouver, BC, Canada, 2001; pp. 207–220.
18. Bye, A.R. The strategic and tactical value of a 3D geotechnical model for mining optimisation, Anglo Platinum, Sandsloot openpit. J. S. Afr. Inst. Min. Metall. 2006, 3, 1–8.
19. Wirfiyata, F.; McCaffery, K. Applied Geometallurgical Characterisation for Life of Mine Throughput Prediction at BatuHijau. InProceedings of the SAG 2011; University of British Columbia: Vancouver, BC, Canada, 2011.
20. Bye, A.R. Case studies demonstrating value of geometallurgy initiatives. In Proceedings of the Geometallurgy 2011, Brisbane,Australia, 5–7 September 2011; Australasian Institute of Mining and Metallurgy: Melbourne, Australia, 2011.
21. Dance, A. The importance of primary crushing in mill feed size optimisation. In Proceedings of the SAG Conference, Vancouver,BC, Canada, 30 September–3 October 2001; Barratt, D.J., Allan, M.J., Mular, A.L., Eds.; University of British Columbia: Vancouver,BC, Canada, 2001; Volume I, pp. 189–202.
22. Rogers, W.; Kanchibotla, S.S.; Tordoir, A.; Ako, S.; Engmann, E.; Bisiaux, B. Solutions to reduce blast-induced ore loss and dilutionat Ahafo Gold Mine in Ghana. In Proceedings of the 2012 SME Annual Meeting and Exhibit, Seattle, WA, USA, 19–22 February2012; pp. 19–22.
23. Ebrahimi, A. The importance of dilution factor for open pit mining practices, A modified version of: An attempt to standardizethe estimation of dilution factor for open pit mining projects. In Proceedings of the World Mining Congress, Montreal, QC, USA,11–15 August 2013.
24. Gillot, P. Pit-to-Plant Optimisation at Morila Gold Mine. 2005. Available online: https://www.researchgate.net/publication/228427816_Pit-to-plant_optimisation_at_Morila_Gold_Mine/citations (accessed on 31 August 2020).
25. Nielsen, K.; Malvik, T. Grindability enhancement by blast-induced microcracks. Powder Technol. 1999, 105, 52–56. [CrossRef]26. Michaux, S.; Djordjevic, N. Influence of explosive energy on the strength of the rock fragments and SAG mill throughput. Miner
Eng. 2005, 18, 439–448. [CrossRef]27. Junhyeok, P.; Jwangmin, K. Use of drilling performance to improve rock-breakage efficiencies: A part of mine-to-mill optimization
studies in a hard-rock mine. Int. J. Min. Sci. Technol. 2020, 30, 179–188.28. Fomin, S.I.; Ivanov, V.V.; Semenov, A.S.; Ovsyannikov, M.P. Incremental open-pit mining of steeply dipping ore deposits. ARPN J.
Eng. Appl. Sci. 2020, 15, 1306–1311.29. Oghazi, P.; Lund, C.; Pålsson, B.; Martinsson, O. Applying traceability in a mine-to-mill context by usingparticle texture analysis.
In Proceedings of the SME Annual Meeting and Exhibit, Phoenix, AZ, USA, 28 February–3 March 2010; pp. 7–11.30. Powell, M.; Bye, A. Beyond mine-to-mill: Circuit design for energy efficient resource utilization. In Proceedings of the Tenth Mill
Operators Conference 2009; Australasian Institute of Mining and Metallurgy: Brisbane, Australia, 2009; Volume 11, pp. 357–364.31. Cunningham, C.V.B. The Kuz-Ram fragmentation model-20 years on. In Proceedings of the 3rd Conference on Explosives and Blasting;
Holmberg, R., Ed.; European Federation of Explosives Engineers: Brighton, UK, 2005; pp. 201–210.
Sustainability 2021, 13, 3830 17 of 18
32. Herbst, J.A.; Pate, W.T. Dynamic simulation of size reduction operations from mine-to-mill. In Proceedings of the Mine to Mill1998Conference, Brisbane, Australia, 11–14 October 1998; Australasian Institute of Mining and Metallurgy: Brisbane, Australia, 1998;pp. 243–248.
33. Kanchibotla, S.S.; Morrell, A.; Valery, W.; O’Loughlin, P. Exploring the effect of blast design on SAG mill throughput at KCGM. InProceedings of the Mine to Mill Conference; Australasian Institute of Mining and Metallurgy: Brisbane, Australia, 1998; pp. 153–158.
34. Cameron, P. The ABC of Mine to Mill and Metal Price Cycles. Available online: https://www.ausimmbulletin.com/feature/mill-operations-the-abc-of-mine-to-mill-and-metal-price-cycles/ (accessed on 30 November 2020).
35. Bennett, D.; Tordoir, A.; Walker, P.; La Rosa, D.; Valery, W.; Duffy, K. Throughput forecasting and optimisation at the Phu KhamCopper-Gold Operation. In Proceedings of the 12th AusIMM Mill Operators’ Conference, Townsville, Australia, 1–3 September2014; The Australasian Institute of Mining and Metallurgy: Melbourne, Australia, 2014; pp. 381–390.
36. Kristy, A.D. Achieving and Sustaining Productivity Benefits through a Mine to Mill Approach. Available online: https://www.ausimmbulletin.com/feature/achieving-sustaining-productivity-benefits-mine-mill-approach/ (accessed on 30 November 2020).
37. Cheban, A.Y. Engineering of Complex Structure Apatite Deposits and Excavating Sorting Equipment for Its Implementation.J. Min. Inst. 2019, 238, 399–404. [CrossRef]
38. Isheyskiy, V.A.; Yakubovskiy, M.M. Determination of strength reduction factor in blasted rocks versus the distance from the blastcenter. Gorn. Zhurnal 2016, 12, 55–59. [CrossRef]
39. Amirá, R.; Morales, N.; Cáceres, A. Analysis of the Impact of the Dilution on the Planning of Open-Pit Mines for Highly StructuralVeined-Shaped Bodies. In Proceedings of the 27th International Symposium on Mine Planning and Equipment Selection—MPES 2018;Widzyk-Capehart, E., Hekmat, A., Singhal, R., Eds.; Springer: Cham, Switzerland, 2019. [CrossRef]
40. Câmara, T.R.; Leal, R.S.; Peroni, R.L. Accounting for operational dilution by incorporating geological uncertainties in short-termmine planning. DYNA 2020, 87, 178–183. [CrossRef]
41. Schofield, N.A.; Moore, J.; Carswell, J.T. Mine to Mill reconciliation—Three Case Studies. In Proceedings of the InternationalMine Management conference, AusIMM Bulletin, Melbourne, VIC, Australia, 20–21 November 2012; pp. 1–12.
42. Chapman, R.; Bindoff, M. The Placer Gold Mining Game; School of Earth and Environment, University of Leeds: Leeds, UK, 2010.43. Isokangas, E.; Sonmez, B.; Wortley, M.; Valery, W. Using Smarttag to track ore in process integration and optimization projects:
Some case studies in a variety of applications. J. S. Afr. Inst. Min. Metall. 2012, 112, 871–892.44. Bamber, A.S. Integrated Mining, Pre-Concentration and Waste Disposal Systems for the Increased Sustainability of Hard Rock
Metal Mining. Ph.D. Thesis, University of British Columbia, Vancouver, BC, Canada, 2008.45. Xingwana, L. Monitoring ore loss and dilution for mine-to-mill integration in deep gold mines: A survey-based investigation.
J. S. Afr. Inst. Min. Metall. 2016, 116, 149–160. [CrossRef]46. Chaves, L.S.; Carvalho, L.A.; Souza, F. Analysis of the impacts of slope angle variation on slope stability and NPV via two
different final pit definition techniques. REM Int. Eng. J. 2020, 73, 119–126. [CrossRef]47. Cho, S.H.; Kaneko, K. Rock Fragmentation Control in Blasting; Mining and Materials Processing Institute of Japan: Sapporo, Japan,
2004; Volume 45, pp. 1722–1730.48. La Rosa, D.; Thornton, D. Blast movement modelling and measurement. In Proceedings of the 35th APCOM Symposium,
Wollongong, NSW, Australia, 24–30 September 2011.49. Aadersen, D.C. Criteria Influencing the Mine Call Factor of a Gold Mine; Selected topics in mining engineering; Faculty of Mining
Engineering, University of the Witwatersrand: Johannesburg, South Africa, 1999.50. Engmann, E.; Ako, S.; Bisiaux, B.; Rogers, W.; Kanchibolta, S. Measurement and modelling of blast movement to reduce ore losses
and dilution at Ahafo Gold Mine in Ghana. Ghana Min. J. 2013, 14, 27–36.51. Chieregati, A.C.; Pitard, F.F. The challenge of sampling gold. In Proceedings of the Fourth World Conference on Sampling and
Blending, Cape Town, South Africa, 19–23 October 2009; Southern African Institute of Mining and Metallurgy: Johannesburg,South Africa, 2009.
52. Yilmaz, E. Advances in Reducing Large Volumes of Environmentally Harmful Mine Waste Rocks and Tailings; Department of AppliedSciences, University of Québec at Abitibi-Temiscamingue (UQAT): Rouyn-Noranda, QC, USA, 2011.
53. Wang, W.; Huang, S.; Wu, X.; Ma, O. Calculation and management for mining loss and dilution under 3D visualization technicalcondition. J. Softw. Eng. Appl. 2011, 4, 329–334. [CrossRef]
54. Valery, W.; Jankovic, A.; LaRosa, D.; Dance, A.; Esen, S.; Colacioppo, J. Process integration and optimization from mine-to-mill. InProceedings of the International Seminar on Mineral Processing Technology, Dhanbad, India, 10–12 October 2007.
55. Harraz, H.Z.; Hamdy, M.M.; Aly, S.A.; Abd Ella, S.A. Geochemical Exploration and Evolution of Rodruin Au-Zn(±Pb±Ag)Prospected Area in the Golden Triangle-Egypt. 2020. Available online: https://www.researchgate.net/profile/Hassan-Harraz-2(accessed on 26 March 2021).
56. Pease, J.D.; Young, M.F.; Johnston, M.; Clark, A.; Tucker, G. Lessons from manufacturing—Integrating mining and milling for acomplex orebody. In Proceedings of the Mine to Mill 1998; Australasian Institute of Mining and Metallurgy: Melbourne, Australia;Brisbane, Australia, 1998; pp. 3–9.
57. Karageorgos, J.; Skrypniuk, J.; Valery, W.; Ovens, G. SAG milling at the fimiston plant. In Proceedings of the SAG 2001; Universityof British Columbia: Vancouver, BC, Canada, 2011; pp. 109–124.
58. Lam, M.; Jankovic, A.; Valery, W.; Kanchibotla, S. Maximising sag mill throughput at porgera gold mine by optimising blastfragmentation. In Proceedings of the SAG 2001; University of British Columbia: Vancouver, BC, Canada, 2001; pp. 271–287.
Sustainability 2021, 13, 3830 18 of 18
59. Dance, A.; Valery, W.; Jankovic, A.; La Rosa, D.; Esen, S. Higher productivity through cooperative effort: A method of revealingand correcting hidden operating inefficiencies. In Proceedings of the SAG 2006, HPGR, Geometallurgy, International Conferenceon Semiautogenous Grinding Technology, Vancouver, BC, Canada, 24–28 September 2006; Volume 4, pp. 375–390.
60. Hart, S.; Valery, W.; Clements, B.; Reed, M.; Song, S.; Dunne, R. Optimisation of the Cadia Hill SAG mill circuit. In Proceedings ofthe SAG 2001; University of British Columbia: Vancouver, BC, Canada, 2001; pp. 12–30.
61. Erkayaoglu, M.; Dessureault, S. Improving mine-to-mill by data warehousing and data mining. Int. J. Min. Reclam. Environ. 2019,33, 409–424. [CrossRef]
62. Standard Methodological Instructive Regulations on the Setting of Norms for Extraction Losses of Solid Commercial Minerals; USSRCommittee for Supervision of the Safe Conduct of Mining Work: Moscow, Russia, 1972; 154p.
63. Fomin, S.I. Justification of Engineering Solutions in the Organization of Ore Quarry Development. J. Min. Inst. 2016, 221, 644–650.[CrossRef]
64. Tsvetkova, A.; Katysheva, E. Ecological and economic efficiency evaluation of sustainable use of mineral raw materials inmodern conditions. In Proceedings of the 17 th International Multidisciplinary Scientific GeoConference SGEM 2017, SGEM 2017Conference Proceedings, Albena, Bulgaria, 29 June–5 July 2017; Volume 17, pp. 259–266. [CrossRef]
65. Sidorov, D.V.; Ponomarenko, T.V.; Larichkin, F.D.; Vorob’yov, A.G. Economic Justification of Innovative Solutions on Reduction ofMineral Losses in the Aluminum Industry of Russia. Min. J. 2018, 6, 65–68.
66. Nevskaya, M.A.; Seleznev, S.G.; Masloboev, V.A.; Klyuchnikova, E.M.; Makarov, D.V. Environmental and business challengespresented by mining and mineral processing waste in the Russian federation. Minerals 2019, 7, 445. [CrossRef]
67. Abdollahisharif, J.; Bakhtavar, E.; Anemangely, M. Optimal Cut-Off Grade Determination Based on Variable Capacities inOpen-Pit Mining. J. S. Afr. Inst. Min. Metall. 2012, 112, 1065–1069.
68. Barr, D. Stochastic Dynamic Optimization of Cut-Off Grade in Open Pit Mines. Master’s Thesis, Queen’s University, QueensUniversity Kingston, Kingston, ON, Canada, April 2012.
69. Beck, D. Determination of Optimal Mining Cut-Off Grades: Mathematical Formulation and Solution Algorithm: (Case Study:Hinoba Copper Mine in The Philippines). Math. Sci. Appl. Math. 2013, 51. [CrossRef]
70. Hall, B. Cut-off Grades and Optimising the Strategic Mine Plan; The Australasian Institute of Mining and Metallurgy: Carlton,Australia, 2014; 301p. Available online: https://ru.scribd.com/document/329622693/BOOK-Cut-off-Grades-pdf (accessed on 26March 2021).
71. Rendu, J.M. An Introduction to Cut-Off Grade Estimation, 2nd ed.; SME: Englewood, CO, USA, 2014; 159p. Available on-line: https://books.google.ru/books?id=jK1yAgAAQBAJ&printsec=frontcover&hl=ru&source=gbs_ge_summary_r&cad=0#v=onepage&q&f=false (accessed on 26 March 2021).
72. Bootsma, M.T.; Alford, C.; Benndorf, J.; Buxton, M.W.N. Cut-off Grade Based Sublevel Stope Mine Optimisation. In Advances inApplied Strategic Mine Planning; Dimitrakopoulos, R., Ed.; Springer: Cham, Switzerland, 2018. [CrossRef]
73. Ahmadi, M.R.; Bazzazi, A.A. Application of Meta-Heuristic Optimization Algorithm to Determine the Optimal Cutoff Grade ofOpen Pit Mines. Arab. J. Geosci. 2020, 13, 224. [CrossRef]
74. Whillans, P.T. Mining Dilution and Mineral Losses, An Underground Operator’s Perspective. In Proceedings of the Mining Tech,Santiago, Chile, 29 July 2018.
75. Elbrond, J. Economic Effects of Ore Losses and Rock Dilution. Cim Bull. 1994, 87, 131–134.76. Hassan, Z. Harraz Mining Dilution and Mineral Losses; Geology Department, Faculty of Science, Tanta University: Tanta, Egypt, 2019.
[CrossRef]77. Methodological Recommendations on the Content and Execution Rules of Submitted for State Expertise Materials on Techno-Economic
Justification of Quality Requirements for Estimation of Mineral Deposit Reserves; Moscow, Russia, 2007; 43p. Available online:http://docs.cntd.ru/document/902023112 (accessed on 30 March 2021).
78. Kaputin, Y.U.E. Cut-off Grade Justification and Optimization of Development Strategy for Open-Pit Mining, SPb., Nedra; 2017; 280p.Available online: https://www.geokniga.org/bookfiles/geokniga-14-07kaputinblock.pdf (accessed on 30 March 2021).
79. Nesis, V.N. Cutoff evaluation practice in short-term gold mine planning. Gorn. Zhurnal 2017. [CrossRef]80. Rudenko, V.V. Non-Ferrous Metals. Open-Pit Mining; Publishing House Gornaya Kniga: Moscow, Russia, 2015; 100p.81. Aristov, I.I.; Ivanov, V.G.; Krotov, V.N. Industry-Based Guidelines on Estimation, Accounting, Standardization and Planning of Losses
and Dilution in the Process of Open-Pit and Underground Mining of Radioactive, Rare and Noble Metal Deposits; Moscow, Russia, 1993;72p. Available online: https://files.stroyinf.ru/Data2/1/4293731/4293731042.pdf (accessed on 30 March 2021).
82. Owning & Operating (O&O) Baseline Cost Estimate Solutions. 2020. 46p. Available online: https://www.holtcat.com/Documents/PDFs/2012PerformanceHandbook/Owning%20&%20Operating%20Costs%20-%20Sec%2020.pdf (accessed on31 August 2020).
83. Petrosov, A.A. Calculation of Metal Inventory for Selection and Economic Justification of Ore Field Development. Min. Inf. Anal.Bull. 2013, 317–325.
84. Bajmashev, Z.G.; Zagirov, N.H.; Tomilov, V.D.; Chemezov, V.V. Methodological Instructions on Standardization, Estimation andAccounting of Mining Losses and Dilution of Gold-Containing Ores (Sands); Irgiredmet: Irkutsk, Russia, 1994; 265p.