New-School Trademark Dilution: Famous Among the Juvenile ...
Upload
georgetownCategory
view
2download
0
Steroid hormone levels in pregnancy and 1 year postpartumusing isotope dilution tandem mass spectrometry
Offie P. Soldin, Ph.D.a,b,c, Tiedong Guo, M.Sc.d, Elisabete Weiderpass, M.D.e,f,g,h, RochelleE. Tractenberg, Ph.D.i, Leena Hilakivi-Clarke, Ph.D.b, and Steven J. Soldin, Ph.D.a,d,j,k
aDepartment of Medicine, Division of Endocrinology and Metabolism, Georgetown UniversityMedical Center, Washington, D.C. bDepartment of Oncology, Division of Cancer Genetics andEpidemiology, Georgetown University Medical Center, Washington, D.C. cCenter for the Study ofSex Differences in Health, Aging and Disease, Georgetown University Medical Center,Washington, D.C. dBioanalytical Core Laboratory, Georgetown Clinical Research Center,Georgetown University Medical Center, Washington, D.C. eDepartment of Medical Epidemiologyand Biostatistics, Karolinska Institutet, Stockholm, Sweden fFinnish Cancer Registry, Institute forStatistical and Epidemiological Cancer Research, Helsinki, Finland gCancer Registry of Norway,Oslo, Norway hDepartment of Biomathematics and Biostatistics, Georgetown University MedicalCenter, Washington, D.C. iDepartment of Pharmacology, Georgetown University, Washington,D.C. jDepartments of Pediatrics and Pathology, The George Washington University School ofMedicine, Washington, D.C. kDepartment of Laboratory Medicine, Children’s National MedicalCenter, Washington, D.C.
AbstractObjective—To establish normal, trimester-specific reference intervals for serum 17β-estradiol,progesterone (P), 17α-hydroxyprogesterone, cortisol, 11-deoxycortisol, androstenedione, DHEA,and DHEAS, measured simultaneously using isotope dilution tandem mass spectrometry.
Design—Sequential cohort study.
Patient(s)—Healthy women undergoing a normal pregnancy (age, 25–38 years; mean, 30 years)attending a prenatal well clinic at gestation weeks 12, 22, and 32 and approximately 1 yearpostpartum.
Main Outcome Measure(s)—Trimester-specific reference intervals of endogenous steroidhormones analyzed using an isotope dilution tandem mass spectrometer equipped with anatmospheric pressure photoionization source with deuterium-labeled internal standards.
Result(s)—Serum estradiol, P, 17α-hydroxyprogesterone, and 11-deoxycortisol increasedthroughout pregnancy; cortisol increased up to the second trimester and then remained steady,while androstenedione increased by 80 percent by gestation week 12, then remained constant.Serum DHEA-S decreased by 50% by the third trimester.
Conclusion(s)—Trimester-specific reference intervals are reported for eight serum steroids. Theratios of individual serum hormone concentrations during pregnancy relative to their 1-year
Copyright ©2005 American Society for Reproductive Medicine, Published by Elsevier Inc.
Reprint requests: Dr. Offie P. Soldin, Lombardi Comprehensive Cancer Center, LL Room S-165A, Georgetown University MedicalCenter, Box 571465, 3800 Reservoir Road, N.W., Washington, D.C. 20057-1465, USA (FAX: 202-784-3034;[email protected]).
Presented in part at the Endocrine Society’s 87th Annual Meeting “ENDO” 2005, San Diego, California, June 4–7, 2005.
NIH Public AccessAuthor ManuscriptFertil Steril. Author manuscript; available in PMC 2013 May 01.
Published in final edited form as:Fertil Steril. 2005 September ; 84(3): 701–710. doi:10.1016/j.fertnstert.2005.02.045.
NIH
-PA Author Manuscript
NIH
-PA Author Manuscript
NIH
-PA Author Manuscript
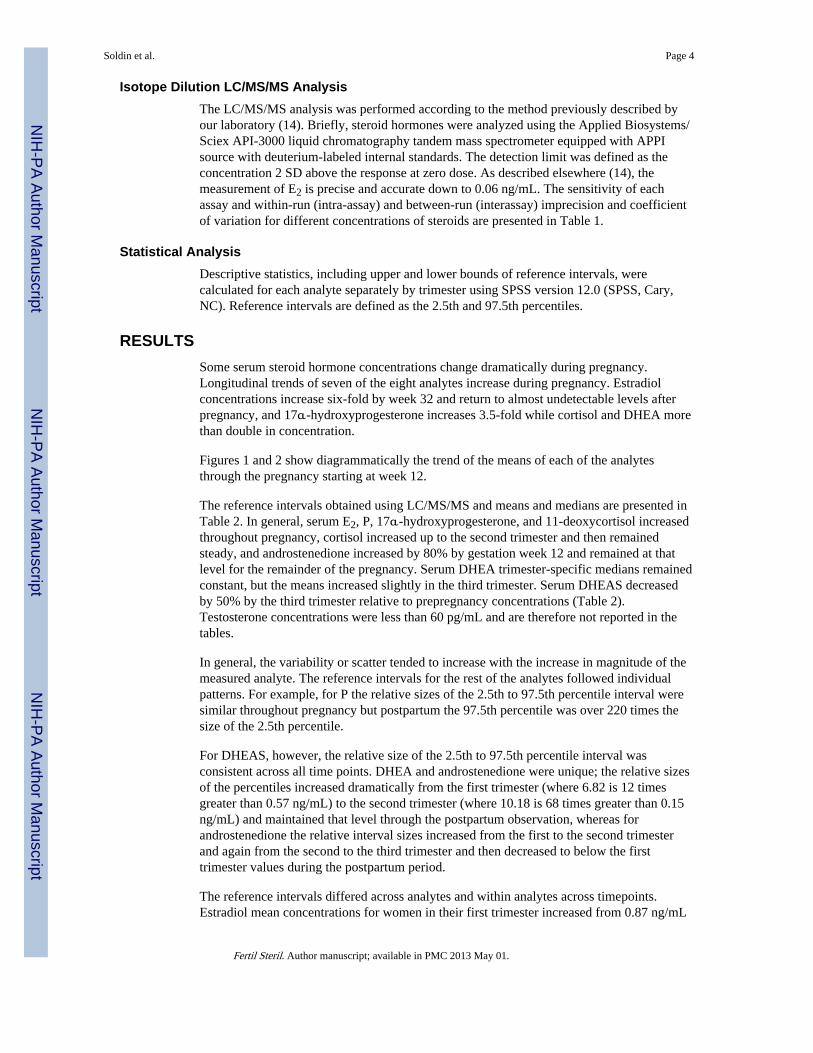
postpartum concentrations illustrate the expected normal trends of changes in hormoneconcentrations during pregnancy.
KeywordsReference intervals; estradiol; progesterone; cortisol; DHEA; DHEAS; androstenedione; steroids;hormones; isotope dilution tandem mass spectrometry
Normal pregnancy depends on pronounced adaptations in pregnancy-related hormoneconcentrations, characterized by elevated levels of several circulating steroid hormones,which normally increase with the progression of pregnancy (1–6). Endogenous steroidhormone exposure during pregnancy has been of interest in studies of duration of gestation,fetal size, twin pregnancies, control of labor, nausea and vomiting in pregnancy, pregnancy-induced hypertension, and other disease states (5–9). The studies have generally producedweak and inconsistent findings because the hormone levels were either not available orlacked specificity or because surrogate measures of exposure to altered steroid hormonelevels were often used to estimate these hormones.
Steroid hormones are derived from cholesterol. Binding proteins facilitate their transport andincrease their half-life but limit their entry into target cells, thereby regulating theirbiological activity. Binding proteins make precise determination of serum steroid hormoneconcentrations difficult by interfering with different steroid hormones immunoassays (IAs).Furthermore, the lack of specificity of IAs due to cross reactivity with structurally relatedmolecules is a well-known phenomenon (10–12).
In contrast, isotope dilution liquid chromatography–tandem mass spectrometry (LC/MS/MS)is a specific detection method that allows the quantification of the analyte of interest. It alsoallows for a simpler approach to sample preparation without employing lengthy and time-consuming extraction and sample derivatization steps. This has been reported in a previouspublication, and steroid hormone analysis using isotope dilution LC/MS/MS was comparedwith the analysis of the same samples using IA techniques (14). Generally, tandem massspectrometry provides lower values than IA, no doubt because of improved specificity.
The reasons for the improved specificity in our tandem mass spectrometric method (14)include the use of multiple reaction mode monitoring (MRM) as very few analytes haveidentical parent and daughter ions; use of the atmospheric pressure photoionization (APPI)source, which selectively ionizes steroids very well but is less adept at ionization of manyother compounds thereby increasing selectivity of the method; and the use of HighPerformance Liquid Chromatography (HPLC) together with tandem mass spectrometry,which further enhances the specificity of the method. The between-day precision data for themethod are shown in Table 1.
The method, which uses the API-3000 (Sciex, Concord, Ontario, Canada) requires a fairlylarge serum volume (800 µL) to optimize sensitivity; however, we have recently been able toimprove the sensitivity by using the more sensitive API-5000 (Sciex), which has enabled usto reduce the serum requirement to 250 µL and by changing the C18 column for a C4column, the total chromatography time has been reduced from 18 to 10 minutes. Whiledeuterated internal standards were used for each analyte, the internal standard used forDHEAS was deuterated testosterone (14). The quality control material used was Bio-RadLiquichek Immunoassay Plus Control (Irvine, CA). Column life has been at least 1 month(or 600 injections).
Given the importance of steroid hormones in pregnancy, we set out to determine trimester-specific reference intervals in a longitudinal study of 52 women during normal pregnancy
Soldin et al. Page 2
Fertil Steril. Author manuscript; available in PMC 2013 May 01.
NIH
-PA Author Manuscript
NIH
-PA Author Manuscript
NIH
-PA Author Manuscript

and 1 year postpartum. Simultaneous analysis and measurement of eight steroid hormoneswas conducted in the positive ion mode by LC/MS/MS employing MRM. Steroids and theirrespective deuterated internal standards were separated within 18 minutes. The normalreference intervals for eight serum steroid hormones, trimester-related and for non-pregnantwomen, as well as their relative changes during pregnancy are reported.
MATERIALS AND METHODSThe research was conducted at the Georgetown University Medical Center’s GeneralClinical Research Center. Informed consents were obtained, and the study was approved bythe Institutional Review Board.
Study PopulationBlood specimens were obtained from healthy women on normal diets undergoing their firstpregnancy. All sera were stored frozen at −80°C before analysis. All of the women were ofCaucasian descent/non-Hispanic, with a mean age of 30 years (25–38 years) attending aprenatal pregnancy well clinic at the Karolinska Institute, Stockholm, Sweden. The sampleswere obtained during gestation week 12 (first trimester), gestation week 22 (secondtrimester), gestation week 32 (third trimester), and approximately 1 year postpartum.Gestational dates were confirmed by ultrasound. All pregnancies were normal, viable,singleton pregnancies.
Hormones and ChemicalsAndrostenedione (4-androstene-3,17-dione), cortisol (4-pregnen-11β,17α,21-triol-3,20-dione), 11-deoxycortisol (4-pregnen-17α,1-diol-3,20-dione), DHEA (5-androsten-3β-ol-17-one), DHEA-S (5-androsten-3β-ol-17-one sulfate, sodium salt), 17β-estradiol (1,3,5(10)-estratriene-3,17β-diol), P (4-pregnen-3,20-dione), 17α-hydroxyprogesterone (4-pregnen-17α-ol-3,20-dione), testosterone (T) (4-androsten-17-ol-3-one), ammonium acetate,and bovine albumin (96%) were purchased from Sigma-Aldrich (St. Louis). Deuterium-labeled internal standards (cortisol-9,11,12,12-d4, estradiol-2,4,16,16-d4, andtestosterone-1,2-d2) were obtained from Cambridge Isotope Laboratory (Andover, MA); 4-androstene-3,17-dione-2,2,4,6,6,16,6-d7, dehydroepiandrosterone-16,16-d2, 4-pregnen-17α-ol-3,20-dione-2,2,4,6,6,21,21,21-d8, 11-deoxycortisol-21,21-d2, and P-2,2,4,6,6,17α,21,21,21-d9 were purchased from C/D/N Isotopes (Pointe-Claire, Quebec, Canada). High-performance liquid chromatography-grade water and methanol were obtained from Burdick& Jackson (Muskegon, MI). Optima-grade acetonitrile and toluene were purchased fromFisher Scientific (Fair Lawn, NJ). All chemicals (unless otherwise noted) had a purity of atleast 98% according to the manufacturer.
Sample PreparationSeven hundred sixty microliters of each standard mixture or serum sample containing thesteroids of interest were placed into a 2.0-mL conical plastic centrifuge tube. One thousandone hundred forty microliters of acetonitrile containing the internal standards was added tothe tube to precipitate the proteins in the sample. The tubes were capped, vortexedvigorously for at least 30 seconds, and centrifuged at 13,000 rpm for 10 minutes. Thesupernatant in the tubes was transferred into autosampler vials for injection into the LC/MS/MS system. Sample preparation was performed at room temperature and 1.7 mL of thesupernatant was injected into the LC/MS/MS.
Soldin et al. Page 3
Fertil Steril. Author manuscript; available in PMC 2013 May 01.
NIH
-PA Author Manuscript
NIH
-PA Author Manuscript
NIH
-PA Author Manuscript
Isotope Dilution LC/MS/MS AnalysisThe LC/MS/MS analysis was performed according to the method previously described byour laboratory (14). Briefly, steroid hormones were analyzed using the Applied Biosystems/Sciex API-3000 liquid chromatography tandem mass spectrometer equipped with APPIsource with deuterium-labeled internal standards. The detection limit was defined as theconcentration 2 SD above the response at zero dose. As described elsewhere (14), themeasurement of E2 is precise and accurate down to 0.06 ng/mL. The sensitivity of eachassay and within-run (intra-assay) and between-run (interassay) imprecision and coefficientof variation for different concentrations of steroids are presented in Table 1.
Statistical AnalysisDescriptive statistics, including upper and lower bounds of reference intervals, werecalculated for each analyte separately by trimester using SPSS version 12.0 (SPSS, Cary,NC). Reference intervals are defined as the 2.5th and 97.5th percentiles.
RESULTSSome serum steroid hormone concentrations change dramatically during pregnancy.Longitudinal trends of seven of the eight analytes increase during pregnancy. Estradiolconcentrations increase six-fold by week 32 and return to almost undetectable levels afterpregnancy, and 17α-hydroxyprogesterone increases 3.5-fold while cortisol and DHEA morethan double in concentration.
Figures 1 and 2 show diagrammatically the trend of the means of each of the analytesthrough the pregnancy starting at week 12.
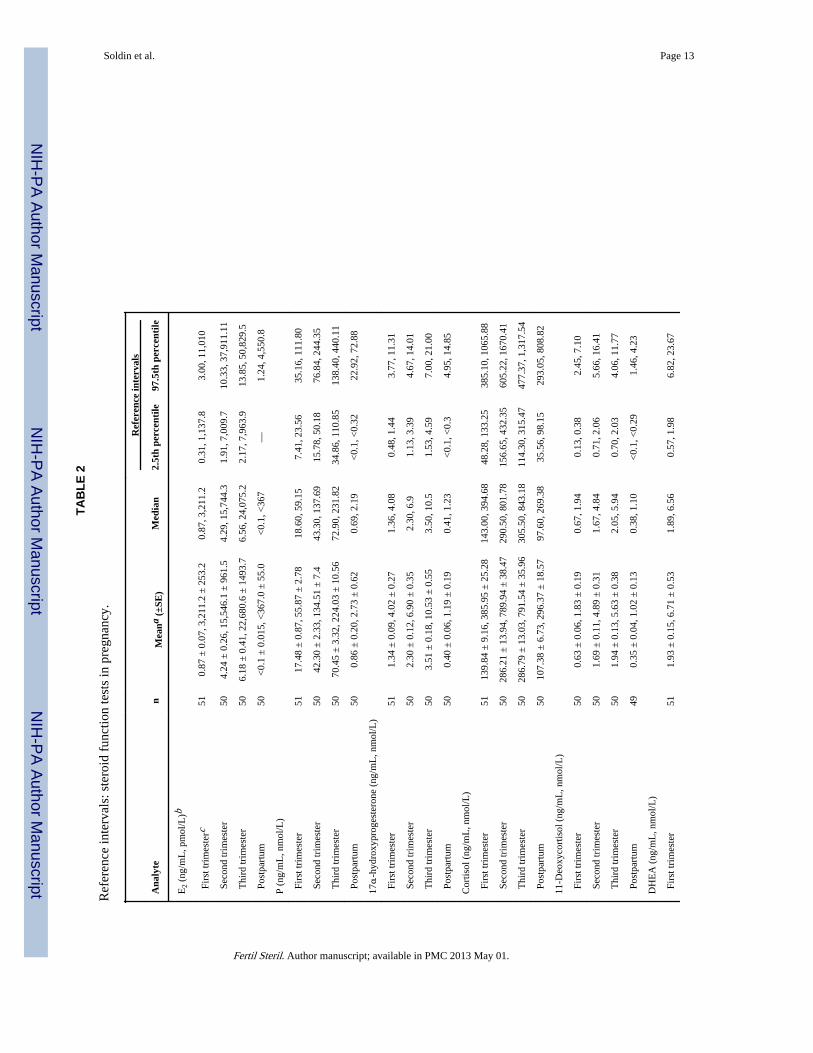
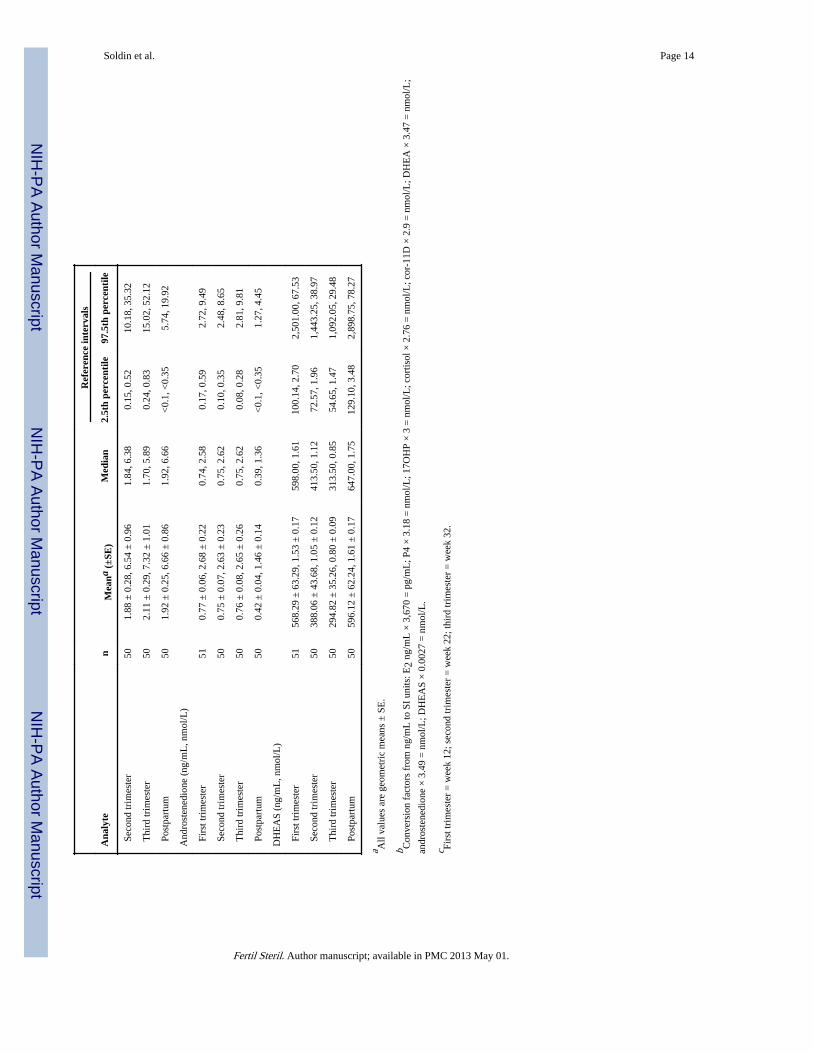
The reference intervals obtained using LC/MS/MS and means and medians are presented inTable 2. In general, serum E2, P, 17α-hydroxyprogesterone, and 11-deoxycortisol increasedthroughout pregnancy, cortisol increased up to the second trimester and then remainedsteady, and androstenedione increased by 80% by gestation week 12 and remained at thatlevel for the remainder of the pregnancy. Serum DHEA trimester-specific medians remainedconstant, but the means increased slightly in the third trimester. Serum DHEAS decreasedby 50% by the third trimester relative to prepregnancy concentrations (Table 2).Testosterone concentrations were less than 60 pg/mL and are therefore not reported in thetables.
In general, the variability or scatter tended to increase with the increase in magnitude of themeasured analyte. The reference intervals for the rest of the analytes followed individualpatterns. For example, for P the relative sizes of the 2.5th to 97.5th percentile interval weresimilar throughout pregnancy but postpartum the 97.5th percentile was over 220 times thesize of the 2.5th percentile.
For DHEAS, however, the relative size of the 2.5th to 97.5th percentile interval wasconsistent across all time points. DHEA and androstenedione were unique; the relative sizesof the percentiles increased dramatically from the first trimester (where 6.82 is 12 timesgreater than 0.57 ng/mL) to the second trimester (where 10.18 is 68 times greater than 0.15ng/mL) and maintained that level through the postpartum observation, whereas forandrostenedione the relative interval sizes increased from the first to the second trimesterand again from the second to the third trimester and then decreased to below the firsttrimester values during the postpartum period.
The reference intervals differed across analytes and within analytes across timepoints.Estradiol mean concentrations for women in their first trimester increased from 0.87 ng/mL
Soldin et al. Page 4
Fertil Steril. Author manuscript; available in PMC 2013 May 01.
NIH
-PA Author Manuscript
NIH
-PA Author Manuscript
NIH
-PA Author Manuscript
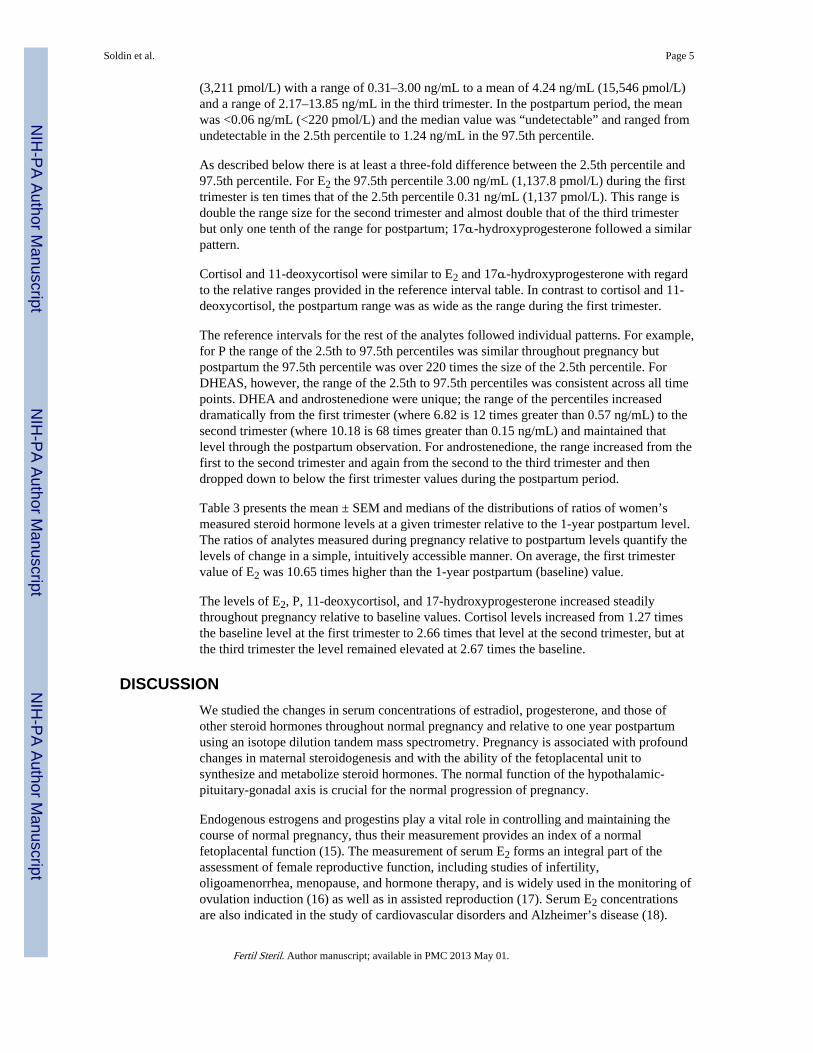
(3,211 pmol/L) with a range of 0.31–3.00 ng/mL to a mean of 4.24 ng/mL (15,546 pmol/L)and a range of 2.17–13.85 ng/mL in the third trimester. In the postpartum period, the meanwas <0.06 ng/mL (<220 pmol/L) and the median value was “undetectable” and ranged fromundetectable in the 2.5th percentile to 1.24 ng/mL in the 97.5th percentile.
As described below there is at least a three-fold difference between the 2.5th percentile and97.5th percentile. For E2 the 97.5th percentile 3.00 ng/mL (1,137.8 pmol/L) during the firsttrimester is ten times that of the 2.5th percentile 0.31 ng/mL (1,137 pmol/L). This range isdouble the range size for the second trimester and almost double that of the third trimesterbut only one tenth of the range for postpartum; 17α-hydroxyprogesterone followed a similarpattern.
Cortisol and 11-deoxycortisol were similar to E2 and 17α-hydroxyprogesterone with regardto the relative ranges provided in the reference interval table. In contrast to cortisol and 11-deoxycortisol, the postpartum range was as wide as the range during the first trimester.
The reference intervals for the rest of the analytes followed individual patterns. For example,for P the range of the 2.5th to 97.5th percentiles was similar throughout pregnancy butpostpartum the 97.5th percentile was over 220 times the size of the 2.5th percentile. ForDHEAS, however, the range of the 2.5th to 97.5th percentiles was consistent across all timepoints. DHEA and androstenedione were unique; the range of the percentiles increaseddramatically from the first trimester (where 6.82 is 12 times greater than 0.57 ng/mL) to thesecond trimester (where 10.18 is 68 times greater than 0.15 ng/mL) and maintained thatlevel through the postpartum observation. For androstenedione, the range increased from thefirst to the second trimester and again from the second to the third trimester and thendropped down to below the first trimester values during the postpartum period.
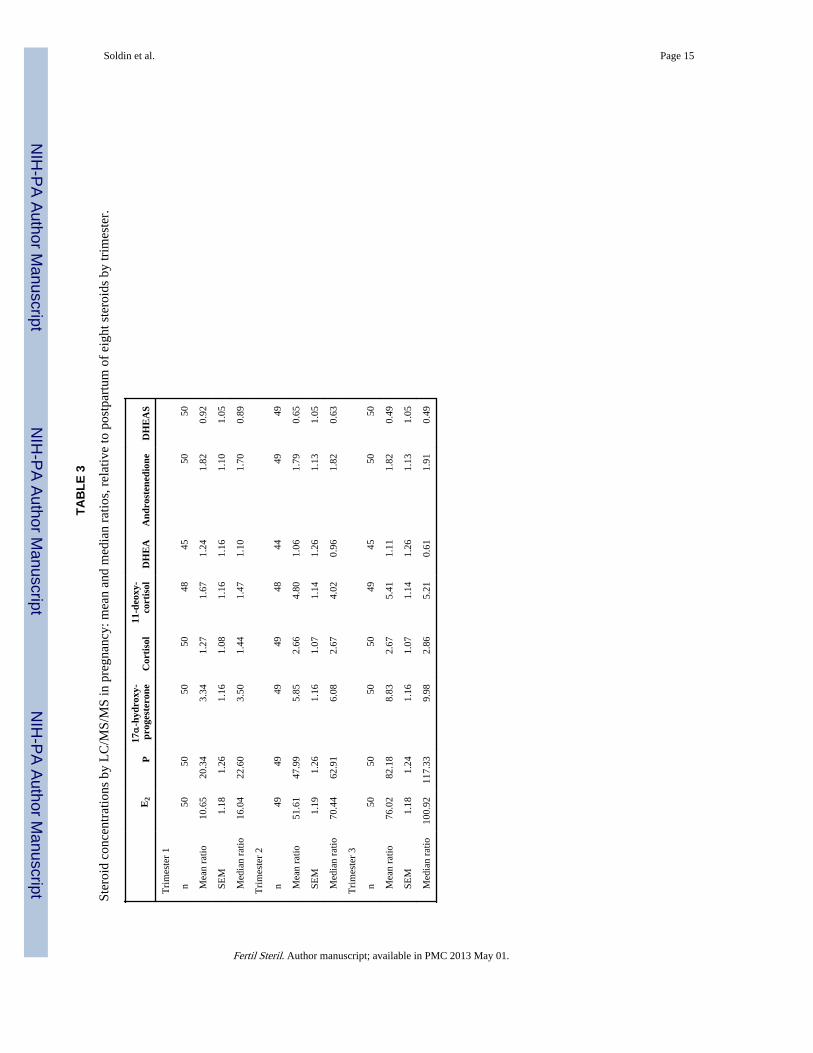
Table 3 presents the mean ± SEM and medians of the distributions of ratios of women’smeasured steroid hormone levels at a given trimester relative to the 1-year postpartum level.The ratios of analytes measured during pregnancy relative to postpartum levels quantify thelevels of change in a simple, intuitively accessible manner. On average, the first trimestervalue of E2 was 10.65 times higher than the 1-year postpartum (baseline) value.
The levels of E2, P, 11-deoxycortisol, and 17-hydroxyprogesterone increased steadilythroughout pregnancy relative to baseline values. Cortisol levels increased from 1.27 timesthe baseline level at the first trimester to 2.66 times that level at the second trimester, but atthe third trimester the level remained elevated at 2.67 times the baseline.
DISCUSSIONWe studied the changes in serum concentrations of estradiol, progesterone, and those ofother steroid hormones throughout normal pregnancy and relative to one year postpartumusing an isotope dilution tandem mass spectrometry. Pregnancy is associated with profoundchanges in maternal steroidogenesis and with the ability of the fetoplacental unit tosynthesize and metabolize steroid hormones. The normal function of the hypothalamic-pituitary-gonadal axis is crucial for the normal progression of pregnancy.
Endogenous estrogens and progestins play a vital role in controlling and maintaining thecourse of normal pregnancy, thus their measurement provides an index of a normalfetoplacental function (15). The measurement of serum E2 forms an integral part of theassessment of female reproductive function, including studies of infertility,oligoamenorrhea, menopause, and hormone therapy, and is widely used in the monitoring ofovulation induction (16) as well as in assisted reproduction (17). Serum E2 concentrationsare also indicated in the study of cardiovascular disorders and Alzheimer’s disease (18).
Soldin et al. Page 5
Fertil Steril. Author manuscript; available in PMC 2013 May 01.
NIH
-PA Author Manuscript
NIH
-PA Author Manuscript
NIH
-PA Author Manuscript
First trimester steroid profiles are determined by corpus luteum P and E2 biosynthesis andsecretion, as well as by the time of onset and extent of P and E2 secretion by the placenta.This dual interplay is dominated by the corpus luteum placental shift, where a relative P andE2 deficiency can develop and may lead to early as well as late abortion. Measurements ofserum P and E2 are essential to reveal such deficiencies and for effective treatment (19).
During pregnancy, E2 is synthesized by placental aromatization of maternal and fetalDHEAS (16). Measurements of circulating levels of the major adrenal steroids, cortisol,DHEA, and DHEAS are useful in the evaluation of hypothalamic-pituitary-adrenal function.DHEAS has been shown to increase in puberty (20), although its function is not yet fullyunderstood.
Serum cortisol excess can indicate Cushing’s syndrome, while a deficiency can indicateAddison’s disease. Elevated levels of stress (and of cortisol) during pregnancy have beenassociated with preterm labor, low infant birth weight and Apgar scores, and increased useof neonatal intensive care unit services (21–23). Epidemiological data indicate an inverserelationship between serum DHEA and DHEAS concentrations and the frequency ofcardiovascular diseases, immune function, progression of HIV infection, Alzheimer’sdisease, and progression of age-related diseases (25–27). Elevated levels of DHEAS arefound in patients with adrenal tumors and congenital adrenal hyperplasia, and slightlyelevated levels are found in patients with polycystic ovary syndrome (28, 29). SerumDHEAS has less interindividual variability than serum cortisol (30), and a higher long-termstability. DHEAS may be a more suitable marker of individual function of the adrenal cortexthan cortisol (31).
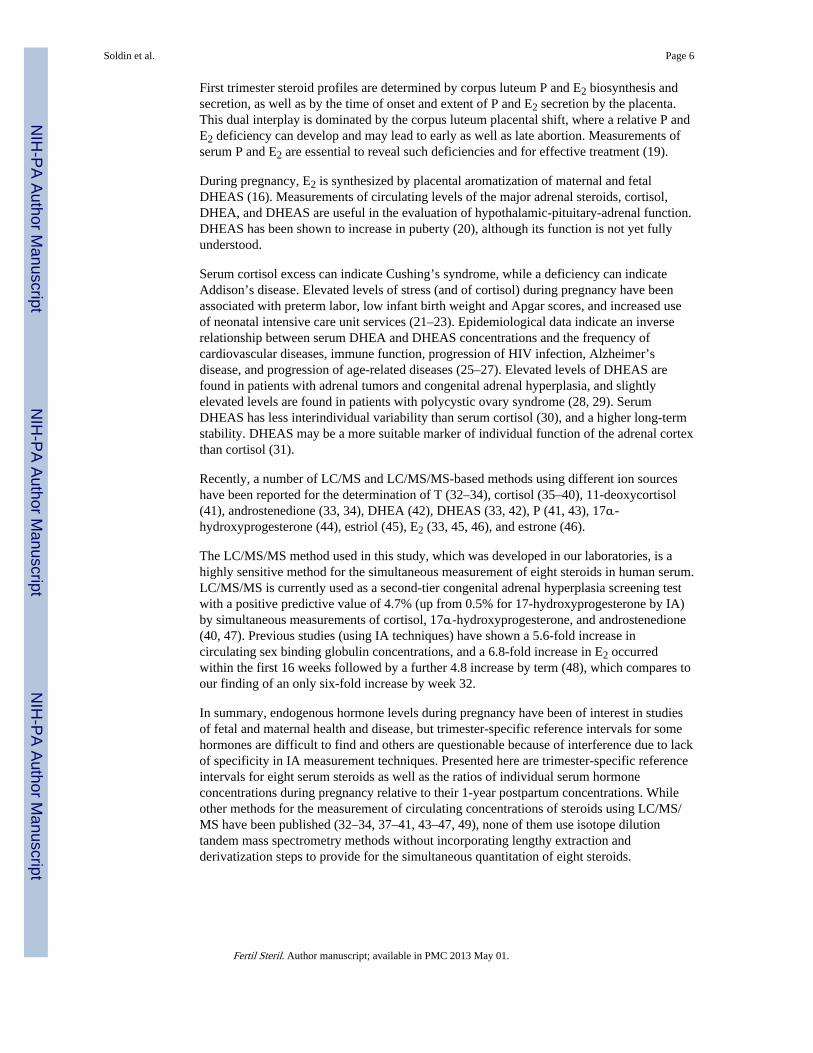
Recently, a number of LC/MS and LC/MS/MS-based methods using different ion sourceshave been reported for the determination of T (32–34), cortisol (35–40), 11-deoxycortisol(41), androstenedione (33, 34), DHEA (42), DHEAS (33, 42), P (41, 43), 17α-hydroxyprogesterone (44), estriol (45), E2 (33, 45, 46), and estrone (46).
The LC/MS/MS method used in this study, which was developed in our laboratories, is ahighly sensitive method for the simultaneous measurement of eight steroids in human serum.LC/MS/MS is currently used as a second-tier congenital adrenal hyperplasia screening testwith a positive predictive value of 4.7% (up from 0.5% for 17-hydroxyprogesterone by IA)by simultaneous measurements of cortisol, 17α-hydroxyprogesterone, and androstenedione(40, 47). Previous studies (using IA techniques) have shown a 5.6-fold increase incirculating sex binding globulin concentrations, and a 6.8-fold increase in E2 occurredwithin the first 16 weeks followed by a further 4.8 increase by term (48), which compares toour finding of an only six-fold increase by week 32.
In summary, endogenous hormone levels during pregnancy have been of interest in studiesof fetal and maternal health and disease, but trimester-specific reference intervals for somehormones are difficult to find and others are questionable because of interference due to lackof specificity in IA measurement techniques. Presented here are trimester-specific referenceintervals for eight serum steroids as well as the ratios of individual serum hormoneconcentrations during pregnancy relative to their 1-year postpartum concentrations. Whileother methods for the measurement of circulating concentrations of steroids using LC/MS/MS have been published (32–34, 37–41, 43–47, 49), none of them use isotope dilutiontandem mass spectrometry methods without incorporating lengthy extraction andderivatization steps to provide for the simultaneous quantitation of eight steroids.
Soldin et al. Page 6
Fertil Steril. Author manuscript; available in PMC 2013 May 01.
NIH
-PA Author Manuscript
NIH
-PA Author Manuscript
NIH
-PA Author Manuscript

AcknowledgmentsThis study was supported in part by NIH GCRC grant no. 5-MO1-RR-13297-S1 and National Cancer Institute grant5RO1 CA-89950-03, National Institutes of Health, USA, Sciex, Canada, and by grants from the Swedish CancerSociety.
REFERENCES1. Tulchinsky D, Hobel CH, Yeager E, Marshall JR. Plasma estrone, estradiol, estriol, progesterone
and 17-hydroxyprogesterone in human pregnancy. I. Normal pregnancy. Am J Obstet Gynecol.1972; 112:1095–1100. [PubMed: 5025870]
2. Buster JE, Abraham GE. The applications of steroid hormone radioimmunoassays to clinicalobstetrics. Obstet Gynecol. 1975; 46:489–499. [PubMed: 126392]
3. Lindberg BS, Johansson EDB, Nilsson BA. Plasma levels of nonconjugated estrone, estradiol, 17β,and estriol during uncomplicated pregnancy. Acta Obstet Gynecol Scand. 1974; 32(Suppl):21–36.
4. Johansson ENB. Plasma levels of progesterone in pregnancy measured by a rapid competitiveprotein binding technique. Acta Endocrinol. 1969; 61:607–617. [PubMed: 5409083]
5. Yen, SSC.; Jaffe, RB. Reproductive endocrinology: physiology, pathophysiology and clinicalmanagement. 3d ed. Philadelphia: W. B. Saunders Company; 1991.
6. Tulchinsky, D.; Little, AB. Maternal-fetal endocrinology. 2d ed. Philadelphia: W. B. SaundersCompany, PA; 1994.
7. Jaffe RB. Fetoplacental endocrine and metabolic physiology. Clin Perinatol. 1983; 10:669–693.[PubMed: 6317268]
8. Norwitz ER, Robinson JN, Challis JRG. The control of labor. N Engl J Med. 1990; 341:660–666.[PubMed: 10460818]
9. Berstein LM. Newborn macrosomy and cancer. Adv Cancer Res. 1988; 50:231–278. [PubMed:3287844]
10. Kricka LJ. Human anti-animal antibody interferences in immunological assays. Clin Chem. 1999;45:942–956. [PubMed: 10388468]
11. Rotmensch S, Cole LA. False diagnosis and needless therapy of presumed malignant disease inwomen with false-positive human chorionic gonadotropin concentrations. Lancet. 2000; 355:712–715. [PubMed: 10703803]
12. Klee GG. Human anti-mouse antibodies. Arch Pathol Lab Med. 2000; 124:921–923. [PubMed:10835540]
13. Marks V. False-positive immunoassay results: a multicenter survey of erroneous immunoassayresults from assays of 74 analytes in 10 donors from 66 laboratories in seven countries. ClinChem. 2002; 48:2008–2016. [PubMed: 12406987]
14. Guo T, Chan YM, Soldin SJ. Steroid profiles using liquid chromatography tandem massspectrometry with atmospheric pressure photoionization source. Arch Path Lab Med. 2004;128:469–475. [PubMed: 15043485]
15. Tulchinsky D, Korenman SG. The plasma estradiol as an index of fetoplacental function. J ClinInvest. 1971; 50:1490–1497. [PubMed: 4996885]
16. Valbuena D, Jasper M, Remohi J, Pellicer A, Simon C. Ovarian stimulation and endometrialreceptivity. Hum Reprod. 1999; 14(Suppl 2):107–111. [PubMed: 10690806]
17. Kligman I, Rosenwaks Z. Differentiating clinical profiles: predicting good responders, poorresponders, and hyperresponders. Fertil Steril. 2001; 76:1185–1190. [PubMed: 11730748]
18. Hogervorst E, Williams J, Combrinck M, David Smith A. Measuring serum oestradiol in womenwith Alzheimer’s disease: the importance of the sensitivity of the assay method. Eur J Endocrinol.2003; 148:67–72. [PubMed: 12534359]
19. Siiteri PK, MacDonald PC. Placental estrogen biosynthesis during human pregnancy. J ClinEndocrinol Metab. 1966; 26:751–761. [PubMed: 4223909]
20. Elmlinger MW, Kuhnel W, Ranke MB. Reference ranges for serum concentrations of lutropin(LH), follitropin (FSH), estradiol (E2), prolactin, progesterone, sex hormone binding globulin
Soldin et al. Page 7
Fertil Steril. Author manuscript; available in PMC 2013 May 01.
NIH
-PA Author Manuscript
NIH
-PA Author Manuscript
NIH
-PA Author Manuscript

(SHBG), dehydroepiandrostendione sulfate (DHEAS), cortisol and ferritin in neonates, childrenand young adults. Clin Chem Lab Med. 2002; 40(11):1151–1160. [PubMed: 12521235]
21. Dole N, Savitz DA, Hertz-Picciotto I, Siega-Riz AM, McMahon MJ, Buekens P. Maternal stressand preterm birth. Am J Epidemiol. 2003; 157:14–24. [PubMed: 12505886]
22. Austin MP, Leader L. Maternal stress and obstetric and infant outcomes: epidemiological findingsand neuroendocrine mechanisms. Aust N Z J Obstet Gynaecol. 2000; 40:331–337. [PubMed:11065043]
23. Urizar GG Jr, Milazzo M, Le HN, Delucchi K, Sotelo R, Munoz RF. Impact of stress reductioninstructions on stress and cortisol levels during pregnancy. Biol Psychol. 2004; 67:275–282.[PubMed: 15294386]
24. Leowattana W. DHEA(S): the fountain of youth. J Med Assoc Thai. 2001; 84(Suppl 2):S605–S612. [PubMed: 11853289]
25. Celec P, Starka L. Dehydroepiandrosterone—is the fountain of youth drying out? Physiol Res.2003; 52:397–407. [PubMed: 12899651]
26. Ceda GP, Dall’Aglio E, Salimbeni I, Rocci A, Mazzoni S, Corradi F, et al. Pituitary function inchronic heart failure in the elderly. J Endocrinol Invest. 2002; 25(10 Suppl):24–28. [PubMed:12508909]
27. Carvalhaes-Neto N, Huayllas MK, Ramos LR, Cendoroglo MS, Kater CE. Cortisol, DHEAS andaging: resistance to cortisol suppression in frail institutionalized elderly. J Endocrinol Invest. 2003;26:17–22. [PubMed: 12602529]
28. Gonzalez F, Chang L, Horab T, Lobo RA. Evidence for heterogeneous etiologies of adrenaldysfunction in polycystic ovary syndrome. Fertil Steril. 1996; 66:354–361. [PubMed: 8751729]
29. Chang PL, Lindheim SR, Lowre C, Ferin M, Gonzalez F, Berglund L, et al. Normal ovulatorywomen with polycystic ovaries have hyperandrogenic pituitary-ovarian responses to gonadotropin-releasing hormone-agonist testing. J Clin Endocrinol Metab. 2000; 85:995–1000. [PubMed:10720029]
30. Thomas G, Frenoy N, Legrain S, Sebag-Lanoe R, Baulieu EE, Debuire B. Serumdehydroepiandrosterone sulfate levels as an individual marker. J Clin Endocrinol Metab. 1994;79:1273–1276. [PubMed: 7962319]
31. Leowattana W. DHEAS as a new diagnostic tool. Clin Chim Acta. 2004; 341:1–15. [PubMed:14967152]
32. Joos PE, Ryckeghem MV. Liquid chromatography-tandem mass spectrometry of some anabolicsteroids. Anal Chem. 1999; 71:4701–4710. [PubMed: 10546536]
33. Dorgan JF, Fears TR, McMahon RP, Aronson Friedman L, Patterson BH, Greenhut SF.Measurement of steroid sex hormones in serum: a comparison of radioimmunoassay and massspectrometry. Steroids. 2002; 67:151–158. [PubMed: 11856538]
34. Chang YC, Li CM, Li LA, Jong SB, Liao PC, Chang LW. Quantitative measurement of malesteroid hormones using automated on-line solid phase extraction-liquid chromatography-tandemmass spectrometry and comparison with radioimmunoassay. Analyst. 2003; 128:363–368.[PubMed: 12741642]
35. Ohno M, Yamaguchi I, Saiki K, Yamamoto I, Azuma J. Specific determination of urinary 6b-hydroxycortisol and cortisol by liquid chromatography-atmospheric pressure chemical ionizationmass spectrometry. J Chromatogr B. 2000; 746:95–101.
36. Tang PW, Law WC, Wan TSM. Analysis of corticosteroids in equine urine by liquidchromatography–mass spectrometry. J Chromatogr B. 2001; 754:229–244.
37. Taylor RL, Machacek D, Singh RJ. Validation of a high-throughput liquid chromatography–tandem mass spectrometry method for urinary cortisol and cortisone. Clin Chem. 2002; 48:1511–1519. [PubMed: 12194928]
38. Jönsson BAG, Malmberg B, Amilon Å, Garde AH, Øraek P. Determination of cortisol in humansaliva using liquid chromatography–electrospray tandem mass spectrometry. J Chromatogr B.2003; 784:63–68.
39. Kushnir MM, Rockwood AL, Nelson GJ, Terry AH, Meikle AW. Liquid chromatography–tandemmass spectrometry analysis of urinary free cortisol. Clin Chem. 2003; 49:965–967. [PubMed:12765998]
Soldin et al. Page 8
Fertil Steril. Author manuscript; available in PMC 2013 May 01.
NIH
-PA Author Manuscript
NIH
-PA Author Manuscript
NIH
-PA Author Manuscript
40. Lacey JM, Minutti CZ, Magera MJ, Tauscher AL, Casetta B, McCann M, et al. Improvedspecificity of newborn screening for congenital adrenal hyperplasia by second-tier steroid profilingusing tandem mass spectrometry. Clin Chem. 2004; 50:621–625. [PubMed: 14656905]
41. Kao PC, Machacek DA, Magera MJ, Lacey JM, Rinaldo P. Diagnosis of adrenal corticaldysfunction by liquid chromatography-tandem mass spectrometry. Ann Clin Lab Sci. 2001;31:199–204. [PubMed: 11337910]
42. Chatman K, Hollenbeck T, Hagey L, Vallee M, Purdy R, Weiss F, et al. Nanoelectrospray massspectrometry and precursor ion monitoring for quantitative steroid analysis and attomolesensitivity. Anal Chem. 1999; 71:2358–2363. [PubMed: 10405603]
43. Wu ZP, Zhang C, Yang CD, Zhang XR, Wu E. Simultaneous quantitative determination ofnorgestrel and progesterone in human serum by high-performance liquid chromatography-tandemmass spectrometry with atmospheric pressure chemical ionization. Analyst. 2000; 125:2201–2205.[PubMed: 11219053]
44. Wudy SA, Hartmann M, Svoboda M. Determination of 17-hydroxyprogesterone in plasma bystable isotope dilution/benchtop liquid chromatography-tandem mass spectrometry. Horm Res.2000; 53:68–71. [PubMed: 10971091]
45. Isobe T, Shiraishi H, Yasuda M, Shinoda A, Suzuki H, Morita M. Determination of estrogens andtheir conjugates in water using solid-phase extraction followed by liquid chromatography-tandemmass spectrometry. J Chromatogr A. 2003; 984:195–202. [PubMed: 12564690]
46. Nelson RE, Grebe SK, O’Kane DJ, Singh RJ. Liquid chromatography-tandem mass spectrometryassay for simultaneous measurement of estradiol and estrone in human plasma. Clin Chem. 2004;50:373–384. [PubMed: 14656902]
47. Minutti CZ, Lacey JM, Magera MJ, Hahn SH, McCann M, Schulze A, et al. Steroid profiling bytandem mass spectrometry improves the positive predictive value of newborn screening forcongenital adrenal hyperplasia. J Clin Endocrinol Metab. 2004; 89:3687–3693. [PubMed:15292289]
48. O’Leary P, Boyne P, Flett P, Beilby J, James I. Longitudinal assessment of changes in reproductivehormones during normal pregnancy. Clin Chem. 1991; 37:667–672. [PubMed: 1827758]
49. Thienpont LM, Van Nieuwenhove B, Stockl D, Reinauer H, De Leenheer AP. Determination ofreference method values by isotope dilution–gas chromatography/mass spectrometry: a five years’experience of two European Reference Laboratories. Eur J Clin Chem Clin Biochem. 1996;34:853–860. [PubMed: 8933112]
Soldin et al. Page 9
Fertil Steril. Author manuscript; available in PMC 2013 May 01.
NIH
-PA Author Manuscript
NIH
-PA Author Manuscript
NIH
-PA Author Manuscript

FIGURE 1.Mean steroid hormone concentrations in pregnancy.
Soldin et al. Page 10
Fertil Steril. Author manuscript; available in PMC 2013 May 01.
NIH
-PA Author Manuscript
NIH
-PA Author Manuscript
NIH
-PA Author Manuscript

FIGURE 2.Ratios steroid hormone concentrations in pregnancy relative to postpartum. P concentrationsare presented as ng/mL/10.
Soldin et al. Page 11
Fertil Steril. Author manuscript; available in PMC 2013 May 01.
NIH
-PA Author Manuscript
NIH
-PA Author Manuscript
NIH
-PA Author Manuscript

NIH
-PA Author Manuscript
NIH
-PA Author Manuscript
NIH
-PA Author Manuscript
Soldin et al. Page 12
TABLE 1
Tandem mass spectrometry between-day precision.
Level 1 Level 2
Steroid Mean (ng/mL, nmol/L) %CV Mean (ng/mL, nmol/L) %CV
E2 0.28, 1,033.48 (pmol/L) 9 0.60, 2,214.6 (pmol/L) 8.5
P 5.6, 17.81 11.4 13.6, 43.25 8.8
17α-hydroxyprogesterone 0.87, 2.61 9.2 3.50, 10.5 7.1
Cortisol 192.7, 531 6.9 341.1, 940 6.1
11-Deoxycortisol 0.78, 2.26 12.7 7.86, 22.79 8.1
DHEA 0.87, 3.02 9.2 2.86, 9.92 8.8
Androstenedione 0.9, 3.14 22 1.82, 6.35 18.1
DHEAS 415, 11.21 (µmol/L) 13.4 1436, 38.77 (µmol/L) 12.7
Note: Replicate: n = 20 for between-day. Quality control was chosen from BioRad Liquichek Immunoassay Plus Control or from in-house controlprepared for 11-deoxycortisol to reflect the clinically reasonable ranges of steroids in pregnancy. CV indicates coefficient of variation.
Fertil Steril. Author manuscript; available in PMC 2013 May 01.
NIH
-PA Author Manuscript
NIH
-PA Author Manuscript
NIH
-PA Author Manuscript
Soldin et al. Page 13
TAB
LE 2
Ref
eren
ce in
terv
als:
ste
roid
fun
ctio
n te
sts
in p
regn
ancy
.
Ref
eren
ce in
terv
als
Ana
lyte
nM
eana
(±S
E)
Med
ian
2.5t
h pe
rcen
tile
97.5
th p
erce
ntile
E2
(ng/
mL
, pm
ol/L
)b
Fir
st tr
imes
terc
510.
87 ±
0.0
7, 3
,211
.2 ±
253
.20.
87, 3
,211
.20.
31, 1
,137
.83.
00, 1
1,01
0
Sec
ond
trim
este
r50
4.24
± 0
.26,
15,
546.
1 ±
961
.54.
29, 1
5,74
4.3
1.91
, 7,0
09.7
10.3
3, 3
7,91
1.11
Thi
rd tr
imes
ter
506.
18 ±
0.4
1, 2
2,68
0.6
± 1
493.
76.
56, 2
4,07
5.2
2.17
, 7,9
63.9
13.8
5, 5
0,82
9.5
Pos
tpar
tum
50<
0.1
± 0
.015
, <36
7.0
± 5
5.0
<0.
1, <
367
—1.
24, 4
,550
.8
P (n
g/m
L, n
mol
/L)
Fir
st tr
imes
ter
5117
.48
± 0
.87,
55.
87 ±
2.7
818
.60,
59.
157.
41, 2
3.56
35.1
6, 1
11.8
0
Sec
ond
trim
este
r50
42.3
0 ±
2.3
3, 1
34.5
1 ±
7.4
43.3
0, 1
37.6
915
.78,
50.
1876
.84,
244
.35
Thi
rd tr
imes
ter
5070
.45
± 3
.32,
224
.03
± 1
0.56
72.9
0, 2
31.8
234
.86,
110
.85
138.
40, 4
40.1
1
Pos
tpar
tum
500.
86 ±
0.2
0, 2
.73
± 0
.62
0.69
, 2.1
9<
0.1,
<0.
3222
.92,
72.
88
17α
-hyd
roxy
prog
este
rone
(ng
/mL
, nm
ol/L
)
Fir
st tr
imes
ter
511.
34 ±
0.0
9, 4
.02
± 0
.27
1.36
, 4.0
80.
48, 1
.44
3.77
, 11.
31
Sec
ond
trim
este
r50
2.30
± 0
.12,
6.9
0 ±
0.3
52.
30, 6
.91.
13, 3
.39
4.67
, 14.
01
Thi
rd tr
imes
ter
503.
51 ±
0.1
8, 1
0.53
± 0
.55
3.50
, 10.
51.
53, 4
.59
7.00
, 21.
00
Pos
tpar
tum
500.
40 ±
0.0
6, 1
.19
± 0
.19
0.41
, 1.2
3<
0.1,
<0.
34.
95, 1
4.85
Cor
tisol
(ng
/mL
, nm
ol/L
)
Fir
st tr
imes
ter
5113
9.84
± 9
.16,
385
.95
± 2
5.28
143.
00, 3
94.6
848
.28,
133
.25
385.
10, 1
065.
88
Sec
ond
trim
este
r50
286.
21 ±
13.
94, 7
89.9
4 ±
38.
4729
0.50
, 801
.78
156.
65, 4
32.3
560
5.22
, 167
0.41
Thi
rd tr
imes
ter
5028
6.79
± 1
3.03
, 791
.54
± 3
5.96
305.
50, 8
43.1
811
4.30
, 315
.47
477.
37, 1
,317
.54
Pos
tpar
tum
5010
7.38
± 6
.73,
296
.37
± 1
8.57
97.6
0, 2
69.3
835
.56,
98.
1529
3.05
, 808
.82
11-D
eoxy
cort
isol
(ng
/mL
, nm
ol/L
)
Fir
st tr
imes
ter
500.
63 ±
0.0
6, 1
.83
± 0
.19
0.67
, 1.9
40.
13, 0
.38
2.45
, 7.1
0
Sec
ond
trim
este
r50
1.69
± 0
.11,
4.8
9 ±
0.3
11.
67, 4
.84
0.71
, 2.0
65.
66, 1
6.41
Thi
rd tr
imes
ter
501.
94 ±
0.1
3, 5
.63
± 0
.38
2.05
, 5.9
40.
70, 2
.03
4.06
, 11.
77
Pos
tpar
tum
490.
35 ±
0.0
4, 1
.02
± 0
.13
0.38
, 1.1
0<
0.1,
<0.
291.
46, 4
.23
DH
EA
(ng
/mL
, nm
ol/L
)
Fir
st tr
imes
ter
511.
93 ±
0.1
5, 6
.71
± 0
.53
1.89
, 6.5
60.
57, 1
.98
6.82
, 23.
67
Fertil Steril. Author manuscript; available in PMC 2013 May 01.
NIH
-PA Author Manuscript
NIH
-PA Author Manuscript
NIH
-PA Author Manuscript
Soldin et al. Page 14
Ref
eren
ce in
terv
als
Ana
lyte
nM
eana
(±S
E)
Med
ian
2.5t
h pe
rcen
tile
97.5
th p
erce
ntile
Sec
ond
trim
este
r50
1.88
± 0
.28,
6.5
4 ±
0.9
61.
84, 6
.38
0.15
, 0.5
210
.18,
35.
32
Thi
rd tr
imes
ter
502.
11 ±
0.2
9, 7
.32
± 1
.01
1.70
, 5.8
90.
24, 0
.83
15.0
2, 5
2.12
Pos
tpar
tum
501.
92 ±
0.2
5, 6
.66
± 0
.86
1.92
, 6.6
6<
0.1,
<0.
355.
74, 1
9.92
And
rost
ened
ione
(ng
/mL
, nm
ol/L
)
Fir
st tr
imes
ter
510.
77 ±
0.0
6, 2
.68
± 0
.22
0.74
, 2.5
80.
17, 0
.59
2.72
, 9.4
9
Sec
ond
trim
este
r50
0.75
± 0
.07,
2.6
3 ±
0.2
30.
75, 2
.62
0.10
, 0.3
52.
48, 8
.65
Thi
rd tr
imes
ter
500.
76 ±
0.0
8, 2
.65
± 0
.26
0.75
, 2.6
20.
08, 0
.28
2.81
, 9.8
1
Pos
tpar
tum
500.
42 ±
0.0
4, 1
.46
± 0
.14
0.39
, 1.3
6<
0.1,
<0.
351.
27, 4
.45
DH
EA
S (n
g/m
L, n
mol
/L)
Fir
st tr
imes
ter
5156
8.29
± 6
3.29
, 1.5
3 ±
0.1
759
8.00
, 1.6
110
0.14
, 2.7
02,
501.
00, 6
7.53
Sec
ond
trim
este
r50
388.
06 ±
43.
68, 1
.05
± 0
.12
413.
50, 1
.12
72.5
7, 1
.96
1,44
3.25
, 38.
97
Thi
rd tr
imes
ter
5029
4.82
± 3
5.26
, 0.8
0 ±
0.0
931
3.50
, 0.8
554
.65,
1.4
71,
092.
05, 2
9.48
Pos
tpar
tum
5059
6.12
± 6
2.24
, 1.6
1 ±
0.1
764
7.00
, 1.7
512
9.10
, 3.4
82,
898.
75, 7
8.27
a All
valu
es a
re g
eom
etri
c m
eans
± S
E.
b Con
vers
ion
fact
ors
from
ng/
mL
to S
I un
its: E
2 ng
/mL
× 3
,670
= p
g/m
L; P
4 ×
3.1
8 =
nm
ol/L
; 17O
HP
× 3
= n
mol
/L; c
ortis
ol ×
2.7
6 =
nm
ol/L
; cor
-11D
× 2
.9 =
nm
ol/L
; DH
EA
× 3
.47
= n
mol
/L;
andr
oste
nedi
one
× 3
.49
= n
mol
/L; D
HE
AS
× 0
.002
7 =
nm
ol/L
.
c Firs
t tri
mes
ter
= w
eek
12; s
econ
d tr
imes
ter
= w
eek
22; t
hird
trim
este
r =
wee
k 32
.
Fertil Steril. Author manuscript; available in PMC 2013 May 01.
NIH
-PA Author Manuscript
NIH
-PA Author Manuscript
NIH
-PA Author Manuscript
Soldin et al. Page 15
TAB
LE 3
Ster
oid
conc
entr
atio
ns b
y L
C/M
S/M
S in
pre
gnan
cy: m
ean
and
med
ian
ratio
s, r
elat
ive
to p
ostp
artu
m o
f ei
ght s
tero
ids
by tr
imes
ter.
E2
P17α
-hyd
roxy
-pr
oges
tero
neC
orti
sol
11-d
eoxy
-co
rtis
olD
HE
AA
ndro
sten
edio
neD
HE
AS
Tri
mes
ter
1
n50
5050
5048
4550
50
Mea
n ra
tio10
.65
20.3
43.
341.
271.
671.
241.
820.
92
SE
M1.
181.
261.
161.
081.
161.
161.
101.
05
Med
ian
ratio
16.0
422
.60
3.50
1.44
1.47
1.10
1.70
0.89
Tri
mes
ter
2
n49
4949
4948
4449
49
Mea
n ra
tio51
.61
47.9
95.
852.
664.
801.
061.
790.
65
SE
M1.
191.
261.
161.
071.
141.
261.
131.
05
Med
ian
ratio
70.4
462
.91
6.08
2.67
4.02
0.96
1.82
0.63
Tri
mes
ter
3
n50
5050
5049
4550
50
Mea
n ra
tio76
.02
82.1
88.
832.
675.
411.
111.
820.
49
SE
M1.
181.
241.
161.
071.
141.
261.
131.
05
Med
ian
ratio
100.
9211
7.33
9.98
2.86
5.21
0.61
1.91
0.49
Fertil Steril. Author manuscript; available in PMC 2013 May 01.
Copyright © 2022 FDOKUMEN