Microbial conversion of steroid compounds: recent developments
Upload
khangminh22Category
view
1download
0
Dissertation zur Erlangung des Doktorgrades
der Fakultät für Chemie und Pharmazie
der Ludwig-Maximilians-Universität München
Dissecting the regulation of gene expression
during steroid hormone signaling in Drosophila
by Dynamic Transcriptome Analysis (DTA)
Katja Frühauf
aus
Pfullendorf, Deutschland
2015

Erklärung
Diese Dissertation wurde im Sinne von � 7 der Promotionsordnung vom 28.
November 2011 von Frau Prof. Dr. Ulrike Gaul betreut.
Eidesstattliche Versicherung
Diese Dissertation wurde eigenständig und ohne unerlaubte Hilfe erarbeitet.
München, 20.01.2015
Katja Frühauf
Dissertation eingereicht am 20.01.2015
1. Gutachter: Prof. Dr. Ulrike Gaul
2. Gutachter: Prof. Dr. Klaus Förstemann
Mündliche Prüfung am 20.02.2015
2

Acknowledgments
Die Zeit der Promotion war für mich ein sehr intensiver, manchmal grenzwertiger, abererfahrungsreicher und wichtiger Lebensabschnitt. Deshalb möchte ich mich bei den Menschen, diediese ermöglicht haben, die Zeit so interessant und bewegend gemacht haben, sowie mich auf diesemWeg begleitet und unterstützt haben, bedanken.
I would like to express my gratitude to you, Ulrike Gaul, for giving me the opportunity to work inyour lab and for the trust you placed in me and my capabilities. I appreciate your personal supportand e�ort to improve my skills towards perfection.
I am very grateful to Prof. Dr. Klaus Förstemann for reviewing this thesis and for his valuableexperimental and scienti�c advices on microRNAs.
Moreover, I would like to thank all the other members of my thesis committee: Dr. DietmarMartin, Prof. Dr. Nicolas Gompel, Prof. Dr. Karl-Klaus Conzelmann and Dr. Daniel Wilson fortheir support and time.
I am particularly grateful for the excellent bioinformatic assistance given by Björn Schwalb.Without your support and ideas this thesis wouldn´t have been possible.
I also would like to thank Fulvia Ferrazzi, Bettina Knapp and Ste�en Sass for stimulatingdiscussions and great work on data analysis. In this regard, I also want to thank Ulrich Unnerstall,and additionally for his fascination for details.
I am very grateful for the excellent scienti�c assistance given by Lars Dölken and Bernd Rädle formetabolic RNA labeling, as well as Stefan Krebs and Alexander Graf for next-generation sequencing.
I warmly thank all the present and former members of the Gaul group for a comfortable andsupporting working atmosphere. I really appreciate that throughout the six years I was alwayshappy to see and chat to you.
Hierbei möchte ich mich bei einigen persönlich bedanken:
Liebe Julia (Philippou-Massier), deine umsetzungsfreudige Arbeitsweise und technische Expertisewar eine wertvolle Bereicherung für mich. Lieber Christophe (Jung), dir danke ich für deinegrenzenlos optimistische Einstellung, analystische Expertise und für die wunderbare Zeit mit dir,die über den Dächern bzw. im Jazz Keller New Yorks begonnen hat.
Liebe Claudia (Ludwig) und Monika (Hanf), aller liebsten Dank für eure wertvolle experimentelleUnterstützung und dafür, dass ihr zusammen mit euch, Ruzica (Barisic) und Peter (Bandilla),dieses Labor perfekt ver- und entsorgt. Und auch dir, Sabine, möchte ich danken.
Liebe Susi (Rieder), ohne dich wären die ersten Jahre nur halb so e�zient und halb so lustiggewesen. Ich bin sehr dankbar, dass wir uns auch in den privaten Höhen und Tiefen begleitet habenund die gemeinsame Zeit unvergesslich bleibt.
Genauso unvergessen bleibt auch die Zeit, die ich mit dir, So�a (Axelrod), verbracht habe. Es warimmer eine wunderbar erfrischende Abwechslung mit dir den Wald im Berghain oder die Schweinein der Oper au�eben zu lassen.
3
Bei einigen Leuten im Genzentrum möchte ich mich nicht nur für die exzellente Hilfestellung, sondernauch für die freundschaftlichen Beziehungen bedanken.Romy (Böttcher), ohne deinen hot stu� wäre ein Teil dieser Arbeit nicht möglich gewesen und ohnedeine herrlich fröhliche Art wäre vieles nicht so hyper, hyper gewesen.Auch du Anja (Kiesel) hast mit deiner Fröhlichkeit und Begeisterung für den CASY dazubeigetragen, dass die S2 Zellen sich wohl fühlten und endlich das machten was ich wollte.Genauso möchte ich auch noch einmal dir, Claudia, danken, dass du mich in der letzten doch sehrschweren Laborzeit sehr unterstützt hast.Auch dir, Margaux (Michel) möchte ich danken, da es immer unglaublich wertvoll war einen weiterenRNA-Seq (Leid-)genossen zu haben.Dir, Kerstin (Maier) danke ich für deine einzigartige Unterstützung im Andimetrix Raum undnatürlich für das proof reading.Auch dir Wolfgang (Mühlbacher) möchte ich danken, dass du in der allerschwersten Zeit noch fürwesentliche Geistesblitze gesorgt hast.Danke an euch, Simone (Boos), Martina (Oberhuber), Matthias (Siebert) und Stefan (Jordan) fürdie Zeit, die wir auÿerhalb des Genzentrums, meist auf der Tanzfäche, verbracht haben.
Ich möchte mich aus tiefstem Herzen bei all meinen Freunden und Bekannten bedanken, die dieZeit der Promotion mit unendlicher Unterstützung und Lebensfreude gefüllt haben.
Besonderen Dank an euch, Becky, Natalie, Marie, Petzi, Clare und Frederike, dass ihr alle auf eureganz besondere Weise immer wieder mein Selbstvertrauen gestärkt habt und mit eurer Freundschaftdiese Zeit so wunderbar erfüllt habt.
Liebe Julia (Graf), dir verdanke ich, dass ich in dir oft einen Spiegel meiner selbst gesehen habeund mich daher deine Gedanken und Ansichten ohne viel Worte bereichert haben.
Dir, Lisa (Marcinowksi), erst einmal vielen Dank, dass du diese Arbeit komplett gelesen hast unddeine e�ziente Art ein sehr wertvolles feedback für mich war. Viel mehr möchte ich dir aber dafürdanken, dass du, wie schon so lange, immer für mich da warst, mich aufgebaut hast und auf deineeigene Art und Weise mit gelitten hast/musstest.
Bei meinen Geschwistern möchte ich mich bedanken, dass sie immer an meiner Seite sind. Besondersdir, Jessi, danke ich für deine kleinen Aufmerksamkeiten, die unendlich groÿe Wirkung hatten.Das kleine Glück wurde ganz groÿ und hat Gesellschaft von der erleuchteten Frucht�iege bekommen.
Bei euch, Mama und Papa möchte ich mich aus tiefstem Herzen bedanken. Danke, dass ihr mich inallem was ich tue so selbstverständlich unterstützt und immer hinter mir steht.
Etwas was mich persönlich durch all die Höhen und Tiefen dieser Zeit getragen hat, ist die Musik.Ihr verdanke ich auch das wertvollste, dass in dieser Zeit entstanden ist:
Die Beziehung mit dir, Michi. Mit dir an meiner Seite konnte ich immer wieder den Ausblickgenieÿen, wenn ich mal wieder einen Umweg nehmen musste. Ich bin dir unendlich dankbar, dassdu diese Arbeit mehrmals (!) gelesen und überarbeitet hast; sie mit deiner Meinung und Expertisewesentlich beein�usst hast. Danke, dass du mich immer wieder und besonders in den letzten Monatenmit deiner Liebe aufgefangen und mir die nötige Kraft zum Durchhalten gegeben hast. You've gotthe love I need to see me through!
4
Abstract
The synthesis and decay of mRNA transcripts are key mechanisms for the regulation of geneexpression in all organisms, from yeast to �y to human. However, a quantitative and globaldescription of how transcriptional and post-transcriptional regulation is integrated to set and adjustgene expression levels is still missing.In this work I used the genomic response to the steroid hormone ecdysone in the Drosophila S2cell line as an experimental model to study the transcriptional and post-transcriptional regulationof gene expression dynamics. I combined highly quantitative time series data on mRNA expressionlevels, synthesis and decay rates, obtained by metabolic RNA labeling (Dynamic TranscriptomeAnalysis, DTA), with single-molecule microRNA expression pro�ling and phenotypic readouts ofcell proliferation, cell cycle and cell morphology.DTA measures the genomic response to ecdysone with high sensitivity and improved temporalresolution for early changes in gene expression and particularly for repressed genes. Overall, ecdysonesignaling di�erentially regulates the mRNA expression levels, synthesis or decay rates of 2141 geneswithin the �rst 12 hours. The functional annotation of these genes correlates very well with theecdysone induced phenotypic changes, namely exit from cell proliferation to enter di�erentiation.The �rst global assessment of decay regulation by ecdysone signaling shows that changes in decayrates are characterized by a less sustained progression compared to changes in synthesis rates,indicating that decay rates are controlled in a temporally more restricted (dynamic) fashion.By complementing the DTA gathered gene expression data with k-means clustering of fold changesand kinetics of nascent and total mRNA expression levels as well as decay and turnover rates, weuncover that ecdysone signaling induces a rich and previously unknown diversity of gene expressiondynamics. Speci�cally, we identi�ed twenty distinct groups of potentially co-regulated genes, whichexhibit unique combinations of e�ect type, strength and timing of changes in mRNA synthesis, decayrates and total expression level. Moreover, we observe a widespread, but not general coupling ofmRNA synthesis and decay rates. Further investigation of these kinetically distinct gene clustersshows speci�c and reliable functional annotation enrichments and reveals the temporal order inwhich ecdysone signaling regulates the biological processes to direct the cell from its proliferatingstate into the di�erentiated state.To gain �rst insights into the regulatory principles that underlie these patterns of coordinated geneactivity we assessed the kinetics of transcription factors (TFs) and RNA-binding proteins (RBPs)and provide evidence that, in addition to the canonical regulators of the ecdysone cascade, the TFsfoxo, Sox14 and schlank as well as the RBPs brat and lin-28 represent potential novel key regulatorsof ecdysone induced genes expression kinetics.Based on mRNA decay rates we developed a novel approach for miRNA-mRNA network analysisthat is superior to previous approaches and o�ers insights into the post-transcriptional regulationof the ecdysone response by miRNAs. Upon ecdysone treatment, we observe a rapid repression ofmiRNAs associated with the proliferative state and a progressive induction of miRNAs associatedwith the di�erentiated state. Strikingly, the largest fraction of the di�erentially regulated miRNAsand especially the early induced miRNAs (miR-282*, miR-276a*, miR-276a, miR-276b and miR-252)have not been implicated in ecdysone signaling or in the biological processes regulated by ecdysone,yet. Therefore, our dataset represents an excellent resource for studying the function of thesemiRNAs in ecdysone signaling, cell cycle, metabolism or di�erentiation/morphogenesis.This work comprises a detailed dissection of ecdysone induced gene expression dynamics, theirfunctional implications and underlying regulatory principles, and therefore, establishes ecdysonestimulation in Drosophila S2 cells as an experimental paradigm for studying mechanistic details ofgene expression regulation.
5
Contents
Erklärung 2
Eidesstattliche Versicherung 2
Acknowledgments 3
Abstract 5
Table of contents 8
I Introduction 9
1 Mechanisms of gene regulation 9
1.1 Transcriptional mechansims . . . . . . . . . . . . . . . . . . . . . . . . . . . . . . . . 91.2 Co-transcriptional and post-transcriptional mechanisms . . . . . . . . . . . . . . . . 10
1.2.1 mRNA life cycle . . . . . . . . . . . . . . . . . . . . . . . . . . . . . . . . . . 101.2.2 miRNAs as post-transcriptional regulators . . . . . . . . . . . . . . . . . . . . 10
1.2.2.1 miRNA biogenesis . . . . . . . . . . . . . . . . . . . . . . . . . . . . 111.2.2.2 miRNA induced silencing of mRNA targets . . . . . . . . . . . . . . 111.2.2.3 miRNA function and their role in signaling pathways . . . . . . . . 111.2.2.4 Computational target prediction . . . . . . . . . . . . . . . . . . . . 13
2 The steroid hormone ecdysone 13
2.1 Biological function of ecdysone . . . . . . . . . . . . . . . . . . . . . . . . . . . . . . 132.2 Pathway components and its spatio-temporal regulation . . . . . . . . . . . . . . . . 152.3 Ecdysone regulated miRNAs . . . . . . . . . . . . . . . . . . . . . . . . . . . . . . . . 16
3 Dynamic Transcriptome Analysis (DTA) 17
4 Aims and scope of this thesis 19
II Material and Methods 23
5 Material 23
5.1 Cell line and culture . . . . . . . . . . . . . . . . . . . . . . . . . . . . . . . . . . . . 235.2 List of primers . . . . . . . . . . . . . . . . . . . . . . . . . . . . . . . . . . . . . . . 235.3 Spike-In transcripts . . . . . . . . . . . . . . . . . . . . . . . . . . . . . . . . . . . . . 245.4 Antibodies and probes . . . . . . . . . . . . . . . . . . . . . . . . . . . . . . . . . . . 245.5 Bu�ers and solutions . . . . . . . . . . . . . . . . . . . . . . . . . . . . . . . . . . . . 255.6 Metabolic RNA labeling and RNA isolation . . . . . . . . . . . . . . . . . . . . . . . 255.7 mRNA and microRNA expression pro�ling . . . . . . . . . . . . . . . . . . . . . . . . 265.8 Nucleic acid quanti�cation . . . . . . . . . . . . . . . . . . . . . . . . . . . . . . . . . 265.9 Staining for �ow cytometry . . . . . . . . . . . . . . . . . . . . . . . . . . . . . . . . 26
6 Experimental methods 27
6.1 Cell based methods . . . . . . . . . . . . . . . . . . . . . . . . . . . . . . . . . . . . . 276.1.1 Cell culture conditions . . . . . . . . . . . . . . . . . . . . . . . . . . . . . . . 276.1.2 Cell counting and phenotypic assessment . . . . . . . . . . . . . . . . . . . . . 27
6

6.1.3 Cell treatments . . . . . . . . . . . . . . . . . . . . . . . . . . . . . . . . . . . 276.1.4 Flow cytometry . . . . . . . . . . . . . . . . . . . . . . . . . . . . . . . . . . . 27
6.2 Protein methods . . . . . . . . . . . . . . . . . . . . . . . . . . . . . . . . . . . . . . 276.2.1 Preparation of whole cell extracts for Western blot analysis . . . . . . . . . . 276.2.2 SDS-Polyacrylamide gel electrophoresis (SDS-PAGE) . . . . . . . . . . . . . . 286.2.3 Western blotting . . . . . . . . . . . . . . . . . . . . . . . . . . . . . . . . . . 28
6.3 Methods for expression analysis of mRNAs . . . . . . . . . . . . . . . . . . . . . . . . 286.3.1 Metabolic labeling of nascent RNA (DTA-protocol) . . . . . . . . . . . . . . . 286.3.2 Extraction of total cellular RNA (DTA-protocol) . . . . . . . . . . . . . . . . 286.3.3 Biotinylation of 4sU labeled, nascent RNA (DTA-protocol) . . . . . . . . . . 296.3.4 Isolation of labeled (nascent) RNA (DTA-protocol) . . . . . . . . . . . . . . . 296.3.5 RNA quanti�cation and quality control . . . . . . . . . . . . . . . . . . . . . 296.3.6 DNase treatment . . . . . . . . . . . . . . . . . . . . . . . . . . . . . . . . . . 306.3.7 Dot blot . . . . . . . . . . . . . . . . . . . . . . . . . . . . . . . . . . . . . . . 306.3.8 Reverse transcription and real-time PCR . . . . . . . . . . . . . . . . . . . . . 306.3.9 Microarray hybridization for DTA . . . . . . . . . . . . . . . . . . . . . . . . 306.3.10 Data processing, quality control, normalization and �ltering . . . . . . . . . 306.3.11 Estimation of relative mRNA synthesis and decay rates . . . . . . . . . . . . 316.3.12 Di�erential expression analysis . . . . . . . . . . . . . . . . . . . . . . . . . . 32
6.3.12.1 Single time point analysis . . . . . . . . . . . . . . . . . . . . . . . . 326.3.12.2 Time series analysis . . . . . . . . . . . . . . . . . . . . . . . . . . . 32
6.3.13 Gene Ontology (GO) analysis . . . . . . . . . . . . . . . . . . . . . . . . . . . 336.3.13.1 topGO . . . . . . . . . . . . . . . . . . . . . . . . . . . . . . . . . . 336.3.13.2 Cytoscape plugin ClueGO . . . . . . . . . . . . . . . . . . . . . . . . 33
6.3.14 k-means clustering . . . . . . . . . . . . . . . . . . . . . . . . . . . . . . . . . 336.3.14.1 Individual k-means clustering . . . . . . . . . . . . . . . . . . . . . . 336.3.14.2 Combined k-means clustering . . . . . . . . . . . . . . . . . . . . . . 33
6.3.15 Cluster characterization . . . . . . . . . . . . . . . . . . . . . . . . . . . . . . 346.3.15.1 Description of cluster timing, strength, e�ect type and coupling of
synthesis and decay rates . . . . . . . . . . . . . . . . . . . . . . . . 346.3.15.2 UTR sequence analysis . . . . . . . . . . . . . . . . . . . . . . . . . 346.3.15.3 Enrichment analyses . . . . . . . . . . . . . . . . . . . . . . . . . . . 34
6.4 Methods for expression analysis of microRNAs . . . . . . . . . . . . . . . . . . . . . 346.4.1 microRNA puri�cation . . . . . . . . . . . . . . . . . . . . . . . . . . . . . . . 346.4.2 Northern blotting . . . . . . . . . . . . . . . . . . . . . . . . . . . . . . . . . . 346.4.3 RT-PCR . . . . . . . . . . . . . . . . . . . . . . . . . . . . . . . . . . . . . . . 346.4.4 nCounter . . . . . . . . . . . . . . . . . . . . . . . . . . . . . . . . . . . . . . 356.4.5 nCounter data analysis . . . . . . . . . . . . . . . . . . . . . . . . . . . . . . . 356.4.6 miRNA target predictions . . . . . . . . . . . . . . . . . . . . . . . . . . . . . 356.4.7 miRNA-mRNA network analysis . . . . . . . . . . . . . . . . . . . . . . . . . 35
6.5 Methods for optimizing the D. melanogaster DTA-RNA-Seq protocol . . . . . . . . . 366.5.1 Spike-In controls . . . . . . . . . . . . . . . . . . . . . . . . . . . . . . . . . . 366.5.2 Depletion of ribosomal RNA (primer design) . . . . . . . . . . . . . . . . . . 376.5.3 Next-generation sequencing . . . . . . . . . . . . . . . . . . . . . . . . . . . . 376.5.4 Processing of sequencing data . . . . . . . . . . . . . . . . . . . . . . . . . . . 37
III Dissecting the regulation of gene expression during steroid hormonesignaling in Drosophila 38
7
7 Results 387.1 Ecdysone induced cell cycle exit and di�erentiation in S2 cells . . . . . . . . . . . . . 387.2 Establishing 4sU labeling and the transcriptional time scale of ecdysone signaling in
S2 cells . . . . . . . . . . . . . . . . . . . . . . . . . . . . . . . . . . . . . . . . . . . 407.3 DTA monitors the transcriptional response to ecdysone with high sensitivity and
improved temporal resolution . . . . . . . . . . . . . . . . . . . . . . . . . . . . . . . 407.4 Ecdysone induces major, progressively increasing and mostly sustained changes in
gene expression . . . . . . . . . . . . . . . . . . . . . . . . . . . . . . . . . . . . . . . 427.5 Functional annotation of ecdysone regulated genes explains observed phenotypic changes 437.6 First global assessment of ecdysone regulated synthesis and decay rates suggests
di�erent regulatory principles . . . . . . . . . . . . . . . . . . . . . . . . . . . . . . . 477.7 Ecdysone induces multiple distinct temporal patterns of transcription, decay rates
and total expression level . . . . . . . . . . . . . . . . . . . . . . . . . . . . . . . . . 497.8 DTA reveals a rich and previously unknown diversity of gene expression dynamics
downstream of ecdysone signaling and uncovers principles of transcriptional and post-transcriptional regulation . . . . . . . . . . . . . . . . . . . . . . . . . . . . . . . . . 50
7.9 Ecdysone regulates genes with speci�c biological functions in a de�ned temporal order 537.10 Establishing miRNA pro�ling in ecdysone treated S2 cells . . . . . . . . . . . . . . . 557.11 nCounter expression pro�ling identi�es known and novel ecdysone regulated miRNAs 567.12 Potential roles of miRNAs in the ecdysone response of S2 cells . . . . . . . . . . . . . 587.13 Novel decay rate-based approach for miRNA-mRNA network analysis . . . . . . . . . 597.14 The miRNA-mRNA networks during the ecdysone response . . . . . . . . . . . . . . 617.15 TFs, miRNA-mRNA interactions and RBPs indicate underlying regulatory mecha-
nisms of ecdysone induced gene expression kinetics . . . . . . . . . . . . . . . . . . . 63
8 Summary and Discussion 67
9 Outlook 70
IV Establishing an improved DTA-RNA-Sequencing protocol for dissectingthe Drosophila core promoter 73
10 Results and Discussion 7310.1 4sU labeled and unlabeled Spike-In transcripts enable DTA-RNA-Sequencing data
normalization . . . . . . . . . . . . . . . . . . . . . . . . . . . . . . . . . . . . . . . . 7310.2 InDA-C technology e�ciently depletes Drosophila rRNA during sequencing library
preparation . . . . . . . . . . . . . . . . . . . . . . . . . . . . . . . . . . . . . . . . . 7410.3 Genome-wide measurement of transcript steady state and nascent transcription rates 76
V Appendix 77
11 Supplementary Figures 77
12 Supplementary Tables (CD-ROM) 90
13 Supplementary File (CD-ROM) 90
List of Figures 108
List of Tables 109
8
Part I
Introduction
1 Mechanisms of gene regulation
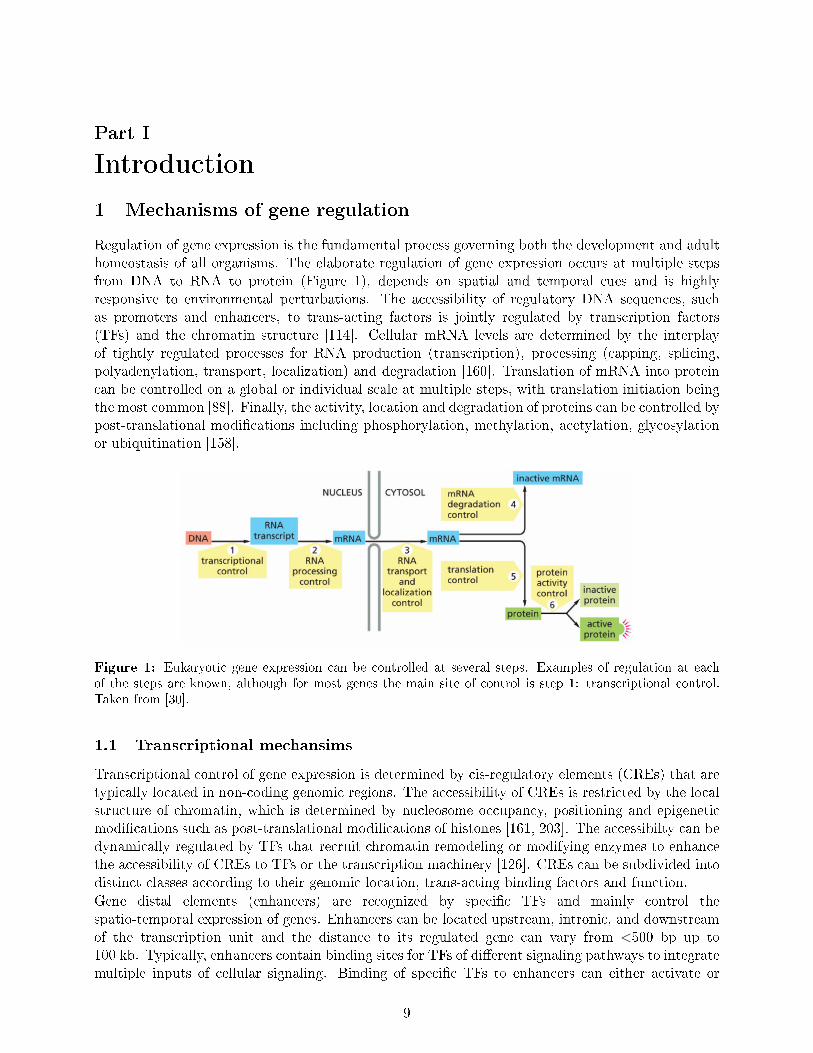
Regulation of gene expression is the fundamental process governing both the development and adulthomeostasis of all organisms. The elaborate regulation of gene expression occurs at multiple stepsfrom DNA to RNA to protein (Figure 1), depends on spatial and temporal cues and is highlyresponsive to environmental perturbations. The accessibility of regulatory DNA sequences, suchas promoters and enhancers, to trans-acting factors is jointly regulated by transcription factors(TFs) and the chromatin structure [114]. Cellular mRNA levels are determined by the interplayof tightly regulated processes for RNA production (transcription), processing (capping, splicing,polyadenylation, transport, localization) and degradation [160]. Translation of mRNA into proteincan be controlled on a global or individual scale at multiple steps, with translation initiation beingthe most common [88]. Finally, the activity, location and degradation of proteins can be controlled bypost-translational modi�cations including phosphorylation, methylation, acetylation, glycosylationor ubiquitination [158].
Figure 1: Eukaryotic gene expression can be controlled at several steps. Examples of regulation at eachof the steps are known, although for most genes the main site of control is step 1: transcriptional control.Taken from [30].
1.1 Transcriptional mechansims
Transcriptional control of gene expression is determined by cis-regulatory elements (CREs) that aretypically located in non-coding genomic regions. The accessibility of CREs is restricted by the localstructure of chromatin, which is determined by nucleosome occupancy, positioning and epigeneticmodi�cations such as post-translational modi�cations of histones [161, 203]. The accessibilty can bedynamically regulated by TFs that recruit chromatin remodeling or modifying enzymes to enhancethe accessibility of CREs to TFs or the transcription machinery [126]. CREs can be subdivided intodistinct classes according to their genomic location, trans-acting binding factors and function.Gene distal elements (enhancers) are recognized by speci�c TFs and mainly control thespatio-temporal expression of genes. Enhancers can be located upstream, intronic, and downstreamof the transcription unit and the distance to its regulated gene can vary from <500 bp up to100 kb. Typically, enhancers contain binding sites for TFs of di�erent signaling pathways to integratemultiple inputs of cellular signaling. Binding of speci�c TFs to enhancers can either activate or
9
repress the transcription of their target genes [114].Gene proximal elements (core promoters) interact with the transcription machinery and controlexpression strength [101]. The core promoter is generally de�ned as the DNA region that isnecessary for the initiation of transcription and is comprised of the transcription start site (TSS)and �anking sequence [101]. At the core promoter, RNA Polymerase II (Pol II) assembles togetherwith general TFs (GTFs) into a pre-initiation complex (PIC). GTFs mediate promoter recognition,recruitment of Pol II, connect gene-speci�c factors to the PIC, interact with histones and promoteDNA unwinding [182]. The PIC is required for transcription bubble formation, TSS scanning, andinitial synthesis of the nascent transcript [116].While the general composition and mechanism of the PIC is well studied, the gene class speci�ccomposition and the core promoter elements it binds to are not well characterized. Moreover, howthe core promoter architecture and its surrounding features, such as nucleosomes, mechanisticallycontrol the plasticity of gene expression is largely unknown. Therefore, one challenging goal inthe �eld of gene expression regulation is to understand how all regulatory input from trans-actingfactors that bind to distal or proximal CREs is integrated at the core promoter resulting in a uni�edtranscription rate.
1.2 Co-transcriptional and post-transcriptional mechanisms
1.2.1 mRNA life cycle
The mRNA life cycle consists of RNA production (transcription), processing (capping, splicing,polyadenylation, transport, localization), translation and degradation. The global and speci�cregulation of mRNA abundance is predominantly accomplished by alterations of synthesis and decayrates.Transcription can be regarded as the most important regulatory step in the mRNA life cycle. It isnot only catalyzing the synthesis of a transcript itself, but via co-transcriptional 5´ capping, splicingand 3´ end formation it also converts a pre-mRNA into an export, translation and decay competentmRNA. Pol II and associated TFs can also recruit various post-transcriptional regulators that areco-transcriptionally deposited onto the nascent mRNA [80]. Moreover, transcription controls thelength of 5´ and 3´ untranslated regions (UTRs) through alternative TSS choice and alternativepoly(A) site usage [168, 135]. The length of UTRs directly a�ects mRNA stability and/or translatione�ciency, since longer UTRs typically contain more cis-regulatory elements, which can be targetedby RNA-binding proteins (RBPs) or microRNAs (miRNAs) [68, 64, 112, 188].Eukaryotic mRNAs are equipped with two integral stability determinants � the 5´ 7-methylguanosinecap and the 3´ poly(A) tail. These two structures interact with the cytoplasmic proteins eIF4E andthe poly(A)-binding protein (PABP), respectively, to protect the transcript from exonucleases andto enhance translation initiation [64]. Shortening (deadenylation) of the 3´ poly(A) tail by theCcr4-Not complex is the �rst and often rate-limiting step in eukaryotic mRNA degradation [74].Following deadenylation either the 5´ cap is removed by a process known as decapping and theuncapped mRNA subsequently degraded by the exonuclease Xrn1 or the unprotected 3´ end isattacked by a large complex of exonucleases known as the exosome [46, 123, 91]. In many cases,mRNA stability regulation is linked to changes in the poly(A) tail: activators protect or lengthenthe tail, repressors shorten it. The latter is achieved by RBP or miRNA mediated recruitment ofthe Ccr4-Not complex and is a key mechanism to regulate the steady-state levels of mRNAs and, asa consequence, protein output [28].
1.2.2 miRNAs as post-transcriptional regulators
In 1993 the world of miRNAs was discovered by Ambros, Ruvkun and colleagues [125], who reportedthat the miRNAs lin-4 and let-7 control developmental timing in nematodes by modulating the
10
expression of other genes at the post-transcriptional level. Since then the miRNA �eld has growntremendously becoming an integral component of gene expression regulation [96].
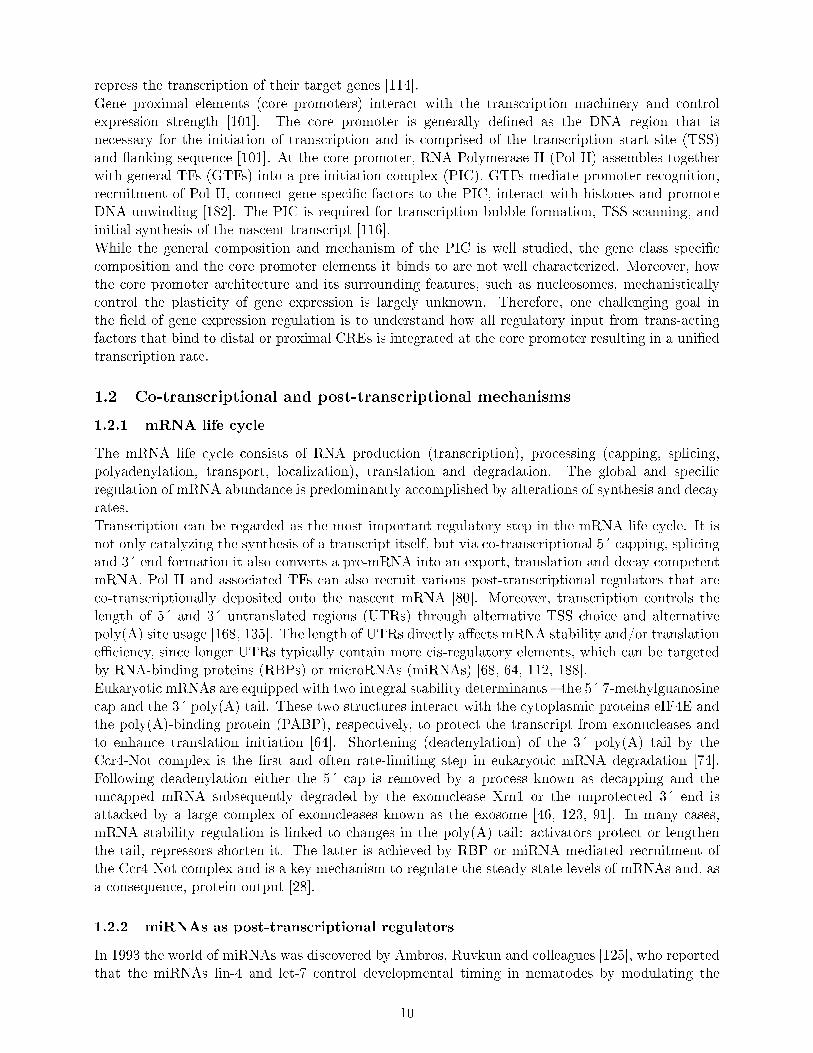
1.2.2.1 miRNA biogenesis miRNAs are small non-coding RNAs ∼20�24 nucleotides (nt) long,which post-transcriptionally repress the expression of target genes usually by binding to the 3´ UTRof mRNA. As a class, miRNAs constitute about 1%�2% of genes in worms, �ies, and mammals [16].Most miRNA genes are located as genomic clusters in intergenic regions and are transcribedas independent transcriptional units by Pol II. Other miRNAs (about 25-30%) are embeddedwithin introns of coding genes and might be regulated by the promoter of their host gene [96].miRNAs are transcribed as part of longer precursors (primary transcript; pri-miRNA) that fold onthemselves to form hairpin structures (Figure 2). The hairpin structure is cleaved by the RNase IIIendonuclease Drosha and its double-stranded RNA-binding domain partner Pasha [127, 48] to yieldthe ∼60-70 nucleotide long pre-miRNA hairpin. The pre-miRNA is exported to the cytoplasmby Exportin 5 [108], where it is cleaved by a second RNase III endonuclease, Dicer (Dcr-1 inDrosophila) and its dsRBD partner Loquacious (Loqs) into a double-stranded miRNA-miRNA*duplex [134]. The mature miRNA strand is subsequently incorporated into the miRNA-inducedsilencing complex (miRISC), where it is bound to a member of the Ago protein family (Ago1 inDrosophila). The unincorporated strand (miRNA*) is degraded. However, in some cases miRNAs*can also be functional [140].
1.2.2.2 miRNA induced silencing of mRNA targets At the core of the miRISC lies themiRNA-loaded Ago protein and the sca�old protein GW182, which recruits additional silencingfactors [59]. The miRNA guides target selection through canonical base pairing between the seedsequence of the miRNA (nucleotides 2�8 at its 5´ end) and its complementary seed match sequencein the target mRNA. The seed sequence contributes the majority of the binding energy and istypically located in the 3´ UTR of the mRNA [4, 77, 137]. However, it can also be located in the5´ UTR or coding region of the mRNA [136, 60, 171, 85]. Upon binding miRISC represses thetargets translation and/or stimulates its degradation. Translational repression can be modulated byinterfering with eIF4E-cap recognition, 40S ribosomal subunit recruitment or by displacing PABPand inhibiting the circularization of the closed-loop structure necessary for translation [111, 59,147]. The degradation of targets depends on the extent of sequence complementarity. Completesequence complementarity leads to site-speci�c endonucleolytic cleavage by Ago (Ago2 in Drosophila)and subsequent degradation of the 5´ and 3´ ends by Xrn1 and the exosome [141]. However,most miRNAs bind with partial complementarity. In this case, miRISC interacts with the Ccr4-Not deadenylase complex and the Dcp1-Dcp2 decapping complex, to facilitate deadenylation anddecapping, respectively [28, 50, 59, 152]. The remaining mRNA is subsequently degraded by Xrn1and the exosome [94].The relative importance and timing of translational inhibition versus mRNA degradation is amatter of current discussion. However, recent studies have shown that miRNA mediated transcriptdegradation explains ∼70-80% of the e�ect on protein levels [86].
1.2.2.3 miRNA function and their role in signaling pathways miRNAs are speci�cand essential post-transcriptional regulators in a wide range of biological processes. During bothdevelopment and adulthood, miRNA function to coordinate cell growth, metabolism, fate, andmorphology within changing environmental conditions [122, 97, 117, 183, 134]. In doing so, miRNAsensure that the organism undergoes appropriate developmental and post-developmental transitionsand confer biological robustness. The mechanistic concepts of miRNA functions depend on thespeci�c biological context and include reinforcing transcriptional programs to sharpen transitions,entrench cellular identities, bu�er �uctuations in gene expression or determine signal outcomes inthe context of gene regulatory networks [54]. Within gene regulatory networks miRNAs can have
11

Figure 2: microRNA biogenesis and mode of action. The miRNA gene is transcribed by Pol II to generatea pri-miRNA. The pri-miRNA folds into a hair-pin structure, which is processed by the Drosha-Pashamicroprocessor complex, and results in a pre-miRNA of around 60-70 nt. The pre-miRNA is exported tothe cytoplasm by Exportin 5 and further processed by Dicer-1 and Loquacious to form the miRNA-miRNAduplex. The duplex is separated and one strand is selected as the mature miRNA, while the other strand isdegraded. The mature miRNA strand is loaded into the miRISC complex and binds with its �seed sequence�to the complementary seed match sites within the 3´ UTR of mRNAs, resulting in translational inhibitionand/or mRNA degradation. Adapted from [117].
12

quite di�erent roles, from using to throw a developmental switch to bu�ering the consequences ofnoise in order to confer robustness [87].Signaling pathways are ideal candidates for miRNA-mediated regulation owing to the sharpdose-sensitive activity of signaling pathways. Within these pathways miRNAs are crucial fortresholding against noise, default repression, context-dependent signaling, signal ampli�cation orsignaling pathway crosstalk [96, 54].However, uncovering the speci�c function of individual miRNAs is challenging. miRNAs arefrequently present as families of redundant genes and the degree of miRNA-mediated targetdown-regulation often tends to be quantitatively modest [96]. Therefore, a future challenge inthe speci�c context of signaling pathways is to systematically identify miRNAs that a�ect and/orare regulated by cell signaling to unravel this gentle but essential layer of gene expression control.
1.2.2.4 Computational target prediction A crucial step in understanding miRNA functionis to determine authentic miRNA targets. Computational biologists developed numerous predictionalgorithms to capture the sequence and location characteristics of miRNA binding sites [2, 190].Some of these characteristics are: (i) complementarity to the miRNA seed region, (ii) evolutionaryconservation of the binding site, (iii) free energy of the miRNA-mRNA hetero-duplex, and (iv) mRNAsequence features outside the target site [106, 190]. However, neither individual nor combinations ofthese criteria are su�cient to predict all authentic targets without a serious number of false positivesor false negatives. Since the development of the early algorithms, the importance of toleratingimperfect seed matches as well as extending the prediction to CDS became even more evident [79,190].The miRanda algorithm [22], used in this thesis, aligns a miRNA to the target 3´ UTR to identifyhighly complementary sequences. Seed pairing is weighed more strongly than pairing elsewhere, butseed G�U wobbles and mismatches are allowed. High-scoring targets are then �ltered on a secondarycriterion of heteroduplex free energy (∆G).Complementing computational predictions with expression pro�les of miRNAs and mRNA targetsalong with experimental target identi�cation is a fundamental approach to identify biological relevantmiRNA targets.
2 The steroid hormone ecdysone
Steroid hormones regulate the development, maturation, reproduction, and metabolism of highereukaryotes [12]. In vertebrates the process of maturation is primarily controlled by thyroid hormoneand sex steroids, while in insects it is regulated by the steroid hormone 20-hydroxyecdysone(ecdysone). Although relatively little is known about how vertebrate hormones control maturation,molecular and genetic studies from the early 1950`s onwards have provided a detailed understandingof the mechanisms by which ecdysone exerts its e�ects on insect development [31, 110].
2.1 Biological function of ecdysone
In Drosophila, the post-embryonic development progresses through three larval stages before thelarva enters metamorphosis and �nally emerges as an adult �y. The transitions between these stagesare triggered by pulses of ecdysone (Figure 3a). Periodic pulses of α-ecdysone are released fromthe prothoracic glands and rapidly converted in peripheral tissues to its biologically active form,20-hydroxyecdysone [165, 155]. There are two major pulses of ecdysone during metamorphosis. The�rst pulse occurs in the third instar larva triggering the initiation of (prepupal) morphogenesis. Thesecond pulse is released 10-12 hours later triggering radical reorganization in body form: (i) histolysisof larval cells and tissues and (ii) di�erentiation and morphogenesis of adult cells and tissues.
13

Figure 3: Ecdysone concentration and gene cascade during development. (a) Schematic representationof whole-body ecdysone concentrations during Drosophila development. Arrows indicate physiological andbehavioral changes that are triggered by the respective ecdysone pulse. (b) Ecdysone induced gene cascade atthe onset of metamorphosis. The expression of genes is shown in bars with di�erent shades of gray representingdi�erent gene categories (see inset), and the length of the bars indicate the approximate duration of theirexpression. Positive and inhibitory interactions are shown. Ecdysone peaks are shown in dotted boxes at thetop. L1/L2/L3, �rst/second/ third instar; PP, prepupa; E74A, Eip74EF; E75B, Eip75B; DHR4, Hr4; DHR3,Hr46. Adapted from [155].
14

The cellular processes controlled by ecdysone include cell death, cell proliferation, cell di�erentiation,tissue morphogenesis, metabolic and growth control, as well as changes in behavior and reproductivestatus [12, 155]. All these processes need to be adjusted in a cell and tissue speci�c manner multipletimes during metamorphosis, implicating di�erent levels of regulation. Consequently, a key questionin the �eld is how a single hormone can have such a broad range of e�ects and how this diversityis regulated. The answer to these questions lies in the speci�c spatial (cell type) and temporal(developmental stage) regulation of ecdysone signaling.
2.2 Pathway components and its spatio-temporal regulation
Initial evidence for the ecdysone pathway was elucidated from an ex vivo culture system that usedecdysone regulated pu�ng patterns in salivary gland polytene chromosomes to reveal the underlinggene expression hierarchy [8]. Chromosome pu�s are DNA regions of active transcription, at whichecdysone signaling leads to recruitment of histone methyltransferases that methylate lysine 4 ofhistone 3, thereby loosening the nucleosomes in that area [175]. Four classes of pu�s have beendescribed: (i) intermolt pu�s, which are active at the beginning of the response and thereafterregress, (ii) early pu�s, which are induced within minutes, (iii) early-late pu�s, appearing with adelay of two hours, and (iv) late pu�s, which appear from three hours onwards [8]. This earlyconceptual framework is referred to as the Ashburner model. Ashburner postulated that the earlypu�s are direct targets of the ecdysone-bound receptor and that the corresponding early genes encoderegulatory proteins that induce the late pu�s. Ever since, decades of research have elucidated themolecular and regulatory mechanisms how these early (or primary) regulatory proteins coordinatethe expression of late (or secondary) response genes, which ultimately direct the developmentalchanges.
Ecdysone receptor and DNA binding Ecdysone binds to a heterodimer of two nuclearreceptors, the ecdysone receptor (EcR) and ultraspiracle (USP), which are orthologous ofthe vertebrate farnesoid X receptor (FXR) or liver X receptor (LXR), and RXR receptors,respectively [113, 110]. EcR comprises the ecdysone binding domain but is dependent on USPto facilitate its DNA- and ligand-binding activities [92]. EcR exists in three protein isoforms (A,B1 and B2), which arise through alternative promoter usage and di�erential splicing resulting indi�erent amino-terminal domains but common DNA- and ligand-binding domains [113, 189]. EcRisoforms are expressed in a tissue- and stage-speci�c manner [110]. At the onset of metamorphosisisoform B1 dominates in larval tissues that will die during metamorphosis, while A dominates in theimaginal discs that undergo di�erentiation [189]. Isoform B2 might play a major role in the larvalfat body and epidermis [38].The EcR/USP heterodimer binds to speci�c promoter sequences called ecdysone response elements(EcREs) and interacts with transcriptional cofactors to regulate expression of ecdysone responsivegenes. Recent research has elucidated the identity and mechanisms of several cofactors, such aschromatin remodelers, histone modi�ers, histone chaperones and insulator-binding factors [13, 65,11, 207, 109, 62, 169]. The selection of speci�c cofactors depends on DNA sequence or cellularcontext. Importantly, EcR/USP can function as repressors in the absence of ecdysone by recruitingco-repressor complexes. Upon ecdysone binding these repressors are displaced by recruited co-activators, resulting in the activation of a characteristic set of early target genes [66].
Ecdysone target genes At the larval-to-prepupal transition, the �rst pulse of ecdysone inducesa small group of �early genes� including its own receptor (EcR) and the transcription factorsBroad-Complex (Br), Eip74 and Eip75 (Figure 3b). The genomic loci encoding the �earlygenes� are extraordinary large (>60kb) and complex, with multiple overlapping transcriptionunits driven by multiple nested ecdysone-inducible promoters, which respond to distinct ecdysone
15
concentrations [104, 93]. Br plays a pivotal role in the initiation and progression throughmetamorphosis and represents the most complex locus, which through di�erential initiation andsplicing gives rise to 14 transcript isoforms. These isoforms are expressed in tissue and stage speci�cmanner during metamorphosis and can be classi�ed into four protein isoforms, distinguished by theirzinc �nger module (Z1 to Z4) [148].All �early genes� are key regulators of the ecdysone cascade and induce the expression of a secondseries of genes such as Hr4 and Hr46, which shut o� some �early genes� and activate �late genes�. Thelatter are �e�ector genes�, since they directly execute the developmental changes during larval-to-prepupal and prepupal-to-pupal transition. The second pulse of ecdysone during pupal developmentuses the same hierarchy of regulatory early genes but triggers a distinct set of late �e�ector genes�in order to remodel the body plan by regulating processes including cell death, cell proliferation, celldi�erentiation, energy metabolism and tissue morphogenesis [104, 93, 155].
In summary, at the core of ecdysone signaling lies the interaction of the ecdysone hormone with aheterodimer of EcR/USP to induce a cascade of primary (regulatory) and secondary (e�ector) genes.The �nal biological outcome depends on the speci�c spatio-temporal expression of ecdysone signalingcomponents (Figure 4). The elaborate regulation of this spatio-temporal patterning involves multiplemechanisms including ecdysone concentration, the combination of speci�c protein isoforms andcofactors as well as other signaling pathways [104, 189, 155]. Signaling pathways such as insulin,TGFβ, or JAK/STAT interact with the ecdysone pathway components to further �ne-tune thecell-type speci�c outcome [118].Although multiple critical components of the tissue and stage speci�c regulation are identi�ed, aglobal and detailed kinetic description of the underling regulatory network and its network motifs ismissing. In regard to general mechanism of gene regulation, the control of transcription might notbe su�cient to dynamically �ne-tune ecdysone signaling and it is therefore likely complemented bypost-transcriptional mechanisms, such as speci�c expression of miRNAs or RBPs (Figure 4).
2.3 Ecdysone regulated miRNAs
Multiple studies suggest a crucial role for miRNAs in the coordination of developmental transitionsin insects [17, 177, 35]. Although changes in miRNA expression patterns coincide with the pulsesof ecdysone, the direct relationship between ecdysone signaling as key trigger of all developmentaltransitions and miRNAs is largely unknown.To date only a few miRNAs have an established role in ecdysone signaling or have even beenidenti�ed as direct targets of EcR and Br (miRNAs of the let-7 locus, miR-14, and miR-8) [177,193, 37, 100]. The miRNAs of the let-7 locus (let-7, miR-100 and miR-125) are thought to controldevelopmental transitions [176, 177, 37]. miR-14 and its validated target EcR compose an auto-regulatory negative feedback loop [193]. miR-8 promotes insulin signaling and body growth and wasshown to be transcriptionally repressed by ecdysone's early response genes, providing a link betweenthe antagonistic signaling of insulin and ecdysone [95, 100].Comprehensive insights into how ecdysone signaling is a�ected by and/or implements miRNAs asprimary or secondary response genes are still missing. However, such knowledge would complementthe transcriptional regulation of ecdysone signaling with one mechanism of post-transcriptionalregulation.
16

Figure 4: Spatio-temporal patterning of ecdysone signaling. Schematic representation of the ecdysonesignaling cascade and a�ected cellular processes. Components within the boxed area (green) underlie tissueand time speci�c expression, including EcR isoforms, cofactors, target genes, miRNAs and RBPs. Structureof the EcR/USP heterodimer ligand-binding domain (Heliothis virescens) is taken from [89]. Ecdysone isshown in black within the ligand-binding pocket of the EcR.
3 Dynamic Transcriptome Analysis (DTA)
The cellular RNA abundance level is the consequence of two opposing mechanisms, namely nuclearsynthesis and cytoplasmic decay. These individual contributions keep mRNA levels in a dynamicequilibrium and are highly responsive to environmental perturbations.
Until recently, RNA synthesis was measured by genomic run-on (GRO) [63], which required sarkosyltreatment, and decay was analyzed upon chemical blocking of transcription, e.g. by actinomycin-Dtreatment [170]. However, these methods are rather cell invasive and induce a cellular stress response,which on its own a�ects RNA stability [181]. Therefore, most gene expression studies are carried outusing total cellular abundance RNA, accepting serious limitations: (i) the RNA abundance level hasto be used as an approximation for changes in synthesis and (ii) the contribution of RNA degradationhas to be neglected.
Metabolic RNA 4-thiouridine (4sU) labeling overcomes these limitations and determines changesin RNA synthesis and decay, as well as their impact on total cellular abundance level in a non-invasive manner within a single experiment. It has been known for several decades that exogenousthiol-containing nucleosides, such as 4sU, can be introduced into the eukaryotic nucleoside salvagepathway [142]. By introducing 4sU into this pathway, it is possible to label and selectively isolatenewly synthesized (nascent) RNA since eukaryotic RNAs normally do not contain thiol-groups.
17

Figure 5: Schematic representation of metabolic 4sU RNA labeling. Eukaryotic cells take up 4sU from theculture medium in a concentration dependent manner and incorporate 4sU into nascent RNA, generating apool of labeled RNA and pre-existing, unlabeled RNA. After cell lysis thiol-labeled nascent RNA is taggedwith biotin and isolated by puri�cation with streptavidin-coated magnetic beads. Adapted from [144].
4sU labeling is applicable to a large variety of cell types (in vitro) and organisms (in vivo) [105, 145,51, 196, 138, 186, 67]. The experimental in vitro setup simply requires culturing cells in the presenceof 4sU, which is taken up by eukaryotic cells in a concentration dependent manner, generating apool of labeled RNA (Figure 5). After cell lysis, the thiol-labeled nascent RNA can be isolated bythiol-speci�c biotinylation and streptavidin puri�cation [43]. If needed, the pre-existing (presentprior to 4sU labeling) RNA can be recovered from the sample. Therefore, metabolic RNA labelingyields three types of RNA fractions: total cellular RNA, pre-existing unlabeled RNA and nascentlabeled RNA. The quanti�cation of these fractions can be accomplished by any gene expressionpro�ling method.4sU labeling has been shown to monitor gene expression dynamics with higher sensitivity and greatertemporal resolution compared to conventional transcriptomics [51, 196, 144, 160, 186]. Moreover,labeling has minimal adverse side e�ects on gene expression, RNA decay, mRNA translation, proteinstability, and cell viability [44, 105, 51, 144]. 4sU labeling was complemented with a customizednovel statistical approach to estimate mRNA synthesis and decay rates on a genome-wide scale,assuming exponential decay (Dynamic Transcriptome Analysis, DTA) [172].4sU labeling/DTA measures transcription with unprecedented sensitivity and temporal resolutionand permits to dissect the contributions of RNA synthesis and decay to gene expression level.
18

4 Aims and scope of this thesis
The elaborate regulation of gene expression occurs at multiple steps from DNA to RNA to proteinand is highly responsive to environmental perturbations. Although, regulation of transcription is thedominant step, rates of mRNA degradation and translation are regulated between genes as well [200,160, 174, 128]. A quantitative and global description of how transcriptional and post-transcriptionalregulation is integrated to set and adjust gene expression levels is still missing.Microarray and next-generation sequencing techniques have revolutionized the way we can addressthis fundamental question of gene expression regulation. All aspects contributing to thisregulation can be measured in a genome-wide and highly quantitative fashion, including discoveryof accessible cis-regulatory elements by DNaseI Hypersensitivity Site-Sequencing (DHS-Seq),nucleosome positioning and occupancy pro�ling by MNase-Seq, identi�cation of histone modi�cationor protein binding pro�les by ChIP-Chip/Seq as well as measurement of nascent and total abundancemRNA expression by DTA-RNA-Chip/Seq. The combination of all these experimental techniqueswith computational modeling enables investigating gene expression regulation at an unprecedentedmechanistic level.In this regard, the aims of my PhD thesis were:
1. Establishing ecdysone treatment of S2 cells as experimental paradigm for studying geneexpression regulation
2. Using DTA and microRNA pro�ling to dissect the regulation of gene expression duringecdysone signaling
3. Establishing an improved DTA-RNA-Sequencing protocol for dissecting the Drosophila corepromoter
Establishing ecdysone treatment of S2 cells as experimental paradigm for
studying gene expression regulation
To correlate diverse genome-wide data sets, it is crucial to work within a consistent and reproducibleexperimental paradigm. Ideally, the paradigm should be easily perturbed to investigate the dynamicsand plasticity of gene expression regulation.Therefore, the �rst aim of my thesis was to establish and characterize such an experimentalparadigm. Time series treatment of Drosophila Schneider 2 (S2) cells with the steroid hormoneecdysone represents a highly suitable and interesting paradigm: (i) Our S2 cell line represents ahomogenous cell population, as it is derived from a single clone (K. Förstemann). We cultivate thecells under standardized condition in synthetic cell culture medium without serum. (ii) Bindingof ecdysone to its nuclear receptor triggers a complex gene expression cascade that induces bothtransient and long-term expression changes in a wide range of functionally diverse genes, includingTFs [155]. (iii) Despite much knowledge about the transcriptional players in ecdysone signaling, acomprehensive description of the regulatory mechanism involving TF activity, chromatin dynamicsand post-transcriptional contributions has not been carried out.In my thesis, I established the time series treatment of S2 cells comprising of a frequently sampledearly interval (1-12 hours) and an extended interval up to 72 hours (Figure 6). I characterizedthe ecdysone induced phenotype using a cell analyzer, light microscopy and �ow cytometry. Icould reproducibly show that upon ecdysone treatment S2 cells cease proliferation and acquired adi�erentiated morphology, characterized by increase in cell size and granularity along with outgrowthof �lopodia (Section 7.1, Figure 6).
19

Using DTA and microRNA pro�ling to dissect the regulation of gene expression
during ecdysone signaling
The genomic response to ecdysone is one of the best studied transcriptional cascades inDrosophila [129, 18, 66, 75]. However, one common drawback of all studies is that they examinedonly RNA abundance levels. Therefore these studies su�ered from imprecise measurements oftranscription rate and were unable to discriminate whether changes in RNA abundance are dueto alterations in RNA synthesis or decay. Metabolic RNA 4sU labeling, also known as DynamicTranscriptome Analysis (DTA), was shown to be a direct readout of transcription, which allowsgenes expression pro�ling with superior sensitivity and improved temporal resolution compared toconventional transcriptomics [51, 144]. Moreover, it allows attributing changes in gene expressionto alterations in synthesis or decay rates [160, 186, 58].Therefore, the second aim of my thesis was the application of DTA to investigate the transcriptionaland post-transcriptional regulation of gene expression dynamics during the ecdysone response. Tothis end, I established 4sU labeling coupled to microarrays for S2 cells and measured nascentand total mRNA levels during the early time interval (1-12 hours) of the ecdysone response(Section 7.2, Figure 6). We demonstrate that DTA monitors the genomic response to ecdysonewith high sensitivity and great temporal resolution (Section 7.3), as well as that ecdysone inducesmajor, progressively increasing and continuous changes in gene expression (Section 7.4). Functionalannotation of ecdysone regulated genes explains the observed phenotypes very well and demonstrateshow rapid the ecdysone cascade regulates a wide range of functionally diverse genes (Section 7.5).Furthermore, we estimated relative mRNA synthesis and decay rates and present the �rst globalassessment of decay regulation by ecdysone signaling (Section 7.6). Overall, ecdysone signalingdi�erentially regulates the mRNA expression level, synthesis or decay rate of 2141 genes (Figure 6).By complementing the DTA gathered gene expression data with k-means clustering of fold changesand kinetics in nascent and total mRNA expression levels as well as decay and turnover rates, wereveal that ecdysone induces a rich and previously unknown diversity of gene expression dynamics.Speci�cally, we identi�ed twenty kinetically distinct groups of co-regulated genes, which exhibitunique combinations of e�ect type, strength and timing of changes in mRNA synthesis, decay ratesand total expression level (Section 7.8). Notably, we observed a strong coupling of mRNA synthesisand decay rates. The functional annotation of these kinetic groups shows speci�c enrichments andindicates the temporal order in which ecdysone regulates biological processes to direct the cell fromits proliferating state into the di�erentiated state (Section 7.9, Figure 6).Moreover, to investigate the role of microRNAs in the ecdysone response, I quanti�ed the expressionof 184 microRNAs (miRNAs) in ecdysone stimulated S2 cells using a single-molecule countingtechnique (Section 7.11). Upon ecdysone treatment, we observed a rapid repression of some miRNAsand a progressive induction of other miRNAs (Figure 6). In addition to the known ecdysoneresponsive miRNAs, we identi�ed 26 miRNAs that have no established function in ecdysone signalingor in the biological processes regulated by ecdysone in S2 cells. Therefore, our dataset representsan excellent resource for studying the function of these miRNAs in ecdysone signaling, cell cycle,metabolism or di�erentiation/morphogenesis. Finally, based on mRNA decay rates we establisheda novel approach for miRNA-mRNA network analysis to facilitate miRNA target identi�cation(Sections 7.13) and gain �rst insights into the miRNA-mRNA network during the ecdysone response(Section 7.14, Figure 6).Overall, our time series DTA analysis captures the complex gene expression dynamics of the ecdysoneresponse and presents valuable insights into its elaborate transcriptional and post-transcriptionalregulation.
20
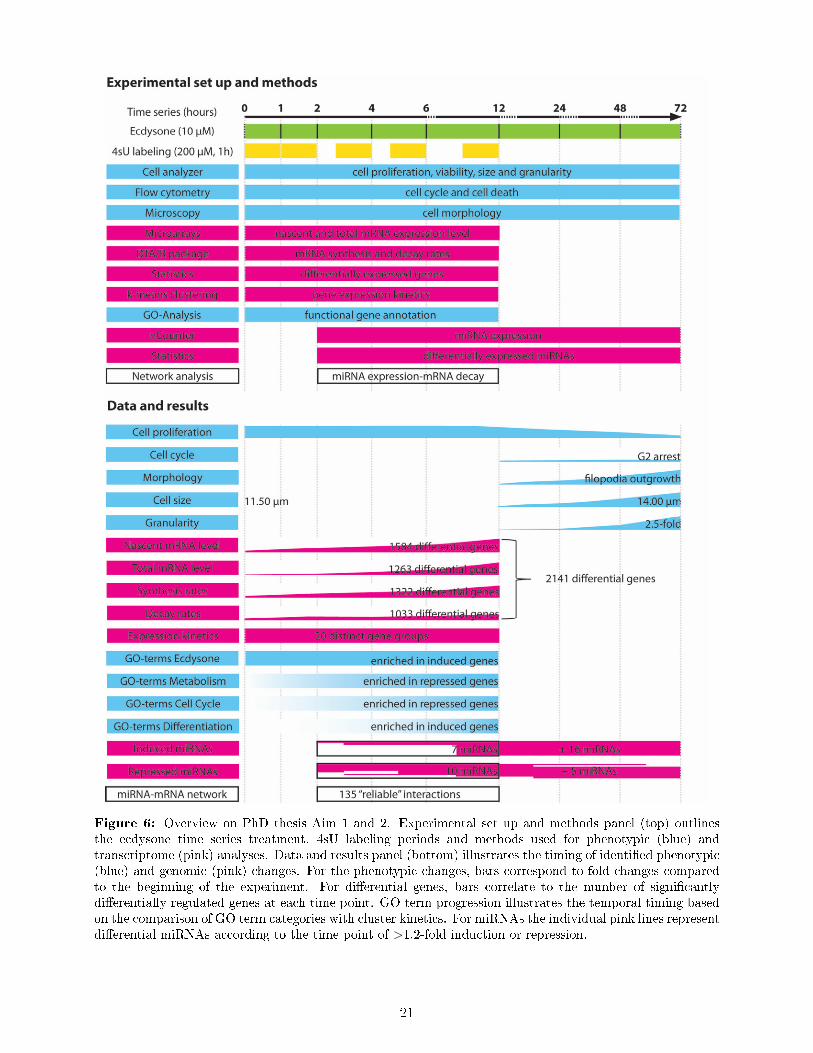
Figure 6: Overview on PhD thesis Aim 1 and 2. Experimental set up and methods panel (top) outlinesthe ecdysone time series treatment, 4sU labeling periods and methods used for phenotypic (blue) andtranscriptome (pink) analyses. Data and results panel (bottom) illustrates the timing of identi�ed phenotypic(blue) and genomic (pink) changes. For the phenotypic changes, bars correspond to fold changes comparedto the beginning of the experiment. For di�erential genes, bars correlate to the number of signi�cantlydi�erentially regulated genes at each time point. GO term progression illustrates the temporal timing basedon the comparison of GO term categories with cluster kinetics. For miRNAs the individual pink lines representdi�erential miRNAs according to the time point of >1.2-fold induction or repression.
21

Establishing an improved DTA-RNA-Sequencing protocol for dissecting the
Drosophila core promoter
In an independent, collaborative project we used DTA to achieve a better quantitative understandingof gene expression as it is regulated by the core promoter, namely its sequence features and structuralproperties (Section 10). Since some of the features might operate in an activity dependent manner,we trigged di�erent transcriptional programs, using ecdysone as developmental stimulus, insulinas metabolic stimulus and heat shock to induce a stress response. My main contribution to theproject was the measurement of transcript steady state and nascent transcription rates using DTA-RNA-Sequencing (Section 10.3). To this end, I �rst adapted the DTA microarray protocol to next-generation sequencing and established a novel procedure for data normalization using arti�cial Spike-In transcripts (Section 10.1), as well as a novel strategy for rRNA depletion during sequencing librarypreparation employing rRNA speci�c oligos (Section 10.2).
In summary, my thesis made an important contribution to the laboratory's research interest in generegulation. The established and characterized ecdysone paradigm will serve as a working modelfor diverse gene regulatory questions including the dynamic regulation of cis-regulatory elementsand their TFs, as well as chromatin dynamics involving nucleosome positioning and chromatinmodi�cations. Moreover, using this paradigm I generated highly quantitative genome-wide datasets on mRNA and miRNA expression dynamics during the ecdysone response. Our analysisprovides novel insights into how cells coordinate distinct patterns of gene expression in order toadjust the transcriptome to environmental perturbations. These data furnish the laboratory with acomprehensive resource for further experimental and computational projects.
22
Part II
Material and Methods
5 Material
5.1 Cell line and culture
Name Speci�cation Source (Catalog #)Drosophila Schneider 2 (S2) cells single clone derived from late
D. melanogaster embryosK. Förstemann
Express Five® SFM protein-free, serum-free Gibco (10486-025)L-Glutamine 200 mM, add 90 ml per 1000 ml
mediumGibco (25030-081)
20-Hydroxyecdysone 10 mM stock in ethanol, store -20°C Sigma-Aldrich (H5142)Insulin 2 mM stock in water, store -20°C Roche (11376497001)
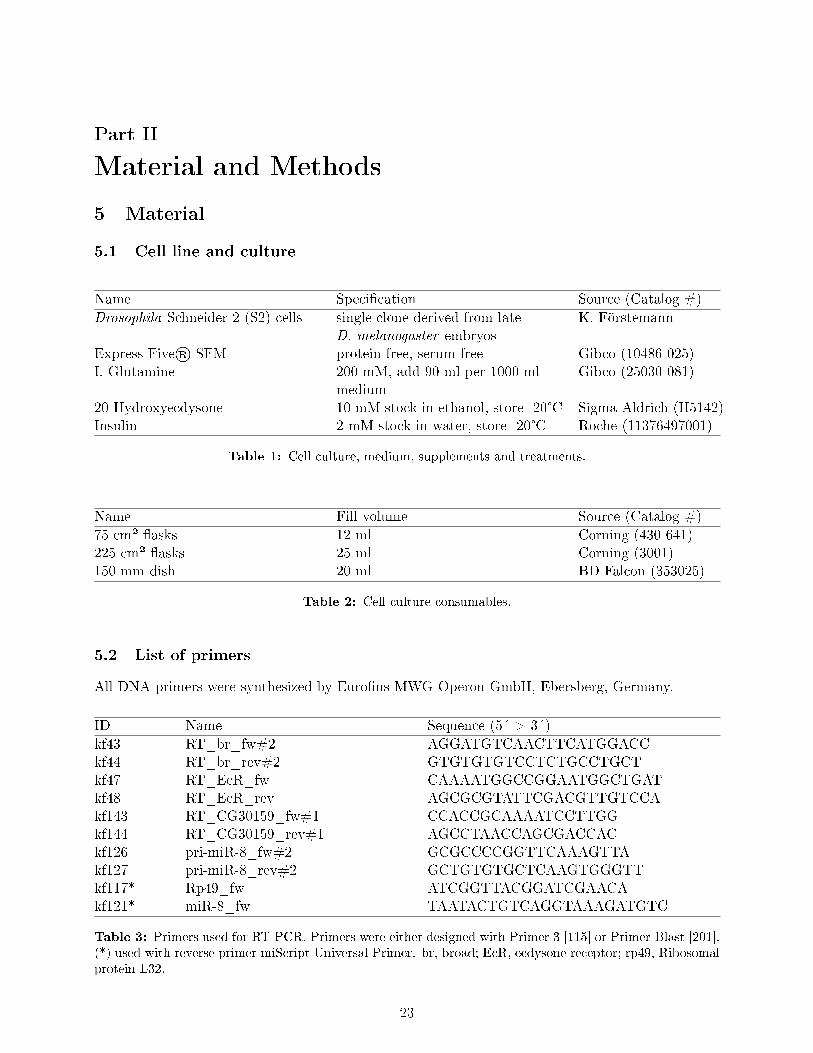
Table 1: Cell culture, medium, supplements and treatments.
Name Fill volume Source (Catalog #)75 cm² �asks 12 ml Corning (430 641)225 cm² �asks 25 ml Corning (3001)150 mm dish 20 ml BD Falcon (353025)
Table 2: Cell culture consumables.
5.2 List of primers
All DNA primers were synthesized by Euro�ns MWG Operon GmbH, Ebersberg, Germany.
ID Name Sequence (5´ > 3´)kf43 RT_br_fw#2 AGGATGTCAACTTCATGGACCkf44 RT_br_rev#2 GTGTGTGTCCTCTGCCTGCTkf47 RT_EcR_fw CAAAATGGCCGGAATGGCTGATkf48 RT_EcR_rev AGCGCGTATTCGACGTTGTCCAkf143 RT_CG30159_fw#1 CCACCGCAAAATCCTTGGkf144 RT_CG30159_rev#1 AGCCTAACCAGCGACCACkf126 pri-miR-8_fw#2 GCGCCCCGGTTCAAAGTTAkf127 pri-miR-8_rev#2 GCTGTGTGCTCAAGTGGGTTkf117* Rp49_fw ATCGGTTACGGATCGAACAkf121* miR-8_fw TAATACTGTCAGGTAAAGATGTC
Table 3: Primers used for RT-PCR. Primers were either designed with Primer 3 [115] or Primer-Blast [201].(*) used with reverse primer miScript Universal Primer. br, broad; EcR, ecdysone receptor; rp49, Ribosomalprotein L32.
23
ID Name Sequence (5´ > 3´) Annealing261 spike#2_fw3 TAATACGACTCACTATAGGGTGCTTTAACAAGAG
GAAATTGTGT53°C
262 spike#2_rev3 CCATCTTGTTTATAAAATCCTAATTACTC 53°C278 spike#12_fw2 TAATACGACTCACTATAGGGGGCACAAGTTGCTG
AAGTTGC58°C
279 spike#12_rev2 TCTGCTGTAATCTCAGCTCC 58°C263 spike#4_fw3 TAATACGACTCACTATAGGGTTTCGACGTTTTGA
AGGAGGG53°C
264 spike#4_rev3 GTACCCGGGAAAATCCTAGTTC 53°C265 spike#5_fw3 TAATACGACTCACTATAGGGACTGTCCTTTCATC
CATAAGCGG55°C
266 spike#5_rev3 CGCACGCCGAATGATGAAACG 55°C267 spike#8_fw3 TAATACGACTCACTATAGGGGATGTCCTTGGACG
GGGT55°C
268 spike#8_rev3 GCTTTCGGAGCAAATCGCG 55°C269 spike#9_fw3 TAATACGACTCACTATAGGGCCAGATTACTTCCA
TTTCCGCC55°C
270 spike#9_rev3 GGGTAAAACGCAAGCACCG 55°C
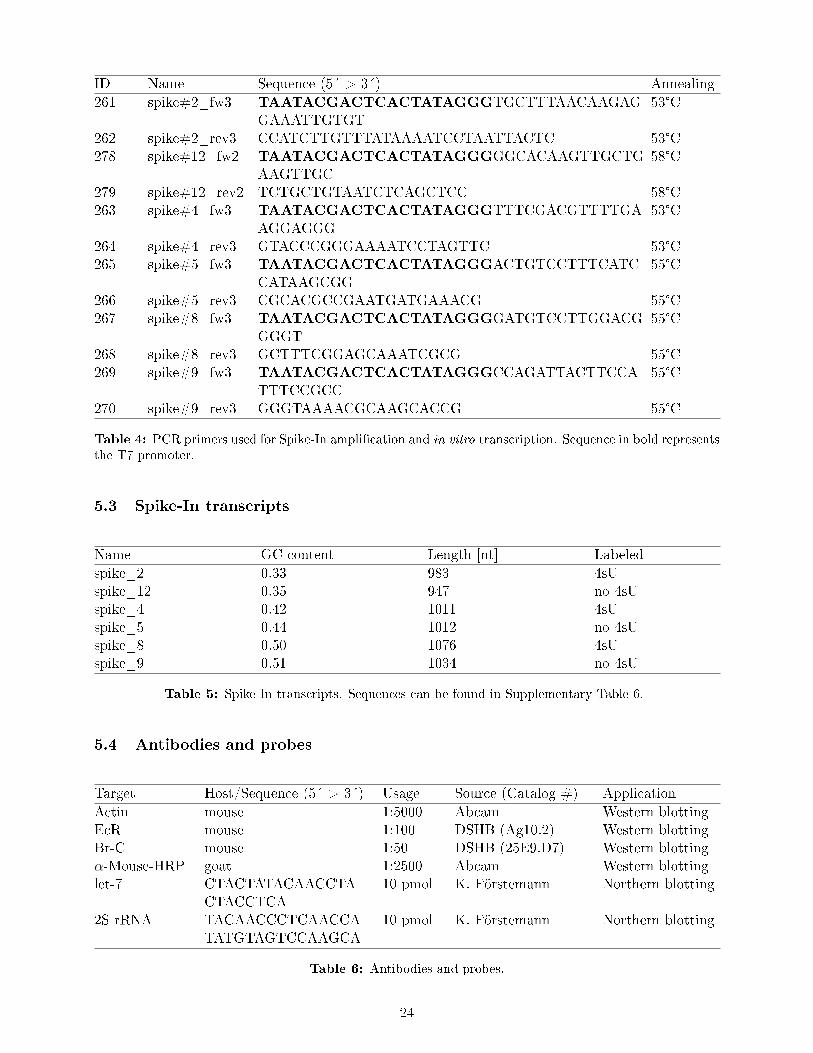
Table 4: PCR primers used for Spike-In ampli�cation and in vitro transcription. Sequence in bold representsthe T7 promoter.
5.3 Spike-In transcripts
Name GC content Length [nt] Labeledspike_2 0.33 983 4sUspike_12 0.35 947 no 4sUspike_4 0.42 1011 4sUspike_5 0.44 1012 no 4sUspike_8 0.50 1076 4sUspike_9 0.51 1034 no 4sU
Table 5: Spike-In transcripts. Sequences can be found in Supplementary Table 6.
5.4 Antibodies and probes
Target Host/Sequence (5´ > 3´) Usage Source (Catalog #) ApplicationActin mouse 1:5000 Abcam Western blottingEcR mouse 1:100 DSHB (Ag10.2) Western blottingBr-C mouse 1:50 DSHB (25E9.D7) Western blottingα-Mouse-HRP goat 1:2500 Abcam Western blottinglet-7 CTACTATACAACCTA
CTACCTCA10 pmol K. Förstemann Northern blotting
2S rRNA TACAACCCTCAACCATATGTAGTCCAAGCA
10 pmol K. Förstemann Northern blotting
Table 6: Antibodies and probes.
24

5.5 Bu�ers and solutions
Name Composition ApplicationcOmplete Lysis-MEDTA-free
Commercial bu�er, Roche (4719964001) Cell lysis
Roti-Load 1 Commercial bu�er, Roth (K929.1) SDS-PAGERunning bu�er 30.3 g Tris, 144.1 g glycine, 10 g SDS in
1000 ml ddH2OSDS-PAGE
10x WB transfer bu�er 14.5 g Tris, 72 g glycine in 1000 ml ddH2O Western blotting1x WB transfer bu�er 100 ml 10x WB transfer bu�er, 200 ml
methanol, 3 ml SDS 10%, 700 ml ddH2OWestern blotting
WB blocking bu�er 5% (w/v) milk powder in 1x PBS-T Western blotting1x PBS 2 mM KH2PO4, 4 mM Na2HPO4, 140 mM
NaCl, 3 mM KCl, pH 7.4 (25°C)Western blotting
1x PBS-T (0.1%) 100 ml PBS 10x, 1 ml Tween 20, 900 ml ddH2O Western blottingBiotinylation bu�er 100 mM Tris pH 7.4, 10 mM EDTA DTA-protocolWash bu�er 100 mM Tris pH 7.5, 10 mM EDTA, 1 M NaCl,
0.1% Tween 20DTA-protocol
Table 7: Bu�ers and solutions.
5.6 Metabolic RNA labeling and RNA isolation
Name Description Source (Catalog #)4-thiouridine 50 mM stock in PBS, store -20°C,
thaw only onceSigma-Aldrich (T4509)
peqGOLD TriFast store at 4°C Peqlab (30-2030)15 ml PP-Tubes tolerate up to 15000 g Greiner Bio-One (188261)EZ-Link HPDP-Biotin 1 mg/ml stock in DMF Pierce (21341)Screw cap micro tubes 1.5 and 2.0 ml Sarstedt (72.692.005,
72.694.005)Phase Lock Gel Heavy Tubes 2 ml 5 Prime (2900309)Magnetic Stand Miltenyi (130-042-303)µMacs Streptavidin Kit Miltenyi (130-074-101)1,4-Dithio-DL-threitol (DTT) 1 M stock in RNase-free water,
store -20°CSigma-Aldrich (43815-1G)
TURBO DNA-free Kit Ambion (1907)RNeasy MinElute Qiagen (74204)Agencourt RNAClean XP Beads Beckman Coulter (A63987)Round bottom 96 well plate Greiner Bio-One (651161)96 well magnetic stand Ambion (AM10027)
Table 8: Consumables for metabolic RNA labeling.
25
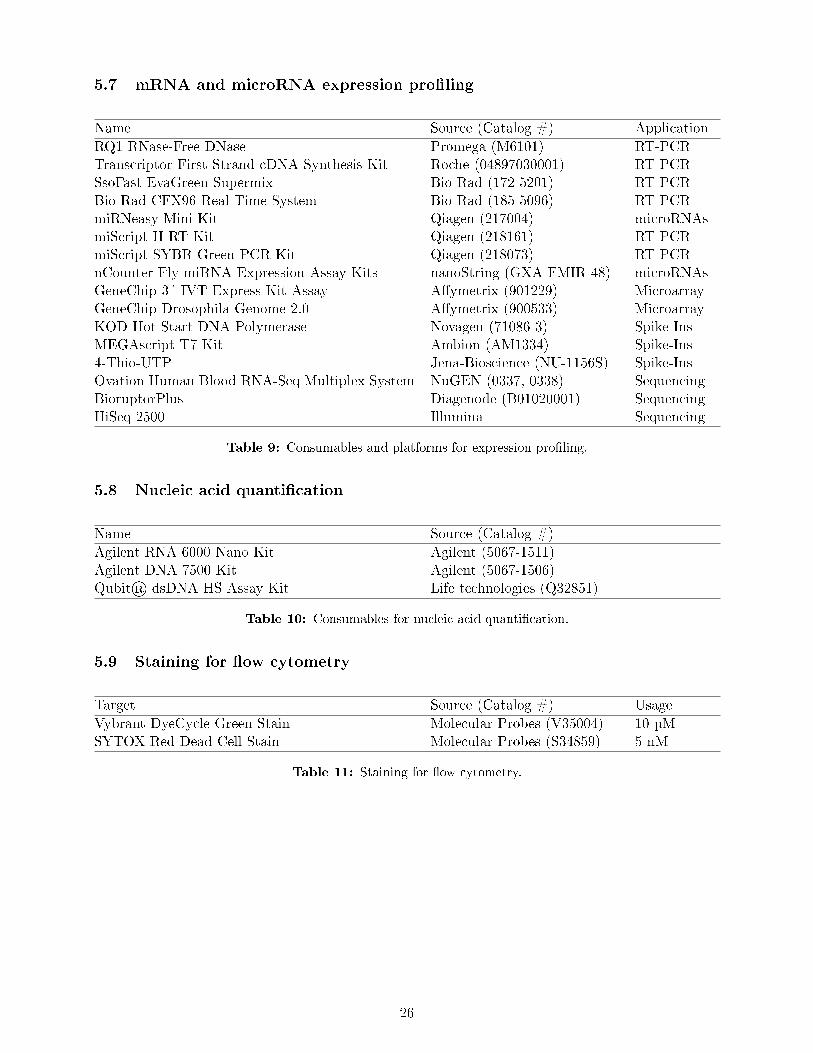
5.7 mRNA and microRNA expression pro�ling
Name Source (Catalog #) ApplicationRQ1 RNase-Free DNase Promega (M6101) RT-PCRTranscriptor First Strand cDNA Synthesis Kit Roche (04897030001) RT-PCRSsoFast EvaGreen Supermix Bio-Rad (172-5201) RT-PCRBio-Rad CFX96 Real-Time System Bio-Rad (185-5096) RT-PCRmiRNeasy Mini Kit Qiagen (217004) microRNAsmiScript II RT Kit Qiagen (218161) RT-PCRmiScript SYBR Green PCR Kit Qiagen (218073) RT-PCRnCounter Fly miRNA Expression Assay Kits nanoString (GXA-FMIR-48) microRNAsGeneChip 3´ IVT Express Kit Assay A�ymetrix (901229) MicroarrayGeneChip Drosophila Genome 2.0 A�ymetrix (900533) MicroarrayKOD Hot Start DNA Polymerase Novagen (71086-3) Spike-InsMEGAscript T7 Kit Ambion (AM1334) Spike-Ins4-Thio-UTP Jena-Bioscience (NU-1156S) Spike-InsOvation Human Blood RNA-Seq Multiplex System NuGEN (0337, 0338) SequencingBioruptorPlus Diagenode (B01020001) SequencingHiSeq 2500 Illumina Sequencing
Table 9: Consumables and platforms for expression pro�ling.
5.8 Nucleic acid quanti�cation
Name Source (Catalog #)Agilent RNA 6000 Nano Kit Agilent (5067-1511)Agilent DNA 7500 Kit Agilent (5067-1506)Qubit® dsDNA HS Assay Kit Life technologies (Q32851)
Table 10: Consumables for nucleic acid quanti�cation.
5.9 Staining for �ow cytometry
Target Source (Catalog #) UsageVybrant DyeCycle Green Stain Molecular Probes (V35004) 10 µMSYTOX Red Dead Cell Stain Molecular Probes (S34859) 5 nM
Table 11: Staining for �ow cytometry.
26
6 Experimental methods
6.1 Cell based methods
6.1.1 Cell culture conditions
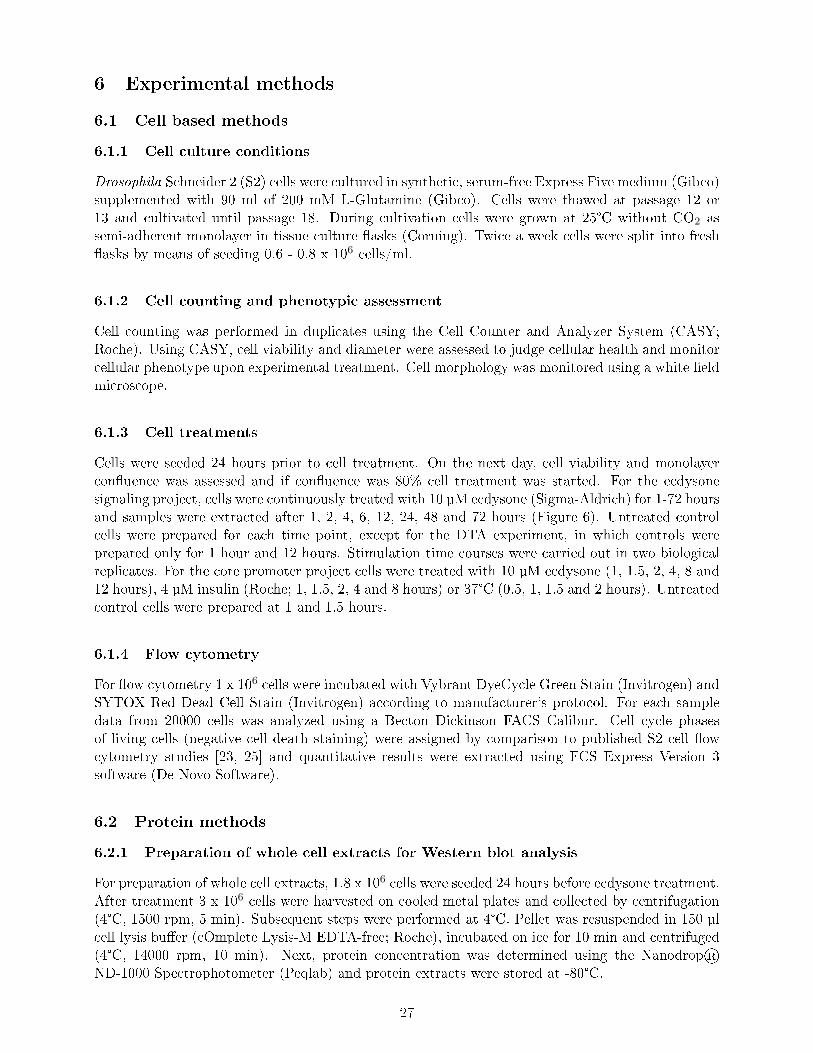
Drosophila Schneider 2 (S2) cells were cultured in synthetic, serum-free Express Five medium (Gibco)supplemented with 90 ml of 200 mM L-Glutamine (Gibco). Cells were thawed at passage 12 or13 and cultivated until passage 18. During cultivation cells were grown at 25°C without CO2 assemi-adherent monolayer in tissue culture �asks (Corning). Twice a week cells were split into fresh�asks by means of seeding 0.6 - 0.8 x 10⁶ cells/ml.
6.1.2 Cell counting and phenotypic assessment
Cell counting was performed in duplicates using the Cell Counter and Analyzer System (CASY;Roche). Using CASY, cell viability and diameter were assessed to judge cellular health and monitorcellular phenotype upon experimental treatment. Cell morphology was monitored using a white �eldmicroscope.
6.1.3 Cell treatments
Cells were seeded 24 hours prior to cell treatment. On the next day, cell viability and monolayercon�uence was assessed and if con�uence was 80% cell treatment was started. For the ecdysonesignaling project, cells were continuously treated with 10 µM ecdysone (Sigma-Aldrich) for 1-72 hoursand samples were extracted after 1, 2, 4, 6, 12, 24, 48 and 72 hours (Figure 6). Untreated controlcells were prepared for each time point, except for the DTA experiment, in which controls wereprepared only for 1 hour and 12 hours. Stimulation time courses were carried out in two biologicalreplicates. For the core promoter project cells were treated with 10 µM ecdysone (1, 1.5, 2, 4, 8 and12 hours), 4 µM insulin (Roche; 1, 1.5, 2, 4 and 8 hours) or 37°C (0.5, 1, 1.5 and 2 hours). Untreatedcontrol cells were prepared at 1 and 1.5 hours.
6.1.4 Flow cytometry
For �ow cytometry 1 x 10⁶ cells were incubated with Vybrant DyeCycle Green Stain (Invitrogen) andSYTOX Red Dead Cell Stain (Invitrogen) according to manufacturer's protocol. For each sampledata from 20000 cells was analyzed using a Becton Dickinson FACS Calibur. Cell cycle phasesof living cells (negative cell death staining) were assigned by comparison to published S2 cell �owcytometry studies [23, 25] and quantitative results were extracted using FCS Express Version 3software (De Novo Software).
6.2 Protein methods
6.2.1 Preparation of whole cell extracts for Western blot analysis
For preparation of whole cell extracts, 1.8 x 10⁶ cells were seeded 24 hours before ecdysone treatment.After treatment 3 x 10⁶ cells were harvested on cooled metal plates and collected by centrifugation(4°C, 1500 rpm, 5 min). Subsequent steps were performed at 4°C. Pellet was resuspended in 150 µlcell lysis bu�er (cOmplete Lysis-M EDTA-free; Roche), incubated on ice for 10 min and centrifuged(4°C, 14000 rpm, 10 min). Next, protein concentration was determined using the Nanodrop®ND-1000 Spectrophotometer (Peqlab) and protein extracts were stored at -80°C.
27
6.2.2 SDS-Polyacrylamide gel electrophoresis (SDS-PAGE)
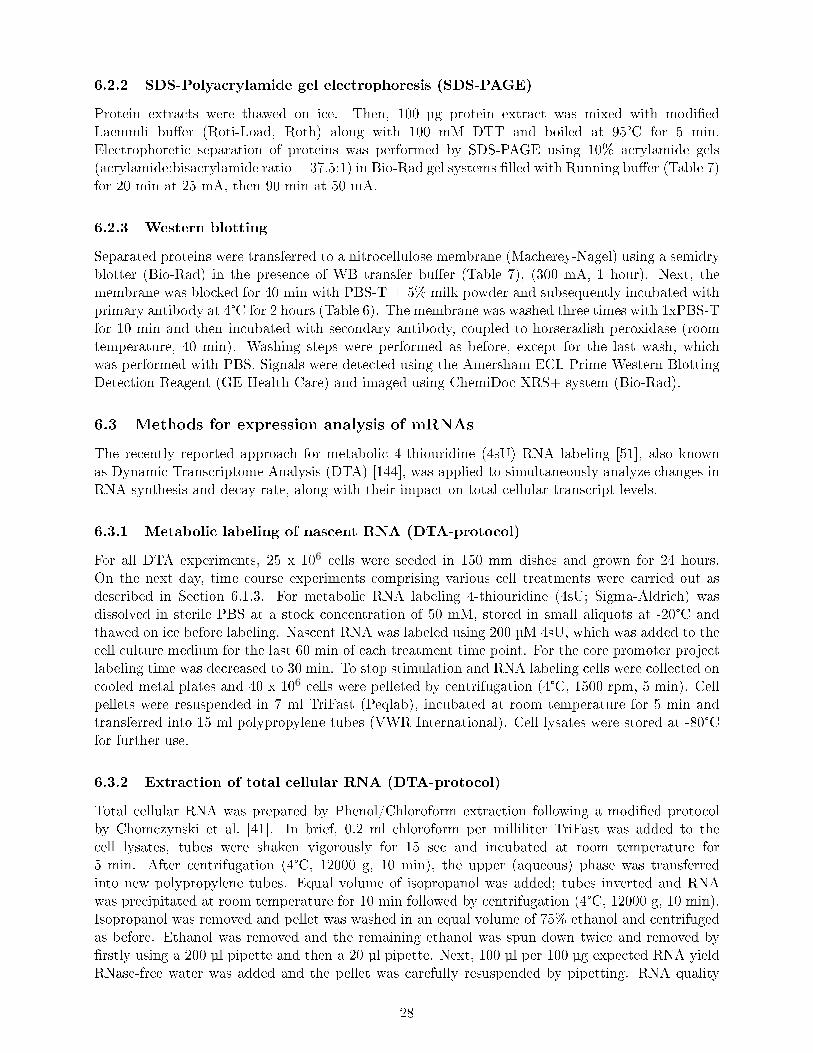
Protein extracts were thawed on ice. Then, 100 µg protein extract was mixed with modi�edLaemmli bu�er (Roti-Load, Roth) along with 100 mM DTT and boiled at 95°C for 5 min.Electrophoretic separation of proteins was performed by SDS-PAGE using 10% acrylamide gels(acrylamide:bisacrylamide ratio = 37.5:1) in Bio-Rad gel systems �lled with Running bu�er (Table 7)for 20 min at 25 mA, then 90 min at 50 mA.
6.2.3 Western blotting
Separated proteins were transferred to a nitrocellulose membrane (Macherey-Nagel) using a semidryblotter (Bio-Rad) in the presence of WB transfer bu�er (Table 7), (300 mA, 1 hour). Next, themembrane was blocked for 40 min with PBS-T + 5% milk powder and subsequently incubated withprimary antibody at 4°C for 2 hours (Table 6). The membrane was washed three times with 1xPBS-Tfor 10 min and then incubated with secondary antibody, coupled to horseradish peroxidase (roomtemperature, 40 min). Washing steps were performed as before, except for the last wash, whichwas performed with PBS. Signals were detected using the Amersham ECL Prime Western BlottingDetection Reagent (GE Health Care) and imaged using ChemiDoc XRS+ system (Bio-Rad).
6.3 Methods for expression analysis of mRNAs
The recently reported approach for metabolic 4-thiouridine (4sU) RNA labeling [51], also knownas Dynamic Transcriptome Analysis (DTA) [144], was applied to simultaneously analyze changes inRNA synthesis and decay rate, along with their impact on total cellular transcript levels.
6.3.1 Metabolic labeling of nascent RNA (DTA-protocol)
For all DTA experiments, 25 x 106 cells were seeded in 150 mm dishes and grown for 24 hours.On the next day, time course experiments comprising various cell treatments were carried out asdescribed in Section 6.1.3. For metabolic RNA labeling 4-thiouridine (4sU; Sigma-Aldrich) wasdissolved in sterile PBS at a stock concentration of 50 mM, stored in small aliquots at -20°C andthawed on ice before labeling. Nascent RNA was labeled using 200 µM 4sU, which was added to thecell culture medium for the last 60 min of each treatment time point. For the core promoter projectlabeling time was decreased to 30 min. To stop stimulation and RNA labeling cells were collected oncooled metal plates and 40 x 106 cells were pelleted by centrifugation (4°C, 1500 rpm, 5 min). Cellpellets were resuspended in 7 ml TriFast (Peqlab), incubated at room temperature for 5 min andtransferred into 15 ml polypropylene tubes (VWR International). Cell lysates were stored at -80°Cfor further use.
6.3.2 Extraction of total cellular RNA (DTA-protocol)
Total cellular RNA was prepared by Phenol/Chloroform extraction following a modi�ed protocolby Chomczynski et al. [41]. In brief, 0.2 ml chloroform per milliliter TriFast was added to thecell lysates, tubes were shaken vigorously for 15 sec and incubated at room temperature for5 min. After centrifugation (4°C, 12000 g, 10 min), the upper (aqueous) phase was transferredinto new polypropylene tubes. Equal volume of isopropanol was added; tubes inverted and RNAwas precipitated at room temperature for 10 min followed by centrifugation (4°C, 12000 g, 10 min).Isopropanol was removed and pellet was washed in an equal volume of 75% ethanol and centrifugedas before. Ethanol was removed and the remaining ethanol was spun down twice and removed by�rstly using a 200 µl pipette and then a 20 µl pipette. Next, 100 µl per 100 µg expected RNA yieldRNase-free water was added and the pellet was carefully resuspended by pipetting. RNA quality
28

was assessed on a RNA 6000 Nano Chip (Agilent). The extracted total RNA was stored at -80°Cfor further use.
6.3.3 Biotinylation of 4sU labeled, nascent RNA (DTA-protocol)
To separate total RNA (T) into 4sU labeled (nascent) RNA (L) and unlabeled (pre-existing)RNA (U), 80 µg total RNA were incubated with EZ-Link Biotin-HPDP (Pierce). Biotin wasdissolved in dimethylformamide (DMF) at a concentration of 1 mg/ml and stored in small aliquotsat 4°C. 2 µl of biotin solution were used per 1 µg total RNA, together with Biotinylation bu�er(1 µl / 1 µg RNA, Table 7) and RNase-free water (7 µl / 1 µg RNA). Biotinylation was carried outat room temperature on a rotating wheel for 2 hours, protected from light. Subsequently, unboundbiotin and DMF were removed by chloroform extraction. First, an equal volume of chloroform wasadded and samples were shaken vigorously for 15 sec, incubated for 3 min at room temperature andcentrifuged (room temperature, full speed, 5 min). Next, upper phase was transferred to 2 ml PhaseLock Gel Heavy Tubes (5 Prime) and a second extraction with 500 µl chloroform was performed.The upper phase was transferred into 1.5 ml tubes and total RNA was precipitated by addition of anequal volume of isopropanol and 1/10 volume of 5 M NaCl. RNA was pelleted by centrifugation (4°C,20000 g, 20 min). RNA pellet was washed using an equal volume of 75% ethanol and pelleted bycentrifugation (4°C, 20000 g, 10 min). Ethanol was removed immediately as described in Section 6.3.2and the pellet was resuspended in 100 µl of RNase-free water by careful pipetting. The biotin labeledRNA was stored at -80°C or immediately used for isolation of labeled (nascent) RNA.
6.3.4 Isolation of labeled (nascent) RNA (DTA-protocol)
Biotinylated, 4sU labled RNA was heated to 65°C for 10 min to minimize secondary structures,immediately placed on ice for 5 min, and then captured by incubation with 100 µl streptavidin-coatedmagnetic beads (Miltenyi Biotec) on a rotating wheel for 15 min (4°C). Meanwhile, µMAC columns(Miltenyi Biotec) were equilibrated with 900 µl room temperature Wash bu�er (Table 7). After15 min, samples were applied twice to the same µMAC column. Next, columns were �rst washed3x with 900 µl of 65°C Wash bu�er, then 3x with room temperature Wash bu�er. If the unlabeled(pre-existing) RNA had to be recovered, the �ow-through of the sample together with the �rst washwas collected and RNA was precipitated with isopropanol as described in Section 6.3.3. Finally,labeled RNA was eluted into 700 µl RLT bu�er (Qiagen) with 100 µl of 100 mM freshly preparedDTT (Table 8). A second elution step was performed 5 min later and RNA was recovered usingthe RNeasy MinElute Kit (Qiagen) according to manufacturer's cleanup protocol. RNA was elutedwith 20 µl of RNase-free water, applied twice.
For the core promoter project the protocol was further optimized by substituting the MinElute Kitby Agencourt RNAClean XP Beads (Beckman Coulter). The RNA was recovered from the DTTeluate according to manufacturer's protocol for Large Volume Reactions. 15 µl of RNase-free waterwere used for elution.
6.3.5 RNA quanti�cation and quality control
RNA concentration was measured using the Nanodrop® ND-1000 Spectrophotometer (Peqlab).Further, 1 µl of the eluted RNA was loaded on a RNA 6000 Nano Chip of the Agilent automatedelectrophoresis system to control RNA integrity and the characteristic molecular weight distributionof smallRNAs, 18S and 28S rRNA.
29

6.3.6 DNase treatment
Prior to preparing microarray or sequencing samples, DNase treatment was performed to excludeany DNA contamination in extracted total RNA. 10 µg of total RNA were subjected to TURBODNase according to the manufacturer's protocol (Ambion). Nascent RNA, which is puri�ed by its4sU label, does not contain any signi�cant DNA contamination, and therefore, no DNase treatmentis needed.
6.3.7 Dot blot
In order to establish the 4sU labeling concentration and time for S2 cells, Dot blot analysis, whichspeci�cally detects 4sU labeled, biotinylated RNA, was performed as described previously [51].Analysis was carried out in 10-fold dilutions (1 µg down to 1 ng) using a biotinylated controloligonucleotide of 81 nt length to quantify 4sU-incorporation (100 ng down to 0.1 ng).
6.3.8 Reverse transcription and real-time PCR
Real-time PCR (RT-PCR) was performed to prove the expression of a given gene in S2 cells or tomonitor the activation of genes upon cell stimulation.Gene speci�c 22-27 nt long primers were designed using the software Primer 3 (v. 0.4.0) [115]or Primer-Blast [201]. The speci�city of the corresponding primer pairs was determined using astandard curve, and only primer pairs with a speci�c melting curve were used. A list of all RT-PCRprimers used in this thesis is given in Table 3. Prior to reverse transcription, 400 ng total RNAor 100 ng nascent RNA were treated with DNase (Promega) at 37°C for 30 minutes. Reversetranscription into cDNA was carried using the First Strand cDNA Synthesis Kit (Roche) in thepresence of a 2:1 ratio of random hexamer and oligo-dT primers, respectively. Approximately 60 ngof cDNA was used to set up 10 µl PCR reactions containing 5 µl 2x SSO-fast Evagreen Supermix(Bio-Rad) and 0.3 µl of both forward and reverse primer, 20 µM each. RT-PCR was performed ona Bio-Rad CFX96 Real-Time System (Bio-Rad) using a 30 sec denaturation step at 95°C, followedby 40 cycles of 5 sec at 95°C and 5 sec at 58°C. Finally, a melting curve was generated in 0.5°Cincrements for 5 sec from 65-95°C. To exclude any genomic DNA or general contaminations a -RTcontrol (no reverse transcriptase during cDNA synthesis) and a water control (no cDNA template)were included in all RT-PCR runs. Threshold cycle (Ct) values were determined by application ofthe corresponding Bio-Rad CFX Manager software version 3.1 using the Ct determination mode�Single Threshold�. Relative expression levels were calculated applying the 2−∆∆CT method [131]with normalization of target gene expression levels to CG30159.
6.3.9 Microarray hybridization for DTA
Gene expression analysis by microarrays was carried out with 300 ng of total or nascent RNAusing the GeneChip 3´ IVT labeling assay (A�ymetrix). Samples were hybridized to the GeneChipDrosophila Genome 2.0 Array containing 18880 probe sets following the manufacturer's instructions(A�ymetrix). All GeneChips were processed in the A�ymetrix facility at the Gene Center LMUMunich, Groÿhadern.
6.3.10 Data processing, quality control, normalization and �ltering
Data were analyzed by B. Schwalb (Max Planck Institute for Biophysical Chemistry, Göttingen)using the open source R/Bioconductor software [70, 49]. Microarray processing, quality control,baseline normalization across microarrays as well as probe intensity calculation were performedusing GeneChip Robust Multiarray Averaging (GC-RMA) [198]. Probe sets were annotated basedon the A�ymetrix annotation �le Drosophila_2.na32.annot (June 10, 2011), along with manual
30
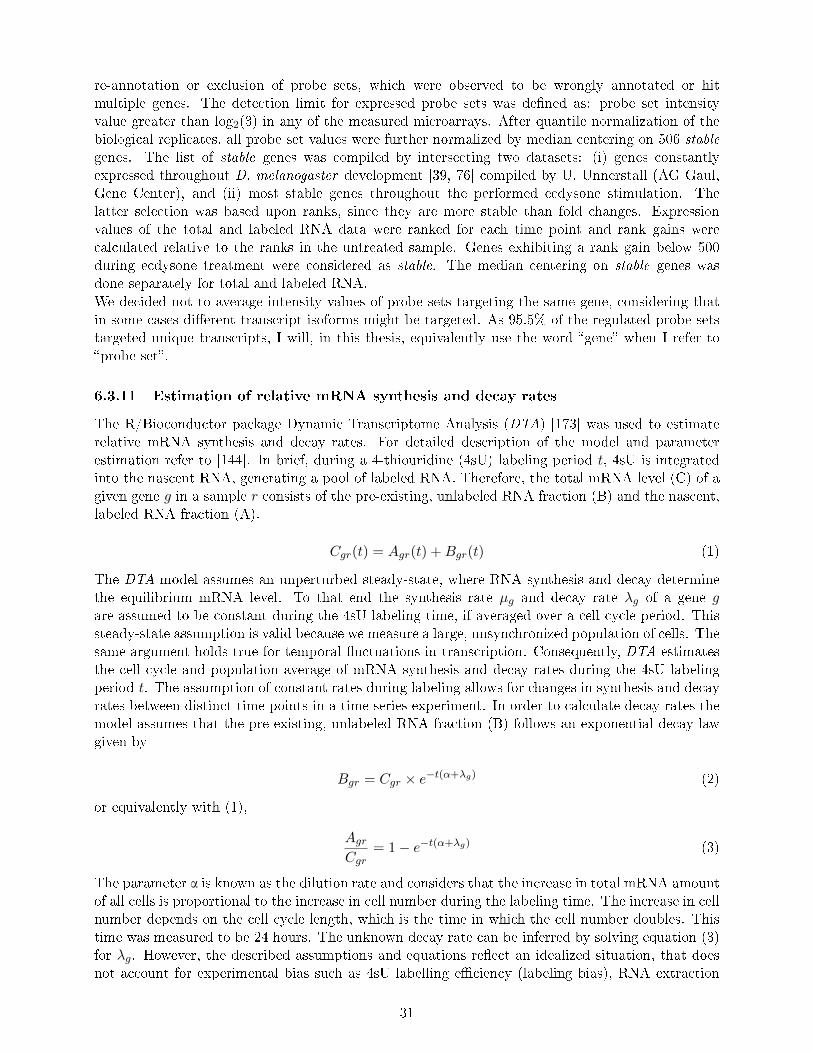
re-annotation or exclusion of probe sets, which were observed to be wrongly annotated or hitmultiple genes. The detection limit for expressed probe sets was de�ned as: probe set intensityvalue greater than log2(3) in any of the measured microarrays. After quantile normalization of thebiological replicates, all probe set values were further normalized by median centering on 506 stablegenes. The list of stable genes was compiled by intersecting two datasets: (i) genes constantlyexpressed throughout D. melanogaster development [39, 76] compiled by U. Unnerstall (AG Gaul,Gene Center), and (ii) most stable genes throughout the performed ecdysone stimulation. Thelatter selection was based upon ranks, since they are more stable than fold changes. Expressionvalues of the total and labeled RNA data were ranked for each time point and rank gains werecalculated relative to the ranks in the untreated sample. Genes exhibiting a rank gain below 500during ecdysone treatment were considered as stable. The median centering on stable genes wasdone separately for total and labeled RNA.We decided not to average intensity values of probe sets targeting the same gene, considering thatin some cases di�erent transcript isoforms might be targeted. As 95.5% of the regulated probe setstargeted unique transcripts, I will, in this thesis, equivalently use the word �gene� when I refer to�probe set�.
6.3.11 Estimation of relative mRNA synthesis and decay rates
The R/Bioconductor package Dynamic Transcriptome Analysis (DTA) [173] was used to estimaterelative mRNA synthesis and decay rates. For detailed description of the model and parameterestimation refer to [144]. In brief, during a 4-thiouridine (4sU) labeling period t, 4sU is integratedinto the nascent RNA, generating a pool of labeled RNA. Therefore, the total mRNA level (C) of agiven gene g in a sample r consists of the pre-existing, unlabeled RNA fraction (B) and the nascent,labeled RNA fraction (A).
Cgr(t) = Agr(t) +Bgr(t) (1)
The DTA model assumes an unperturbed steady-state, where RNA synthesis and decay determinethe equilibrium mRNA level. To that end the synthesis rate µg and decay rate λg of a gene gare assumed to be constant during the 4sU labeling time, if averaged over a cell cycle period. Thissteady-state assumption is valid because we measure a large, unsynchronized population of cells. Thesame argument holds true for temporal �uctuations in transcription. Consequently, DTA estimatesthe cell cycle and population average of mRNA synthesis and decay rates during the 4sU labelingperiod t. The assumption of constant rates during labeling allows for changes in synthesis and decayrates between distinct time points in a time series experiment. In order to calculate decay rates themodel assumes that the pre-existing, unlabeled RNA fraction (B) follows an exponential decay lawgiven by
Bgr = Cgr × e−t(α+λg) (2)
or equivalently with (1),
AgrCgr
= 1− e−t(α+λg) (3)
The parameter α is known as the dilution rate and considers that the increase in total mRNA amountof all cells is proportional to the increase in cell number during the labeling time. The increase in cellnumber depends on the cell cycle length, which is the time in which the cell number doubles. Thistime was measured to be 24 hours. The unknown decay rate can be inferred by solving equation (3)for λg. However, the described assumptions and equations re�ect an idealized situation, that doesnot account for experimental bias such as 4sU labelling e�ciency (labeling bias), RNA extraction
31
e�ciencies, ampli�cation steps and scanner calibrations. Consequently, a set of parameters is de�nedto relate the mRNA fractions Ag(t) and Cg(t) to the measured levels of total RNA Tg(t) and labeledRNA Lg(t). The parameter estimation was done as described in [144]. The �nal equation forcalculation of decay and synthesis rates is given by
LgrTgr
= lgrarcr
[1− e−t(α+λgr)
](4)
and considers the estimated labeling bias lgr as well as the ratio of agr and cgr, which accountfor multiple experimental bias introduced during sample and microarray preparation. ar
crhas been
determined in previous experiments to be 0.08.Using equation (4) the decay rate can be deduced from
λgr = −∝− 1
trlog
[1−
crlgrar
Lgr(tr)
Tgr(tr)
](5)
The synthesis rate can be calculated from
µgr =
crlgrar
Lgr(tr)(α+ λgr)[e∝tr − e−λgrtr
] (6)
Note: Using our experimental setup DTA cannot estimate absolute rates, but reliably reports relativerates as shown in [144]. Furthermore, the synthesis rate is not given in mRNA molecules producedper cell cycle period, as we did not have an estimate of how many copies of a transcript exist inDrosophila S2 cells. Since our data did not su�er from any labeling bias (data not shown) ratescould be calculated without bias correction.
6.3.12 Di�erential expression analysis
6.3.12.1 Single time point analysis Signi�cantly di�erentially expressed probe sets wereidenti�ed using the R/Bioconductor package LIMMA [184]. LIMMA was applied to all measuredand calculated values: (i) total RNA expression, (ii) labeled RNA expression, (iii) synthesis rate and(iv) decay rate. We considered a probe set �signi�cantly di�erentially expressed�, if the calculatedexpression value fold or rate fold of the treated versus the untreated group di�ered by a factor of atleast log2(1.5) along with a p-value smaller than 1% in the respective two-group comparison.
6.3.12.2 Time series analysis Di�erential expression analysis across the treatment time serieswas carried out by B. Knapp, ICB Helmholtz Zentrum, München.For the time series analysis total RNA and labeled RNA expression values of untreated (mock)and ecdysone treatment at the individual time points 1, 2, 4, 6, and 12 hours were extractedfrom the DTA text �le output (total_expression_table; labeled_expression_table). Next, the foldchange log2(sample/mock) was calculated, where sample corresponds to the data given for eachreplicate at each time point. For mock, the median of the 1hour and 12hours time points and theirrespective replicates was used. To identify probe sets di�erentially regulated over the time series,the R/Bioconductor package Bayesian Estimation of Temporal Regulation (betr) [7] was applied.In short, in betr a probability is computed for each probe set denoting whether it is di�erentiallyexpressed or not. The algorithm �ts two models to the data, one assuming that the probe setis di�erentially expressed across time points, and one assuming no di�erential expression. Thelatter model is a random e�ects model that takes correlations between time points into account andthus, allows an increased sensitivity in comparison to an analysis based on individual time points.Probe sets were considered as being di�erentially expressed, if they exhibited a replicate's averagedprobability equal to 1.
32
6.3.13 Gene Ontology (GO) analysis
6.3.13.1 topGO Gene Ontology (GO) enrichment analysis in the categories Biological Pro-cess (BP), Molecular Function (MF) and Cellular Component (CC) were performed using theR/Bioconductor package topGO [1]. Annotation terms were derived from the R/Bioconductorpackage drosophila2.db [33]. Enrichment was tested for the union of all di�erentially regulatedprobe sets (single time point and time series), but also separately for up- and down-regulated probesets. topGO was applied in three di�erent modes: (i) classical mode using a Fisher test in whicheach GO category was tested independently, (ii) elim algorithm which scores parent nodes accordingto the signi�cance of their children, and (iii) weight01 algorithm which uses elim and additionally aweighting scheme for the nodes. The latter algorithm was used to sort the enriched GO categoriesaccording to their p-value.
6.3.13.2 Cytoscape plugin ClueGO The ClueGO v2.1.1 plugin [24] for the open sourcesoftware Cytoscape V3 [45] was used to analyze and visualize the GO network. Functionalannotations were retrieved through Cytoscape from Gene Ontology �Biological Process� and KEGGdatabase [103]. Gene lists submitted to ClueGO: (i) genes with induced/repressed expressionin total or labeled RNA, (ii) genes with induced/repressed synthesis rate and (iii) genes withinduced/repressed decay rate. Enrichment was tested using a two-sided hypergeometric test andBonferroni correction. Enriched GO terms (hierarchy level 3-8, without IEA) had to contain at leastsix genes and the associated genes needed to represent at least 8% of all genes of that term. GO termswere grouped when they overlapped in at least 50% of their genes using Kappa Score 0.5 and initialGroup Size 4. After a gene list was tested for overrepresented terms, all genes associated with termsunrelated to either cell cycle (Figure 5), metabolism (Figure 6) or di�erentiation/morphogenesis(Figure 7) were excluded and enrichment analysis was repeated. For visualization only the mostrepresentative terms and genes were chosen.
6.3.14 k-means clustering
In order to group probe sets according to similar expression or rate kinetics across the time seriesk-means clustering was applied.
6.3.14.1 Individual k-means clustering Data sets of total and labeled RNA, as well assynthesis and decay rate were separately clustered considering all probe sets, which were de�nedas signi�cantly di�erentially regulated at any time point in all data sets (Section 6.3.12). All log2
expression values or rates of a gene at a given time point were converted to z-scores and subjectedto k-means clustering. Clustering was initiated on stable cluster centers for the optimal numberof clusters. Both parameters were determined by hundred fold iteration, until stable centers werefound and optimal separation of the clusters achieved.
6.3.14.2 Combined k-means clustering All signi�cantly di�erentially regulated genes(Section 6.3.12) were subjected to k-means clustering using all data sets to group genes accordingto their similarity in all evaluated parameters: (i) z-score kinetics in total RNA, labeled RNA anddecay rate and (ii) log2 fold change at a given time point in total RNA, labeled RNA or decay rate.Further, the turnover of a gene, being de�ned as �synthesis rate x decay rate�, was included insteadof the synthesis rate. Final clustering was initiated on the stable cluster centers for the optimalcluster numbers, as described above.
33

6.3.15 Cluster characterization
6.3.15.1 Description of cluster timing, strength, e�ect type and coupling of synthesisand decay rates The characterization of timing was based upon mean fold change progressionof total RNA or labeled RNA, and described in �ve time windows: early (1, 2 hours), early untillate (1-12 hours), middle (4, 6 hours), middle until late (4-12 hours) and late (12 hours). Thee�ect strength was de�ned as the maximum mean fold change in total RNA expression: <1.5-fold,≥1.5-fold, ≥2-fold or ≥4-fold. E�ect type, i.e. increase or decrease of gene expression or rate wasdiscretized based on mean fold changes ≥1.5-fold by color coding in red and blue, respectively.Coupling of synthesis and decay rates was assessed by Pearson correlation of mean fold changes:strong (r≥0.75), moderate (r≥0.50), poor (r≥0.25) and no coupling (r<0.25).
6.3.15.2 UTR sequence analysis For all clusters genomic 5´ UTR and 3´ UTR coordinateswere obtained from �ybase-r5.22. Average UTR length of each cluster was compared to averageUTR length of all clusters. Di�erence was called signi�cant, if the cluster average di�ered by atleast 25% with a p-value smaller than 1% in the respective two-group comparison (Wilcoxon RankSum test).
6.3.15.3 Enrichment analyses The functional annotation enrichment of each cluster was cal-culated using a Fisher's exact test against all genes present on the A�ymetrix Drosophila Genome 2.0array. Annotation terms were derived from the R/Bioconductor package drosophila2.db [33] and anoptimized functional prediction resource [199]. Enrichment was called signi�cant, if it achieved ap-value smaller than 1%. The degree of over-representation de�ned as the number of expectedgenes versus the number of observed genes was calculated for signi�cantly enriched terms. RNAbinding protein (RBP) enrichment of each cluster was calculated using a Fisher`s exact test using apublished data set of Pumilio targets (embryo) [71] and unpublished data from G. Meister for Brattargets (embryo). Enrichment was called signi�cant, if it achieved a p-value smaller than 1%. Degreeof over-representation was calculated for signi�cantly enriched terms. For the random enrichmentanalysis, all signi�cantly di�erentially regulated genes were randomly assigned to 20 clusters of thesize equal to the original 20 clusters (Section 6.3.14) and enrichment analyses were performed asdescribed above. The random assignment and analysis was repeated 50 times and the occurrence ofeach enriched GO term or RBP target was documented. Occurrence of ≤5 was called reliable.
6.4 Methods for expression analysis of microRNAs
6.4.1 microRNA puri�cation
For all microRNA (miRNA) experiments 1.8 x 10⁶ cells were seeded 24 hours before ecdysonetreatment. After treatment 2.5 x 10⁶ cells were harvested and total RNA containing the small RNAfraction was extracted using the miRNeasy Mini Kit (Qiagen) according to manufacturer's protocol.
6.4.2 Northern blotting
Northern blotting using 15 µg RNA was carried out by R. Böttcher (AG Förstemann, Gene Center)and was performed as described in [61]. 2S rRNA was used as positive control. All probes are listedin Table 6.
6.4.3 RT-PCR
The relative quanti�cation of mature microRNAs was carried out using primers designed by K.Förstemann (Table 3). miRNA tailing and reverse transcription of 200 ng RNA was performed usingmiScript II reverse transcription kit (Qiagen) according to the manufacturer's instruction. PCR
34
ampli�cation was executed on a Bio-Rad CFX96 Real-Time System (Bio-Rad) using Qiagen miScriptRT-PCR kit according to the manufacturer's instruction. The 15 sec denaturation step at 95°C wasfollowed by 40 cycles of 15 sec at 95°C, 30 sec at 55°C and 30 sec at 72°C. Finally, a meltingcurve was generated in 0.5°C increments for 5 sec from 65-95°C. Threshold cycle (Ct) values weredetermined by application of the corresponding Bio-Rad CFX Manager software version 3.1 usingthe Ct determination mode Single Threshold. Relative expression levels were calculated applyingthe 2−∆∆CT method [131] with normalization of target miRNA expression levels to rp49. Relativequanti�cation of pri-miRNAs was performed as for mRNAs (Section 6.3.8). Primers were designedto target a preferably unstructured region next to the mature miRNA stem loop.
6.4.4 nCounter
In order to simultaneously measure the di�erential expression of 184 microRNAs, the digitalmultiplexed nanoString nCounter Fly miRNA expression assay (nanoString Technologies) wasperformed with 100 ng total RNA extracted from two biological replicates. Sample hybridizationand nCounter analysis was conducted by the nCounter Core Facility, Heidelberg.
6.4.5 nCounter data analysis
Raw data were transformed to log scale and normalized based on the average counts of the internalpositive spike controls to account for platform associated sources of variation. The detection limitwas set to two standard deviations above the average count of the lower 33% of the data. Next, aglobal normalization between the biological replicates was applied calculating a scaling factor basedon the top 40 expressed miRNAs. Data were further normalized by a scaling factor calculated fromthe average of six invariant miRNAs. The invariant miRNAs were selected using the R/Bioconductorpackage NanoStringNorm [195]. Di�erentially expressed candidate miRNAs were identi�ed applyingthe betr package (Section 6.3.12) with minor modi�cations. First, two time intervals were used forthe time series analysis (i) 2-12 hours and (ii) 2-72 hours. For mock the mean of the 2-24 hourstime points was used. Second, the signi�cance level α was set to 0.1. miRNAs were considered to besigni�cantly di�erentially expressed, if they exhibited a replicate's averaged score of at least 0.99.The lists of di�erentially expressed candidate miRNAs were manually re�ned to exclude putativefalse positives or include obvious false-negatives. miRNAs with inconsistent and minor fold changes(< 1.2-fold) were excluded, whereas miRNAs with strong (≥1.5-fold), but not monotonic fold changeswere included.Note: An improved normalization strategy would be to use Spike-In RNA oligos of the negativecontrols C, D and E, which then control for RNA extraction e�ciency and sample input [98].
6.4.6 miRNA target predictions
The target predictions from microRNA.org are based on the miRanda algorithm [56] and are furtherscored for likelihood of mRNA down regulation using mirSVR [22]. All fruit �y pre-computedtarget site predictions were downloaded from microRNA.org (August 2010 release) and combinedto one target graph (good and non-good mirSVR score, conserved and non-conserved miRNAs). Inaddition, miRanda was run in its default setting to predict targets for dme-mir-282-3p. All predictedmiRNA-mRNA target pairs containing di�erentially regulated miRNAs and mRNAs were extractedfor further use.
6.4.7 miRNA-mRNA network analysis
miRNA-mRNA network analysis was carried out by B. Knapp and S. Sass, ICB Helmholtz Zentrum,München.
35
To identify potential miRNA mediated down-regulation of mRNA expression a simple matchingcriterion, based on discrete expression and decay rate fold change patterns, was applied. First, forsigni�cantly regulated genes a discrete decay rate pattern was generated at the time points 2, 4,6 and 12 hours. The fold change (FC) in decay rate after treatment was discretized to +1 and=1 for FC>0 or <0, respectively. Furthermore, the expression pattern of di�erentially regulatedmiRNAs was discretized just as well. Next, discrete expression and decay rate patterns of miRNAsand mRNAs were correlated for all predicted microRNA-mRNA target pairs (Section 6.4.6) overthe entire time series or using one time shift: miRNA pattern at 2-4-6 hours was allowed to matchan mRNA decay rate pattern at 4-6-12 hours. A miRNA-mRNA pair was called �valid�, if theexpression pattern of an induced or repressed miRNA matched to the increased or decreased decayrate pattern of its target, respectively. Finally, we used the total mRNA expression data to �lter formiRNA-mRNA interactions, in which mRNA expression levels are signi�cantly changed (≥1.5-fold,p-value<0.01). We classi�ed these interactions as �reliable�.
In addition, miRNA-mRNA pairs were correlated by the miRNA expression pattern and discretemRNA total RNA expression pattern. In this case �valid� pairs had to be positively correlated andfor �reliable� pairs the mRNA decay rate had to be signi�cantly regulated (≥1.5-fold, p-value<0.01).Networks of miRNAs and their targets were visualized using Cytoscape V3 [45].
6.5 Methods for optimizing the D. melanogaster DTA-RNA-Seq protocol
6.5.1 Spike-In controls
Arti�cial RNA spike-in controls were established as a novel method for normalization againstvarious experimental biases including variations in RNA input amount, puri�cation e�ciency orPCR ampli�cation biases due to variable GC-content. 1 µl of the ERCC RNA Spike-In Mix(Ambion) was reverse transcribed using the First Strand cDNA Synthesis Kit (Roche) with oligo-dTprimers. Speci�c PCR primers were designed to amplify six Spike-In sequences characterized by:(i) approximate length of 1000 nt, (ii) almost equal number of thymine/uridines and (iii) either 30%,40% or 50% GC content (Table 5). GC contents were represented by two sequences. The 5´ end ofthe forward primer included the T7 promoter sequence to facilitate in vitro transcription (IVT) fromthe PCR product. All experimental procedures were conducted under RNase-free conditions. PCRampli�cation was performed using the KOD Hot Start DNA Polymerase (Novagen) on a Bio-RadDNAEngine Thermo Cycler (Bio-Rad). After an initial denaturation step at 95°C for 2 min ,30 cycles of 95°C for 20 sec, primer annealing step for 3 sec and 72°C for 70 sec were performed.Annealing temperature was adjusted for each Spike-In sequence (Table 4). After the �nal extensionstep at 72°C for 10 sec, PCR products were puri�ed using the QIAquick PCR Puri�cation Kit(Qiagen). Size and purity of PCR products was assessed by gel electrophoresis. If PCR productsshowed contaminations with smaller fragments, the desired PCR fragment was isolated by gelextraction using the QIAquick Gel Extraction Kit (Qiagen). Final fragments were sent for sequenceveri�cation to Euro�ns MWG Operon. Finally, in vitro transcription of 500 ng PCR product wasperformed for 4 hours using the MEGAscript T7 Kit (Ambion) according to manufacturer's protocol.For each GC content one Spike-In was transcribed in the presence of 1:1 ratio UTP to 4-Thio-UTP(Jena Bioscience). Final products were puri�ed using the Agencourt RNAClean XP Beads (BeckmanCoulter) following the manufacturer's protocol and eluted in 100 µl RNase-free water. Transcriptintegrity and size was assessed on a RNA 6000 Nano Chip (Agilent). All six Spike-Ins were pooledin equal numbers (1.44× 10⁶ molecules) to generate a stock mix and 8 µl of this mix was spiked inthe cell lysate prior to total RNA isolation (Section 6.3.2).
36

6.5.2 Depletion of ribosomal RNA (primer design)
Depletion of ribosomal RNA (rRNA) was achieved by D. melanogaster rRNA speci�c primerscoupled to the Insert Dependent Adaptor Cleavage (InDA-C) method (NuGEN).The rRNA speci�c primers were designed by NuGEN based on two resources: Firstly, weextracted all rRNA sequences from the Flybase genome release dmel_r5.53_FB2013_05, resultingin 160 transcripts. Secondly, we provided sequencing results from our own previous experiments, inwhich 70% of all reads mapped to rRNA. 17-25 nt long primers were placed approximately every70-300 nt along the transcript with emphasis on the most prominently expressed rRNAs. Afterthe design, primers were aligned to the genome (NCBI Blast) to identify possible o� target e�ects.Finally, a total of 124 primers were synthesized by Metabion. Before use, all primers were pooledand the concentration adjusted to 125 nM each.After this work was completed NuGEN released a commercial library preparation kit containingD. melanogaster rRNA speci�c InDA-C primers (Ovation Drosophila RNA-Seq System 1-16).
6.5.3 Next-generation sequencing
The Ovation Human Blood RNA-Seq Library Systems 1-8 and 9-16 (NuGEN) was used for strandspeci�c RNA-Sequencing library generation. 250 ng total or labeled RNA were �rst convertedinto double stranded cDNA according to manufacturer's protocol (NuGEN) and fragmented bysoni�cation using the BiorupterPlus (Diagenode). 15 cycles time on 30 sec, time o� 30 sec, �low�setting, followed by 10 cycles using the same settings after 10 min cool down. Next, librarypreparation was continued as described by the manufacturer, except that component SS5 wasreplaced by the D. melanogaster speci�c InDA-C primer mix (Section 6.5.2). Libraries wereampli�ed using 15 PCR cycles. Final libraries were quanti�ed using the Qubit dsDNA HS Assay Kit(Invitrogen). In addition, molarity and fragment distribution was analyzed on a Bioanalyzer DNA7500 Chip (Agilent). Libraries were pooled and 50 bp paired-end sequencing was performed on anIllumina HiSeq 2500 sequencer. Sequencing was continued until 40 x 106 fragment reads could bemapped to the genome (without rRNA reads). Next-generation sequencing was performed by theLAFUGA sequencing facility at the Gene Center LMU Munich, Groÿhadern.
6.5.4 Processing of sequencing data
Sequencing raw data were processed using Galaxy [72, 26, 73]. First, FASTQ �les were demultiplexedto obtain reverse and forward reads for each sample. Then reads were trimmed from the 3´ end usinga Phred score cuto� of <30 and read pairs shorter than 30 bp were discarded. Furthermore, the �rst5 bases from the 5´ end were removed. Reads were then mapped to all rRNA sequences (extractedfrom the D. melanogaster genome build 5.53, September 2013) using Bowtie version 1.0 [120] usingits default parameter settings except allowing for ambiguous mapping of reads (parameter m =−1). Next, read pairs that did not map to rRNA sequences were extracted and mapped to theD. melanogaster genome (build 5.53) using Tophat version 2.0 [107] using the following parametersettings: Anchor length 5, minimum intron length 40, maximum number of alignments allowed 1,minimum length of read segment 15 and gene annotation model �le of build 5.53. Mapped readswere counted using the tool HTseq-count version 1.0 [5] in its setting �intersection_nonempty�.
37
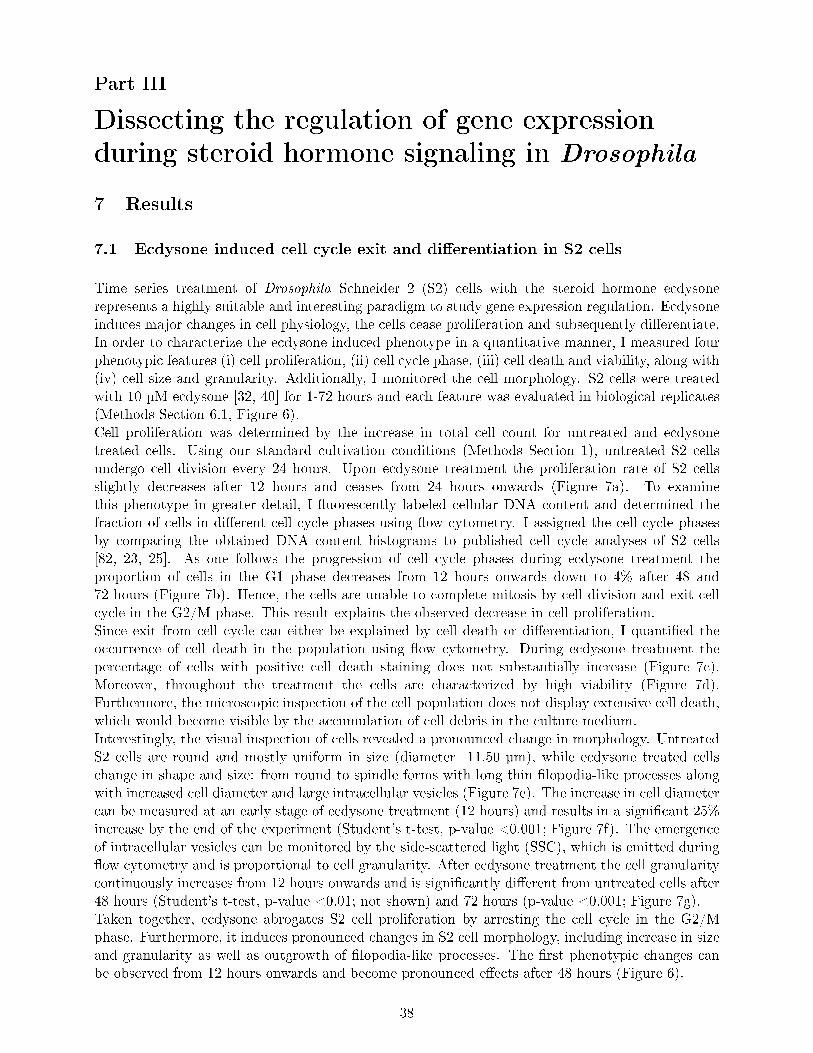
Part III
Dissecting the regulation of gene expression
during steroid hormone signaling in Drosophila
7 Results
7.1 Ecdysone induced cell cycle exit and di�erentiation in S2 cells
Time series treatment of Drosophila Schneider 2 (S2) cells with the steroid hormone ecdysonerepresents a highly suitable and interesting paradigm to study gene expression regulation. Ecdysoneinduces major changes in cell physiology, the cells cease proliferation and subsequently di�erentiate.In order to characterize the ecdysone induced phenotype in a quantitative manner, I measured fourphenotypic features (i) cell proliferation, (ii) cell cycle phase, (iii) cell death and viability, along with(iv) cell size and granularity. Additionally, I monitored the cell morphology. S2 cells were treatedwith 10 µM ecdysone [32, 40] for 1-72 hours and each feature was evaluated in biological replicates(Methods Section 6.1, Figure 6).Cell proliferation was determined by the increase in total cell count for untreated and ecdysonetreated cells. Using our standard cultivation conditions (Methods Section 1), untreated S2 cellsundergo cell division every 24 hours. Upon ecdysone treatment the proliferation rate of S2 cellsslightly decreases after 12 hours and ceases from 24 hours onwards (Figure 7a). To examinethis phenotype in greater detail, I �uorescently labeled cellular DNA content and determined thefraction of cells in di�erent cell cycle phases using �ow cytometry. I assigned the cell cycle phasesby comparing the obtained DNA content histograms to published cell cycle analyses of S2 cells[82, 23, 25]. As one follows the progression of cell cycle phases during ecdysone treatment theproportion of cells in the G1 phase decreases from 12 hours onwards down to 4% after 48 and72 hours (Figure 7b). Hence, the cells are unable to complete mitosis by cell division and exit cellcycle in the G2/M phase. This result explains the observed decrease in cell proliferation.Since exit from cell cycle can either be explained by cell death or di�erentiation, I quanti�ed theoccurrence of cell death in the population using �ow cytometry. During ecdysone treatment thepercentage of cells with positive cell death staining does not substantially increase (Figure 7c).Moreover, throughout the treatment the cells are characterized by high viability (Figure 7d).Furthermore, the microscopic inspection of the cell population does not display extensive cell death,which would become visible by the accumulation of cell debris in the culture medium.Interestingly, the visual inspection of cells revealed a pronounced change in morphology. UntreatedS2 cells are round and mostly uniform in size (diameter 11.50 µm), while ecdysone treated cellschange in shape and size: from round to spindle forms with long thin �lopodia-like processes alongwith increased cell diameter and large intracellular vesicles (Figure 7e). The increase in cell diametercan be measured at an early stage of ecdysone treatment (12 hours) and results in a signi�cant 25%increase by the end of the experiment (Student's t-test, p-value <0.001; Figure 7f). The emergenceof intracellular vesicles can be monitored by the side-scattered light (SSC), which is emitted during�ow cytometry and is proportional to cell granularity. After ecdysone treatment the cell granularitycontinuously increases from 12 hours onwards and is signi�cantly di�erent from untreated cells after48 hours (Student's t-test, p-value <0.01; not shown) and 72 hours (p-value <0.001; Figure 7g).Taken together, ecdysone abrogates S2 cell proliferation by arresting the cell cycle in the G2/Mphase. Furthermore, it induces pronounced changes in S2 cell morphology, including increase in sizeand granularity as well as outgrowth of �lopodia-like processes. The �rst phenotypic changes canbe observed from 12 hours onwards and become pronounced e�ects after 48 hours (Figure 6).
38
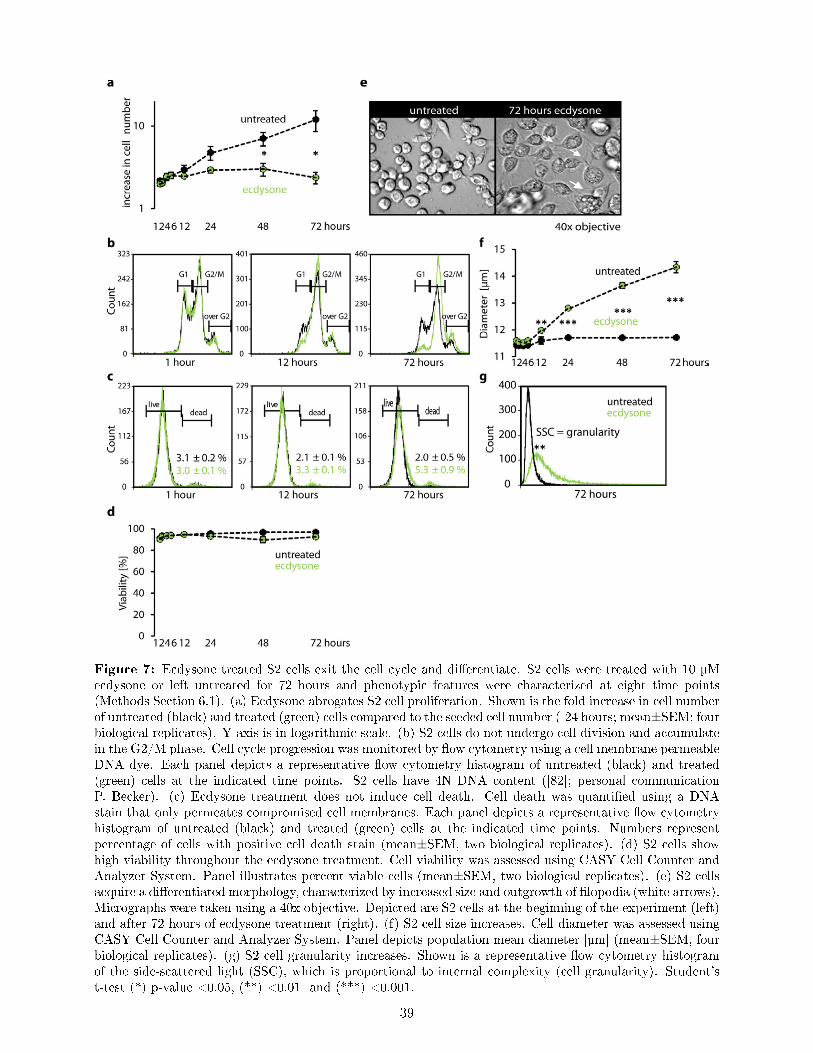
Figure 7: Ecdysone treated S2 cells exit the cell cycle and di�erentiate. S2 cells were treated with 10 µMecdysone or left untreated for 72 hours and phenotypic features were characterized at eight time points(Methods Section 6.1). (a) Ecdysone abrogates S2 cell proliferation. Shown is the fold increase in cell numberof untreated (black) and treated (green) cells compared to the seeded cell number (-24 hours; mean±SEM; fourbiological replicates). Y-axis is in logarithmic scale. (b) S2 cells do not undergo cell division and accumulatein the G2/M phase. Cell cycle progression was monitored by �ow cytometry using a cell membrane permeableDNA dye. Each panel depicts a representative �ow cytometry histogram of untreated (black) and treated(green) cells at the indicated time points. S2 cells have 4N DNA content ([82]; personal communicationP. Becker). (c) Ecdysone treatment does not induce cell death. Cell death was quanti�ed using a DNAstain that only permeates compromised cell membranes. Each panel depicts a representative �ow cytometryhistogram of untreated (black) and treated (green) cells at the indicated time points. Numbers representpercentage of cells with positive cell death stain (mean±SEM, two biological replicates). (d) S2 cells showhigh viability throughout the ecdysone treatment. Cell viability was assessed using CASY Cell Counter andAnalyzer System. Panel illustrates percent viable cells (mean±SEM, two biological replicates). (e) S2 cellsacquire a di�erentiated morphology, characterized by increased size and outgrowth of �lopodia (white arrows).Micrographs were taken using a 40x objective. Depicted are S2 cells at the beginning of the experiment (left)and after 72 hours of ecdysone treatment (right). (f) S2 cell size increases. Cell diameter was assessed usingCASY Cell Counter and Analyzer System. Panel depicts population mean diameter [µm] (mean±SEM, fourbiological replicates). (g) S2 cell granularity increases. Shown is a representative �ow cytometry histogramof the side-scattered light (SSC), which is proportional to internal complexity (cell granularity). Student'st-test (*) p-value <0.05, (**) <0.01 and (***) <0.001.
39

7.2 Establishing 4sU labeling and the transcriptional time scale of ecdysone
signaling in S2 cells
Having characterized the ecdysone induced phenotype, I next established non-invasive 4sU labelingconditions for Drosophila S2 cells and determined the transcriptional time scale downstream of theecdysone signaling cascade. To this end, I adapted the 4sU labeling protocol [51] for S2 cells (MethodsSections 6.3.1-6.3.4). I quanti�ed the incorporation of 4sU into nascent RNA using Dot blot analysis(Methods Section 6.3.7), which speci�cally detects 4sU labeled, biotinylated RNA. 4sU is e�cientlyincorporated into nascent RNA in a concentration and time dependent manner (Figure 8a). Since200 µM 4sU for 1 hour yields su�cient nascent RNA in a relatively short labeling time (comparedto the cell cycle length of 24 hours), we decided to use this as our labeling condition. Next, we askedwhether 4sU labeling perturbs gene expression and hybridized expression microarrays (A�ymetrix)with total RNA of wild-type S2 cells and 4sU exposed cells (Methods Section 6.3.9). Our labelingcondition does not induce any signi�cant changes in gene expression (Figure 8b).To investigate the temporal scale of ecdysone signaling, I measured nascent mRNA and proteinlevels of ecdysone receptor (EcR) and the transcription factor broad (br), as representatives forearly (primary) ecdysone target genes (Methods Sections 6.3.8, 6.2). Nascent mRNA expressionrevealed that transcription of EcR and br are rapidly and strongly induced and peak at 2 and4 hours, respectively (Figure 8c). At 12 hours, transcription has almost returned to initial levels.The respective protein levels were analyzed by Western blot for an extended time period (1-72 hours),to account for the time lag between transcription and translation. As EcR and Br are both expressedin multiple isoforms, I used antibodies targeting common protein domains [189, 55]. EcR and Brlevels are strongly induced from 2-24 hours and regress thereafter (Figure 8d). Furthermore, weobserved two interesting phenomena. First, protein levels of EcR are lower at 48 hours compared to72 hours. Second, Br is expressed in di�erent isoforms upon ecdysone stimulation. This has beenobserved in in vivo studies as well [55].These results demonstrate that the early transcriptional cascade of ecdysone signaling is inducedwithin the �rst twelve hours. Moreover, the protein kinetics of EcR and Br indicate that transcriptionof their target genes, the early-late and late genes, might already be a�ected during this interval, aswell.
7.3 DTA monitors the transcriptional response to ecdysone with high sensitivity
and improved temporal resolution
To dissect ecdysone induced gene expression kinetics with high temporal resolution in a genome-widefashion, I applied Dynamic Transcriptome Analysis (DTA) [144]. Speci�cally, I performed a timeseries of ecdysone treatment and 4sU nascent RNA labeling in S2 cells, comprising frequentlysampled early time points (1, 2, 4, 6 and 12 hours), (Figure 6; Methods Sections 6.1.3, 6.3.1-6.3.6).Expression pro�ling of nascent and total mRNA was carried out using microarrays (A�ymetrix;Methods Section 6.3.9). We identi�ed 1788 genes as being signi�cantly di�erentially expressed uponecdysone treatment in the nascent or total mRNA fractions at any time point (fold change >1.5,p-value <0.01; Methods Sections 6.3.10, 6.3.12; Supplementary Table 1). Considering the entiretime series, the number of genes identi�ed in nascent or total mRNA was rather similar, 1437 and1153, respectively. However, we �nd di�erences in the temporal resolution of nascent and total RNAexpression pro�ling.When comparing the number of signi�cantly di�erentially expressed genes after 1 hour, expressionpro�ling in nascent RNA identi�es four times more genes compared to total RNA (Figure 9a). Thise�ect is particularly pronounced for repressed genes. To assess this e�ect more globally, I quanti�edinduced and repressed genes at each time point and classi�ed them according to the mRNA fractionthey were identi�ed in. Especially at early time points most genes are identi�ed in the �only nascentmRNA� fraction. Again, this is particularly pronounced for repressed genes (>80%; Figure 9b). The
40

Figure 8: Establishing 4sU labeling and the transcriptional time scale of ecdysone signaling in S2 cells.(a) Concentration and time dependent incorporation of 4-thiouridine (4sU) into nascent RNA. S2 cells werecultured in the presence of 0, 100, 200 and 500 µM 4sU for 1 and 2 hours. Following isolation of total RNA andthiol-speci�c biotinylation, Dot blot analysis was carried out in 10-fold dilutions (1 µg down to 1 ng) (MethodsSection 6.3.7). A biotinylated oligonucleotide (control) was used to quantify 4sU-incorporation (100 ng downto 0.1 ng). (b) Gene expression is una�ected by 4sU labeling (200 µM, 1 hour). Volcano plot shows themean fold change (x-axis) in gene expression of 4sU exposed cells compared to unexposed cells. Each dotcorresponds to one gene. Y-axis represents the multiple testing adjusted p-value (Benjamini�Hochberg). Theinner vertical and horizontal lines represent the de�ned cuto� for fold change and p-value (>log2(1.5); adjustedp-value <0.05). (c) Transcriptional kinetics of early ecdysone target genes. Nascent mRNA expression wasanalyzed by RT-PCR (Methods Section 6.3.8). Histograms represent normalized fold change of EcR and brexpression relative to untreated cells (mean±SEM, two biological replicates). EcR and br expression wasnormalized against housekeeping gene CG30159. (d) EcR and Br protein levels show characteristic inductionpatterns. Monoclonal antibodies directed against the common EcR and Br-core (α-Br core) domains wereused to probe equivalent Western blots. Br isoforms are shown on the right [55]. Actin was used as proteinloading control. 4sU, 4-thiouridine; EcR, ecdysone receptor gene and protein; br/Br, broad gene/protein.
41

Figure 9: DTA monitors the transcriptional response to ecdysone with high sensitivity and improvedtemporal resolution. (a) Expression pro�ling using nascent RNA exhibits higher sensitivity compared tototal RNA. Volcano plot shows the mean fold change (x-axis) in gene expression after 1 hour of ecdysonetreatment compared to untreated cells for total (top) and nascent (bottom) mRNA. Each dot corresponds toone gene. Signi�cantly di�erentially expressed genes are colored in green (fold change >log2(1.5); Student'st-test p-value <0.01; two biological replicates). (b) Distribution of di�erentially expressed genes betweenmRNA fractions. Numbers on top denote the total number of genes induced (left) or repressed (right) ateach time point. Histograms illustrate the percentage of genes identi�ed as regulated in the correspondingmRNA fraction: only nascent mRNA (light grey), only total mRNA (black) or both fractions (dark grey).
overlap, genes identi�ed in both fractions, increases with time. Nevertheless, the exclusive fractions,�only nascent mRNA� and �only total mRNA�, persist throughout the time course.Genes in the �only nascent mRNA� fraction can be explained by higher sensitivity of nascent RNApro�ling. Genes in the �only total mRNA� fraction can be explained by two considerations: Firstly,the distance between 4sU labeling intervals at later time points was rather long and the nascentmRNA fraction cannot identify changes in transcription, which occur between these intervals.Secondly, while nascent RNA is dependent on RNA synthesis, total RNA levels are in�uenced byboth RNA synthesis and decay. Therefore, changes in gene expression as a result of altered RNAdecay can be identi�ed only in the total RNA fraction.In conclusion, gene expression pro�ling of the ecdysone response using nascent RNA shows a highersensitivity and therefore improved temporal resolution compared to total RNA pro�ling.
7.4 Ecdysone induces major, progressively increasing and mostly sustained
changes in gene expression
Binding of ecdysone to its nuclear receptor triggers a complex gene expression cascade. First, asmall set of early regulators is induced or repressed, which in turn a�ects other regulatory genes to�nally induce or repress late e�ector genes. This particular signaling pathway architecture ampli�es
42

Figure 10: Ecdysone induces major, progressively increasing and mostly sustained changes in geneexpression. The heat map is based on t-values, which are calculated with t-statistics and denote if the meantotal (left) or nascent (right) mRNA expression value of a gene is signi�cantly induced (red) or repressed(blue) by ecdysone treatment. Each row and column corresponds to one time point. All rectangles in onerow represent mean t-values of the same group of genes, which were signi�cantly di�erentially expressed atthe indicated time point (number in bold), (fold change >log2(1.5); Student´s t-test p-value < 0.01; twobiological replicates). As one horizontally follows the progression of a gene group over time, darker colorindicates that these genes become more signi�cantly induced or repressed. Less signi�cant induction orrepression is indicated by lighter color. Color scale denotes the range of t-values. 95% of the data is shown.
the signal to induce both rapid and long-term expression changes in a wide array of functionallydiverse genes [89]. Our time series DTA data re�ects this architecture. The number of inducedand repressed genes progressively increases from early to late time points (Figure 10; numbers inbold) and represent a major proportion of the expressed genes (28%, data not shown). Moreover,changes in gene expression observed at one time point are mostly sustained over the entire timeseries (Figure 10).One drawback of our analysis is that we applied a stringent cuto� to de�ne di�erential fold changes.Thereby, we neglect all genes that show only minor but consistent changes. To identify these geneswe additionally used the Bayesian algorithm for Estimation of Temporal Regulation (betr) [7]. betridenti�ed 110 and 147 additional genes in nascent and total mRNA, respectively (SupplementaryTable 1). These genes are included in the subsequent data analysis.
7.5 Functional annotation of ecdysone regulated genes explains observed
phenotypic changes
From our phenotypic analysis we know that after one day of ecdysone treatment S2 cells start tocease proliferation and subsequently undergo major morphological changes (Figure 6; Section 7.1).Given that ecdysone induces major changes in the transcriptome within the �rst 12 hours(Section 7.4), we wondered if these early changes already comprise genes that might a�ect thelater phenotype. Therefore, we tested induced and repressed genes for enrichment in functionalannotation terms of �Biological Process�, �Cellular Component� and �Molecular Function� based onGene Ontology [9] using topGO [1] (Methods Section 6.3.13.1) and the Cytoscape plugin ClueGO(Methods Section 6.3.13.2). The latter allows for both GO and KEGG [103] term enrichmentanalysis and visualization [24]. Functional annotation of the di�erentially regulated genes explainsthe ecdysonse induced progression of S2 cells from the proliferative to the di�erentiated state verywell (Supplementary Tables 2 and 3).As expected, induced genes are enriched for terms related to ecdysone signaling, e.g. �steroid hormonereceptor activity� or �steroid hormone mediated signaling pathway�. The genes in these categories
43

include key regulators of the early ecdysone cascade (EcR, br, Hr39, Eip74EF and Eip75B). Notably,many enriched terms are related to cell death, e.g. �ecdysone-mediated induction of salivary glandcell autophagic cell death�. However, our phenotypic analysis demonstrates that ecdysone does notinduce cell death in S2 cells (Section 7.1). Furthermore, the key cell death regulators, reaper, grimand hid are not induced or even expressed. Hence, the GO term enrichment of cell death termsis mainly due to the well-established general function of ecdysone regulated genes in cell deathpathways during Drosophila development [99, 32, 124, 40] and therefore, equivalent to activation ofecdysone signaling.The decline in proliferation rate is the �rst phenotypic change we observe upon ecdysone treatmentand due to a cell cycle arrest in the G2/M phase (Figure 6; Section 7.1). This cell cycle arrestis re�ected by repressed genes, which are enriched for multiple GO annotation terms related toDNA replication, cell cycle and proliferation (Figure 11), e.g �DNA replication initiation�, �mitoticspindle organization� and �centrosome separation�. Strikingly, the GO analysis of repressed genesalso reveals a strong enrichment for multiple terms related to energy and biomolecule production,suggesting a metabolic rearrangement as the cell leaves the proliferating state to enter a resting,di�erentiated state, e.g. �Glycolysis�, �Citrate cycle� or �Cellular amino acid metabolic process�(Figure 12). The late observed extensive remodeling of cell size and shape (Figure 6; Section 7.1)is re�ected by induced genes, which are enriched for multiple terms related to morphogenesis anddi�erentiation terms (Figure 13). Furthermore, most signi�cantly enriched �Cellular Component�terms are �Plasma membrane� and �Cytoskeleton�.The great variety of enriched functional annotation terms demonstrates how rapid the ecdysonecascade regulates a wide range of functionally diverse genes. Moreover, within this early timeinterval (1-12 hours) ecdysone regulates not only the regulatory key players of the ecdysone cascade,but also genes that presage phenotypic changes observed much later.
44
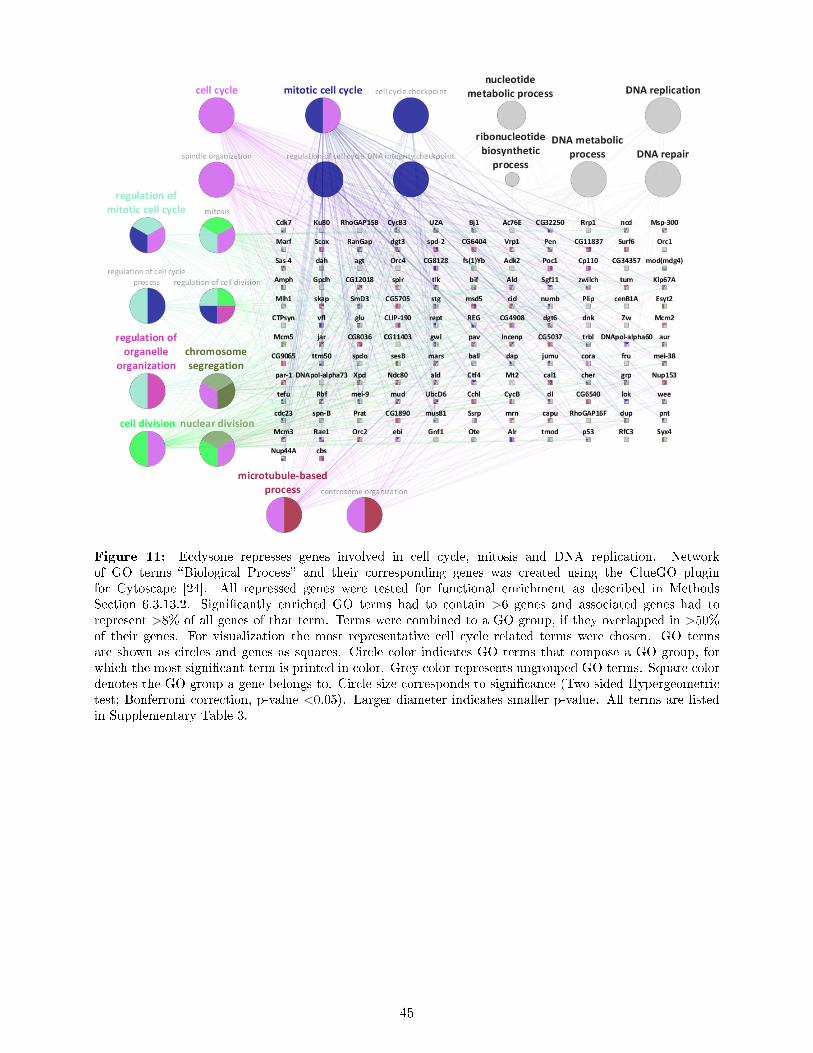
Figure 11: Ecdysone represses genes involved in cell cycle, mitosis and DNA replication. Networkof GO terms �Biological Process� and their corresponding genes was created using the ClueGO pluginfor Cytoscape [24]. All repressed genes were tested for functional enrichment as described in MethodsSection 6.3.13.2. Signi�cantly enriched GO terms had to contain >6 genes and associated genes had torepresent >8% of all genes of that term. Terms were combined to a GO group, if they overlapped in >50%of their genes. For visualization the most representative cell cycle related terms were chosen. GO termsare shown as circles and genes as squares. Circle color indicates GO terms that compose a GO group, forwhich the most signi�cant term is printed in color. Grey color represents ungrouped GO terms. Square colordenotes the GO group a gene belongs to. Circle size corresponds to signi�cance (Two-sided Hypergeometrictest; Bonferroni correction, p-value <0.05). Larger diameter indicates smaller p-value. All terms are listedin Supplementary Table 3.
45

Figure 12: Ecdysone a�ects energy and biomolecule production. All repressed genes were tested forfunctional enrichment as described in Methods Section 6.3.13.2. Legend as in Figure 11, but KEGG terms(octagons) were included and the most representative terms related to metabolism are visualized. All termsare listed in Supplementary Table 3.
Figure 13: Ecdysone induces genes involved in morphogenesis and di�erentiation. All induced genes weretested for functional enrichment as described in Methods Section 6.3.13.2. Legend as in Figure 11, except themost representative terms related to morphogenesis and di�erentiation are visualized. All terms are listed inSupplementary Table 3.
46
7.6 First global assessment of ecdysone regulated synthesis and decay rates
suggests di�erent regulatory principles
Next, we used the measured nascent and total mRNA expression level to estimate relative mRNAsynthesis and decay rates (Methods Section 6.3.11). Our study represents the �rst global assessmentof synthesis and decay regulation by ecdysone signaling. Ecdysone regulates synthesis and decayrates of a large fraction of genes, 1322 and 1033, respectively (fold change >1.5, p-value <0.01).Although the number of genes with regulated synthesis and decay rates is similar, we �nd distinctcharacteristics in their regulation. For the synthesis rates the number of genes with increased anddecreased rates progressively increases over time (Figure 14a). Moreover, the genes exhibit a mostlysustained change over multiple time points, similar to nascent mRNA (compare Figure 14a andFigure 10). In contrast, as suggested by the less sustained progression of mean t-values, decay ratesare controlled in a temporally more restricted fashion (Figure 14a).Besides these kinetic di�erences, genes with altered synthesis and decay rates di�er in theirbiological annotation. Although for both rates the total number of di�erential genes is similar,genes with regulated synthesis rates show more enriched functional annotation terms compared togenes with regulated decay rates (66% more; Methods Section 6.3.13.2; Supplemental Table 4).Similar to the di�erential genes of nascent mRNA, genes with increased synthesis rates are enrichedin terms related to development and morphogenesis, while genes with decreased synthesis ratesre�ect metabolic or cell cycle related processes (Figure 14b). The few terms that are enriched ingenes with increased and decreased decay rates are in either case involved in regulation of metabolicprocesses (Figure 14c). Generally, these analyses suggest that synthesis and decay rate regulationby ecdysone is governed by di�erent principles.
Figure 14 (facing page): First global assessment of ecdysone regulated synthesis and decay rates suggestsdi�erent regulatory principles. (a) Changes in synthesis and decay rates di�er in their continuity. Heatmap is based on t-values, which are calculated in the t-statistics and denote if the mean synthesis (left) ordecay (right) rate of a gene is signi�cantly increased (red) or decreased (blue) by ecdysone treatment. Eachrow and column corresponds to one time point. All rectangles in one row represent mean t-values of thesame group of genes, which exhibited signi�cantly di�erential rates at the indicated time point (number inbold),(fold change log2(1.5); Student's t-test p-value < 0.01; two biological replicates). As one horizontallyfollows the progression of a gene group over time, darker color indicates that these rates become moresigni�cantly increased or decreased. Less signi�cant increase or decrease is indicated by lighter color. 95%of the data is shown. Color scale denotes the range of t-values. (b) Genes with altered synthesis rate areenriched in the same categories as di�erential genes in nascent mRNA. Pie diagrams represent all GO groupsand terms enriched in genes with increased (left) and decreased (right) synthesis rates (Methods Section6.3.13.2). Colored pie sections represent GO groups, which are named by the most signi�cantly enrichedterm. Pie section size correlates with the number of terms included in the GO group. Grey sections representungrouped terms or KEGG terms. (c) Genes with altered decay rate are enriched in few GO term groups.Histogram presents the enriched terms, the number of associated genes and the percentage that these genesrepresent compared to all genes associated with the term. Enriched terms that did not group are not shown.Complete lists of enriched terms in Supplemental Table 4. (*) p-value <0.05, (**) p-value <0.01 (Two-sidedHypergeometric test; Bonferroni correction).
47

48
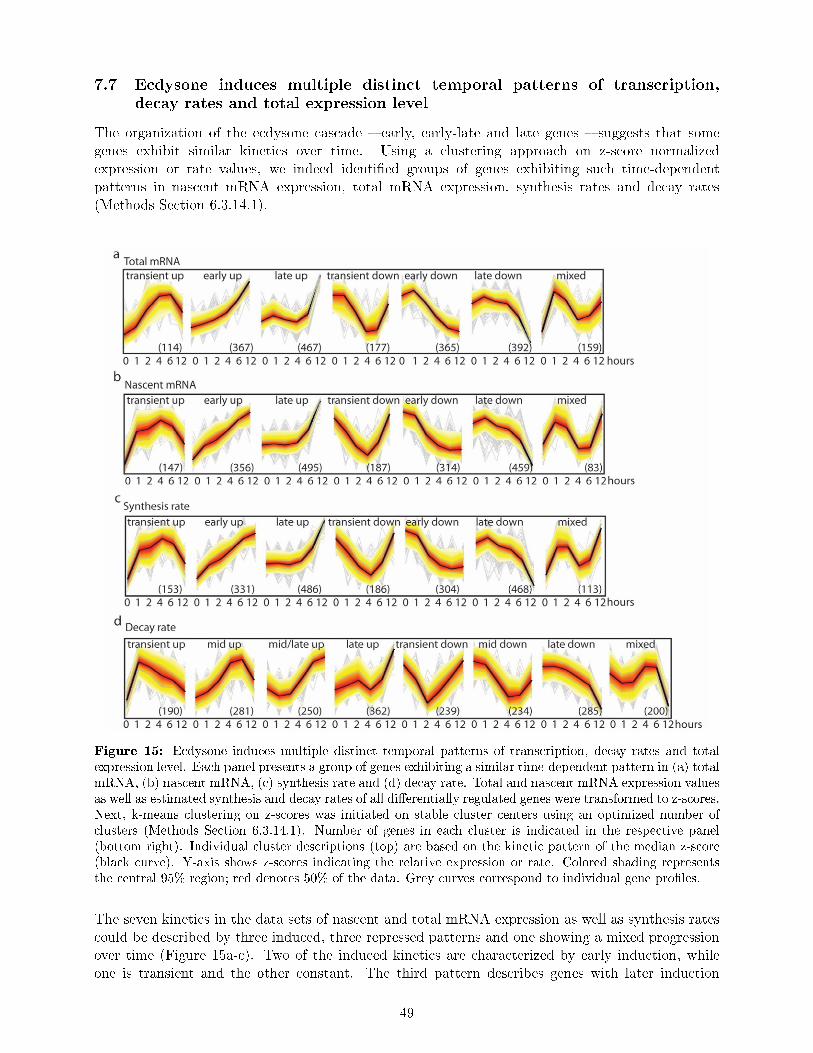
7.7 Ecdysone induces multiple distinct temporal patterns of transcription,
decay rates and total expression level
The organization of the ecdysone cascade � early, early-late and late genes � suggests that somegenes exhibit similar kinetics over time. Using a clustering approach on z-score normalizedexpression or rate values, we indeed identi�ed groups of genes exhibiting such time-dependentpatterns in nascent mRNA expression, total mRNA expression, synthesis rates and decay rates(Methods Section 6.3.14.1).
Figure 15: Ecdysone induces multiple distinct temporal patterns of transcription, decay rates and totalexpression level. Each panel presents a group of genes exhibiting a similar time-dependent pattern in (a) totalmRNA, (b) nascent mRNA, (c) synthesis rate and (d) decay rate. Total and nascent mRNA expression valuesas well as estimated synthesis and decay rates of all di�erentially regulated genes were transformed to z-scores.Next, k-means clustering on z-scores was initiated on stable cluster centers using an optimized number ofclusters (Methods Section 6.3.14.1). Number of genes in each cluster is indicated in the respective panel(bottom right). Individual cluster descriptions (top) are based on the kinetic pattern of the median z-score(black curve). Y-axis shows z-scores indicating the relative expression or rate. Colored shading representsthe central 95% region; red denotes 50% of the data. Grey curves correspond to individual gene pro�les.
The seven kinetics in the data sets of nascent and total mRNA expression as well as synthesis ratescould be described by three induced, three repressed patterns and one showing a mixed progressionover time (Figure 15a-c). Two of the induced kinetics are characterized by early induction, whileone is transient and the other constant. The third pattern describes genes with later induction
49
(6-12 hours). The kinetics of repressed genes follow similar patterns: early but transient repression,early and constantly increasing repression and late repression. Notably, the kinetics of genes innascent mRNA precede the kinetics of total mRNA (e.g. compare �transient down� clusters). Theeight kinetics of genes with di�erential decay rates re�ect the early transiently induced/repressed aswell as the late induced/repressed patterns (Figure 15d). However, the middle time points are bestdescribed by four kinetics. This agrees well with the observed more dynamic regulation of decayrates (Section 7.6).The functional GO/KEGG annotation enrichment analysis of each cluster does not assign speci�cannotations to individual clusters. Generally, clusters with induced patterns show enrichment ofterms related to development and morphogenesis, while clusters with repressed patterns are involvedin cell cycle and metabolism (data not shown). As the individual clusters are not enriched for specicbiological processes, we wondered if we could further subdivide these cluster kinetics using a morecomplex clustering approach that reveals the kinetics of individual biological processes.
7.8 DTA reveals a rich and previously unknown diversity of gene expression
dynamics downstream of ecdysone signaling and uncovers principles of
transcriptional and post-transcriptional regulation
Upon ecdysone stimulation the gene expression dynamic of an ecdysone responsive gene is determinedby the time dependent changes in mRNA synthesis and/or decay rate that lead to changes in thetotal expression level. Therefore, the most comprehensive approach to describe genome-wide geneexpression dynamics is to simultaneously consider a gene's synthesis rate, decay rate and totalexpression level, and then identify all genes with similar gene expression dynamic.To this end, we applied a more complex clustering approach that is able to �nd groups of genes basedon similar time-dependent changes in all of those parameters (Methods Section 6.3.14.2). Speci�cally,we used k-means clustering to segregate di�erentially regulated genes in groups based on similar foldchanges in (i) nascent mRNA expression (synthesis rate), (ii) total mRNA expression, (iii) decay rateand (iv) turnover. To include the time-dependency we used the z-score kinetics of genes in nascentmRNA expression, total mRNA expression and decay rates (Section 7.7) as additional parametersfor the clustering. Since nascent mRNA expression and synthesis rate are rather equal in theirinformation content (Pearson correlation of 1; data not shown), we used the measured nascentmRNA and not the estimated synthesis rate for the clustering. The parameter �turnover�, de�nedas �synthesis rate x decay rate�, was included, since it contains additional information content andis expected to be di�erent for genes with similar synthesis or decay rates.Combined clustering on these parameters separated all di�erentially regulated genes into twentykinetically distinct groups. To visualize the kinetics of these gene groups, we plotted the fold changeof individual genes in a cluster at each time point in a two dimensional space comparing nascentmRNA against total mRNA (Figure 16a) and decay rates against synthesis rates (Figure 16b).This visualization demonstrates a rich and previously unknown diversity of ecdysone induced geneexpression dynamics. The temporal progression of changes in nascent and total mRNA expressiondemonstrates that immediately after ecdysone treatment the �rst genes start to exhibit di�erentialexpression, primarily in nascent mRNA (Figure 16a; Clusters 2, 3, 12 ,13). Over time and particularlyafter 12 hours, all clusters show changes in nascent and total mRNA emphasizing ecdysone's impacton the total transcriptome. When we compared decay and synthesis rates, we observed that moreclusters start to diverge within the �rst two hours and that this divergence increased even more overtime (Figure 16b).To better understand the distinctiveness of the cluster kinetics, we calculated the mean expressionor rate fold change at individual time points for each cluster. These mean fold changes then de�nedcoordinates for a trajectory of each cluster (trajectory start: 1 hour; end: 12 hours; Figure 16c,d).Strikingly, each cluster is characterized by a unique combination of e�ect strength (fold change) and
50
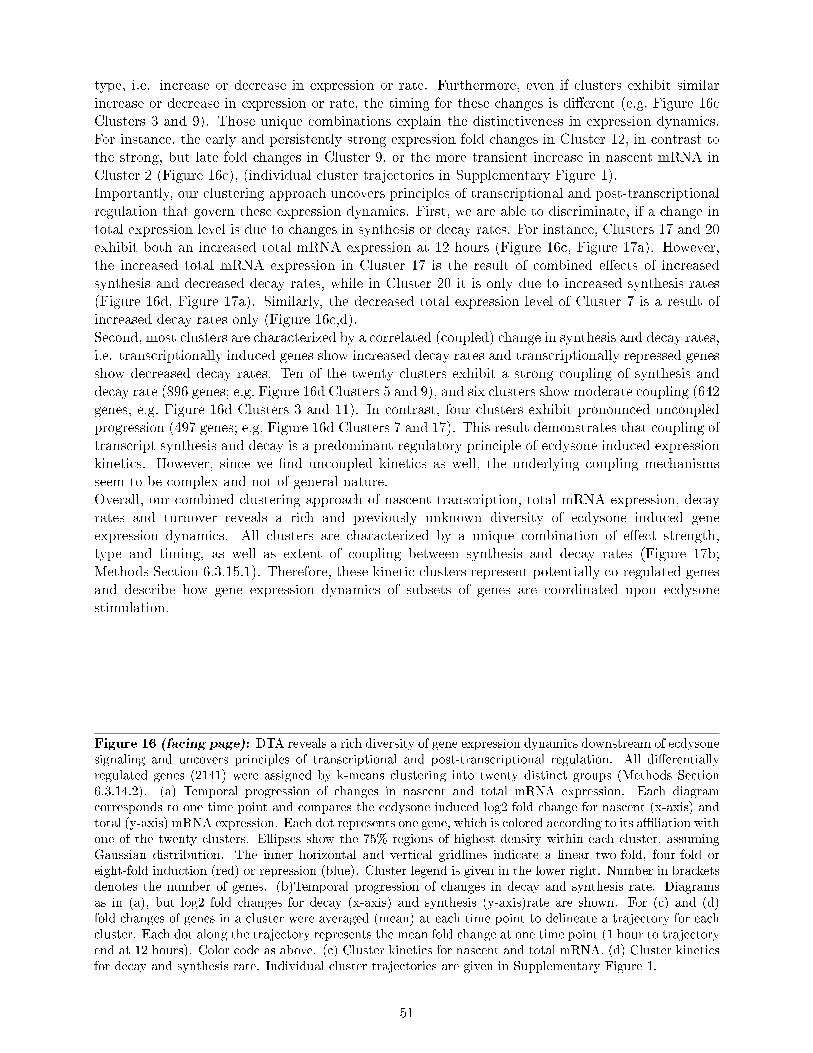
type, i.e. increase or decrease in expression or rate. Furthermore, even if clusters exhibit similarincrease or decrease in expression or rate, the timing for these changes is di�erent (e.g. Figure 16cClusters 3 and 9). Those unique combinations explain the distinctiveness in expression dynamics.For instance, the early and persistently strong expression fold changes in Cluster 12, in contrast tothe strong, but late fold changes in Cluster 9, or the more transient increase in nascent mRNA inCluster 2 (Figure 16c), (individual cluster trajectories in Supplementary Figure 1).Importantly, our clustering approach uncovers principles of transcriptional and post-transcriptionalregulation that govern these expression dynamics. First, we are able to discriminate, if a change intotal expression level is due to changes in synthesis or decay rates. For instance, Clusters 17 and 20exhibit both an increased total mRNA expression at 12 hours (Figure 16c, Figure 17a). However,the increased total mRNA expression in Cluster 17 is the result of combined e�ects of increasedsynthesis and decreased decay rates, while in Cluster 20 it is only due to increased synthesis rates(Figure 16d, Figure 17a). Similarly, the decreased total expression level of Cluster 7 is a result ofincreased decay rates only (Figure 16c,d).Second, most clusters are characterized by a correlated (coupled) change in synthesis and decay rates,i.e. transcriptionally induced genes show increased decay rates and transcriptionally repressed genesshow decreased decay rates. Ten of the twenty clusters exhibit a strong coupling of synthesis anddecay rate (896 genes; e.g. Figure 16d Clusters 5 and 9), and six clusters show moderate coupling (642genes, e.g. Figure 16d Clusters 3 and 11). In contrast, four clusters exhibit pronounced uncoupledprogression (497 genes; e.g. Figure 16d Clusters 7 and 17). This result demonstrates that coupling oftranscript synthesis and decay is a predominant regulatory principle of ecdysone induced expressionkinetics. However, since we �nd uncoupled kinetics as well, the underlying coupling mechanismsseem to be complex and not of general nature.Overall, our combined clustering approach of nascent transcription, total mRNA expression, decayrates and turnover reveals a rich and previously unknown diversity of ecdysone induced geneexpression dynamics. All clusters are characterized by a unique combination of e�ect strength,type and timing, as well as extent of coupling between synthesis and decay rates (Figure 17b;Methods Section 6.3.15.1). Therefore, these kinetic clusters represent potentially co-regulated genesand describe how gene expression dynamics of subsets of genes are coordinated upon ecdysonestimulation.
Figure 16 (facing page): DTA reveals a rich diversity of gene expression dynamics downstream of ecdysonesignaling and uncovers principles of transcriptional and post-transcriptional regulation. All di�erentiallyregulated genes (2141) were assigned by k-means clustering into twenty distinct groups (Methods Section6.3.14.2). (a) Temporal progression of changes in nascent and total mRNA expression. Each diagramcorresponds to one time point and compares the ecdysone induced log2 fold change for nascent (x-axis) andtotal (y-axis) mRNA expression. Each dot represents one gene, which is colored according to its a�liation withone of the twenty clusters. Ellipses show the 75% regions of highest density within each cluster, assumingGaussian distribution. The inner horizontal and vertical gridlines indicate a linear two-fold, four-fold oreight-fold induction (red) or repression (blue). Cluster legend is given in the lower right. Number in bracketsdenotes the number of genes. (b)Temporal progression of changes in decay and synthesis rate. Diagramsas in (a), but log2 fold changes for decay (x-axis) and synthesis (y-axis)rate are shown. For (c) and (d)fold changes of genes in a cluster were averaged (mean) at each time point to delineate a trajectory for eachcluster. Each dot along the trajectory represents the mean fold change at one time point (1 hour to trajectoryend at 12 hours). Color code as above. (c) Cluster kinetics for nascent and total mRNA. (d) Cluster kineticsfor decay and synthesis rate. Individual cluster trajectories are given in Supplementary Figure 1.
51

52
7.9 Ecdysone regulates genes with speci�c biological functions in a de�ned
temporal order
We have shown that the functional GO/KEGG annotation of genes with induced and repressedexpression levels explains the ecdysone induced phenotypic changes very well (Section 7.5). Havingdissected the ecdysone induced gene expression dynamics into multiple distinct kinetics of potentiallyco-regulated genes, we asked now whether we could assign speci�c biological annotations to theindividual gene clusters (Methods Section 6.3.15.3). While we could not �nd cluster speci�cfunctional enrichment upon separate k-means clustering of nascent mRNA expression/synthesisrate, total mRNA expression or decay rate (Section 7.7), the clusters of the combined clusteringare characterized by speci�c functional enrichment patterns. Eighteen out of twenty clusters showsigni�cantly enriched terms (Figure 17b, Supplementary Table 5). These enriched terms can beclassi�ed into six generic categories: response to ecdysone, gene expression, signaling, metabolism,cell cycle and di�erentiation/morphogenesis (Table 1).The comparison of a cluster's functional enrichment terms with its timing of gene expression changesreveals insights into the temporal order, in which the biological processes are regulated (Figure 17b).Strikingly, this temporal order re�ects the timing of the observed phenotypic changes (Figure 6).Clusters characterized by early, strong and sustained induction of gene expression are enriched for thecategory �response to ecdysone�. Clusters with middle and late timing of gene expression inductionor repression are enriched for the category �signaling� and �gene expression�. The category �signaling�comprises multiple signaling pathways, which are important for regulation of metabolism, cell cycleand development (Table 12). The category �gene expression� comprises rather heterogeneous termsfrom early to late steps of gene expression. Clusters with mostly middle to late timing of repressedgene expression are involved in diverse metabolic and cell cycle related processes. Interestingly,metabolic changes slightly precede cell cycle related changes. Finally, genes involved in di�erentiationand morphogenesis are predominantly found in clusters showing late changes in gene expression.Despite some overlap in timing, the temporal order of the functional annotation terms, which arerelated to the observed phenotype (exit from the cell cycle to enter di�erentiation), is: �ecdysonesignaling� - �metabolism� - �cell cycle� - �di�erentiation/morphogenesis�.To validate our functional enrichment analysis we used random sampling (Methods Section 6.3.15.3).Except for �ubiquitin mediated proteolysis� and �mitotic cell cycle�, which occurred six out of �ftytimes, none of the other terms was enriched more than �ve times. The low reoccurrence of speci�cterms emphasizes the reliability of the functional annotation. Moreover, we repeated the functionalannotation using a di�erent enrichment algorithm (topGO [1]) and obtained identical results (datanot shown).Taken together, the functional annotation of the clusters of co-regulated genes is unique, reliableand in agreement with the ecdysone induced phenotypic changes. Our analysis reveals the timingand strength at which ecdysone signaling regulates these cellular processes. Therefore, the distinctgene expression kinetics describe how ecdysone signaling directs the cell from a proliferating stateinto a di�erentiated state. The question arising from these results is: What are the transcriptionaland post-transcriptional regulatory mechanisms that underlie these gene expression kinetics?
53

Figure 17: Groups of potentially co-regulated genes are characterized by individual kinetic features andfunctional annotation. (a) Time course progression of log2 fold change (y-axis) in total mRNA (grey), nascentmRNA (yellow), synthesis rate (red), decay rate (blue) and turnover (green). Solid line represents mean foldchange and shading between error bars the standard deviation. Cluster 17 (left panels) and Cluster 20 (rightpanels) are representatively shown. All clusters in Supplementary Figure 2. (b) Each cluster is characterizedby a speci�c combination of kinetic features and functional annotation. Catalogue of features was compiledbased on mean fold change progression of measured and estimated values (Methods Section 6.3.15.1). Timingwas classi�ed as being early (E), middle (M), middle to late (M-L), late (L) and early to late (E-L), based onnascent or total mRNA expression. E�ect strength was de�ned as the maximum mean fold change on totalmRNA level: <1.5-fold (o), >1.5-fold (+), >2-fold (++) or >4-fold (+++). Increase (red) or decrease (blue)of gene expression or rate was discretized based on mean fold changes. White denotes mean fold change<1.5-fold. Coupling of synthesis and decay rates was assessed by Pearson correlation of mean fold changes:strong +++ (r >0.75), moderate ++ (r >0.50), poor + (r >0.25) and no coupling o (r <0.25). Functionalenrichment for GO �Biological Process� and KEGG terms was calculated using Fisher's exact test (p-value<0.01; Methods Section 6.3.15.3). Enriched terms were manually classi�ed in six generic categories andrepresented by the summarized degree of over-representation (number of expected genes in a term comparedto number of observed genes). Individual terms are listed in Table 12 and Supplementary Figure 3.
54
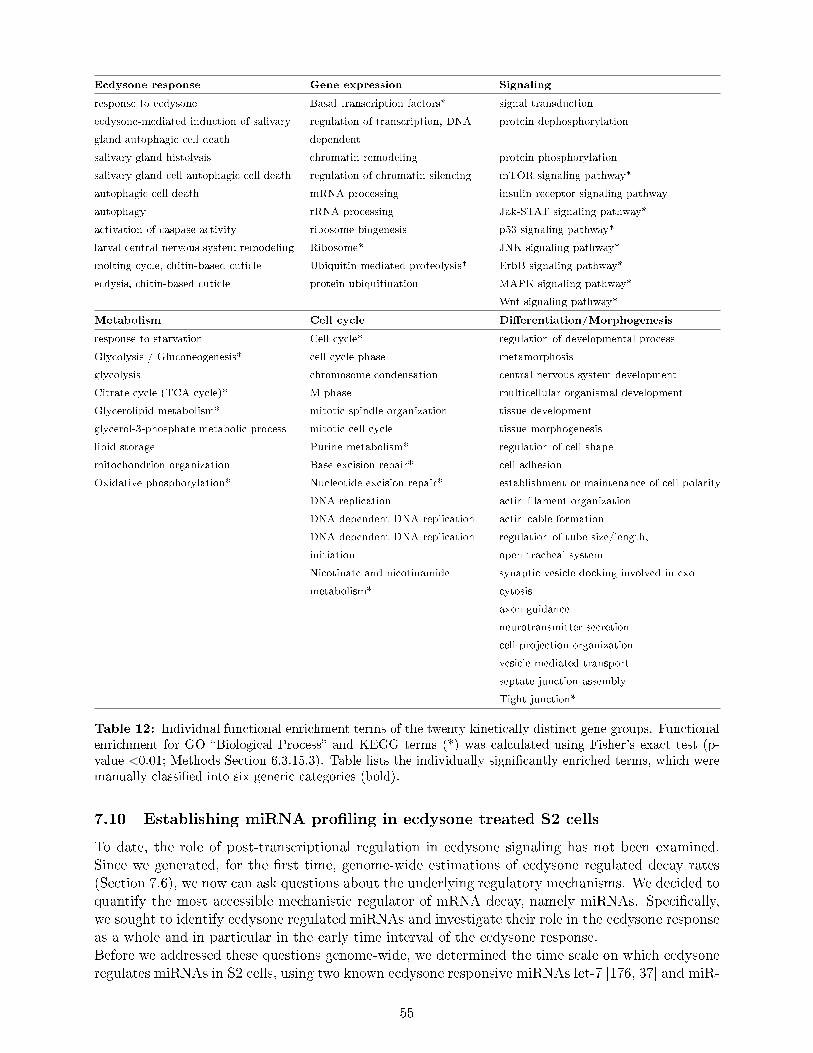
Ecdysone response Gene expression Signaling
response to ecdysone Basal transcription factors* signal transduction
ecdysone-mediated induction of salivary
gland autophagic cell death
regulation of transcription, DNA
dependent
protein dephosphorylation
salivary gland histolysis chromatin remodeling protein phosphorylation
salivary gland cell autophagic cell death regulation of chromatin silencing mTOR signaling pathway*
autophagic cell death mRNA processing insulin receptor signaling pathway
autophagy rRNA processing Jak-STAT signaling pathway*
activation of caspase activity ribosome biogenesis p53 signaling pathway*
larval central nervous system remodeling Ribosome* JNK signaling pathway*
molting cycle, chitin-based cuticle Ubiquitin mediated proteolysis* ErbB signaling pathway*
ecdysis, chitin-based cuticle protein ubiquitination MAPK signaling pathway*
Wnt signaling pathway*
Metabolism Cell cycle Di�erentiation/Morphogenesis
response to starvation Cell cycle* regulation of developmental process
Glycolysis / Gluconeogenesis* cell cycle phase metamorphosis
glycolysis chromosome condensation central nervous system development
Citrate cycle (TCA cycle)* M phase multicellular organismal development
Glycerolipid metabolism* mitotic spindle organization tissue development
glycerol-3-phosphate metabolic process mitotic cell cycle tissue morphogenesis
lipid storage Purine metabolism* regulation of cell shape
mitochondrion organization Base excision repair* cell adhesion
Oxidative phosphorylation* Nucleotide excision repair* establishment or maintenance of cell polarity
DNA replication actin �lament organization
DNA-dependent DNA replication actin cable formation
DNA-dependent DNA replication
initiation
regulation of tube size/length,
open tracheal system
Nicotinate and nicotinamide
metabolism*
synaptic vesicle docking involved in exo-
cytosis
axon guidance
neurotransmitter secretion
cell projection organization
vesicle-mediated transport
septate junction assembly
Tight junction*
Table 12: Individual functional enrichment terms of the twenty kinetically distinct gene groups. Functionalenrichment for GO �Biological Process� and KEGG terms (*) was calculated using Fisher's exact test (p-value <0.01; Methods Section 6.3.15.3). Table lists the individually signi�cantly enriched terms, which weremanually classi�ed into six generic categories (bold).
7.10 Establishing miRNA pro�ling in ecdysone treated S2 cells
To date, the role of post-transcriptional regulation in ecdysone signaling has not been examined.Since we generated, for the �rst time, genome-wide estimations of ecdysone regulated decay rates(Section 7.6), we now can ask questions about the underlying regulatory mechanisms. We decided toquantify the most accessible mechanistic regulator of mRNA decay, namely miRNAs. Speci�cally,we sought to identify ecdysone regulated miRNAs and investigate their role in the ecdysone responseas a whole and in particular in the early time interval of the ecdysone response.Before we addressed these questions genome-wide, we determined the time scale on which ecdysoneregulates miRNAs in S2 cells, using two known ecdysone responsive miRNAs let-7 [176, 37] and miR-
55
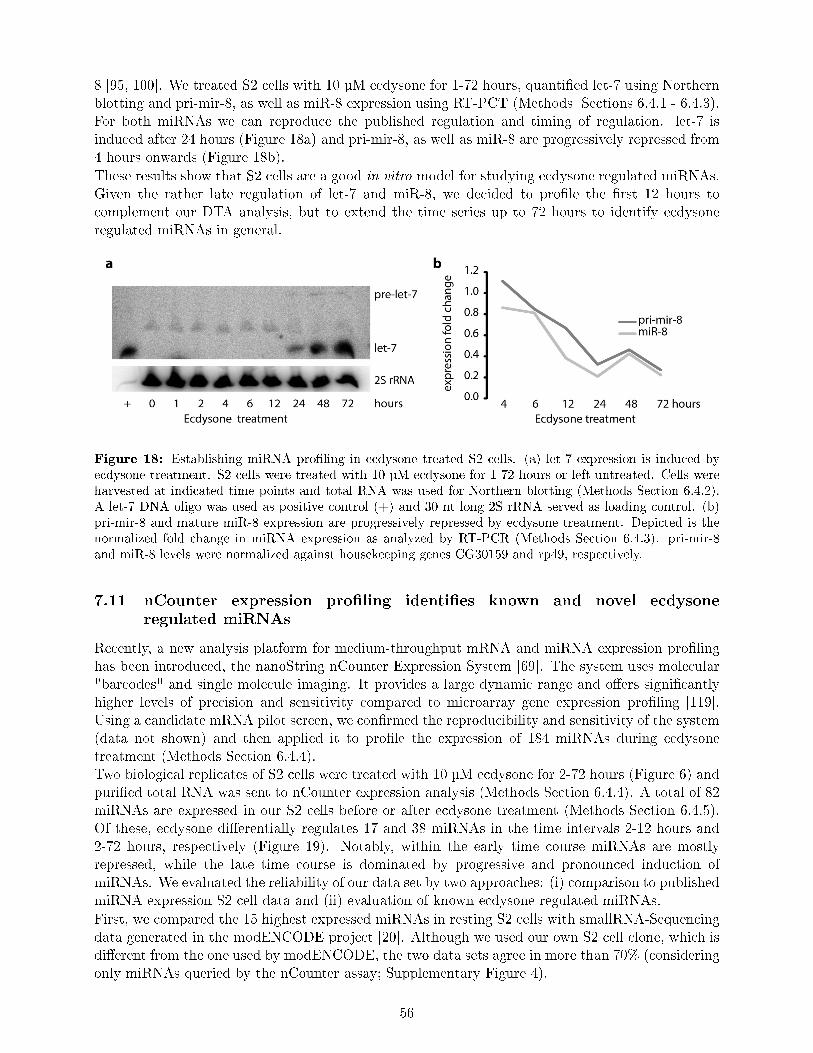
8 [95, 100]. We treated S2 cells with 10 µM ecdysone for 1-72 hours, quanti�ed let-7 using Northernblotting and pri-mir-8, as well as miR-8 expression using RT-PCT (Methods Sections 6.4.1 - 6.4.3).For both miRNAs we can reproduce the published regulation and timing of regulation. let-7 isinduced after 24 hours (Figure 18a) and pri-mir-8, as well as miR-8 are progressively repressed from4 hours onwards (Figure 18b).These results show that S2 cells are a good in vitro model for studying ecdysone regulated miRNAs.Given the rather late regulation of let-7 and miR-8, we decided to pro�le the �rst 12 hours tocomplement our DTA analysis, but to extend the time series up to 72 hours to identify ecdysoneregulated miRNAs in general.
Figure 18: Establishing miRNA pro�ling in ecdysone treated S2 cells. (a) let-7 expression is induced byecdysone treatment. S2 cells were treated with 10 µM ecdysone for 1-72 hours or left untreated. Cells wereharvested at indicated time points and total RNA was used for Northern blotting (Methods Section 6.4.2).A let-7 DNA oligo was used as positive control (+) and 30 nt long 2S rRNA served as loading control. (b)pri-mir-8 and mature miR-8 expression are progressively repressed by ecdysone treatment. Depicted is thenormalized fold change in miRNA expression as analyzed by RT-PCR (Methods Section 6.4.3). pri-mir-8and miR-8 levels were normalized against housekeeping genes CG30159 and rp49, respectively.
7.11 nCounter expression pro�ling identi�es known and novel ecdysone
regulated miRNAs
Recently, a new analysis platform for medium-throughput mRNA and miRNA expression pro�linghas been introduced, the nanoString nCounter Expression System [69]. The system uses molecular"barcodes" and single molecule imaging. It provides a large dynamic range and o�ers signi�cantlyhigher levels of precision and sensitivity compared to microarray gene expression pro�ling [119].Using a candidate mRNA pilot screen, we con�rmed the reproducibility and sensitivity of the system(data not shown) and then applied it to pro�le the expression of 184 miRNAs during ecdysonetreatment (Methods Section 6.4.4).Two biological replicates of S2 cells were treated with 10 µM ecdysone for 2-72 hours (Figure 6) andpuri�ed total RNA was sent to nCounter expression analysis (Methods Section 6.4.4). A total of 82miRNAs are expressed in our S2 cells before or after ecdysone treatment (Methods Section 6.4.5).Of these, ecdysone di�erentially regulates 17 and 38 miRNAs in the time intervals 2-12 hours and2-72 hours, respectively (Figure 19). Notably, within the early time course miRNAs are mostlyrepressed, while the late time course is dominated by progressive and pronounced induction ofmiRNAs. We evaluated the reliability of our data set by two approaches: (i) comparison to publishedmiRNA expression S2 cell data and (ii) evaluation of known ecdysone regulated miRNAs.First, we compared the 15 highest expressed miRNAs in resting S2 cells with smallRNA-Sequencingdata generated in the modENCODE project [20]. Although we used our own S2 cell clone, which isdi�erent from the one used by modENCODE, the two data sets agree in more than 70% (consideringonly miRNAs queried by the nCounter assay; Supplementary Figure 4).
56
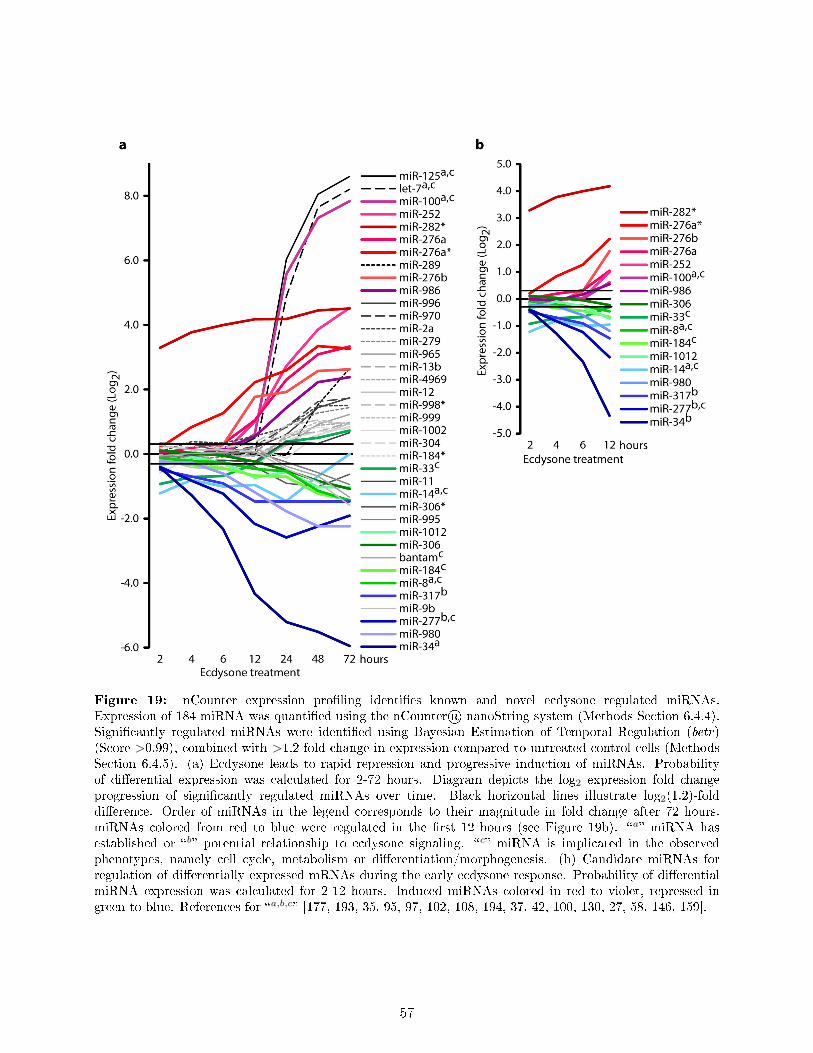
Figure 19: nCounter expression pro�ling identi�es known and novel ecdysone regulated miRNAs.Expression of 184 miRNA was quanti�ed using the nCounter® nanoString system (Methods Section 6.4.4).Signi�cantly regulated miRNAs were identi�ed using Bayesian Estimation of Temporal Regulation (betr)(Score >0.99), combined with >1.2-fold change in expression compared to untreated control cells (MethodsSection 6.4.5). (a) Ecdysone leads to rapid repression and progressive induction of miRNAs. Probabilityof di�erential expression was calculated for 2-72 hours. Diagram depicts the log2 expression fold changeprogression of signi�cantly regulated miRNAs over time. Black horizontal lines illustrate log2(1.2)-folddi�erence. Order of miRNAs in the legend corresponds to their magnitude in fold change after 72 hours.miRNAs colored from red to blue were regulated in the �rst 12 hours (see Figure 19b). �a� miRNA hasestablished or �b� potential relationship to ecdysone signaling. �c� miRNA is implicated in the observedphenotypes, namely cell cycle, metabolism or di�erentiation/morphogenesis. (b) Candidate miRNAs forregulation of di�erentially expressed mRNAs during the early ecdysone response. Probability of di�erentialmiRNA expression was calculated for 2-12 hours. Induced miRNAs colored in red to violet, repressed ingreen to blue. References for �a,b,c� [177, 193, 35, 95, 97, 102, 108, 194, 37, 42, 100, 130, 27, 58, 146, 159].
57

Next, we searched for known ecdysone regulated miRNAs in our data set (2-72 hours). As expected,let-7 is not expressed in untreated cells or within the �rst 12 hours of ecdysone treatment, but isstrongly induced later on (Figure 19a). miR-100 and miR-125, which are processed from the sameprecursor as let-7 (Let-7-C) and are also known to be induced by ecdysone [177], accompany the let-7induction in timing and strength. miR-14 and its validated target EcR compose a auto-regulatoryfeedback loop, in which miR-14 modulates EcR expression and EcR limits miR-14 expression [193].Not surprisingly, miR-14's repression �uctuates around two-fold and recoveres to basal levels at72 hours, which coincides with decreased EcR protein levels (Figures 19a, 8d). Finally, we also �ndmiR-8 to be down-regulated (Figure 19a).Thus, by treating S2 cells with ecdysone, we recovered all known ecdysone regulated miRNAs(Figure 19a �a�). In addition, we identi�ed six miRNAs, which have a potential relation toecdysone signaling (Figure 19a �b�) or one of the phenotypic processes regulated by ecdysone,namely cell cycle, metabolism or di�erentiation/morphogenesis (Figure 19a �c�). All other ecdysoneregulated miRNAs (26) have no established function in these processes or are even missing anyfunctional characterization in Drosophila. Therefore, our dataset represents an excellent resource toreveal the function of these miRNAs in ecdysone signaling, proliferation, cell cycle, metabolism ordi�erentiation/morphogenesis.
7.12 Potential roles of miRNAs in the ecdysone response of S2 cells
Our data set on miRNA expression demonstrates a great di�erence in the miRNA transcriptomeof proliferating compared to di�erentiated cells. To evaluate potential roles of ecdysone regulatedmiRNAs in the ecdysone response we compared the miRNA expression dynamics (Figure 19a) withthe temporal order of both the phenotypic changes (Figure 6) and functional annotations of thekinetic clusters (Figure 17b).The earliest and strongest repressed miRNAs are miR-34, miR-277 and miR-317 (Figure 19b),which are encoded by the same genomic locus [102]. Given that the earliest functional annotationcategories are �ecdysone signaling� and �metabolism� (Figure 6) and the earliest observed phenotypeis the decline in proliferation rate (Figure 7a), these miRNAs might be important for these processes.This assumption �nds support in the literature. miR-34 is known to regulate Eip74EF [130], one ofthe key regulators of the ecdysone cascade, miR-277 has a well-established role in metabolism [58]and miR-317 targets CycB [159], a crucial regulator of mitosis. The early and strong inductionof the so far uncharacterized miR-282* and miR-276a* (Figure 19b) suggests a potential role ofthese miRNAs in the early biological processes as well. While the rather late kinetics of the inducedmiRNAs of the let-7 locus (Figure 19a) indicates a role in the later phenotypic changes related to cellcycle exit or di�erentiation. These miRNAs have been reported to be important for the appropriatestage speci�c morphologies during the larval-to-pupal transition and genetic elimination of let-7 andmiR-125 leads to a delay in cell-cycle exit [35]. Based on the coinciding kinetics of miRNAs andecdysone phenotypic changes as well as the known functions of some miRNAs, the di�erentiallyregulated miRNAs may be important for di�erent aspects of the ecdysone response.These correlations are corroborated by a preliminary validation experiment using RNAi mediatedexpression knockdown of Ago1. During the knockdown S2 cells cease proliferation, but recoverafter a few days and resume proliferation when RNAi knockdown e�ciency has declined (data notshown). In contrast, ecdysone treated Ago1 knockdown cells do not resume proliferation, but exhibitdecreased viability and undergo cell death. This result demonstrates the crucial role of miRNAs inthe ecdysone response. The severe decrease in proliferation of untreated cells in Ago1 knockdowncondition mimics the ecdysone induced stop in proliferation. Hence, the miRNAs that are repressedby ecdysone may indeed be essential for proliferation, and their repression crucial for the ecdysoneinduced stop in proliferation. Moreover, as S2 cells undergo cell death in Ago1 knockdown conditions,miRNAs might be crucial for the speci�cation of the ecdysone response, namely di�erentiation or
58
cell death.
7.13 Novel decay rate-based approach for miRNA-mRNA network analysis
To investigate the role of miRNAs in the ecdysone response, we used computational network analysisto identify target genes of those miRNAs. Speci�cally, we sought to identify the role of miRNAs asregulators of the mRNA kinetics within the �rst 12 hours of the ecdysone response (Figure 6). Tothis end, we took advantage of the estimated mRNA decay rates and developed a novel approachfor network analysis based on correlation of miRNA expression and mRNA decay rates.miRNA-mRNA interaction networks are typically based on candidate lists of computationallypredicted miRNA targets, which can be reduced to the most promising candidates by correlatingmiRNA and mRNA expression [150]. Most studies assume that changes in miRNA expressioncause inverse changes in mRNA expression, i.e. increased miRNA expression leads to decreasedmRNA expression due to miRNA mediated mRNA degradation (or decreased miRNA expressionleads to increased mRNA expression). However, this �expression-based� approach evaluates theactivity of miRNAs based on a composite e�ect, since changes of mRNA expression levels underliethe contribution of both mRNA synthesis and decay. Although miRNAs can directly impact thedecay rate of their targets, it is unknown to which extent this particular increase or decrease indecay rate a�ects mRNA expression levels. Furthermore, we and others [144] found that di�erentialmRNA expression levels strongly correlate with mRNA synthesis (Pearson correlation 0.9, data notshown) and not with mRNA decay rates (Pearson correlation −0.13, data not shown). Since mostexpression-based approaches demand the inverse correlation of miRNA and mRNA expression levelsbased on miRNA-mediated decay, they ignore the impact of mRNA synthesis on mRNA expression.Consequently, expression-based miRNA-mRNA networks may su�er from a high false-positive rate.To overcome this limitation, we established a novel approach to infer miRNA-mRNA networks usingthree sources of information, namely miRNA expression, mRNA decay rates and mRNA expressionlevels (Figure 20a). We �rst retrieved mRNA target predictions for the signi�cantly regulatedmiRNAs of the early time course using the miRanda algorithm [22](Methods Section 6.4.6). ThemiRanda algorithm is a widely used and comprehensive target prediction algorithm. Importantly, ittolerates mismatches in the seed sequence and takes the binding energy of the miRNA-target duplexinto account. Of the miRanda predicted targets we considered only targets which show signi�cantlyregulated decay rates at any time point within 2-12 hours (fold change >1.5, p-value <0.01; MethodsSection 6.3.12).To correlate miRNA expression kinetics to the mRNA decay rates, we used a simple, but strictmatching criterion based on discrete time series patterns of miRNA expression and mRNA decayrate fold changes. Since we investigated a narrow time interval, we reasoned, if a miRNA regulatesan mRNA the miRNA expression pattern correlates with the mRNA decay pattern over time,i.e. increased miRNA expression leads to increased mRNA decay rates (or decreased miRNAexpression leads to decreased mRNA decay rates). In other words, we took advantage of informationthat was �encoded� in the expression/decay pattern over time. In addition, we allowed onetime shift to account for both a probable time lag between miRNA expression and its e�ect ondecay rates, as well as for lower sensitivity of microarray measurements compared to nCountermeasurements [119]. Target interactions with correlated miRNA expression and mRNA decay werecalled �valid� interactions. Finally, we used mRNA expression data to �lter for miRNA-mRNAinteractions in which mRNA expression levels were signi�cantly changed, i.e. �reliable� interactions(mRNA expression change >1.5-fold, p-value <0.01; Methods Section 6.3.12).We called this approach �decay rate-based� network analysis (Figure 20a, Methods Section 6.4.7).The advantage of our novel decay rate-based approach as opposed to expression-based approachesis that mRNA decay rates represent a more direct readout of miRNA activity compared to mRNAexpression levels which are a composite readout.
59
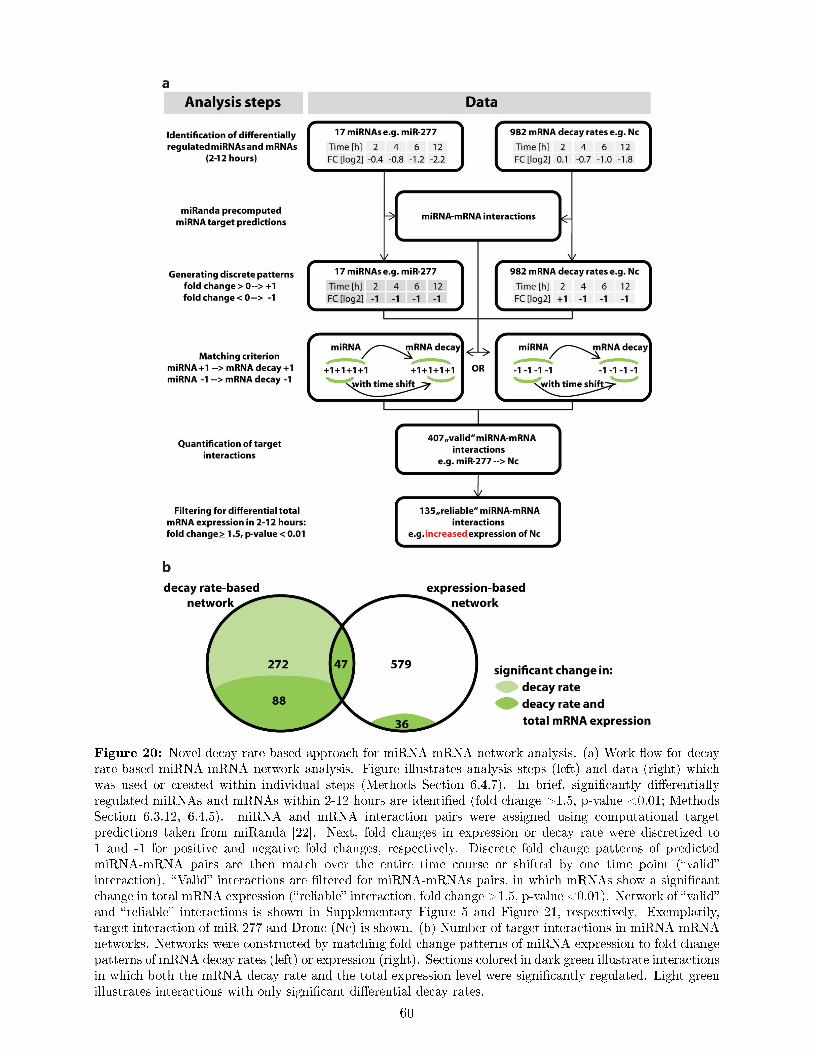
Figure 20: Novel decay rate-based approach for miRNA-mRNA network analysis. (a) Work �ow for decayrate-based miRNA-mRNA network analysis. Figure illustrates analysis steps (left) and data (right) whichwas used or created within individual steps (Methods Section 6.4.7). In brief, signi�cantly di�erentiallyregulated miRNAs and mRNAs within 2-12 hours are identi�ed (fold change >1.5, p-value <0.01; MethodsSection 6.3.12, 6.4.5). miRNA and mRNA interaction pairs were assigned using computational targetpredictions taken from miRanda [22]. Next, fold changes in expression or decay rate were discretized to1 and -1 for positive and negative fold changes, respectively. Discrete fold change patterns of predictedmiRNA-mRNA pairs are then match over the entire time course or shifted by one time point (�valid�interaction). �Valid� interactions are �ltered for miRNA-mRNAs pairs, in which mRNAs show a signi�cantchange in total mRNA expression (�reliable� interaction, fold change >1.5, p-value <0.01). Network of �valid�and �reliable� interactions is shown in Supplementary Figure 5 and Figure 21, respectively. Exemplarily,target interaction of miR-277 and Dronc (Nc) is shown. (b) Number of target interactions in miRNA-mRNAnetworks. Networks were constructed by matching fold change patterns of miRNA expression to fold changepatterns of mRNA decay rates (left) or expression (right). Sections colored in dark green illustrate interactionsin which both the mRNA decay rate and the total expression level were signi�cantly regulated. Light greenillustrates interactions with only signi�cant di�erential decay rates.
60

7.14 The miRNA-mRNA networks during the ecdysone response
The network analysis using our decay rate-based miRNA-mRNA matching approach identi�ed 135�reliable� interactions (Figure 21; for the 407 �valid� interactions see Supplementary Figure 5).
To compare our novel approach to the conventional expression-based approach, we constructed amiRNA-mRNA network based on matching discrete miRNA and mRNA expression fold changepatterns (Methods Section 6.4.7). This expression-based network is 40% larger compared toour decay rate-based network (data not shown). However, in only 12% of all expression-basedinteractions mRNAs show signi�cantly altered decay rates (fold change >1.5, p-value <0.01; MethodsSection 6.3.12). Thus, 88% of di�erential mRNA expression could not be associated with mRNAdecay, and is due to transcriptional regulation. Consequently, the overlap between these networksis rather poor (Figure 20b, Figure 21). These results show the advantage of our decay rate-basednetwork as direct readout of miRNA activity compared to the expression-based network, whichrepresents a composite readout.The network of repressed miRNAs (Figure 21a) comprises more target interactions compared tothe network of induced miRNAs (Figure 21b). This is reasonable, since the number of repressedmiRNAs showing an early and pronounced fold change in expression is larger compared to inducedmiRNAs (Figure 19b). The largest fraction of genes within the network of repressed miRNAs isregulated by miR-8, miR-277, miR-317 and miR-34 (Figure 21a, Table 13). Importantly, multiplegenes are co-regulated by these miRNAs. This result is supported by the known cell growthpromoting functions of miR-8 and miR-277. miR-8 promotes insulin signaling, which antagonizesecdysone signaling [100] and miR-277 has been reported to control branched-chain amino acid(BCAA) catabolism and consequently can modulate the activity of the TOR kinase, a central growthregulator [58].
Interestingly, the target genes of repressed miRNAs fall into two classes. While all of their targetgenes have decreased decay rates, 36% show an induced and 64% a repressed expression levelduring ecdysone treatment (Table 13). Many genes with induced expression levels are important forprocesses related to di�erentiation (e.g. pck, lama and bif [157, 167, 19]), while genes with repressedexpression levels are for instance implicated in metabolism (e.g. Got2, Zw and Adk2 [34, 153, 143]).Obviously, target genes with induced expression are implicated in processes that are up-regulatedby ecdysone, e.g. di�erentiation. The same holds true for repressed gene expression levels anddown-regulated processes, e.g. metabolism.
Within the network of induced miRNAs the largest fraction of genes was regulated by miR-276a*,miR-276a, miR-282* and miR-252 (Figure 21b, Table 13). Except for mir-252, which is the mosthighly expressed miRNA in the adult �y and required for proper muscle development [139], noneof these miRNAs has an established function. Furthermore, none has been shown to be regulatedby ecdysone. Interestingly, miR-282* targets tai, which is a known co-factor for EcR [13]. Fortarget genes of induced miRNAs we observed the same subdivision as for target genes of repressedmiRNAs (Table 13). 44% of genes with increased decay rates show increased expression levels,while 56% have repressed expression levels. In the cases of increased expression levels many of thesegenes regulate processes important for di�erentiation (e.g. NijA, mbc, Ama and tai [13, 205, 202,83]), while repressed genes mainly regulate metabolism or cell cycle (e.g. Alr, mei-38, Nmnat, r-l,Cdk7 [121, 133, 204, 197, 78]).
These results emphasize a second advantage of our decay rate-based network approach as it canrecover two classes of miRNA-mRNA target interactions. In one class, miRNA-mediated decayhas a determining impact on the mRNA expression level. In the other, miRNAs modulatethe mRNA expression level that is determined by mRNA synthesis. The speci�c outcomedepends on the biological context of the mRNA target. The function of miRNAs in theseinteractions is a combination of several accepted mechanistic principles (Section 1.2.2.3), includingreinforcing the ecdysone induced transcriptional program, attenuating transcripts that were speci�c
61
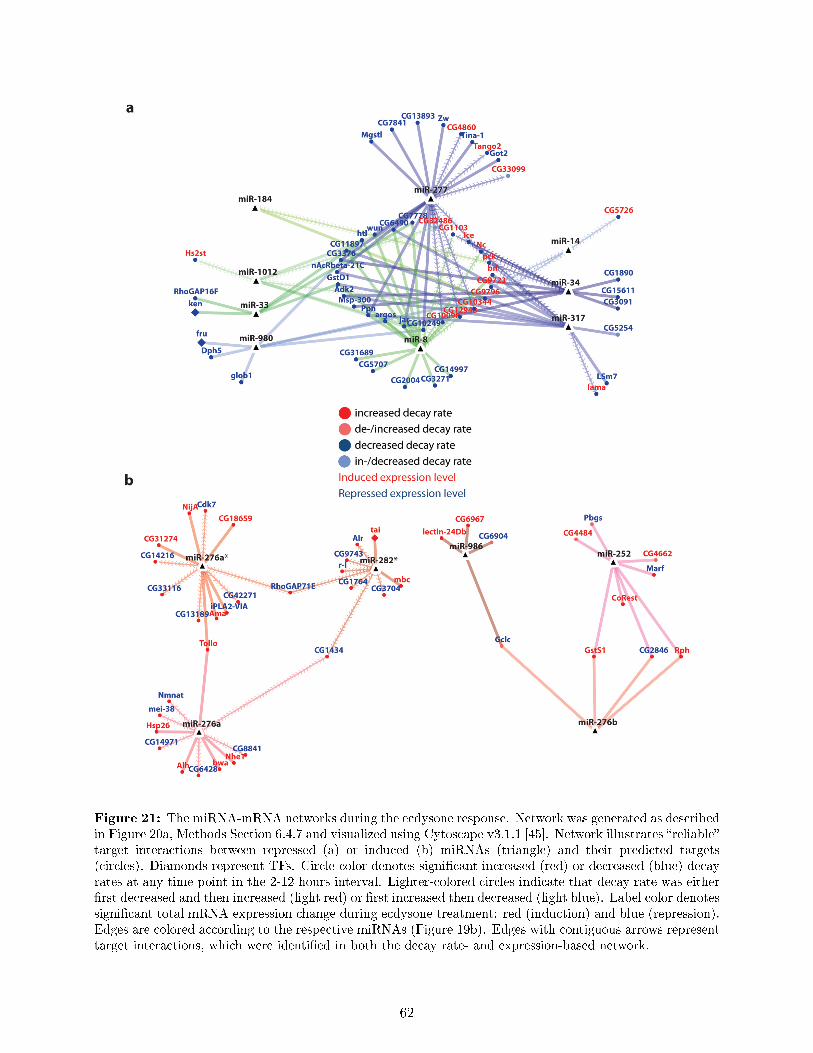
Figure 21: The miRNA-mRNA networks during the ecdysone response. Network was generated as describedin Figure 20a, Methods Section 6.4.7 and visualized using Cytoscape v3.1.1 [45]. Network illustrates �reliable�target interactions between repressed (a) or induced (b) miRNAs (triangle) and their predicted targets(circles). Diamonds represent TFs. Circle color denotes signi�cant increased (red) or decreased (blue) decayrates at any time point in the 2-12 hours interval. Lighter-colored circles indicate that decay rate was either�rst decreased and then increased (light red) or �rst increased then decreased (light blue). Label color denotessigni�cant total mRNA expression change during ecdysone treatment: red (induction) and blue (repression).Edges are colored according to the respective miRNAs (Figure 19b). Edges with contiguous arrows representtarget interactions, which were identi�ed in both the decay rate- and expression-based network.
62

Repressed
miRNAs
Number of
target genes
Induced
expression
Repressed
expression
Induced
miRNAs
Number of
target genes
Induced
expression
Repressed
expression
miR-277 21 8 13 miR-276a* 12 5 7
miR-8 19 5 14 miR-276a 11 5 6
miR-317 13 5 8 miR-282* 9 2 7
miR-34 11 4 7 miR-252 8 5 3
miR-980 7 1 6 miR-276b 4 2 2
miR-1012 6 3 3 miR-986 4 2 2
miR-33 5 - 5 miR-100 - - -
miR-14 3 3 -
miR-184 2 2 -
miR-306 - - -
Sum 87 31 56 Sum 48 21 27
[%] 100 36 64 [%] 100 44 56
Table 13: Summary of miRNA-mRNA networks during the ecdysone response. Listed are repressed (left)and induced (right) miRNAs and number of their targets based on matching miRNA expression and mRNAdecay rates (Methods Section 6.4.7). Total number of targets includes only targets, whose expression levelwas either signi�cantly induced or repressed at any time point in the 2-12 hours interval (�reliable� network).
to the proliferative cell state, stabilizing the new/di�erentiated cell state or having stabilized theold/proliferative state.Overall, the obtained miRNA-mRNA network comprises known ecdysone regulated miRNAs andthe functions of a large fraction of target genes agree with the ecdysone induced phenotypic changes.Thus, our network presents a promising candidate list for both the validation of our decay rate-basednetwork approach and for unraveling the role of these miRNA-mRNA interactions in ecdysonesignaling and its regulated biological processes.
7.15 TFs, miRNA-mRNA interactions and RBPs indicate underlying regulatory
mechanisms of ecdysone induced gene expression kinetics
We have shown that ecdysone and its early signaling cascade induce distinct gene expression kineticsin a wide range of functionally diverse genes (Figure 17b). We sought to identify the transcriptionaland post-transcriptional regulatory mechanisms that govern these distinct kinetics. To gain �rstinsights we used network analysis to investigate the impact of miRNAs. To associate the obtainedmiRNA-mRNA interactions with the speci�c cluster kinetics, we quanti�ed the number of miRNA-mRNA interactions that occurred in each cluster. Although miRNAs target only a minor fraction ofgenes in the clusters, we identi�ed speci�c clusters that are targeted by multiple miRNAs (Figure 22).Clusters 4, 13 and 17 are targeted by repressed miRNAs (Figure 23a), while Clusters 7, 9 and 19 aretargeted by induced miRNAs (Figure 23b). This result indicates that during the ecdysone responsegene expression regulation by miRNA mediated decay seems to be a rather gene speci�c than a globalregulatory mechanism. However, the speci�c regulation of key regulatory gene might be crucial asfor instance miR-282* targets the EcR cofactor tai [13].To further investigate the post-transcriptional regulation of these kinetics we evaluated the 5´and 3´ UTR of the cluster genes. Longer UTR have a higher probability to contain structuralor sequence motifs that are recognized by miRNAs or RBPs. Several clusters have signi�cantlydi�erent UTR lengths compared to the average of all clusters (Figure 22, Supplementary Figure 3,Methods Section 6.3.15.2). In this fairly unspeci�c analysis the length distribution is not associatedwith the number of miRNA-mRNA target interactions.Given the poor availability of experimentally identi�ed RBP targets in Drosophila, we were unable to
63
investigate the regulatory impact of RBPs on a global scale. Nevertheless, we used available data ontwo ecdysone induced RBPs. Pumilio shows an increased expression level at 12 hours and is knownfor its role in translational repression and mRNA degradation [71]. Pumilio regulates a signi�cantlyenriched number of targets in the Cluster 7 (Methods Section 6.3.15.3), which is characterized bylate increase of decay rates and down-regulated expression levels (Figure 22). The second RBP isthe translational repressor brat [132], which is strongly induced throughout the entire time courseand targets genes with similar induction kinetic in Cluster 3 (Figure 22). Encouraged from theseresults we used the RBP Database (v3.1 Sep 2012, [47]) to identify further ecdysone regulated RBPsand found 23 induced and 16 repressed RBPs. According to their expression kinetics most RBPsa�liate with late clusters (Figure 22) indicating that during the ecdysone response gene expressionregulation by RBPs is a mechanism to regulate the late response genes of the ecdysone cascade.To gain �rst insights into the transcriptional regulation, we evaluated the distribution of the 39ecdysone regulated TFs, for which experimentally determined PWMs were available [206]. We founda speci�c distribution in early and late clusters, which agrees with the well-established function ofthese TFs either in ecdysone signaling or the biological processes of the observed phenotype. Forinstance, the key TFs of the early ecdysone cascade (EcR, br, Eip74EF, Eip75B, Hr39) belong toearly and strongly induced clusters such as Clusters 2, 3 or 12 (Figure 22). TFs that are involved inmetabolism or di�erentiation/morphogenesis are found in �late� clusters.These results have signi�cant impact. It is expected from developmental studies that the early keyTFs of the ecdysone cascade have early and similar kinetics [8, 93]. Since in our clustering theseTFs accumulate in clusters that are characterized by early, strong and sustained gene expressioninduction, this result validates the reliability of our clustering approach. Thus, DTA reliably dissectsgenes expression dynamics during ecdysone signaling. Second, the early, strong and sustainedinduction strongly suggests that these TFs are the key regulators of the gene expression kineticsin later cluster. Importantly, as other TFs and also RBPs exhibit the same kinetics as those keyregulators, the clustering provides evidence that the TFs foxo, Sox14 and schlank as well as the RBPslin-28 and brat are novel key regulators of ecdysone induced genes expression kinetics. Finally, sincethe translational repressor Brat targets the TFs Eip74EF and Eip75B our results indicate howtranslational regulation is generally integrated into the ecdysone response and in particular duringthis early stage.In summary, the analysis of ecdysone regulated TFs, RBPs and miRNAs provides �rst insights intothe transcriptional and post-transcriptional regulation of ecdysone induced gene expression kinetics.
64

Figure 22: Transcriptional and post-transcriptional regulators of ecdysone induced gene expression kinetics.Catalogue of kinetic features and functional annotation was compiled as in Figure 17b. TFs and RBPs areshown in the cluster they were assigned to by k-means clustering (Section 7.8). Individual microarray probesets are shown. Average 5´ or 3´ UTR length of each cluster was compared to average 5` and 3` UTR lengthof all clusters (Methods Section 6.3.15.2). Red and blue denote signi�cant 25% longer or shorter UTR,respectively (Wilcoxon Rank Sum test; p-value <0.01). Degree of signi�cant over-presentation for RBPtargets was calculated: number of expected genes compared to number of observed genes (Fisher's exact test;p-value <0.01), (Methods Section 6.3.15.3). miRNA-mRNA target interactions are taken from Section 7.14.Data sources: Pumilio [71] and Brat (G. Meister unpublished data).
65
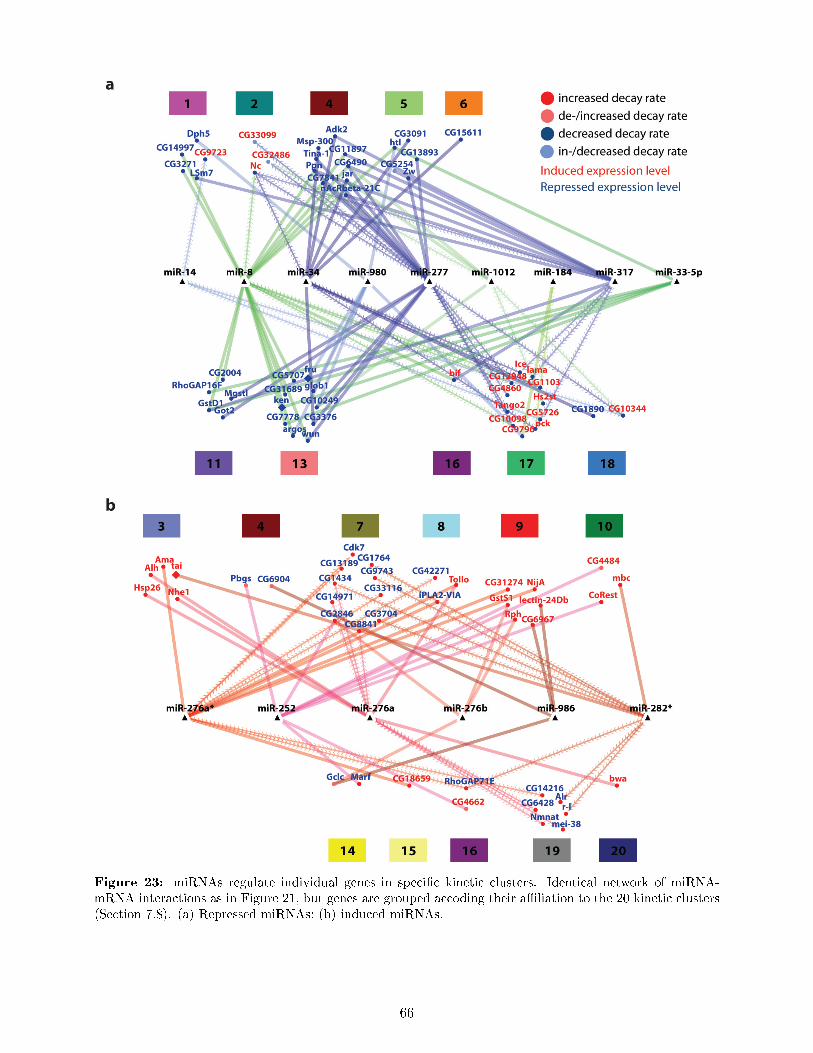
Figure 23: miRNAs regulate individual genes in speci�c kinetic clusters. Identical network of miRNA-mRNA interactions as in Figure 21, but genes are grouped accoding their a�liation to the 20 kinetic clusters(Section 7.8). (a) Repressed miRNAs; (b) induced miRNAs.
66
8 Summary and Discussion
Regulation of gene expression is the fundamental process governing both the development and adulthomeostasis of all organisms. In this thesis, I applied Dynamic Transcriptome Analysis (DTA) todissect the regulation of gene expression during ecdysone signaling at the level of mRNA synthesisand decay. By combining the improved temporal resolution of DTA and its simultaneous assessmentof mRNA synthesis rates, mRNA decay rates and mRNA expression levels with kinetic clusteringanalysis, we provide compelling evidence that ecdysone signaling induces a rich and previouslyunknown diversity of gene expression dynamics. Furthermore, our kinetic analysis leads to a reliablefunctional description of ecdysone regulated genes and reveals how ecdysone coordinates a wide arrayof functionally diverse genes to direct the cell from its proliferating state into the di�erentiated state.In addition, based on mRNA decay rates we developed a novel approach for miRNA-mRNA networkanalysis and o�er insights into the post-transcriptional regulation of these gene expression dynamicsby miRNAs. Importantly, our comprehensive description of the ecdysone induced gene expressiondynamics and phenotype establishes ecdysone stimulation in Drosophila S2 cells as an experimentalparadigm for studying mechanistic details of gene expression regulation.
Improvement over existing studies on the genomic and phenotypic response to ecdysone.Although several studies have examined the genomic response to ecdysone [129, 18, 66, 75] as well asthe phenotypic behavior of ecdysone stimulated cells [21, 185, 164, 32, 40], our study represents themost comprehensive and detailed description of the ecdysone induced gene expression dynamics andphenotypic changes. By using DTA we present the �rst genome-wide and simultaneous assessmentof mRNA synthesis rates, mRNA decay rates and total mRNA expression levels throughout an earlytime interval of ecdysone stimulation in Drosophila S2 cells. We show that using nascent mRNA forexpression pro�ling improves the sensitivity of time series gene expression measurements for earlychanges in gene expression and in particular for repressed genes. Compared to a similar time coursestudy of ecdysone treated Kc167 cells [66], which found that within the �rst 12 hours most genes areinduced, we identi�ed four times more di�erentially regulated genes in general and a predominantlylarge fraction of repressed genes. Thus, our study measured the genomic response to ecdysone withhigher sensitivity and improved temporal resolution compared to existing studies. Furthermore,using DTA we were not limited to study changes of the total expression level of ecdysone regulatedgenes, but were able to additionally assess ecdysone induced changes of mRNA synthesis rates anddecay rates. Therefore, we present the �rst genome-wide assessment of decay regulation during theecdysone response.Using a cell analyzer system, �ow cytometry and light microscopy we provide the �rst systematicand accurate characterization of the ecdysone induced phenotypic changes in S2 cells as well astheir timing. We show that upon ecdysone treatment, S2 cells cease proliferation due to cell cyclearrest in the G2 phase. Subsequently the cells acquire a di�erentiated morphology, characterizedby increase in cell size and granularity along with outgrowth of �lopodia. The comprehensive anddetailed phenotypic characterization was crucial since it enabled us to validate our genomic resultsand to link the ecdysone induced changes in gene expression to speci�c biological processes.
Ecdysone induces major changes in the transcriptome that presage the �nal biologicaloutcome. By taking advantage of the higher sensitivity of DTA, we demonstrate that ecdysoneimmediately regulates the synthesis rate (nascent mRNA expression) of an initial set of genes andthen progressively regulates hundreds of genes, most of them in a sustained fashion. Importantly,the regulated synthesis rates translate into a progressively increasing number of genes thatexhibit mostly sustained changes of their total expression level. These progressive changes re�ectthe architecture of the ecdysone signaling cascade: a small set of early regulators controls theexpression of a larger set of regulators, to ultimately control gene expression of a wide array of
67
functionally diverse genes. We con�rmed the functional diversity of ecdysone regulated genes byGene Ontology [9] and KEGG Pathway [103] enrichment analysis. Importantly, the functionalannotation of these genes correlates very well with the ecdysone induced phenotypic changes. Thecell cycle arrest is re�ected by repressed genes, which are enriched for multiple processes relatedto DNA replication, cell cycle and proliferation. The extensive remodeling of cell size and shapeis re�ected by induced genes, which are enriched for morphogenesis and di�erentiation terms.Furthermore, we found repressed genes to be enriched in multiple terms related to energy andbiomolecule production, suggesting a metabolic rearrangement as the cell leaves the proliferatingstate to enter a resting, di�erentiated state. Thus, our DTA analysis reveals that the early timeinterval of ecdysone treatment comprises not only the regulatory key players of the ecdysonecascade, but also the genes presaging the �nal biological outcome.
First genome-wide assessment of ecdysone regulated decay rates. Owing to the customizedstatistical approach [173] for the estimation of mRNA decay rates, we were for the �rst time able toshow that ecdysone di�erentially regulates the decay rates of a large fraction of genes. Strikingly,changes in decay rates are characterized by a less sustained progression compared to changes insynthesis rates, indicating that decay rates are controlled in a temporally more restricted (dynamic)fashion. Although we currently do not fully understand the functional or mechanistic principle ofthis observation, it suggests that the dynamic regulation of decay rates may facilitate the progressionfrom the proliferating cell state to the di�erentiated state, while the decay rates in the respectivecell states are again similar. Di�erential regulation of decay rates upon cellular stimulation hasbeen observed by others [166, 163, 162, 149, 160]. It is thought that the dynamic regulation ofdecay rates is an e�cient mechanism for the cell to rapidly respond to environmental challengesand is particularly important for shaping sharp `peaked' gene expression responses [162, 160].
Ecdysone induces a rich and previously unknown diversity of gene expression dynamics.By complementing the DTA gathered gene expression data with kinetic analysis we arrive at adetailed dissection of ecdysone induced gene expression dynamics, their functional implications andunderlying regulatory principles. Speci�cally, we identi�ed twenty kinetically distinct groups ofecdysone regulated genes. Each group is characterized by a unique combination of e�ect type,strength and timing of changes in mRNA synthesis and decay rates as well as total expression level.Furthermore, the functional annotation of these groups is speci�c, reliable and agrees well with theecdysone induced phenotype. Importantly, only by simultaneously considering the changes in nascenttranscription, total mRNA expression, decay and turnover rates as well as their time-dependency,we were able to encompass the entire complexity of ecdysone induced gene expression dynamics.The twenty distinct gene expression dynamics immediately reveal several signi�cant and novelinsights into the genomic response to ecdysone. First, we can both link the distinct gene expressiondynamics to speci�c biological processes and assign a temporal order in which ecdysone regulatesthese biological processes to direct the cell from its proliferating state into the di�erentiated state.We show that the earliest regulated gene groups are enriched for functional annotations relatedto ecdysone signaling. Among the later kinetics we observe that regulation of genes implicated inseveral aspects of metabolism slightly precede genes important for cell cycle and proliferation. Genesinvolved in morphology and di�erentiation show a predominantly late gene expression response.Since the timing of the late processes, namely metabolism, cell cycle and di�erentiation, overlap,our data demonstrate that the ecdysone cascade regulates a wide variety of functionally diversegenes at the same time.Many of our observations are consistent with current knowledge of the ecdysone response. Forinstance the earliest regulated gene groups comprise the early and early-late regulators of theecdysone response as de�ned in the Ashburner model [8]. The early and sustained di�erentialexpression of these TFs indicates their importance as regulators of the ecdysone induced gene
68

expression dynamics. Further data analysis will be able to explicitly address this questionby modeling the underlying TFs network and its motifs using the nascent transcription data.Importantly, as other TFs and also RBPs exhibit the same kinetics as those key regulators, weprovide evidence to extend the set of early regulators. Within this extended set, we �nd both generalregulators of gene expression, such as the translation repressor brat, and regulators of speci�c cellularprocesses such as the growth regulator foxo. Since Brat targets the key TFs Eip74EF and Eip75B ourresults are the �rst indication how translational regulation is integrated into the ecdysone response.Another intriguing �nding of our study is that we can discriminate the contribution of transcriptsynthesis and decay to the observed gene expression patterns. We identi�ed several genes, whosechanges in total expression level are dependent on either altered synthesis or decay rates. However,the largest fraction of genes is characterized by a correlated (coupled) change in synthesis anddecay rates, i.e. simultaneous increase or decrease in synthesis and decay rates. There are severallines of evidence in the current literature that despite the spatial separation of mRNA synthesisand decay, these processes can be coordinated in general and in particular upon environmentalperturbation [57, 179, 84, 144, 53, 180, 192, 52, 156, 186, 187]. Coupling is thought to enable anorganism to quickly react to a signal and to quickly attain new mRNA steady state levels [80].One important coupling mechanism involves imprinting of the mRNA with general and/or classspeci�c coordinators, yet, not much is known about how imprinting speci�cally occurs. Our datasuggest that the underlying functional and mechanistic principles of combined or opposing actionof synthesis and decay rates seems to be complex and not of global nature. The molecular detailsand regulation underlying the observed coupling remains to be explored.
The role of miRNAs in the ecdysone response. Our results suggest that miRNAs constitutea crucial additional layer of regulation during the ecdysone response. Upon ecdysone treatment, weobserve a rapid repression of several miRNAs and a progressive induction of multiple other miRNAs.The rapid repression indicates that ecdysone induced di�erentiation requires the coordinated down-regulation of those miRNAs that are probably involved in maintaining the proliferating state. Thisconclusion is corroborated by our �nding that upon abrogation of miRNA activity S2 cells ceaseproliferation. Furthermore, since ecdysone treated S2 cells undergo cell death in Ago1 knockdownconditions, this suggests a crucial role of miRNAs in the speci�cation of the ecdysone response. ThemiRNAs of the miR-2 family and bantam have a well-established anti-apoptotic function [122] andinhibition of their function could be one possible explanation for the observed cell death.The important role of the ecdysone regulated miRNAs in the di�erentiation of S2 cells is supported bythe identi�ed miRNAs which have established functions in ecdysone signaling, cell growth regulationor di�erentiation (miR-14, miR-8, miR-277 and let-7-C locus [193, 35, 100, 58]). Strikingly, thelargest fraction of identi�ed miRNAs and especially the early induced miRNAs have not beenimplicated in ecdysone signaling or in any of the phenotypic changes. Therefore, our data setrepresents an excellent resource to reveal the function of these miRNAs in ecdysone signaling,proliferation, cell cycle, metabolism or di�erentiation/morphogenesis.By developing a novel decay rate-based approach for miRNA target identi�cation, we already providea fundamental step for the functional analysis of these miRNAs. Our miRNA-mRNA networkapproach matches discretized fold change patterns of miRNA expression to discretized fold changepatterns of estimated mRNA decay rates. We then used the mRNA expression level as additionalinformation to judge the �reliability� of identi�ed miRNA-mRNA interactions. One advantage of ourdecay rate-based network approach as opposed to expression-based networks is that mRNA decayrates represent a more direct readout of miRNA activity compared to mRNA expression levels, whichrepresent a composite readout. Consequently, we �nd that in the expression-based networks only12% of the mRNAs identi�ed as miRNA targets show di�erential decay rates. The second advantageof our decay rate-based network approach is that we do not assume an inverse correlation of miRNAand mRNA expression levels. Thus, we can also reliably identify miRNA-mRNA interactions in
69
which miRNAs only modulate mRNA expression levels, which are determined by mRNA synthesis.Therefore, the decay rate-based network of the ecdysone response is superior to previous approachesand comprises several mechanistic functions of miRNAs, including reinforcing the ecdysone inducedtranscriptional program, attenuating transcripts that are speci�c to the proliferative cell state,stabilizing the new/di�erentiated cell state or having stabilized the old/proliferative state.We acknowledge the fact that changes in mRNA decay can be due to RBP mediated decay and/ormechanistic coupling of transcription and decay. However, our approach reduces computationallypredicted miRNA-mRNA target interactions to an experimentally supported candidate list. Theobtained miRNA-mRNA network comprises known ecdysone regulated miRNAs and a large fractionof the inferred target interactions agree with the ecdysone induced phenotypic changes. Thus, ournetwork represents a promising candidate list for both the validation of our decay rate-based networkapproach and for unraveling the role of these miRNA-mRNA interactions in ecdysone signalingand/or its regulated biological processes.Finally, owing to the unprecedented and rich diversity of ecdysone induced gene expression dynamics,this thesis establishes ecdysone stimulation in Drosophila S2 cells as an excellent experimentalparadigm for studying mechanistic details of gene expression regulation.
9 Outlook
Quantitative mechanistic understanding of transcriptional and post-transcriptional regulation ofgene expression upon environmental perturbation is fundamental to life science and medicine. Thisthesis used the genomic response to the steroid hormone ecdysone in the Drosophila S2 cell lineas an experimental model to study various aspects of gene regulation. To this end, we combinedquantitative data of mRNA synthesis and decay with microRNA expression pro�ling as well aswith phenotypic readouts of proliferation, cell cycle and cell morphology. Some of the immediateand long-term future challenges arising from results presented here are discussed in the followingparagraphs.
Mapping the transcriptional and post-transcriptional network governing the ecdysoneresponseRealistic reconstruction of transcriptional and post-transcriptional regulatory networks that controlgene expression is one of the current key challenges in systems biology. Although gene expressiondynamics are ultimately encoded by constellations of cis-regulatory binding sites recognized bytrans-acting regulators such as TFs, RBPs and miRNAs, our understanding of this regulatorycode and its context-dependent readout is very fragmentary. Several recent studies prove thatcomputational modeling of genome-wide gene expression dynamics is a powerful approach toreconstruct regulatory networks [36, 154, 15, 178, 14]. To this end, several types of quantitative andgenome-wide biological data are integrated, including gene expression data, mapping of cis-regulatorysequences and their occupancy with TFs or the general Pol II transcription machinery, as well asmiRNA and RBP expression and binding data. Ideally, these data are evaluated in a time-seriesfashion upon environmental perturbation to sample dynamics and coordination of transcriptionaland post-transcriptional regulatory networks.Our DTA data provide such quantitative data for modeling complex gene-regulatory systemsincluding transcriptional and post-transcriptional networks, their dynamics and coordination. Weidenti�ed multiple distinct patterns of coordinated gene expression activity whose underlyingregulatory mechanisms remain to be fully explored.The ecdysone induced gene expression cascade represents one of the best-studied transcriptionalcascades in Drosophila. However, a global description of the underling regulatory network andits motifs is still missing. The nascent transcription data, together with the identi�ed ecdysoneregulated TFs, will enable modeling of this network. To this end, one �rst needs to identify TF
70
binding sites in enhancers of ecdysone regulated genes, which can be addressed computationally usinga binding site prediction algorithm such as MotEvo [6]. The challenge ahead is to generate accurategenome-wide maps of active enhancers during the ecdysone response to reduce the search space forcomputational prediction of the binding sites. One method that not only allows for identi�cation ofenhancers, but also has the unique advantage to uncover TF binding sites, if coupled to extremelydeep next-generation sequencing, is DNase I hypersensitive site (DHS) sequencing [191, 151].Until now, the role of post-transcriptional regulation in the ecdysone response has not been studied.Based on our genome-wide estimated decay rates our study evaluates miRNAs as one mechanisticregulator of the post-transcriptional network governing the ecdysone response. For a comprehensivedescription of this network the target interactions of ecdysone regulated RBPs have to be integrated.However, availability of experimentally determined target interactions are limited for Drosophilaand computational prediction of targets is hampered by the fact that RBPs have much more scopeto achieve speci�city through secondary structure than though sequence [10]. One experimentaltechnique that could be used to map RNA binding sites of RBPs on a genome-wide scale isPAR-CLIP.Importantly, by integrating the networks governed by TF, miRNA and RBPs we would arrive at aquantitative description of gene expression as function of transcriptional and post-transcriptionalinteractions.
Using the ecdysone paradigm to study coupling of mRNA transcription and decay
Eukaryotic gene expression is traditionally divided into several stages, including mRNA synthesis,processing, export, translation and decay. A growing body of evidence argues that regulation of geneexpression is circular, by elucidating more and more mechanistic aspect of the coupling betweenRNA transcription and decay [57, 114, 84, 29, 53, 52, 180, 192, 156, 186, 80, 81, 187]. Importantly,coupling most often accompanies cellular processes that involve transitions in gene expressionpatterns, for example during mitotic division, cellular di�erentiation or in response to cellularstress. Several coupling mechanisms have been studied on the molecular level including imprintingof coupling coordinators onto the nascent mRNA, which then interact with the cytoplasmic decaymachinery (see references in [80]) or mechanisms involving feedback regulation between the decayand transcription machinery. The latter was recently studied in yeast using synthesis and decayrates obtained by cDTA (comparativeDTA) [186, 187]. Since the kinetic analysis of ecdysoneinduced gene expression dynamics shows a widespread coupling, the ecdysone paradigm is a perfectmodel system to study mechanistic aspects of coupling. As we observe di�erent extent of couplingin distinct groups of genes, it will be interesting to investigate, if the respective coupling underliesspeci�c or global mechanisms. Experimentally this could be addressed by impairing factors ofmRNA synthesis or degradation coupled to DTA. Given that most mechanistic studies wereconducted in yeast, studying coupling in Drosophila would generalize these �ndings to metazoan oridentify novel and metazoan speci�c mechanisms.
Validation of the decay rate-based network approach and the role of miRNA in theecdysone response
Using single molecule imaging we identi�ed multiple ecdysone regulated miRNAs. To date mostof these miRNAs have no established function in ecdysone signaling, proliferation, cell cycle,metabolism or di�erentiation/morphogenesis. Furthermore, some miRNAs are even missing anyfunctional characterization in Drosophila. Therefore, our dataset represents an excellent resource tostudy the function of these miRNAs.A crucial step in understanding the role of miRNAs is to determine their authentic miRNA targets.We established an improved miRNA-mRNA network approach to reduce computationally predictedtarget interactions to an experimentally supported candidate list. We acknowledge one drawbackof our current approach that is the matching criterion we used for the correlation of miRNA
71
expression and mRNA decay rates. Since we demanded a complete match of the discretizedexpression/decay rate fold change patterns, we increased the number of false negative results, thusrendering our approach rather conservative. An improved strategy would be to use Pearson orSpearman correlation or regression based analyses [150]. Although this improvement should bemade to extent the list of candidate interactions, we are con�dent that our strict matching criterionidenti�ed some of the most promising miRNA-mRNA target interactions.A validation strategy for these target interactions is be to insert the 3´ UTR of the identi�ed targetsdownstream of a luciferase gene and test the degree of target down regulation during ecdysonetreatment using a luciferase reporter assay. In order to use the ecdysone induced di�erential ofendogenous miRNA levels the sensitivity of the luciferase assay has to be optimized by using rapidresponse luciferases [3].Furthermore, individual or combined knockdown of the involved miRNAs in untreated and ecdysonetreated cells could help to determine the role of these miRNAs in ecdysone signaling and/or theecdysone regulated biological processes. The most interesting candidates are the early and stronglyrepressed miRNAs miR-34, miR-277 and miR-317 as well as the so far unstudied and relativelyearly induced miRNAs miR-282*, miR-276a*, miR-276a, miR-276b and miR-252.
Relevance for cell biology and medicineThe results presented in this thesis can provide novel insights into cell biology and medicine. Both,our detailed characterization of ecdysone induced phenotypic changes and the functional annotationof di�erential expressed genes demonstrate the major impact ecdysone has on cell proliferation, cellcycle, growth, metabolism, morphology and di�erentiation. One of many possible future applicationsarising from our data set could be to study the possible mechanistic link between metabolism andcell cycle exit. The functional annotation of the kinetically distinct gene groups suggests that geneexpression changes in metabolic genes slightly precede the ones in cell cycle related genes. Thisraises the question, if the rearrangement of metabolism may be causative for the cell cycle exit. Thishypothesis is supported by a recent publication that studied stem cell proliferation and terminaldi�erentiation in Drosophila neural stem cells [90]. The authors demonstrate that ecdysone inducedchanges in energy metabolism initiate an irreversible cascade of events leading to cell cycle exit.Therefore, analysis of metabolism and cell cycle related genes in our data could provide furthermechanistic insight into the pivotal role of metabolic rearrangement for cell cycle exit.Finally, since mammalian steroid hormone signaling is also involved in proliferation control, ourresults extend beyond insect development and homeostasis. In fact, most of the established prostateand breast cancer treatments are designed to modulate steroid hormone production or response [90].The presented mechanistic connections between steroid hormone signaling, energy metabolism, andcell proliferation regulation could for instance provide novel insights into cancer therapy.
72
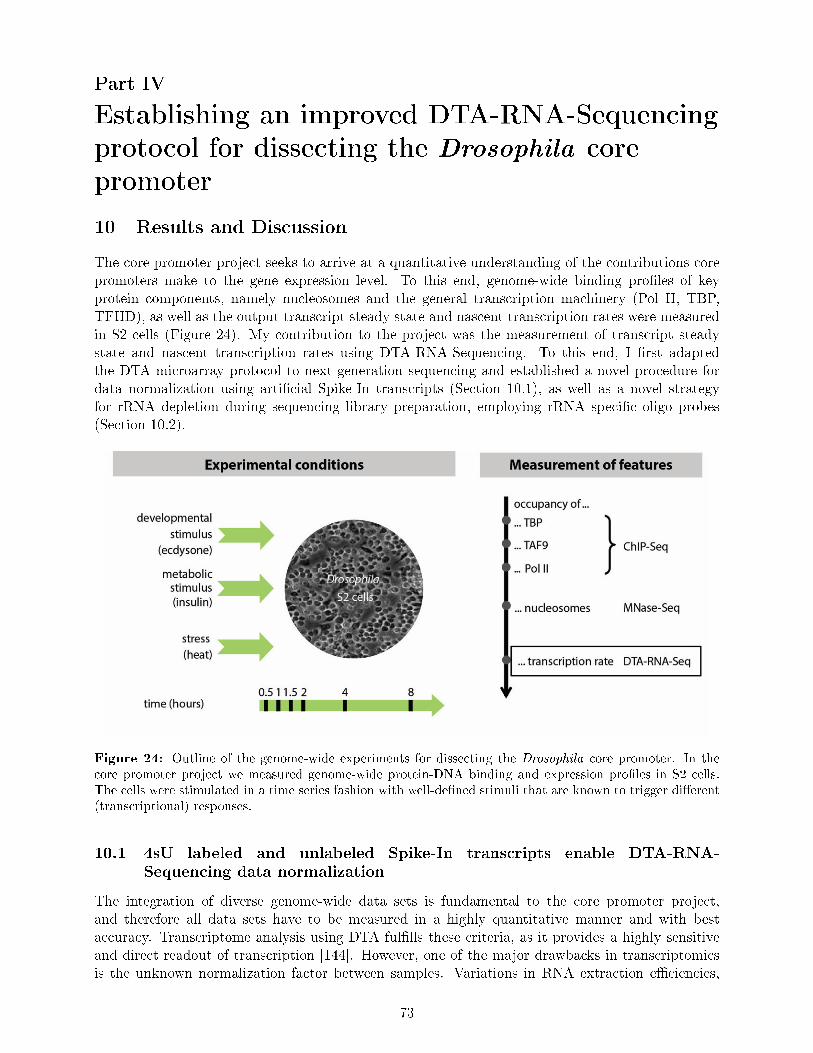
Part IV
Establishing an improved DTA-RNA-Sequencing
protocol for dissecting the Drosophila core
promoter
10 Results and Discussion
The core promoter project seeks to arrive at a quantitative understanding of the contributions corepromoters make to the gene expression level. To this end, genome-wide binding pro�les of keyprotein components, namely nucleosomes and the general transcription machinery (Pol II, TBP,TFIID), as well as the output transcript steady state and nascent transcription rates were measuredin S2 cells (Figure 24). My contribution to the project was the measurement of transcript steadystate and nascent transcription rates using DTA-RNA-Sequencing. To this end, I �rst adaptedthe DTA microarray protocol to next-generation sequencing and established a novel procedure fordata normalization using arti�cial Spike-In transcripts (Section 10.1), as well as a novel strategyfor rRNA depletion during sequencing library preparation, employing rRNA speci�c oligo probes(Section 10.2).
Figure 24: Outline of the genome-wide experiments for dissecting the Drosophila core promoter. In thecore promoter project we measured genome-wide protein-DNA binding and expression pro�les in S2 cells.The cells were stimulated in a time series fashion with well-de�ned stimuli that are known to trigger di�erent(transcriptional) responses.
10.1 4sU labeled and unlabeled Spike-In transcripts enable DTA-RNA-
Sequencing data normalization
The integration of diverse genome-wide data sets is fundamental to the core promoter project,and therefore all data sets have to be measured in a highly quantitative manner and with bestaccuracy. Transcriptome analysis using DTA ful�lls these criteria, as it provides a highly sensitiveand direct readout of transcription [144]. However, one of the major drawbacks in transcriptomicsis the unknown normalization factor between samples. Variations in RNA extraction e�ciencies,
73
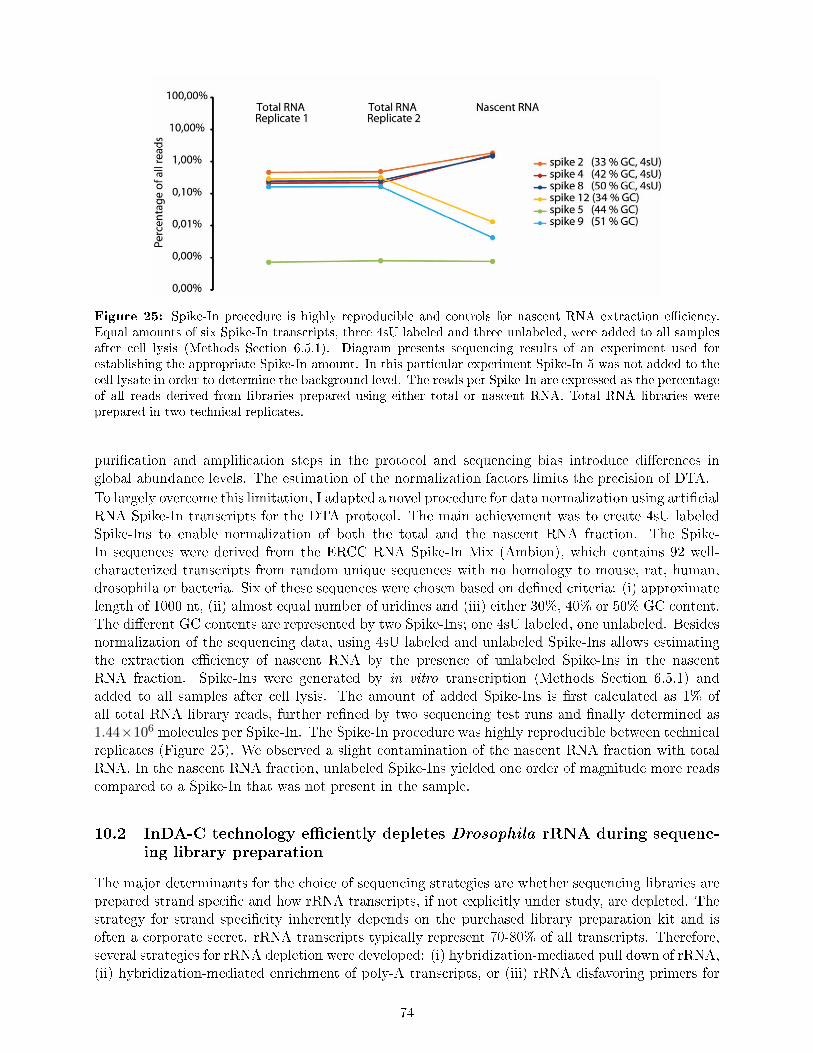
Figure 25: Spike-In procedure is highly reproducible and controls for nascent RNA extraction e�ciency.Equal amounts of six Spike-In transcripts, three 4sU labeled and three unlabeled, were added to all samplesafter cell lysis (Methods Section 6.5.1). Diagram presents sequencing results of an experiment used forestablishing the appropriate Spike-In amount. In this particular experiment Spike-In 5 was not added to thecell lysate in order to determine the background level. The reads per Spike-In are expressed as the percentageof all reads derived from libraries prepared using either total or nascent RNA. Total RNA libraries wereprepared in two technical replicates.
puri�cation and ampli�cation steps in the protocol and sequencing bias introduce di�erences inglobal abundance levels. The estimation of the normalization factors limits the precision of DTA.To largely overcome this limitation, I adapted a novel procedure for data normalization using arti�cialRNA Spike-In transcripts for the DTA protocol. The main achievement was to create 4sU labeledSpike-Ins to enable normalization of both the total and the nascent RNA fraction. The Spike-In sequences were derived from the ERCC RNA Spike-In Mix (Ambion), which contains 92 well-characterized transcripts from random unique sequences with no homology to mouse, rat, human,drosophila or bacteria. Six of these sequences were chosen based on de�ned criteria: (i) approximatelength of 1000 nt, (ii) almost equal number of uridines and (iii) either 30%, 40% or 50% GC content.The di�erent GC contents are represented by two Spike-Ins; one 4sU labeled, one unlabeled. Besidesnormalization of the sequencing data, using 4sU labeled and unlabeled Spike-Ins allows estimatingthe extraction e�ciency of nascent RNA by the presence of unlabeled Spike-Ins in the nascentRNA fraction. Spike-Ins were generated by in vitro transcription (Methods Section 6.5.1) andadded to all samples after cell lysis. The amount of added Spike-Ins is �rst calculated as 1% ofall total RNA library reads, further re�ned by two sequencing test runs and �nally determined as1.44×106 molecules per Spike-In. The Spike-In procedure was highly reproducible between technicalreplicates (Figure 25). We observed a slight contamination of the nascent RNA fraction with totalRNA. In the nascent RNA fraction, unlabeled Spike-Ins yielded one order of magnitude more readscompared to a Spike-In that was not present in the sample.
10.2 InDA-C technology e�ciently depletes Drosophila rRNA during sequenc-
ing library preparation
The major determinants for the choice of sequencing strategies are whether sequencing libraries areprepared strand speci�c and how rRNA transcripts, if not explicitly under study, are depleted. Thestrategy for strand speci�city inherently depends on the purchased library preparation kit and isoften a corporate secret. rRNA transcripts typically represent 70-80% of all transcripts. Therefore,several strategies for rRNA depletion were developed: (i) hybridization-mediated pull down of rRNA,(ii) hybridization-mediated enrichment of poly-A transcripts, or (iii) rRNA disfavoring primers for
74
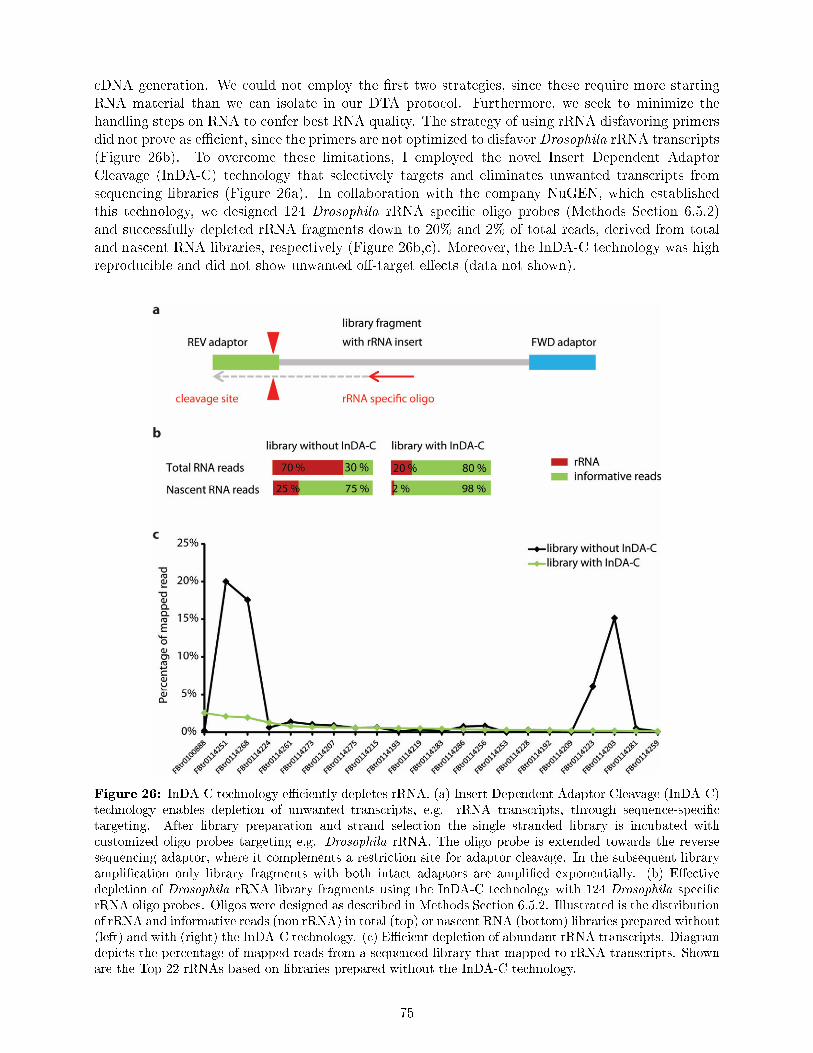
cDNA generation. We could not employ the �rst two strategies, since these require more startingRNA material than we can isolate in our DTA protocol. Furthermore, we seek to minimize thehandling steps on RNA to confer best RNA quality. The strategy of using rRNA disfavoring primersdid not prove as e�cient, since the primers are not optimized to disfavor Drosophila rRNA transcripts(Figure 26b). To overcome these limitations, I employed the novel Insert Dependent AdaptorCleavage (InDA-C) technology that selectively targets and eliminates unwanted transcripts fromsequencing libraries (Figure 26a). In collaboration with the company NuGEN, which establishedthis technology, we designed 124 Drosophila rRNA speci�c oligo probes (Methods Section 6.5.2)and successfully depleted rRNA fragments down to 20% and 2% of total reads, derived from totaland nascent RNA libraries, respectively (Figure 26b,c). Moreover, the InDA-C technology was highreproducible and did not show unwanted o�-target e�ects (data not shown).
Figure 26: InDA-C technology e�ciently depletes rRNA. (a) Insert Dependent Adaptor Cleavage (InDA-C)technology enables depletion of unwanted transcripts, e.g. rRNA transcripts, through sequence-speci�ctargeting. After library preparation and strand selection the single stranded library is incubated withcustomized oligo probes targeting e.g. Drosophila rRNA. The oligo probe is extended towards the reversesequencing adaptor, where it complements a restriction site for adaptor cleavage. In the subsequent libraryampli�cation only library fragments with both intact adaptors are ampli�ed exponentially. (b) E�ectivedepletion of Drosophila rRNA library fragments using the InDA-C technology with 124 Drosophila speci�crRNA oligo probes. Oligos were designed as described in Methods Section 6.5.2. Illustrated is the distributionof rRNA and informative reads (non rRNA) in total (top) or nascent RNA (bottom) libraries prepared without(left) and with (right) the InDA-C technology. (c) E�cient depletion of abundant rRNA transcripts. Diagramdepicts the percentage of mapped reads from a sequenced library that mapped to rRNA transcripts. Shownare the Top 22 rRNAs based on libraries prepared without the InDA-C technology.
75

10.3 Genome-wide measurement of transcript steady state and nascent tran-
scription rates
To describe and quantify the rules underlying variability and degree of plasticity in the transcriptionaloutput between genes, it is crucial to measure transcript abundance and transcription rate in anactivity depended manner. We triggered di�erent transcriptional programs by stimulating S2 cellsin a time series with ecdysone as developmental stimulus, insulin as metabolic stimulus and heatshock to induce a stress response (Figure 24). The stimulation time intervals were individuallydetermined for each stimulus based on previous experiments using nascent mRNA pro�ling (datanot shown). Heat-shock stimulation is limited to 2 hours, since afterwards cells undergo celldeath. Insulin and ecdysone treatment were monitored in frequently sampled early time pointsand extended to 8 hours, to measure not only primary but also secondary response genes. Inthe �nal experiment, all treatments were conducted simultaneously and the DTA protocol aswell as sequencing library preparation (38 libraries) were carried out as described in MethodsSections 6.1.3, 6.3.1 - 6.3.4, 6.3.6, 6.5.3. All libraries yielded high quality sequencing data (data notshown) and were in the initial phase of data analysis at the time this thesis was written (MethodsSection 6.5.4).
Taken together, I successfully established a standardized, strand-speci�c RNA-sequencing protocoland carried out genome-wide measurement of transcript steady state and nascent transcription rates.The established Spike-In controls will enable bias corrections for all experimental steps, after RNAextraction to data generation. This will improve comparisons of DTA-RNA-Sequencing samplesboth within the core promoter project and future projects. Furthermore, Spike-In normalization willfacilitate identi�cation of global changes in transcription. The adaption of the InDA-C technologyto Drosophila rRNA depletion was highly e�cient and cost-e�ective. Due to the higher fraction ofinformative reads in the sequencing libraries, I could decrease the costs for sequencing and was ableto conduct paired-end, instead of single-end sequencing, within the project budget. The obtainedtranscription rates will be correlated with computationally identi�ed promoter sequence motifs(XX-motif), Pol II and GTF binding pro�les (ChIP-Seq) as well as nucleosome positioning data(MNase-Seq) in order to classify core promoters and generate quantitative models for their activity.Furthermore, the DTA-RNA-Seq data set of S2 cells under various stimulation conditions representsa crucial data resource beyond the core promoter project.
76

Part V
Appendix
11 Supplementary Figures
Supplementary Figure 1: Cluster trajectoriesEcdysone regulated genes were clustered as described in Methods Section 6.3.14.2. Shown are theindividual cluster trajectories in decay and synthesis rate (left) and nascent (labeled) and totalRNA (right). Trajectories delineate mean fold change at one time point (1 hour to trajectory endat 12 hours).
Supplementary Figure 2: Cluster fold change progressionEcdysone regulated genes were clustered as described in Methods Section 6.3.14.2. Time courseprogression of individual cluster log2 fold changes (y-axis) in nascent RNA (yellow), total RNA(grey), decay rate (blue), synthesis rate (red) and turnover (green) are shown. Solid line representsmean fold change and shading between error bars the standard deviation.
Supplementary Figure 3: All cluster features and GO/KEGG enrichment termsKinetic features according to Methods Section 6.3.15.1. Average 5´ or 3´ UTR length of eachcluster was compared to average 5´ or 3´ UTR length of all clusters (Methods Section 6.3.15.2).Green denotes 25% longer or shorter UTR. Functional enrichment for GO �Biological Process� andKEGG terms (*) was calculated using Fisher's exact test (p-value <0.01; Methods Section 6.3.15).Table lists the individual signi�cantly enriched terms. Summarized degree of over-representation:number of expected genes in a term, compared to number of observed genes.
Supplementary Figure 4: The 15 highest expressed miRNAsThe 15 highest expressed miRNAs from smallRNA-Seq data of Berezikov et al. 2011 (modENCODE)were compared to miRNAs pro�lied in this study (Methods Section 6.4.5) for untreated and ecdysonetreated cells (12 and 72 hours).
Supplementary Figure 5: �Valid� interaction networks of miRNA-mRNAsNetwork was generated as described in Figure 20and Methods Section 6.4.7. Networks illustrates�valid� interactions between induced (a) and repressed (b) miRNAs (triangle) and their predictedtargets (circles). Diamonds represent TFs. Circle color denotes signi�cantly increased (red) ordecreased (blue) decay rates at any time point in the 2-12 hours interval (fold change >1.5, p-value<0.01). Lighter-colored circles indicate that decay rate was either �rst decreased and then increased(light red) or �rst increased then decreased (light blue). Label color denotes signi�cant total mRNAexpression change during ecdysone treatment (fold change >1.5, p-value <0.01): red (induction),blue (repression) or no change signi�cant change (black). Edges are colored according to regulatedmiRNAs (Figure 19b). Edges with contiguous arrows represent target interactions, which wereidenti�ed in both the decay rate-based and expression-based network.
77
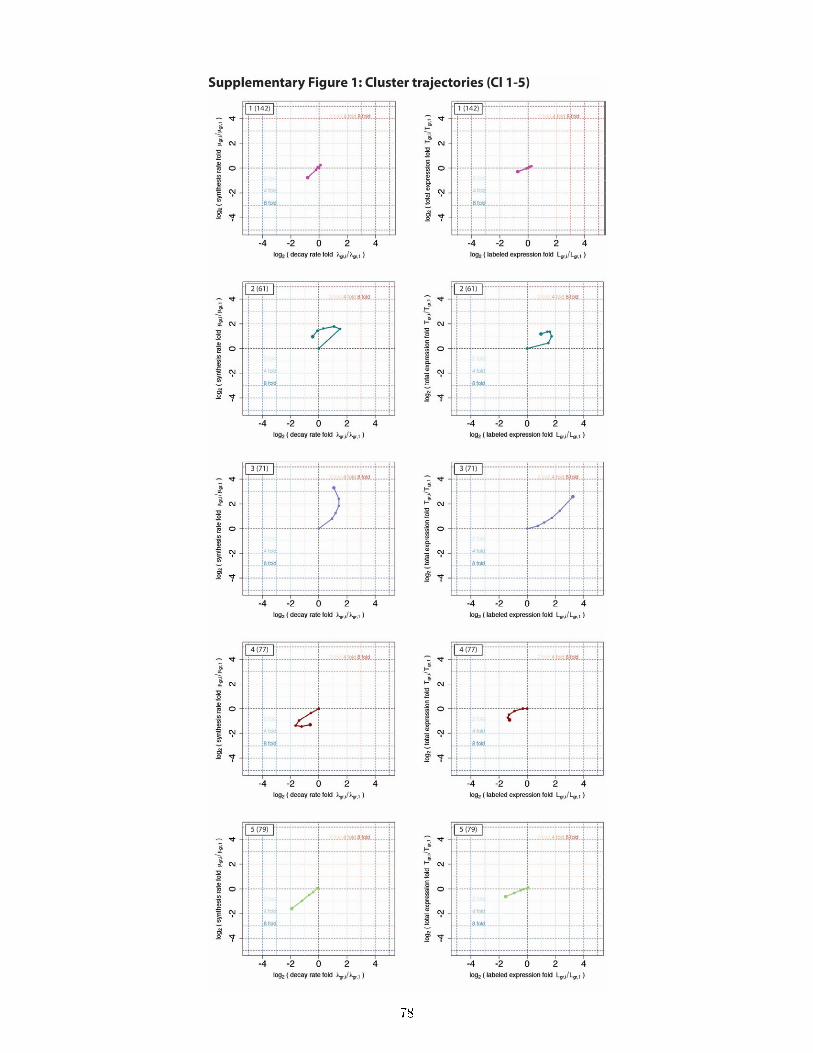
78
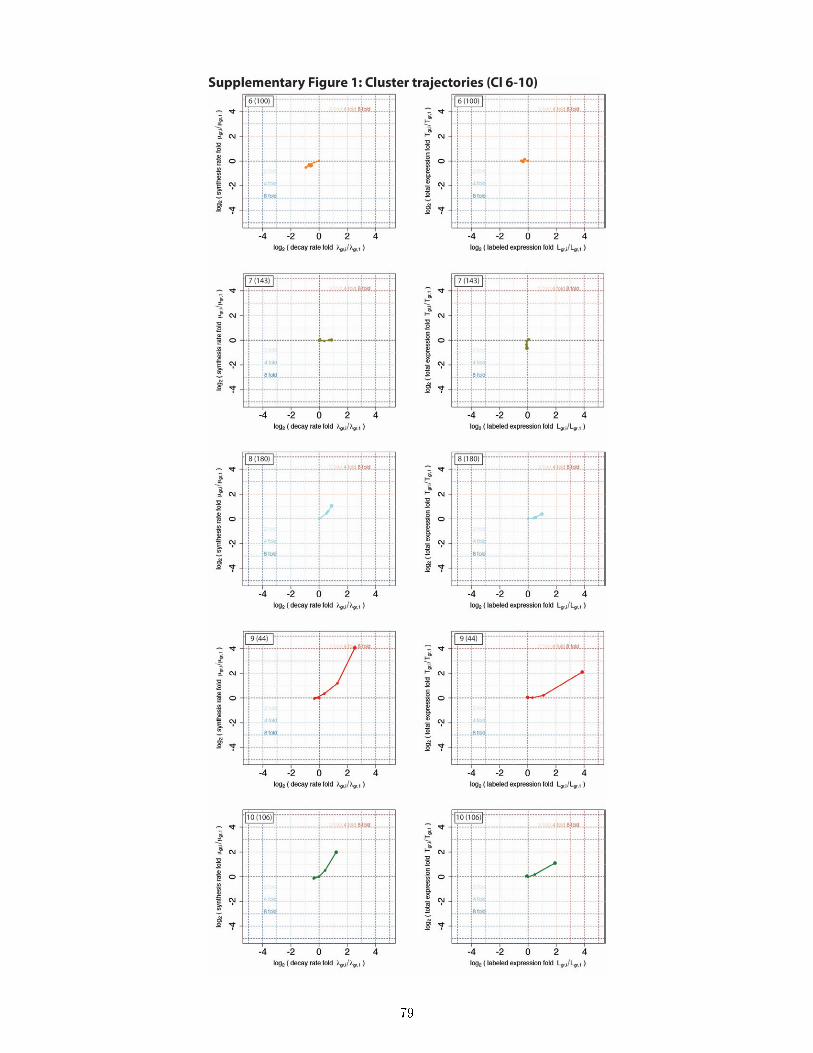
79

80
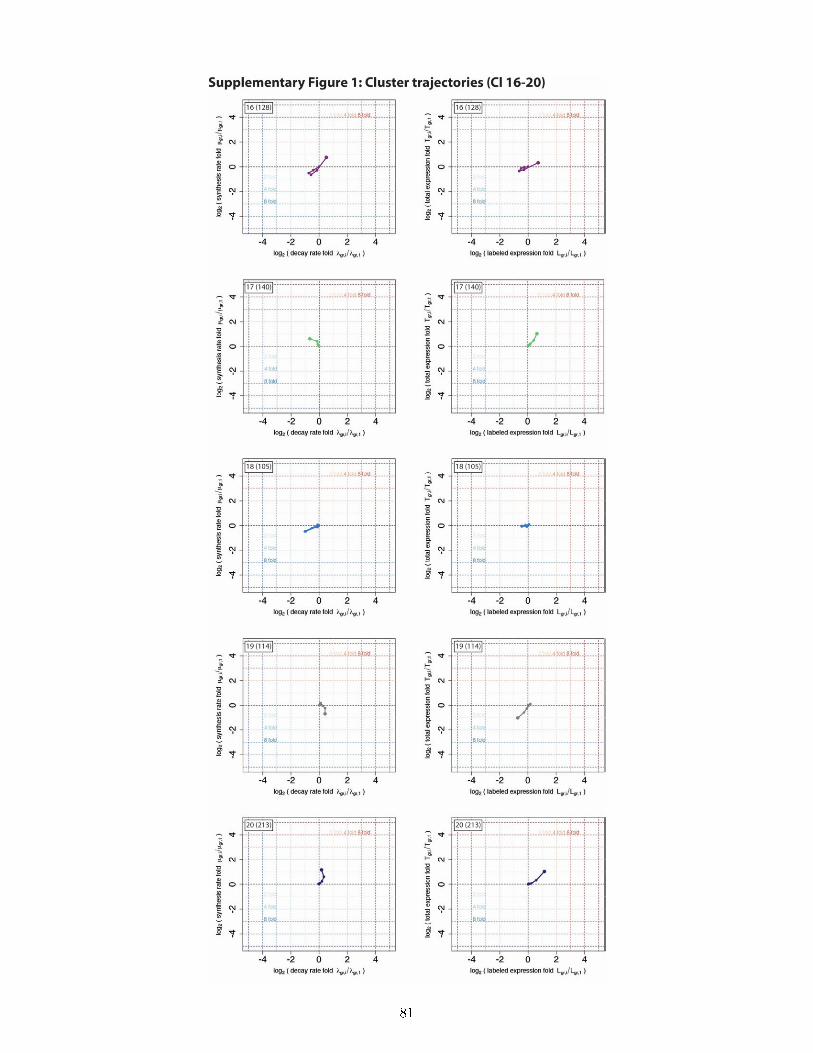
81

82
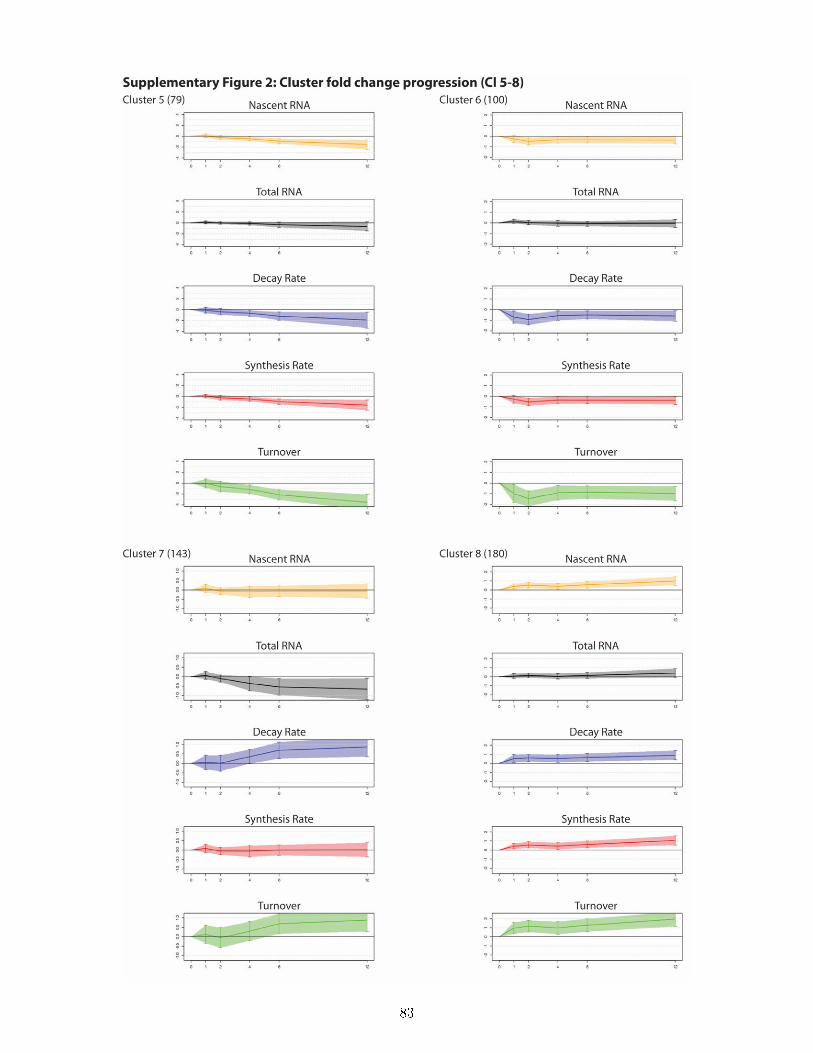
83
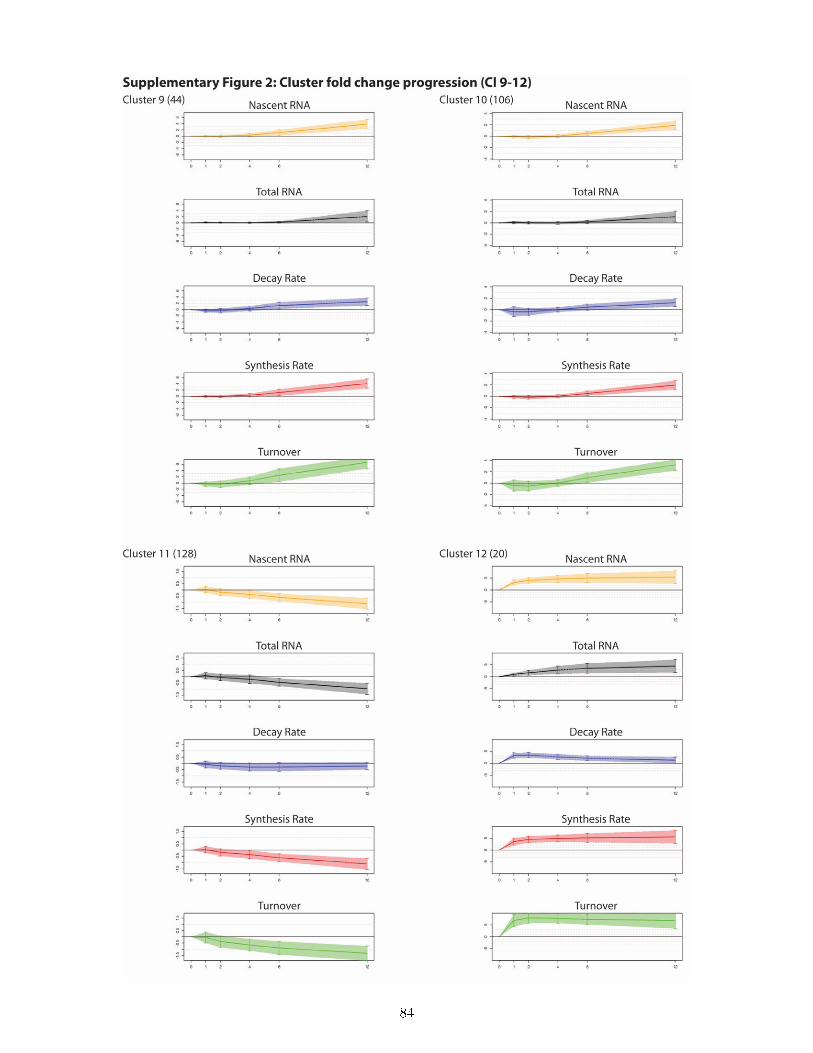
84

85
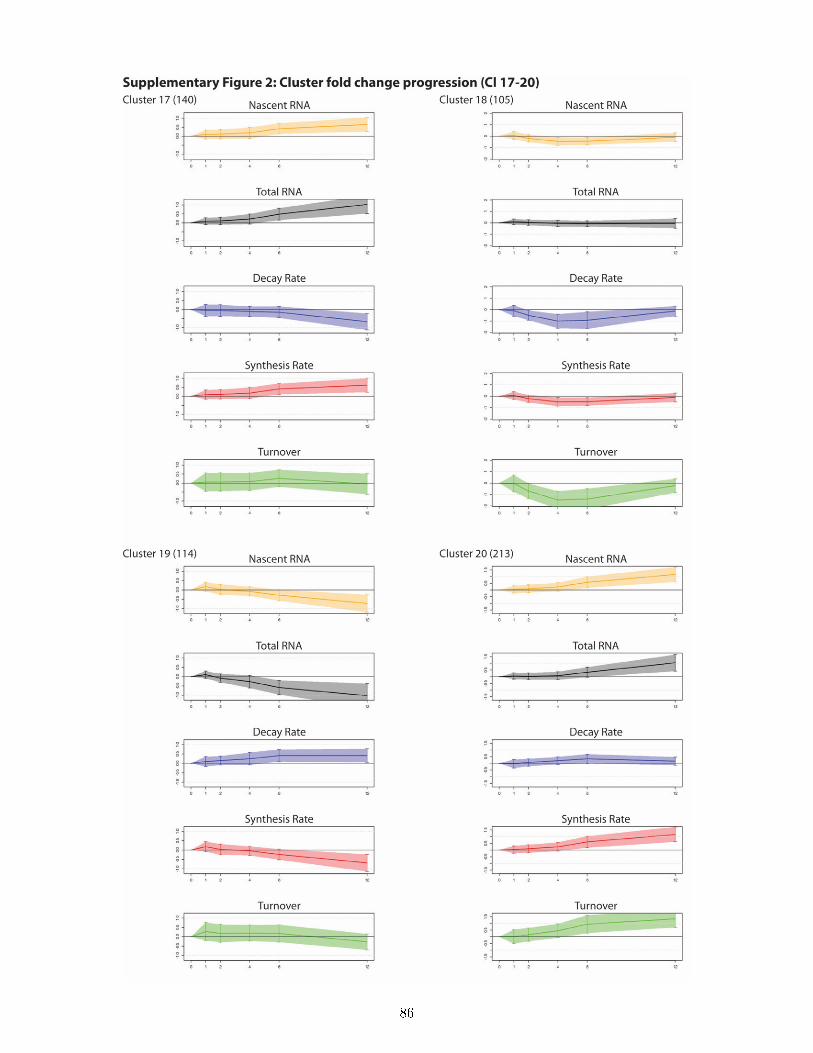
86

87

88
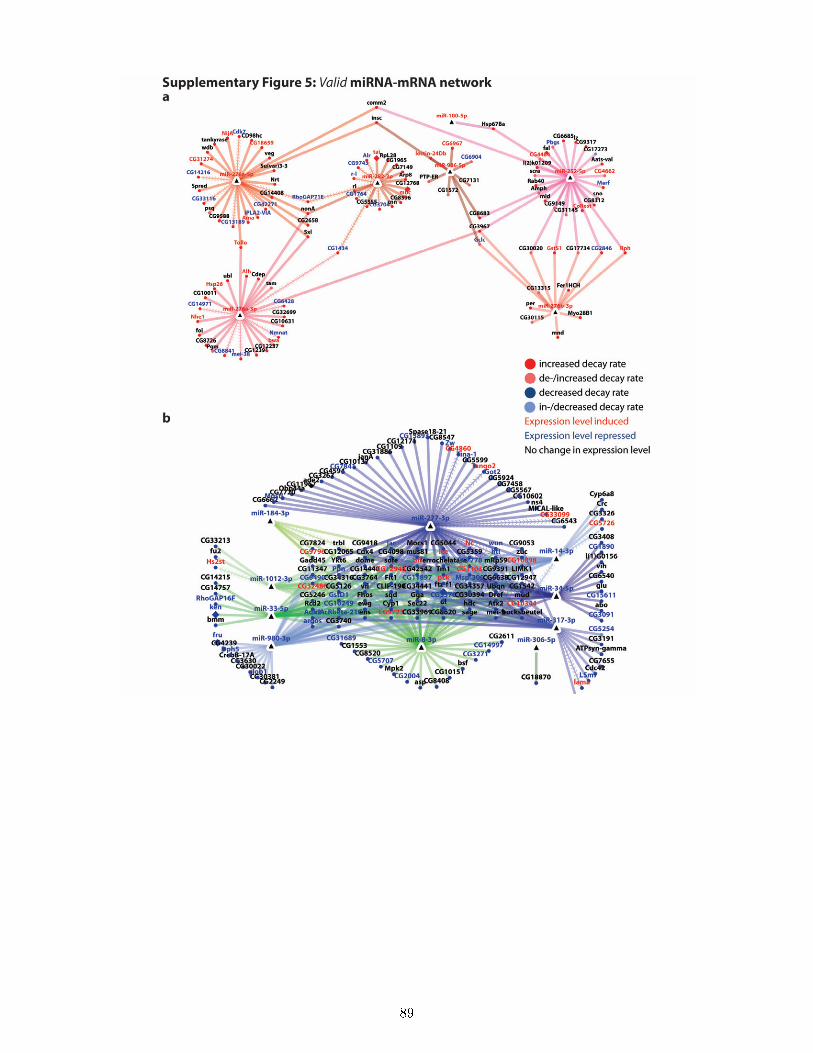
89
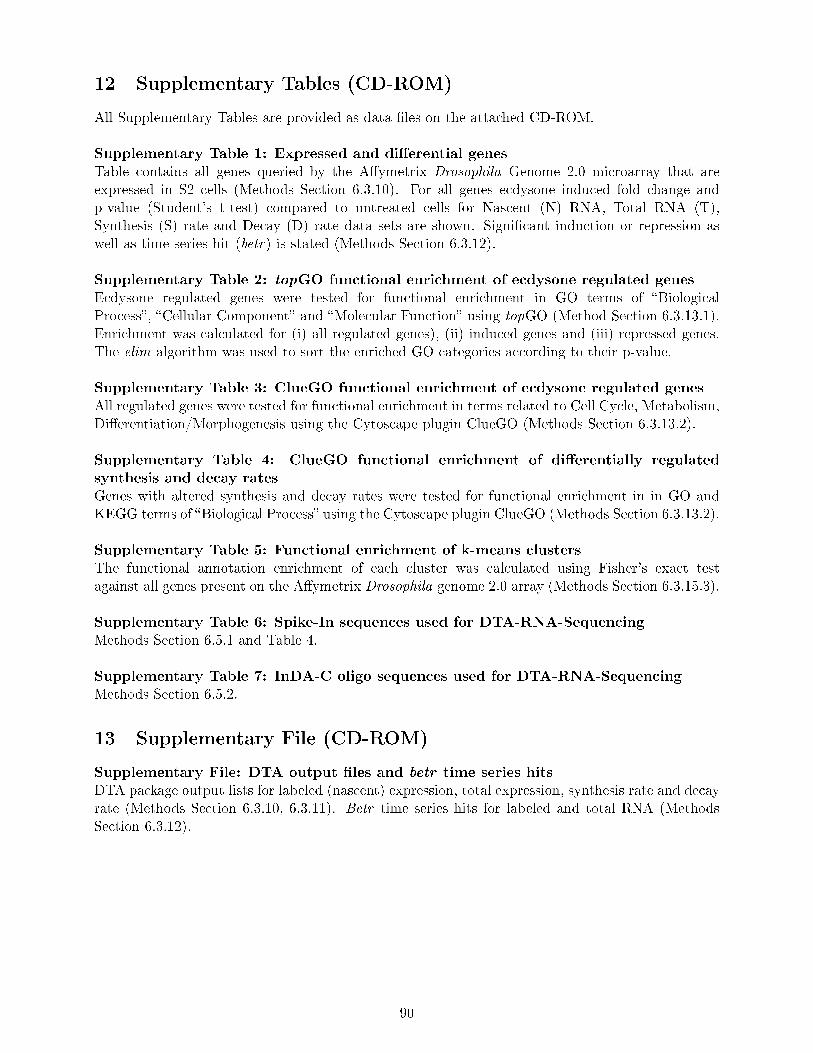
12 Supplementary Tables (CD-ROM)
All Supplementary Tables are provided as data �les on the attached CD-ROM.
Supplementary Table 1: Expressed and di�erential genesTable contains all genes queried by the A�ymetrix Drosophila Genome 2.0 microarray that areexpressed in S2 cells (Methods Section 6.3.10). For all genes ecdysone induced fold change andp-value (Student's t-test) compared to untreated cells for Nascent (N) RNA, Total RNA (T),Synthesis (S) rate and Decay (D) rate data sets are shown. Signi�cant induction or repression aswell as time series hit (betr) is stated (Methods Section 6.3.12).
Supplementary Table 2: topGO functional enrichment of ecdysone regulated genesEcdysone regulated genes were tested for functional enrichment in GO terms of �BiologicalProcess�, �Cellular Component� and �Molecular Function� using topGO (Method Section 6.3.13.1).Enrichment was calculated for (i) all regulated genes), (ii) induced genes and (iii) repressed genes.The elim algorithm was used to sort the enriched GO categories according to their p-value.
Supplementary Table 3: ClueGO functional enrichment of ecdysone regulated genesAll regulated genes were tested for functional enrichment in terms related to Cell Cycle, Metabolism,Di�erentiation/Morphogenesis using the Cytoscape plugin ClueGO (Methods Section 6.3.13.2).
Supplementary Table 4: ClueGO functional enrichment of di�erentially regulatedsynthesis and decay ratesGenes with altered synthesis and decay rates were tested for functional enrichment in in GO andKEGG terms of �Biological Process� using the Cytoscape plugin ClueGO (Methods Section 6.3.13.2).
Supplementary Table 5: Functional enrichment of k-means clustersThe functional annotation enrichment of each cluster was calculated using Fisher's exact testagainst all genes present on the A�ymetrix Drosophila genome 2.0 array (Methods Section 6.3.15.3).
Supplementary Table 6: Spike-In sequences used for DTA-RNA-SequencingMethods Section 6.5.1 and Table 4.
Supplementary Table 7: InDA-C oligo sequences used for DTA-RNA-SequencingMethods Section 6.5.2.
13 Supplementary File (CD-ROM)
Supplementary File: DTA output �les and betr time series hitsDTA package output lists for labeled (nascent) expression, total expression, synthesis rate and decayrate (Methods Section 6.3.10, 6.3.11). Betr time series hits for labeled and total RNA (MethodsSection 6.3.12).
90

References
[1] Adrian Alexa, Jörg Rahnenführer, and Thomas Lengauer. Improved scoring of functionalgroups from gene expression data by decorrelating GO graph structure. Bioinformatics,22(13):1600�7, July 2006. 6.3.13.1, 7.5, 7.9
[2] Panagiotis Alexiou, Manolis Maragkakis, Giorgos L Papadopoulos, Martin Reczko, andArtemis G Hatzigeorgiou. Lost in translation: an assessment and perspective for computationalmicroRNA target identi�cation. Bioinformatics (Oxford, England), 25(23):3049�55, December2009. 1.2.2.4
[3] Brian D Almond, Alex Zdanovsky, Marina Zdanovskaia, Dongping Ma, Pete Stecha, AileenPaguio, Denise Garvin, Keith Wood, and Promega Corporation. Promega Notes 87:Introducing the Rapid Response(TM) Reporter Vector. 9
[4] Stefan Ludwig Ameres, Javier Martinez, and Renée Schroeder. Molecular basis for target RNArecognition and cleavage by human RISC. Cell, 130(1):101�12, July 2007. 1.2.2.2
[5] Simon Anders and Wolfgang Huber. Di�erential expression analysis for sequence count data.Genome biology, 11(10):R106, January 2010. 6.5.4
[6] Phil Arnold, Ionas Erb, Mikhail Pachkov, Nacho Molina, and Erik van Nimwegen. MotEvo:integrated Bayesian probabilistic methods for inferring regulatory sites and motifs on multiplealignments of DNA sequences. Bioinformatics, 28(4):487�94, February 2012. 9
[7] Martin J Aryee, José a Gutiérrez-Pabello, Igor Kramnik, Tapabrata Maiti, and JohnQuackenbush. An improved empirical bayes approach to estimating di�erential gene expressionin microarray time-course data: BETR (Bayesian Estimation of Temporal Regulation). BMCbioinformatics, 10(409):409, January 2009. 6.3.12.2, 7.4
[8] Michael Ashburner. Sequential gene activation by ecdysone in polytene chromosomes ofDrosophila melanogaster. Developmental Biology, 39(1):141�157, July 1974. 2.2, 7.15, 8
[9] Michael Ashburner. Gene Ontology : tool for the uni�cation of biology. Nature genetics,25:25�29, 2000. 7.5, 8
[10] Naomi Attar. The RBPome: where the brains meet the brawn. Genome Biol, 15(1):402, 2014.9
[11] Paul Badenhorst, Hua Xiao, Lucy Cherbas, So Yeon Kwon, Matt Voas, Ilaria Rebay, PeterCherbas, and Carl Wu. The Drosophila nucleosome remodeling factor NURF is required forEcdysteroid signaling and metamorphosis. Genes & development, 19(21):2540�5, November2005. 2.2
[12] Eric H Baehrecke. Ecdysone signaling cascade and regulation of Drosophila metamorphosis.Archives of insect biochemistry and physiology, 33(3-4):231�44, January 1996. 2, 2.1
[13] Jianwu Bai, Yoshihiko Uehara, and Denise J Montell. Regulation of invasive cell behaviorby taiman, a Drosophila protein related to AIB1, a steroid receptor coactivator ampli�ed inbreast cancer. Cell, 103(7):1047�58, December 2000. 2.2, 7.14, 7.15
91

[14] Piotr J Balwierz, Mikhail Pachkov, Phil Arnold, Andreas J Gruber, Mihaela Zavolan, andErik van Nimwegen. ISMARA: automated modeling of genomic signals as a democracy ofregulatory motifs. Genome research, 24(5):869�84, March 2014. 9
[15] Ziv Bar-Joseph, Anthony Gitter, and Itamar Simon. Studying and modelling dynamicbiological processes using time-series gene expression data. Nature reviews. Genetics,13(8):552�64, August 2012. 9
[16] David P. Bartel. MicroRNAs: target recognition and regulatory functions. Cell, 136(2):215�233, Jan 2009. 1.2.2.1
[17] Arash Bashirullah, Amy E. Pasquinelli, Amy a. Kiger, Norbert Perrimon, Gary Ruvkun, andCarl S. Thummel. Coordinate regulation of small temporal RNAs at the onset of Drosophilametamorphosis. Developmental biology, 259(1):1�8, July 2003. 2.3
[18] Robert B Beckstead, Geanette Lam, and Carl S Thummel. The genomic response to20-hydroxyecdysone at the onset of Drosophila metamorphosis. Genome biology, 6(12):R99,January 2005. 4, 8
[19] Matthias Behr, Dietmar Riedel, and Reinhard Schuh. The claudin-like megatrachea is essentialin septate junctions for the epithelial barrier function in Drosophila. Development Cell,5(4):611�620, Oct 2003. 7.14
[20] Eugene Berezikov, Nicolas Robine, Anastasia Samsonova, Jakub O Westholm, Ammar Naqvi,Jui-Hung Hung, Katsutomo Okamura, Qi Dai, Diane Bortolamiol-Becet, Raquel Martin,Yongjun Zhao, Phillip D Zamore, Gregory J Hannon, Marco a Marra, Zhiping Weng, NorbertPerrimon, and Eric C Lai. Deep annotation of Drosophila melanogaster microRNAs yieldsinsights into their processing, modi�cation, and emergence. Genome research, 21(2):203�15,February 2011. 7.11
[21] Edward Berger, Robert Ringler, Stamatis Alahiotis, and Mark Frank. Ecdysone-InducedChanges in Morphology and Protein Drosophila Cell Cultures Synthesis in. Developmentalbiology, 62:498�511, 1978. 8
[22] Doron Betel, Anjali Koppal, Phaedra Agius, Chris Sander, and Christina Leslie. Comprehen-sive modeling of microRNA targets predicts functional non-conserved and non-canonical sites.Genome biology, 11(8):R90, January 2010. 1.2.2.4, 6.4.6, 7.13, 20
[23] M Bettencourt-Dias, R Giet, R Sinka, a Mazumdar, W G Lock, F Balloux, P J Za�ropoulos,S Yamaguchi, S Winter, RW Carthew, M Cooper, D Jones, L Frenz, and DMGlover. Genome-wide survey of protein kinases required for cell cycle progression. Nature, 432(7020):980�7,December 2004. 6.1.4, 7.1
[24] Gabriela Bindea, Bernhard Mlecnik, Hubert Hackl, Pornpimol Charoentong, Marie Tosolini,Amos Kirilovsky, Wolf-Herman Fridman, Franck Pagès, Zlatko Trajanoski, and Jérôme Galon.ClueGO: a Cytoscape plug-in to decipher functionally grouped gene ontology and pathwayannotation networks. Bioinformatics, 25(8):1091�3, April 2009. 6.3.13.2, 7.5, 11
[25] Mikael Björklund, Minna Taipale, Markku Varjosalo, Juha Saharinen, Juhani Lahdenperä,and Jussi Taipale. Identi�cation of pathways regulating cell size and cell-cycle progression byRNAi. Nature, 439(7079):1009�13, February 2006. 6.1.4, 7.1
[26] Daniel Blankenberg, Assaf Gordon, Gregory Von Kuster, Nathan Coraor, James Taylor, andAnton Nekrutenko. Manipulation of FASTQ data with Galaxy. Bioinformatics, 26(14):1783�5,July 2010. 6.5.4
92
[27] Laura Boulan, David Martín, and Marco Milán. bantam miRNA promotes systemic growthby connecting insulin signaling and ecdysone production. Current biology : CB, 23(6):473�8,March 2013. 19
[28] Joerg E Braun, Eric Huntzinger, and Elisa Izaurralde. A molecular link between miRISCs anddeadenylases provides new insight into the mechanism of gene silencing by microRNAs. ColdSpring Harbor perspectives in biology, 4(12), December 2012. 1.2.1, 1.2.2.2
[29] Almog Bregman, Moran Avraham-Kelbert, Oren Barkai, Lea Duek, Adi Guterman, andMordechai Choder. Promoter Elements Regulate Cytoplasmic mRNA Decay. Cell,147(7):1473�1483, December 2011. 9
[30] Alberts Bruce, Dennis Bray, Karen Hopkin, Alexander D Johnson, Julian Lewis, Martin Ra�,Keith Roberts, and Peter Walter. Control of Gene Expression. In Essentail Cell Biology,volume 2, chapter 8, pages 269�299. 3rd edition, October 2009. 1
[31] Adolf Butenandt and Peter Karlson. Über die Isolierung eines Metamorphose-Hormons derInsekten in kristallisierter Form. Zeitschrift für Naturforschung, 9b(6):389�391, 1954. 2
[32] Dimitrios Cakouros, Tasman Daish, Damali Martin, Eric H Baehrecke, and Sharad Kumar.Ecdysone-induced expression of the caspase DRONC during hormone-dependent programmedcell death in Drosophila is regulated by Broad-Complex. Cell, 157(6):985�995, 2002. 7.1, 7.5,8
[33] Marc Carlson. A�ymetrix Drosophila Genome 2.0 Array annotation data (chip drosophila2).R package version 2.14.0. 6.3.13.1, 6.3.15.3
[34] D. R. Cavener and M. T. Clegg. The genetics of glutamate oxaloacetate transaminase inDrosophila melanogaster. J Hered, 67(5):313�314, 1976. 7.14
[35] Elizabeth E Caygill and Laura A Johnston. Temporal regulation of metamorphic processesin Drosophila by the let-7 and miR-125 heterochronic microRNAs. Current biology : CB,18(13):943�50, July 2008. 2.3, 19, 7.12, 8
[36] The FANTOM Consortium & Riken Omics Science Center. The transcriptional network thatcontrols growth arrest and di�erentiation in a human myeloid leukemia cell line. Naturegenetics, 41(5):553�62, May 2009. 9
[37] Geetanjali Chawla and Nicholas S Sokol. Hormonal activation of let-7-C microRNAs viaEcR is required for adult Drosophila melanogaster morphology and function. Development,139(10):1788�97, May 2012. 2.3, 7.10, 19
[38] Lucy Cherbas. EcR isoforms in Drosophila: testing tissue-speci�c requirements by targetedblockade and rescue. Development, 130(2):271�284, January 2003. 2.2
[39] Lucy Cherbas, Aarron Willingham, Dayu Zhang, Li Yang, Yi Zou, Brian D Eads, Joseph WCarlson, Jane M Landolin, Philipp Kapranov, Jacqueline Dumais, Anastasia Samsonova,Jeong-Hyeon Choi, Johnny Roberts, Carrie A Davis, Haixu Tang, Marijke J van Baren, SrinkaGhosh, Alexander Dobin, Kim Bell, Wei Lin, Laura Langton, Michael O Du�, Aaron ETenney, Chris Zaleski, Michael R Brent, Roger A Hoskins, Thomas C Kaufman, JustenAndrews, Brenton R Graveley, Norbert Perrimon, Susan E Celniker, Thomas R Gingeras,and Peter Cherbas. The transcriptional diversity of 25 Drosophila cell lines. Genome research,21(2):301�14, February 2011. 6.3.10
93
[40] Suganthi Chittaranjan, Melissa McConechy, Ying-chen Claire Hou, J Douglas Freeman, andSharon M Gorski. Steroid Hormone Control of Cell Death and Cell Survival : MolecularInsights Using RNAi. PLoS Genetics, 5(2):18�22, 2009. 7.1, 7.5, 8
[41] Piotr Chomczynski and Kevin Mackey. Short technical reports. Modi�cation of the TRIreagent procedure for isolation of RNA from polysaccharide- and proteoglycan-rich sources.BioTechniques, 19(6):942�5, December 1995. 6.3.2
[42] Daniel Cirera-Salinas, Montse Pauta, Ryan M Allen, Alessandro G Salerno, Cristina MRamírez, Aránzazu Chamorro-jorganes, Amarylis C Wanschel, Miguel A Lasunción, ManuelMorales-ruiz, Yajaira Suárez, Ángel Baldán, Enric Esplugues, and Carlos Fernández-hernando.Mir-33 regulates cell proliferation and cell cycle progression. Cell Cycle, 11(5):922�933, 2012.19
[43] Michael D Cleary. Cell Type Speci�c Analysis of mRNA Synthesis and Decay In Vivo withUracil Phosphoribosyltransferase and 4-thiouracil. Methods, 448(08):379�406, 2008. 3
[44] Michael D Cleary, Christopher D Meiering, Eric Jan, Rebecca Guymon, and John CBoothroyd. Biosynthetic labeling of RNA with uracil phosphoribosyltransferase allowscell-speci�c microarray analysis of mRNA synthesis and decay. Nature Biotechnology,23(2):232�237, 2005. 3
[45] Melissa S Cline, Michael Smoot, Ethan Cerami, Allan Kuchinsky, Nerius Landys, ChrisWorkman, Rowan Christmas, Iliana Avila-Campilo, Michael Creech, Benjamin Gross, KristinaHanspers, Ruth Isserlin, Ryan Kelley, Sarah Killcoyne, Samad Lotia, Steven Maere, JohnMorris, Keiichiro Ono, Vuk Pavlovic, Alexander R Pico, Aditya Vailaya, Peng-Liang Wang,Annette Adler, Bruce R Conklin, Leroy Hood, Martin Kuiper, Chris Sander, Ilya Schmulevich,Benno Schwikowski, Guy J Warner, Trey Ideker, and Gary D Bader. Integration of biologicalnetworks and gene expression data using Cytoscape. Nature protocols, 2(10):2366�82, January2007. 6.3.13.2, 6.4.7, 21
[46] Je� Coller and Roy Parker. Eukaryotic mRNA decapping. Annu Rev Biochem, 73:861�890,2004. 1.2.1
[47] Kate B Cook, Hilal Kazan, Khalid Zuberi, Quaid Morris, and Timothy R Hughes. RBPDB:a database of RNA-binding speci�cities. Nucleic acids research, 39(Database issue):D301�8,January 2011. 7.15
[48] Ahmet M Denli, Bastiaan B J Tops, Ronald H a Plasterk, René F Ketting, and Gregory JHannon. Processing of primary microRNAs by the Microprocessor complex. Nature,432(7014):231�5, November 2004. 1.2.2.1
[49] Development Core Team. R: A language and environment for statistical computing. RFoundation for Statistical Computing, Vienna, Austria. ISBN 3-900051-07-0, 2011. 6.3.10
[50] Sergej Djuranovic, Ali Nahvi, and Rachel Green. miRNA-mediated gene silencing by trans-lational repression followed by mRNA deadenylation and decay. Science, 336(6078):237�40,April 2012. 1.2.2.2
[51] Lars Dölken, Zsolt Ruzsics, Bernd Rädle, Caroline C Friedel, Ralf Zimmer, Jörg Mages,Reinhard Ho�mann, Paul Dickinson, Thorsten Forster, Peter Ghazal, and Ulrich HKoszinowski. High-resolution gene expression pro�ling for simultaneous kinetic parameteranalysis of RNA synthesis and decay. RNA, 14(9):1959�72, September 2008. 3, 4, 6.3, 6.3.7,7.2
94
[52] Mally Dori-Bachash, Ophir Shalem, Yair S Manor, Yitzhak Pilpel, and Itay Tirosh.Widespread promoter-mediated coordination of transcription and mRNA degradation.Genome biology, 13(12):R114, December 2012. 8, 9
[53] Mally Dori-Bachash, Efrat Shema, and Itay Tirosh. Coupled evolution of transcription andmRNA degradation. PLoS biology, 9(7):e1001106, July 2011. 8, 9
[54] Margaret S Ebert and Phillip A Sharp. Roles for microRNAs in conferring robustness tobiological processes. Cell, 149(3):515�24, April 2012. 1.2.2.3
[55] Ivette F Emery, Vahe Bedian, and Gregory M Guild. Di�erential expression of Broad-Complextranscription factors may forecast tissue-speci�c developmental fates during Drosophilametamorphosis. Development (Cambridge, England), 120(11):3275�87, November 1994. 7.2, 8
[56] Anton J Enright, Bino John, Ulrike Gaul, Thomas Tuschl, Chris Sander, and Debora S Marks.MicroRNA targets in Drosophila. Genome biology, 5(1):R1, January 2003. 6.4.6
[57] Jörg Enssle, Wilfried Kugler, Matthias W Hentze, and Andreas E Kulozik. Determination ofmRNA fate by di�erent RNA polymerase II promoters. Proceedings of the National Academyof Sciences of the United States of America, 90(21):10091�5, November 1993. 8, 9
[58] Stephanie Maria Esslinger, Björn Schwalb, Stephanie Helfer, Katharina Maria Michalik, HeidiWitte, Kerstin C Maier, Dietmar Martin, Bernhard Michalke, Achim Tresch, Patrick Cramer,and Klaus Förstemann. Drosophila miR-277 controls branched-chain amino acid catabolismand a�ects lifespan. RNA biology, 10(6):1�15, April 2013. 4, 19, 7.12, 7.14, 8
[59] Marc R Fabian and Nahum Sonenberg. The mechanics of miRNA-mediated gene silencing: alook under the hood of miRISC. Nature structural & molecular biology, 19(6):586�93, June2012. 1.2.2.2
[60] Joshua J Forman, Aster Legesse-Miller, and Hilary A Coller. A search for conservedsequences in coding regions reveals that the let-7 microRNA targets Dicer within its codingsequence. Proceedings of the National Academy of Sciences of the United States of America,105(39):14879�84, September 2008. 1.2.2.2
[61] Klaus Förstemann, Yukihide Tomari, Tingting Du, Vasily V Vagin, Ahmet M Denli, Diana PBratu, Carla Klattenho�, William E Theurkauf, and Phillip D Zamore. Normal microRNAmaturation and germ-line stem cell maintenance requires Loquacious, a double-stranded RNA-binding domain protein. PLoS biology, 3(7):e236, July 2005. 6.4.2
[62] Víctor A Francis, Antonio Zorzano, and Aurelio A Teleman. dDOR is an EcR coactivator thatforms a feed-forward loop connecting insulin and ecdysone signaling. Current biology : CB,20(20):1799�808, October 2010. 2.2
[63] Josè Garcìa-Martìnez, Agustìn Aranda, and Josè E Pèrez-Ortìn. Genomic Run-On EvaluatesTranscription Rates for All Yeast Genes and Identi�es Gene Regulatory Mechanisms.Molecularcell, 15:303�313, 2004. 3
[64] Nicole L Garneau, Je�rey Wilusz, and Carol J Wilusz. The highways and byways of mRNAdecay. Nature reviews. Molecular cell biology, 8(2):113�26, February 2007. 1.2.1
[65] Julie Gates, Geanette Lam, José A Ortiz, Régine Losson, and Carl S Thummel. rigor mortisencodes a novel nuclear receptor interacting protein required for ecdysone signaling duringDrosophila larval development. Development, 131(1):25�36, January 2004. 2.2
95
[66] Zareen Gauhar, Ling V Sun, Sujun Hua, Christopher E Mason, Florian Fuchs, Tong-Ruei Li,Michael Boutros, and Kevin P White. Genomic mapping of binding regions for the Ecdysonereceptor protein complex. Genome research, 19(6):1006�13, June 2009. 2.2, 4, 8
[67] Leslie Gay, Kate V Kar�lis, Michael R Miller, Chris Q Doe, and Kryn Stankunas. Applyingthiouracil tagging to mouse transcriptome analysis. Nature protocols, 9(2):410�20, February2014. 3
[68] Fátima Gebauer and Matthias W Hentze. Molecular mechanisms of translational control.Nature reviews. Molecular cell biology, 5(10):827�35, October 2004. 1.2.1
[69] Gary K Geiss, Roger E Bumgarner, Brian Birditt, Timothy Dahl, Naeem Dowidar, Dwayne LDunaway, H Perry Fell, Sean Ferree, Renee D George, Tammy Grogan, Je�rey J James, MaliniMaysuria, Je�rey D Mitton, Paola Oliveri, Jennifer L Osborn, Tao Peng, Amber L Ratcli�e,Philippa J Webster, Eric H Davidson, Leroy Hood, and Krassen Dimitrov. Direct multiplexedmeasurement of gene expression with color-coded probe pairs. Nature biotechnology, 26(3):317�25, March 2008. 7.11
[70] Robert C Gentleman, Vincent J Carey, Douglas M Bates, Ben Bolstad, Marcel Dettling,Sandrine Dudoit, Byron Ellis, Laurent Gautier, Yongchao Ge, Je� Gentry, Kurt Hornik,Torsten Hothorn, Wolfgang Huber, Stefano Iacus, Rafael Irizarry, Friedrich Leisch, Cheng Li,Martin Maechler, Anthony J Rossini, Gunther Sawitzki, Colin Smith, Gordon Smyth, LukeTierney, Jean Y H Yang, and Jianhua Zhang. Bioconductor: open software development forcomputational biology and bioinformatics. Genome biology, 5(10):R80, January 2004. 6.3.10
[71] André P Gerber, Stefan Luschnig, Mark A Krasnow, Patrick O Brown, and Daniel Herschlag.Genome-wide identi�cation of mRNAs associated with the translational regulator PUMILIOin Drosophila melanogaster. Proceedings of the National Academy of Sciences of the UnitedStates of America, 103(12):4487�92, March 2006. 6.3.15.3, 7.15, 22
[72] Belinda Giardine, Cathy Riemer, Ross C Hardison, Richard Burhans, Laura Elnitski, PrachiShah, Yi Zhang, Daniel Blankenberg, Istvan Albert, James Taylor, Webb Miller, W JamesKent, and Anton Nekrutenko. Galaxy: a platform for interactive large-scale genome analysis.Genome research, 15(10):1451�5, October 2005. 6.5.4
[73] Jeremy Goecks, Anton Nekrutenko, and James Taylor. Galaxy: a comprehensive approachfor supporting accessible, reproducible, and transparent computational research in the lifesciences. Genome biology, 11(8):R86, January 2010. 6.5.4
[74] Aaron C Goldstrohm and Marvin Wickens. Multifunctional deadenylase complexes diversifymRNA control. Nature reviews. Molecular cell biology, 9(4):337�344, April 2008. 1.2.1
[75] Sarah E Gonsalves, Scott J Neal, Amy S Kehoe, and J Timothy Westwood. Genome-wide ex-amination of the transcriptional response to ecdysteroids 20-hydroxyecdysone and ponasteroneA in Drosophila melanogaster. BMC genomics, 12(475), January 2011. 4, 8
[76] Brenton R Graveley, Angela N Brooks, Joseph W Carlson, Michael O Du�, Jane M Landolin,Li Yang, Carlo G Artieri, Marijke J van Baren, Nathan Boley, Benjamin W Booth, James BBrown, Lucy Cherbas, Carrie A Davis, Alex Dobin, Renhua Li, Wei Lin, John H Malone,Nicolas R Mattiuzzo, David Miller, David Sturgill, Brian B Tuch, Chris Zaleski, Dayu Zhang,Marco Blanchette, Sandrine Dudoit, Brian Eads, Richard E Green, Ann Hammonds, LichunJiang, Phil Kapranov, Laura Langton, Norbert Perrimon, Jeremy E Sandler, Kenneth HWan, Aarron Willingham, Yu Zhang, Yi Zou, Justen Andrews, Peter J Bickel, Steven EBrenner, Michael R Brent, Peter Cherbas, Thomas R Gingeras, Roger A Hoskins, Thomas C
96

Kaufman, Brian Oliver, and Susan E Celniker. The developmental transcriptome of Drosophilamelanogaster. Nature, 471(7339):473�9, March 2011. 6.3.10
[77] Andrew Grimson, Kyle Kai-How Farh, Wendy K Johnston, Philip Garrett-Engele, Lee P Lim,and David P Bartel. MicroRNA targeting speci�city in mammals: determinants beyond seedpairing. Molecular cell, 27(1):91�105, July 2007. 1.2.2.2
[78] Stephen T Guest, Jingkai Yu, Dongmei Liu, Julie A Hines, Maria A Kashat, and Russell LFinley. A protein network-guided screen for cell cycle regulators in Drosophila. BMC SystemsBiology, 5(1):65, 2011. 7.14
[79] Markus Hafner, Markus Landthaler, Lukas Burger, Mohsen Khorshid, Jean Hausser, PhilippBerninger, Andrea Rothballer, Manuel Ascano, Anna-carina Jungkamp, Mathias Munschauer,Alexander Ulrich, Greg S Wardle, Scott Dewell, Mihaela Zavolan, and Thomas Tuschl.Resource Transcriptome-wide Identi�cation of RNA-Binding Protein and MicroRNA TargetSites by PAR-CLIP. Cell, 141(1):129�141, 2010. 1.2.2.4
[80] Gal Haimovich, Mordechai Choder, Robert H Singer, and Tatjana Trcek. The fate of themessenger is pre-determined: a new model for regulation of gene expression. Biochimica etbiophysica acta, 1829(6-7):643�53, 2013. 1.2.1, 8, 9
[81] Gal Haimovich, Daniel A. Medina, Sebastien Z. Causse, Manuel Garber, Gonzalo Millán-Zambrano, Oren Barkai, Sebastián Chávez, José E. Pérez-Ortín, Xavier Darzacq, andMordechai Choder. Gene expression is circular: factors for mRNA degradation also fostermRNA synthesis. Cell, 153(5):1000�1011, May 2013. 9
[82] Scott M Hammond, Emily Bernstein, David Beach, and Gregory J Hannon. AnRNA-directed nuclease mediates post-transcriptional gene silencing in Drosophila cells. Nature,404(6775):293�6, March 2000. 7.1, 7
[83] Shruti Haralalka, Claude Shelton, Heather N. Cartwright, Erin Katzfey, Evan Janzen, andSusan M. Abmayr. Asymmetric mbc, active rac1 and f-actin foci in the fusion-competentmyoblasts during myoblast fusion in drosophila. Development, 138(8):1551�1562, Apr 2011.7.14
[84] Liat Harel-Sharvit, Naama Eldad, Gal Haimovich, Oren Barkai, Lea Duek, and MordechaiChoder. RNA polymerase II subunits link transcription and mRNA decay to translation.Cell, 143(4):552�63, November 2010. 8, 9
[85] Jean Hausser, Afzal Pasha Syed, Biter Bilen, and Mihaela Zavolan. Analysis of CDS-locatedmiRNA target sites suggests that they can e�ectively inhibit translation. Genome research,23(4):604�15, April 2013. 1.2.2.2
[86] David G Hendrickson, Daniel J Hogan, Heather L McCullough, Jason W Myers, DanielHerschlag, James E Ferrell, and Patrick O Brown. Concordant regulation of translationand mRNA abundance for hundreds of targets of a human microRNA. PLoS biology,7(11):e1000238, November 2009. 1.2.2.2
[87] Héctor Herranz and Stephen M Cohen. MicroRNAs and gene regulatory networks: managingthe impact of noise in biological systems. Genes & development, 24(13):1339�44, July 2010.1.2.2.3
[88] John W B Hershey, Nahum Sonenberg, and Michael B Mathews. Principles of translationalcontrol: an overview. Cold Spring Harbor perspectives in biology, 4(12):a011528, December2012. 1
97
[89] Ronald J Hill, Isabelle M L Billas, François Bonneton, Lloyd D Graham, and Michael CLawrence. Ecdysone receptors: from the Ashburner model to structural biology. Annualreview of entomology, 58:251�71, January 2013. 4, 7.4
[90] Catarina C.F. Homem, Victoria Steinmann, Thomas R. Burkard, Alexander Jais, HaraldEsterbauer, and Juergen A. Knoblich. Ecdysone and Mediator Change Energy Metabolism toTerminate Proliferation in Drosophila Neural Stem Cells. Cell, 158(4):874�888, August 2014.9
[91] Jonathan Houseley and David Tollervey. The many pathways of RNA degradation. Cell,136(4):763�776, Feb 2009. 1.2.1
[92] Xiao Hu, Lucy Cherbas, and Peter Cherbas. Transcription activation by the ecdysone receptor(EcR/USP): identi�cation of activation functions. Molecular endocrinology (Baltimore, Md.),17(4):716�31, April 2003. 2.2
[93] Francois Huet, Claude Ruiz, and Geo� Richards. Sequential gene activation by ecdysonein Drosophila melanogaster: the hierarchical equivalence of early and early late genes.Development, 121(4):1195�204, April 1995. 2.2, 7.15
[94] Eric Huntzinger and Elisa Izaurralde. Gene silencing by microRNAs: contributions oftranslational repression and mRNA decay. Nature reviews. Genetics, 12(2):99�110, February2011. 1.2.2.2
[95] Seogang Hyun, Jung Hyun Lee, Hua Jin, JinWu Nam, Bumjin Namkoong, Gina Lee,Jongkyeong Chung, and V Narry Kim. Conserved MicroRNA miR-8/miR-200 and its targetUSH/FOG2 control growth by regulating PI3K. Cell, 139(6):1096�108, December 2009. 2.3,7.10, 19
[96] Masafumi Inui, Graziano Martello, and Stefano Piccolo. MicroRNA control of signaltransduction. Nature reviews. Molecular cell biology, 11(4):252�63, April 2010. 1.2.2, 1.2.2.1,1.2.2.3
[97] Nicola Iovino, Attilio Pane, and Ulrike Gaul. miR-184 has multiple roles in Drosophila femalegermline development. Developmental cell, 17(1):123�33, July 2009. 1.2.2.3, 19
[98] Naduparambil Korah Jacob, James V Cooley, Tamara N Yee, Jidhin Jacob, Hansjuerg Alder,Priyankara Wickramasinghe, Kirsteen H Maclean, and Arnab Chakravarti. Identi�cation ofSensitive Serum microRNA Biomarkers for Radiation Biodosimetry. PloS one, 8(2):e57603,January 2013. 6.4.5
[99] Changan Jiang, J Lamblin, Hermann Steller, Carl S Thummel, and Howard Hughes. A Steroid-Triggered Transcriptional Hierarchy Controls Salivary Gland Cell Death during DrosophilaMetamorphosis. 5:445�455, 2000. 7.5
[100] Hua Jin, V Narry Kim, and Seogang Hyun. Conserved microRNA miR-8 controls body size inresponse to steroid signaling in Drosophila. Genes & development, 26(13):1427�32, July 2012.2.3, 7.10, 19, 7.14, 8
[101] Tamar Juven-Gershon and James T Kadonaga. Regulation of gene expression via the corepromoter and the basal transcriptional machinery. Developmental biology, 339(2):225�9, March2010. 1.1
98
[102] Sebastian Kadener, Joseph Rodriguez, Katharine Compton Abruzzi, Yevgenia L Khodor, KenSugino, Michael T Marr, Sacha Nelson, and Michael Rosbash. Genome-wide identi�cation oftargets of the drosha-pasha/DGCR8 complex. RNA, 15(4):537�45, April 2009. 19, 7.12
[103] Minoru Kanehisa and Susumu Goto. KEGG: kyoto encyclopedia of genes and genomes. Nucleicacids research, 28(1):27�30, January 2000. 6.3.13.2, 7.5, 8
[104] Felix D Karim and Carl S Thummel. Temporal coordination of regulatory gene expression bythe steroid hormone ecdysone. The EMBO journal, 11(11):4083�93, November 1992. 2.2
[105] M Kenzelmann, S Maertens, M Hergenhahn, S Kue�er, A Hotz-Wagenblatt, L Li, S Wang,C Ittrich, T Lemberger, R Arribas, S Jonnakuty, M C Hollstein, W Schmidt, N Gretz, H JGröne, and G Schütz. Microarray analysis of newly synthesized RNA in cells and animal.PNAS, 104(15):6164�6169, 2007. 3
[106] Michael Kertesz, Nicola Iovino, Ulrich Unnerstall, Ulrike Gaul, and Eran Segal. The role ofsite accessibility in microRNA target recognition. Nature genetics, 39(10):1278�84, October2007. 1.2.2.4
[107] Daehwan Kim, Geo Pertea, Cole Trapnell, Harold Pimentel, Ryan Kelley, and Steven LSalzberg. TopHat2: accurate alignment of transcriptomes in the presence of insertions,deletions and gene fusions. Genome biology, 14(4):R36, April 2013. 6.5.4
[108] Hyeon Ho Kim, Yuki Kuwano, Subramanya Srikantan, Eun Kyung Lee, Jennifer L Martindale,and Myriam Gorospe. HuR recruits let-7/RISC to repress c-Myc expression. Genes &development, 23(15):1743�8, August 2009. 1.2.2.1, 19
[109] Shuhei Kimura, Shun Sawatsubashi, Saya Ito, Alexander Kouzmenko, Eriko Suzuki, Yue Zhao,Kaoru Yamagata, Masahiko Tanabe, Takashi Ueda, Sari Fujiyama, Takuya Murata, HiroyukiMatsukawa, Ken-Ichi Takeyama, Nobuo Yaegashi, and Shigeaki Kato. Drosophila argininemethyltransferase 1 (DART1) is an ecdysone receptor co-repressor. Biochemical and biophysicalresearch communications, 371(4):889�93, July 2008. 2.2
[110] Kirst King-Jones and Carl S Thummel. Nuclear receptors�a perspective from Drosophila.Nature reviews. Genetics, 6(4):311�23, April 2005. 2, 2.2
[111] Marianthi Kiriakidou, Grace S. Tan, Styliani Lamprinaki, Mariangels De Planell-Saguer,Peter T. Nelson, and Zissimos Mourelatos. An mRNA m7G cap binding-like motif withinhuman Ago2 represses translation. Cell, 129(6):1141�51, Jun 2007. 1.2.2.2
[112] Shivendra Kishore, Sandra Luber, and Mihaela Zavolan. Deciphering the role of RNA-bindingproteins in the post-transcriptional control of gene expression. Brie�ngs in functional genomics,9(5-6):391�404, December 2010. 1.2.1
[113] M R Koelle, W S Talbot, W a Segraves, M T Bender, P Cherbas, and D S Hogness. TheDrosophila EcR gene encodes an ecdysone receptor, a new member of the steroid receptorsuperfamily. Cell, 67(1):59�77, October 1991. 2.2
[114] Suzanne Komili and Pamela A Silver. Coupling and coordination in gene expression processes:a systems biology view. Nature reviews. Genetics, 9(1):38�48, January 2008. 1, 1.1, 9
[115] Triinu Koressaar and Maido Remm. Enhancements and modi�cations of primer design programPrimer3. Bioinformatics, 23(10):1289�91, May 2007. 3, 6.3.8
99
[116] Dirk Kostrewa, Mirijam E Zeller, Karim-Jean Armache, Martin Seizl, Kristin Leike, MichaelThomm, and Patrick Cramer. RNA polymerase II-TFIIB structure and mechanism oftranscription initiation. Nature, 462(7271):323�30, November 2009. 1.1
[117] Jacek Krol, Inga Loedige, and Witold Filipowicz. The widespread regulation of microRNAbiogenesis, function and decay. Nature reviews. Genetics, 11(9):597�610, September 2010.1.2.2.3, 2
[118] Mariya M Kucherenko and Halyna R Shcherbata. Steroids as external temporal codes act viamicroRNAs and cooperate with cytokines in di�erential neurogenesis. Fly, 7(3):173�183, 2013.2.2
[119] Meghana M Kulkarni. Digital multiplexed gene expression analysis using the NanoStringnCounter system. Current protocols in molecular biology, Chapter 25(April):Unit25B.10, April2011. 7.11, 7.13
[120] Ben Langmead, Cole Trapnell, Mihai Pop, and Steven L Salzberg. Ultrafast and memory-e�cient alignment of short DNA sequences to the human genome. Genome biology, 10(3):R25,January 2009. 6.5.4
[121] D. M. Lastowski and D. R. Falk. Characterization of an autosomal rudimentary-shaped wingmutation in Drosophila melanogaster that a�ects pyrimidine synthesis. Genetics, 96(2):471�478, Oct 1980. 7.14
[122] Dan Leaman, Po Yu Chen, John Fak, Abdullah Yalcin, Michael Pearce, Ulrich Unnerstall,Debora S Marks, Chris Sander, Thomas Tuschl, and Ulrike Gaul. Antisense-MediatedDepletion Reveals Essential and Speci�c Functions of MicroRNAs in Drosophila Development.Development, 121(7):1097�1108, 2005. 1.2.2.3, 8
[123] Alice Lebreton and Bertrand Séraphin. Exosome-mediated quality control: substraterecruitment and molecular activity. Biochim Biophys Acta, 1779(9):558�565, Sep 2008. 1.2.1
[124] Cheng-Yu Lee, Emily A Clough, Paula Yellon, Tanya M Teslovich, Dietrich A Stephan, andEric H Baehrecke. Genome-wide analyses of steroid- and radiation-triggered programmed celldeath in Drosophila. Current biology : CB, 13(4):350�7, March 2003. 7.5
[125] Rosalind C Lee, Rhonda L Feinbaum, and Victor Ambros. The C . elegans HeterochronicGene lin-4 Encodes Small RNAs with Antisense Complementarity to lin-14. Cell, 75:843�854,1993. 1.2.2
[126] Tong. I. Lee and Richard A. Young. Transcription of eukaryotic protein-coding genes. AnnualReview of Genetics, 34:77�137, 2000. 1.1
[127] Yoontae Lee, Chiyoung Ahn, Jinju Han, Hyounjeong Choi, Jaekwang Kim, Jeongbin Yim,Junho Lee, Patrick Provost, Olof Rå dmark, Sunyoung Kim, and V Narry Kim. The nuclearRNase III Drosha initiates microRNA processing. Nature, 425(6956):415�9, September 2003.1.2.2.1
[128] Jingyi Jessica Li, Peter J Bickel, and Mark D Biggin. System wide analyses haveunderestimated protein abundances and the importance of transcription in mammals. PeerJ,2:e270, January 2014. 4
[129] Tong-Ruei Li and Kevin P White. Tissue-speci�c gene expression and ecdysone-regulatedgenomic networks in Drosophila. Developmental cell, 5(1):59�72, July 2003. 4, 8
100

[130] Nan Liu, Michael Landreh, Kajia Cao, Masashi Abe, Gert-Jan Hendriks, Jason R Kennerdell,Yongqing Zhu, Li-San Wang, and Nancy M Bonini. The microRNA miR-34 modulates ageingand neurodegeneration in Drosophila. Nature, 482(7386):519�23, February 2012. 19, 7.12
[131] Kenneth J Livak and Thomas D Schmittgen. Analysis of relative gene expression data usingreal-time quantitative PCR and the 2(-Delta Delta C(T)) Method. Methods, 25(4):402�8,December 2001. 6.3.8, 6.4.3
[132] Inga Loedige, Mathias Stotz, Saadia Qamar, Katharina Kramer, Janosch Hennig, ThomasSchubert, Patrick Lö�er, Gernot Längst, Rainer Merkl, Henning Urlaub, and Gunter Meister.The NHL domain of BRAT is an RNA-binding domain that directly contacts the hunchbackmRNA for regulation. Genes & development, 28(7):749�64, April 2014. 7.15
[133] John J. Long, Anne Leresche, Richard W. Kriwacki, and Joel M. Gottesfeld. Repression ofTFIIH transcriptional activity and TFIIH-associated cdk7 kinase activity at mitosis. Mol CellBiol, 18(3):1467�1476, Mar 1998. 7.14
[134] Keira Lucas and Alexander S Raikhel. Insect microRNAs: biogenesis, expression pro�ling andbiological functions. Insect biochemistry and molecular biology, 43(1):24�38, January 2013.1.2.2.1, 1.2.2.3
[135] Carol S Lutz and Alexandra Moreira. Alternative mRNA polyadenylation in eukaryotes: ane�ective regulator of gene expression. Wiley interdisciplinary reviews. RNA, 2(1):23�31, 2011.1.2.1
[136] J Robin Lytle, Therese A Yario, and Joan A Steitz. Target mRNAs are repressed as e�cientlyby microRNA-binding sites in the 5' UTR as in the 3' UTR. Proceedings of the NationalAcademy of Sciences of the United States of America, 104(23):9667�72, June 2007. 1.2.2.2
[137] William H Majoros and Uwe Ohler. Spatial preferences of microRNA targets in 3' untranslatedregions. BMC genomics, 8(152), January 2007. 1.2.2.2
[138] Lisa Marcinowski, Michael Lidschreiber, Lukas Windhager, Martina Rieder, Jens B Bosse,Bernd Rädle, Thomas Bonfert, Ildiko Györy, Miranda de Graaf, Olivia Prazeres da Costa,Philip Rosenstiel, Caroline C Friedel, Ralf Zimmer, Zsolt Ruzsics, and Lars Dölken. Real-timeTranscriptional Pro�ling of Cellular and Viral Gene Expression during Lytic CytomegalovirusInfection. PLoS pathogens, 8(9):e1002908, September 2012. 3
[139] April K Marrone, Evgeniia V Edeleva, Mariya M Kucherenko, Nai-Hua Hsiao, and Halyna RShcherbata. Dg-Dys-Syn1 signaling in Drosophila regulates the microRNA pro�le. BMC cellbiology, 13(1):26, January 2012. 7.14
[140] Gunter Meister. Argonaute proteins: functional insights and emerging roles. Nature reviews.Genetics, 14(7):447�459, 2013. 1.2.2.1
[141] Gunter Meister, Markus Landthaler, Agnieszka Patkaniowska, Yair Dorsett, Grace Teng, andThomas Tuschl. Human Argonaute2 mediates RNA cleavage targeted by miRNAs and siRNAs.Mol Cell, 15(2):185�197, Jul 2004. 1.2.2.2
[142] William T. Melvin, Helen B. Milne, Alison A. Slater, Hamish J. Allen, and Hamish M. Keir.Incorporation of 6-Thioguanosine and 4-Thiouridine into RNA. Application to Isolation ofNewly Synthesised RNA by A�nity Chromatography. European Journal of Biochemistry,92(2):373�379, December 1978. 3
101

[143] Thomas J. S. Merritt, Caitlin Kuczynski, Efe Sezgin, Chen-Tseh. Zhu, Seiji Kumagai,and Walter F. Eanes. Quantifying Interactions Within the NADP(H) Enzyme Network inDrosophila melanogaster. Genetics, 182(2):565�574, Mar 2009. 7.14
[144] Christian Miller, Björn Schwalb, Kerstin Maier, Daniel Schulz, Sebastian Dümcke, BenediktZacher, Andreas Mayer, Jasmin Sydow, Lisa Marcinowski, Lars Dölken, Dietmar E Martin,Achim Tresch, and Patrick Cramer. Dynamic transcriptome analysis measures rates of mRNAsynthesis and decay in yeast. Molecular systems biology, 7(458):458, January 2011. 5, 3, 4,6.3, 6.3.11, 6.3.11, 6.3.11, 7.3, 7.13, 8, 10.1
[145] Michael R Miller, Kristin J Robinson, Michael D Cleary, and Chris Q Doe. TU-tagging: cell type-speci�c RNA isolation from intact complex tissues. Nature Publishing Group,6(6):439�441, 2009. 3
[146] Javier Morante, Diana M Vallejo, Claude Desplan, and Maria Dominguez. ConservedmiR-8/miR-200 de�nes a glial niche that controls neuroepithelial expansion and neuroblasttransition. Developmental cell, 27(2):174�87, October 2013. 19
[147] Francesca Moretti, Constanze Kaiser, Agnieszka Zdanowicz-Specht, and Matthias W. Hentze.PABP and the poly(A) tail augment microRNA repression by facilitated miRISC binding. NatStruct Mol Biol, 19(6):603�608, Jun 2012. 1.2.2.2
[148] Bruno Mugat, Veronique Brodu, Jana Kejzlarova-Lepesant, Christo Antoniewski, Cynthia ABayer, James W Fristrom, and Jean-Antoine Lepesant. Dynamic expression of broad-complexisoforms mediates temporal control of an ecdysteroid target gene at the onset of Drosophilametamorphosis. Developmental biology, 227(1):104�17, November 2000. 2.2
[149] Sarah E Munchel, Ryan K Shultzaberger, Naoki Takizawa, and Karsten Weis. Dynamicpro�ling of mRNA turnover reveals gene-speci�c and system-wide regulation of mRNA decay.Molecular biology of the cell, 22(15):2787�95, August 2011. 8
[150] Ander Muniategui, Jon Pey, Francisco J Planes, and Angel Rubio. Joint analysis of miRNAand mRNA expression data. Brie�ngs in bioinformatics, 14(3):263�78, May 2013. 7.13, 9
[151] Shane Neph, Je� Vierstra, Andrew B. Stergachis, Alex P. Reynolds, Eric Haugen, BenjaminVernot, Robert E. Thurman, Sam John, Richard Sandstrom, Audra K. Johnson, and et al.An expansive human regulatory lexicon encoded in transcription factor footprints. Nature,489(7414):83�90, Sep 2012. 9
[152] Tadashi Nishihara, Latifa Zekri, Joerg E Braun, and Elisa Izaurralde. miRISC recruitsdecapping factors to miRNA targets to enhance their degradation. Nucleic acids research,41(18):8692�705, October 2013. 1.2.2.2
[153] Takafumi Noma, Ryutaro Murakami, Yasuhiro Yamashiro, Koichi Fujisawa, Sachie Inouye, andAtsushi Nakazawa. cDNA cloning and chromosomal mapping of the gene encoding adenylatekinase 2 from Drosophila melanogaster. Biochimica et Biophysica Acta (BBA) - Gene Structureand Expression, 1490(1-2):109�114, Jan 2000. 7.14
[154] Noa Novershtern, Aravind Subramanian, Lee N. Lawton, Raymond H. Mak, W NicholasHaining, Marie E. McConkey, Naomi Habib, Nir Yosef, Cindy Y. Chang, Tal Shay, Garrett M.Frampton, Adam C B. Drake, Ilya Leskov, Bjorn Nilsson, Fred Pre�er, David Dombkowski,John W. Evans, Ted Liefeld, John S. Smutko, Jianzhu Chen, Nir Friedman, Richard A. Young,Todd R. Golub, Aviv Regev, and Benjamin L. Ebert. Densely interconnected transcriptionalcircuits control cell states in human hematopoiesis. Cell, 144(2):296�309, Jan 2011. 9
102

[155] Qiuxiang Ou and Kirst King-Jones. What goes up must come down: transcription factorshave their say in making ecdysone pulses. Current topics in developmental biology, 103:35�71,January 2013. 2.1, 3, 2.1, 2.2, 4
[156] Athma A Pai, Carolyn E Cain, Orna Mizrahi-Man, Sherryl De Leon, Noah Lewellen,Jean-Baptiste Veyrieras, Jacob F Degner, Daniel J Ga�ney, Joseph K Pickrell, MatthewStephens, Jonathan K Pritchard, and Yoav Gilad. The contribution of RNA decay quantitativetrait loci to inter-individual variation in steady-state gene expression levels. PLoS genetics,8(10):e1003000, January 2012. 8, 9
[157] Sharon E. Perez and Hermann Steller. Molecular and genetic analyses of lama, anevolutionarily conserved gene expressed in the precursors of the Drosophila �rst optic ganglion.Mechanisms of Development, 59(1):11�27, Sep 1996. 7.14
[158] Sudhakaran Prabakaran, Guy Lippens, Hanno Steen, and Jeremy Gunawardena. Post-translational modi�cation: nature`s escape from genetic imprisonment and the basis fordynamic information encoding. WIREs Syst Biol Med, 4(6):565�83, Aug 2012. 1
[159] Sreerangam N C V L Pushpavalli, Arpita Sarkar, Indira Bag, Clayton R Hunt, M JanakiRamaiah, Tej K Pandita, Utpal Bhadra, and Manika Pal-Bhadra. Argonaute-1 functions asa mitotic regulator by controlling Cyclin B during Drosophila early embryogenesis. FASEBjournal : o�cial publication of the Federation of American Societies for Experimental Biology,28(2):655�66, February 2014. 19, 7.12
[160] Michal Rabani, Joshua Z Levin, Lin Fan, Xian Adiconis, Raktima Raychowdhury, ManuelGarber, Andreas Gnirke, Chad Nusbaum, Nir Hacohen, Nir Friedman, Ido Amit, and AvivRegev. Metabolic labeling of RNA uncovers principles of RNA production and degradationdynamics in mammalian cells. Nature biotechnology, 29(5):436�42, May 2011. 1, 3, 4, 4, 8
[161] Marta Radman-Livaja and Oliver J Rando. Nucleosome positioning: how is it established,and why does it matter? Developmental biology, 339(2):258�66, March 2010. 1.1
[162] Arvind Raghavan and Paul R Bohjanen. Microarray-based analyses of mRNA decay in theregulation of mammalian gene expression. Brie�ngs in functional genomics and proteomics,3(2):112�124, 2004. 8
[163] Arvind Raghavan, Rachel L Ogilvie, Cavan Reilly, Michelle L Abelson, Jayprakash Vasdewani,Mitchell Krathwohl, and Paul R Bohjanen. Genome-wide analysis of mRNA decay in restingand activated primary human T lymphocytes. Nucleic Acids Research, 30(24):5529�38, 2002.8
[164] C Ress, M Holtmann, U Maas, J Sofsky, and A Dorn. 20-Hydroxyecdysone-induceddi�erentiation and apoptosis in the Drosophila cell line, l(2)mbn. Tissue and Cell,32(6):464�477, 2000. 8
[165] Lynn M Riddiford. Hormones and Drosophila development. In Bate, N., Martinez-Arias, A.(Eds.), The Development of Drosophila melanogaster, Cold Spring Harbor Laboratory Press,Cold Spring Harbor, pages 899�939. 1993. 2.1
[166] J Ross. mRNA stability in mammalian cells. Microbiological reviews, 59(3):423�50, September1995. 8
[167] Wenjing Ruan, Hong Long, Dac Hien Vuong, and Yong Rao. Bifocal is a downstream targetof the Ste20-like serine/threonine kinase misshapen in regulating photoreceptor growth conetargeting in Drosophila. Neuron, 36(5):831�842, Dec 2002. 7.14
103

[168] Albin Sandelin, Piero Carninci, Boris Lenhard, Jasmina Ponjavic, Yoshihide Hayashizaki, andDavid A. Hume. Mammalian RNA polymerase II core promoters : insights from genome-widestudies. Nature Reviews Genetics, 8(6):424�436, June 2007. 1.2.1
[169] Shun Sawatsubashi, Takuya Murata, Jinseon Lim, Ryoji Fujiki, Saya Ito, Eriko Suzuki,Masahiko Tanabe, Yue Zhao, Shuhei Kimura, Sally Fujiyama, Takashi Ueda, DaikiUmetsu, Takashi Ito, Ken-ichi Takeyama, and Shigeaki Kato. A histone chaperone, DEK,transcriptionally coactivates a nuclear receptor. Genes & development, 24(2):159�70, January2010. 2.2
[170] Klaus Scherrer, Harriet Latham, and James. E. Darnell. Demonstration of an unstable RNAand of a precursor to ribosomal RNA in HeLa cells. Proc Natl Acad Sci U S A, 49:240�248,Feb 1963. 3
[171] Michael Schnall-Levin, Yong Zhao, Norbert Perrimon, and Bonnie Berger. ConservedmicroRNA targeting in Drosophila is as widespread in coding regions as in 3'UTRs. Proceedingsof the National Academy of Sciences of the United States of America, 107(36):15751�6,September 2010. 1.2.2.2
[172] Björn Schwalb, Daniel Schulz, Mai Sun, Benedikt Zacher, Sebastian Dümcke, Dietmar EMartin, Patrick Cramer, and Achim Tresch. Measurement of genome-wide RNA synthesisand decay rates with Dynamic Transcriptome Analysis (DTA). Bioinformatics, 28(6):884�5,March 2012. 3
[173] Björn Schwalb, Benedikt Zacher, Sebastian Duemcke, and Achim Tresch. DTA: DynamicTranscriptome Analysis. R package version 2.0.2, 2011. 6.3.11, 8
[174] Björn Schwanhäusser, Dorothea Busse, Na Li, Gunnar Dittmar, Johannes Schuchhardt, JanaWolf, Wei Chen, and Matthias Selbach. Global quanti�cation of mammalian gene expressioncontrol. Nature, 473(7347):337�42, May 2011. 4
[175] Yurii Sedkov, Elizabeth Cho, Svetlana Petruk, Lucy Cherbas, Sheryl T Smith, Richard S Jones,Peter Cherbas, Eli Canaani, James B Jaynes, and Alexander Mazo. Methylation at lysine 4 ofhistone H3 in ecdysone-dependent development of Drosophila. Nature, 426(6962):78�83, 2003.2.2
[176] Lorenzo F Sempere, Edward B Dubrovsky, Veronica A Dubrovskaya, Edward M Berger, andVictor Ambros. The expression of the let-7 small regulatory RNA is controlled by ecdysoneduring metamorphosis in Drosophila melanogaster. Developmental biology, 244(1):170�9, April2002. 2.3, 7.10
[177] Lorenzo F Sempere, Nicholas S Sokol, Edward B Dubrovsky, Edward M Berger, and VictorAmbros. Temporal regulation of microRNA expression in Drosophila melanogaster mediatedby hormonal signals and Broad-Complex gene activity. Developmental Biology, 259(1):9�18,July 2003. 2.3, 19, 7.11
[178] Manu Setty, Karim Helmy, Aly A. Khan, Joachim Silber, Aaron Arvey, Frank Neezen, PhaedraAgius, Jason T. Huse, Eric C. Holland, and Christina S. Leslie. Inferring transcriptional andmicroRNA-mediated regulatory programs in glioblastoma. Molecular Systems Biology, 8:605,2012. 9
[179] Ophir Shalem, Orna Dahan, Michal Levo, Maria Rodriguez Martinez, Itay Furman, Eran Segal,and Yitzhak Pilpel. Transient transcriptional responses to stress are generated by opposinge�ects of mRNA production and degradation. Molecular Systems Biology, 4(223):223, 2008. 8
104

[180] Ophir Shalem, Bella Groisman, Mordechai Choder, Orna Dahan, and Yitzhak Pilpel.Transcriptome Kinetics Is Governed by a Genome-Wide Coupling of mRNA Production andDegradation : A Role for RNA Pol II. PLoS Genetics, 7(9), 2011. 8, 9
[181] Ann-Bin Shyu, Michael E Greenberg, and Joel G Belasco. The c-fos transcript is targeted forrapid decay by two distinct mRNA degradation pathways. Genes & Development, 3(1):60�72,January 1989. 3
[182] Timothy W Sikorski and Stephen Buratowski. The Basal Initiation Machinery: Beyond theGeneral Transcription Factors. Current Opinion in Cell Biology, 21(3):344�351, 2009. 1.1
[183] Peter Smibert and Eric C Lai. A view from Drosophila: multiple biological functions forindividual microRNAs. Seminars in Cell & Developmental Biology, 21(7):745�753, 2010.1.2.2.3
[184] Gordon K Smyth. Limma : Linear Models for Microarray Data. In Bioinformatics andComputational Biology Solutions using R and Bioconductor, R. Gentleman, V. Carey, S.Dudoit, R. Irizarry, W. Huber (eds.), Springer, New York, number 2005, pages 397�420. 2005.6.3.12.1
[185] Bryn Stevens and O'Conner John D. The acquisition of resistance to ecdysteroids in culturedDrosophila cells. Developmental biology, 94(1):176�82, November 1982. 8
[186] Mai Sun, Björn Schwalb, Daniel Schulz, Nicole Pirkl, Stefanie Etzold, Laurent Larivière,Kerstin C Maier, Martin Seizl, Achim Tresch, and Patrick Cramer. Comparative dynamictranscriptome analysis (cDTA) reveals mutual feedback between mRNA synthesis anddegradation. Genome research, 22(7):1350�9, July 2012. 3, 4, 8, 9
[187] Mai Sun, Björn Schwalb, Nicole Pirkl, Kerstin C. Maier, Arne Schenk, Henrik Failmezger,Achim Tresch, and Patrick Cramer. Global analysis of eukaryotic mRNA degradation revealsXrn1-dependent bu�ering of transcript levels. Molecular Cell, 52(1):52�62, Oct 2013. 8, 9
[188] Emilia Szostak and Fátima Gebauer. Translational control by 3` -UTR-binding proteins.Brie�ngs in functional genomics, 12(1):58�65, 2012. 1.2.1
[189] William S Talbot, Elizabeth A Swyryd, and David S Hogness. Drosophila tissues withdi�erent metamorphic responses to ecdysone express di�erent ecdysone receptor isoforms. Cell,73(7):1323�37, July 1993. 2.2, 2.2, 7.2
[190] Marshall Thomas, Judy Lieberman, and Ashish Lal. Desperately seeking microRNA targets.Nature structural & molecular biology, 17(10):1169�74, October 2010. 1.2.2.4
[191] Sean Thomas, Xiao-Yong Li, Peter J Sabo, Richard Sandstrom, Robert E Thurman, Theresa KCan�eld, Erika Giste, William Fisher, Ann Hammonds, Susan E Celniker, Mark D Biggin,and John A Stamatoyannopoulos. Dynamic reprogramming of chromatin accessibility duringDrosophila embryo development. Genome biology, 12(5):R43, January 2011. 9
[192] Tatjana Trcek, Daniel R Larson, Alberto Moldón, Charles C Query, and Robert H Singer.Single-molecule mRNA decay measurements reveal promoter- regulated mRNA stability inyeast. Cell, 147(7):1484�97, December 2011. 8, 9
[193] Jishy Varghese and Stephen M Cohen. microRNA miR-14 acts to modulate a positiveautoregulatory loop controlling steroid hormone signaling in Drosophila. Genes & development,21(18):2277�82, September 2007. 2.3, 19, 7.11, 8
105
[194] Jishy Varghese, Sing Fee Lim, and Stephen M Cohen. Drosophila miR-14 regulates insulinproduction and metabolism through its target, sugarbabe. Genes & development, 24(24):2748�53, December 2010. 19
[195] Daryl Waggott, Kenneth Chu, Shaoming Yin, Bradly G Wouters, Fei-Fei Liu, and Paul CBoutros. NanoStringNorm: an extensible R package for the pre-processing of NanoStringmRNA and miRNA data. Bioinformatics, 28(11):1546�8, June 2012. 6.4.5
[196] Gabriele Weintz, Jesper V Olsen, Katja Frühauf, Magdalena Niedzielska, Ido Amit, JonathanJantsch, Jörg Mages, Cornelie Frech, Lars Dölken, Matthias Mann, and Roland Lang. Thephosphoproteome of toll-like receptor-activated macrophages. Molecular systems biology,6(371):371, June 2010. 3
[197] Changjian Wu, Vinod Singaram, and Kim S. McKim. mei-38 is required for chromosomesegregation during meiosis in Drosophila females. Genetics, 180(1):61�72, Sep 2008. 7.14
[198] Zhijin Wu, Rafael A Irizarry, Robert Gentleman, Francisco Martinez-Murillo, and ForrestSpencer. A Model-Based Background Adjustment for Oligonucleotide Expression Arrays.Journal of the American Statistical Association, 99(468):909�917, December 2004. 6.3.10
[199] Han Yan, Kavitha Venkatesan, John E Beaver, Niels Klitgord, Muhammed a Yildirim, TongHao, David E Hill, Michael E Cusick, Norbert Perrimon, Frederick P Roth, and Marc Vidal.A genome-wide gene function prediction resource for Drosophila melanogaster. PloS one,5(8):e12139, January 2010. 6.3.15.3
[200] Edward Yang, Erik van Nimwegen, Mihaela Zavolan, Nikolaus Rajewsky, Mark Schroeder,Marcelo Magnasco, and James E Darnell. Decay rates of human mRNAs: correlation withfunctional characteristics and sequence attributes. Genome research, 13(8):1863�72, August2003. 4
[201] Jian Ye, George Coulouris, Irena Zaretskaya, Ioana Cutcutache, Steve Rozen, and Thomas LMadden. Primer-BLAST: a tool to design target-speci�c primers for polymerase chain reaction.BMC bioinformatics, 13(134):134, January 2012. 3, 6.3.8
[202] Tzviya Zeev-Ben-Mordehai, Efstratios Mylonas, Aviv Paz, Yoav Peleg, Lilly Toker, IsraelSilman, Dmitri I. Svergun, and Joel L. Sussman. The quaternary structure of amalgam,a Drosophila neuronal adhesion protein, explains its dual adhesion properties. Biophys J,97(8):2316�2326, Oct 2009. 7.14
[203] Gabriel E Zentner and Steven Heniko�. Regulation of nucleosome dynamics by histonemodi�cations. Nature structural & molecular biology, 20(3):259�66, March 2013. 1.1
[204] R Grace Zhai, Yu Cao, P Robin Hiesinger, Yi Zhou, Sunil Q. Mehta, Karen L. Schulze, PatrikVerstreken, and Hugo J. Bellen. Drosophila NMNAT maintains neural integrity independentof its NAD synthesis activity. PLoS Biol, 4(12):e416, Nov 2006. 7.14
[205] Shuning Zhang, Gina M. Dailey, Elaine Kwan, Bernadette M. Glasheen, Gyna E. Sroga, andAndrea Page-McCaw. An MMP liberates the Ninjurin A ectodomain to signal a loss of celladhesion. Genes Dev, 20(14):1899�1910, Jul 2006. 7.14
[206] Lihua J. Zhu, Ryan G. Christensen, Majid Kazemian, Christopher J. Hull, Metewo S.Enuameh, Matthew D. Basciotta, Jessi A. Brase�eld, Cong Zhu, Yuna Asriyan, David S.Lapointe, Sinha Saurabh, Wolfe Scott A., and Brodsky Michael H. FlyFactorSurvey: adatabase of Drosophila transcription factor binding speci�cities determined using the bacterialone-hybrid system. Nucleic Acids Research, 39(Database):D111�7, Nov 2010. 7.15
106

[207] Claudia B Zraly, Frank A Middleton, and Andrew K Dingwall. Hormone-response genes aredirect in vivo regulatory targets of Brahma (SWI/SNF) complex function. The Journal ofbiological chemistry, 281(46):35305�15, November 2006. 2.2
107
List of Figures
Introduction 9
1 Regulation of eukaryotic gene expression . . . . . . . . . . . . . . . . . . . . . . . . . 92 microRNA biogenesis and mode of action . . . . . . . . . . . . . . . . . . . . . . . . 123 Ecdysone concentration and gene cascade during development . . . . . . . . . . . . . 144 Spatio-temporal patterning of ecdysone signaling . . . . . . . . . . . . . . . . . . . . 175 Schematic representation of metabolic 4sU RNA labeling . . . . . . . . . . . . . . . . 186 Aims and scope of this thesis . . . . . . . . . . . . . . . . . . . . . . . . . . . . . . . 21
Methods 23
Results & Discussion 38
7 Ecdysone treated S2 cells exit the cell cycle and di�erentiate . . . . . . . . . . . . . . 398 Establishing 4sU labeling and the transcriptional time scale of ecdysone signaling in
S2 cells . . . . . . . . . . . . . . . . . . . . . . . . . . . . . . . . . . . . . . . . . . . 419 DTA monitors the dynamics of gene expression with superior sensitivity and higher
temporal resolution than conventional transcriptomics . . . . . . . . . . . . . . . . . 4210 Ecdysone induces major, progressively increasing and mostly sustained changes in
gene expression . . . . . . . . . . . . . . . . . . . . . . . . . . . . . . . . . . . . . . . 4311 Ecdysone represses genes involved in cell cycle, mitosis and DNA replication . . . . . 4512 Ecdysone a�ects energy and biomolecule production . . . . . . . . . . . . . . . . . . 4613 Ecdysone induces genes involved in morphogenesis and di�erentiation . . . . . . . . . 4614 First global assessment of ecdysone regulated synthesis and decay rates . . . . . . . . 4715 Ecdysone induces various temporal patterns of transcription, decay rates and total
expression level . . . . . . . . . . . . . . . . . . . . . . . . . . . . . . . . . . . . . . . 4916 DTA reveals multiple distinct groups of co-regulated genes downstream of ecdysone
signaling . . . . . . . . . . . . . . . . . . . . . . . . . . . . . . . . . . . . . . . . . . . 5117 Co-regulated genes are characterized by individual kinetic features and functional
annotation . . . . . . . . . . . . . . . . . . . . . . . . . . . . . . . . . . . . . . . . . . 5418 Establishing miRNA pro�ling in ecdysone treated S2 cells . . . . . . . . . . . . . . . 5619 NanoString expression pro�ling identi�es known and novel ecdysone regulated miRNAs 5720 Novel decay rate-based approach for miRNA-mRNA network analysis . . . . . . . . . 6021 miRNA-mRNA network during the ecdysone response . . . . . . . . . . . . . . . . . 6222 Transcriptional and post-transcriptional regulators of ecdysone induced gene expres-
sion kinetics . . . . . . . . . . . . . . . . . . . . . . . . . . . . . . . . . . . . . . . . . 6523 miRNAs regulate individual genes in speci�c kinetic clusters . . . . . . . . . . . . . . 6624 Outline of the genome-wide experiments for dissecting the Drosophila core promoter 7325 Spike-In procedure is highly reproducible and controls for nascent RNA extraction
e�ciency . . . . . . . . . . . . . . . . . . . . . . . . . . . . . . . . . . . . . . . . . . . 7426 InDA-C technology e�ciently depletes rRNA . . . . . . . . . . . . . . . . . . . . . . 75
List of Tables
1 Cell culture medium and supplements . . . . . . . . . . . . . . . . . . . . . . . . . . 232 Cell culture consumables . . . . . . . . . . . . . . . . . . . . . . . . . . . . . . . . . . 233 Primers used for RT-PCR . . . . . . . . . . . . . . . . . . . . . . . . . . . . . . . . . 23
108
4 PCR primers used for Spike-In ampli�cation . . . . . . . . . . . . . . . . . . . . . . . 245 Spike-Ins . . . . . . . . . . . . . . . . . . . . . . . . . . . . . . . . . . . . . . . . . . . 246 Antibodies and probes . . . . . . . . . . . . . . . . . . . . . . . . . . . . . . . . . . . 247 Bu�ers and solutions . . . . . . . . . . . . . . . . . . . . . . . . . . . . . . . . . . . . 258 Consumables for metabolic RNA labeling . . . . . . . . . . . . . . . . . . . . . . . . 259 Consumables and platforms for expression pro�ling . . . . . . . . . . . . . . . . . . . 2610 Consumables for nucleic acid quanti�cation . . . . . . . . . . . . . . . . . . . . . . . 2611 Staining for �ow cytometry . . . . . . . . . . . . . . . . . . . . . . . . . . . . . . . . 26
Results & Discussion 3812 Individual functional enrichment terms of the twenty kinetically distinct gene groups 5513 Summary of the miRNA-mRNA network during the ecdysone response . . . . . . . . 63
109
Copyright © 2022 FDOKUMEN