Global boundary controllability of the Saint-Venant system for sloped canals with friction
Upload
independentCategory
view
0download
0
R
Qpa
Za
b
c
a
ARRA
KBQOVMBS
1
agtvcptcacbu
MT
0d
Annals of Anatomy 193 (2011) 211–219
Contents lists available at ScienceDirect
Annals of Anatomy
journa l homepage: www.e lsev ier .de /aanat
esearch article
uantification of compact bone microporosities in the basal and alveolarortions of the human mandible using osteocyte lacunar density andrea fraction of vascular canals
bynek Tonara,b,∗, Ismail Khadangc, Pavel Fialac, Lukás Nedorosta, Petra Kochováb
Department of Histology and Embryology, Faculty of Medicine in Pilsen, Charles University in Prague, Karlovarská 48, 301 66 Pilsen, Czech RepublicDepartment of Mechanics, Faculty of Applied Sciences, University of West Bohemia, Univerzitní 8, 306 14 Pilsen, Czech RepublicDepartment of Anatomy, Faculty of Medicine in Pilsen, Charles University in Prague, Karlovarská 48, 301 66 Pilsen, Czech Republic
r t i c l e i n f o
rticle history:eceived 10 June 2010eceived in revised form 20 January 2011ccepted 1 February 2011
eywords:oneuantificationsteocyte lacunaeascular canals
s u m m a r y
Based on the orientation of the osteons, the basal portion and the alveolar portion of the body of the humanmandible can be distinguished. In the compact bone, two types of microporosities can be quantified, theosteocyte lacunae and the vascular canals. Our aim was (i) to perform three-dimensional reconstruction ofosteocyte lacunae to suggest an efficient means of sampling to estimate their numerical density and (ii) tocompare bone microporosities in the basal and the alveolar portions of ten mandibles. Using optical disec-tor, we estimated the density of osteocyte lacunae, and using a stereological point-counting technique, wequantified the area fraction of the vascular canals. The diameter of the lacunae was 14 ± 3 �m. While thefraction of vascular canals was comparable in both parts of the body of the mandible, the numerical densityof osteocyte lacunae was higher (p = 0.007) in the alveolar portion (17056 ± 1264/mm3) than in the basalportion (14522 ± 665/mm3). The lacunar and vascular microporosities were statistically independent of
icroporositiesiomechanicstereology
each other. As this is the first three-dimensional counting of osteocyte lacunae, we discuss the relationof this parameter to the biomechanics of the mandible, and we compare our data with previously usedtwo-dimensional methods. We present an efficient sampling method that is useful for the histologicaldescription of bone microporosities. When taking into account the spatial characteristics of lacunae, thelocally specific numerical density of lacunae can be easily assessed with the three-dimensional counting
sed b
method, which is not bia. Introduction
The relationship between the structure of the mandibular bodynd its properties is relevant when dealing with mandibularrowth, distraction and reconstruction techniques, fractures, den-al implants and other dentoalveolar conditions. From the point ofiew of functional morphology, two parts of the mandibular bodyan be distinguished: the basal and the alveolar parts. The basalart is formed by a thick basal arch with osteons running parallelo the lower margin of the body of the mandible. The alveolar pro-ess of the mandible is located on this arch, but with osteons havingpreferentially vertical orientation. The mandible is loaded with a
ombination of sagittal bending, rotation of the body and transverseending (Van Eijden, 2000). The alveolar process is predominantlynder pressure, whereas the basal arch is under tension caused
∗ Corresponding author at: Department of Histology and Embryology, Faculty ofedicine in Pilsen, Karlovarská 48, 301 66 Pilsen, Czech Republic.
el.: +420 377593320/607818614; fax: +420 377593329.E-mail address: [email protected] (Z. Tonar).
940-9602/$ – see front matter © 2011 Elsevier GmbH. All rights reserved.oi:10.1016/j.aanat.2011.02.001
y the variation in size and orientation of the lacunae.© 2011 Elsevier GmbH. All rights reserved.
by the masticatory muscles. This pressure and tension correspondwith the orientation of the vascular canals, which can be easilymacroscopically visualised (Khadang, 2003, see also Fig. 1B). Histo-logically, the mandibular body is formed by secondary (Haversian)cortical and trabecular bone consisting of osteons and interstitiallamellae. Central canals of osteons form a dense spatial networkwith rich interconnections; their orientation corresponds to thedirection of the first principal stress (Martin and Burr, 1989; Petrtylet al., 1996). The dominant mode of loading bones can be deducedfrom the direction of the osteons (Hert et al., 1994; Fiala et al., 1998;Fiala and Hert, 1999).
Remodelling of Haversian bone results in both spatial and tem-poral variability of osteocyte lacunar density and arrangementof vascular canals, which are, together with bone microcracks,sometimes referred to as “bone microporosities” (Rohan andCimrman, 2010; Tonar et al., 2010). The microporosity hastwo functional levels, the vascular porosity (related to vas-
cular canals; order 10–1000 �m) and the lacunar-canalicularporosity (surrounding the osteocytes; order 0.1–10 �m), whilesome authors (Corwin, 2001) report even a third level ofnanoporous spaces between the collagen and mineral crystal-
2 Anato
lcrcbtmpaatrbh
(otptVt(njcbpwsfq
1
2
2
2
7mvtwgatg7we
12 Z. Tonar et al. / Annals of
ites (order 10 nm). Microporosities and osteocyte deficiencyan be related to the propensity of the bone to traumaticupture (Forwood and Parker, 1989; Qiu et al., 2005). Quantifi-ation of lacunae and vascular canals might be relevant to theiomechanics of the human mandible, traumatology and implan-ology (Nomura et al., 2006). The microstructure of the human
andibular condyle has already been the subject of several mor-hometric studies (Cioffi et al., 2007; Renders et al., 2007). Inddition, the regional differences in the architecture and miner-lisation of the developing porcine mandible have been mappedhoroughly (Mulder et al., 2006). However, no histomorphomet-ic study has been published concerning the possible differencesetween the compact bone of the basal and alveolar portions of theuman mandible.
Current classification of bone histomorphometric parametersParfitt, 1988; Rauch, 2006) includes bone and osteoid volume,steoid thickness, osteoclast number, bone surface, trabecularhickness and separation, and bone formation rate. Although thesearameters have been used recently in studies dealing with the his-omorphometry of both normal and pathological bone tissue (e.g.,ashishth et al., 2000, 2002, 2005), none of these studies describes
he distribution and density of osteocytes as three-dimensional3-D) entities. Although an unbiased 3-D method for counting lacu-ae was suggested 25 years ago in one of the most acknowledged
ournals of microscopy (Howard et al., 1985), no quantitative dataoncerning the numerical density of osteocyte lacunae have yeteen published. The number of osteocyte lacunae in bone sam-les can be estimated using the disector principle (Sterio, 1984),hich gives an estimate of particle number unbiased by the various
izes (Yeager et al., 1975) or orientations of the lacunae. There-ore, the aim of the present study was to answer the followinguestions:
. What are the typical dimensions of osteocyte lacunae in thehuman mandible and how does one perform an efficient three-dimensional sampling of compact bone for estimating theirnumerical density? Can the locally specific numerical densityof lacunae be easily assessed with a three-dimensional countingmethod not biased by the variation in size and orientation of thelacunae?
. Are there any quantitative differences in microporositiesbetween the two portions of the body of the mandible with dif-ferent orientations of vascular canals, i.e., between the basal andalveolar part?
. Materials and methods
.1. Tissue processing and sampling
We used ten mandibles from male cadavers between 55 and5 years of age and free of any previous bone-affecting disease oredication. In all mandibles, partial dentition was preserved, pro-
iding adequate masticatory function. Paired samples representinghe basal and alveolar part were sawed from the medial (vestibular)all of the middle portion of the body of the mandible (n = 10) and
round with frontal orientation (Fig. 1A and B). From each block,n undecalcified, frontal section, which was approximately 2 mmhick, was sawed, ground manually on abrasive paper of increasing
rades (starting with grade 200, polishing with grade 2000) to a0–120 �m thick section, stained with basic fuchsin, and observedith an optical microscope (the method was previously described,.g., by Paral et al. (2007) and Mastalkova et al. (2008)).
my 193 (2011) 211–219
2.2. Three-dimensional reconstruction of osteocyte lacunae
To evaluate the 3-D size of osteocyte lacunae (Aim #1), wecarried out a 3-D reconstruction of a Haversian vascular canaland its surrounding lacunae as part of a randomly selectedHaversian system. Using an immersion objective (100×, numer-ical aperture 1.25), 90 optical equidistant sections were takenfrom a randomly selected but contrast-stained part of an osteon.The optical sections were perpendicular to the long axis of theHaversian canal and the Z-interval between each of two adja-cent micrographs was 1.25 �m (microscope Olympus BX51 witha programmable motorised Z-stage). After cropping, this resultedin a stack of micrographs with dimensions of the bounding boxbeing 136.6 �m × 102.3 �m × 112.5 �m. The stack was importedto the Amira 3.0 software (TGS Europe, Merignac Cedex, France).All colour micrographs were converted to 8-bit colour depth, andthe images underwent segmentation by labelling the outlines of theHaversian canal and of the osteocyte lacunae with use of a graphicaltablet. The number of lacunar profiles in focus on each optical sec-tion ranged from six to ten. The resulting set of two-dimensional(2-D) contours was then reconstructed into a 3-D model, whichcomprised 42 completely rendered lacunae. Using a built-in linemeasurement tool, we assessed the mean height of the 42 recon-structed lacunae (i.e., their dimension projected to the Z-axis, whichwas parallel to the Haversian canal and perpendicular to the cuttingplane). Due to the resolution of the model, the results are pre-sented as mean ± standard deviation, with values rounded-off tomicrometers.
2.3. Quantification of osteocyte lacunar density and area fractionof vascular canals
We quantified the numerical density of the osteocyte lacunaein compact bone, while five image frames were sampled in a sys-tematic uniform random manner from each section. A series ofseven optical sections registered with respect to the Z-axis werephotographed in each image frame (Fig. 1C and D) with an oilimmersion objective (60×, numerical aperture 1.35) and motorisedZ-stage. The unbiased counting rule of the optical disector (Sterio,1984) was applied (Fig. 2A–C) to these series to assess the numberof osteocyte lacunae per unit volume according to the Eq. (1):
estNV (par) =∑n
i=1Q−i
(par)∑n
i=1Pi(ref )× p
a × h, (1)
where estNV(par) is the estimated numerical density, Q−(par) is thenumber of particles (lacunae) sampled by the i-th disector, Pi(ref)is the number of points of the p-point grid within the i-th countingframe hitting the reference space (Fig. 2D), a is the actual area ofthe counting frame, and h is the height of the disector. Accordingto the sampling described above, quantification of lacunar densityto determine differences between the basal and alveolar part often mandibles (Aim #2) was based on 750 micrographs. The vari-ation in the number of lacunae in the series of optical sections ofeach specimen was assessed with use of the coefficient of error CEcalculated with the quadratic approximation formula of Matheron,modified for use in a stereological context (Gundersen and Jensen,1987).
The area fraction of the profiles of vascular canals in thebone sections AA(canals,bone) was estimated based on micrographstaken with low magnification (objective 2×) using the point-
counting method (Fig. 2E and F) according to the Eq. (2):AA(canals, bone) = estA(canals)estA(bone)
, (2)

Z. Tonar et al. / Annals of Anatomy 193 (2011) 211–219 213
Fig. 1. Sampling of tissue blocks and image frames. (A) Tissue blocks were sawed and ground with frontal orientation from the middle portion of the body of ten mandibles.(B) External wall of the alveolar process of the mandible with mainly vertically running vascular canals of osteons (V) supported by the basal arch of the body of the mandiblewith horizontally running tensional osteons (H). Vascular canals were visualised with India ink (according to Hert et al., 1994; cf. Baca et al., 2007). When investigatingdifferences between the basal and alveolar parts of another ten mandibles, paired samples were sawed from the medial (vestibular) wall and were ground with frontalorientation. (C) Frontal ground section of the basal part of the mandible, stained with basic fuchsin. Image frames were sampled in a systematic uniform random manner(marked with a tick in this example), and as a result, five stacks of seven optical sections (i.e., 35 micrographs) were assessed from each tissue block. Scale bar 700 �m. (D)From each image frame, seven equidistant optical sections were taken and used for counting the lacunae with the optical disector. (E) Photograph of a three-dimensionalreconstruction of a part of an osteon with Haversian canal (yellow) and osteocyte lacunae (purple). Reconstruction was based on a series of 90 optical sections (one of these90 planes is shown). (F) A close-up view of the reconstructed Haversian canal (yellow) and a group of adjacent osteocyte lacunae (purple). (For interpretation of the referencesto color in this figure legend, the reader is referred to the web version of the article.)
214 Z. Tonar et al. / Annals of Anatomy 193 (2011) 211–219
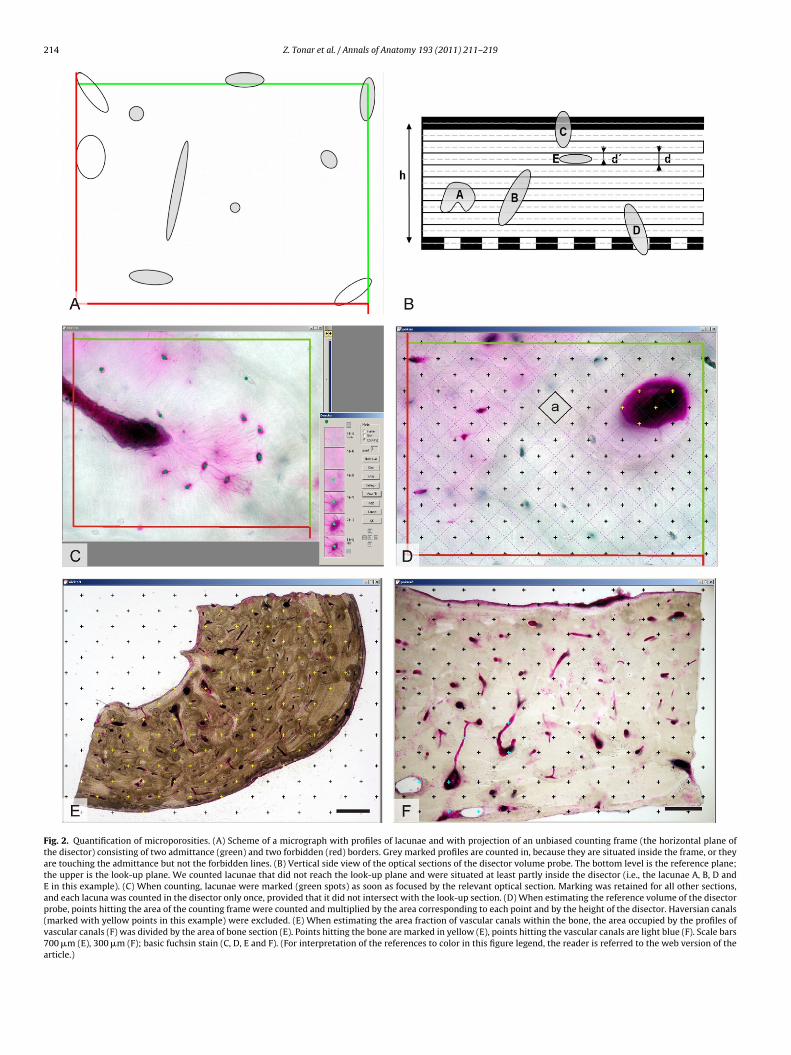
Fig. 2. Quantification of microporosities. (A) Scheme of a micrograph with profiles of lacunae and with projection of an unbiased counting frame (the horizontal plane ofthe disector) consisting of two admittance (green) and two forbidden (red) borders. Grey marked profiles are counted in, because they are situated inside the frame, or theyare touching the admittance but not the forbidden lines. (B) Vertical side view of the optical sections of the disector volume probe. The bottom level is the reference plane;the upper is the look-up plane. We counted lacunae that did not reach the look-up plane and were situated at least partly inside the disector (i.e., the lacunae A, B, D andE in this example). (C) When counting, lacunae were marked (green spots) as soon as focused by the relevant optical section. Marking was retained for all other sections,and each lacuna was counted in the disector only once, provided that it did not intersect with the look-up section. (D) When estimating the reference volume of the disectorprobe, points hitting the area of the counting frame were counted and multiplied by the area corresponding to each point and by the height of the disector. Haversian canals(marked with yellow points in this example) were excluded. (E) When estimating the area fraction of vascular canals within the bone, the area occupied by the profiles ofvascular canals (F) was divided by the area of bone section (E). Points hitting the bone are marked in yellow (E), points hitting the vascular canals are light blue (F). Scale bars700 �m (E), 300 �m (F); basic fuchsin stain (C, D, E and F). (For interpretation of the references to color in this figure legend, the reader is referred to the web version of thearticle.)

Z. Tonar et al. / Annals of Anatomy 193 (2011) 211–219 215
F steocyu vascu(
wcWcitota(
2
hdtshmtTfcstcmvw
3
d1FdpHbmd
ig. 3. Results of the quantification of microporosities. (A) Numerical density of onder study (Wilcoxon matched pairs test, n = 10, p = 0.007). (B) The area fraction ofWilcoxon matched pairs test, n = 10, p = 0.878).
here estA(canals) was the estimated area of profiles of vascularanals, and estA(bone) was the estimated area of the bone section.
hen using the point-counting method, the minimum number ofounted intersections between the point grid and the structures ofnterest always exceeded 200 for each sample. When comparinghe estimated area with the actual area (based on planimetry afterutlining the section manually), the relative difference betweenhe estimated and actual total area of the bone was 0.80%. Disectornd point-grid counting was performed with the Ellipse softwareViDiTo, Kosice, Slovak Republic).
.4. Statistical hypotheses
The quantitative aims of the study can be formulated as nullypotheses to be tested as follows: neither the mean numericalensity of osteocyte lacunae (hypothesis H0A) nor the area frac-ion of vascular canals (hypothesis H0B) differs between pairedamples taken from the basal and the alveolar portion of the tenuman mandibles. The H0A and H0B hypotheses claim that theicroporosities are independent of the different orientations of
he osteons in the alveolar and basal part of the same mandible.he average number of osteocyte lacunae per mm3 and the arearactions of the profiles of vascular canals in the bone were pro-essed with the Statistica Base 8 (StatSoft, Inc., Tulsa, OK, USA). Asome of the data sets did not pass the Shapiro–Wilks’ W normalityest, we used the nonparametric Wilcoxon Matched Pairs test toompare paired values describing the basal and alveolar part of theandible. As a measure of the statistical relationship between the
ariables, Spearman rank order correlations were used. All resultsere considered statistically significant if p < 0.05.
. Results
The 3-D reconstruction (Fig. 1E and F) revealed that the meaniameter of the lacunae perpendicular to the section plane was4 ± 3 �m. The quantification of microporosities is summarised inig. 3 and Table 1. The paired values showed that the numericalensity of osteocyte lacunae was higher (Fig. 3A) in the alveolarart than in the basal part of the mandibles under study (p = 0.007,
0A rejected), and the area fraction of vascular canals within theone (Fig. 3B) was the same in the alveolar and basal portion of theandibles under study (H0B cannot be rejected). The numericalensity of osteocyte lacunae estNv was not correlated (Spearman
te lacunae was higher in the alveolar part than in the basal part of the mandibleslar canals was the same in the alveolar and basal part of the mandibles under study
R = 0.12, p > 0.05) with the area fraction of vascular canals withinthe bone AA(canals,bone).
4. Discussion
4.1. Interpreting the morphometry of bone microporosities
The three-dimensional reconstruction was the first step in eval-uating the dimensions of the osteocyte lacunae. The true size ofthe lacunae might be much more variable (cf. Yeager et al., 1975) ifbased on more extensive sampling than that done in our study. Wenoticed that 100–110 �m was the limit of optical sectioning of ourundecalcified bone sections, as the segmentation of lacunae on thelast ten optical sections became unreliable.
While the numerical density of osteocyte lacunae was higherin the alveolar portion than in the basal portion of the mandibles,the area fraction of vascular canals was the same in both parts. Thelacunar level of microporosity is statistically independent of vas-cular porosity. A positive correlation would suggest that a denservascular network can supply more osteocytes. As part of the lacu-nae do not contain vital osteocytes, an increased fraction of emptylacunae might represent a potential source of fatigue-inducedmicrocracks, as the bone matrix surrounding the empty lacunaelikely has a slow remineralisation rate. The viability of osteocytesand remodelling activity decreases with age (Dunstan et al., 1993),thus contributing to the fatigue-related microdamage (Verborgtet al., 2000; Vashishth et al., 2000). Bone cellular density dependson the number of osteoblasts incorporated into the matrix, whichresults from the balance between their life span and apoptoticrate. Anabolic remodelling of bone is stimulated, e.g., by intermit-tent parathormone administration, which prevents the apoptosisof osteoblasts (Lossdörfer et al., 2010; Jilka et al., 1999) by counter-acting the adverse effect of glucocorticoids on bone viability andformation (Weinstein et al., 2010). While physiological mechanicalstimulation supports bone formation, abnormal mechanical ten-sion triggers apoptosis of osteoblasts (Meyer et al., 1999). AlthoughCano et al. (2006) gave a comprehensive review of the molecularmechanisms of bone formation and remodelling, the relationship ofthese mechanisms and functional conditions to lacunar or vascular
density is still unclear. This gap in knowledge is quite challengingas it has clinical consequences. Uckan et al. (2002) demonstratedthat mandibular basal distraction may be successfully used for thereconstruction of the mandible in patients with loss of alveolar
216 Z. Tonar et al. / Annals of Anatomy 193 (2011) 211–219
Table 1Quantification of osteocyte lacunar density. The estimates were calculated with the disector formula (Eq. (1)) separately for the basal and alveolar parts of each mandible.∑
Q−(par) is the total number of lacunae counted by the disector volume probes per sample; estNV(par) is the estimated numerical density of osteocyte lacunae per unitvolume presented as a mean value of the five disectors applied to the bone samples; CE is the coefficient of error illustrating the variation in the number of lacunae countedin the series of optical sections of each specimen (Gundersen and Jensen, 1987). The bottom part of the table summarises the mean values calculated per basal and alveolarparts of the mandibles and the corresponding standard deviations (SD) and coefficient of variations (CV, calculated as a ratio CV = SD/estNV(par)).
Mandible No. Part of mandible∑
Q−(par) estNV(par) (lacunae/1 mm3) CE Group SD Group CV
Individual specimens1 Basal 104 12794.8 0.047
Alveolar 129 16094.7 0.0642 Basal 107 13260.4 0.067
Alveolar 119 14979.4 0.0543 Basal 107 12894.1 0.079
Alveolar 100 12858.3 0.0634 Basal 108 13786.4 0.070
Alveolar 132 15795.5 0.0605 basal 115 14058.3 0.057
alveolar 123 14728.1 0.0616 Basal 101 13087.9 0.055
Alveolar 127 15603.4 0.0677 Basal 112 13423.8 0.057
Alveolar 123 14272.6 0.0788 Basal 119 14522.7 0.057
Alveolar 130 15183.6 0.0709 Basal 98 12450.6 0.054
Alveolar 132 17056.3 0.07210 Basal 114 14120.8 0.059
Alveolar 142 17005.7 0.062Mean values
40.057.8
bptftdbtdrabtoattAfomdpttm
ptorhvitct
1–10 Basal 1085 1341–10 Alveolar 1257 153
one. This is in agreement with our findings that the vascular micro-orosity, which probably governs the growth of whole osteons, ishe same in the basal and alveolar part. Also, Raoul et al. (2009)ound that, in most patients, the alveolar and basal bone responseo tensile strain was macroscopically comparable. The activity andensity of osteoblasts recruited to a bone formative surface cane measured by labelling of newly formed bone as the mineralisa-ion apposition rate (MAR). In growing individuals, MAR stronglyepends on mandibular growth, the major site of which is theamus, the alveolar ridge and the condyle (Liu et al., 2006). Allennd Burr (2008) demonstrated that, in canine mandibles, alveolarone had a higher bone formation rate than non-alveolar bone andhe intracortical bone turnover was 2–4 times greater in the alve-lar region than in the basal portion. Although no MAR data arevailable in the human mandible, higher bone formation rate andurnover might be linked to the higher lacunar density found inhe alveolar portion in our study. The cause for this is not known.lthough the basal and alveolar parts of the mandible have dif-
erent types of loading and, therefore, a different orientation ofsteons, it is possible that the effect of tension and pressure on boneicrostructure is essentially comparable. Should the 3-D lacunar
ensity be a simple function of mechanical bone loading, the sim-lest explanation for the differences found in our study would behat the pressure acting on the alveolar part is absolutely higherhan the tension caused within the basal arch by the masticatory
uscles.Regarding the area fraction of vascular canals, we offer three
ossible interpretations. First, it is a microporosity at a higher levelhan the density of osteocyte lacunae, and it can be assessed notnly histologically but also with use of micro-computed tomog-aphy (Renders et al., 2007). Second, it might be linked to theealing and growth of the mandible. Third, assessment of theascularisation seems to be important for infiltration anaesthesia
n dental medicine (Yassen, 2010) and may explain why infiltra-ion anaesthesia is so efficient, thus contributing to the debateoncerning mandibular infiltration versus mandibular block anaes-hesia.0.060 665.7 0.0500.065 1264 0.082
4.2. Relation of microporosities to bone biomechanics
The quantification of bone microporosities is used for testingtheir effect on the viscoelastic properties of bone tissue. Most ofthe papers on the mathematical and computational models of boneare based on Biot’s theory of poroelastic solids (reviewed, e.g., byCorwin, 2001), where the matrix of porous bone material deformsunder compressive loading, thus increasing the pressure in the fluidwithin the pores. The pore volume fraction is partially occupiedby immobile organic material (endothelium, fibroblasts, pericytes,osteoblasts, osteoclasts and osteocytes) and partially occupiedby mobile bone fluid. This approach involves fluid–solid inter-actions and hydro-mechanical responses of the porous mediumduring tension, bending and shear. Advanced models (e.g., Rohanand Cimrman, 2010) reflect the prominent morphological hetero-geneity of the porosities, and although they employ sophisticatedand highly abstract mathematical apparatuses, they acknowledgethat the morphological assessment of the porosities is a key tounderstanding and predicting macroscopic stiffness and strengthbehaviour.
Experimental and observational biomechanical studies primar-ily deal with bone microcracks, with the identification of boneelastic modules (describing the stress–strain behaviour) and theultimate strength of various bones. The mechanical experimentsclearly demonstrate that the hierarchical organisation of bonearchitecture is crucial and that bone structural heterogeneity varieswith the scale of magnification (for a review on human and animalbone parameters see Liebschner, 2004). In addition to natural bonemicroporosities, microdamages accumulate with age and have aneffect on bone toughness or resistance to fracture (Mohsin et al.,2006). The role of microporosities becomes more obvious withthe increasing number of studies investigating tissue engineeringmaterials with bone-like structures, such as bone and cartilage scaf-
folds. The porosities of scaffolds are usually higher than in nativebone, and the pore morphology is usually much more homoge-neous. Therefore, scaffolds possess mechanical properties withinthe lower range of native bone (Hou et al., 2003).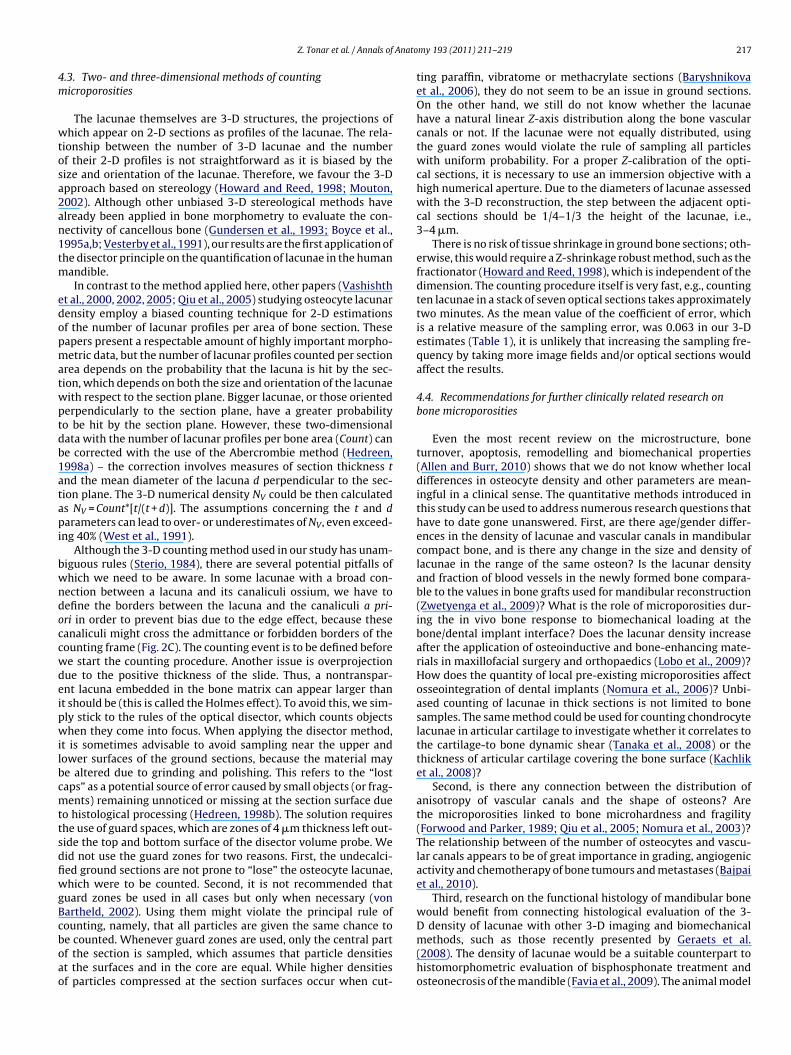
Anato
4m
wtosa2an1tm
edopmatwptdb1atapi
bwndoccwdeipwilbcmttsdfiwgBcboao
Z. Tonar et al. / Annals of
.3. Two- and three-dimensional methods of countingicroporosities
The lacunae themselves are 3-D structures, the projections ofhich appear on 2-D sections as profiles of the lacunae. The rela-
ionship between the number of 3-D lacunae and the numberf their 2-D profiles is not straightforward as it is biased by theize and orientation of the lacunae. Therefore, we favour the 3-Dpproach based on stereology (Howard and Reed, 1998; Mouton,002). Although other unbiased 3-D stereological methods havelready been applied in bone morphometry to evaluate the con-ectivity of cancellous bone (Gundersen et al., 1993; Boyce et al.,995a,b; Vesterby et al., 1991), our results are the first application ofhe disector principle on the quantification of lacunae in the human
andible.In contrast to the method applied here, other papers (Vashishth
t al., 2000, 2002, 2005; Qiu et al., 2005) studying osteocyte lacunarensity employ a biased counting technique for 2-D estimationsf the number of lacunar profiles per area of bone section. Theseapers present a respectable amount of highly important morpho-etric data, but the number of lacunar profiles counted per section
rea depends on the probability that the lacuna is hit by the sec-ion, which depends on both the size and orientation of the lacunaeith respect to the section plane. Bigger lacunae, or those orientederpendicularly to the section plane, have a greater probabilityo be hit by the section plane. However, these two-dimensionalata with the number of lacunar profiles per bone area (Count) cane corrected with the use of the Abercrombie method (Hedreen,998a) – the correction involves measures of section thickness tnd the mean diameter of the lacuna d perpendicular to the sec-ion plane. The 3-D numerical density NV could be then calculateds NV = Count*[t/(t + d)]. The assumptions concerning the t and darameters can lead to over- or underestimates of NV, even exceed-
ng 40% (West et al., 1991).Although the 3-D counting method used in our study has unam-
iguous rules (Sterio, 1984), there are several potential pitfalls ofhich we need to be aware. In some lacunae with a broad con-ection between a lacuna and its canaliculi ossium, we have toefine the borders between the lacuna and the canaliculi a pri-ri in order to prevent bias due to the edge effect, because theseanaliculi might cross the admittance or forbidden borders of theounting frame (Fig. 2C). The counting event is to be defined beforee start the counting procedure. Another issue is overprojectionue to the positive thickness of the slide. Thus, a nontranspar-nt lacuna embedded in the bone matrix can appear larger thant should be (this is called the Holmes effect). To avoid this, we sim-ly stick to the rules of the optical disector, which counts objectshen they come into focus. When applying the disector method,
t is sometimes advisable to avoid sampling near the upper andower surfaces of the ground sections, because the material maye altered due to grinding and polishing. This refers to the “lostaps” as a potential source of error caused by small objects (or frag-ents) remaining unnoticed or missing at the section surface due
o histological processing (Hedreen, 1998b). The solution requireshe use of guard spaces, which are zones of 4 �m thickness left out-ide the top and bottom surface of the disector volume probe. Weid not use the guard zones for two reasons. First, the undecalci-ed ground sections are not prone to “lose” the osteocyte lacunae,hich were to be counted. Second, it is not recommended that
uard zones be used in all cases but only when necessary (vonartheld, 2002). Using them might violate the principal rule ofounting, namely, that all particles are given the same chance to
e counted. Whenever guard zones are used, only the central partf the section is sampled, which assumes that particle densitiest the surfaces and in the core are equal. While higher densitiesf particles compressed at the section surfaces occur when cut-my 193 (2011) 211–219 217
ting paraffin, vibratome or methacrylate sections (Baryshnikovaet al., 2006), they do not seem to be an issue in ground sections.On the other hand, we still do not know whether the lacunaehave a natural linear Z-axis distribution along the bone vascularcanals or not. If the lacunae were not equally distributed, usingthe guard zones would violate the rule of sampling all particleswith uniform probability. For a proper Z-calibration of the opti-cal sections, it is necessary to use an immersion objective with ahigh numerical aperture. Due to the diameters of lacunae assessedwith the 3-D reconstruction, the step between the adjacent opti-cal sections should be 1/4–1/3 the height of the lacunae, i.e.,3–4 �m.
There is no risk of tissue shrinkage in ground bone sections; oth-erwise, this would require a Z-shrinkage robust method, such as thefractionator (Howard and Reed, 1998), which is independent of thedimension. The counting procedure itself is very fast, e.g., countingten lacunae in a stack of seven optical sections takes approximatelytwo minutes. As the mean value of the coefficient of error, whichis a relative measure of the sampling error, was 0.063 in our 3-Destimates (Table 1), it is unlikely that increasing the sampling fre-quency by taking more image fields and/or optical sections wouldaffect the results.
4.4. Recommendations for further clinically related research onbone microporosities
Even the most recent review on the microstructure, boneturnover, apoptosis, remodelling and biomechanical properties(Allen and Burr, 2010) shows that we do not know whether localdifferences in osteocyte density and other parameters are mean-ingful in a clinical sense. The quantitative methods introduced inthis study can be used to address numerous research questions thathave to date gone unanswered. First, are there age/gender differ-ences in the density of lacunae and vascular canals in mandibularcompact bone, and is there any change in the size and density oflacunae in the range of the same osteon? Is the lacunar densityand fraction of blood vessels in the newly formed bone compara-ble to the values in bone grafts used for mandibular reconstruction(Zwetyenga et al., 2009)? What is the role of microporosities dur-ing the in vivo bone response to biomechanical loading at thebone/dental implant interface? Does the lacunar density increaseafter the application of osteoinductive and bone-enhancing mate-rials in maxillofacial surgery and orthopaedics (Lobo et al., 2009)?How does the quantity of local pre-existing microporosities affectosseointegration of dental implants (Nomura et al., 2006)? Unbi-ased counting of lacunae in thick sections is not limited to bonesamples. The same method could be used for counting chondrocytelacunae in articular cartilage to investigate whether it correlates tothe cartilage-to bone dynamic shear (Tanaka et al., 2008) or thethickness of articular cartilage covering the bone surface (Kachliket al., 2008)?
Second, is there any connection between the distribution ofanisotropy of vascular canals and the shape of osteons? Arethe microporosities linked to bone microhardness and fragility(Forwood and Parker, 1989; Qiu et al., 2005; Nomura et al., 2003)?The relationship between of the number of osteocytes and vascu-lar canals appears to be of great importance in grading, angiogenicactivity and chemotherapy of bone tumours and metastases (Bajpaiet al., 2010).
Third, research on the functional histology of mandibular bonewould benefit from connecting histological evaluation of the 3-D density of lacunae with other 3-D imaging and biomechanical
methods, such as those recently presented by Geraets et al.(2008). The density of lacunae would be a suitable counterpart tohistomorphometric evaluation of bisphosphonate treatment andosteonecrosis of the mandible (Favia et al., 2009). The animal model
2 Anato
o(
eHlmtwumtmcTo
A
oMwNKbcM
R
A
A
B
B
B
B
B
B
C
C
C
D
F
F
F
F
18 Z. Tonar et al. / Annals of
f mandibular necrosis established recently by Burr and Allen2009) would be suitable for this purpose.
In conclusion, we proved that the optical disector can be usedfficiently for estimating the lacunar density as suggested byoward et al. (1985). The locally specific numerical density of
acunae can easily be assessed with a three-dimensional countingethod that is not biased by the variation in size and orientation of
he lacunae. The fraction of vascular canals can be easily assessedith the stereological point-counting method. These methods areseful for a description of local heterogeneities in the body of theandible. In other histological areas of research, e.g., in neurohis-
ology, the disector has already been established as a very efficientethod, and it is considered to be the golden standard for counting
ells and other spatial objects (cf. West et al., 1991; West, 1999).herefore, we recommend the use of the disector in bone stereol-gy.
cknowledgements
Supported by the Ministry of Education, Youth and Sportsf the Czech Republic under Project No. MSM4977751303 andSM0021620819. The development of quantification techniquesas supported by the Grant Agency of the Czech Republic, Projecto. 106/09/0740. The authors acknowledge the kind advice of Prof.irsti Witter (Vienna, Austria) concerning histological processing ofone. This cooperation received partial support from The Scientificooperation between Czech Republic and Austria, Project KontaktE09090.
eferences
llen, M.R., Burr, D.B., 2008. Mandible matrix necrosis in beagle dogs after 3 yearsof daily oral bisphosphonate treatment. J. Oral Maxillofac. Surg. 66, 987–994.
llen, M.R., Burr, D.B., 2010. Bisphosphonate effects on bone turnover, microdamage,and mechanical properties: what we think we know and what we know that wedon’t know. Bone, 159, doi:10.1016/j.bone.2010.10.
aca, V., Kachlik, D., Horak, Z., Stingl, J., 2007. The course of osteons in the compactbone of the human proximal femur with clinical and biomechanical significance.Surg. Radiol. Anat. 29, 201–207.
ajpai, J., Gamanagatti, S., Sharma, M.C., Kumar, R., Vishnubhatla, S., Khan, S.A.,Rastogi, S., Malhotra, A., Bakhshi, S., 2010. Noninvasive imaging surrogate ofangiogenesis in osteosarcoma. Pediatr. Blood Cancer 54, 526–531.
aryshnikova, L.M., von Bohlen und Halbach, O., Kaplan, S., von Bartheld, C.S., 2006.Two distinct events, section compression and loss of particles (“lost caps”), con-tribute to z-axis distortion and bias in optical disector counting. Microsc. Res.Tech. 69, 738–756.
oyce, R.W., Ebert, D.C., Youngs, T.A., Paddock, C.L., Mosekilde, Li., Stevens, M.L., Gun-dersen, H.J.G., 1995a. Unbiased estimation of vertebral trabecular connectivityin calcium-restricted ovariectomized minipigs. Bone 16, 637–642.
oyce, R.W., Wronski, T.J., Ebert, D.C., Stevens, M.L., Paddock, C.L., Youngs, T.A.,Gundersen, H.J.G., 1995b. Direct stereological estimation of three-dimensionalconnectivity in rat vertebra: effect of estrogen, etidronate and risedronate fol-lowing ovarectomy. Bone 16, 209–213.
urr, D.B., Allen, M.R., 2009. Mandibular necrosis in beagle dogs treated with bis-phosphonates. Orthod. Craniofac. Res. 12, 221–228.
ano, J., Campo, J., Moreno, L.A., Bascones, A., 2006. Osteogenic alveolar distraction:a review of the literature. Oral Surg. Oral Med. Oral Pathol. Oral Radiol. Endod.101, 11–28.
ioffi, I., van Ruijven, L.J., Renders, G.A., Farella, M., Michelotti, A., van Eijden, T.M.,2007. Regional variations in mineralization and strain distributions in the cortexof the human mandibular condyle. Bone 41, 1051–1058.
orwin, S.C. (Ed.), 2001. Bone Mechanics Handbook. , 2nd edition. CRC Press, BocaRaton.
unstan, C.R., Somers, N.M., Evans, R.A., 1993. Osteocyte death and hip fracture.Calcif. Tissue Int. 53 (Suppl. 1), S113–S116.
avia, G., Pilolli, G.P., Maiorano, E., 2009. Histologic and histomorphometric featuresof bisphosphonate-related osteonecrosis of the jaws: an analysis of 31 caseswith confocal laser scanning microscopy. Bone 45, 406–413.
iala, P., Hert, J., Petrtyl, M., Kaiser, J., 1998. Dependence of mechanical strengthon the architecture of the compact bone of human shaft. Acta Chir. Orthop.
Traumatol. Cech. 65, 217–224.iala, P., Hert, J., 1999. Osteon – development and its structure. Electr. J. Pathol. Histol.5, 33–41.
orwood, M.R., Parker, A.W., 1989. Microdamage in response to repetitive torsionalloading in the rat tibia. Calcif. Tissue Int. 45, 47–53.
my 193 (2011) 211–219
Geraets, W.G., van Ruijven, L.J., Verheij, J.G., van der Stelt, P.F., van Eijden, T.M.,2008. Spatial orientation in bone samples and Young’s modulus. J. Biomech.41, 2206–2210.
Gundersen, H.J.G., Jensen, E.B., 1987. The efficiency of systematic sampling in stere-ology and its prediction. J. Microsc. 147, 229–263.
Gundersen, H.J.G., Boyce, R.W., Nyengaard, J.R., Odgaard, A., 1993. The ConnEulor:unbiased estimation of connectivity using physical disectors under projection.Bone 14, 217–222.
Hedreen, J.C., 1998a. Lost caps in histological counting methods. Anat. Rec. 250,366–372.
Hedreen, J.C., 1998b. What was wrong with the Abercrombie and empirical cellcounting methods? A review. Anat. Rec. 250, 373–380.
Hert, J., Fiala, P., Petrtyl, M., 1994. Osteon orientation of the diaphysis of the longbones in man. Bone 15, 269–277.
Hou, Q., Grijpma, D.W., Feijen, J., 2003. Porous polymeric structures for tissue engi-neering prepared by a coagulation, compression moulding and salt leachingtechnique. Biomaterials 24, 1937–1947.
Howard, C.V., Reed, M.G., 1998. Unbiased Stereology: Three Dimensional Measure-ment in Microscopy. Royal Microscopical Society, Microscopy Handbook SeriesNo. 41, 2nd edition. Springer-Verlag, New York.
Howard, V., Reid, S., Baddeley, A., Boyde, A., 1985. Unbiased estimation of parti-cle density in the tandem scanning reflected light microscope. J. Microsc. 138,203–212.
Jilka, R.L., Weinstein, R.S., Bellido, T., Roberson, P., Parfitt, A.M., Manolagas, S.C., 1999.Increased bone formation by prevention of osteoblast apoptosis with parathy-roid hormone. J. Clin. Invest. 104, 439–446.
Kachlik, D., Baca, V., Cepelik, M., Hajek, P., Mandys, V., Musil, V., 2008. Clinicalanatomy of the calcaneal tuberosity. Ann. Anat. 190, 284–291.
Khadang, I., 2003. Architecture of compact bone on the human mandible. Plzen. lek.Sborn. Suppl. 78, 127–129.
Liebschner, M.A., 2004. Biomechanical considerations of animal models used in tis-sue engineering of bone. Biomaterials 25, 1697–1714.
Liu, Z.J., King, G.J., Herring, S.W., 2006. Condylar mineralization following mandibulardistraction in rats. J. Dent. Res. 85, 653–657.
Lobo, S.E., Wykrota, F.H., Oliveira, A.C., Kerkis, I., Mahecha, G.B., Alves, H.J., 2009.Quantification of bone mass gain in response to the application of biphasic bioce-ramics and platelet concentrate in critical-size bone defects. J. Mater. Sci. Mater.Med. 20, 1137–1147.
Lossdörfer, S., Yildiz, F., Götz, W., Kheralla, Y., Jäger, A., 2010. Anabolic effect ofintermittent PTH(1-34) on the local microenvironment during the late phaseof periodontal repair in a rat model of tooth root resorption. Clin. Oral Invest.14, 89–98.
Martin, R.B., Burr, D.B., 1989. Structure, Function and Adaption of Compact Bone.Raven Press, New York.
Mastalkova, K., Tonar, Z., Fiala, P., Janacek, J., 2008. Quantification of osteocyte lacu-nar density and anisotropy of vascular canals in compact bone. In: Kachlik,D. (Ed.), 9th Congress of the European Association of Clinical Anatomy EACA.Medimond International Proceedings. Bologna, pp. 45–48.
Meyer, T., Meyer, U., Stratmann, U., Wiesmann, H.P., Joos, U., 1999. Identification ofapoptotic cell death in distraction osteogenesis. Cell Biol. Int. 23, 439–446.
Mohsin, S., O’Brien, F.J., Lee, T.C., 2006. Microcracks in compact bone: a three-dimensional view. J. Anat. 209, 119–124.
Mouton, P.R., 2002. Principles and Practices of Unbiased Stereology. An Introductionfor Bioscientists. The Johns Hopkins University Press, Baltimore.
Mulder, L., van Groningen, L.B., Potgieser, Y.A., Koolstra, J.H., van Eijden, T.M., 2006.Regional differences in architecture and mineralization of developing mandibu-lar bone. Anat. Rec. A: Discov. Mol. Cell. Evol. Biol. 288, 954–961.
Nomura, T., Gold, E., Powers, M.P., Shingaki, S., Katz, J.L., 2003. Micromechan-ics/structure relationships in the human mandible. Dent. Mater. 19, 167–173.
Nomura, T., Gold, E., Powers, M.P., Shingaki, S., Saito, C., Katz, J.L., 2006. A clinicalcase report: interface analysis of a successful well-functioning transmandibularimplant from a cadaver mandible. J. Biomed. Mater. Res. B: Appl. Biomater. 77,213–218.
Paral, V., Witter, K., Tonar, Z., 2007. Microscopic examination of ground sections – asimple method for distinguishing between bone and antler? Int. J. Osteoarchaeol.17, 627–634.
Parfitt, A.M., 1988. Bone histomorphometry: standardization of nomenclature, sym-bols and units. Bone 9, 67–69.
Petrtyl, M., Hert, J., Fiala, P., 1996. Spatial organization of the haversian bone in man.J. Biomech. 29, 161–169.
Qiu, S., Rao, D.S., Fyhrie, D.P., Palnitkar, S., Parfitt, A.M., 2005. The morphologicalassociation between microcracks and osteocyte lacunae in human cortical bone.Bone 37, 10–15.
Raoul, G., Wojcik, T., Ferri, J., 2009. Outcome of mandibular symphyseal distractionosteogenesis with bone-borne devices. J. Craniofac. Surg. 20, 488–493.
Rauch, F., 2006. Watching bone cells at work: what we can see from bone biopsies.Pediatr. Nephrol. 21, 457–462.
Renders, G.A., Mulder, L., van Ruijven, L.J., van Eijden, T.M., 2007. Porosity of humanmandibular condylar bone. J. Anat. 210, 239–248.
Rohan, E., Cimrman, R., 2010. Two-scale modeling of tissue perfusion problem usinghomogenization of dual porous media. Int. J. Multiscale Com. 8, 81–102.
Sterio, D.C., 1984. The unbiased estimation of number and sizes of arbitrary particlesusing the disector. J. Microsc. 134, 127–136.
Tanaka, E., Rego, E.B., Iwabuchi, Y., Inubushi, T., Koolstra, J.H., van Eijden, T.M., Kawai,N., Kudo, Y., Takata, T., Tanne, K., 2008. Biomechanical response of condylarcartilage-on-bone to dynamic shear. J. Biomed. Mater. Res. A 85, 127–132.

Anato
T
U
V
V
V
V
V
V
Z. Tonar et al. / Annals of
onar, Z., Kochova, P., Janacek, J., Fiala, P., 2010. Stereological tools for quantitativeassessment of microporosities and microcracks in biomechanics of calcified andsoft tissues. In: Wythers, M.C. (Ed.), Advances in Materials Science Research, vol.1. Nova Science Publishers, New York.
ckan, S., Dolanmaz, D., Kalayci, A., Cilasun, U., 2002. Distraction osteogenesis ofbasal mandibular bone for reconstruction of the alveolar ridge. Br. J. Oral Max-illofac. Surg. 40, 393–396.
an Eijden, T.M., 2000. Biomechanics of the mandible. Crit. Rev. Oral Biol. Med. 11,123–136.
ashishth, D., Verborgt, O., Divine, G., Schaffler, M.B., Fyhrie, D.P., 2000. Decline inosteocyte lacunar density in human cortical bone is associated with accumula-tion of microcracks with age. Bone 26, 375–380.
ashishth, D., Gibson, G., Kimura, J., Schaffler, M.B., Fyhrie, D.P., 2002. Determinationof bone volume by osteocyte population. Anat. Rec. 267, 292–295.
ashishth, D., Gibson, G.J., Fyhrie, D.P., 2005. Sexual dimorphism and age depen-dence of osteocyte lacunar density for human vertebral cancellous bone. Anat.Rec. A: Discov. Mol. Cell. Evol. Biol. 282, 157–162.
erborgt, O., Gibson, G.J., Schaffler, M.B., 2000. Loss of osteocyte integrity in associa-tion with microdamage and bone remodeling after fatigue in vivo. J. Bone Miner.Res. 15, 60–67.
esterby, A., Gundersen, H.J.G., Melsen, F., Mosekilde, L., 1991. Marrow space starvolume in the iliac crest decreases in osteoporotic patients after continu-
my 193 (2011) 211–219 219
ous treatment with fluoride, calcium, and vitamin D2 for five years. Bone 12,33–37.
von Bartheld, C., 2002. Counting particles in tissue sections: choices of methods andimportance of calibration to minimize biases. Histol. Histopathol. 17, 639–648.
Weinstein, R.S., Jilka, R.L., Almeida, M., Roberson, P.K., Manolagas, S.C., 2010. Inter-mittent parathyroid hormone administration counteracts the adverse effectsof glucocorticoids on osteoblast and osteocyte viability, bone formation, andstrength in mice. Endocrinology 151, 2641–2649.
West, M.J., Slomianka, L., Gundersen, H.J., 1991. Unbiased stereological estimationof the total number of neurons in the subdivisions of the rat hippocampus usingthe optical fractionator. Anat. Rec. 231, 482–497.
West, M.J., 1999. Stereological methods for estimating the total number of neuronsand synapses: issues of precision and bias. Trends Neurosci. 22, 51–61.
Yassen, G.H., 2010. Evaluation of mandibular infiltration versus mandibular blockanaesthesia in treating primary canines in children. Int. J. Paediatr. Dent. 20,43–49.
Yeager, V.L., Chiemchanya, S., Chaiseri, P., 1975. Changes in size of lacunae during
the life of osteocytes in osteons of compact bone. J. Gerontol. 30, 9–14.Zwetyenga, N., Catros, S., Emparanza, A., Deminiere, C., Siberchicot, F., Fricain, J.C.,2009. Mandibular reconstruction using induced membranes with autologouscancellous bone graft and HA-betaTCP: animal model study and preliminaryresults in patients. Int. J. Oral Maxillofac. Surg. 38, 1289–1297.
Copyright © 2022 FDOKUMEN