Economical & Physical Justification For Canals - Lectures on ...

Specific Conductance and Ionic Characteristics of Farm Canals in theEverglades Agricultural Area
Ming Chen,* Samira H. Daroub, Timothy A. Lang, and Orlando A. Diaz
ABSTRACTSpecific conductance in farm canals of the Everglades Agricultural
Area (EAA) in south Florida is an important water quality parameterthat was categorized as a parameter of concern according to an observedfrequency of .5% excursions over the Class III water quality criterionand needed to be addressed as a part of the Everglades RegulatoryProgram. This study was conducted to evaluate specific conductance infarm canals of the EAA. Specific conductance was monitored at 10 rep-resentative farms (a total of 12 pump stations) in the EAA using multi-parameter water quality data loggers, for periods ranging from 24 to83 mo. Cation and anion concentrations were also determined. Non-parametric Mann-Kendall trend analyses and Sen’s slope analysis ofspecific conductance were conducted to determine specific conductancetrends. Mean specific conductance ranged from 0.74 to 1.68 dS m21 andonly 2 of the 10 farms were above the State Class III water qualitycriterion of 1.275 dS m21. Statistically significant downward trends wereobserved at 3 of the 10 farms. Determination of ion compositions in grabsamples at 8 of the 10 farms indicated that themajor ions contributing tothe increase in specific conductance in the EAAwere Cl2, HCO3
2, andNa1. Mean Na/Cl ratios in most of the EAA canals ranged from 0.57 to0.78, whereas those of SO4 /Cl ranged from 0.46 to 0.98. Investigation ofhistorical data and literature indicates that elevated specific conductancein parts of the EAA is a natural phenomenon due to entrapment ofconnate seawater in the Everglades formation. Sulfur contributes minorincreases in specific conductance in the EAA with probable sourcesfrom organic soil mineralization, ground water, Lake Okeechobee, andS fertilizers.
THE EVERGLADES AGRICULTURAL AREA (EAA) is lo-cated south of Lake Okeechobee and north of the
Water Conservation Areas (WCAs) in south Florida.The EAA is comprised of an artificially drained areaof approximately 283 300 ha of organic soils, which pro-vide a rich environment for the cultivation of sugar-cane (Saccharum officinarum L.), vegetables, rice (Oryzasativa L.), and sod (Rice et al., 2002). The EAA playsan important role in the Everglades water supply, eitherdirectly through agricultural drainage runoff or indirectlyby serving as a conduit for large water transfers fromLake Okeechobee to the WCAs. Water is pumped fromfarm canals to main canals and eventually into the Ever-glades Protection Areas.
In April of 1994, the Florida state legislature passedthe ‘‘Everglades Forever Act,’’ which mandated a re-
search program, to be conducted in cooperation with theEAA landowners for evaluation and implementationof P best management practices (BMPs) in the EAA.Mandatory P load reduction BMPs in the EAA startedin 1995 and had been successful in reducing P loadsout of the EAA. In 1997, the Everglades RegulatoryProgram was revised to identify water quality parame-ters that are not being significantly improved by BMPsand to identify further BMP strategies needed to addressthese parameters’’ (Florida Statute Section 373.4592;Everglades Forever Act, 1994). Specific conductance isamong these important water quality parameters in sur-face waters of the EAA that was categorized as a pa-rameter of concern for Refuge inflows of the EvergladesProtection Area. Additionally, specific conductance wascategorized as a potential concern for the Refuge rimcanal, interior and outflows, WCA-2 interior, and WCA-2 and WCA-3 inflows (Weaver et al., 2002). Use of the5% break point between parameters classified as poten-tial concerns and concerns of excursions parallels thecommon scientific practice of allowing a 5% rejectionlimit in statistical analyses (Weaver et al., 2001). All theexcursions were likely associated with the pumping orseepage of high ionic strength ground water into thesurface water in the canals (Weaver et al., 2002). There-fore, specific conductance and ionic characteristics weretargeted by the Everglades Regulatory Program.Specific conductance is an indirect measure of the
total concentration of ions (e.g., Ca21, Mg21, Na1, K1,Cl2, HCO3
2, SO422, and F2) in the water. Although all
ions contribute to specific conductance, their valencesand mobilities differ, so their actual and relative con-centrations affect specific conductance. When the con-centration of ions is high, specific conductance is high,and the resistance to electrical passage is low.Changes in specific conductance beyond natural
background variability can result in potentially delete-rious efforts to aquatic life. Several states have adopteddifferent numeric water quality standards for specificconductance to protect cold-water aquatic life. For ex-ample, the recommended maximum contaminant levelfor specific conductance in drinking water is 0.90 dS m21
in California (Brandstetter et al., 1997). In Florida, thecurrent state Class III water (surface waters for re-creation, propagation, and maintenance of a healthy,well balanced population of fish and wild life) qualitycriterion, which allows a 50% increase in the specificconductance over background or 1.275 dS m21, which-ever is greater, is meant to preserve natural backgroundconditions and thus protect aquatic organisms fromstressful ion concentrations (Weaver et al., 2002).
M. Chen, T.A. Lang, and O.A. Diaz, Everglades Research andEducation Center, University of Florida, Belle Glade, FL 33430; S.H.Daroub, Soil and Water Science Department and Everglades Re-search and Education Center, University of Florida, Belle Glade, FL33430. Received 2 Mar. 2005. *Corresponding author ([email protected]).
Published in J. Environ. Qual. 35:141–150 (2006).Technical Reports: Surface Water Qualitydoi:10.2134/jeq2005.0079ª ASA, CSSA, SSSA677 S. Segoe Rd., Madison, WI 53711 USA
Abbreviations: BMPs, best management practices; EAA, EvergladesAgricultural Area; WCA, Water Conservation Area.
Reproducedfrom
JournalofEnvironmentalQuality.PublishedbyASA,CSSA,andSSSA.Allcopyrights
reserved.
141
Published online January 3, 2006

Given natural conditions, the specific conductance ofa water body is generally based on the geology of thewatershed through which the water flows. Water comingin contact with soils and erodible source rock materialwill dissolve salts, especially when soil drainage is poor.Some rocks and soils release ions easily when waterflows over them. Concentrations generally are greatestin streams draining basins with rocks and soils that con-tain easily dissolved minerals (Risey and Doyle, 1997).The chemistry of the surface water can be modified byprecipitation and evapotranspiration, weathering of geo-logical formation, and chemical changes brought aboutby biological organisms and chemical equilibria (Floraand Rosendahl, 1981).
Historical water quality data on the EAA and sur-rounding areas provides important information in eval-uating current specific conductance status of farm canalsin the EAA. Parker et al. (1955) conducted a field studyfrom 1941 to 1943 on surface and ground water in southFlorida. The Hillsboro Canal and the North New RiverCanal (Fig. 1) showed wide fluctuations in specific con-ductance. For example, the Hillsboro Canal specificconductance ranged from 0.22 to 1.44 dS m21 from Julythrough August. The North New River Canal specific
conductance ranged from 0.28 to 1.04 dS m21 during thesame time period.
The U.S. Army Corps of Engineers (1971) reportedspecific conductance from 1950 to 1970 in surface waterin south Florida. The Hillsboro Canal showed specificconductance ranging from 0.49 to 1.11 dS m21 for its 10thand 90th percentiles, with a median value of 0.78 dS m21.The percentile values are consistent with results of Parkeret al. (1955), but are lower than those of Gleason (1974),who reported that the Hillsboro Canal specific conduc-tance ranged from 1.10 to 1.50 dS m21 on 31 July 1973.
A collaborative study by the University of Florida andthe USDA Soil Conservation Service, conducted in the1940s, described an isolated area of fairly permeablerocks underlying about half of Lake Okeechobee andnearby lands to the southeast, perhaps 8 m thick andencountered at a depth of 4 to 10 m (Jones, 1948). Thewater from this area contained total solids concentra-tion of 4000 to 5000 mg L21 (Jones, 1948). In a later studyconducted jointly by the U.S. Geological Survey andthe U.S. Army Corps of Engineers, higher specific con-ductance values were found in the northern half of thisarea than that from the southern half (Waller andEarle, 1975).
Fig. 1. Monitoring sites for specific conductance and ionic characteristics at farm canals of the Everglades Agricultural Area, Florida.
Reproducedfrom
JournalofEnvironmentalQuality.PublishedbyASA,CSSA,andSSSA.Allcopyrights
reserved.
142 J. ENVIRON. QUAL., VOL. 35, JANUARY–FEBRUARY 2006

Water quality data possess unique characteristics thatmay exhibit seasonal variation, which may include a sea-sonal fluctuant, as well as a yearly trend. This variationmay be the result of a diversity of conditions, includingspecific agricultural land-use practices, biological activ-ity, or sources of stream flow or sediment. Investigationson specific conductance and ionic characteristics havebeen conducted in certain parts of south Florida (Floraand Rosendahl, 1982; Lietz, 2000), but in general, the in-formation on ionic characteristics of farm canals in theEAA is limited.
The objectives of this research were: (i) to character-ize specific conductance and ionic concentration in farmcanals that are representatives of the EAA, (ii) to deter-mine the time-serial trend of specific conductance, and(iii) to evaluate geographical distribution of specific con-ductance in the EAA. These characteristics are goodindicators of water sources that are potentially informa-tive about the effectiveness of BMPs in improving thequality of water entering the Everglades ProtectionAreas from the EAA.
MATERIALS AND METHODS
Specific Conductance Monitoring Program in theEverglades Agricultural Area
A monitoring program was established on 10 farms (12 dis-charge structures) in the EAA (Fig. 1). Cropping systems, farmsize, and monitoring period are presented in Table 1. HydrolabDataSonde (series 3, 4, 4a) multi-sensor water quality dataloggers (Hydrolab Corp., Austin, TX) were used to measureand record specific conductance in situ. The DataSonde unitswere calibrated according to instrument specifications andprogrammed for a 6-d run recording measurements everyhour. The units were deployed at a depth of 1.0 m beneath thecanal water surface. DataSonde units were replaced every 6 dand data stored electronically for future analysis. A post-runassessment for drift of the instrument’s sensors was subse-quently conducted. The instruments were then cleaned, main-tained, and recalibrated in the laboratory and returned to thefield for deployment during the subsequent monitoring cycle.All field and laboratory activities strictly followed relevantStandard Operating Procedures (Chen, 2001). Quality controlcriteria for specific conductance regarding sensor drift andbiofouling were ,60.1 dS m21 at 1.413 dS m21 (0.01 M KCl).
Ion concentrations in grab samples were determined to iden-tify the major ions that are associated with specific conduc-
tance in the EAA. Grab samples were taken during 2001–2002adjacent to DataSonde locations. Analyses for Na1, Ca21,Mg21, and K1 concentrations were conducted via an atomicabsorption spectrometer (SpectrAA 220 FS, Varian, Spring-vale, Australia) using USEPA Method 200.0 (USEPA, 1983).Analyses for Cl2, SO4
22, and F2 were conducted using ionchromatography specified by USEPA Method 300.0 (USEPA,1983). A Dionex DX-500 ion chromatograph (Dionex Co.,Sunnyvale, CA), equipped with an injection valve, a sampleloop, guard column, and ion separator columns, was chosento measure anion concentrations. Bicarbonate anion was notanalyzed in our monitoring program, since it was used as theeluent in the ion chromatography determinations. However,we did calculate HCO3
2 ion concentrations as the differencebetween the sum of the measured cations and anions.
Statistical Data Analysis
Histogram analyses and goodness-of-fit tests were conductedto check the distribution patterns of specific conductance andother parameters measured (Gilbert, 1987). Summary statisticswere conducted to assess significant differences of parameters(SAS Institute, 1999). A box and whisker plot was then used todisplay visual summaries (site by site and aggregates) of: (i) thecenter of the data (the median 5 the centerline of the box), (ii)the variation or spread (interquartile range 5 the box height),(iii) the skewness (quartile skew 5 the relative size of boxhalves), and (iv) presence or absence of unusual values (outliersand extreme values).
Monthly averages of specific conductance for 10 farms wereused for time series trend analysis. The upward and downwardtrends with time were evaluated using a nonparametric Mann-Kendall test using the ChemStat 6.0 software (Starpoint Soft-ware, 2005). The Sen’s slope test was also used to detect yearlytrends (Lietz, 1996; Gilbert, 1987).
RESULTS AND DISCUSSIONGeneral Characteristics of Specific Conductance inFarm Canals of the Everglades Agricultural AreaSpecific conductance in farm canals of the EAA
varied from 0.32 dS m21 at UF9205A to 2.75 dS m21 atUF9208A,with overallmean value of 1.15 dSm21 (Table 2).This mean value is close to the high end of the datareported by Parker et al. (1955), although at the lowend of the data reported by Gleason (1974). The me-dian is close to the mean and the coefficients of thekurtosis and the skewness are close to zero, indicating
Table 1. Background information on size, cropping system, and specific conductance monitoring dates of 10 representative farms in theEverglades Agricultural Area, Florida.
Specific conductance monitoring
Name of farm Size of farm, ha Cropping system† Start date End date Months of data
UF9200A 518 sugarcane February 1997 December 2003 83UF9201A 518 vegetable January 1998 December 1999 24UF9202A 130 sugarcane January 1998 December 2001 48UF9203A 1866 sugarcane January 1998 December 2001 48UF9204A 259 sugarcane January 1998 December 2001 48UF9205A 130 sugarcane January 1998 December 1999 24UF9206A and UF9206B‡ 710 mixed§ February 1997 December 2003 83UF9207A and UF9207B 1013 sugarcane January 1998 December 2001 48UF9208A 106 sugarcane December 1997 August 2001 44UF9209A 1244 sugarcane January 1998 December 2003 72
† Sugarcane, Saccharum officinarum L.; rice, Oryza sativa L.‡A and B indicate two discharge structures of the same farm.§Mixed denotes sugarcane–vegetable–sod–flooded rice.
Reproducedfrom
JournalofEnvironmentalQuality.PublishedbyASA,CSSA,andSSSA.Allcopyrights
reserved.
143CHEN ET AL.: FARM CANALS IN THE EVERGLADES AGRICULTURAL AREA

that the specific conductance data are normally distrib-uted (Gilbert, 1987).
Summary statistics of specific conductance in canalwater at the 12 discharge structures in the EAA basedon the monthly data show that the mean of specific con-ductance at the 12 discharge structures decreased in thefollowing order (in dS m21): UF9208A (1.68).UF9206B(1.57), UF9206A (1.51) . UF9201A (1.17), UF9207A(1.09), UF9207B (1.09), UF9204A (1.08) $ UF9202A(0.95) $ UF9200A (0.89), UF9203A (0.86), UF9209A(0.84).UF9205A (0.74) (Table 2). Specific conductancedata from two farms (UF9206A and UF9206B, andUF9208A) show averages above 1.275 dS m21, which isthe StateClass IIIwater criterion for specific conductance.
Historical data have indicated monthly fluctuation indissolved salts in the Everglades canals (Parker et al.,1955). A box and whisker plot of the monthly specificconductance data indicates that specific conductanceshows monthly fluctuation (Fig. 2). Analysis of varianceof the data ( p 5 0.05) shows the overall monthly trend
of specific conductance in canal water of EAA farmsdecreased as follows (arithmetic mean in dS m21):September (1.30), August (1.28), and October (1.26) .November (1.20), February (1.20), July (1.19), January(1.17), December (1.17), and March (1.14) . April(1.03), June (0.96), and May (0.89). The three highestmonths (August, September, and October) also had thehighest average rainfall (206, 166, and 147 mm,respectively) during 1997–2003. This pattern is consis-tent with the observation by Parker et al. (1955) andVolk and Sartain (1976), who found separately thatCl2 and Na1 concentrations in the wet season (June–October) samples were considerably higher than con-centrations in the drier months.
Ion Composition of Specific Conductance in FarmCanals of the Everglades Agricultural Area
The marsh water in the Everglades was reported to beCa21–HCO3
2 dominated (Flora and Rosendahl, 1982).
Table 2. Summary statistics for specific conductance at farms canals of the Everglades Agricultural Area, Florida.
Site No. Range Minimum Maximum Median Skewness Kurtosis SD Mean Significance
dS m21
UF9200A 83 1.16 0.39 1.55 0.90 0.09 21.14 0.30 0.89 e†UF9201A 24 1.23 0.55 1.78 1.15 0.22 20.05 0.32 1.17 cUF9202A 48 0.47 0.71 1.18 0.93 0.35 0.12 0.11 0.95 deUF9203A 48 0.91 0.45 1.36 0.88 0.02 20.50 0.22 0.86 eUF9204A 48 1.06 0.47 1.53 1.12 20.47 20.58 0.28 1.08 cdUF9205A 24 0.95 0.32 1.27 0.77 0.38 20.47 0.28 0.74 fUF9206A 83 1.99 0.59 2.58 1.52 20.14 0.27 0.42 1.51 bUF9206B 83 1.88 0.49 2.37 1.63 20.74 0.43 0.39 1.57 bUF9207A 48 1.07 0.48 1.55 1.10 20.29 0.19 0.23 1.09 cUF9207B 48 1.13 0.42 1.55 1.07 20.45 0.79 0.24 1.09 cUF9208A 44 1.99 0.76 2.75 1.67 0.42 1.11 0.37 1.68 aUF9209A 72 0.93 0.43 1.36 0.85 0.06 20.59 0.22 0.84 eAll sites 653 2.42 0.32 2.75 1.10 0.59 0.10 0.43 1.15
†Letters in the column represent significant differences at the 0.05 probability level.
Fig. 2. Plot of mean specific conductance (dS m21) from all monitoring sites in the Everglades Agricultural Area combined against month ofthe year.
Reproducedfrom
JournalofEnvironmentalQuality.PublishedbyASA,CSSA,andSSSA.Allcopyrights
reserved.
144 J. ENVIRON. QUAL., VOL. 35, JANUARY–FEBRUARY 2006

Many of the surface waters in southeastern Florida had,15 mg L21 of Cl2, but ground waters with 100 mg L21 ormorewere not uncommon (Parker et al., 1955). Itwas alsobelieved that in the pHrangeof 7.0 to 7.5, the principal ionresponsible for alkalinity is HCO3
2 (Hem, 1985; Gleason,1974). In this study, ion composition in grab samplesat 10 discharge structures indicated that HCO3
2, Cl2, andSO4
22 are the major anions and Na1 and Ca21 are themajor cations in farm canal water of the EAA farms(Table 3). The mean concentrations of HCO3
2 variedfrom 190.3 mg L21 at UF9209A to 399.8 mg L21 atUF9208A. The mean concentrations of Cl2 varied from71.6 mg L21 at UF9202A to 174.2 mg L21 at UF9208A,whereas the mean concentrations of SO4
22 ranged from45.2 mg L21 at UF9203A to 118.8 mg L21 at UF9208A.
The quantity of Na1 in ordinary surface or groundwater has been reported to be ,30 mg L21, and con-siderable quantities of Na1 would be found in waterscontaminated with sea water or in waters with salts en-closed in the older marine deposits (Parker et al., 1955).Typically, Ca21 comprises 69.4% and Na1 accounts for23.7% of the total major cations concentration in theEverglades marsh water (Flora and Rosendahl, 1982),which approximates the ionic character of the shallowground water that was found in the east region of theEverglades (Flora and Rosendahl, 1981). The chemicalcharacter of the canal water differed significantly, withCa21 comprising 46.6% and Na1 supplying 41.0% of thetotal cation concentration (Flora and Rosendahl, 1981;Flora and Rosendahl, 1982). In the current study, meanconcentration of Na1 ranged from 27.5% (41.7 mg L21)of the total cation concentration at UF9202A to 55.8%(110.7 mg L21) of the total cation concentration atUF9206A, while those of Ca21 ranged from ,26.0%(51.0 mg L21) at UF9206A to 51.1% (77.7 mg L21) atUF9202A. In addition, mean concentrations of Mg21accounted for 13.0% (25.8 mg L21) of the total cationconcentration at UF9206A to 16.9% (46.1 mg L21) atUF9208A, whereas those of K1 ranged from 3.8%(5.8 mg L21) at UF9202A to 5.5% (11.4 mg L21) atUF9206B (Table 3).
The Na/Cl weight ratio for seawater is 0.55, whereasthat of SO4/Cl is 0.14 (Stumm and Morgan, 1981; Smartet al., 2001). The Na/Cl weight ratio for Hillsboro Canalwater and WCA-2A marsh water varied from 0.76 to0.85 (Gleason, 1974). In this study, the mean Na/Clweight ratio for farm canal water in the EAA ranged be-
tween 0.57 and 0.78, higher than that of the seawater andclose to that of the marsh water (Gleason, 1974). How-ever, the mean SO4/Cl weight ratio for farm canal waterin theEAAranged between 0.47 and 0.98 (Table 3), muchhigher than that of the seawater but close to that ofshallow well water in western Palm Beach County and inthe EAA, which were 0.79 (Parker et al., 1955) and 0.43(Miller and Lietz, 1976), respectively.Correlation coefficient analysis shows a strong corre-
lation coefficient (r 5 0.95, n 5 464) between concen-trations of Na1 and Cl2 in canal water near the EAAfarms. This would reflect, predominately, that sea saltis the dominant source of both Na1 and Cl2 (Neal andKirchner, 2000; Cruz and Amaral, 2004), and secondly,the enrichment of Na1 relative to Cl2 may occur duringthe process of biogeochemical weathering (Smart et al.,2001; Cruz and Amaral, 2004).The relatively high Na1 content of canal water in the
EAA may have resulted partly from the remnants ofsaline residues that have not been completely flushedout of the ground and partly from cation-exchange pro-cesses (Parker et al., 1955). Because the muck and rockof the EAA are much less permeable than sandstonesand limestones, saline residues have not been entirelyflushed out, and organic colloids are still partly saturatedwith Na1, presumably adsorbed from ancient seawater.When brought in contact with Na1 bearing clays, theCa21 in solution is exchanged for Na1 on the clays. Thewater then comes in contact with more calcite, whichdissolves to form more Ca21 and HCO3
2.
CaCO3 1 CO2 1 H2O 5 Ca21 1 2 HCO32 [1]
2 Clay2Na1 Ca21 5 Clay 2 Ca 2 Clay 1 2 Na1 [2]
From this reaction, we know that dissolution of 1 molof calcite by 1 mol of H2CO3 or other acid will result inan equivalent amount of Na1 and HCO3
2 (Banks et al.,1998). Repetition of the process increases HCO3
2 andNa1 to higher values as measured in the EAA farmcanals (Table 3).Relatively high content of SO4
22 in canal water in theEAA has been reported by the USGS (Bates et al.,2002; Orem, 2004). These studies concluded that ele-vated S concentrations in the EAA canals are the resultof high agricultural S use. Ground water was also a pos-sible source (Bates et al., 2002). However, Schueneman(2001) investigated the S sources in the EAA and found
Table 3. Mean ion concentrations in grab water samples at farm canals of the Everglades Agricultural Area, Florida.
Site No. K Na Ca Mg Cl SO4 F HCO3† Na/Cl SO4 /Cl
mg L21
UF9200A 37 8.7b‡ 64.0cd 52.2c 22.3d 93.6cd 61.3de 0.61c 215.0ef 0.65c 0.66bUF9202A 37 5.8d 41.7e 77.7ab 26.7c 71.6e 70.3bc 0.57c 277.7c 0.57d 0.98aUF9203A 24 7.3c 56.7d 49.1c 22.2d 84.2de 45.2g 0.54c 220.4def 0.67bc 0.56cUF9204A 66 9.1b 79.1c 67.8b 35.9b 108.5c 76.5b 0.65bc 326.8b 0.72ab 0.72bUF9206A 65 10.8a 110.7b 51.0c 25.8c 155.3b 65.8cd 0.91a 249.7cde 0.68bc 0.47eUF9206B 36 11.4a 114.8b 54.7c 28.3c 163.2ab 68.6c 0.82ab 262.7cd 0.68bc 0.47eUF9207A 36 9.7b 77.5c 54.9c 26.6c 106.5c 54.3f 0.72abc 269.2c 0.72bc 0.57cUF9207B 36 9.6b 77.6c 56.4c 27.6c 107.1c 55.3ef 0.73abc 276.6c 0.70bc 0.54cdUF9208A 62 10.9a 136.5a 78.8a 46.1a 174.2a 118.8a 0.89a 399.8a 0.78a 0.71bUF9209A 65 6.5cd 49.8d 51.8c 18.9d 82.6de 49.1fg 0.61c 190.3f 0.59d 0.59c
†Calculated based on the balance of cations and anions.‡Letters in the column represents significant differences at the 0.05 probability level.
Reproducedfrom
JournalofEnvironmentalQuality.PublishedbyASA,CSSA,andSSSA.Allcopyrights
reserved.
145CHEN ET AL.: FARM CANALS IN THE EVERGLADES AGRICULTURAL AREA

out that natural sources from organic soil mineralizationin the EAA produces .15 times as much as SO4
22 to theenvironment as growers’ practices. Other potentialcontributors of SO4
22 in the EAA are solution of con-centrated deposits of sodium sulfate or calcium sulfate(Parker et al., 1955), surface water from Lake Okeecho-bee (Schueneman, 2001), and ground water discharge(Bates et al., 2002). Rainfall and fertilizer carriers arerelatively minor sources (Schueneman, 2001).
Sulfate in our study was not the predominant ioncontributing to the specific conductance of canal waterin the EAA. Average contribution of SO4
22 concentra-tion to the total ion concentration in the EAA farmcanals is 7.9%. Specific conductance increased froma mean of 0.84 dS m21 at UF9209A to a mean of 1.51dS m21 at UF9206A (Table 2). Approximately 87.6% ofthe increase in specific conductance between these twosampling sites was due to increases in concentrations ofNa1, Cl2, and HCO3
2 ions. Potassium, Ca21, Mg21, andF2 were responsible for approximately 4.9% of theincrease in specific conductance, whereas SO4
22 had a7.6% effect on specific conductance (Table 3).
Time Trends of Specific Conductance in FarmCanals of the Everglades Agricultural Area
A trend in water quality is defined as a monotonicchange in a particular constituent with time (Lietz,2000). Historically, specific conductance at the Ever-glades National Park has increased 149% since the early1960s (Flora and Rosendahl, 1982), whereas canalwaters in the EAA exhibit widely fluctuating levelsrather than strong trends (Gleason, 1974). In the currentstudy, a box and whisker plot of the yearly specificconductance data from 1997 shows a generally decreas-ing trend until 2000, then a slight increasing trend after-ward (Fig. 3). Correlation coefficient analysis (p5 0.05)indicated that annual mean specific conductance followsthe order (in dS m21): 1997 (1.46) . 2003 (1.25) . 2002(1.18), 1998 (1.18), 2001 (1.12). 1999 (1.08), 2000 (1.08).The time period of minimum mean specific conductanceappears to line up with the drought, which reached itspeak in 2000 with only 848 mm of annual precipitation,following the order (in mm yr21): 1997 (1269mm). 2003(1229 mm). 2001 (1189 mm). 1998 (1059 mm). 1999(1040 mm) . 2002 (971 mm). Processes that contribute
Fig. 3. Plot of average monthly specific conductance (dS m21) from all monitoring sites in the Everglades Agricultural Area combined by year.
Table 4. Summary statistics for historical specific conductance of Lake Okeechobee, ground water, and canal water in the EvergladesAgricultural Area, Florida.
Specific conductance, dS m21† Significant test
Water sources Time period No. of observations Range Median Minimum Maximum SD Mean Difference P . F
Wells 1984–1997 284 48.0 0.62 0.00 48.0 5.75 2.45 a‡ ,0.0001Ocean Canal 1990–1992 142 3.36 1.52 0.37 3.73 0.65 1.63 bWest Palm Beach Canal 1990–1992 265 4.94 1.26 0.42 5.36 0.88 1.49 bcHillsboro Canal 1990–1992 277 10.4 1.34 0.39 10.8 0.67 1.35 bcdNorth New River Canal 1990–1992 335 2.50 1.08 0.16 2.66 0.39 1.09 cdMiami Canal 1990–1992 125 1.72 1.06 0.27 1.99 0.25 1.01 deLake Okeechobee 1978–1999 667 1.28 0.60 0.34 1.62 0.18 0.62 e
†Raw data from South Florida Water Management District DBHYDRO database.‡Letters in the column represent significant differences at the 0.05 probability level.
Reproducedfrom
JournalofEnvironmentalQuality.PublishedbyASA,CSSA,andSSSA.Allcopyrights
reserved.
146 J. ENVIRON. QUAL., VOL. 35, JANUARY–FEBRUARY 2006

to decreased specific conductance in canal waters in theEAA during the dry months (Fig. 2) and drought year(Fig. 3) could increase by irrigation water from LakeOkeechobee, which has a lower mean specific conduc-tance (Table 4) and decrease in stormwater inflow by
rainfall. Since water was moving from fields to secondaryand primary canals during the wet season, it can be as-sumed that the water was solubilizing certain elementsfound in the Histosols and/or was displacing the soil so-lution (Volk and Sartain, 1976).The nonparametric Mann-Kendall trend analysis
(Table 5) confirmed statistically significant downwardtrends (p # 0.05) in specific conductance at UF9202A,UF9205A, and UF9207B. Sen’s estimator of slope anal-ysis indicated reduction rates of specific conductanceat UF9202A, UF9205A, and UF9207B are at 0.0043,0.0034, and 0.0050 dS m21 yr21, respectively (Table 5).A statistically significant upward trend in specific con-ductance at UF9208A was detected using the non-parametric Mann-Kendall trend analysis (p # 0.05).However, the upward trend was not significant using theSen’s estimator of slope analysis.The significance of the downward trends for these three
structures would appear to be indeterminate. StructureUF0202A is the drainage pump station for a small sugar-cane farm (130 ha) that rarely operated its drainagepumps, since it is surrounded by much larger farms that
Table 5. Nonparametric Mann-Kendall trend analysis and Sen’sslope analysis of specific conductance by site.
Mann-Kendall test Sen’s slope analysis
Site Z score
95%confidence
levelEstimatormedian Q
90%confidence
level
dS m21 dS m21
UF 9200A 20.00078 no trend 20.00121 no trendUF 9201A 20.00037 no trend 20.00674 no trendUF 9202A 20.00408 downward trend 20.00432 downward trendUF 9203A 0.00005 no trend 0.00000 no trendUF 9204A 20.00101 no trend 20.00308 no trendUF 9205A 20.00462 downward trend 20.00335 downward trendUF 9206A 20.00082 no trend 20.00182 no trendUF 9206B 20.00052 no trend 20.00118 no trendUF 9207A 20.00051 no trend 20.00077 no trendUF 9207B 20.00186 downward trend 20.00500 downward trendUF 9208A 0.00173 upward trend 0.00726 no trendUF 9209A 0.00106 no trend 0.00232 no trend
Fig. 4. Study sites with mean specific conductance superimposed upon a map of chloride concentration of shallow wells (6.7–16.7 m depth) in theEverglades Agricultural Area (chloride map recreated from Parker et al., 1955).
Reproducedfrom
JournalofEnvironmentalQuality.PublishedbyASA,CSSA,andSSSA.Allcopyrights
reserved.
147CHEN ET AL.: FARM CANALS IN THE EVERGLADES AGRICULTURAL AREA

effectively provided drainage through subsurface flow(Table 1). Structure UF9205A stopped production in late1999, after only 2 yr of specific conductance monitoring,when it was incorporated into a Stormwater TreatmentArea. Structure UF9207B is an auxiliary pump station forits main farm UF9207A, and as such, the station pumpsonly after very high rainfall events, so it does not ade-quately represent themajority of EAA farms. These threestructures that showed downward trends in specific con-ductance also had low mean specific conductance (lowerthan the Class III water quality criterion of 1.275 dS m21
for specific conductance).One farm, UF9208A, had an upward trend for
specific conductance, which was significant using onlyone of two trend analyses utilized in the study, the non-parametric Mann-Kendall test. This small farm of 106 hais positioned between the Ocean Canal on its northborder and a large feeder canal on its south border (thefeeder canal joins the Hillsboro canal approximately1.6 km east of the farm). This farm is located overan area of known high specific conductance groundwater (Fig. 4).
Geographical Distribution of Specific Conductancein the Everglades Agricultural Area
Historical information indicates that higher specificconductance water in certain areas in the EAA is anatural phenomenon (Waller and Earle, 1975). Geolog-ically, underlying the organic soils of the Lake Okee-chobee–Everglades depression is the Fort Thompsonformation, a series of alternating beds of limestone,shells, sand, and marl of marine, brackish, and freshwater origin (Jones, 1948; Parker et al., 1955). The ma-rine beds represent times when the area was flooded bythe sea; the freshwater beds record times when sea levelwas below the present level and freshwater lakes andmarshes occupied the sea; and the brackish water bedsmay represent either times of rising or falling sea levelswhen the water in the area was neither salt nor freshbut was a mixture of the two. The water in most of theEverglades region comes mostly from precipitationwithin the basin (,1350 mm yr21) and that upon LakeOkeechobee drainage basin (,1275 mm yr21). The quan-tity of flow into the region through subsurface aquifersis negligible. However, in the EAA, ditches or wells
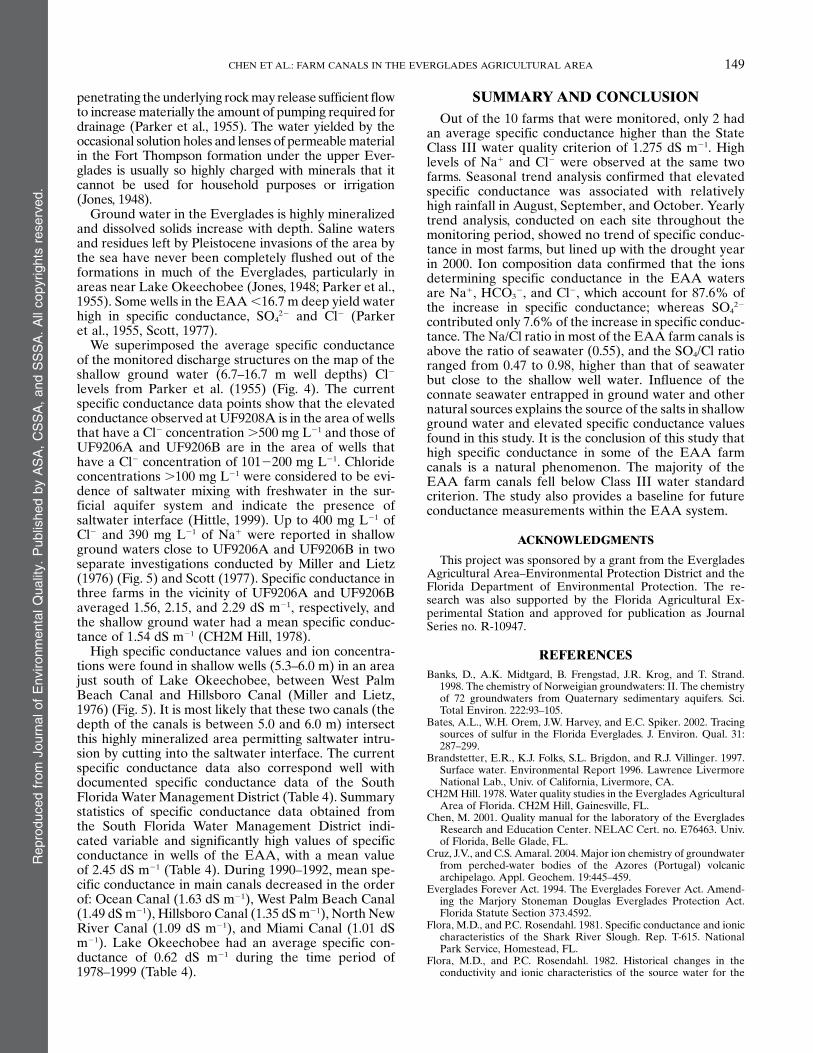
Fig. 5. Water chemical characteristics of shallow wells (5.3–6.0 m depth) in the Everglades Agricultural Area and current study farm locations (welldata from Miller and Lietz, 1976).
Reproducedfrom
JournalofEnvironmentalQuality.PublishedbyASA,CSSA,andSSSA.Allcopyrights
reserved.
148 J. ENVIRON. QUAL., VOL. 35, JANUARY–FEBRUARY 2006
penetrating the underlying rockmay release sufficient flowto increase materially the amount of pumping required fordrainage (Parker et al., 1955). The water yielded by theoccasional solution holes and lenses of permeablematerialin the Fort Thompson formation under the upper Ever-glades is usually so highly charged with minerals that itcannot be used for household purposes or irrigation(Jones, 1948).
Ground water in the Everglades is highly mineralizedand dissolved solids increase with depth. Saline watersand residues left by Pleistocene invasions of the area bythe sea have never been completely flushed out of theformations in much of the Everglades, particularly inareas near Lake Okeechobee (Jones, 1948; Parker et al.,1955). Some wells in the EAA,16.7 m deep yield waterhigh in specific conductance, SO4
22 and Cl2 (Parkeret al., 1955, Scott, 1977).
We superimposed the average specific conductanceof the monitored discharge structures on the map of theshallow ground water (6.7–16.7 m well depths) Cl2levels from Parker et al. (1955) (Fig. 4). The currentspecific conductance data points show that the elevatedconductance observed at UF9208A is in the area of wellsthat have a Cl2 concentration.500 mg L21 and those ofUF9206A and UF9206B are in the area of wells thathave a Cl2 concentration of 1012200 mg L21. Chlorideconcentrations .100 mg L21 were considered to be evi-dence of saltwater mixing with freshwater in the sur-ficial aquifer system and indicate the presence ofsaltwater interface (Hittle, 1999). Up to 400 mg L21 ofCl2 and 390 mg L21 of Na1 were reported in shallowground waters close to UF9206A and UF9206B in twoseparate investigations conducted by Miller and Lietz(1976) (Fig. 5) and Scott (1977). Specific conductance inthree farms in the vicinity of UF9206A and UF9206Baveraged 1.56, 2.15, and 2.29 dS m21, respectively, andthe shallow ground water had a mean specific conduc-tance of 1.54 dS m21 (CH2M Hill, 1978).
High specific conductance values and ion concentra-tions were found in shallow wells (5.3–6.0 m) in an areajust south of Lake Okeechobee, between West PalmBeach Canal and Hillsboro Canal (Miller and Lietz,1976) (Fig. 5). It is most likely that these two canals (thedepth of the canals is between 5.0 and 6.0 m) intersectthis highly mineralized area permitting saltwater intru-sion by cutting into the saltwater interface. The currentspecific conductance data also correspond well withdocumented specific conductance data of the SouthFloridaWater Management District (Table 4). Summarystatistics of specific conductance data obtained fromthe South Florida Water Management District indi-cated variable and significantly high values of specificconductance in wells of the EAA, with a mean valueof 2.45 dS m21 (Table 4). During 1990–1992, mean spe-cific conductance in main canals decreased in the orderof: Ocean Canal (1.63 dS m21), West Palm Beach Canal(1.49 dS m21), Hillsboro Canal (1.35 dS m21), North NewRiver Canal (1.09 dS m21), and Miami Canal (1.01 dSm21). Lake Okeechobee had an average specific con-ductance of 0.62 dS m21 during the time period of1978–1999 (Table 4).
SUMMARYAND CONCLUSIONOut of the 10 farms that were monitored, only 2 had
an average specific conductance higher than the StateClass III water quality criterion of 1.275 dS m21. Highlevels of Na1 and Cl2 were observed at the same twofarms. Seasonal trend analysis confirmed that elevatedspecific conductance was associated with relativelyhigh rainfall in August, September, and October. Yearlytrend analysis, conducted on each site throughout themonitoring period, showed no trend of specific conduc-tance in most farms, but lined up with the drought yearin 2000. Ion composition data confirmed that the ionsdetermining specific conductance in the EAA watersare Na1, HCO3
2, and Cl2, which account for 87.6% ofthe increase in specific conductance; whereas SO4
22
contributed only 7.6% of the increase in specific conduc-tance. The Na/Cl ratio in most of the EAA farm canals isabove the ratio of seawater (0.55), and the SO4/Cl ratioranged from 0.47 to 0.98, higher than that of seawaterbut close to the shallow well water. Influence of theconnate seawater entrapped in ground water and othernatural sources explains the source of the salts in shallowground water and elevated specific conductance valuesfound in this study. It is the conclusion of this study thathigh specific conductance in some of the EAA farmcanals is a natural phenomenon. The majority of theEAA farm canals fell below Class III water standardcriterion. The study also provides a baseline for futureconductance measurements within the EAA system.
ACKNOWLEDGMENTS
This project was sponsored by a grant from the EvergladesAgricultural Area–Environmental Protection District and theFlorida Department of Environmental Protection. The re-search was also supported by the Florida Agricultural Ex-perimental Station and approved for publication as JournalSeries no. R-10947.
REFERENCESBanks, D., A.K. Midtgard, B. Frengstad, J.R. Krog, and T. Strand.
1998. The chemistry of Norweigian groundwaters: II. The chemistryof 72 groundwaters from Quaternary sedimentary aquifers. Sci.Total Environ. 222:93–105.
Bates, A.L., W.H. Orem, J.W. Harvey, and E.C. Spiker. 2002. Tracingsources of sulfur in the Florida Everglades. J. Environ. Qual. 31:287–299.
Brandstetter, E.R., K.J. Folks, S.L. Brigdon, and R.J. Villinger. 1997.Surface water. Environmental Report 1996. Lawrence LivermoreNational Lab., Univ. of California, Livermore, CA.
CH2MHill. 1978. Water quality studies in the Everglades AgriculturalArea of Florida. CH2M Hill, Gainesville, FL.
Chen, M. 2001. Quality manual for the laboratory of the EvergladesResearch and Education Center. NELAC Cert. no. E76463. Univ.of Florida, Belle Glade, FL.
Cruz, J.V., and C.S. Amaral. 2004. Major ion chemistry of groundwaterfrom perched-water bodies of the Azores (Portugal) volcanicarchipelago. Appl. Geochem. 19:445–459.
Everglades Forever Act. 1994. The Everglades Forever Act. Amend-ing the Marjory Stoneman Douglas Everglades Protection Act.Florida Statute Section 373.4592.
Flora, M.D., and P.C. Rosendahl. 1981. Specific conductance and ioniccharacteristics of the Shark River Slough. Rep. T-615. NationalPark Service, Homestead, FL.
Flora, M.D., and P.C. Rosendahl. 1982. Historical changes in theconductivity and ionic characteristics of the source water for the
Reproducedfrom
JournalofEnvironmentalQuality.PublishedbyASA,CSSA,andSSSA.Allcopyrights
reserved.
149CHEN ET AL.: FARM CANALS IN THE EVERGLADES AGRICULTURAL AREA

Shark River slough, Everglades National Park, Florida USA.Hydrobiologia 97:249–254.
Gilbert, O.R. 1987. Statistical methods for environmental pollutionmonitoring. John Wiley & Sons, New York, NY.
Gleason, P.J. 1974. Chemical quality of water in Conservation Area 2Aand associated canals. Tech. Publ. 74-1. Central and SouthernFlorida Flood Control District, West Palm Beach, FL.
Hem, J.D. 1985. Study and interpretation of the chemical character-istics of natural water. 3rd ed. U.S. Geological Survey Water-SupplyPap. 2254. USGS, Reston, VA.
Hittle, C.D. 1999. Delineation of saltwater intrusion in the surficialaquifer system in eastern Palm Beach, Martin, and St. LucieCounties, Florida, 1997–98. U.S. Geological Survey Water-Resour.Invest. Rep. 99-4214. USGS, Reston, VA.
Jones, L.A. 1948. Soils, geology, and water control in the Ever-glades region. Agric. Exp. Stn. Bull. 442. Univ. of Florida, Gaines-ville, FL.
Lietz, A.C. 1996. Assessment of water quality in the South IndianRiver Water Control District, Palm Beach, Florida, 1989–1994. U.S.Geological Survey Open-File Rep. 96-495. USGS, Reston, VA.
Lietz, A.C. 2000. Analysis of water-quality trends at two dischargestations: One within Big Cypress National Preserve and one nearBiscayne Bay—southern Florida, 1966–94. U.S. Geological SurveyWater-Resour. Invest. Rep. 00-4099. USGS, Reston, VA.
Miller, W.L., and A.C. Lietz. 1976. Quality of water data, Palm BeachCounty, Florida 1970–1975. U.S. Geological Survey, Open-File Rep.76-784. USGS, Reston, VA.
Neal, C., and J.W. Kirchner. 2000. Sodium and chloride levels inrainfall, mist, streamwater and groundwater at the Plynlimoncatchments, mid-Wales: Inferences on hydrological and chemicalcontrols. Hydrol. Earth Syst. Sci. 4:295–310.
Orem, W.H. 2004. Impacts of sulfate contamination on the FloridaEverglades ecosystem.U.S. Geological Survey Fact Sheet FS 109-03.USGS, Reston, VA.
Parker, G.G., G.E. Ferguson, and S.K. Love. 1955. Water resources ofsoutheastern Florida with special reference to the geology andgroundwater of the Miami area. U.S. Geological Survey Water-Supply Pap. 1255. USGS, Reston, VA.
Rice, R.W., F.T. Izuno, and R.M. Garcia. 2002. Phosphorus load re-ductions under best management practices for sugarcane cropping
systems in the Everglades Agricultural Area. Agric. Water Manage.56:17–39.
Risey, J.C., and M.C. Doyle. 1997. Water temperature, specific-conductance, and meteorological data for the Rualatin River basin,Oregon, 1994–1995. U.S. Geological Survey Open-File Rep. 96-315.USGS, Reston, VA.
SAS Institute. 1999. SAS system for Windows. Version 8. SAS Inst.,Cary, NC.
Schueneman, T.J. 2001. Characterization of sulfur sources in the EAA.Soil Crop Sci. Soc. Fla. Proc. 60:49–52.
Scott, W.B. 1977. Hydraulic conductivity and water quality of theshallow aquifer, Palm Beach County, Florida. U.S. Geological Sur-vey, Water-Resour. Invest. Rep. 76-119. USGS, Reston, VA.
Smart, R., C.C. White, J. Townend, and M.S. Cresser. 2001. A modelfor prediction chloride concentrations in river water in relativelyunpolluted catchment in northeast Scotland. Sci. Total Environ.265:131–141.
Starpoint Software. 2005. ChemStat Version 6.0. Starpoint Software,Cincinnati, OH.
Stumm, W., and J.J. Morgan. 1981. Aquatic chemistry. An introductionemphasizing chemical equilibria in natural waters. 2nd ed. JohnWiley & Sons, New York.
U.S. Army Corps of Engineers. 1971. Water quality study: EvergladesNational Park. Dep. of the Army, Jacksonville, FL.
USEPA. 1983. Methods for chemical analysis of water and wastes.USEPA Rep. 600/4-79-020. USEPA, Cinncinnati, OH.
Volk, B.G., and J.B. Sartain. 1976. Elemental concentrations ofdrainage water from Everglades Histosols as affected by croppingsystems. Soil Crop Sci. Soc. Fla. Proc. 35:177–183.
Waller, B.G., and J.E. Earle. 1975. Chemical and biological qualityof water in part of the Everglades. Southeastern Florida WaterResour. Invest. Rep. 56-75. USGS, Reston, VA.
Weaver, K., T. Bennett, G. Payne, T. Bechtel, S. Hill, and N. Iricanin.2002. Statues of water quality in the Everglades Protection Area.p. 1–41. In 2002 Everglades consolidated report. South FloridaWater Manage. Dist., West Palm Beach, FL.
Weaver, K., T. Bennett, G. Payne, G. Germain, S. Hill, and N. Iricanin.2001. Statues of water quality criteria compliance in the EvergladesProtection Area. p. 1–66. In 2001 Everglades Consolidated Report.South Florida Water Management District, West Palm Beach, FL.
Reproducedfrom
JournalofEnvironmentalQuality.PublishedbyASA,CSSA,andSSSA.Allcopyrights
reserved.
150 J. ENVIRON. QUAL., VOL. 35, JANUARY–FEBRUARY 2006
Copyright © 2022 FDOKUMEN