12-technical assistance for the northern everglades chemical ...
187
TECHNICAL ASSISTANCE FOR THE NORTHERN EVERGLADES CHEMICAL TREATMENT PILOT PROJECT By: Del Bottcher Tom DeBusk Harvey Harper Steve Iwinski George O‟Connor, and Marty Wanielista PROJECT OFFICER James Laing SFWMD PROJECT ID#: PS 100093 July 6, 2009
-
Upload
khangminh22 -
Category
Documents
-
view
1 -
download
0
Transcript of 12-technical assistance for the northern everglades chemical ...

TECHNICAL ASSISTANCE FOR THE NORTHERN EVERGLADES
CHEMICAL TREATMENT PILOT PROJECT
By:
Del Bottcher
Tom DeBusk
Harvey Harper
Steve Iwinski
George O‟Connor,
and
Marty Wanielista
PROJECT OFFICER
James Laing
SFWMD PROJECT ID#: PS 100093
July 6, 2009

Final Report – Chemical Treatment
1
TABLE OF CONTENTS
ABSTRACT .................................................................................................................................... 7
CHAPTER I INTRODUCTION ................................................................................................... 9
PURPOSE ................................................................................................................................... 9
BACKGROUND ........................................................................................................................ 9
SFWMD APPLICATIONS ...................................................................................................... 12
LIMITATIONS ......................................................................................................................... 12
ROAD MAP.............................................................................................................................. 13
REFERENCES ......................................................................................................................... 13
CHAPTER II ALUMINUM, IRON, AND CALCIUM SALTS .................................................. 15
INTRODUCTION .................................................................................................................... 15
OVERVIEW OF TECHNOLOGY ........................................................................................... 16
APPLICATIONS AND SUCCESS STORIES ......................................................................... 27
At Least Fifty Five Facilities in the State ............................................................................. 27
Initial Testing and Evaluation ............................................................................................... 28
System Configurations .......................................................................................................... 29
IMPLEMENTATION ISSUES ............................................................................................... 53
What phosphorus concentrations and/or species will respond to chemical treatment cost
effectively? ............................................................................................................................ 53
What volume or flow rate is logistically feasible for treatment? .......................................... 54
Where in the KOE can chemical treatment be applied? ....................................................... 54
What water quality parameters affect chemical treatment phosphorus reduction efficiency?
And Do we have sufficient existing data or is additional data required? ............................. 55
What water quality standards must be met for chemically treated discharges to various
receiving waters? .................................................................................................................. 55
What is the best aerial economy of scale for treatment system implementation? ................ 56
Can the chemical treatment be permitted? ............................................................................ 56
What are the monitoring requirements of planned solutions? .............................................. 56
What are the cost-benefits of planned solutions? ................................................................. 56
What factors affect settling and residuals management? ...................................................... 57

Final Report – Chemical Treatment
2
What are cost effective options for residual management? .................................................. 57
What chemicals should be evaluated? .................................................................................. 58
SUMMARY .............................................................................................................................. 58
REFERENCES ......................................................................................................................... 60
CHAPTER III POLYMER ENHANCED BEST MANAGEMENT PRACTICES FOR
PHOSPHORUS CONTROL ......................................................................................................... 61
INTRODUCTION .................................................................................................................... 61
Use of PAM for the reduction of Phosphorus from water .................................................... 62
Phosphorus retention and reduction at the source................................................................. 63
APPLICATIONS AND SUCCESS STORIES ......................................................................... 64
Reducing Eutrophic Conditions of the Salton Sea Case Study............................................. 64
SolarBee/PAM Floc Log Test at Hilaman Park Golf Course ............................................... 66
IMPLEMENTAION ISSUES ................................................................................................... 67
What P concentrations and/or species will respond to PAM based enhanced treatment and
what are the costs? ................................................................................................................ 67
What volume or flow rate is logistically feasible for treatment? .......................................... 68
Where in KOE planned features can chemical treatment be applied? .................................. 68
Water quality parameters affect chemical treatment P reduction efficiency? Do we have
sufficient existing data or is additional data required? ......................................................... 69
What water quality standards must be met for chemically treated discharges to various
receiving waters? .................................................................................................................. 69
What is the best aerial economy of scale for treatment system implementation? ................ 70
Can the use of chemical treatment be permitted? ................................................................. 70
What are the monitoring requirements of planned solutions? .............................................. 70
What are the cost-benefits of planned solutions? ................................................................. 70
What factors effect settling and residual management? ....................................................... 71
What are the cost effective options for residual management? ............................................ 71
What chemicals should be evaluated? .................................................................................. 72
SUMMARY .............................................................................................................................. 72
REFERENCES ......................................................................................................................... 72
CHAPTER IV DRINKING-WATER TREATMENT RESIDUALS ........................................... 75
INTRODUCTION .................................................................................................................... 75
OVERVIEW OF TECHNOLOGY ........................................................................................... 76
Determination of WTR application rate ............................................................................... 78
APPLICATIONS AND SUCCESS STORIES ......................................................................... 80

Final Report – Chemical Treatment
3
IMPLEMENTATION ISSUES ................................................................................................ 95
What P concentrations and/or species will respond to WTR treatment cost effectively? .... 95
Where in the KOE planned features can WTR treatment be applied? ................................. 96
What water quality parameters affect WTR treatment P-reduction efficiency? Do we have
sufficient existing data or is additional data required? ......................................................... 96
What water quality standards must be met for chemically treated discharges to various
receiving waters? .................................................................................................................. 97
What is the best aerial economy of scale for treatment system implementation? ................ 97
Can WTR treatment be permitted? ....................................................................................... 97
What are the monitoring requirements of planned solutions? ............................................ 101
What are the cost-benefits of planned solutions? ............................................................... 101
What factors affect settling and residuals management? .................................................... 101
What further studies are needed for WTR use? .................................................................. 101
SUMMARY ............................................................................................................................ 102
REFERENCES ....................................................................................................................... 103
CHAPTER V HYBRID WETLAND TREATMENT .............................................................. 113
INTRODUCTION .................................................................................................................. 113
OVERVIEW OF TECHNOLOGY ......................................................................................... 114
APPLICATIONS AND SUCCESS STORIES ....................................................................... 116
Lake June, Orange Co., Florida .......................................................................................... 117
Ideal #2 Grove, St. Lucie County, Florida .......................................................................... 119
Nubbin Slough, Okeechobee County, Florida .................................................................... 125
IMPLEMENTATION ISSUES .............................................................................................. 133
What P concentrations and/or species will respond to chemical treatment cost effectively?
............................................................................................................................................. 133
What volume or flow rate is logistically feasible for treatment? ........................................ 133
Where in the KOE planned features can chemical treatment be applied? .......................... 133
What water quality parameters affect chemical treatment P-reduction efficiency? Do we
have sufficient existing data or is additional data required? ............................................... 133
What water quality standards must be met for chemically treated discharges to various
receiving waters? ................................................................................................................ 134
What is the best aerial economy of scale for treatment system implementation (parcel, sub-
basin, STA, reservoir)? ....................................................................................................... 134
Can the chemical treatment be permitted? .......................................................................... 134
What are the monitoring requirements of planned solutions? ............................................ 134
What are the cost-benefits of planned solutions? ............................................................... 135

Final Report – Chemical Treatment
4
What factors affect settling and residuals management? and, What are cost effective options
for residual management? ................................................................................................... 135
What chemicals and treatment configurations should be further evaluated? ..................... 135
SUMMARY ............................................................................................................................ 135
REFERENCES ....................................................................................................................... 136
CHAPTER VI EDGE OF FARM (EOF) TREATMENT SYSTEMS ....................................... 137
INTRODUCTION .................................................................................................................. 137
OVERVIEW OF EDGE OF FARM TECHNOLOGY ........................................................... 138
Cost Considerations of EOF Technology ........................................................................... 140
APPLICATIONS AND SUCCESS STORIES ....................................................................... 140
Butler Oaks Dairy EOF System .......................................................................................... 140
Davie Dairy EOF System.................................................................................................... 143
Dry Lake Dairy EOF System .............................................................................................. 143
Milking R Dairy EOF System............................................................................................. 146
Operation and Maintenance – Lessons Learned ................................................................. 154
Estimated Annual Costs and P Removal Efficiencies ........................................................ 155
IMPLEMENTATION ISSUES .............................................................................................. 156
What phosphorus concentration and/or species will respond to chemical treatment cost
effectively ........................................................................................................................... 156
What volume or flow rate is logistically feasible for treatment? ........................................ 156
Where in KOE planned features can chemical treatment be applied? ................................ 156
Water quality parameters affect chemical treatment P reduction efficiency? Do we have
sufficient existing data or is additional data required? ....................................................... 157
What water quality standards must be met for chemically treated discharges to various
receiving waters? ................................................................................................................ 157
What is the best aerial economy of scale for treatment system implementation? .............. 157
Can the use of chemical treatment be permitted? ............................................................... 157
What are the monitoring requirements of planned solutions? ............................................ 157
What are the cost-benefits of planned solutions? ............................................................... 158
What factors effect settling and residual management? ..................................................... 158
What are the cost effective options for residual management? .......................................... 158
What chemicals should be evaluated? ................................................................................ 158
SUMMARY ............................................................................................................................ 158
REFERENCES ....................................................................................................................... 160

Final Report – Chemical Treatment
5
CHAPTER VII FINDINGS AND CONCLUSIONS ................................................................. 161
INTRODUCTION .................................................................................................................. 161
FINDINGS .............................................................................................................................. 161
What P concentrations and/or species will respond to chemical treatment cost effectively?
............................................................................................................................................. 162
What volume or flow rate is logistically feasible for treatment? ........................................ 162
Where in the KOE planned features can chemical treatment be applied? .......................... 162
What water quality parameters affect chemical treatment P-reduction efficiency? Do we
have sufficient existing data or is additional data required? ............................................... 162
What water quality standards must be met for chemically treated discharges to various
receiving waters? ................................................................................................................ 163
What is the best aerial economy of scale for treatment system implementation (parcel, sub-
basin, STA, reservoir)? ....................................................................................................... 163
Can the chemical treatment be permitted? .......................................................................... 164
What are the monitoring requirements of planned solutions? ............................................ 165
What are the cost-benefits of planned solutions? ............................................................... 165
What factors affect settling and residuals management? .................................................... 167
What are cost effective options for residual management? ................................................ 167
What chemicals and treatment configurations should be further evaluated? ..................... 168
CONCLUDING REMARKS .................................................................................................. 168
REFERENCES ....................................................................................................................... 170
CHAPTER VIII COMPREHENSIVE LISTING OF LITERATURE ........................................ 171

Final Report – Chemical Treatment
6
This report is available from the South Florida Water Management District, West Palm Beach
Florida and from the Stormwater Management Academy, University of Central Florida, Orlando
Florida, and can be downloaded from www.stormwater.ucf.edu.

Final Report – Chemical Treatment
7
ABSTRACT
Chemical treatment of stormwater discharges for the purpose of phosphorus removal is under
consideration for use within the South Florida Water Management District (SFWMD). There
exists significant literature on the subject but no one document which summarizes information
useful for decision making within the SFWMD. A significant investment in time, effort and
money may be allocated to chemical treatment, thus the purpose of this report is to present a
review of existing information and an evaluation of potential uses of chemical treatment to
reduce phosphorus loading within the Kissimmee, Okeechobee, and Everglades (KOE) areas and
at varying scales.
An extensive literature review is complete. Approximately 80% of the literature cited was in a
form that could be copied without copyright violation and reproduced in electronic form. Thus
an electronic copy for most of the literature and is available and entitled “Depository for Support
Literature.” Other literature not cited in the report is also included in the electronic copy and
together all the literature provide an in-depth review.
In reviewing available information, the authors are guided by the following implementation
issues.
1. What P concentrations and/or species will respond to chemical treatment cost effectively?
2. What volume or flow rate is logistically feasible for treatment?
3. Where in the KOE planned features can chemical treatment be applied?
4. What water quality parameters affect chemical treatment p-reduction efficiency? Do we
have sufficient existing data or is additional data required?
5. What water quality standards must be met for chemically treated discharges to various
receiving waters?
6. What is the best aerial economy of scale for treatment system implementation (parcel,
sub-basin, STA, reservoir)?
7. Can the chemical treatment be permitted?
8. What are the monitoring requirements of planned solutions?
9. What are the cost-benefits of planned solutions?
10. What factors affect settling and residuals management?
11. What are cost effective options for residual management?
12. What chemicals and treatment configurations should be further evaluated?
The existing information shows the use of chemicals to control phosphorus that discharge from
watersheds is well established and may be a viable and cost effective option for consideration by
decision makers in the SFWMD. The practical application of the technology requires an
understanding of flow attenuation, chemical dosing equipment, sludge handling, and local cost

Final Report – Chemical Treatment
8
considerations. Long term cost to include initial and operating cost investments favor larger
areas because of the reduced variability of flow and concentration. Nevertheless, chemical
treatment may be cost effective and reliable for most watershed sizes provided the operation can
be justified and the terms of a permit can be met. Monitoring of the effluent should not be a
problem. Cost comparisons can be made as chemical treatment is cost effective for most
watershed sizes. However if the treatment train is land intensive, land cost may be significant
and may be included in comparisons. Because of the many combinations of chemical treatment
options, a cost comparison among the various methods is not reasonable; nevertheless
comparisons are made with the knowledge that they are not always completely comparable.
A majority of the applications for flows from a concentrated discharge have used aluminum
sulfate (alum) compounds. Enhanced removal when using a chemical metal salt may be
achieved with an anionic polymer. Dosage and toxicity tests should be conducted before design
and construction to determine dosages and effectiveness. The literature supports the method of
dosage determination as a standard procedure well known by many professionals.
The use of water treatment residuals (WRT) is an option for areal treatment, and can also be used
for concentrated source treatment, but availability of WRT may be an issue. Laboratory testing
should be done to determine optimal dosage.
It is also known and documented that chemical treatment can be used as part of a combination of
treatment methods. Detention facilities, edge of farm (EOF) and Hybrid Wetland Treatment
Technologies (HWTT) are available for consideration. The HWTT system concept does reduce
some of the problems associated with residual management as the residuals can be reused in the
system. Residual management must be a consideration for the residuals and is part of cost
effective calculations.
Lastly, permitting of the chemical treatment methods is a function of the regulatory agencies and
with the data presented in this report together with the comprehensive associated literature list,
the authors believe that the system can be permitted.

Final Report – Chemical Treatment
9
CHAPTER I INTRODUCTION
PURPOSE
The purpose of this report is to present a review of existing information and an evaluation of
potential uses of chemical treatment to reduce phosphorus loading within the Kissimmee,
Okeechobee, and Everglades (KOE) areas and at varying scales. An assessment of whether
additional testing is necessary to determine the potential costs and benefits of various chemical
treatment technologies is also presented.
BACKGROUND
Over 40 years ago, chemical treatment using aluminum sulfate (alum) compounds and water
treatment plant residuals (WTRs) were introduced for phosphorus reduction in lakes and in
stormwater discharges (Wanielista et.al. 1979, 1981 and Harper et.al. 1982). Other chemical
compounds are used for the control of pollutants found in stormwater runoff since these early
studies and their use is documented within the literature (Lind, 1997). Polyacrylamide (PAM)
gained acceptance for phosphorus removal (Sojka, 1997) within the past ten years. Also,
scientific and engineering applications for WTRs are documented in the literature (O‟Connor et
al., 2002). Various technologies and applications of chemicals used for phosphorus containment
from agricultural and urban lands have been completed (DeBusk, 2005, SWET, 2002).
Of particular relevance to the literature review is a South Florida Water Management District
(SFWMD) comprehensive testing program to evaluate various chemical treatment configurations
to reduce TP in surface waters to a concentration of 10 g/L; the anticipated target for protecting
downstream Everglades marshes. This work was performed south of Lake Okeechobee in Palm
Beach County, with treatment trials performed on canal waters that conveyed Everglades
Agricultural Area runoff, Lake Okeechobee waters, or a blend of the two water types. This
research was part of the Advanced Treatment Technology (ATT) initiative, which was
performed at a time when the minimum achievable outflow TP concentrations from the
Everglades Stormwater Treatment Area (STA) wetlands was expected to be approximately 50
g/L. The chemical treatment systems were intended to either be stand-alone, or deployed in
conjunction with an STA. Most of the chemical treatment testing involved the use of two water
sources: Post-BMP waters, representing waters that enter an STA following the implementation
of on-farm “Best Management Practices” (BMPs), and Post-STA waters, representing outflow
waters from an STA. Summaries and listings of project reports for these efforts can be found in
Coffelt et al. (2001), HSA (2000) and SFWMD (2002).
Several chemical treatment technologies were evaluated, and considerable testing focused on
coagulant dose and type (e.g., aluminum sulfate, polyaluminum chloride [PACl], ferrous sulfate,
ferric chloride), used either with or without coagulant aids (various polymers). No buffers were
utilized in any of the trials, since the alkalinity of the Post-STA and Post-BMP waters was

Final Report – Chemical Treatment
10
adequate to support effective coagulation and flocculation.
A second key component that was evaluated, and one that served to differentiate many of the
technologies, was the approach for separating the chemical flocs – resulting from chemical
coagulant addition – from the treated water stream. For example, conventional or “high rate” floc
settling was investigated in a project entitled Chemical Treatment and Solids Separation (CTSS),
along with other more rigorous approaches for separating solids (direct filtration, dissolved air
flotation, microfiltration). A second project - “Managed Wetlands” - utilizes chemical dosing and
floc settling/clarification, followed by a downstream wetland unit process. The wetland was
utilized primarily to “polish” the water prior to discharge to downstream marshes, although at
times it served to capture and settle chemical flocs that were carried over from the upstream
settling/clarification step. The principal chemical treatment projects that comprised SFWMD‟s
ATT program included the CTSS, Managed Wetlands and Low Intensity Chemical Dosing
(LICD). This latter approach entailed the use of low doses of metal coagulants added either prior
to, or within a treatment wetland.
For all technologies, appropriate chemical doses initially were defined using laboratory jar tests,
followed by tests either within mesocosms, small wetland test cells (0.2 ha), or in a trailer-
mounted chemical treatment test bed facility. Additional testing, to determine the effects of
chemical amendments on numerous water quality constituents in addition to P, was performed to
ensure that system outflows would not adversely impact the downstream marsh communities.
The CTSS facility consisted of an in-line static mixer, a coagulation tank, two flocculation tanks
in series, and a clarifier fitted with inclined plate settlers. This treatment train, along with several
others, was able to achieve the 10 g/L target TP concentration. For the demonstration-scale
CTSS facility, highest short-period (December 4 through 23, 1999) P reduction (164 to 7 g/L)
for Post-BMP waters was achieved with 40 mg/L of ferric chloride and 0.5 mg/L of an anionic
polymer (Cytec A-130). The highest total P reduction (22 to 7 g/L) for Post-STA waters was
achieved with 20 mg Al/L (alum). Additional back –end filters (with 2 media types) provided
little additional P reduction. Similarly, the CTSS trailer facility effectively treated TP in urban
stormwater runoff (from the town of Wellington) to extremely low levels using PACl.
Microfiltration utilizes membranes with pore sizes from 0.04 to 20 microns, and this approach
was evaluated as a treatment technology for both Post-BMP and Post-STA waters. As expected,
the more efficient solids separation provided by the membrane resulted in lower chemical dose
requirements. For example, a “Zenon” microfiltration membrane unit successfully reduced Post-
BMP influent TP levels of 81 to 17 g/L without chemical addition. The addition of 9 mg Fe/L
(ferric chloride), 9 mg Al/L (alum) and 8 mg Al/L (PACl), followed by membrane separation,
resulted in outflow TP levels of 7, 11 and 12 g/L, respectively. For Post-STA waters, the Zenon
microfiltration membrane unit reduced influent TP levels of 24 to 13 g/L without chemical
addition. The addition of 2-4 mg Fe/L (ferric chloride) and 2 – 4 mg Al/L (alum) prior to
membrane treatment resulted in outflow TP levels of 8 and 11 g/L, respectively.
The Low Intensity Chemical Dosing (LICD) project represented a similar attempt to minimize
chemical dose requirements, using a wetland (STA), rather than membranes, to remove the
small, “pinpoint” flocs that resulted from low-level coagulant additions. In trials performed by

Final Report – Chemical Treatment
11
the SFWMD and Duke University using metal coagulant concentrations as high as 20 mg/L,
however, the technology was unsuccessful in reducing water column TP levels below that of an
un-amended “control” cattail marsh, or in achieving the 10 g/L TP target. Similarly, the
Managed Wetland technology, which employed both PACl (14.5 – 36 mg Al/L) and a polymer
(0.5 – 1.0 mg/L) in the front-end chemical treatment unit process, did not attain the target
outflow TP level of 10 g/L, instead providing outflows in the range of 12 – 15 g/L. While the
downstream wetland did not contribute to TP removal (and at times, increased water column TP
levels) following the chemical treatment step, it did provide some desirable ionic “conditioning”,
by altering pH, alkalinity and metal ion concentrations.
Although bioassay and algal growth potential studies conducted on inflow waters and chemically
treated outflow waters in several of the projects demonstrated no significant adverse impact to
biota, changes in chemical composition indeed were observed as a result of coagulant additions.
For example, coagulant amendments typically resulted in slight elevations in outflow metal (iron
or aluminum) concentrations, as well as marked changes in other constituents. Trials using the
CTSS demonstration trailer resulted in alkalinity reductions of 129 to 38 mg/L (Post-BMP
waters) and 220 to 114 mg/L (Post-STA waters). Sulfate increased from 50 mg/L to 164 mg/L
for the Post-STA waters that received alum. The CTSS process reduced color of Post-BMP
runoff from 153 to 22 APHA units. However, neither the Post-STA nor Post-BMP waters
exhibited a reduction in nitrogen (N) compounds as a result of CTSS treatment.
The ATT initiative also produced a number of key design and operational findings relevant to the
use of chemical treatment technologies for removing P from surface waters in south Florida.
These are important to an understanding of chemical systems for the removal of pollutants and
are summarized below.
From a design standpoint, the ATT investigators recommended that a flow equalization basin be
utilized in large-scale treatment systems to balance the extremes of quality and quantities of
water. Within the treatment facilities, clarifier surface loading rates of 0.14 gallons per minute
per square foot were found to achieve satisfactory solids separation. Finally, a post-treatment
settling basin was recommended to capture any potential floc overflow from the CTSS system.
Capital costs (dollars per cubic meter of capacity) were similar for post-BMP and post-STA
sites, with civil work (40%), equipment (24%) and land (24%) comprising the major cost items.
The ATT initiative also noted that strict operator control is required for chemical treatment
systems to perform effectively. While this potentially imposes an operational cost burden, it also
is advantageous in that properly operated treatment systems can be started quickly and can
respond rapidly to troubleshooting. Both iron and aluminum salts were found to be effective for
P removal, typically at dosing rates that resulted in a water pH of 6.0 to 6.3. Phosphorus removal
with metal salts often was enhanced by the use of anionic polymers. Chemical costs were found
to comprise approximately 70% of operating costs, suggesting that optimization efforts should
focus on techniques for minimizing chemical use.
Finally, the ATT investigators noted that residuals management also can comprise a major
component of the operating costs. Land application of residuals was tested as part of this
program, and the residuals exhibited no adverse effects to vegetable crops, other than the

Final Report – Chemical Treatment
12
tendency to cause P limitations in the soil.
These cited publications and results are valuable but a more complete review of the literature is
needed in light of the possible extensive use of chemical treatment with the SFWMD area. The
literature and experience of the authors of this report provides valuable information used to
determine the feasibility for chemical use. The review with extensive literature citations is
contained in this report.
SFWMD APPLICATIONS
The Northern Everglades Chemical Treatment Pilot Project was initiated through the Process
Development and Engineering component of the Lake Okeechobee Watershed Construction
Project Phase II Technical Plan (P2TP). The P2TP, submitted to the legislature on February 1,
2008, identifies regional construction projects and on-site measures, such as agricultural and
urban BMPs, necessary to meet the Lake‟s total phosphorus Total Maximum Daily Load
(TMDL) limit. Reducing phosphorus export from a watershed can minimize eutrophication in
the lake due to excessive phosphorus inputs. Intensive phosphorus management strategies will
be needed to lower the loadings sufficiently to meet the Lake TMDL by 2015. It is also recognized that chemical treatment may be used in other places within the SFWMD
and, as such, the potential for chemical treatment in all locations within the SFWMD should be
determined. Nutrient TMDLs for other water bodies within the SFWMD have recently been
adopted or are under development. Nutrient based TMDLs include both phosphorus and nitrogen
parameters. Nitrogen as well as other pollutant reductions may result from the use of chemicals,
but phosphorus is the target pollutant when using the chemicals considered in this report.
EPA recently adopted a phosphorus TMDL for tributaries in the Lake Okeechobee watershed
based on a phosphorus concentration of 113 ppb. A phosphorus concentration around 55 ppb is
being considered in the Kissimmee watershed and a phosphorus water quality standard of 10 ppb
already exists for the Everglades Protection Area. Chemical treatment shows promise for
achieving concentration reduction to acceptable levels; however, the treatment train and
operational parameters have to be defined. Chemical treatment can be a stand-alone method, or
can also be used with other control strategies that reduce water discharge volumes and/or
phosphorus concentration, to achieve further phosphorus load reduction.
LIMITATIONS
It is recognized by the authors that there are other methods for the control of phosphorus. The
focus of this report is on chemical treatment. The report is also constrained to the climate
conditions of south Florida, generally considered to be tropical with a rainy season from June
through September. It is also recognized that tropical cyclones have to be considered in design
and operation. Between October and May, frontal passage is probable but the region is relatively
dry providing for other opportunities to use chemical treatment of non-storm generated waters.

Final Report – Chemical Treatment
13
ROAD MAP
In this Chapter, the background, purpose and limitations are introduced. Within the next three
Chapters, presented is information relative to three classes of chemical treatment; namely the use
of Aluminum, Iron, and Calcium Salts (Chapter 2); the use of Polymers (Chapter 3) and the use
of Water Treatment Residuals (Chapter 4). Within Chapter 5, chemical treatment as a part of a
wetland system is presented and named as Hybrid Wetlands to distinguish it from naturally
functioning wetlands. Within Chapter 6, chemical treatment as part of stormwater management
is presented and called Edge of Farm. In the last Chapter, a summary of findings is presented.
Each Chapter includes references cited in the Chapter. In addition, there is a separate electronic
publication for most of the references, namely “Technical Assistance for The Northern
Everglades Chemical Study, Depository for Support Literature.” It is available from the
SFWMD and from the University of Central Florida Stormwater Academy web site,
www.stormwater.ucf.edu.
The authors conducted a comprehensive search and review of related literature and potential data
sources for chemical treatment of discharges from land uses common to the SFWMD area. In
reviewing all available information, the authors were guided by the following implementation
issues.
1. What P concentrations and/or species will respond to chemical treatment cost effectively?
2. What volume or flow rate is logistically feasible for treatment?
3. Where in the KOE planned features can chemical treatment be applied?
4. What water quality parameters affect chemical treatment p-reduction efficiency? Do we
have sufficient existing data or is additional data required?
5. What water quality standards must be met for chemically treated discharges to various
receiving waters?
6. What is the best aerial economy of scale for treatment system implementation (parcel,
sub-basin, STA, reservoir)?
7. Can the chemical treatment be permitted?
8. What are the monitoring requirements of planned solutions?
9. What are the cost-benefits of planned solutions?
10. What factors affect settling and residuals management?
11. What are cost effective options for residual management?
12. What chemicals and treatment configurations should be further evaluated?
REFERENCES
Coffelt, G., J.M. Newman, T. Aziz, D. Campbell, B. Gu, J. Jorge, J. Lopez, K. Pietro and L.
Wenkert. 2001. Chapter 8: Advanced Treatment Technologies for Treating Stormwater
Discharges into Everglades Protection Area. South Florida Water Management District

Final Report – Chemical Treatment
14
Everglades Consolidated Report. SFWMD, West Palm Beach, Florida, USA.
DeBusk, T.A., K. A. Grace and F.E. Dierberg. 2005. Treatment wetlands for removing
phosphorus from agricultural drainage waters. In: E. J. Dunne, K. R. Reddy and O.T.
Carton, Eds, Nutrient Management in Agricultural Watersheds: A Wetlands Solution. Pp.
167 – 178. Wageningen Academic Publishers, The Netherlands.
Harper, H.H.; Wanielista, M.P.; and Yousef, Y.A., 1982. "Restoration of Lake Eola," 2nd Annual
Conference of the North American Lake Management Society, Vancouver, British
Columbia, October 27-29.
HSA Engineers and Scientists, Inc., 2000. Chemical Treatment Followed by Solids Separation
Advanced Technology Demonstration Project. Final Project Report to the South Florida
Water Management District, West Palm Beach, Florida, USA.
Lind, C.B. (December 1997). “Phosphorus Inactivation – Chemical Precipitants and Strategies.”
Presented at the 17th
International Symposium of the North American Lake Management
Society (NALMS), Houston, Texas.
O‟Connor, G.A., Elliott, H.A., Lu, P., 2002. Characterizing water treatment residuals for P
retention. Soil Crop Sci. Soc. Florida Proc., 67–73.
Sojka, R.E. and Lentz, R.D. 1997. A PAM Primer: A Brief History of PAM and PAM Related
Issues. U.S. Department of Agriculture, Agricultural Research Service, Northwest
Irrigation and Soils Research Lab. Posted on USDA-ARS website.
http://www.nwisrl.ars.usda.gov/research/PAM/primer
South Florida Water Management District, 2002. Chapter 4C: Advanced Treatment
Technologies. South Florida Water Management District Everglades Consolidated
Report. West Palm Beach, Florida, USA.
SWET. 2002. Final Report - Task 2.10 Evaluation of Alternatives Ranking Best Available
Technologies. SFWMD Project entitled „Dairy Best Available Technologies in the
Okeechobee Basin‟. SFWMD. West Palm Beach, FL
Wanielista, M.P.; Yousef, Y.A.; and Taylor, J.S., (1981). "Stormwater Management to Improve
Lake Water Quality,” Final report Environmental Protection Agency. 600/2-82-048, January
Wanielista, M.P., “Lake Eola: A Case Study, (1979)." Urban Stormwater and Combined Sewer
Overflow Impacts Workshop, Orlando, Florida, Environmental Protection Agency,
November 27.

Final Report – Chemical Treatment
15
CHAPTER II ALUMINUM, IRON, AND CALCIUM SALTS
INTRODUCTION
Coagulation and clarification of water using metal salts has been practiced since at least Roman
times to reduce turbidity and improve the appearance of drinking water and surface water. The
predominant chemical agent used in these processes has been aluminum sulfate [Al2(SO4)3],
commonly referred to as alum. Lime [Ca(OH)2] has also been used, either alone or in
combination with alum as well as with iron salts, such as ferric sulfate [Fe2(SO4)3] or ferric
chloride (FeCl3).
Alum was used by the ancient Romans beginning around 2000 BC as a coagulant which was
mixed with lime to make bitter water potable. Beginning in the mid-1700s, muddy water in
England was treated with alum, followed by flocculation and filtration of the supernatant, to
improve the quality of drinking water. Large-scale coagulation of municipal water supplies
originated in Baltom, England in 1881 (Baker, 1981).
The first scientific investigation into the use of alum for coagulation in the United States was
conducted by Rutgers University in 1885. They concluded alum was useful in clarifying turbid
water without impairment to taste or physiological properties. During 1885-1897, a series of
experiments was conducted on turbid water collected from the Ohio River. A variety of
compounds were tested, including alum, potash, and lime, with alum found to be the most
suitable. These experiments eventually led to the widespread use of alum coagulation in the
United States. Concurrent research was also conducted on the use of iron compounds, such as
ferrous sulfate and ferric chloride, which were found to be reasonably effective in certain
situations. However, alum remains the most widely used coagulant today.
In 1970, Jernelov was apparently the first to use alum to remove phosphorus from the water
column of a lake in a whole-lake alum application conducted as part of a lake restoration project
on Lake Langsjon in Sweden. The first U.S. lake to be treated with a whole-lake alum
application was Horseshoe Lake in Wisconsin which received a surface application of 2.6 mg
Al/liter in May 1970. Twelve years later, phosphorus concentrations were still below the pre-
treatment level (Garrison and Knauer, 1984).
In 1985, a lake restoration project was initiated at Lake Ella, a shallow, 13.3 ac hypereutrophic
lake in Tallahassee, Florida, which receives untreated stormwater runoff from approximately 163
ac of highly impervious urban watershed areas. Initially, conventional stormwater treatment
technologies, such as retention basins, exfiltration trenches and filter systems, were considered
for reducing available stormwater loadings to Lake Ella in an effort to improve water quality
within the lake. Since there was no available land surrounding Lake Ella that could be used for
construction of traditional stormwater management facilities, and the cost of purchasing homes
and businesses to acquire land for construction of these facilities was cost-prohibitive, alternate

Final Report – Chemical Treatment
16
stormwater treatment methods were considered.
Chemical treatment of stormwater runoff was evaluated using various chemical coagulants,
including alum, ferric salts and polymers. Alum consistently provided the highest removal
efficiencies and produced the most stable end product. In view of successful jar test results on
runoff samples collected from the Lake Ella watershed, the design of a prototype alum injection
stormwater system was completed. Construction of the Lake Ella alum stormwater treatment
system was completed in January 1987, resulting in a rapid and significant improvement in water
quality.
OVERVIEW OF TECHNOLOGY
Characteristics of Common Coagulants
A number of inorganic salts of calcium, iron, and aluminum are sold commercially for
coagulation purposes. A summary of properties of common coagulants is given in Table 2-1.
Within the United States, alum is used extensively for clarification of drinking water originating
from surface water sources. Lime is commonly used for treatment of drinking water which
originates as a groundwater source. Iron compounds are used predominantly in treatment of
domestic and industrial wastewaters. Both aluminum and iron compounds are used for
phosphorus removal in a variety of processes.
TABLE 2-1
PROPERTIES OF COMMON COAGULANTS
COMMON
NAME
FORMULA EQUIVALENT
WEIGHT
pH OF 1%
SOLUTION
AVAILABLE
FORMS
Alum Al2(SO4)3 p 14H2O 114 3.5 Lump:
Liquid:
17% Al2O3
4.4% Al
Lime Ca(OH)2 40 12 Lump:
Powder:
Slurry:
As CaO
93-95%
15-50%
Ferric Chloride FeCl3 p 6H2O 91 3-4 Lump:
Liquid:
20% Fe
10-45% FeCl3
Ferric Sulfate Fe2(SO4)3 p 3H2O 51.5 3-4 Granular: 18.5% Fe
Copperas FeSO4 p 7H2O 139 3-4 Granular: 20% Fe
Sodium Aluminate Na2Al2O4 100 14 Liquid: 20-25% Al2O3
10-13% Al
Aluminum Chloride AlCl3 44 < 1 Liquid: 15-30% AlCl3
Polyaluminum
Hydroxychloride
PACl Varies Varies Liquid: 3-13% Al

Final Report – Chemical Treatment
17
Alum is produced by dissolving aluminum ore in sulfuric acid and water. The most common aluminum sources used for production of alum are chemical grade bauxite, high aluminum clays, and aluminum trihydrate. Bauxite and bauxitic clays are used to produce the standard grade alum most commonly used for coagulation. The purity of alum will vary with aluminum and acid sources used in the production process. However, bauxite and bauxitic clays are low in metal contaminants, and alum solutions are typically low in most heavy metals. Aluminum chloride is generated in a similar manner by dissolving aluminum ore in hydrochloric acid. Polyaluminum hydroxychloride (PACl) consists of a variety of products which vary in both physical and chemical characteristics. Many PACl compounds contain supplemental hydroxide (OH)
- ions which cause lower pH depression and alkalinity impacts during coagulation
processes. The manufacturing of PACl in North America is commonly done with very pure raw materials. Thus, heavy metal impurities in PACl are often less than the cleanest standard alum. PACl is often a good choice for coagulation processes where pH depression is a significant concern. However, PACl is substantially more expensive than alum, and distributors are limited. Ferric sulfate has been used in the water treatment industry since the late 1800s. Ferric sulfate solutions can be either manufactured or reprocessed from waste streams generated in iron mills, foundries, and pickeling operations. One of the most common methods for manufacturing ferric sulfate is to dissolve iron ores or scrap iron in sulfuric acid. As a result, ferric sulfate is often highly variable in terms of its chemical composition and contaminant levels. Ferric chloride (FeCl3) is the most widely used iron salt in North America, and is second only to alum for use in chemical coagulation. Ferric chloride is produced in a manner similar to ferric sulfate, where iron ore is dissolved in hydrochloric acid. As a result, heavy metals are common contaminants. Strict control of chemical characteristics of ferric chloride is necessary when using this compound in treating surface or drinking waters. Sodium aluminate is an alkaline form of alum which is formed by dissolving aluminum ore in sodium hydroxide. Sodium aluminate is a good choice for treatment of acidic waters since the excess alkalinity will provide pH neutralization. Sodium aluminate contains approximately three times as much aluminum by weight as alum, and as a result, must be used and dosed carefully to avoid overdose and undesirable increases in pH. The chemical impurities in sodium aluminate are similar to the level of impurities found in high grade alum. Unlike solutions of aluminum or iron which consist of dissolved ions in solution, lime is typically supplied as a slurry of calcium hydroxide solids in water. Since the product consists of a slurry of solids, it must be continuously agitated to prevent the solids from settling onto the bottom of the storage tank. Lime slurry is used in a wide variety of applications which include pH adjustment, metals precipitation, lime softening, coagulation, and sludge stabilization. Lime slurries have been used on a limited basis for removal of phosphorus in surface waters. However, lime precipitation typically occurs at a pH range of approximately 10-12 which then requires pH neutralization as a second step. The lime precipitate must be separated from the treated water prior to pH neutralization to avoid dissolution of the lime precipitate and release of undesirable compounds as the pH is lowered. In view of the additional steps and equipment required for storage and distribution of lime, and the subsequent sludge separation and pH neutralization processes, lime is seldom used for coagulation processes designed to remove phosphorus.
Final Report – Chemical Treatment
18
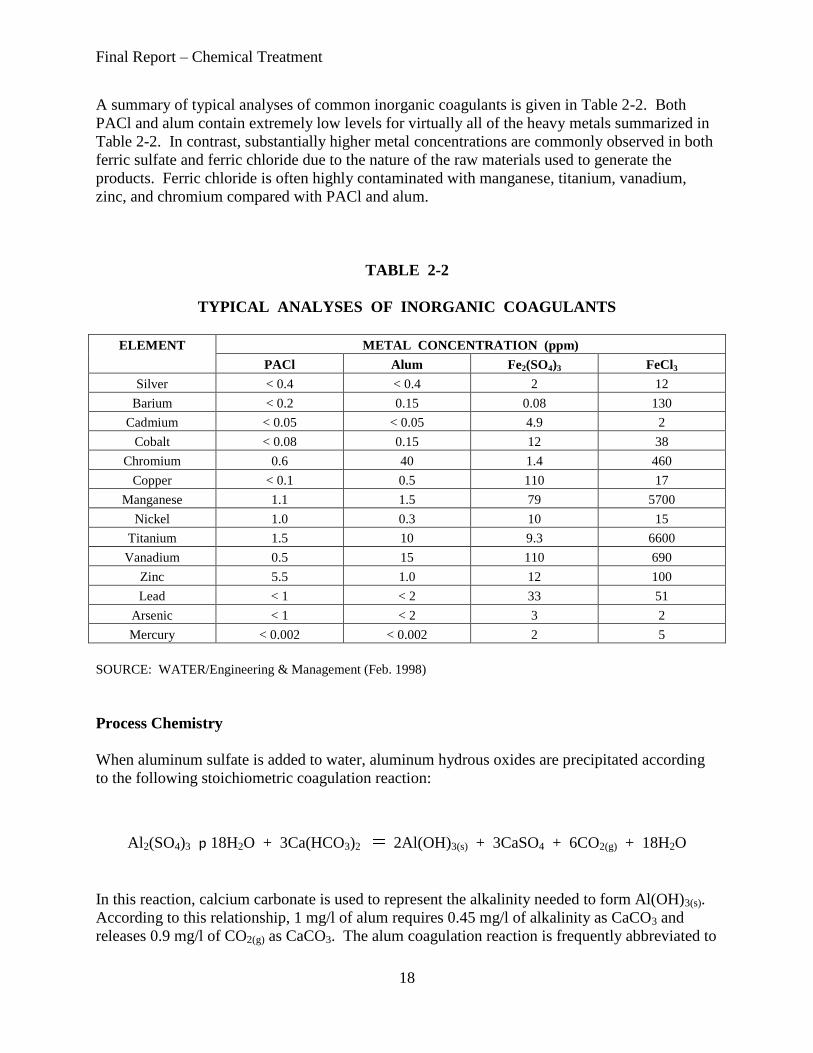
A summary of typical analyses of common inorganic coagulants is given in Table 2-2. Both
PACl and alum contain extremely low levels for virtually all of the heavy metals summarized in
Table 2-2. In contrast, substantially higher metal concentrations are commonly observed in both
ferric sulfate and ferric chloride due to the nature of the raw materials used to generate the
products. Ferric chloride is often highly contaminated with manganese, titanium, vanadium,
zinc, and chromium compared with PACl and alum.
TABLE 2-2
TYPICAL ANALYSES OF INORGANIC COAGULANTS
ELEMENT METAL CONCENTRATION (ppm)
PACl Alum Fe2(SO4)3 FeCl3
Silver < 0.4 < 0.4 2 12
Barium < 0.2 0.15 0.08 130
Cadmium < 0.05 < 0.05 4.9 2
Cobalt < 0.08 0.15 12 38
Chromium 0.6 40 1.4 460
Copper < 0.1 0.5 110 17
Manganese 1.1 1.5 79 5700
Nickel 1.0 0.3 10 15
Titanium 1.5 10 9.3 6600
Vanadium 0.5 15 110 690
Zinc 5.5 1.0 12 100
Lead < 1 < 2 33 51
Arsenic < 1 < 2 3 2
Mercury < 0.002 < 0.002 2 5
SOURCE: WATER/Engineering & Management (Feb. 1998)
Process Chemistry
When aluminum sulfate is added to water, aluminum hydrous oxides are precipitated according
to the following stoichiometric coagulation reaction:
Al2(SO4)3 p 18H2O + 3Ca(HCO3)2 2Al(OH)3(s) + 3CaSO4 + 6CO2(g) + 18H2O
In this reaction, calcium carbonate is used to represent the alkalinity needed to form Al(OH)3(s).
According to this relationship, 1 mg/l of alum requires 0.45 mg/l of alkalinity as CaCO3 and
releases 0.9 mg/l of CO2(g) as CaCO3. The alum coagulation reaction is frequently abbreviated to

Final Report – Chemical Treatment
19
include just significant products and reactants.
The addition of alum to water results in the production of chemical precipitates which remove
pollutants by two primary mechanisms. Removal of suspended solids, algae, phosphorus, heavy
metals and bacteria occurs primarily by enmeshment and adsorption onto aluminum hydroxide
precipitate according to the following net reaction:
Al+3
+ 6H2O Al(OH)3(s) + 3H3O+
Removal of additional dissolved phosphorus occurs as a result of direct formation of AlPO4 by:
Al+3
+ HnPO4n-3
AlPO4(s) + nH+
The aluminum hydroxide precipitate, Al(OH)3, is a gelatinous floc which attracts and adsorbs
colloidal particles onto the growing floc, thus clarifying the water. Phosphorus removal or
entrapment can occur by several mechanisms, depending on the solution pH. Inorganic
phosphorus is also effectively removed by adsorption to the Al(OH)3 floc. Removal of
particulate phosphorus is most effective in the pH range of 6-8 where maximum floc occurs
(Cooke and Kennedy, 1981). At higher pH values, OH- begins to compete with phosphate ions
for aluminum ions, and aluminum hydroxide-phosphate complexes begin to form. At lower pH
values and higher inorganic phosphorus concentrations, the formation of aluminum phosphate
(AlPO4) is favored.
The chemical stoichiometric reaction for coagulation with iron compounds is similar to the
reactions previously provided for aluminum. A typical coagulation reaction involving ferric
sulfate can be written as:
Fe2(SO4)3 p 18H2O + 3Ca(HCO3)2 2Fe(OH)3(s) + 3CaSO4 + 6CO2(g)
The addition of iron to water also produces chemical precipitates which remove pollutants by the
same two primary mechanisms previously discussed for aluminum. Removal of suspended
solids, algae, phosphorus, heavy metals, and bacteria occurs primarily by enmeshment and
adsorption onto iron hydroxide precipitate according to the following net reaction:
Fe+3
+ 6H2O Fe(OH)3(s) + 3H3O+
Removal of additional dissolved phosphorus occurs as a result of formation of FePO4 by:

Final Report – Chemical Treatment
20
Fe+3
+ HnPO4n-3
FePO4(s) + nH+
Immediately after addition to water, Al+3
and Fe+3
cations undergo hydration reactions in
aqueous systems which are governed by a variety of factors such as the presence of other
inorganic ligands, concentration of the metal ion, and pH of the solution. The hydrolytic
reactions are so rapid that raw metal ions do not exist, and ionic species occur as a variety of
soluble monomeric, dimeric, and polymeric hydroxo-metal complexes. A listing of significant
hydrolytic reactions and equilibrium constants for aluminum, iron, and calcium reactions are
given in Table 2-3. Both Al and Fe are ampoteric and capable of forming both cationic and
anionic complexes.
TABLE 2-3
HYDROLYTIC REACTIONS AND CONSTANTS
FOR ALUMINUM, IRON, AND CALCIUM EQUILIBRIA @ 25oC
REACTION
NUMBER
REACTION LOG Keq
1 Al+3
+ H2O = AlOH+2
+ H+ - 4.97
2 Al+3
+ 2H2O = Al(OH)2+ + 2H
+ - 9.3
3 Al+3
+ 3H2O = Al(OH)3(aq) + 3H+ - 15.0
4 Al+3
+ 4H2O = Al(OH)4- + 4H
+ - 23.0
5 2Al+3
+ 2H2O = Al2(OH)2+4
+ 2H+ - 7.7
6 3Al+3
+ 4H2O = Al3(OH)4+5
+ 4H+ - 13.9
7 13Al+3
+ 28H2O = Al13O4 (OH)24+7
+ 32H+ - 98.7
8 -Al(OH)3(s) + 3H+ = Al
+3 + 3H2O 8.5
9 Al(OH)3 + 3H+ = Al
+3 + 3H2O amorph. 10.5
10 Al+3
+ 3OH- = Al(OH)3(s) 33.0
1 Fe+3
+ H2O = FeOH+2
+ H+ - 2.19
2 Fe+3
+ 2H2O = Fe(OH)2+ + 2H
+ - 5.67
3 Fe+3
+ 3H2O = Fe(OH)3(aq) + 3H+ < 12.0
4 Fe+3
+ 4H2O = Fe(OH)4- + 4H
+ - 21.6
5 2Fe+3
+ 2H2O = Fe2(OH)2+4
+ 2H+ - 2.95
6 -Fe(OH)(s) + 3H+ = Fe
+3 + 2H2O 0.5
7 (am) Fe(OH)(s) + 3H+ = Fe
+3 + 2H2O 2.5
8 Fe+3
+ 3OH- = Fe(OH)3(s) 38.0
1 CaHPO4(s) = Ca+2
+ HPO4-2
- 6.6
2 Ca4H(PO4)3(s) = 4Ca+2
+ 3PO4-3
+ H+ - 46.9
3 Ca10(PO4)6(OH)2(s) = 10Ca+2
+ 6PO4-3
+ 2OH- - 114
4 Ca10(PO4)6(F)2(s) = 10Ca+2
+ 6PO4-3
+ 2F- - 118
5 Ca10(PO4)6(OH)2(s) + 6H2O = 4[Ca2(HPO4)(OH)2] + 2Ca+2
+ 2HPO4-2
- 17

Final Report – Chemical Treatment
21
A solubility diagram for freshly precipitated and aged Al(OH)3 floc is given in Figure 2-1. The
equilibrium solubility of aluminum is primarily a function of pH and age of the floc. Freshly
precipitated Al(OH)3 floc has a minimum solubility of approximately 10-5
M which occurs in the
pH range of 6.2-8.0. However, over a period of several months, the alum floc ages, eventually
forming gibbsite, with a minimum solubility of approximately 10-9
M. As this aging process
occurs, the pH range of minimum solubility shifts slightly into the range of approximately 5-7.
0
-2
-4
-6
-8
-10
-12
2 4 6 8 10
0
-2
-4
-6
-8
-10
-12
2 4 6 8 10
Lo
g [
Co
nc
.]
Lo
g [
Co
nc
.]
pH pH
Al(OH)3(s)
Al(OH)3(s)
Freshly Precipitated Al(OH)3 Aged Al(OH)3
Al(OH)+2
Al+3
Al+3
Al2(OH)2+4
Al2(OH)2+4 Al13(OH)34
+5
Figure 2-1. Solubility Diagram for Freshly Precipitated and Aged Al(OH)3.
(Adapted from Snoeyink and Jenkins, 1980).
A solubility diagram for freshly precipitated Fe(OH)3 floc is given on Figure 2-2. The minimum
solubility for this floc is approximately 10-9
M which occurs in the pH range of approximately 8-
10. The stability of the floc decreases substantially and the solubility of Fe+3
increases
substantially at pH values both lower and higher than this range. Unlike Al(OH)3, Fe(OH)3 does
not undergo a significant aging process or shift in solubility characteristics over time.
A solubility diagram for calcium phosphate compounds is given on Figure 2-3. The minimum
solubility for calcium phosphate compounds is approximately 10-10
M which occurs in the pH
range of approximately 10-12. The stability of the floc decreases substantially and the solubility
of Ca+2
increases substantially at pH values less than 8. Unlike AlOH3, calcium phosphate

Final Report – Chemical Treatment
22
compounds do not undergo a significant aging process or shift in solubility characteristics over
time.
2
-8
-6
-4
-2
4 6 8 10 12-10
Lo
g [
Fe
]
pH
Fe(OH)3(s)
Figure 2-2
Figure 2-2. Solubility Diagram for Amorphous Fe(OH)3.
(Adapted from Faust and Aly, 1998).

Final Report – Chemical Treatment
23
2
10
8
6
4
4 6 8 10 12
2
Lo
g [
So
lub
le P
]
-
-
-
-
-
pH
CaHPO4
Ca4H(PO4)3
Ca10H(PO4)6(OH)2
Ca10H(PO4)6(F)2
Figure 2-3
Figure 2-3. Solubility Diagram for Calcium Phosphate Complexes.
(Adapted from Stumm and Morgan, 1981).
In addition to phosphorus removal by absorption onto metal hydroxides, iron and aluminum
compounds can also precipitate dissolved orthophosphorus directly as metal phosphate
compounds. Solubility diagrams for ferric and aluminum phosphate are given on Figure 2-4.
The minimum solubility for ferric phosphate appears to be approximately 10-5.8
M which occurs
at a pH of 4-5. The minimum solubility for aluminum phosphate (AlPO4)(s) is approximately
10-6.5
M which occurs at a pH value of approximately 6-6.5. These diagrams appear to suggest
that alum will provide a lower equilibrium concentration when used for coagulating waters with
high concentrations of orthophosphate.

Final Report – Chemical Treatment
24
2
-6
-5
-4
-3
4 6 8-7
3
-6
-5
-4
-3
5 7 9-7
Figure 2-4
Lo
g [
Fe
]
Lo
g [
Al]
FePO4(s)AlPO4(s)
Al(OH)3(s)
Fe(OH)3(s)
pH pH
Figure 2-4. Solubility Diagrams for Ferric and Aluminum Phosphate.
Physical Factors Affecting Coagulation
Many factors are capable of affecting the coagulation process using metal salts. The most
significant factors include: (a) coagulant dosage, (b) pH, (c) natural color concentration, (d)
competing ions in solution, (e) mixing effects, and (f) temperature.
In general, the performance efficiency of metal salt coagulants increases in a non-linear fashion
with increases in coagulant dose, provided that a relatively neutral pH is maintained during the
process. Although the performance efficiency increases with increasing coagulant dose, the
additional removal efficiency achieved begins to level off and become asymptotic at elevated
doses.
The impact of pH on the coagulation process has been discussed in previous sections. In general,
the coagulation process is maximized, and residual metal concentrations minimized, when the
coagulated water is maintained within the pH range of minimum solubility for the applied
coagulant. For alum, this pH zone is approximately 6-7, while for iron the minimum solubility
occurs in the pH range of 8-10, and in the pH range of 10-12 for calcium.
A considerable amount of information has been developed concerning the chemical nature of

Final Report – Chemical Treatment
25
organic color in natural waters. Organic color generally has the physical property of a negatively
charged colloid with particle sizes ranging from 3.5-10 m. When the dissolved organic carbon
(DOC) in a water is low, the formation of humic-aluminum precipitates is favored which often
have poor settling characteristics. However, when the DOC is high, the precipitation process
favors formation of Al(OH)3 which is a more rapidly settling precipitate.
Competing ions in solution can substantially impact the kinetics of the coagulation process.
Anions such as sulfate have long been known to suppress the charge reversal process which is
primarily responsible for formation of settleable floc material. Also, the presence of divalent
ions such as Ca+2
and Mg+2
have been shown to enhance the coagulation process.
Temperature may also have a significant impact on the coagulation process. Under cold
temperatures, floc formation and the removal efficiency achieved using metal salts for
coagulation decreases substantially. Colder temperatures often require a change in coagulant or
change in dose to maintain acceptable settling characteristics and removal efficiencies.
However, under conditions commonly observed within the State of Florida, temperature is
generally an insignificant parameter impacting coagulation processes.
Impacts of Redox Potential
Aluminum and calcium do not exhibit alternative oxidation states in the natural environment, and
both aluminum and calcium compounds are immune to changes in redox potential within the
collected floc. Compounds absorbed onto aluminum or calcium floc are equally stable under
aerobic or anoxic conditions.
However, iron compounds can exhibit several different electron configurations, the most
common of which involve the ferric (Fe+3
) and ferrous (Fe+2
) ions. Under oxidized conditions,
indicated by redox potentials in excess of 200 mv (Eh), iron compounds are predominantly
present in the ferric ion state. Compounds formed with ferric ions are highly insoluble under
aerobic conditions. When the redox potential drops below 200 mv and reduced conditions
dominate, the ferric ion accepts an electron and is converted into a highly soluble ferrous ion, as
shown in the following reaction:
Fe+3
+ e- Fe
+2
Any contaminants which have been adsorbed onto the iron floc will be released as the floc
dissolves under the reduced conditions. Therefore, iron compounds should only be used for
coagulation in processes where aerobic conditions can be assured at all times. Iron compounds
may not be suitable for use in systems where the floc is collected and stored in a pond for long
periods of time in submerged conditions. A summary of iron solubility as a function of pH and
redox potential is given in Table 2-4. For example, at a pH of 7.0, iron is 10,000,000,000,000
times more soluble under reduced conditions than under highly oxidized conditions.

Final Report – Chemical Treatment
26
TABLE 2-4
SOLUBILITY OF IRON SPECIES AS A
FUNCTION OF pH AND REDOX POTENTIAL
SPECIES pH
6.0 6.5 7.0 7.5 8.0 8.5
Fe+3
10-7.9
10-9.4
10-10.9
10-12.4
10-13.9
10-15.4
Fe+2
Eh = 800 mv 10-8.5
10-10.0
10-11.5
10-13.0
10-14.5
10-16.0
Eh = 600 mv 10-5.0
10-6.5
10-8.0
10-9.5
10-11.0
10-12.5
Eh = 400 mv 10-1.5
10-3.0
10-4.5
10-6.0
10-7.5
10-9.0
Eh = 300 mv 2 10-1.25
10-2.75
10-4.25
10-5.75
10-7.25
Eh = 250 mv 13 0.4 10-1.9
10-3.4
10-4.9
10-6.4
Eh = 200 mv 100 3 0.1 10-2.5
10-4.0
10-5.5
Eh = 0 mv 300,000 10,000 300 10 0.3 10-2.0
pH Impacts
One of the most significant issues involved in the selection and use of chemical coagulants is the
potential for either consumption or addition of alkalinity and the resulting impacts on pH. A
comparison of alkalinity addition or consumption during coagulation with common treatment
chemicals is given in Table 2-5. When iron or aluminum coagulants are used, alkalinity is
consumed as a result of the coagulation process which can result in a decrease in solution pH,
depending upon the applied coagulant dose and the available buffering capacity of the source
water. As seen in Table 2-5, the alkalinity consumption during coagulation is higher with ferric
coagulants than with aluminum sulfate, aluminum chloride, or PACl. This suggests that at equal
doses the addition of ferric chloride will have a more significant impact on pH than would be
observed using aluminum-based coagulants. In contrast, alkalinity is added to the source water
during coagulation with alkaline coagulants, such as lime, sodium hydroxide, or sodium
aluminate.

Final Report – Chemical Treatment
27
TABLE 2-5
ALKALINITY ADDITION OR CONSUMPTION DURING
COAGULATION WITH COMMON TREATMENT CHEMICALS
(Lind, 1997)
CHEMICAL
(BASIS)
CHANGE IN
ALKALINITY
(ppm as CaCO3 per ppm Product)
Ferric Chloride/Sulfate (liquid) - 1.0
Aluminum Sulfate (dry basis) - 0.5
Aluminum Chloride (liquid) - 0.3
PACl (liquid) -0.3 to -0.05 (varies with product)
Lime (dry) + 1.45
Sodium Hydroxide (dry) + 1.26
Soda Ash (sodium carbonate) (dry) + 0.96
Sodium Bicarbonate (dry) + 0.6
Sodium Aluminate (liquid) +0.4 to +0.6 (varies with product)
APPLICATIONS AND SUCCESS STORIES
At Least Fifty Five Facilities in the State
Environmental Research & Design, Inc. (ERD) pioneered the concept of using chemical coagulants for treatment of stormwater and tributary inflows during the mid-1980s. The first system designed for chemical treatment of stormwater was constructed on Lake Ella, Tallahassee, during 1986. This system injects liquid alum into the incoming stormwater on a flow-proportioned basis. The alum forms inert precipitates of Al(OH)3 and AlPO4, which sorb phosphorus, suspended solids, heavy metals, organic compounds, and bacteria as it settles from the water column into the lake sediments. This system provided a cost effective and highly efficient method for treatment of stormwater runoff in an urban setting. Since that time, ERD has designed and constructed more than 55 additional alum treatment systems in urban settings and conducted literally hundreds of laboratory jar tests to evaluate treatment feasibility for a wide range of water characteristics collected throughout the State of Florida. ERD has also conducted FDEP sponsored research to address a variety of potential issues related to chemical treatment, such as removal efficiencies, reaction kinetics, floc generation rates, floc characteristics, floc disposal, benthic and ecological impacts, floc stability, and treatment costs. During 1988, ERD conducted an evaluation of the feasibility of using chemical treatment to reduce phosphorus loadings from agricultural discharges into Lake Apopka. A pilot system was constructed which confirmed the ability of the process to remove phosphorus from pumped agricultural discharges. During 1995, ERD evaluated, designed, and constructed an alum treatment system for the primary agricultural inflow to Lake Apopka (30,000 gpm), which is still in operation today. Since that time, ERD has designed, and in some cases, constructed, 5 additional large scale treatment systems for tributary and agricultural discharges, one of which is located in the Northern Okeechobee Basin. The most recent system, located in the Lake Apopka

Final Report – Chemical Treatment
28
basin, is capable of continuously treating up to 300 cfs.
Initial Testing and Evaluation
Once alum has been identified as an option in a stormwater management or retrofit project,
extensive laboratory testing must be performed to verify the feasibility of alum treatment and to
establish process design parameters. The feasibility of alum treatment for a particular
stormwater stream is typically evaluated in a series of laboratory jar tests conducted on
representative runoff samples collected from the project watershed area. This laboratory testing
is an essential part of the evaluation process necessary to determine design, maintenance, and
operational parameters such as the optimum coagulant dose required to achieve the desired water
quality goals, chemical pumping rates and pump sizes, the need for additional chemicals to
buffer receiving water pH, post-treatment water quality characteristics, floc formation and
settling characteristics, floc accumulation, annual chemical costs and storage requirements,
ecological effects, and maintenance procedures. In addition to determining the optimum
coagulant dose, jar tests can also be used to determine floc strength and stability, required mixing
intensity and duration, and determine design criteria for settling basins.
Since 1986, Environmental Research & Design, Inc. (ERD) has performed literally hundreds of
laboratory flocculation jar tests to evaluate the effectiveness of alum for reducing concentrations
of common constituents in stormwater runoff collected from a wide range of urban land use
activities. A summary of mean removal efficiencies achieved during alum treatment of
stormwater runoff for typical stormwater pollutants is given in Table 2-6. Removal efficiencies
are summarized for alum treatment of stormwater runoff at doses of 5, 7.5 and 10 mg Al/liter, as
well as stormwater samples which were allowed to settle under quiescent conditions for a period
of 24 hours to simulate removal efficiencies which would be achieved using a wet or dry
detention stormwater treatment basin for comparison purposes (Harper, et al., 1998).
TABLE 2-6
TYPICAL REMOVAL EFFICIENCIES FOR
ALUM TREATED STORMWATER RUNOFF
PARAMETER SETTLED
WITHOUT
ALUM
ALUM DOSE (mg/l as Al)
5 mg/l 7.5 mg/l 10 mg/l
Diss. Organic N 20 51 62 65
Particulate Nitrogen 67 88 94 96
Total Nitrogen 20 25-50 30-60 40-70
Diss. Orthophosphorus 17 96 98 98
Particulate P 71 82 94 95
Total P 45 86 94 96
Turbidity 92 98 99 99
TSS 80 95 97 98
BOD 44 61 63 64
Total Coliform 37 80 94 99
Fecal Coliform 61 96 99 99

Final Report – Chemical Treatment
29
As seen in Table 2-6, alum treatment of stormwater runoff consistently achieves an 85-95%
reduction in total phosphorus, 20-70% reduction in total nitrogen, 95-99% reduction in turbidity
and TSS, and 96-99% reduction in fecal coliform bacteria. Removal efficiencies of 50-90% are
also achieved for heavy metals. The minimum tested dose of 5 mg Al/liter is generally
considered to be the minimum dose necessary to achieve acceptable floc settling characteristics.
Removal efficiencies for measured constituents appear to increase slightly with increasing alum
dose. In general, removal efficiencies achieved using alum are substantially greater than those
achieved using settling alone.
Removal of total phosphorus in alum treated stormwater occurs by direct precipitation of
orthophosphorus as aluminum phosphate (AlPO4), as well as enmeshment of particulate
phosphorus by incorporation into Al(OH)3 floc. Removal of nitrogen species occurs primarily as
a result of precipitation of particulate nitrogen and dissolved organic nitrogen, since alum
treatment generally does not affect measured concentrations of ammonia or nitrate.
As seen in Table 2-6, alum treatment removal efficiencies for nitrogen can be highly variable. In
general, alum treatment has only a minimal effect on concentrations of ammonia and virtually no
impact on concentrations of NOx in stormwater runoff. Removal of dissolved organic nitrogen
species can also be highly variable, depending upon molecular size and structure of the organic
compounds. The only nitrogen species which can be removed predictably is particulate nitrogen.
As a result, removal efficiencies for total nitrogen are highly dependent upon the nitrogen species
present, with higher removal efficiencies associated with runoff containing large amounts of
particulate and organic nitrogen and lower removal efficiencies for runoff flows which contain
primarily inorganic nitrogen species. Selection of the "optimum" dose often involves an economic
evaluation of treatment costs vs. desired removal efficiencies.
System Configurations
In a typical alum stormwater treatment system, alum is injected into the stormwater or tributary
flow on a flow-proportioned basis so that the same dose of alum is added regardless of the
discharge rate. A variable speed chemical metering pump is typically used as the injection
pump. If the initial laboratory testing indicates that the addition of alum to the target runoff flow
will reduce pH levels to undesirable levels, a buffering agent, such as sodium aluminate
(Na2Al2O4) or sodium hydroxide (NaOH) can be injected along with the alum to maintain
desired pH levels. A separate metering system and storage tank will be necessary for the
buffering agent.
The operation of each injection pump is regulated by a flow meter device attached to each
incoming stormwater line to be treated. Measured flow from each stormwater flow meter is
transformed into a 4-20 mA electronic signal which instructs the metering pump to inject alum
according to the measured flow of runoff discharging through each individual stormsewer line.
Mixing of the alum and stormwater occurs as a result of turbulence in the stormsewer line. If
sufficient turbulence is not available within the stormsewer line, artificial turbulence can be
generated using aeration or physical stormsewer modifications. Since alum addition is regulated
by the rate of flow in the stormsewer line, the treatment system is capable of treating stormwater

Final Report – Chemical Treatment
30
as well as dry weather baseflow. A series of rate experiments were conducted by Harper (1990) to evaluate the time required for
dissolution of alum floc. Since Al+3
can be a potentially toxic species, floc formation should be
complete prior to discharging the treated stormwater into the receiving waterbody. It was
determined that floc formation is complete, although on a microscopic scale, and Al+3
is virtually
removed from the water column, in 45-60 seconds after alum addition. Therefore, alum injection
locations are carefully selected to allow a minimum of 45-60 seconds of travel time in the
stormsewer line after alum addition prior to reaching the receiving waterbody.
Mechanical components for an alum stormwater treatment system include chemical metering
pumps and stormsewer flow meters and electronic controls which are typically housed in a
central facility constructed as an above-ground or below-ground structure. A fiberglass storage
tank is typically used for bulk alum storage. Alum feed lines and electrical conduits are run from
the central facility to each point of alum addition and flow measurement. Alum injection points
can be located as far as 3000 ft or more from the central pumping facility. The capital costs of
constructing an alum stormwater treatment system do not increase substantially with increasing
size of the drainage basin which is treated. As a result, alum treatment has become increasingly
popular in large regional treatment systems.
Prior to 1998, many of the constructed alum stormwater treatment systems allowed the
generated aluminum floc to settle directly in the receiving waterbody. An example of this type
of system is the Lake Howard alum stormwater treatment system located in downtown Winter
Haven. This system provides alum injection to seven separate stormsewer systems which drain
approximately 261 acres of commercial and single-family land use adjacent to Lake Howard.
An overview of the Lake Howard alum stormwater treatment system is given on Figure 2-5. A
single chemical metering pump is used to inject alum to each of the seven points of injection,
with flow control valves used to regulate the amount of alum added at each injection point.
Mixing of the alum and stormwater occurs within the stormsewer system, and the generated
alum floc discharges directly into Lake Howard. The electrical components and pumping
equipment are contained within a small equipment building constructed on vacant land adjacent
to the Lake.
One of the earliest stormwater treatment systems was constructed on Lake Lucerne, a 29-acre
urban lake located near downtown Orlando. Lake Lucerne receives untreated stormwater runoff
from a 267-acre watershed which includes much of downtown Orlando. An alum stormwater
treatment system was designed which injects liquid alum into six primary stormsewer systems
discharging to Lake Lucerne which contribute approximately 90% of the annual runoff inputs to
the lake. Mechanical components for the Lake Lucerne alum treatment system are housed in an
underground vault beneath an elevated expressway and required no land purchase for
construction. The floc generated during the coagulation process discharges directly into the lake.
Photographs of Lake Lucerne and the underground pump and control building are given on
Figure 2-6.

Final Report – Chemical Treatment
31
Equipment Building Equipment Building
Alum Injection Equipment
Underground Alum Storage Tank
Figure 2-5
Floc Discharge
to Lake
Underground Alum Storage Tank Equipment Building
Alum Injection Equipment
Underground Alum Storage Tank
Figure 2-5
Floc Discharge
to Lake
Alum Injection Equipment
Equipment Building
Alum Injection Equipment
Underground Alum Storage Tank
Figure 2-5
Floc Discharge
to Lake
Equipment Building
Alum Injection Equipment
Underground Alum Storage Tank
Figure 2-5
Floc Discharge
to Lake
Figure 2-5. Overview of the Lake Howard Alum Stormwater Treatment System.
Virtually all of the alum stormwater treatment systems permitted after 1998 provide mechanisms
for collection and removal of the generated floc. One of the first systems designed for automatic
collection and removal of the alum floc is referred to as the Gore Street treatment system which
provides alum treatment for a 250-acre watershed in downtown Orlando which discharges into
Clear Lake. An overview of the Gore Street alum stormwater treatment and floc collection
system is given on Figure 2-7. The mechanical components for the system are housed in a small
prefabricated concrete building located adjacent to the point of injection. Alum is injected into a
large 8-ft x 10-ft CBC, and the generated floc is collected in an expanded portion of the channel

Final Report – Chemical Treatment
32
which connects the box culvert to Clear Lake. A semi-permeable fabric is used to collect the
alum floc while allowing water to pass through the fabric. The generated floc is removed
periodically by pumping directly into the adjacent sanitary sewer system. Figure 2-6
Figure 2-6
Chemical
metering pumps
Pump control
panels
Flow meter control
panels
Figure 2-6. Photographs of Lake Lucerne and the Underground Pump and Control Building.

Final Report – Chemical Treatment
33
Equipment Building Equipment Building Floc Disposal System
In-line Floc Trap In-line Floc Trap
Figure 2-7
Floc Pumping
Equipment
Permeable
Fabric
Floc Disposal System Equipment Building Floc Disposal System
In-line Floc Trap In-line Floc Trap
Figure 2-7
Floc Pumping
Equipment
Permeable
Fabric
In-Line Floc Trap
Equipment Building Floc Disposal System
In-line Floc Trap In-line Floc Trap
Figure 2-7
Floc Pumping
Equipment
Permeable
Fabric
In-Line Floc Trap
Equipment Building Floc Disposal System
In-line Floc Trap In-line Floc Trap
Figure 2-7
Floc Pumping
Equipment
Permeable
Fabric
Figure 2-7. Overview of the Gore Street Alum Stormwater Treatment System.
One of the larger alum stormwater treatment systems was constructed in the City of Largo to
provide treatment for a 1158-acre watershed which discharges through a canal into Tampa Bay.
An overview of the Largo regional alum treatment system is given on Figure 2-8. A drivable
diversion weir was constructed across the channel to divert the canal water into an underground
box culvert. The flow rate through the box culvert is measured using a flow meter, and alum is
injected according to the rate of stormwater flow. Mechanical and electrical components for the

Final Report – Chemical Treatment
34
alum injection system are housed in an adjacent concrete block building. The alum floc is
discharged into a floc settling pond, and the clear water discharges through an outfall structure
back into the original channel. Collected floc is removed periodically from the settling pond
using a series of underwater sumps which are connected to the adjacent sanitary sewer lift
station.
Drivable Drainage
Diversion Weir
Alum Injection
Building
Canal Flow Diverted
Into Box Culvert
Flow
Figure 2-8
Floc Settling
Pond
Elevated
Wooden
Boardwalk
Floating Dock
Paved
Walking
Path
15 Acre
Hardwood
Wetland
Enhancement
Wetland
EnhancementInflow
Outflow
Figure 2-8
Figure 2-8. Overview of the Largo Regional Alum Treatment Facility.

Final Report – Chemical Treatment
35
The largest alum stormwater treatment system to date is located along the Apopka-Beauclair Canal
which extends between Lake Apopka and Lake Beauclair in Central Florida. This canal carries
discharges from Lake Apopka, a 30,000-acre shallow hypereutrophic lake, into Lake Beauclair
which forms the headwaters of the Harris Chain-of-Lakes. Inflow from the Apopka-Beauclair
Canal into Lake Beauclair is thought to be the single largest source of phosphorus loadings to the
Harris Chain-of-Lakes. The Apopka-Beauclair Canal Nutrient Reduction Facility (NuRF) is
designed to provide alum treatment for the canal discharges prior to reaching Lake Beauclair.
A schematic of the NuRF Facility is given on Figure 2-9. Discharge rates and water level elevations
in the Apopka-Beauclair Canal are regulated by the Apopka-Beauclair Canal lock and dam. The
NuRF Facility uses the difference in water level elevations between upstream and downstream
portions of the canal to force the upstream canal water into two parallel treatment basins. Liquid
alum is added upstream of the point of inflow into the treatment basins, and the generated floc
settles onto the bottom of the ponds. These basins are designed to allow treatment of up to 300 cfs
while still providing a minimum detention time of three hours for capture of the floc material.
Treated discharges from the ponds enter a small canal which conveys the treated water downstream
of the lock and dam structure where it ultimately reaches Lake Beauclair. Flow in excess of 300
cfs, which rarely occurs, will be allowed to bypass the treatment system.
From Lake Apopka
Lock and Dam
Structure
Treatment Pond 1
Treatment Pond 2
Inflow Canal
300 cfs max.Outflow
Canal
To Lake
Beauclair
Alum Pumping
& Control Bldg.
62,000 gal
alum storage tanks
Floc dewatering
facility
Dried floc
storage
area
200,000 gal
Floc mixing tank
Figure 2-9
Figure 2-9. Overview of the Lake County NuRF Facility.

Final Report – Chemical Treatment
36
Approximately 1-2 times each year, depending upon treated flow rates, floc removal will be necessary from the two settling ponds. This removal will be achieved using an automated dredging system constructed as part of these ponds. This system will automatically dredge the accumulated floc from the bottom of the pond and pump the dredge slurry to a large centrifuge located in the adjacent floc processing building. The centrifuge will decrease the water content of the sludge to approximately 40%, so that it can be hauled to the adjacent floc drying area. The floc drying area consists of an elevated area constructed on permeable soils where the floc will continue to dry naturally. It is anticipated that the dry floc will be used either as landfill cover or by the St. Johns River Water Management District as a soil amendment for various Lake Apopka restoration projects. The alum floc still contains considerable uptake capacity for phosphorus and other species and can be used to reduce phosphorus release from flooded farm lands which are converted to water quality treatment areas. The NuRF Facility contains storage capabilities for approximately 124,000 gallons of alum to meet chemical demand under high flow conditions. At the maximum design treatment rate of 300 cfs, the facility will utilize approximately eight tanker loads (4500 gallons) of alum each day. The construction cost for the facility was approximately $7.5 million, with an anticipated annual alum consumption in excess of 1 million gallons.
A recent innovation in alum treatment systems is currently being constructed at Lake Seminole in Pinellas County. Lake Seminole is a large eutrophic urban lake which has been hydraulically impacted by construction of the adjacent Seminole Bypass Canal. To increase flushing within the lake, water from the Seminole Bypass Canal is pumped into a linear alum treatment system at a constant flow rate of 10 cfs. The generated floc settles onto the bottom of a trough-type collection system, and the treated water is then discharged into lake Seminole to increase flushing and provide a source of clean water. The collected floc settles onto the bottom of the trough and is removed automatically on a daily basis using a series of control valves and floc collection pumps. The collected floc is then discharged to the sanitary sewer system for disposal. A schematic of the Lake Seminole Bypass Canal treatment system is given on Figure 2-10. Alum treatment has also been evaluated for use in reducing nutrient concentrations in agricultural runoff. Harper (1987) performed an extensive study to evaluate the effectiveness of alum for reducing nutrient concentrations in agricultural runoff from the Central Florida area. The evaluated farm areas were utilized primarily for row crops which were grown in high organic muck and peat type soils. Runoff generated from these areas was found to contain high levels of color, with large portions of inorganic and organic nutrient forms. The dominant nitrogen species was found to be dissolved organic nitrogen, while the dominant phosphorus species was dissolved orthophosphorus. Typical changes in water quality characteristics resulting from alum treatment of agricultural runoff are summarized in Table 2-7. In general, alum treatment resulted in slight reductions in pH and alkalinity in the treated water, with corresponding increases in specific conductivity. Inorganic nitrogen species were relatively unaffected by the treatment process, with the majority of total nitrogen removal occurring as a result of reduction in concentrations of organic nitrogen. Alum treatment was observed to be extremely effective in reducing concentrations of dissolved orthophosphorus with more than 90% removal achieved at alum doses in excess of 10 mg Al/liter. Alum treatment was also effective in reducing concentrations of TSS and BOD, with approximately 50% removal for these parameters at alum doses in excess of 10 mg Al/liter. In general, efficient

Final Report – Chemical Treatment
37
removal of phosphorus species from agricultural runoff using alum required doses which were approximately two times greater than the doses necessary to substantially reduce nutrient concentrations in urban runoff.
Seminole Bypass Canal
Alum pumping
and control bldg. Treatment SystemInflow
10 cfs
Treated
Discharge
Lake Seminole
Cross-section of Treatment System
Floc collection
system – discharge
to sanitary sewer
25 ft.
Lake Seminole Bypass Canal Treatment System
First system
which is
totally
automated
Figure 2-10
Figure 2-10. Schematic of the Lake Seminole Bypass Canal Treatment System.
TABLE 2-7
TYPICAL CHANGES IN WATER QUALITY
CHARACTERISTICS RESULTING FROM ALUM
TREATMENT OF AGRICULTURAL RUNOFF1
PARAMETER UNITS RAW
WATER
ALUM TREATED (Dose in mg Al/liter)
5 10 15 20
pH s.u. 7.24 6.88 6.59 6.40 6.10
Alkalinity mg/l 186 153 128 102 80.6
Specific Conductivity μmho/cm 589 600 609 619 627
NH3-N μg/l 1083 1101 1094 1081 1131
NOx-N μg/l 133 50 56 59 62
Organic Nitrogen μg/l 3850 2438 2541 1775 1625
Total Nitrogen μg/l 5066 3689 3689 2913 2816
Orthophosphorus μg/l 666 244 100 24 11
Total Phosphorus μg/l 853 696 642 257 80
TSS mg/l 34.1 20.5 18.0 17.1 10.6
BOD mg/l 5.3 3.9 3.1 2.4 2.1
1. Harper (1987)
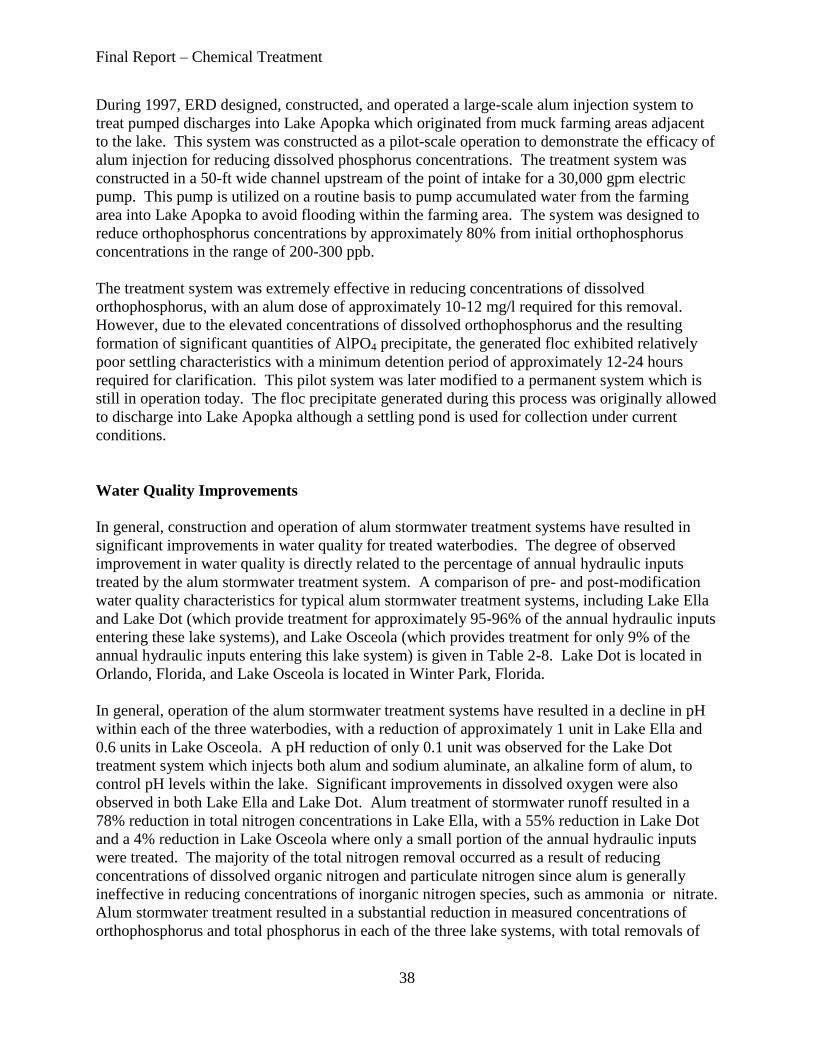
Final Report – Chemical Treatment
38
During 1997, ERD designed, constructed, and operated a large-scale alum injection system to
treat pumped discharges into Lake Apopka which originated from muck farming areas adjacent
to the lake. This system was constructed as a pilot-scale operation to demonstrate the efficacy of
alum injection for reducing dissolved phosphorus concentrations. The treatment system was
constructed in a 50-ft wide channel upstream of the point of intake for a 30,000 gpm electric
pump. This pump is utilized on a routine basis to pump accumulated water from the farming
area into Lake Apopka to avoid flooding within the farming area. The system was designed to
reduce orthophosphorus concentrations by approximately 80% from initial orthophosphorus
concentrations in the range of 200-300 ppb.
The treatment system was extremely effective in reducing concentrations of dissolved
orthophosphorus, with an alum dose of approximately 10-12 mg/l required for this removal.
However, due to the elevated concentrations of dissolved orthophosphorus and the resulting
formation of significant quantities of AlPO4 precipitate, the generated floc exhibited relatively
poor settling characteristics with a minimum detention period of approximately 12-24 hours
required for clarification. This pilot system was later modified to a permanent system which is
still in operation today. The floc precipitate generated during this process was originally allowed
to discharge into Lake Apopka although a settling pond is used for collection under current
conditions.
Water Quality Improvements
In general, construction and operation of alum stormwater treatment systems have resulted in
significant improvements in water quality for treated waterbodies. The degree of observed
improvement in water quality is directly related to the percentage of annual hydraulic inputs
treated by the alum stormwater treatment system. A comparison of pre- and post-modification
water quality characteristics for typical alum stormwater treatment systems, including Lake Ella
and Lake Dot (which provide treatment for approximately 95-96% of the annual hydraulic inputs
entering these lake systems), and Lake Osceola (which provides treatment for only 9% of the
annual hydraulic inputs entering this lake system) is given in Table 2-8. Lake Dot is located in
Orlando, Florida, and Lake Osceola is located in Winter Park, Florida.
In general, operation of the alum stormwater treatment systems have resulted in a decline in pH
within each of the three waterbodies, with a reduction of approximately 1 unit in Lake Ella and
0.6 units in Lake Osceola. A pH reduction of only 0.1 unit was observed for the Lake Dot
treatment system which injects both alum and sodium aluminate, an alkaline form of alum, to
control pH levels within the lake. Significant improvements in dissolved oxygen were also
observed in both Lake Ella and Lake Dot. Alum treatment of stormwater runoff resulted in a
78% reduction in total nitrogen concentrations in Lake Ella, with a 55% reduction in Lake Dot
and a 4% reduction in Lake Osceola where only a small portion of the annual hydraulic inputs
were treated. The majority of the total nitrogen removal occurred as a result of reducing
concentrations of dissolved organic nitrogen and particulate nitrogen since alum is generally
ineffective in reducing concentrations of inorganic nitrogen species, such as ammonia or nitrate.
Alum stormwater treatment resulted in a substantial reduction in measured concentrations of
orthophosphorus and total phosphorus in each of the three lake systems, with total removals of
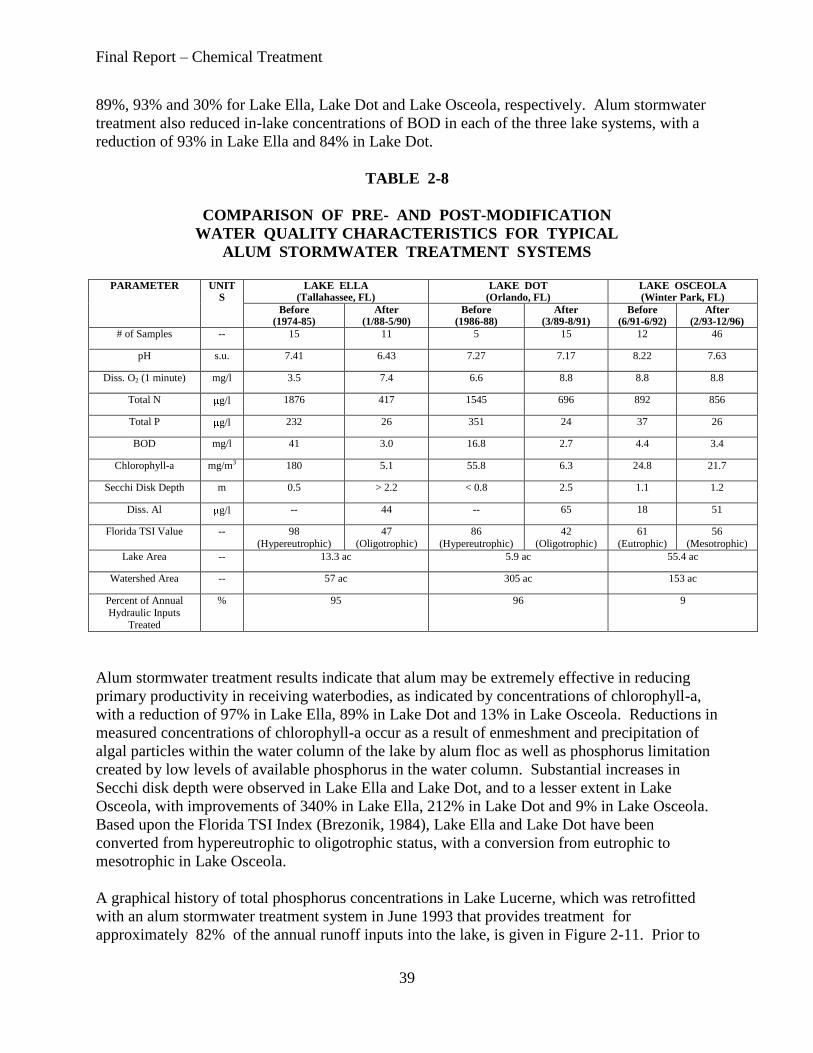
Final Report – Chemical Treatment
39
89%, 93% and 30% for Lake Ella, Lake Dot and Lake Osceola, respectively. Alum stormwater
treatment also reduced in-lake concentrations of BOD in each of the three lake systems, with a
reduction of 93% in Lake Ella and 84% in Lake Dot.
TABLE 2-8
COMPARISON OF PRE- AND POST-MODIFICATION
WATER QUALITY CHARACTERISTICS FOR TYPICAL
ALUM STORMWATER TREATMENT SYSTEMS
PARAMETER UNIT
S LAKE ELLA
(Tallahassee, FL) LAKE DOT
(Orlando, FL) LAKE OSCEOLA (Winter Park, FL)
Before (1974-85)
After (1/88-5/90)
Before (1986-88)
After (3/89-8/91)
Before (6/91-6/92)
After (2/93-12/96)
# of Samples -- 15 11 5 15 12 46
pH s.u. 7.41 6.43 7.27 7.17 8.22 7.63
Diss. O2 (1 minute) mg/l 3.5 7.4 6.6 8.8 8.8 8.8
Total N g/l 1876 417 1545 696 892 856
Total P g/l 232 26 351 24 37 26
BOD mg/l 41 3.0 16.8 2.7 4.4 3.4
Chlorophyll-a mg/m3 180 5.1 55.8 6.3 24.8 21.7
Secchi Disk Depth m 0.5 > 2.2 < 0.8 2.5 1.1 1.2
Diss. Al g/l -- 44 -- 65 18 51
Florida TSI Value -- 98
(Hypereutrophic)
47
(Oligotrophic)
86
(Hypereutrophic)
42
(Oligotrophic)
61
(Eutrophic)
56
(Mesotrophic)
Lake Area -- 13.3 ac 5.9 ac 55.4 ac
Watershed Area -- 57 ac 305 ac 153 ac
Percent of Annual
Hydraulic Inputs Treated
% 95 96 9
Alum stormwater treatment results indicate that alum may be extremely effective in reducing
primary productivity in receiving waterbodies, as indicated by concentrations of chlorophyll-a,
with a reduction of 97% in Lake Ella, 89% in Lake Dot and 13% in Lake Osceola. Reductions in
measured concentrations of chlorophyll-a occur as a result of enmeshment and precipitation of
algal particles within the water column of the lake by alum floc as well as phosphorus limitation
created by low levels of available phosphorus in the water column. Substantial increases in
Secchi disk depth were observed in Lake Ella and Lake Dot, and to a lesser extent in Lake
Osceola, with improvements of 340% in Lake Ella, 212% in Lake Dot and 9% in Lake Osceola.
Based upon the Florida TSI Index (Brezonik, 1984), Lake Ella and Lake Dot have been
converted from hypereutrophic to oligotrophic status, with a conversion from eutrophic to
mesotrophic in Lake Osceola.
A graphical history of total phosphorus concentrations in Lake Lucerne, which was retrofitted
with an alum stormwater treatment system in June 1993 that provides treatment for
approximately 82% of the annual runoff inputs into the lake, is given in Figure 2-11. Prior to
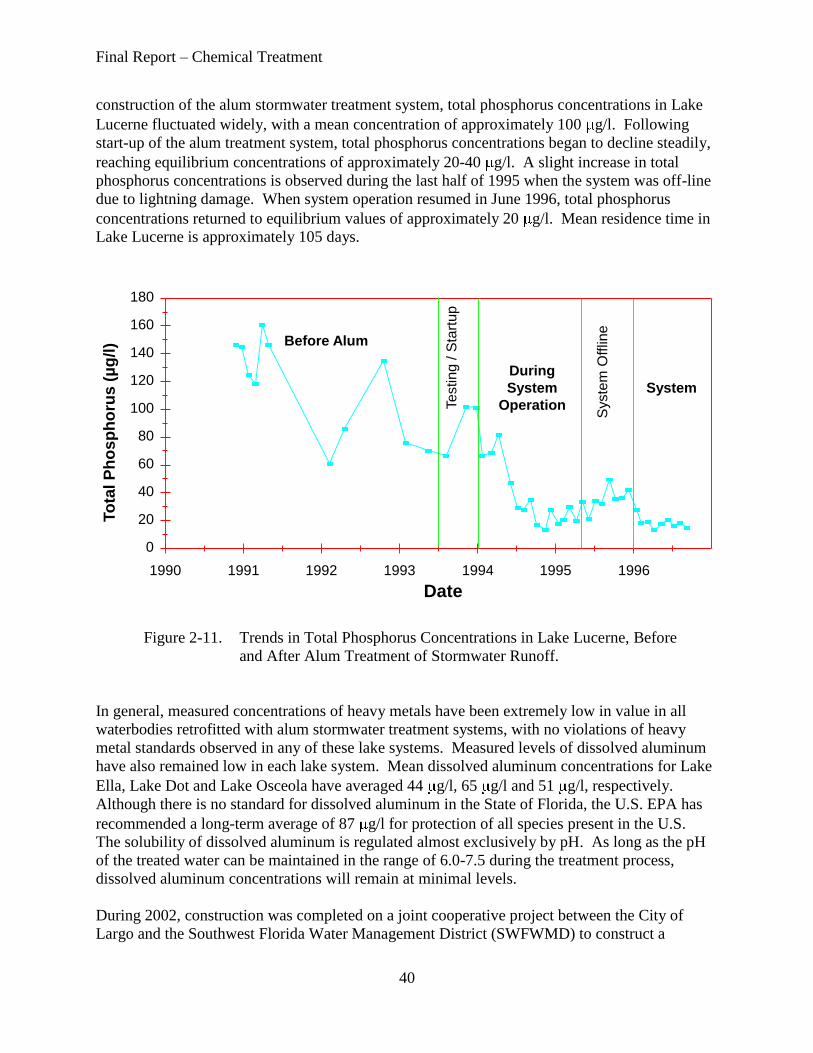
Final Report – Chemical Treatment
40
construction of the alum stormwater treatment system, total phosphorus concentrations in Lake
Lucerne fluctuated widely, with a mean concentration of approximately 100 g/l. Following
start-up of the alum treatment system, total phosphorus concentrations began to decline steadily,
reaching equilibrium concentrations of approximately 20-40 g/l. A slight increase in total
phosphorus concentrations is observed during the last half of 1995 when the system was off-line
due to lightning damage. When system operation resumed in June 1996, total phosphorus
concentrations returned to equilibrium values of approximately 20 g/l. Mean residence time in
Lake Lucerne is approximately 105 days.
0
20
40
60
80
100
120
140
160
180
To
tal P
ho
sp
ho
rus
(µ
g/l
)
1990 1991 1992 1993 1994 1995 1996
Date
Total Phosphorus
Before Alum
Te
stin
g / S
tart
up
During
System
Operation
During
System
Operation
Syste
m O
fflin
e
Figure 2-11
Figure 2-11. Trends in Total Phosphorus Concentrations in Lake Lucerne, Before
and After Alum Treatment of Stormwater Runoff.
In general, measured concentrations of heavy metals have been extremely low in value in all
waterbodies retrofitted with alum stormwater treatment systems, with no violations of heavy
metal standards observed in any of these lake systems. Measured levels of dissolved aluminum
have also remained low in each lake system. Mean dissolved aluminum concentrations for Lake
Ella, Lake Dot and Lake Osceola have averaged 44 g/l, 65 g/l and 51 g/l, respectively.
Although there is no standard for dissolved aluminum in the State of Florida, the U.S. EPA has
recommended a long-term average of 87 g/l for protection of all species present in the U.S.
The solubility of dissolved aluminum is regulated almost exclusively by pH. As long as the pH
of the treated water can be maintained in the range of 6.0-7.5 during the treatment process,
dissolved aluminum concentrations will remain at minimal levels.
During 2002, construction was completed on a joint cooperative project between the City of
Largo and the Southwest Florida Water Management District (SWFWMD) to construct a

Final Report – Chemical Treatment
41
regional alum stormwater treatment facility to treat pollutant loads discharging from a 1158-acre
watershed which discharges directly to Boca Ciega Bay and Tampa Bay. Photographs of the
Largo regional alum treatment facility are given on Figure 2-8. Performance efficiency
monitoring of the treatment facility was conducted by ERD from September 2002-February
2003. Monitoring was conducted of the raw runoff inflow prior to alum addition and at the
discharge from the alum floc settling pond.
A summary of the changes in phosphorus concentrations observed during field monitoring
program is given on Figure 2-12. The alum treatment facility resulted in substantial reductions
in measured concentrations of dissolved orthophosphorus, dissolved organic phosphorus,
particulate phosphorus, and total phosphorus. During the monitoring program, the treatment
system achieved a removal efficiency of approximately 85% for total phosphorus, 88% for TSS,
and 37% for total nitrogen. The observed removal efficiencies achieved by the system were
substantially in excess of the predicted annual load reductions predicted during the preliminary
evaluation phase. This system has resulted in a significant reduction in nutrient loadings
discharging to Tampa Bay. According to SWFWMD, the load reductions achieved by the Largo
project represent approximately 60% of the overall load reduction goals to Tampa Bay.
Dis
s. O
rth
o-P
Dis
s. O
rgan
ic P
Pa
rtic
ula
te P
To
tal P
Ph
osp
ho
rus C
on
ce
ntr
atio
n (
µg/l)
0
50
100
150
200
250
Inflow
Outflow
Figure 2-12. Fate of Phosphorus Species in the Largo Regional Stormwater Facility.

Final Report – Chemical Treatment
42
Floc Accumulation
Laboratory investigations have been conducted on stormwater runoff collected from a wide
range of land uses typical of urban areas to quantify the amount of alum floc generated as a result
of alum treatment of stormwater runoff at various treatment doses. After initial formation, alum
floc appears to consolidate rapidly for a period of approximately 6-8 days, compressing
approximately 20% of the initial floc volume. Additional consolidation appears to occur over a
settling period of approximately 30 days, after which collected sludge volumes appear to
approach maximum consolidation (Harper, 1990).
Estimates of maximum anticipated sludge production, based upon literally hundreds of
laboratory tests involving coagulation of stormwater runoff with alum at various doses, and a
consolidation period of approximately 30 days, is given in Table 2-9. At alum doses typically
used for treatment of stormwater runoff, ranging from 5-10 mg Al/liter, sludge production is
equivalent to approximately 0.16-0.28% of the treated runoff flow. Sludge production values
listed in Table 2-9 reflect the combined volume generated by alum floc as well as solids
originating from the stormwater sample.
TABLE 2-9
ANTICIPATED PRODUCTION OF ALUM SLUDGE
FROM ALUM TREATMENT OF STORMWATER AT VAROUS
DOSES AFTER A 30-DAY CONSOLIDATION PERIOD
ALUM DOSE
(mg/l as Al)
SLUDGE PRODUCTION
As Percent of
Treated Flow
Per 1000
m3 Treated
Per 106
Gallons Treated
5 0.16 1.6 m3 214 ft
3
7.5 0.20 2.0 m3 268 ft
3
10 0.28 2.8 m3 374 ft
3
After collection, alum floc undergoes a drying process similar to a wastewater sludge. Photographs of a typical drying process for alum floc are given on Figure 2-13. When fresh floc is collected, it generally dewaters rapidly, with a cracked cake forming in approximately one week. Complete dewatering of the sludge generally requires approximately 30-60 days, depending upon weather conditions. A volume reduction of approximately 95% is achieved in the dried sludge compared with the fresh floc.

Final Report – Chemical Treatment
43
After ~ 1 week After ~ 30 days
Fresh Floc
Figure 2-12
Figure 2-13. Typical Drying Process for Alum Floc.
Floc Characteristics and Stability A substantial amount of data has been collected by ERD regarding the physical and chemical characteristics of alum residual generated as a result of alum treatment of tributary inflows and stormwater runoff. One of the most recent studies was conducted as part of the preliminary evaluation phase for the Lake County NuRF project. A summary of the chemical characteristics of dried alum residual from NuRF pilot studies is given
in Table 2-10. The alum sludge evaluated during this study was generated by chemical coagulation
of thousands of gallons of water collected from the Apopka-Beauclair Canal. The generated floc
was captured, placed onto a drying bed, and allowed to dewater. After the sludge has dried,
chemical characteristics of the sludge were evaluated and compared with Clean Soil Criteria,
outlined in Chapter 62-777 FAC, to assist in identifying disposal options. As seen in Table 2-10,
the measured chemical characteristics from the alum residual are substantially less than the
applicable Clean Soil Criteria, based upon direct residential exposure which is the most restrictive
soil criteria. Based upon this analysis, the dried alum residual easily meets the criteria for use as fill
material for daily landfill cover.

Final Report – Chemical Treatment
44
TABLE 2-10
CHEMICAL CHARACTERISTICS OF DRIED ALUM
RESIDUAL FROM THE NURF PILOT STUDIES1
PARAMETER
UNITS
VALUE
CLEAN SOIL
CRITERIA2
(Chap. 62-777 FAC)
Aluminum μg/g 51,096 72,000
Antimony μg/g < 6.3 26
Barium μg/g < 21 110
Beryllium μg/g < 0.53 120
Cadmium μg/g 0.5 75
Calcium μg/g 1,564 None
Chromium μg/g 65.0 210
Copper μg/g 31.6 110
Iron μg/g 764 23,000
Lead μg/g 0.7 400
Magnesium μg/g 96.8 None
Manganese μg/g 12.3 1,600
Mercury μg/g < 0.091 3.4
Nickel μg/g 2.3 110
Zinc μg/g 50.6 23,000
NOx μg/g 0.773 120,000
Total N μg/g 2,054 None
SRP μg/g < 1 None
Total P μg/g 166 None
pH s.u. 6.17 None
1. Residual sample air-dried and screened using an 0.855 mm sieve
2. Based on residential direct exposure criteria.
The alum residual generated during the NuRF project pilot testing was also subjected to the Toxicity Characteristics Leaching Procedure (TCLP) in which a dried residual sample was agitated for 18 hours under acidified conditions at a pH of approximately 4.93. This procedure resulted in virtually no release of heavy metals from the dried residual samples. Measured concentrations for virtually all heavy metals were less than laboratory detection limits for the evaluated parameters. A summary of the results of the TCLP leachate testing conducted on dried alum residual from the NuRF project is given on Table 2-11. Soon after initial formation, newly formed alum floc consists of a series of individual crystalline structures which form the newly generated floc. Over time, these crystalline structures begin to combine into larger and larger crystalline structures. During this process, the OH/Al ratio increases approximately 10-fold from 0.3 in the newly formed floc to approximately 3.0 in the aluminum trihydroxide solid phase, commonly called gibbsite. As the crystalline structure becomes larger, the stability of the floc particles increases. The stability of trapped particles and ions within the crystalline structure also increases accordingly.

Final Report – Chemical Treatment
45
TABLE 2-11
RESULTS OF TCLP1 LEACHATE TESTING ON
DRIED ALUM RESIDUAL FROM THE NURF PROJECT
PARAMETER UNITS CONCENTRATION
Arsenic mg/l < 0.05
Barium mg/l < 1.0
Cadmium mg/l < 0.005
Chromium mg/l 0.011
Lead mg/l < 0.05
Mercury mg/l < 0.01
Selenium mg/l < 0.05
Silver mg/l < 0.01
1. Toxicity Characteristics Leaching Procedure - sample acidified with acetic acid to pH 4.93 and
agitated for 18 hours - residual sample air-dried and screened using an 0.855 mm sieve
A schematic of the aging process for alum floc is given on Figure 2-14. The aging process
summarized on this Figure requires approximately 30-90 days for completion. Once the floc
reaches the final aluminum trihydroxide or gibbsite phase, the structures are extremely stable
under a wide range of pH and redox conditions.
[Al6(OH)12(H20)12]6+ [Al10(OH)22(H20)16]
8+ [Al13(OH)30(H20)18]9+
OH
Al= 0.3-2.1
Aging Process for Alum Sludge
Aluminum
trihydroxide
solid phase
[Al13(OH)30(H20)18]9+
[Al24(OH)60(H20)24]12+
[Al54(OH)144(H20)36]18+
[Aln(OH)3n
Conclusions: 1. Aged alum floc is exceptionally stable under a wide range of pH and redox conditions
2. Constituents bound into the floc are inert and have virtually no release potential
OH
Al= 2.2-2.7
OH
Al= 3.0-3.3
Figure 2-14
Figure 2-14. Process of Aging for Newly Formed Alum Floc.
ERD has also conducted laboratory experiments on accumulated alum floc samples collected
from Lake Ella, Lake Dot, and Lake Lucerne to evaluate the influence of pH and redox potential

Final Report – Chemical Treatment
46
on the stability of heavy metals in alum treated sediments. Each of these lakes had alum
stormwater treatment systems with direct floc discharge which had been operational for 2-3
years. Each of these lakes also received an alum surface application to control sediment
phosphorus release.
An incubation apparatus was constructed which allows a circulating sediment slurry to be
maintained under precisely controlled conditions of pH and redox potential. A schematic and
photograph of this apparatus are given on Figure 2-15. Samples were collected periodically from
the sediment slurry to evaluate the solubility of heavy metals within the sediments under various
pH and redox conditions. Experiments were conducted at selected pH levels typical of values
within the sediments of each lake, as well as redox potentials from highly reduced to highly
oxidized.
The results of incubation experiments conducted on pre- and post-sediment samples collected
from Lake Ella for chromium, copper, lead and zinc are summarized in Figure 2-16 (Harper,
1990). Sediment metal release was found to be substantially less in alum treated samples than
observed in pre-treatment samples collected from the lake under a wide range of pH conditions
and under redox potentials ranging from highly oxidized to highly reduced. Alum floc is capable
of tightly binding heavy metals within the sediments, substantially reducing the potential toxicity
of in-place sediments. Similar results were obtained for copper, nickel and lead. As alum floc
ages, the freshly precipitated AlOH3 forms into a series of ringed structures which are extremely
stable and which tightly bind phosphorus and heavy metals in a crystalline lattice network.
These phosphorus and metal associations, once combined with alum, are apparently inert to
changes in pH and redox potential normally observed in a natural lake system.
The impact of alum floc on lake sediments has also been evaluated by comparison of pre- and
post-treatment sediment pore water concentrations in Lake Ella, Lake Lucerne and Lake Cannon.
A comparison of sediment pore water concentrations in Lake Lucerne before and after alum
stormwater treatment is given in Table 2-12. Post-treatment samples reflect approximately four
years of operation of the alum stormwater treatment system. Introduction of alum floc into the
lake sediments has significantly reduced measured concentrations of total nitrogen, total
phosphorus and each of the listed heavy metals. Pore water concentrations of total aluminum
have also been reduced as a result of replacing pre-treatment aluminum associations with stable
Al(OH)3 associations. The reduced pore water concentrations indicated in Table 2-12 provide an
enhanced environment for sediment-dwelling organisms.

Final Report – Chemical Treatment
47
Schematic of Sediment Incubation Apparatus
Figure 2-15
Incubation apparatus capable of incubating sediments under a wide
range of pH and redox conditions (oxidized to reduced)
Figure 2-15
Figure 2-15. Sediment Incubation Apparatus used to Evaluate Floc Stability.

Final Report – Chemical Treatment
48
Figure 2-16. Comparison of Sediment-Metal Stability in Pre- and Post-Treatment
Sediments in Lake Ella.
TABLE 2-12
COMPARISON OF SEDIMENT PORE WATER
CONCENTRATIONS IN LAKE LUCERNE BEFORE AND
AFTER ALUM STORMWATER TREATMENT
PARAMETER UNITS PRE-TREATMENT
SAMPLES
(12/92)
POST-TREATMENT
SAMPLES
(5/97)
PERCENT
REDUCTION
Total N g/l 9978 5846 41
Total P g/l 531 189 64
Total Al g/l 417 123 70
Total Cu g/l 21 6 71
Total Fe g/l 1389 50 96
Total Ni g/l 17 8 53
Total Mn g/l 314 36 89
Total Zn g/l 80 12 85
pH
5.0 6.5 5.0 6.0 7.0
Cop
per
Rele
ase (
µg/g
dry
wt.
)
0
1
2
Pre Post
pH
5.0 6.5 5.0 6.0 7.0
Lead
Rele
ase (
µg/g
dry
wt.
)
0
1
2
pH
5.0 6.5 5.0 6.0 7.0
Zin
c R
ele
ase (
µg/g
dry
wt.
)
0
1
2
Pre Post
pH
5.0 6.5 5.0 6.0 7.0Chro
miu
m R
ele
ase (
µg/g
dry
wt.
)
0
1
2
Pre Post
Pre Post
-200 mV
0 mV
200 mV
400 mV
-200 mV
0 mV
200 mV
400 mV
-200 mV
0 mV
200 mV
400 mV
-200 mV
0 mV
200 mV
400 mV

Final Report – Chemical Treatment
49
Construction and O&M Costs
A summary of construction and annual operation and maintenance (O&M) costs for existing alum
stormwater treatment facilities, with treated watershed areas ranging from 64 ac to 1450 ac, is given
in Table 2-13. Construction costs for alum stormwater treatment systems have ranged from
$75,000 to $786,585, depending upon the number of outfalls to be retrofitted and piping
modifications necessary to optimize the system. In general, the capital cost of constructing alum
stormwater treatment systems is independent of the watershed size since the capital cost for
constructing a treatment system for a 100 ac watershed at one location is identical to the cost of
constructing a system to treat 1000 ac at the same location, although annual O&M costs would
increase. The average capital cost for existing alum stormwater treatment facilities is $307,627.
TABLE 2-13
SUMMARY OF CONSTRUCTION AND O&MCOSTS FOR EXISTING ALUM
STORMWATER TREATMENT FACILITIES DESIGNED BY ERD
PROJECT AREA
TREATED
(ac)
CONSTRUCTION
COST/SYSTEM
($)
ESTIMATED
ANNUAL
O&M COST
($)
CONSTRUCTION
COST PER
AREA TREATED
($/ac)
ANNUAL O&M
COST PER
AREA TREATED
($/ac)
Lake Ella 158 200,400 -- 1,268 --
Lake Dot 305 250,000 -- 823 --
Lake Lucerne 272 400,000 16,000 1,472 59
Lake Osceola 153 300,000 13,089 1,959 86
Lake Cannon 490 135,000 16,140 276 33
Channel 2 84 180,000 9,724 2,144 116
Lake Virginia North 64 242,000 11,577 3,769 181
Celebration 158 300,000 25,000 1,898 158
Lake Holden 183 292,000 23,584 1,598 129
Lake Tuskawilla 311 242,000 19,627 777 63
Lake Rowena 538 75,000 14,098 139 26
Lake Mizell 74 300,000 15,389 4,049 208
Lake Maggiore (5) 1450 400,000 21,450 1,379 74
Webster Avenue 91 154,000 12,397 1,692 136
Lake Virginia South 437 323,000 56,015 739 128
Merritt Ridge 195 416,805 26,298 2,137 135
Largo 1159 786,585 38,874 679 34
Clear Lake 63 110,000 8,731 1,746 139
Gore Street 752 600,000 41,276 798 55
Mirror Lake 144 360,000 15,044 2,500 104
Lake Howard 216 247,000 17,482 1,144 81
East Lake 1127 454,000 37,241 403 33
AVERAGES 330 $ 307,627 $ 21,952 $ 1,518 $ 99

Final Report – Chemical Treatment
50
Estimated O&M costs are also provided in Table 2-13 and include chemical, power, manpower for
routine inspections, and equipment renewal and replacement costs. Operation and maintenance
costs for existing alum stormwater treatment systems range from $8,731 to $38,874 per year.
Construction costs and annual O&M costs are also included on a per acre treated basis for
comparison with other stormwater treatment alternatives.
Alum Production and Costs
Aluminum sulfate is currently produced by approximately 15 companies in North America which
include three companies in Canada, 11 companies in the U.S., and one company in Mexico.
Approximately 88% of the total alum production in North America is distributed as a liquid product
(General Chemical, 2008). The largest distributor of liquid alum product in North American is
General Chemical Performance Products, LLC (General Chemical), which contributes
approximately 35% of the North American production. Approximately 20% of the North American
production is contributed by GEO Specialty Chemicals, with the remaining 45% produced by a
variety of smaller distributors.
There are three primary factors which impact the cost of aluminum sulfate:
1. Aluminum – Aluminum is obtained as a processed aluminum tri-hydrate product or as a
bauxite ore. In some cases, recycled aluminum is used as an alternative source. Alum
sources remained relatively stable through the 1980s and 1990s, with demand generally in
line with global production. However, during 2001, demand for aluminum sulfate increased
substantially in Asia along with unplanned decreases in global production capacity. These
factors created a significant increase in aluminum costs and resulted in an overall doubling
of the cost for aluminum sources over the period from 2001-2006. During 2007, the global
aluminum market stabilized, and pricing has been relatively stable over the past 18 months.
This price stability is expected to remain through at least 2010 (General Chemical, 2008).
2. Sulfate – Sulfate used for production of aluminum sulfate is obtained in the form of sulfuric
acid. Sulfuric acid is the world‟s largest commodity chemical and has historically been one
of the most stable resources in the global market. However, during the past year, sulfuric
acid demand has increased beyond global capacity, creating a limited supply in North
America. Acid prices in North America have doubled from 2007 to 2008, and current
indications are that this price escalation will continue until additional production facility
catches up with current demand.
3. Environmental/Transportation Costs: Continued increases in environmental regulation
and transportation costs have also been responsible for increases in the cost of aluminum
sulfate, particularly in recent years. According to General Chemical, maintenance to
existing facilities required by environmental regulations has increased over the past years at
a rate of approximately 15% per year.

Final Report – Chemical Treatment
51
A summary of aluminum sulfate pricing from 1998-2008 is given in Figure 2-17 (General
Chemical, 2008). This trend indicates that the average price of aluminum sulfate has increased
substantially from 2007 to 2008, primarily as a result of increases in the cost of sulfuric acid.
However, it is anticipated that this trend will level off as additional production facilities come on-
line for sulfuric acid in the near future. The current cost of approximately $350/dry ton for
aluminum sulfate is equivalent to a unit cost of approximately $1/gallon, including delivery costs
within a 200-mile radius of the production facility.
Figure 2-17. Aluminum Sulfate Pricing
Pollutant Removal Costs
Alum stormwater treatment has been shown to provide highly competitive mass removal costs
compared with traditional stormwater treatment techniques such as wet detention and wetland
treatment. The smaller land area required for alum treatment, combined with high removal
efficiencies, results in a lower life-cycle cost per mass of pollutant removed. A comparison of life-
cycle costs per mass of pollutant removal for similar large-scale stormwater retrofit projects is given
in Table 2-14. Life-cycle costs are calculated using the initial capital costs and 20 years of
operation and maintenance according to the following equation:
Life Cycle Cost = Capital Cost + 20 x (Annual O&M Cost)
The data summarized in Table 2-14 provide a comparison of life-cycle costs and mass pollutant
removal costs for typical alum treatment and wet detention treatment facilities. Each of these
facilities was designed by ERD, and the projected life-cycle costs and annual mass pollutant
removal efficiencies are based upon actual construction costs and field monitoring activities. The
wet detention systems are designed for water quality treatment only and do not include a flood
attenuation component. Based upon this analysis, the cost per mass removal for total phosphorus
Aluminum Sulfate Price Trend
0
100
200
300
400
1998
1999
2000
2001
2002
2003
2004
2005
2006
2007
2008
Year
Do
llars
To
ns (
X 1
0,0
00)
Average Price
Tons

Final Report – Chemical Treatment
52
TABLE 2-14
COMPARISON OF LIFE-CYCLE COST PER
MASS POLLUTANT REMOVED FOR TYPICAL
STORMWATER RETROFIT PROJECTS*
PROJECT 20-YEAR LIFE
CYCLE COST
($)
COST PER MASS POLLUTANT REMOVED
($/kg)
Total Phosphorus Total Nitrogen TSS
Alum Treatment
Lake Howard 596,359 74 32 2
Largo Regional STF 2,044,780 253 65 4
Lake Maggiore STF 4,086,060 200 71 2
Gore Street Outfall STF 1,825,280 87 12 1
East Lake Outfall TF 1,223,600 135 17 1
LCWA NuRF Facility 34,254,861 198 30 2
Wet Detention
Melburne Blvd. STF 1,069,000 371 125 2
Clear Lake Ponds STF 1,091,600 658 237 2
*Does not consider cost of land purchase
The life-cycle costs summarized in Table 2-14 consider routine maintenance activities such as
chemical and operational costs for the alum systems and perimeter mowing for the wet detention
systems but do not consider the cost of land purchases which may have been required for the
evaluated projects. Land requirements are typically much greater for wet detention facilities than
for alum treatment projects since wet detention ponds are designed for detention times of
approximately 14-100 days while settling basins for alum treatment require detention times ranging
from 3-24 hours. If the cost of land were considered in the mass pollutant costs summarized in
Table 2-14, the differences in mass pollutant removal costs between alum treatment and wet
detention systems would be even greater.
As seen in Table 2-14, phosphorus removal costs using alum treatment range from approximately
$75-250/kg of phosphorus removed over a 20-year life-cycle cost. Nitrogen removal costs range
from approximately $10-70/kg removed, with TSS removal costs ranging from $1-4/kg removed.
Phosphorus removal costs using wet detention range from approximately $370-650/kg of
phosphorus removed, with nitrogen removal costs ranging from $125-250/kg and TSS removal
costs of approximately $2/kg. In terms of nutrient removal, alum appears to be a substantially more
cost-effective method of removing nitrogen and phosphorus than wet detention systems. The mass
pollutant removal cost with alum treatment decreases as the size of the treatment facility increases.

Final Report – Chemical Treatment
53
Comparison with Other Stormwater Treatment Alternatives
A comparison of treatment efficiencies for common stormwater management systems is given in
Table 2-15 (Harper, 1995). Removal efficiencies achieved with alum treatment are similar to
removal efficiencies achieved with dry retention and appear to exceed removal efficiencies which
can be obtained using wet detention, wet detention with filtration, dry detention, or dry detention
with filtration. The removal efficiencies summarized in Table 2-15 assume that the systems are
properly maintained and operated. For the pond systems this includes periodic mowing,
inspections, and trash removal but does not include removal of vegetation from within the ponds.
For the alum systems the efficiencies assume that the system is properly maintained and operated on
a continuous basis.
TABLE 2-15
COMPARISON OF TREATMENT EFFICIENCIES
FOR COMMON STORMWATER MANAGEMENT SYSTEMS
TYPE OF SYSTEM ESTIMATED REMOVAL EFFICIENCIES (%)
TOTAL N TOTAL P TSS BOD
Dry Retention (0.50-inch runoff) 60-80 60-80 60-80 60-80
Wet Detention 20-30 60-70 85 50-60
Dry Detention 10-20 20-40 60-80 30-50
Alum Treatment 40-70 > 90 > 95 60
IMPLEMENTATION ISSUES
What phosphorus concentrations and/or species will respond to chemical treatment cost
effectively?
Phosphorus species in urban and agricultural runoff consist of particulate and dissolved forms.
Particulate forms of phosphorus can be removed easily, even at relatively low alum doses, with
typical removals of 80->95%. However, there is an observed decrease in removal rate for
particulate phosphorus at extremely low particle sizes. Dissolved phosphorus forms consist
primarily of orthophosphorus and dissolved organic phosphorus. Orthophosphorus reacts rapidly
with alum and will preferentially form AlPO4 prior to formation of Al(OH)3. Removal of
orthophosphorus is highly efficient, with typical removals ranging from 90-99%. Higher
concentrations of orthophosphorus will require higher alum doses for complete removal.
However, AlPO4 is a milky floc which settles very slowly and can significantly affect the design
of the floc collection system if orthophosphorus is present in concentrations in excess of 100-200
ppb.
Removal of organic phosphorus is more variable and depends on the composition of the organic
molecules. Many organic phosphorus molecules can be trapped into the alum floc during the
Final Report – Chemical Treatment
54
coagulation process, but the settling process is extremely slow, and the overall capture rate is less
than observed for orthophosphorus, with removals from about 40-70% in most cases. The
efficiency of removal for organic phosphorus can be improved at a higher alum dose, but the
chemical costs may not justify the additional removal achieved. The chemical processes
involved with using iron as a coagulant are virtually identical to alum, and the comments above
can be assumed to apply to iron compounds as well.
What volume or flow rate is logistically feasible for treatment?
The chemical coagulation process is regulated by two processes: (1) the ability to meter and
inject the coagulant, and (2) the ability to collect and manage the generated floc, if required. As
far as chemical metering is concerned, there is virtually no limit, either upper or lower, to the
ability to meter and inject alum or other coagulants. The technology of chemical metering is
well established from the potable and wastewater fields.
The only practical limitation on treatment feasibility is unit cost. The capital costs of
constructing a chemical treatment system are relatively fixed regardless of the flow rate or
volume of water to be treated. The same basic infrastructure is required, although the pump size
and cost may increase slightly at substantially higher flows. Therefore, it is more economical, in
terms of cost per unit of water treated, to construct a chemical treatment system for a very large
flow than for a very small flow. Alum treatment is generally much less expensive per kg of
phosphorus removed than other traditional practices such as wet ponds. However, some level of
flow exists at which the unit costs for alum and other practices become more similar, although
this flow level varies depending on the application.
The most serious restriction on the flow rate for chemical treatment is the ability to collect the
floc which is generated. If floc collection is required, the most common method is the use of a
settling pond. The minimum settling time required for complete removal of floc from the water
column ranges from <3->24 hours, depending on the characteristics of the raw water. Floc
generated from water with a high percentage of particulate phosphorus will settle quickly, while
floc formed from water with an elevated level of orthophosphorus or organic phosphorus will
tend to settle slowly. This is an important parameter to evaluate during the pre-design jar testing
and can have a significant impact on the overall design and the size of the settling pond.
Where in the KOE can chemical treatment be applied?
Chemical treatment, like most other types of runoff treatment systems, is most cost effective
when the systems are placed at the terminal end of the drainage system so the system can treat
flows which are concentrated into a single point of treatment. This concept should be applied to
the Northern Everglades area whether the system is located at the terminal end of a single farm
or a larger tributary.

Final Report – Chemical Treatment
55
What water quality parameters affect chemical treatment phosphorus reduction efficiency?
And Do we have sufficient existing data or is additional data required?
The most significant factor affecting the efficiency of chemical treatment is the characteristics of
the raw water. This issue was addressed previously in this section as well as in the response to
Question 1. In general, phosphorus removal efficiency is best when the raw water consists
primarily of particulate matter and orthophosphorus at concentrations between <100-200 ppb.
At elevated orthophosphorus concentrations, floc settling rates decrease and can dictate the
design of the collection system. Chemical coagulation is less efficient when the concentration of
organic phosphorus is high.
Alkalinity is also an important parameter, since chemical coagulation with alum results in a
reduction in pH which is mitigated by the available alkalinity. If the alkalinity of the raw water
is insufficient to prevent an undesirable reduction in pH, then alternative coagulants or pH
buffering compounds can also be added. The addition of NaOH or similar base can substantially
enhance the rate of formation and settling of the generated floc.
A significant amounts of data are available concerning the impacts of raw water characteristics
on coagulation efficiency. A basic summary has been provided above. However, data are not
available to define specific concentrations at which the issues discussed above begin to become
concerns. Other water quality parameters are also involved, and it would take a significant
research effort to document all possible combinations of characteristics. Since a site specific
series of tests would be conducted for any potential application, it does not seem worthwhile to
address the issue in general when more site specific testing will be conducted.
What water quality standards must be met for chemically treated discharges to various
receiving waters?
At a minimum, chemically treated discharges must meet the numerical and narrative standards
outlined in Ch. 62-302 FAC for the applicable surface water classification. Discharges within
the Lake Okeechobee basin would be classified as Class III waters. Extensive previous testing
has indicated that alum treated water easily meets virtually all Class III water quality criteria.
Since alum consumes alkalinity and has a potential to reduce water column pH, the most
significant numerical water quality standards for alum treated discharges are pH and alkalinity.
For freshwater receiving waters the pH must be ≥ 6, while the alkalinity must be >20 mg/l.
There is no numerical standard for aluminum in fresh waters. Dissolved aluminum
concentrations in alum treated waters are generally less than the aluminum concentration in the
raw water due to the readjustment of the pH into the range of minimum solubility for aluminum.
Narrative standards address the stimulatory or toxicity characteristics of the treated waters.
Alum treated runoff has been shown to be neither stimulatory nor toxic (Harper, 1990).
The District has questioned the “marsh readiness” of alum treated water, suggesting that the
coagulation process may be too efficient and remove ions which are necessary for marsh growth.
Alum treatment has virtually no impact on Group I or II elements such as sodium, potassium,
calcium or magnesium. Although alum treatment is also effective for removal of other metals

Final Report – Chemical Treatment
56
such as copper and zinc, it is unlikely that coagulation of ionic rich agricultural water will reduce
concentrations to levels below the needs of aquatic organisms or vegetation.
What is the best aerial economy of scale for treatment system implementation?
As discussed in previous responses, the capital costs of a chemical coagulation system are
largely independent of the size of the watershed which is treated since any system will require
the same basic components such as a flow meter, alum pumps, storage tank, etc. Therefore, the
costs/kg phosphorus removed decrease as the size of the treated area increases. It is most cost
effective to locate the treatment system at the most downstream portion of the parcel or basin
area.
Can the chemical treatment be permitted?
Chemical treatment has become a common tool in the retrofit toolbox throughout the State of
Florida. Alum treatment systems have been permitted by each of the 5 water management
districts as well as FDEP. FDEP often requires that chemical treatment be used in federally
funded retrofit projects due to the low unit removal cost compared with other common
techniques. Currently, chemical treatment can be permitted for virtually any retrofit opportunity.
Under current directives, which may be subject to change as the Statewide Stormwater Rule
develops, the only limitation on chemical treatment is that the floc must be collected. Exceptions
to this policy have been made in cases where the water body is eutrophic, and a study has been
conducted to demonstrate that the sediments are a source of nutrient recycling and that
introduction of floc into the receiving water will result in a net improvement in water quality.
The vast majority of existing alum stormwater treatment systems has been constructed as retrofit
projects for existing developed or agricultural areas with only a handful of systems designed for
new development.
What are the monitoring requirements of planned solutions?
Early chemical treatment systems were monitored extensively to obtain information on the
efficiency and impacts of this technology. However, more recent systems have been assigned
substantially reduced monitoring requirements, if any at all. Most of the current systems require
only monitoring for pH with an automatic shut-off required as part of the design in the event that
pH levels drop below the applicable standard. The performance of alum coagulation systems has
been documented to the point that FDEP often does not require efficiency monitoring for alum
retrofit projects. However, regardless of permit required monitoring, the owner should conduct
routine monitoring to make sure that the water quality objectives of the treatment process are
being met.
What are the cost-benefits of planned solutions?
Alum coagulation has consistently been shown to have a phosphorus removal cost which is much
lower than other more traditional projects. As discussed in a previous section, the phosphorus

Final Report – Chemical Treatment
57
removal cost for alum coagulation is typically in the range of $75-250/kg phosphorus removed
over a 20-year life-cycle compared with $400-650 for traditional BMPs such as wet detention.
In general, the pollutant removal cost of alum treatment decreases as the amount of water treated
increases. If floc collection is not required, alum treatment costs are less than $100/kg
phosphorus removed. However, treatment costs can be variable depending on the configuration
of the treatment system. Alum chemical costs have been very stable historically with a price
escalation similar to inflation. However, recent world demand for sulfuric acid has resulted in a
temporary rapid price increase in recent years.
What factors affect settling and residuals management?
Factors affecting settling of alum floc have been addressed in previous responses. The floc
generation rate for alum coagulation has been well established, ranging from 0.16% of the
treated flow at an alum dose of 5 mg Al/liter to 0.25% at a dose of 10 mg/liter. The most
common method of collecting the floc has been a settling pond. The design of the settling pond
is based on the results of the pre-design laboratory jar testing which provides information on the
required detention time. The design volume is the volume required to provide the minimum
detention time at the maximum anticipated flow rate, generally in the range of 3-24 hours, plus
an additional volume for dedicated floc storage. If the floc is to be stored for extended periods in
a wet pond environment, then alum coagulation is preferable to iron since iron becomes reduced
at low redox potentials, and the bound phosphorus is released from the floc. Therefore, iron
should never be used as a coagulant when the floc is not immediately collected and dewatered.
What are cost effective options for residual management?
ERD has conducted extensive lab testing on the physical and chemical characteristics of alum
floc generated as a result of alum coagulation of a wide range of raw water characteristics,
including heavy metals and toxicity leaching experiments. ERD has also conducted FDEP
funded experiments to evaluate the stability of coagulated pollutants inside the floc matrix.
Virtually every test has confirmed that the generated floc is extremely stable with virtually no
potential for release of pollutants under a wide range of pH values and redox potentials. The floc
characteristics easily meet the clean soil criteria and can be used on a wide range of applications. The dried floc still has considerable phosphorus adsorption potential, and the St. Johns River Water Management District (SJRWMD) uses large quantities of dried residual from potable water plants as a soil amendment in the Lake Apopka muck farm areas to inhibit phosphorus release from flooded soils on former agricultural plots. Recent alum treatment system designs provide for floc removal using either an automatic sump collection system or a portable dredge unit. Some of the automatic systems discharge the floc to the sanitary sewer system at a controlled rate, typically ranging from 300-500 gpm, during non-peak hours. Dredged floc can be placed on a drying bed to de-water, which usually occurs in about 30 days. The Lake County NuRF system uses a centrifuge to de-water the solids which are then stored on a drying/storage area.

Final Report – Chemical Treatment
58
What chemicals should be evaluated? Based on existing research and experience, aluminum based coagulants have several advantages over other potential coagulants such as iron or calcium. Aluminum is stable under a wide range of pH values and redox potentials, which makes aluminum the coagulant of choice for systems where the floc is to be stored in a wet environment. Aluminum coagulants are available in a variety of compounds such as aluminum sulfate (alum), aluminum chloride, poly-aluminum compounds, and alum/polymer blends to enhance floc settling and to meet various pH buffering requirements. Iron should only be considered in systems where the floc is collected immediately or can be stored in an aerobic environment. Iron coagulation also occurs at a higher pH level than alum which may not be suitable in some waters. Like alum, calcium compounds are also relatively stable, but coagulation only occurs at pH levels in excess of 10-11. The use of calcium would add an additional pH neutralization step to the process which would increase both capital and operational costs. Calcium compounds are only available as a slurry which must be stirred continuously to prevent separation, adding additional costs and equipment.
SUMMARY A number of inorganic salts of calcium, iron, and aluminum are sold commercially for coagulation purposes. Aluminum salts are used extensively for clarification of drinking water originating from surface water sources, while lime is commonly used for treatment of drinking water which originates as a groundwater source. Iron compounds are used predominantly in treatment of domestic and industrial wastewaters. Both aluminum and iron compounds are used for phosphorus removal in a variety of processes. When aluminum and iron coagulants are added to water, metal hydrous oxide precipitates are formed which remove suspended solids, algae, phosphorus, heavy metals, and bacteria by enmeshment and adsorption onto the hydroxide precipitate. In addition, in the presence of high levels of orthophosphorus, both aluminum and iron can form insoluble metal phosphate precipitates. The minimum solubility of Al(OH)3 and Fe(OH)3 precipitates are relatively similar at approximately 10
-10 M. However, the area of minimum solubility for Al(OH)3 occurs in pH
range of approximately 5.5-6.5, while the minimum solubility for Fe(OH)3 occurs in pH range of approximately 8-10. The minimum solubility for calcium hydroxides and phosphates occurs in the pH range of approximately 10-12 which minimizes the usefulness of calcium as a precipitant in some cases. Aluminum compounds are more suitable for coagulation processes under near-neutral pH conditions, while iron compounds are more suited to alkaline environments. Aluminum and calcium do not exhibit alternative oxidation states in the natural environment, and both aluminum and calcium compounds are immune to changes in redox potential within the collected floc. Compounds adsorbed onto aluminum or calcium floc are equally stable under aerobic or anoxic conditions. However, iron compounds exhibit several electron configurations. Under oxidized conditions, iron exists as ferric compounds which are highly insoluble. These insoluble ferric compounds may be converted into a highly soluble ferrous form under reduced conditions. Any contaminants which had been adsorbed onto the iron floc will be released as the floc dissolves under the reduced conditions. Therefore, iron compounds should only be used for coagulation in processes where aerobic conditions can be assured at all times.

Final Report – Chemical Treatment
59
The concept of using chemical coagulants for treatment of stormwater and tributary inflows originated during the mid-1980s. Based on the results of literally hundreds of laboratory flocculation jar tests, alum treatment of stormwater runoff has consistently achieved an 85-95% reduction in total phosphorus, 20-70% reduction in total nitrogen, 95-99% reduction in turbidity and TSS, and 96-99% reduction in fecal coliform bacteria. More than 60 alum stormwater treatment systems have been designed and are operational within the State of Florida for a wide variety of urban and agricultural applications. Alum stormwater treatment systems permitted prior to 1998 generally discharge floc directly into the receiving water, while systems permitted after 1998 provide mechanisms for collection and removal of the generated floc. One of the most common methods of disposal of floc is discharge into adjacent sanitary sewer systems. Alum stormwater treatment has resulted in significant improvements in water quality for virtually all waterbodies impacted by the treatment process. The degree of observed improvement in water quality is directly related to the percentage of annual hydraulic inputs treated by the alum stormwater treatment system. ERD has also evaluated alum for use in reducing nutrient concentrations in agricultural runoff and designed, constructed, and operated a pilot-scale system designed to treat the discharge for a 30,000 gpm electric pump which pumps accumulated water from muck farming areas into Lake Apopka. Laboratory investigations have been conducted on stormwater runoff collected from a wide range of land uses typical of urban areas to quantify the amount of alum floc generated by alum treatment of stormwater at various doses. As a result, sludge production rates for alum treated waters are well known. After initial formation, alum floc begins aging processes during which a series of crystalline structures are formed and become increasingly more stable as the crystalline structure increases. After approximately 30-90 days, the alum floc forms into mineral gibbsite and is virtually inert under any conceivable condition of pH or redox potential which could occur in a natural waterbody. Dried alum residual from treatment processes has been evaluated by ERD and found to easily meet clean soil criteria for use in virtually any fill application. In general, the capital cost of constructing an alum stormwater treatment system is independent of the watershed size since the same basic equipment is necessary to treat flows originating from a 100-acre or 1000-acre drainage basin. However, annual O&M costs would obviously increase with larger watershed sizes due to the additional alum consumption. Pollutant removal costs in terms of dollars/kg of phosphorus removed over a 20-year life-cycle are substantially lower for alum treatment systems than for other traditional BMPs such as wet detention. Alum appears to be a more cost-effective method of removing both nitrogen and phosphorus than wet detention systems. Mass removal efficiencies achieved with alum treatment are similar to removal efficiencies observed for dry retention and exceed removal efficiencies which can be obtained using wet detention.
Alum appears to have a number of advantages over both iron and calcium as a coagulant for
phosphorus reduction. Although the chemistry of aluminum and iron compounds are relatively
similar, aluminum coagulation occurs in a neutral pH environment, while iron precipitation
occurs under more alkaline conditions. Iron is also extremely unstable in a reduced environment,
and the collected floc must be stored in an aerobic environment at all times. Like alum, calcium
compounds are also relatively stable, but coagulation only occurs at pH levels in excess of 10-11,
requiring a supplemental pH neutralization step. Calcium compounds also are available
primarily in a slurry form which must be stirred continuously to prevent separation.

Final Report – Chemical Treatment
60
REFERENCES
Baker, M.N. (1981). “The Quest for Pure Water.” AWWA, Denver, CO.
Brezonik, P.L. (1984). "Trophic State Indices: Rationale for Multivariate Approaches."
In Lake and Reservoir Management, pp. 427-430, EPA-440/5-84-001.
Cooke, G.D., and Kennedy, R.H. (1981). Precipitation and Inactivation of Phosphorus as a
Lake Restoration Technique. EPA-600/3-81-012.
Faust, S.D., and Aly, O.M. (1998). “Removal of Particulate Matter by Coagulation.” In
Chemistry of Water Treatment, 2nd
Ed. Ann Arbor Press, Inc.: Chelsea, Michigan.
Garrison, P.J., and Knauer, D.J. (1984). "Long-Term Evaluation of Three Alum Treated Lakes."
In Lake and Reservoir Management, pp. 513-517. EPA-440/5-84-001.
Harper, H.H. (1987). “Feasibility of Alum Treatment for Nutrient Reductions in Surface Water
Discharges.” Presented to the Lake County Board of County Commissioners/Lake
County Pollution Control Board.
Harper, H.H. (December 1990). "Long-Term Performance Evaluation of the Alum
Stormwater Treatment System at Lake Ella, Florida." FDEP, Project WM339.
Harper, H.H. (October 1995). "Pollutant Removal Efficiencies for Typical Stormwater
Management Systems in Florida." In Proceedings of the 4th Biennial Stormwater
Research Conference (Sponsored by the Southwest Florida Water Management District),
pp. 6-17, Clearwater, FL.
Harper, H.H.; Herr, J.L.; and Livingston, E.H. (1998). "Alum Treatment of Stormwater: The
First Ten Years." New Applications in Modeling Urban Water Systems - Monograph 7 -
Proceedings of the Conference on Stormwater and Related Modeling: Management and
Impacts, Toronto, Canada, February 19-20.
Jernelov, A. (1970). Phosphate Reduction in Lakes by Precipitation with Aluminum
Sulfate. 5th
International Water Pollution Research Conference. New York: Pergamon
Lind, C.B. (December 1997). “Phosphorus Inactivation – Chemical Precipitants and Strategies.”
Presented at the 17th
International Symposium of the North American Lake Management
Society (NALMS), Houston, Texas.
Snoeyink, V.L., and Jenkins, D. (1980). Water Chemistry. John Wiley and Sons: New York.
Stumm, W., and Morgan, J.J. (1981). Aquatic Chemistry: An Introduction Emphasizing
Chemical Equilibria in Natural Waters, 2nd
Ed. John Wiley and Sons: New York.
WATER/Engineering and Management. (Feb 1998).

Final Report – Chemical Treatment
61
CHAPTER III POLYMER ENHANCED BEST MANAGEMENT
PRACTICES FOR PHOSPHORUS CONTROL
INTRODUCTION
Phosphorus loads entering into Florida waters have continued to cause water quality issues
throughout the state. Phosphorus from fertilizers, manures, crop runoff and release from
vegetation degradation continue to increase from both commercial and residential sources. The
lack of phosphorus absorbing soils, shallow water tables and excessive rainwater runoff can flush
excessive phosphorus into waterways creating elevated nutrient loads causing eutrophic
conditions causing algal blooms and surface water quality degradation. One potential solution is
to use polymer enhanced best management practices (PEBMPs). One option is to use a water
treatment polyacrylamide (PAM) with no other chemical to retain phosphorus. A second option
is to utilize the flocculation potential of PAM polymers with a coagulant to enhance the
coagulant and settling characteristics.
PAM polymers are used every day around the world for water treatment, sludge processing,
erosion and stormwater control, food and juice processing, mineral processing, food additives
and oil well production. Water treatment versions of these PAM (NSF 60) in the anionic form
have shown very low aquatic toxicity potential to the environment and have been placed in
nearly every BMP manual within the country. Cationic PAMs have better binding potential
directly to clay surfaces but compared to anionic forms do exhibit high toxicity potential to
aquatic organisms. Cationic PAM, chitosan and cationic polymers should be tested for toxicity
and are usually prohibited from use within stormwater and erosion BMPs.
The diversity of multi-industrial use of anionic PAM polymers is insightful. Anionic PAM can
adsorb metal ions, both ferrous and non-ferrous via electrostatic interaction and chelation.
Particulate settling via flocculation after coagulation and particulate binding are standard
practices in many industries. Although PAM reactions are temporary due to the environmental
biodegradation of the PAM molecule, the combination of the application of PEBMPs with other
binding materials may result in long term binding of phosphorus. Anionic PAM production
facilities have increased worldwide over the last decade resulting in readily available products as
emerging industrial countries have increased their demand.
DESCRIPTION OF TECHNOLOGY
Polymer Enhanced BMPs are becoming more acceptable when water quality is an issue.
Standard BMPs used in stormwater and erosion control alone cannot address the lower
requirements associated with TMDL reduction. By definition a PEBMP is the use of any BMP
tool, with the addition of polymer, used to capture or retain soil particulate, fines, turbidity,
chemical contaminants and thus enhances the BMP performance and water quality. PAM
polymers are specific to the lithology targeted and must be tested before application. Improper
application or incorrect PAM material can result in poor binding of the target material and
unfavorable water quality. Nearly all industries that use PAM polymers have a testing procedure

Final Report – Chemical Treatment
62
in place. Only the erosion control industry markets “PAM” as a one product fits all approach,
and this technique has resulted in as many failures as successes.
All PAMs have the ability to attach to soil surfaces, some much better than others, but all PAMs
will not address water quality, organic nutrient loads and other chemical contaminants. PAM
polymers are temporary control measures when applied to soil or water lasting only a few
months when exposed to sunlight and bacteria which causes photo and biodegradation. The
addition of gypsum, lime, water treatment residuals, aluminum sulfate, and other materials may
be required. The use of high surface area fabrics, erosion control waddles, matting and filter
strips can greatly increase phosphorus holding and binding, whether applied at the source or as
an intercept BMP used to filter water after and during the PAM reaction within flowing water.
Use of PAM for the reduction of Phosphorus from water
PAM polymer at low concentrations is a very effective flocculant for binding of fine particulate
and the formation of floc. The presence of mass within the water column is essential for the
binding to occur even though the polymer can and does directly attach to ions having opposite
electrostatic charge. Polyacrylamide can bind with electrostatic charges basically the same as
ion resin exchange beads. The order of binding follows the zeta potential or electrostatic double
layer potential of strength of the ions present. This means that the greater the electrostatic charge
the first order of binding will occur. Iron will bind to a PAM molecule before aluminum, which
will bind before zinc, which will bind before magnesium. Flocculation is much more effective in
dirty water rather than clean water. Water treatment plants that need to remove specific metals,
nutrients or materials from very clean water are required to “seed” the water column to produce
sufficient mass to aid the settling process. Light flocs are sometimes addressed using clarifiers to
“attach” the fine floc to a surface to enhance removal from the water column. Dissolved metals
and nutrients may be chemically attached to the polyacrylamide molecule increasing mass for
settling.
The use of a PAM polymer for dissolved phosphorus removal from water is not effective without
the use of clarifiers or seeding systems (Salton Sea Rpt., 2005). PAM polymer added to water
can reduce total phosphorus when phosphorus exists as the organic particulate material or soil
particulate form by standard flocculation processes. Increasing particulate mass within the water
flow greatly increases the potential for phosphorus removal. Efficiencies of total phosphorus and
ortho-phosphate removal for agricultural fields have been reported to be greater than 92% when
mass and particulate matter are present within the water flow (Entry, 2003). PAM polymer
treatment of aqua-cultural effluents containing TSS as low as 10 to 17 mg/l have shown TSS
reductions of 99% and 92 to 95% reductions of soluble reactive phosphorus (SRP) (Bragg,
2003). Thus, the most effective method for using polyacrylamide PAM for phosphorus removal
from water appears to require the effluent have some amounts of TSS present. Not all
phosphorus laden waters are likely to have sufficient TSS.
Treating relatively clean water containing phosphorus requires a different method. The use of a
coagulant to destabilize the electrostatic charge and bind the phosphorus before adding the PAM
may be required. The coagulant of choice in Florida is aluminum sulfate (alum). Other
coagulants are currently being researched that do not have potential negative effects to plant

Final Report – Chemical Treatment
63
growth that aluminum may exhibit (Bragg, 2003). Alum has been used for many years world
wide as a primary water treatment chemical. There are many difficulties using alum alone as it
can depress pH causing toxic conditions for fish. Alum floc formed after reaction may settle
very slowly and may travel great distances through a water course when water velocities are high
(Salton Sea Report, 2005). Alum floc may also form layers through a water column in deeper
ponds or lakes and may not settle or be easily re-suspended if significant water agitation occurs.
Alum + PAM studies performed on California farmland feeding into the Salton Sea having high
water velocities were highly effective at 93% in soluble phosphorus reduction (Salton Sea
Report, 2005). Alum treatment alone resulted in significant floc travel through the ditch systems
with alum floc ending up in the Salton Sea even though the alum was effective in binding
virtually all of the phosphorus. The method of chemical addition was by injection systems that
fed the alum and PAM into the water stream from stock solutions. These active methods of
chemical addition are quite costly in comparison to passive methods. The estimated cost to treat
the three tributaries that feed to the Salton Sea was estimated to be 44 million dollars per year.
The estimated cost to treat the Imperial and Coachella Valley‟s at the source with land applied
PAM methods was estimated to be 11-18 million dollars per year. It was also noted that the land
applied PAM would greatly reduce the sediment loads to receiving waters thus further reducing
maintenance costs (Salton Sea Report, 2005).
Passive water treatment systems using log or block forms containing PAM have also shown high
phosphorus reductions. Pam logs are mixtures of PAM + coagulants that require no power
sources or mechanical apparatus, and are simply placed in flowing water. As water flows over
the surface of the block or log the device dissolves at a constant rate liberating the dosage into
the contaminated water flow. Adequate mixing with the water flow is required and the flow of
water must be in contact with the block or log. These systems have shown approximately 90%
phosphorus reduction used in water flows at Reedy Creek Water Management District (RCID
Data, 2009).
Phosphorus retention and reduction at the source
Land applied PAM has been extensively studied and has been in practice since World War II.
(Sojka, 1997). Most research for land application of PAM polymers has been done in agriculture.
Extensive data show very high effectiveness for soil stabilization, nutrient retention and
reduction of sediment loss (Green, et. al, 2001 ). Land applications of PAM based polymers are
uncomplicated. One simply applies a PAM liquid either by spraying or irrigation or applies
granular powder to the soil surface by spreading methods. The PAM binds to the soils by
physical attachment, bridging mechanisms through dielectric soil ions or direct ionic attachment
to opposite charged particles. The length of the PAM molecule and the electrostatic charge
generally determine what type of PAM will best bind or attach to any specific lithology or soil
type (Green and Stott, 2000). This specifically means that there are different PAM polymers that
need to be selected for different soils; one PAM does not work on all soils. Some PAM
polymers can greatly out-perform other PAMs on specific soil types to the extent that some do
not work at all (Bartholomew, 2003). This fact in itself has not been very well understood and
most sales of PAM polymers are simply completed as a “one shoe fits all” under the title
“PAM”. This has led to poor field results on many applications when the incorrect PAM is

Final Report – Chemical Treatment
64
placed on the wrong soil type. None the less, even when the wrong materials are used the results
are still usually better then not using any PAM at all so the technology has moved forward.
Typical phosphorus reductions in tail water from agricultural fields are around 80% and depend
on water velocity, soil type, SAR values etc., but all systems studied have shown reductions in
comparison to not using PAM (Stieber, 1996). Conservation practice standards and agricultural
TMDL plans are in place across the country and are used as guidelines for standard PAM
applications. In the last few years construction practices using PAM have become commonplace
where Erosion & Sediment Control (E&SC) laws are enforced.
BMP enhancement using PAM has led to better performances than using PAM alone. Soil
berms that incorporate the use of PAM have shown greater retention of sediment on a site with a
99% turbidity reduction in tail water (Blanco, et. el., 2004). The use of artificial berms or
“waddles” that incorporate PAM that are easily installed and maintained have shown greater
than 92% sediment reduction relating to a threefold increase in performance (Faucette, 2006).
Land applications using the addition of calcium oxide and /or alum with PAM have shown the
best reduction of nutrients from animal waste having as much as a 1000 fold decrease (Entry,
2003). Other studies using alum and calcium oxide mixed with PAM polymer have shown
significant reduction of pesticides and bacteria along with nutrient and turbidity reductions
(Entry, 2002).
APPLICATIONS AND SUCCESS STORIES
Reducing Eutrophic Conditions of the Salton Sea Case Study
The ability of polymer enhancement to reduce the phosphorus levels has been demonstrated in
the Salton Sea project carried out by the state of California. Whenever a water body exists that is
inundated with high levels of phosphorus either from runoff waters or from the tributaries that
feed the system it can be expected that a highly eutrophic environment will arise. This is the
case in the Salton Sea. The Salton Sea has experienced all of the typical impacts of high
phosphorus loading into the water body including: high algal biomass, low fish productivity, low
clarity, frequent very low dissolved oxygen concentrations, massive fish kills, and noxious odors
(California Regional Water Quality Control Board, 2005). The study focused on finding the
most efficient way to remove the phosphorus and included jar testing (Figure 3-1) as well as
combating the sediment load that was introduced into the sea by agricultural drainage water
(ADW). Figures 3-2 and 3-3 illustrate some of the site conditions.

Final Report – Chemical Treatment
65
Figure 3-1 Phipps and Bird PB-700 jar test system
Bench scale (jar testing) revealed that alum alone can flocculate the sediment out of solution
however the flocculated particulate was so small and light that a very slow moving system was
required to settle the particulate. Polyacrylamide (PAM) on the other hand easily flocculated the
sediment into large particulate that settled at a much faster rate than alum alone. Together the
PAM and alum create large, fast settling particulate that were easily collected in a settling basin.
Figure 3-2 Treatment ditch lining to prevent soil contamination
Testing for the reduction of phosphorus revealed similar results as in the turbidity testing. Alum
does effectively adsorb the dissolved phosphorus, but the flocculation was poor and required
near still conditions for the material to settle out. PAM alone was unable to remove the
solubilized phosphorus but was able to remove the particulate phosphorus very effectively. The
alum and the PAM together were able to capture and flocculation both the solubilized and
particulate forms of phosphorus from the water body creating a system that has phosphorus
levels were reduced by more than 95%.

Final Report – Chemical Treatment
66
Figure 3-3 Alum and Polymer dosing system
SolarBee/PAM Floc Log Test at Hilaman Park Golf Course
A solar powered aeration unit in conjunction with PAM was used to demonstrate water quality
improvement in a lake (Figure 3-4). A three phase monitoring program was implemented.
Phase 1. Background monitoring to determine existing water quality (April-May)
Phase 2. SolarBee operational monitoring (June-July)
Phase 3. SolarBee plus PAM operational monitoring (Aug-Sept)
The Solar aeration unit was operated from June to October when phosphorus levels fluctuated
between 0.11 mg/l to 0.26 mg/l and turbidity values fluctuated between 10 and 26 NTU.
Periodic rain events very likely were responsible for nutrient and soil particulate entering the
water from the golf course and residual units adjacent to the Lake resulting in the fluctuations in
NTU and phosphorus values.
Figure 3-4 SolarBee installed in Hilaman Lake

Final Report – Chemical Treatment
67
Figure 3-5 SolarBee system showing Floc Logs attach
In October the Floc Logs were installed to the outer ring of the aeration unit (see Figure 3-5).
Although the flow of water from the aeration unit is slow there was enough flow to slowly
dissolve the Floc Logs and liberate the chemical treatment into the lake. Within two week of
mixing the phosphorus levels dropped to 0.062 mg/l and NTU values fell to 2.9mg/l. The last
samples were drawn in December and phosphorus values had further decreased to 0.043 mg/l.
The trend is very encouraging for an aeration system with PAM to reduce nutrient values in a
lake environment.
IMPLEMENTAION ISSUES
What P concentrations and/or species will respond to PAM based enhanced treatment and
what are the costs?
Total phosphorus and ortho-phosphate concentration are readily reduced when polymer
enhancement is applied to agricultural fields (Bjorneberg, 2005). Typical P concentrations from
agricultural fields are less that 3mg/l. Costs for land polymer applications vary greatly based on
P loading, lithology and rain event cycles. Application rates are typically from 4.5 kilograms (10
pounds )/acre to 23 kilograms (50 pounds)/acre in Florida with PAM product costs averaging
$17.60/kilogram. Whether the enhancement is applied to the soil directly or the application is
used in combination with filter strips or other collection BMPs, the performance results are very
consistent at 80-95+% reduction in P concentration (Stieber, 1996). The variations of
performance of these applications are likely due to the use of PAMs that are used generically.
Pre-tested polymers having the correct affinity for a specific soil lithology have shown upward to
99% sediment reduction from runoff water (Blonco, et. el., 2004). A large volume of the
research for agriculture has been done for soil retention and not for water quality in itself.

Final Report – Chemical Treatment
68
Erosion forces resulting in soil loss results in elevated P by the nature of the phosphorus being
attached to the soil particles. PAM that may not correctly react to the soil due to incorrect charge
density, molecular weight or absence of a required soil amendment can result in greater
phosphorus discharge and reduced effectiveness.
Once the phosphorus enters a water course, the chemistry and particulates change and PAM by
itself works poorly for P binding (Salton Sea Rpt., 2005). Phosphorus concentrations are
generally lower from agricultural field discharges when ponds are present, although elevated
concentrations can come directly from manures and animal farms (Entry et. el., 2002). The
addition of alum coagulates; gypsum or lime is usually required to destabilize the electrostatic
charge of the colloidal or suspended particles with the phosphorus, which is similar to what is
used in water treatment plants. The coagulant concentration needs to be determined by jar
testing and will vary in proportion to the P concentration. Once the electrostatic charge has been
destabilized, a PAM polymer specific for the target particle, after the coagulate reaction occurs,
may be used to rapidly settle the solids. PAM blocks, or Floc Logs may be used in place of the
two step process, as they contain the various forms of coagulate required to perform the complete
function. In all cases, mixing of the water column with the chemicals is required to achieve the
desired results.
What volume or flow rate is logistically feasible for treatment?
Lower flow rates are the norm for in-situ water treatment systems typically being < 500 gpm.
Larger flow rates can be treated but mixing and settling times become an issue with greater water
velocities. Treatment of larger flows may be dispersed into sheet flows and filtered through
constructed polymer enhanced filter berms, filter strips and modified silts fences when installed
to treat the discharge from the source. Data suggests that when using alum alone the use of
ponds or basins are required when treating larger flows due to resistance to alum floc settling.
Retention and settling times are much longer when alum is used alone (Salton Sea Rpt., 2005).
Alum treatment without polymer flocculent reaction of larger water bodies may result in
stratification or settlement layers within the water column.
Where in KOE planned features can chemical treatment be applied?
PEBMPs work best when applied closest to the source. For water treatment using alum + PAM
higher water turbidity enhances the P removal by the creation of heavier floc which results in a
more rapid settling. Studies have shown that treating low turbidity water containing P results in
reduced efficiency for P reduction along with difficulty of floc retention. Floc movement has
been shown to travel significant distances when treatment applications are installed in higher
water velocities (Salto Sea Rpt., 2005). The use of baffle panels and particulate collection
systems has been reported to enhance collection of lighter floc materials.
At the source, land applications of PAM alone may reduce ortho-P and total-P runoff water up to
92% when applied as a soil stabilizer (Entry, 2002). There is a large body of evidence that PAM
applied to soil may be the least expensive method for reducing phosphorus releases into runoff
water (Blonco, 2004). The typical $15 to $35/acre costs for using PAM are partially or entirely
retrieved by savings in erosion-related field operations, improving infiltration, water
conservation, or crop responses (Sojka, 1997).

Final Report – Chemical Treatment
69
Data suggests runoff water from the source may be treated with PEBMP filter strips reducing the
initial P load to runoff water thus reducing treatment costs. Actual performances of PEBMPs
have shown mixed results suggesting that the different types of fabrications and installations of
PEBMPs may be significant.
Block or log forms of PAM have shown 75-85% P reduction when installed in ponds or basins.
Mixing potential of block or log PAMs with the water has been shown to be essential for
adequate reaction and desired results. Limited data is available for this type of application and
may require further study.
Water quality parameters affect chemical treatment P reduction efficiency? Do we have
sufficient existing data or is additional data required?
Water quality parameters that affect the use of polymers are pH, alkalinity and TSS. Low TSS
values and turbidity greatly reduce the ability of polymer treatments to produce floc that has
sufficient mass to settle. Many polymers that are used in water treatment do not work well in
varying pH conditions and floc produced can vary in mass and settling characteristics. Dissolved
CaCo3 has an affinity for polyacrylamide based polymers resulting in calcium binding and
attachment to the surface of block and log polymer forms. This can reduce solubility and dosage
resulting in poor performance of reaction and reduction of floc formation (Sojka, 1997).
Existing methods of jar testing and index testing currently being developed at UCF can identify
the requirements for correct polymer selection. Accurate water-polymer testing will be essential
for correct performance when using this form of chemical treatment.
What water quality standards must be met for chemically treated discharges to various
receiving waters?
Chapter 62-302 states that for all classes of water bodies the turbidity, measured in
nephelometric turbidity units (NTU), must be less than equal to 29 NTU above natural
background conditions. This requirement can be met using polymer and/or polymer coagulant
treatment systems. Lower NTU values are obtainable if required although cost may become an
issue to obtain very low values. Phosphorus values discharged into stormwater at or near the
source will have direct correlation with TSS and elevated NTU similar as seen in agricultural
studies. Polymer treatment systems have shown significant P reduction when treating soils at the
source (Sojka, 1997).
The EPA under a proposed rule is currently proposing 13 NTU for stormwater discharges and
50-100 NTU for construction sites. Data suggests that polymer application may be required to
obtain these proposed discharge limits. Request for comments to this rule are open through
February 2009 listed under Docket ID No. EPA-HQ-OW-2008-0465. If adapted, this may affect
current effluent discharge requirements.

Final Report – Chemical Treatment
70
What is the best aerial economy of scale for treatment system implementation?
Polymer treatment systems can readily be implemented into existing BMP devices and systems
using only slight modifications. Land polymer applications and passive water treatment systems
close to higher sources of TP concentrations will likely be most effective both from a cost
prospective and TP reduction to riparian waters.
Can the use of chemical treatment be permitted?
Anionic PAM materials are currently in use in Florida and have been permitted by Florida
Department of Environmental Protection. There is a NRCS standard for the land application of
PAM use on agricultural land and also a NRCS standard for construction site PAM application.
Both standards are listed under “polyacrylamide use for erosion control code 450” (NRCS
Standard, 2003). Florida DOT Reviewer and Design manual also contains a section on polymer
enhanced BMP use. EPA may likely adopt a new proposed rule suggesting use of PAM base
anionic polyacrylamide for compliance of water quality discharges from stormwater and
construction sites in 2009.
What are the monitoring requirements of planned solutions?
Other than monitoring P concentrations within water discharges, polymer treatment usage may
likely further reduce current TSS and NTU values currently seen within stormwater discharges.
Polymer treatment applications have routinely shown significant sediment reduction which
continues to be an issue in Florida. Pollutants other than P coupled with fine sediment found
within inflow waters may be reduced from discharge waters as seen with agricultural polymer
applications. Current methods for monitoring of NTU values can be used when applying
polymer treatment methods.
What are the cost-benefits of planned solutions?
The primary benefit of polymer treatment applications would be the increased volume of nutrient
removal into the inflow waters when using land applications. This would likely have a
significant cost reduction on all other treatment systems downstream as reduced nutrient values
would require less to treat (Sojka, 1997). Efficiency of wetlands, ponds and other methods
designed for nutrient removal will likely show increased performance and less maintenance due
to mass reduction entering into these systems. If source treatment using polymers are employed
and nutrient “polishing” is effective using other nutrient BMPs and combinations within a
treatment train the result may well show that any further treatment within the everglades may not
be required.
The use of water applied polymer systems whether used as active injection systems or passive
block or log forms will increase the effectiveness of the “polishing” BMPs downstream. The
polymer-P floc produced may be used as a food source for vegetation within ponds and wetlands.

Final Report – Chemical Treatment
71
Polyacrylamide based polymer has been shown to biodegrade and act as a food source for
vegetation while leaving only a carbon skeleton. As the P is released over time from the polymer
it will be consumed by the vegetation. Following polymer land applications reduced P will
likely be much easier for the “polishing” BMP to function with significant P reduction in water
exiting these systems.
Polyacrylamide polymers are available throughout Florida in the form of powders, emulsions
and logs. Injection polymers have been used in dredging operations in Florida for decades
although this class of polymers may be harmful to aquatic organisms. Typical average costs are
$7.00 to $8.00 per pound for site specific potable water treatment polymers and are the most
effective and safe within the environment. Usage of the site specific forms are increasing and
becoming more common which has increased distribution by more manufactures into this
industry. Currently all forms of these polymers are available same or next day for any site within
Florida.
A current application of Floc Logs in an urban commercial watershed pond has a SolarBee that
circulates water over the Floc Logs and thus mixes the pond water column. Removal of
phosphorus is reported at about 90% (Reedy Creek, 2009). Other various bubblers and aeration
systems are showing around 90+% P reductions. From the Reddy Creek data, unit cost
calculations show $70.28/pound or $154.62/kg.
What factors effect settling and residual management?
For applications of land applied PAM a testing procedure needs to be in place to determine the
correct form of PAM for any site specific application. The index testing procedure at UCF
designed for this purpose should be implemented. Data suggests that excess PAM use or
incorrect PAM use results in residual PAM discharge to receiving waters. Residual management
will be unnecessary if the correct PAM is matched to each lithology as soil retention and residual
PAM on a site would show little escape (Green and Stott, 2001). Phosphorus discharge may
become minimal to the point where water treatment may not be required if PAM application are
performed correctly. BMP combinations with PAM will need to be installed to the site
topography and may require slight modification based on site by site conditions.
Water treatment using PAM will also require a jar testing procedure similar to that for land
application of PAM. The use of alum + PAM treatment has shown best particulate floc settling
abilities. Residual management may not be an issue if existing pond designs are modified to
retain the alum + PAM floc. Literature suggests baffle panels or curtains can be used to capture
the resultant floc after the alum + PAM reaction (Salton Sea Rpt., 2005).
PAM for water treatment such as log or block formulations that exhibit very low potential of
aquatic toxicity do not have issues in residuals. Settled target materials are bio-degradable and
do not persist within the environment.
What are the cost effective options for residual management?
If polymer land applications and the corresponding BMPs are employed correctly there should

Final Report – Chemical Treatment
72
be insignificant residuals resulting in no further cost.
What chemicals should be evaluated?
Waste treatment residuals, alum and aluminum compounds, and log or block polymer forms for
passive treatment before discharge should be evaluated. Polymers should be made site specific
and with very low or no aquatic toxicity potential. Any floc formation or residuals need to be
captured before discharge and processed. It is very likely the combinations of two or more of
the technologies explained within this report may be required to obtain best results. For filtration
or capture of floc, lignocelluloses materials used as fiber can be used to attach iron compounds
and perhaps PAM as a filter (Han, et. el., 2003).
SUMMARY
Land application of PAM based polymers that has been matched to the lithology of Florida soils
may reduce phosphorus discharges to waterways significantly reducing eutrophic conditions.
PEBMPs that have been tailored to site specific conditions may likely further reduce phosphorus
release via stormwater discharges. Combinations of other known phosphorus binding or
retentive materials used in combination with these PAMs may likely produce highly effective
systems that greatly reduce the phosphorus at the source with lesser costs required to treat
polluted water systems. The binding potential of select PAM types may also enhance the
retention of other forms of materials used to bind phosphorus that would normally move through
the soil structure. Literature has shown that polymer enhanced BMPs from riparian buffers, filter
strips and soil stabilization will aid in binding of phosphorus and reduce phosphorus release to
the environment.
Water treatment using PAM, PAM blocks or logs in conjunction with aluminum sulfate in
Florida can greatly reduce the settling rates of produced floc and assist in residual management.
Alum + PAM treatment systems have been shown to be much more effective than alum alone.
The potential to easily modify existing detention, retention and sediment ponds with particle floc
baffles or curtains may greatly reduce the escapement potential of phosphorus from these ponds
increasing treatment efficiency. The application of alum + PAM, PAM bloc or log systems into
water transfer channels or canals may further treat and reduce particulate and soluble phosphorus
as the water enters into lakes or wetlands. Each potential application will require a site by site
evaluation, testing and PEBMP selection to assure correct performance.
REFERENCES
Bartholomew, Nathanael. 2003. Polyacrylamide for Turbidity Control in Runoff: Effects of
Polyacrylamide, Soil, and Solution Properties. Department of Soil Science, NCSU.
Master‟s Thesis.

Final Report – Chemical Treatment
73
Bjorneberg, D.L.& Lentz, R.D. 2005. Sediment Pond Effectiveness for Removing Phosphorus
from PAM-Treated Irrigation Furrows. Applied Engineering in Agriculture. American
Society of Agricultural Engineers. Vol. 21(4), pp. 589-593
Blanco-Canqui, H., Gantzer, C.J., Anderson, S.H., and Thompson, A.L. 2004. Soil Berms as an
Alternative to Steel Plate Borders for Runoff Plots. Soil Science Society Am. J., (68), pp.
1689-1694.
Bragg, Amanda. 2003. Phosphorus Reductions in Dairy Effluent Through Flocculation and
Precipitation. Texas A&M. Department of Soil and Crop Sciences.
http://twri.tamu.edu/report-abstract/SR%202003-009/
California Regional Water Quality Control Board, Colorado River Basin Region. 2005. Final
Report for Reducing Eutrophic Conditions of the Salton Sea.
http://www.saltonsea.ca.gov/ReducingEutrophicConditionsFinalReport.pdf
Ebeling, J. M., Rishel, K. L., and Sibrell, P. L. 2005. Screening and Evaluation of Polymers as
Flocculation Aids for the Treatment of Aquaculture Effluents. Aquaculture Engineering
33(4), pp. 235-49.
Entry, J.A., Sojka, R.E., Verwey, S.A., and Ross, C.W. 2002. Polyacrylamide Removes
Microorganisms and Nutrients from Surface Water. United States Department of
Agriculture. Northwest Irrigation and Soils Research Lab, Kimberly, ID.
Entry, J. A., Phillips, I., Stratton, H., and Sojka, R.E. 2003. Polyacrylamide + Al2(SO4)3 and
Polyacrylamide + CaO Remove Coliform Bacteria and Nutrients From Swine
Wastewater. Environmental Pollution 121, pp. 453-462
Entry, J.A., and Sojka, R.E. 2003. The Efficiency of Polyacrylamide to Reduce Nutrient
Movement From an Irrigated Field. Transactions of the American Society of Agricultural
Engineers. 46(1), pp. 75-83.
Faucette, B., Shields, F., and Krutz, K.. 2006. Removing Storm Water Pollutants and
Determining Relations Between Hydraulic Flow-Through Rates, Pollutant Removal
Efficiency, and Physical Characteristics of Compost Filter Media.
http://www.ieca.org/membersonly/Proceedings/Object246PDFEnglish.pdf
Faucette, L.B., Sefton, K.A., Sadeghi, A.M., Rowland, R.A. 2008, Sediment and Phosphorus
Removal From Simulated Storm Runoff with Compost Filter Socks and Silt Fence.
Journal of Soil and Water Conservation, 63(4) pp. 257-264.
Goodson, C. C., Schwartz, G., and Amrhein, C. 2006. Controlling Tailwater Sediment and
Phosphorus Concentrations with Polyacrylamide in the Imperial Valley, California.
Journal Environmental Quality. (35), pp. 1072-1077.

Final Report – Chemical Treatment
74
Green, S. V. and Stott, D.E. 2001. Polyacrylamide: A Review of the Use, Effectiveness, and Cost
of a Soil Erosion Control Amendment. 10th
International Soil Conservation
Organizational Meeting, Purdue University. pp. 384-389,
Green, V. Steven, S., Norton, D.E., and Graveel, J.G. 2000. Polyacrylamide Molecular Weight
and Charge Effects on Infiltration Under Simulated Rainfall. Soil Science Society
American Journal (64), pp. 1786-1791.
Han, J. S., Hur, N., Choi, B. and Min, Soo-Hong. 2003. Removal of Phosphorus using
Chemically Modified Lignocellulosic Materials. 6th
Inter-Regional Conference on
Environment-Water, “Land and Water Use Planning and Management”. Albacete, Spain.
Idaho Soil Conservation Commission. 2002. Bruneau River Watershed Agricultural TMDL
Implementation Plan.
http://www.scc.state.id.us/TMDLPlans/BruneauRiverImplementationPlanJune2002.pdf
Lentz, R.D., Sojka, R.E., & Robbins, C.W. 1998. Reducing Soil and Nutrient Losses from
Furrow Irrigated Fields with Polymer Applications. Advances in GeoEcology 31, pp.
1233-1238.
Mason, L.B., Amrhein, C., Goodson, C.C., Matsumoto, M.R., and Anderson, M.A. 2005.
Reducing Sediment and Phosphorus in Tributary Waters with Alum and Polyacrylamide.
Journal of Environmental Quality, (34), pp. 1998-2004
Natural Resources Conservation Service Conservation Practice Standard, Anionic
Polyacrylamide Erosion Control, Code 450-1, 2003
Reedy Creek Water Management District, Florida 2009. Chlorophyll α and Phosphorus
Reduction Monitoring Data. Unpublished raw data.
Sojka, R.E. and Lentz, R.D. 1997. A PAM Primer: A Brief History of PAM and PAM Related
Issues. U.S. Department of Agriculture, Agricultural Research Service, Northwest
Irrigation and Soils Research Lab. Posted on USDA-ARS website.
http://www.nwisrl.ars.usda.gov/research/PAM/primer
Stieber, T.D., and Bahr, G.L. 1996, Reduction of Nutrient and Pesticide Losses Through the
Application of Polyacrylamide in Surface Irrigated Crops. Proceedings of the 1996 PAM
Conference, Twin Falls, ID. pp. 41-48.
Virginia Erosion & Sediment Control Regulations (4VAC50-30-40). 2002. Erosion & Sediment
Control Technical Bulletin #2. Application of Anionic Polyacrylamide for Soil
Stabilization and Stormwater Management.
http://www.dcr.virginia.gov/soil_&_water/documents/anionic.pdf

Final Report – Chemical Treatment
75
CHAPTER IV DRINKING-WATER TREATMENT RESIDUALS
INTRODUCTION
Significant (and sometimes excessive) amounts of phosphorus (P) are added to soils in the
form of fertilizers, biosolids, and manures to promote crop production. Offsite losses of P can
pollute surface water supplies, often via surface runoff. The problem is exacerbated in poorly P-
sorbing soils, such as south Florida soils, where P leaching occurs and polluted water is
intercepted by drains (or shallow water tables) that join surface waters. These soils are
characterized by coarse textures and low native Fe/Al hydroxide contents. Soil amorphous Fe/Al
content is well correlated with P retention (Moore, 1998; Self-Davis et al., 1998; Elliott et al.,
2002b; Dayton and Basta, 2005b), and soils with relatively low amorphous Fe/Al contents are
expected to have low P retention capacities. One management precaution to mitigate the problem
is to increase the P sorption capacity of poorly P-sorbing soils by amendment with Al- or Fe-
based drinking-water treatment residuals (Al-or Fe-WTR respectively), (O‟Connor et al., 2002;
Ippolito et al., 2003; Novak and Watts, 2004; Dayton and Basta, 2005a; Makris and O‟Connor,
2007). The use of WTRs to control mobility of excess P (Elliott et al., 1990b; O‟Connor et al.,
2002; Makris et al., 2004a,b; Novak and Watts, 2004; Agyin-Birikorang et al., 2007) and other
oxyanions (Makris et al., 2006; Sarkar et al., 2007) in poorly sorbing soils is well studied.
Drinking-water treatment residuals are waste products of water purification that, by virtue
of their composition and reactivity, have potential for environmental remediation as a soil
amendment (Livesey and Huang, 1981; Hughes et al., 2005). Drinking-water treatment residuals
are primarily sediment, metal (aluminum, iron or calcium) oxide/hydroxide, activated carbon,
and polymers removed from the raw water processed during the water purification process
(Elliott and Dempsey, 1991; Maurer and Boller, 1999). Coagulation, flocculation, and
sedimentation (or coagulation and filtration) are processes used in many water treatment systems
to remove turbidity, color, taste, and odor from raw water, and to speed sedimentation. Although
new drinking-water treatment technologies (membrane separation, ion exchange, precipitative
softening, granular activated carbon, and disinfection/UV) have emerged, the majority of
drinking-water treatment plants are still based upon coagulation / filtration principles (Makris
and O‟Connor, 2007).For example, a statewide survey of drinking-water treatment plants in
Florida showed that 49%, 20%, and 6% of plants used lime, ferric chloride, and alum,
respectively (Townsend et al., 2001).
A consequence of the expansion and proliferation of water treatment facilities globally is
the increased generation of WTRs that require appropriate methods of disposal. There are
thousands of drinking-water treatment plants in the United States that use metal salts as
coagulants for efficient removal of particulate solids and colloids from surface water supply,

Final Report – Chemical Treatment
76
generating more than 2 million metric tons of WTR daily (Prakash and SenGupta, 2003).
Drinking-water treatment residuals can be disposed: a) directly to receiving stream2; b) to
sanitary sewers; c) to landfills, assuming that the residual contains no free-draining water and
does not have toxic characteristics as defined by the toxicity characteristic leaching procedure
(TCLP) test; and d) by land application (Elliott et al., 1988; Chwirka et al., 2001). A 1991 survey
of 612 utilities serving populations of >50,000 in the United States showed that landfill disposal
was the predominant disposal method followed by land application > sanitary sewer disposal >
direct stream discharge > lagooning (Kawczyinski and Achtermann, 1991). In Florida, the most
acceptable long-term disposal methods of WTRs have been identified as landfilling (Townsend
et al., 2001) and land application (O‟Connor et al., 2005). The disposal (via landfill) cost of non-
hazardous materials, including WTRs, is estimated at ~ $50 Mg-1
(Meng et al., 2001), which can
substantially increase the costs of treated drinking water. Heil and Barbarick (1989), Elliott et al.
(1990b), and Viraraghavan and Ionescu (2002) predicted that landfill space for WTR disposal
will be limited. Several studies have identified land application of WTR as an attractive and less
expensive alternative means of WTRs disposal (Elliott et al., 1990b; Novak and Watts, 2004;
Dayton and Basta, 2005a; Rhoton and Bigham, 2005).
Land application of WTRs can be a cost-effective treatment for effectively sorbing excess
levels of labile P in soils. The high amorphous aluminum (Al) or iron (Fe) content of the WTRs
can increase a soil‟s P sorption capacity (Elliott et al., 1990b; Novak and Watts, 2004; Dayton
and Basta, 2005a; Rhoton and Bigham, 2005). Land-application of WTRs can significantly
reduce runoff-P from agricultural fields. Haustein et al. (2000) documented decreasing soluble P
concentrations in runoff from fields excessively high in soil test P following amendment with an
alum-based WTR (Al-WTR) (rates up to 18 Mg ha-1
). Gallimore et al. (1999) applied an Al-
WTR to poultry litter-amended soils, and reduced soluble P in surface runoff. Peters and Basta
(1996) significantly reduced (~ 50 % of the initial values) soil test-extractable P concentrations
of an acidic and a calcareous soils incubated with high loading rates of two Al-WTRs (~ 60 and
200 Mg ha-1
).
Al-WTRs provide rapid, highly efficient removal of P in soils, and P immobilized by Al-
WTRs is shown to be stable and persist for a long time, irrespective of changes in soil pH. Fe-WTR
immobilized P is only stable under oxidized conditions, and may not be immune to dissolution from
normal fluctuations in redox potential in surface water bodies. Phosphorus immobilized by Ca-
WTR is pH dependent, and long-term stability of P immobilization cannot be guaranteed in low pH
environments. Thus, Al-based WTR is most preferred for P control.
OVERVIEW OF TECHNOLOGY
Many south Florida and other Coastal Plain soils contain excess soil P concentrations as a
result of repeated manure applications (Sharpley and Halvorson, 1994; Barker and Zublena,
1995; Graetz and Nair, 1995; Sims et al., 1998; Hansen et al., 2002). Livestock production and
manure generation in south Florida are frequently concentrated in specific geographic areas
(Graetz and Nair, 1995; Josan et al., 2006; Kellogg et al., 2000). Because transporting manure
away from a production facility is expensive, manure is typically applied onto nearby fields
(Sharpley, 1999), and because land available for manure application is limited, some fields have

Final Report – Chemical Treatment
77
received excessive manure applications, resulting in soils containing several
hundred kg of plant
available P per ha (Sims et al., 1998; Novak et al., 2000; Hansen et al., 2002).
Environmental concerns and regulatory pressure to reduce P loadings to surface water
systems have prompted research into developing and evaluating best management practices
(BMPs) that minimize offsite P transport. Current BMPs used to reduce P transport into surface
water systems include conservation tillage, crop residue management, cover crops, buffer strips,
runoff water impoundment, and riparian zones (Sharpley and Halvorson, 1994; Dosskey et al.,
2002). These BMPs focus on physically reducing P losses through minimizing runoff. Literature
is abundant with studies that attempted to develop and demonstrate soluble P reduction
techniques from soils amended with animal wastes (Anderson et al., 1995; Gilmore et al., 1999;
Dayton and Basta, 2005a, Agyin-Birikorang et al., 2007, 2008), wastewater (Omoike et al.,
1999) and manure slurries (Burns et al., 2001), or in lakes (Hoge et al., 2003) and constructed
wetlands (Ann et al., 2000). Most of the soluble P removal techniques are based on chemical
immobilization of P with di- or tri-valent metal salts.
Because of the high P sorption capacity of some WTRs, many researchers have proposed
the use of WTR to reduce P loading into surface or ground water (Gallimore et al., 1999; Elliott
et al., 2002b; Dayton et al., 2003; Novak and Watts, 2004; Dayton and Basta, 2005a; O‟Connor
et al., 2005; Makris et al., 2004a,b; 2005a,b,c; Ippolito and Barbarick, 2006; Makris and
O‟Connor, 2007; Agyin-Birikorang et al., 2007, 2008; Agyin-Birikorang and O‟Connor, 2007).
Several BMPs using WTR to reduce nonpoint source P pollution have been proposed. One
approach is to surface-apply WTR to reduce transport of P in agricultural runoff water (Basta
and Storm, 1997; Dayton et al., 2003; Gallimore et al., 1999; Haustein et al., 2000; Peters and
Basta, 1996). Another approach is to incorporate WTR into soil to reduce legacy P solubility and
prevent P leaching (Codling et al., 2000; Elliott et al., 2002a, 2002b; Novak and Watts, 2004;
O'Connor et al., 2002; Peters and Basta, 1996). Dayton and Basta (2005b) reported that addition
of WTR as an enhanced buffer strip could be a BMP to greatly reduce DRP in runoff water.
Beneficial use of WTR has also been expanded to reduce the solubility of P in organic soil
amendments, such as manure or biosolids. Co-blending WTR with manure or biosolids before
land application reduces the solubility of P in the manure or biosolids. Reducing the solubility of
manure or biosolids P by co-blending with WTR before land application allows farmers to take
advantage of the nitrogen, micronutrients, and organic carbon content of the manure or biosolids
without increasing the P risk to the environment. A new idea being explored for cleansing
drainage water from golf courses is to attach a filter cartridge filled with WTR to sorb P before
they reach drainage-pipe outlets (USDA-ARS, 2009).
Presently, only “aged” WTRs (those left or manipulated to dewater) are land applied.
However, when demand for WTR increases in the near future, freshly-generated WTRs could
possibly be considered for land application. Unpublished data (McLaughlin, 2005, personal
communication) suggest a greater reactivity and potential ecological risk for the freshly
generated WTRs than “aged” WTRs. Some regulators in Australia suggest limiting land
application of Al-WTRs to the “aged” materials to minimize potential ecological Al risk
(McLaughlin, 2005, personal communication). Agyin-Birikorang and O‟Connor (2008) utilized
laboratory thermal incubation procedure to determine the extractable Al forms in Al-WTR as a
function of WTR “age”, and the time required for freshly generated Al-WTR to stabilize.
Freshly-generated Al-WTR samples were collected directly from the discharge pumps of a

Final Report – Chemical Treatment
78
drinking-water treatment plant, and thermally incubated at 52 oC for 24 wk to hasted “ageing”.
Various measures of extractable Al [total-, oxalate (200 and 5 mM), and Mehlich 1 extractants]
were utilized to assess Al extractability over time. Freshly-generated Al-WTR samples were
potentially more reactive (greater 5 mM oxalate extractable Al concentration) than dewatered Al-
WTR samples stockpiled for ≥ 6 mo. Aluminum reactivity of the freshly-generated Al-WTR
decreased with time. At least 6 wk of thermal incubation (corresponding to ≥ 6 mo of field
drying) was required to stabilize the most reactive Al form (5 mM oxalate extractable Al
concentration) of the Al-WTR. Although few adverse Al-WTR effects have been reported on
plants, and no effects on grazing animals (apparently because of low availability of free Al3+
in
Al-WTR), only dewatered (≥ 6 mo old) Al-WTRs should be land applied to minimize overall
potential ecological Al risk.
Determination of WTR application rate
A quantitative approach of using WTRs to reduce P flux from P-amended soils should be
based on ensuring sufficient reactive Al + Fe in the WTR to immobilize labile P in the soil.
Determining the appropriate application rate of WTR is complicated due to the variations in
chemical properties of the residuals as influenced by the source of water, treatment chemicals
and processing used by drinking-water treatment plants (O‟Connor et al., 2004). Soils and P-
sources that can be co-applied with WTR, can also vary in physicochemical properties. Thus, the
compositional variability of soils, P-sources (if co-applied with WTR), and WTRs need to be
accounted for in determining the amount of WTR applied. Different approaches have been
suggested (Ippolito et al., 1999; Chardon et al., 2000; Elliott et al., 2002b; Dayton and Basta,
2005a; Novak and Watts, 2005a; Oladeji et al., 2007) to determine WTR application rates
sufficient to effectively immobilize excess soluble P in the soil, without negatively affecting
agronomic P requirement.
Ippolito et al. (1999) suggested determination of Pmax of WTR beforehand, and to use the
Pmax value to calculate the quantity of WTR to apply to effectively reduce soluble P in
agricultural runoff water, and to reduce the solubility of P in agricultural soils or organic waste
materials (biosolids, manure). Determining Pmax from adsorption multipoint isotherms is a
laborious procedure. Instead, Dayton and Basta (2005a) suggested that an easier approach is to
use a single WTR extraction with acid ammonium oxalate to estimate amorphous (e.g., reactive)
Al oxide in WTR. In Al-based WTR, the relationship between amorphous Al and Pmax could
provide decision makers with a strong tool to easily estimate the Pmax, of any Al-WTR to
calibrate WTR application. In a batch equilibration study to examine components of WTR that
contribute to P sorption properties, oxalate extractable Al (Alox) correlated with the linearized
Langmuir Pmax values (Dayton et al., 2003). Similarly, sorption capacities of various WTRs were
also shown by O‟Connor et al. (2002) to depend on the oxalate extractable (but not total) Al, Fe,
and P concentrations of the WTRs. Pautler and Sims (2000) reported a relationship (r = 0.61, p-
value = 0.01) between P sorption capacity and amorphous Al and Fe concentrations of soils.
Dayton and Basta (2005a) suggested that oxalate extractable Al (and/or Fe) concentration of
WTRs could be used to calibrate WTR application rates.
Novak and Watts (2005a) observed that increasing the WTR application rate caused a
linear decrease in the soil extractable P (M3P) concentrations. The authors suggested establishing
a regression relationship between WTR application rates and extractable P concentrations for

Final Report – Chemical Treatment
79
each soil and then calculating the WTR application rate needed to reduce soil extractable P
concentrations to target agronomic and environmental threshold levels. Elliott et al. (2002b), on
the other hand, reported that the phosphorus saturation index (PSI = [Pox]/[Alox + Feox]) of WTR,
calculated from the molar concentrations of oxalate extractable P (Pox), Al (Alox), and Fe (Feox),
was useful for determining WTR application rates. The PSI of WTR is a measure of P
retention/release potential from a particular WTR. Thus, integrating the PSI of the WTR and the
P saturation ratio (PSR, similar to PSI) of a particular soil, the WTR application rate for the soil
could be determined.
A study by Nair and Harris (2004) recommended determining the soil phosphorus storage
capacity (SPSC) values as an index to predict the amount of P a soil can sorb before exceeding a
threshold soil equilibrium concentration. The SPSC values are calculated from the soil oxalate
extractable P, Fe, and Al concentrations as:
SPSC (mg P kg-1
) = (0.15 – PSR)* (Alox + Feox)*31
where PSR = phosphorus sorption ratio = [(Pox)/(Alox + Feox)], Pox, Alox, and Feox are 0.2 M
oxalate extractable P, Al, and Fe concentrations of the soil respectively (expressed in mmoles)
(Nair and Harris, 2004).The SPSC values can indicate the risk arising from P loadings as well as
the inherent P sorption capacity of the soil. The SPSC values range from negative values (for
highly P-impacted soils) to positive values (for less P-impacted soils). Oladeji et al. (2007)
identified zero SPSC as an agronomic threshold above which yields and P concentrations of
plants may decline and below which there is little or no yield response to increased plant P
concentrations. Applying P sources at any rate along with sufficient WTR to give SPSC value of
0 mg kg-1
SPSC was shown to enhance environmental benefits (reduced P loss potential) without
producing a negative agronomic impact (Oladeji et al., 2007). Application of WTR, if based on
the agronomic SPSC threshold, targets only the excess P that poses environmental threats and is
not expected to negatively impact the P pools needed to meet plant P requirement. The authors
therefore suggested that an amendment‟s phosphorus storage capacity (APSC, equivalent to
SPSC in soil) should be determined for WTRs and P sources (if any) prior to land application.
The P storage capacity of the WTR and the P sources can be determined by modifying the SPSC
equation (above) by substituting PSR with PSI. Thus, the P storage capacity of the P sources
(APSCsource) and WTR (APSCWTR) can be calculated as:
APSC (mg P kg-1
) = [(0.15-PSI)*(Alox + Feox)]*31
where PSI = Phosphorus sorption index = [(Pox)/(Alox + Feox)]
The SPSC and APSC values can then be combined to determine the amount of WTR
needed to be applied to a P impacted soil or to be co-applied with the P-sources. The SPSC-
based WTR application rate will not only account for the P, Al, and Fe concentrations in the
residuals and the soil, but the threshold soil P value as well. Thus, the WTR rate required to
attain a desired SPSC value can be calculated to ensure a soil P concentration below the
environmental threshold, while at the same time, supplying sufficient P to meet plant needs
(Oladeji et al., 2007). The amount of WTR to be added can then be determined as:
SPSCsoil* Masssoil + APSCsource* Masssource + APSCWTR* MassWTR = 0

Final Report – Chemical Treatment
80
The SPSC value of the soil, and APSC value of P sources and the WTR can be determined
from the chemical compositions of the soil and amendments. The quantity of the P sources is
known from the application rate and the mass of soil could be determined from the land area to
depth of impact (depending on application method; 15 cm depth if incorporated, or 5 cm when
surface applied) and the soil bulk density. The only unknown in the equation would be the mass
of WTR, which can be determined by substituting the known values into the equation. The
equation can be used to calculate amount of WTR needed to achieve a particular soil SPSC value
under any given condition (Oladeji et al., 2007). Due to the various concerns expressed over land
application of WTRs, accurately determining WTR application rate is critical to the continued
use of WTRs as soil amendment.
APPLICATIONS AND SUCCESS STORIES
There is abundant evidence that WTRs are effective P sorbents that reduce the off-site P
losses. The high amorphous Al or Fe contents of the WTRs increase a soil‟s P sorption capacity
of soils with limited P sorption capacity (Elliott et., 2002b; Makris et al., 2004a,b; Elliott et al.,
1990b; Novak and Watts, 2004; Dayton and Basta, 2005a,b; Agyin-Birikorang et al., 2007,
2008).
Laboratory studies have shown that Al-WTRs adsorb large amounts of P and increase the
P-sorbing capacity of poorly P-sorbing soils, thereby decreasing P leaching (Elliott et al., 2002b;
O'Connor et al., 2002). Codling et al. (2000) amended P impacted soil with Al-WTR (rates up to
25 g kg-1
) and observed ~88% reduction s in water-soluble P, relative to the soil without WTR
amendment. O'Connor et al. (2002) showed that the sorption capacity of some Al-WTRs was
>5000 mg P kg-1
, and that the P sorption by WTR was essentially irreversible. Novak and Watts
(2004) determined the extent to which soil incorporation of Al-WTRs would increase the P
sorption capacity of sandy Coastal Plain soils. Laboratory batch P sorption experiments showed
that un-amended Coastal Plain soils had maximum P sorption capacity (Pmax) values of
<1 mg P g-1
, and Al-WTRs had Pmax values between 85 and 175 mg P g-1
. Augmenting soils with
WTRs substantially increased the Pmax values of the Coastal Plain soils to between 1.7 and 8.5
mg P g-1
, depending on the P sorption effectiveness of the WTRs. Novak and Watts (2005b)
showed that crushing WTRs into smaller diameter aggregates can improve the effectiveness of
WTR by increasing their Pmax values between 1- and 2- fold. Butkus et al. (1998) were able to
load a Fe-WTR with 200,000 mg kg-1
(~20 % P by wt). Agyin-Birikorang (2006) reacted Al- and
Fe-WTRs with inorganic P solutions at P loads up to 10,000 mg P kg-1
and observed that almost
all the added P was sorbed by most WTRs, although some WTRs sorbed little P (Fig. 4-1).
Ippolito et al. (2003) investigated the effectiveness of several Al-based WTRs in removing P
from soil solution, and found that the WTRs adsorbed >2000 mg P kg-1
P. One Al-based WTR
had P adsorptive capacity of approximately 12500 mg P kg-1
WTR (Ippolito et al., 2003). Agyin-
Birikorang et al. (2008) reported decreases in degree of P saturation (DPS) values in poorly P-
sorbing surface soils amended with different P-sources when WTR was applied to the soil,
suggesting that the capacity of the soil to adsorb P was enhanced by WTR amendment. Degree
of P saturation has been shown to correlate positively with P loss potentials (Pautler and Sims,
2000; Nair et al., 2004). Pautler and Sims (2000) found that P solubility increased significantly
(r2=0.70) as soil P saturation increased in 41 agricultural soils in Delaware, USA. Hooda et al.
(2000) found that the degree of soil P saturation was significantly related to soil P desorption.
The critical DPS value for Florida soils is suggested to be 0.25, which correspond to ~10 mg kg-1

Final Report – Chemical Treatment
81
of water extractable P (WEP); soils with DPS values >0.25 are expected to release significant
amounts of P to surface runoff or leaching, whereas soils with DPS values <0.25 are not (Nair et
al., 2004). In the presence of WTR amendment, the DPS values of a P-impacted soil were
reduced below the critical value for Florida Spodosols, irrespective of the P source and P-source
rate applied to the soil (Agyin-Birikorang et al., 2008).
0
2000
4000
6000
8000
10000
0 200 400 600 800 1000
Equlibrium P (mg L-1
)
So
rb
ed
P (
mg
kg
-1)
Bradenton WTR
Holland WTR
Lowell WTR
Cocoa WTR
Figure 4-1. Phosphorus sorption isotherms of some selected aluminum- and iron-based drinking-
water treatment residuals (Agyin-Birikorang, 2006)
Peters and Basta (1996) amended a soil that had excessive levels of available P from long-
term poultry litter application with an Al-WTR (100 g WTR kg-1
), and reduced Mehlich 3 soil P
(M3P) values from 296 to <200 mg P kg-1
. In a related study, M3P was reduced from 553 to 250
mg kg-1
, when a P impacted soil was amended with an Al-WTR at 100 g WTR kg-1
. Novak and
Watts (2005a) evaluated the ability of an Al-WTR to reduce soil test P (M3P) concentrations and
water extractable P (WEP) concentrations in three P-enriched sandy soils. The study confirmed
that WTR incorporation into the three soils with varying soil P concentrations significantly
reduced WEP and M3P concentrations. Agyin-Birikorang et al. (2008) showed that amendment
with an Al-based WTR (22.4 kg ha-1
) decreased soluble P concentrations in poorly P-sorbing
soils amended with different P sources (224 kg P ha-1
) by >65%, relative to treatments without
WTR treatments.
Beneficial use of WTR has also been expanded to reduce the solubility of P in organic soil
amendments, such as manure or biosolids (Codling et al., 2000; Elliott et al., 2002b; Ippolito et
al., 1999). Co-blending WTR with a manure or biosolids before land application reduced the

Final Report – Chemical Treatment
82
solubility of P in the manure or biosolids. Dayton and Basta (2005b) evaluated co-blending WTR
with organic soil amendments (poultry litter and biosolids) to reduce the P solubility of the
amendment and observed a reduction in P solubility of the organic materials. Reducing the
solubility of manure or biosolids P by co-blending with WTR before land application allows
farmers to take advantage of the nitrogen, micronutrients, and organic carbon content of the
manure or biosolids without increasing the P risk.
Surface application of WTR has been successful at reducing dissolved P concentrations in
runoff water (Basta and Storm, 1997; Dayton et al., 2003; Gallimore et al., 1999; Haustein et al.,
2000; Peters and Basta, 1996). The P sorption characteristics of WTRs have enabled the
utilization of the WTRs to reduce off-site P losses in runoff from agricultural fields. Haustein et
al. (2000) documented decreasing soluble P concentrations in runoff from fields excessively high
in soil test P following amendment with an Al-WTR (rates up to 18 Mg ha-1
). Gallimore et al.
(1999) applied an Al-based WTR to poultry litter-amended soils, and reduced soluble P in
surface runoff. Dayton and Basta (2005b) reduced runoff-P when used in buffer strips near water
bodies. The authors concluded that concentrating the WTRs in strips of land, rather than
applying the residuals to an entire watershed, reduces the amount of WTR needed while
protecting surface waters from P pollution. Buffer strips are a BMP to reduce surface water
pollution, and the effectiveness of the strips can be greatly improved by amendment with WTRs.
In addition to reducing P losses in runoff, land-application of WTRs can also reduce P
leaching, but is most beneficial when full contact of soil soluble P with the WTR particles is
ensured (Elliott et al., 2002b; Silveira et al., 2006). Makris et al., 2004b showed that P retention
by WTRs is diffusion-controlled, so P must be close to WTR particles to be retained.
Researchers (Codling et al., 2000) that incorporated either Fe- or Al-based WTRs into poultry
litter-amended soils significantly reduced P-leaching. In a greenhouse column setup, Elliott et al.
(2002b) showed that either Fe- or Al-based WTRs were able to reduce P leaching in a low P-
sorbing Florida sand amended with dewatered biosolids and triple superphosphate (TSP)
fertilizer. Amendment with WTRs reduced P leaching to 3.5% (Ca-WTR), 2.5% (Fe-WTR) and
<1% (Al-WTR) of applied TSP-P. For the biosolids treatments, all WTRs retarded P leaching to
the extent that leachate P was not statistically different from the controls. Agyin-Birikorang et al.
(2009) evaluated WTR effectiveness in reducing P losses to groundwater (under natural field
conditions) from a typical Florida Spodosol amended with P sources of different solubilities.
Surface-applied WTR prevented P leaching into the groundwater. In the presence of WTR, the
shallow groundwater P concentrations were significantly lower than those of the corresponding
plots without WTR amendment (Fig. 4-2).
Applying WTRs to poorly P-sorbing soil increase the P sorption capacity of the soils, and
reduces off-site P movement from fields via runoff and leaching. However, the magnitude of the
increase in P sorption capacity of the soil depends on the P binding effectiveness of the WTRs.
Reducing off-site P transport will lower P loads into nutrient sensitive surface water systems,
thereby minimizing the occurrence of eutrophication, and preserve water body quality.

Final Report – Chemical Treatment
83
0.0
0.5
1.0
1.5
2.0
2.5
3.0
3.5
Manure Biosolids 1 Biosolids 2 TSP Control
Phosphorus Source
Ort
ho
ph
os
ph
ate
P (
mg
L-1
)
N-based, no WTR N-based, with WTR
P-based, no WTR P-based, with WTR
e
eee
ee
b
dc
a
e eee ee e
Figure 4-2. Effects of P sources (applied at N-based-, and P-based rates) and WTR amendments
on the orthophosphate concentration of groundwater samples collected from the shallow
wells in an 18-mo field study period. Treatments having the same letter are not different
by the Tukey multiple comparison at significance level (α) of 0.05 (Agyin-Birikorang et
al., 2009)
Concerns have been raised about the long-term stability of WTR-immobilized P, as
regulators are interested in the ultimate fate of P retained by WTR. Various methods, including
spectroscopic and solid-state characterization of P-loaded WTR particles, have been employed to
better understand the long-term stability of sorbed P (Makris et al., 2004b; Ippolito et al., 2003).
Makris et al. (2004b) reacted Fe- and Al-WTR particles with P for 80 d and then subjected the
particles to Scanning Electron Microscopy-Energy Dispersive Spectroscopy (SEM-EDS) and
electron microprobe analyses. No discrete surficial metal-P phases were detected with SEM-EDS
spectroscopy (Fig. 4-3). The data led to the hypothesis that P diffuses into WTR particles to
reach meso- and micro- pore domains rather than precipitating on external surfaces of the WTRs.
Thin cross-sections were prepared that allowed monitoring of the profile depth P distribution in
the WTR particles over time. The SEM-EDS dot maps of cross-sections from both Fe- and Al-
WTRs qualitatively supported an intraparticle sorption mechanism. Phosphorus was evenly
distributed within the particles, except for some near edge P zonation in Fe-WTR particles after
P treatment (Fig. 4-4). Electron microprobe analysis using wavelength-dispersive spectroscopy
(EPMA-WDS) on thin-sections of P-treated WTR particles supported intraparticle P diffusion
more quantitatively than the SEM-EDS (Makris et al., 2004b). Ippolito et al. (2003) used EPMA-
WDS dot maps to assess P distribution in a P-treated Al-WTR equilibrated for 211 d. Dot maps
showed no evidence for P surface precipitation; further, there was a uniform amorphous Al-P
association throughout the particles (Ippolito et al., 2003). The EPMA-WDS data support the
notion that P moves in a three-dimensional fashion towards the interior of the WTR particles
rather than accumulating significantly at the particle surface as by precipitation. The combined
data of Makris et al. (2004b) and Ippolito et al. (2003) suggest that P sorption by Fe- and Al-

Final Report – Chemical Treatment
84
WTRs is practically irreversible. Apparently, once P reaches the WTR microsites, very strong
adsorption, and highly hysteretic desorption is likely. Thus, once immobilized by the WTR
particles, the P is likely irreversibly bound, barring destruction of the WTR particles. The
findings of the authors (Makris et al., 2005a; Ippolito et al., 2003) provide evidence to support
the long-term stability of sorbed P by Fe- and Al-WTRs, when land-applied to P-sensitive
ecosystems.
Figure 4-3. Scanning electron secondary images of the Al- and Fe-WTRs. (A) secondary image
of representative Al-WTR particles; scale bar = 200µm. (B) Magnified secondary image of
a portion of image (A); scale bar = 100µm. (C) secondary image of representative Al-WTR
surfaces; rough and smooth surfaces; scale bar = 20µm. (D) Magnified secondary image of
the rough surface of the Al-WTR particle from image (C); scale bar = 2µm. (E) secondary
image of representative Fe-WTR particles; scale bar = 200µm. (F) Magnified secondary
image of a portion of image (E); scale bar = 100µm. (G) secondary image of representative
Fe-WTR surfaces; rough and smooth surfaces; scale bar = 20µm. (H) Magnified secondary
image of the rough surface of the Fe-WTR particle from image (G); scale bar = 2µm.
Images D and H show surface porosity, but magnification is not large enough to show
microporosity (Makris et al., 2004b).

Final Report – Chemical Treatment
85
Figure 4-4. Scanning electron secondary images (A, D) and the corresponding P and metal dot
maps (B,C, E and F) of thin cross-sections after 80d P treatment for both WTRs. (A)
secondary image of a representative Al-WTR cross-section; scale bar = 20 μm. (B) P dot
map of the secondary image in (A). (C) Al dot map of the secondary image in (A). (D)
Secondary image of a representative Fe-WTR cross-section; scale bar = 20 μm. (E) P dot
map of the secondary image in (D). (F) Al dot map of the secondary image in (D). P dot
maps of cross-sections for both WTRs show uniform P distribution, with no evidence for
surface precipitation. Rarely, and only for the P-treated Fe-WTR, were there indications of
zonal P enrichment near the particle edge (Makris et al., 2004b).

Final Report – Chemical Treatment
86
To validate the findings of the spectroscopic study, Ippolito et al. (2003) determined the
ease of P removal from a P-loaded WTR; and observed that amount of P desorbed decreased
(from 17.3 to 4.7 mg kg-1
) with increased shaking time. The authors suggested that the decrease
in the amount of P desorbed with time resulted from P finding more occluded Al surface sites to
react with, becoming more strongly sorbed at individual Al surface sites or undergoing layered
surface precipitation. Makris et al. (2004b) observed minimal (0.2% and 0.8% of sorbed P) P
desorption from WTRs. The limited P desorption likely reflects increased micropore energy
potentials of pore walls and sorbed P. Micropore walls maximized bonding interaction between
sorbent and sorbate, thus reducing sorbate availability. The WTR particles maintained structural
integrity for 160 d at pH 5-7, as monitored by soluble P and metal (Fe and Al) measurements in
10 mM KCl. Maximum percentages of oxalate (5 mM)-desorbable P (% of that previously
sorbed) were generally < 0.2 % for all but one of seven WTRs; one WTR desorbed 1.5 %
(Makris, 2004). As desorption time increased to 40 or 80 d, no soluble P concentrations greater
than 0.3 mg P L-1
were measured for any Al-WTR, suggesting continuous P sorption.
In a field study, Agyin-Birikorang et al. (2007) assessed the longevity of an Al-WTR
immobilization of P in two fields with long histories of poultry manure applications. Amendment
with Al-WTR reduced soluble P concentration in the soils by >60%, compared to the control
plots, and the WTR-immobilized P remained stable for 7.5 y (Fig. 4-5). The data suggest that Al-
WTR amendment should reduce P losses from soils, and do so for a long time. To confirm this,
the authors utilized rainfall simulation techniques to investigate P losses in runoff and leachate
from soils amended with a one-time application of an Al-based WTR 7.5 y earlier. Amendment
with Al-based WTR reduced total dissolved P and biologically available P by >50%, showing
that the WTR-immobilized P indeed remained nonlabile (Agyin-Birikorang et al., 2007).
Findings from the poultry manure sites may be applied to legacy P in cow-calf type ranches or
dairy operations. The dosage rate should be tested and the site conditions documented.
Agyin-Birikorang and O‟Connor (2007) evaluated aging and pH effects on the lability of
Al-WTR immobilized P using artificially and field-aged Al-WTR amended soils. Artificial aging
of the Al-WTR amended samples was expected to simulate natural long-term weathering
processes that could influence the stability of sorbed P. Artificial aging was achieved through
incubation at elevated temperatures and through repeated wetting and drying. The samples were
either incubated via wetting and drying for 2 y, or thermally incubated at elevated temperatures
(70 oC) for up to 4.5 y. Field-aged Al-WTR amended samples, obtained from 7.5 y-old one-time
WTR-amended fields at two sites were used to validate trends observed with artificially aged
samples. Using a modified isotopic (32
P) dilution technique, coupled with a stepwise
acidification procedure, the authors monitored changes in labile P over time. This technique
enabled evaluation of the effect of pH on the lability of Al-WTR immobilized P. Within the pH
range of commonly occurring agricultural soils (4 to 7), Al-WTR amendment, coupled with
aging, ultimately reduced labile P in artificially aged samples by ~75%, and field-aged samples
by about ~70% relative to the no-WTR (control) samples (Fig. 4-6). The authors concluded that
WTR application is capable of reducing labile P concentrations in soils with excess P, doing so
for a long time and that, within the commonly encountered pH range in agricultural soils, Al-
WTR immobilized P is stable (Agyin-Birikorang and O‟Connor, 2007).
In another study, Agyin-Birikorang et al. (2008) designed an experiment to determine the
efficacy of an Al-WTR in preventing off-site P losses from a poorly P-sorbing Florida soil
amended with different P sources (biosolids, manure and inorganic fertilizer) to surface and

Final Report – Chemical Treatment
87
0
5
10
15
20
25
30
35
40
t (0) 0.5 1.5 2.5 3.5 4.5 5.5 6.5 7.5
Time after WTR application (yr)
Wat
er s
olu
ble
P (
mg
kg
-1)
Control
WTR-amended
A
Site 1
0
5
10
15
20
25
30
35
40
t (0) 0.5 1.5 2.5 3.5 4.5 5.5 6.5 7.5
Time after WTR application (yr)
Wat
er s
olu
ble
P (
mg
kg
-1)
Control
WTR-amended
B
Site 2
Figure 4-5. Effects of drinking-water treatment residuals on changes in water soluble P with time
in a long term study conducted in two Michigan fields (A) site 1 and (B) site 2. Error bars
denote standard errors of the mean of samples (Agyin-Birikorang et al., 2007).
groundwater. Unfortunately, the experimental plots were heavily flooded due to a series of
hurricanes that occurred at the study site (in the fall of 2004). The flooding appeared to have
compromised the treatments (moved soil and associated treatments across plots), which
compelled termination of the experiment. Measurements taken after the flooding, however,
provided a unique opportunity to assess the stability of WTR immobilized P following severe
flooding of WTR amended plots. Soil samples taken from the field after the hurricanes showed
that WTR effects were still obvious, despite the flooding of the field. The soluble P
concentrations measured from WTR-amended plots were significantly lower than in the plots
without WTR amendment. The DPS values of the WTR amended plots remained below the
environmental threshold value of 25% suggested for Florida soils. Phosphorus-specific
measurements in the Bh horizon suggested excessive P leaching from the field (due to the
flooding of the field). The greatest P leaching apparently occurred in the plots without WTR
amendment and the control plots, whereas little or no P leaching occurred in the WTR amended
plots. Thus, despite the extensive flooding of the fields, the WTR was able to retain the
immobilized P and prevented excessive P leaching (Agyin-Birikorang et al., 2008).

Final Report – Chemical Treatment
88
0
20
40
60
80
100
120
t(0) 1 mo 6 mo 1 yr 3.5 yr 4 yr 4.5 yr
Incubation time
La
bil
e P
co
nc.
(mg
kg
-1)
No WTR (pH 3)No WTR (pH 4)No WTR (pH 7)WTR-amended (pH 3)WTR-amended (pH 4)WTR-amended (pH 7)
Figure 4-6. Aging effects on labile P of the Immokalee soil samples spiked with 100 mg P kg-1
and thermally incubated at 70 oC for
4.5 yr. Error bars denote one standard error of the mean (Agyin-Birikorang and O‟Connor, 2007).

Final Report – Chemical Treatment
89
Concerns focus on land application of Al-WTRs negatively affecting human health and
agricultural production. There is a concern that land application of Al-WTRs will result in (i) soil
contamination with trace elements, particularly arsenic (As), and Al that could be directly or
indirectly ingested by humans, and (ii) contaminate groundwater with Al. The specific concern
among crop and livestock producers is that land application of Al-WTRs will result in (i) P
deficiency to plants due to excessive P immobilization (ii) Al toxicity to plants, and (iii) Al
toxicity to grazing animals.
(1) WTR effects on groundwater aluminum concentrations
The presence of Al in drinking water is of concern because of the suspected connection of
Al with Alzheimer‟s diseases or dialysis encephalopathy (Driscoll and Driscoll, 2005; Carol and
Arnold, 1990). In detailed characterization of WTRs generated in Florida, Jain et al. (2005)
reported that Al-based WTR samples contained Al concentrations ranging from 104 g Al kg-1
to
177 g Al kg-1
, with an average of 142 g kg-1
, all of which exceeded the residential soil cleanup
target level (SCTL) of 72 g Al kg-1
. Thus, potential WTR particle dissolution, particularly under
acidic conditions, is a concern with respect to WTR field applications in humid regions. Particle
dissolution in acid soils or aqueous suspensions could release significant quantities of potentially
toxic Al and previously immobilized P to the environment. Makris (2004) conducted long-term
(80 d) equilibrations of Al-WTRs in unbuffered 0.01 M KCl solutions, and showed that soluble
Al concentrations of untreated (no P added) Al-WTRs were below the instrument‟s (ICP-AES)
detection limit (0.03 mg Al L-1
). Overall, the amount of KCl-extractable Al concentrations
released from Al-WTRs within 80 d was minimal (< 0.1 % of oxalate-extractable Al) (Makris,
2004). Land application of Al-WTR at rates of 11.2 and 44.8 Mg ha-1
did not increase dissolved
solids or soluble Al concentrations in surface runoff (Gallimore et al., 1999). Haustein et al.
(2000) reported no significant increase of dissolved Al in surface runoff of soils amended with
an Al-WTR (2.2 to 18 Mg ha-1
).
Agyin-Birikorang et al. (2009) observed that amendment with an Al-based WTR (~22.4
Mg WTR ha-1
) increased oxalate extractable Al concentrations of the surface soil of a Florida
spodosol by several fold. The increase in Al content of the soil prompted the authors to analyze
groundwater samples to determine the impact of the soil surface-applied WTR on total dissolved
Al concentrations. Total dissolved Al concentrations of all the groundwater samples obtained
during the 18-mo study period were unaffected by the Al-WTR application (Fig. 4-7). Total
dissolved Al concentrations of the groundwater samples obtained soon after treatment
application, and throughout the sampling period were similar to the total dissolved Al
concentrations in groundwater samples obtained before treatments application (Agyin-Birikorang
et al., 2009). The authors concluded that WTR can be safely used to enhance the P-sorption
capacity of Florida sandy soils and reduce soluble P losses to groundwater without increasing
total dissolved Al concentrations in groundwater (Agyin-Birikorang et al., 2009).
Several studies have shown that pH control of soluble Al concentrations dominates Al
ecological risks (Lindsay, 1979; Sloan et al., 1995; Dong et al., 1995; Vance et al., 1996; Fest et
al., 2007). The pH of Al-based WTRs ranges between 5.0 and 8.2 (Table 4-2). At such pH
values, Al species is likely to be dominated by hydrolytes of Al (Lindsay, 1979; Sloan et al.,
1995; Lindsay and Walthall, 1996; Vance et al., 1996), and organically complexed Al forms

Final Report – Chemical Treatment
90
(Dong et al., 1995; Lindsay and Walthall, 1996; Vance et al., 1996; Fest et al., 2007), rather than
free Al3+
. Thus, there is little concern that free Al3+
will leach from the soil surface-applied Al-
WTR to contaminate water bodies, unless adverse conditions (e.g. pH<4) that could destroy
WTR particles occur.
-0.1
0.1
0.2
0.3
0.4
2 3 5 6 7 15 16 16
Time after amendment application (mo)
Tota
l d
isso
lved
Al
(mg L
-1)
N-based,no WTR N-based+WTR
Control P-based,no WTR
P-based+WTR
A
0.0
0.1
0.2
0.3
0.4
2 2 2 3 4 6 6 8 9 10 11 12 13 14 14 17
Time after amendment application (mo)
Tota
l d
isso
lved
Al
(mg L
-1)
N-based,no WTR N-based+WTR
Control P-based,no WTR
P-based+WTR
B
Figure 4-7. Trends of total dissolved Al concentrations in groundwater samples collected from a
WTR field study conducted in the Okeechobee watershed from (A) shallow and (B) deep
wells in an 18-mo study period (Agyin-Birikorang et al., 2009)
B
A

Final Report – Chemical Treatment
91
(2) WTR effects on biological systems
(a) Effects on grazing animals
Animal wastes contain P which can accumulate in pastures and eventually pollute nearby
water bodies (Sharpley, 1999; Haustein et al., 2000; Hyde and Morris, 2004). Several studies
have shown that application of WTRs increase the capacity of poorly-P sorbing soils to bind and
retain P (Elliott et al., 2002b; Makris et al., 2005a,b,c; Makris and O‟Connor, 2007), and
therefore can be used to reduce P solubility in pastures. However, the major concern here, is that
land application of WTRs containing large amounts of Al (particularly Al-WTRs) in pasture
could adversely affect P utilization and bone deposition in grazing livestock that inadvertently
consume Al-WTR. Several studies have shown that under grazing conditions, cattle can consume
as much as 10-15% of their dry matter intake as soil (Field and Purves, 1964; Healy, 1967,
1968). Consequently, surface applications of WTR could constitute a substantial portion of the
entire 10% of “soil” consumed by grazing cattle. Ingestion of highly available dietary Al (AlCl3)
by livestock can result in Al toxicity, often observed as P deficiency (Valdivia, 1977, 1978). In
sheep, for example, ingestion of soluble dietary Al suppressed voluntary feed intake, feed
efficiency, plasma P, animal growth, and gains (Rosa et al., 1982; Valdivia et al., 1982). Rosa et
al. (1982) observed that diets containing 0.25% P and 0.14% Al (as AlCl3) resulted in reduced
bone density in sheep (Rosa et al., 1982). High amounts of bioavailable Al can also negatively
impact the status of Fe, Zn, and Mg in sheep (Rosa et al., 1982).
Van Alstyne et al. (2007) evaluated the effects of ingested Al-WTR (8 g Al kg-1
feed) on
growth, feed intake, plasma P levels, tissue P concentrations, and apparent P absorption of
growing lambs, compared to the effects of ingested highly bioavailable source of Al (AlCl3).
Dietary administration of AlCl3 negatively impacted average daily gain, body weight, feed
intake, apparent absorption of P, and plasma P concentrations, whereas no adverse effects were
observed on lambs fed Al-WTR. The authors concluded that drinking-water treatment residuals
are not harmful when consumed in amounts up to 8000 ppm aluminum, and do not negatively
affect feed intake, body weight, or P availability.
In a field study, Madison et al. (2007) applied an Al-WTR to a pasture at a cumulative rate
of 78 Mg ha-1
, and evaluated the effects of dietary Al from the Al-WTR on the growth,
development, and production of cattle. Results showed that Al-WTR had no adverse effects on
cattle growth and development, and plasma mineral concentrations of the cattle (Table 4-1),
possibly due to low Al bioavailability of Al-WTR. The Al-WTR application did not adversely
affect forage mineral concentrations. The observations led to the conclusion that Al-WTR is safe
and could be applied to pastures at low to moderately high levels (~78 Mg ha-1
) to help alleviate
the environmental P problem in pastures (Madison et al., 2007).

Final Report – Chemical Treatment
92
Table 4-1. Plasma mineral concentrations of Yearling Holstein steers (beef cattle) as affected by
Al-WTR and P supplementation (Madison et al., 2007) Values represent mean values of 36
replicates.
Treatment† Day 0 Day 84 Day 148 Mean Std Dev.
Ca (mg dL-1
) 1
2
3
4
12.0
12.1
12.2
12.4
12.5
11.8
11.7
11.7
10.5
11.4
11.7
11.6
11.7
11.8
11.9
11.9
1.05
0.37
0.30
0.45
Mg (mg dL-1
) 1
2
3
4
2.30
2.47
2.40
2.53
2.70
2.50
2.42
2.65
2.07
2.44
2.33
2.38
2.36
2.47
2.38
2.52
0.32
0.03
0.05
0.14
P (mg dL-1
) 1
2
3
4
6.65
6.44
5.89
6.07
6.11
6.27
6.02
5.61
5.42
5.49
6.68
5.51
6.06
6.07
6.20
5.73
0.62
0.51
0.42
0.30
Al (μg dL-1
) 1
2
3
4
0.02
0.01
0.02
0.02
0.02
0.02
0.02
0.02
0.02
0.02
0.02
0.02
0.02
0.02
0.02
0.02
0.00
0.00
0.00
0.00
Cu (μg dL-1
) 1
2
3
4
0.89
0.94
0.99
0.93
0.81
0.82
0.82
0.80
0.77
0.77
0.08
0.89
0.82
0.84
0.88
0.87
0.06
0.09
0.09
0.07
Zn (μg dL-1
) 1
2
3
4
1.79
1.65
1.73
1.84
1.85
1.82
1.89
1.94
2.04
1.75
2.02
2.10
1.89
1.74
1.88
1.93
0.13
0.09
0.15
0.15 †Treatments were as follows: 1) control (no Al-WTR application) with steers receiving
commercial free-choice mineral supplement, minus P, 2) control with free-choice mineral
supplement, plus P, 3) treatment 1 with Al-WTR and 4) treatment 2 with Al-WTR.
(b) Effects on plants
Among the primary concerns over the land application of WTRs are the potential for
induced plant P deficiencies and Al toxicity (Basta et al., 2000). Studies dealing with effects of
land-applied WTRs on crop yields have been contradictory. Several studies have shown
decreased crop yields due to soil amendment with WTR (Elliott and Singer, 1988; Heil and
Barbarick. 1989; Ippolito et al., 1999; 2002), whereas no WTR effects were observed in other
studies (Harris-Pierce et al., 1993; 1994; Novak et al., 1995; Naylor and Carr, 1997; Brown and
Sartain, 2001; Oladeji et al., 2006). Heil and Barbarick (1989) applied WTR at rates of 0 to 25 g
kg-1
to sorghum–sudangrass [Sorghum bicolor (L.) Moench-Sorghum x drummondii (Steudel)
Millsp. and Chase] grown in two soils in a greenhouse study, and observed P deficiencies at the
highest rate of WTR application. By doubling the P fertilizer added to the highest WTR rate,
sorghum–sudangrass produced 29% greater yield than previously observed, indicating an
Final Report – Chemical Treatment
93
adsorption effect by the WTR. Elliott and Singer (1988) and Bugbee and Frink (1985) found
reduced P concentrations in tomato (Lycopersicon esculentum L.) and lettuce (Lactuca sativa L.)
grown in WTR-amended potting media. Cox et al. (1997) reported that WTR application rates
greater than 4.5 g kg-1
decreased yields of wheat, even with P fertilizer additions. Rengasamy et
al. (1980) observed germination problems and P uptake reductions in maize (Zea mays L.) when
Al-WTR was applied (up to 40 Mg ha-1
). Similarly, Lucas et al. (1994) reported decreases in
fescue grass (Festuca ovina ‘glauca’) yields in WTR-amended soil columns (up to 80 Mg ha-1
),
apparently in response to decreasing plant-available P. Ippolito et al. (1999) conducted a
greenhouse study to investigate the effects of co-application of Al-WTR and biosolids on two
native short grass species (blue gramma-Bouteloua gracilis, and western wheatgrass-
Pascopyrum smithii). Results suggested a linear negative relationship between increasing WTR
rate and shoot P concentrations (Ippolito et al., 1999). In a follow up study, Ippoloto et al. (2002)
quantified effects of co-applied WTR and biosolids on biomass production and on P uptake of
blue grama (Bouteloua gracilis) and western wheatgrass (Agropyron smithii). The WTR reduced
P availability to blue grama and western wheatgrass even when co-applied with biosolids, which
were expected to provide plant available P.
In contrast to the above observations, other researchers observed that when Al-WTRs were
applied to forests at rates ranging from 0.8 to 2.5 g kg-1
, the WTRs had no effect on growth or
nutrient content of the plants (Bugbee and Frink, 1985, and Novak et al., 1995). Other studies
have shown that application of >10g WTR kg-1
(>20 Mg WTR ha-1
) reduced tissue P
concentrations, but did not induce other nutrient deficiencies or toxicities (Elliott and Singer,
1988; Heil and Barbarick, 1989; Cox et al., 1997). In a 7-year study, Naylor and Carr (1997)
reported insignificant effects of WTR applications (~20 Mg WTR ha-1
) on crop P nutrition.
Reductions in labile P concentrations were not accompanied by plant growth limitations in soils
amended with biosolids and Al-based WTR. Harris-Pierce et al. (1993; 1994) investigated the
effects of WTR and biosolids co-application on aboveground plant biomass of four dominant
shortgrass prairie species. No significant trends in the biomass or tissue concentrations of the
four species [blue grama (Bouteloua gracilis), western wheatgrass (Agropyron smithii),
buffalograss (Buchloe dactyloides), and fringed sage (Artemisia frigida)] were observed in plots
treated with WTR rates of 5.6 to 22.4 Mg ha-1
, when combined with 11.2 Mg ha-1
of biosolids.
Brown and Sartain (2001) showed that a 2.5 % by wt. (56 Mg ha-1
) Fe-WTR application rate
significantly reduced P leaching from applied fertilizer P to a United States Golf Association
(USGA) greens, but had minimal impacts on Bermuda grass P uptake. Oladeji et al. (2006)
evaluated agronomic impacts of different P sources co-applied with Al-WTR to Florida sands.
Three rates of WTR application (0, 22.4 and 56 Mg ha-1
oven dry basis), and P-source
application rate of ~224 kg P ha-1
were evaluated, using bahiagrass (paspalum notatum Fluggae)
and ryegrass (Lolium perenne L.) as test crops. Although P uptake by the two crops decreased
with increasing WTR application rate, the plant tissue concentrations were above critical P
concentrations of the grasses, and no negative WTR effects on growth of the grasses were
observed (Fig. 4-8).

Final Report – Chemical Treatment
94
0
1
2
3
4
5
6
7
Bahiagrass Ryegrass
Plants
Dry
ma
tte
r y
ield
(M
g h
a-1
)N-based (0% WTR) N-based (1% WTR) N-based (2.5% WTR)
P-based (0% WTR) P-based (1% WTR) P-based 2.5% WTR)
Control
a
d
bcc
bbc
cbc
d d
e e e
f
Figure 4-8. Effects of water treatment residuals (WTR) and P-source rates on dry matter yields of
Bahiagrass (paspalum notatum Fluggae) and ryegrass (Lolium perenne L.). Treatments
having the same letter(s) are not different by the Tukey multiple comparison at
significance level (α) of 0.05 (Oladeji, 2006).
The WTR application rates in the studies reviewed above were based on an arbitrary
WTR:soil ratio, with little account taken of the chemical composition of the materials in arriving
at the WTR rates. Each drinking water treatment plant uses different source water and different
treatment processes (types and amounts of chemicals), producing WTRs with different chemical
compositions and P sorption capacities. Several studies have shown that WTRs largely differ in
their chemical characteristics, resulting in differences in P sorption capacities among WTRs
(Dayton et al., 2003; Makris and O‟Connor, 2007). Therefore application rates of WTR solely
based on dry weight percentages (or fixed soil: amendment ratio) can result in excessive or
inadequate immobilization of soil soluble P depending on the amount and reactivity of Al and or
Fe added in the WTRs. Knowing the correct amount of WTR to land apply is critical because
over application of the residuals can lead to excessive immobilization of soil P and induce plant
P deficiencies. The consensus among researchers is that if soils can be managed to maintain the
STP at level that optimize crop yields, the risk of offsite P transport could be minimized (Higgs
et al., 2000, O‟Connor and Elliott, 2006). Thus, WTR should be applied at a rate that will not
reduce readily available soil P below plants needs.
In addition to agronomic limitations involving P (over-applied WTRs induced plant P
deficiencies); there are concerns about potential Al phytotoxicities when Al-WTRs are used.
Soluble Al has been implicated as the most common source of phytotoxicity, and a common
yield-limiting factor in acid soils (Arkin and Taylor, 1981). Aluminum is a phytotoxic element

Final Report – Chemical Treatment
95
when present at excess concentrations in solution. Cornell (1992) recommended a Morgan soil
test Al values in the range of about 1 to 50 mg kg-1
as normal, with values >50 mg kg-1
being
excessive, but not necessarily phytotoxic. Few data exist on the potential for WTRs to cause Al
phytotoxicity. Ippolitto et al. (1999) reported that no Al toxicity symptoms were observed when
Al-WTR was co-applied with biosolids to grow blue gramma (Bouteloua gracilis), and western
wheatgrass (Pascopyrum smithii). Increasing WTR application rate (from 0 to 22.4 Mg ha-1
)
produced an increase in blue grama Al concentration, but no effect on Al concentration in
western wheatgrass (Ippoloto et al., 2002). Oladeji (2006) studied the impact of an applied Al-
based WTR (56 Mg WTR ha-1
) on Al concentrations and the potential for Al toxicity of
bahiagrass (paspalum notatum Fluggae) and ryegrass (Lolium perenne L.) cropped for four
growing seasons. The applied Al-WTR did not affect the Al concentrations of the plants in any
cropping. Plants Al concentrations in treatments that received no WTR were similar to those
where WTR was applied (Oladeji, 2006). The expected antagonistic effects of increased Al
uptake in reducing the concentrations of other cations (e.g. Ca and Mg) in plants were not
observed, confirming that the plants did to take up excessive Al from the WTR amended soil
(Oladeji, 2006). The phytotoxic Al species (Al3+
) is expected in soil solution with pH ≤ 4.0
(Kennedy and Cooke, 1982). Thus, at the commonly encountered pH range of Al-WTRs (5-8.2,
Table 4-2), the less toxic Al species (Al(OH)2+
, Al(OH)2 +, Al(OH)3) will likely predominate in
WTR amended soils (Lindsay and Walthall, 1996; Vance et al., 1996). In addition, complexation
of Al with organic matter in the WTR could further reduce the free Al3+
concentrations (Dong et
al., 1995; Lindsay and Walthall, 1996; Vance et al., 1996; Fest et al., 2007).
IMPLEMENTATION ISSUES
What P concentrations and/or species will respond to WTR treatment cost effectively?
Theoretically, all P concentrations could respond to WTR treatment. We and others have
conducted studies with initial P concentrations as great as several hundred mg P/L, and shown
almost complete removal of initial P with most, but not all, WTRs. Total added P loads as great
as 5 g P/kg WTR resulted in essentially complete P removal from solution. Full attainment of
sorption equilibrium (maximum sorption potential) requires a few days, but essentially
irreversible binding of the sorbed P requires additional time (a few weeks) as initially sorbed P
apparently diffuses into micropores within the WTRs. Thus at equilibrium, a million liters of
water containing 5 mg P/L (5 kg of P) could be treated to essentially zero P with about 1 Mg of
WTR.
Almost all our work has focused on solutions prepared with ortho-P, or soils fertilized or
amended with manures or biosolids, where ortho-P still dominates soluble P. In one study,
however, we used a soil containing abundant DOC (nearly 110 mg/L). P retention by WTR was
reduced by at least 20%. We did not pursue the possible impact of DOC on WTR effectiveness,
or the effect of unusually high concentrations of competing inorganic species and cannot directly
address possible impacts. Our normal adsorption isotherm procedure, however, includes 0.01M
KCl as a background matrix, which would supply abundant Cl- to potentially compete with P for
adsorption sites. We do not expect significant interferences with P retention by WTRs by
inorganic species or DOC concentrations normally present in most waters or soils. Soils (or
,possibly, waters with abundant DOC, however, may be another issue).

Final Report – Chemical Treatment
96
WTRs are most effective in reducing orthophosphate (PO4-P) concentration. Several studies
conducted in Florida and elsewhere (e.g. Michigan) has demonstrated WTRs‟ efficacy in
reducing biological available P (BAP). For examples in a study involving Immokalee soil (a
typical Florida Spodosol), WTR amendment reduced BAP concentrations by ~80%, compared to
plots without WTR amendment. The effectiveness of WTRs in reducing total dissolved P (TDP)
is often more modest (50-70%), particularly when the TDP includes organic P. WTR additions
minimally affect soil total P and some soil test P (STP) values. The total P and STP extractants
are sufficiently rigorous to dissolve WTR particles and extract P otherwise immobilized by, or
contained in, the WTR, thus making the WTR technique appear to be ineffective. Since the
ortho-P species are the most labile P forms, and are the species likely to cause environmental
problems, focus on WTR effectiveness should be on that P species, instead of TDP, STP, or TP.
Although WTR adsorbs tremendous amount of P, and does not readily release P back into the
environment, P loadings in excess of WTR P retention capacity could result in off-site P losses
from WTR amended soils. Each treatment plant uses different source water and different
treatment chemicals and processes, producing WTR with different physical and chemical
compositions (Table 4-2), and P sorption capacities (Townsend et al., 2001; Dayton et al., 2003;
Makris and O‟Connor, 2007). Thus, P masses removed by WTR depend on the chemical
characteristics of the WTR.
Where in the KOE planned features can WTR treatment be applied?
WTRs can be used in a variety of scenarios to reduce P losses (e.g., surface applications with, or
without, soil incorporation, to augment buffer strips, etc.), but may be most cost effectively used
at the terminal end of drainage systems (ditches or retention basins). This concept can be
implemented at the Kissimmee and Okeechobee watersheds. The Lake Okeechobee Protection
Plan (LOPP, 2008) presented a basin-wide assessment of P loads contributed by each of the 34
sub-watersheds. The assessment identified several priority basins that contribute a significant P
load despite relatively low surface water flows. Hundreds of drainage ditches within these basins
are monitored for P concentrations by the SFWMD and other agencies. Careful assessment of
these data, combined with an inventory of soil P in the basin and limited additional surface water
flow and load monitoring will support selection of field- or ranch-scale sites to implement P
reduction measures. Several phosphorus “hot spots” exist in the watershed (e.g., Zhang et al.,
2002; Hiscock et al., 2003), and WTR land application should target these “hot spots.
What water quality parameters affect WTR treatment P-reduction efficiency? Do we have
sufficient existing data or is additional data required?
The dissolved organic carbon (DOC) and suspended solids content of the raw water are the
parameters likely to affect the efficiency of WTR treatment of water with high P content.
Exceptionally high doses of WTR are likely needed to remove P in waters with high DOC
concentration. Phosphorus removal by WTRs is extremely efficient when the P species in the
raw water is dominated by PO4-P, and at P concentrations up to several mg P L-1
. The pH of the
soil or water can also affect WTR performance, but P-removal efficiency is essentially
independent of pH within the pH range of 4-7.

Final Report – Chemical Treatment
97
There is insufficient existing data concerning the impacts of raw water characteristics on WTR
effectiveness, and more data is needed.
What water quality standards must be met for chemically treated discharges to various
receiving waters?
With the exception of P removed from raw water by WTRs, no other chemical characteristics of
the treated water are affected. WTR treated water has been shown to have no elevated aluminum
concentrations. WTR treatment is also effective in removing arsenic and perchlorate in
contaminated water, and may be effective in removing some soluble toxic organics like
pesticides.
What is the best aerial economy of scale for treatment system implementation?
Drinking-water treatment residuals can be usually be obtained from water treatment plants at
minimal, or no, cost. The main costs associated with the WTR treatment technique are
transportation of the material to the field and subsequent land application/incorporation. The
WTR application method (soil surface application or incorporation, use in augmented buffer
strips next to water bodies, or use as a permeable reactive barrier) will determine the overall
cost/kg of P removed because the masses of WTR required differ widely, as do the P masses
needing removal.
The quantity of WTR generated by water treatment plants in Florida not known precisely, but is
not likely to be sufficient to amend all P-impacted soils. Rather, careful assessment of the spatial
distribution and variability of water flow and P concentrations and loads in soils and surface
waters in the Okeechobee and Kissimmee watersheds are needed to identify phosphorus “hot
spots” and other high priority areas. Existing data from state and local agencies (FDACS,
SFWMD, USGS, FDEP) should be scrutinized in this regard. Additional field sampling and
monitoring may also be needed to assess P fluxes. Such data should be very useful in identifying
critical points where WTR use can be focused to make the best use of limited supplies.
Can WTR treatment be permitted?
Environmental concerns about the high contents of aluminum and arsenic of several Al-WTRs
produced in Florida compelled Florida DEP to issue a guidance memo on land application of
WTRs in Florida (FDEP, 2006). The memo expressed special concern about Al- and Fe-based
WTRs (minimal concern about Ca-based WTRs). Concerns focused on As and Al concentrations
in Fe- and Al-WTRs. If Al- or Fe-WTRs are to be land applied, Appendix A of the FDEP
Guidance is recommended to calculate the appropriate quantity of WTR to blend with soil.
Blend)(
)(
CB
BARatio
where A = concentration of contaminant in WTR (mg kg-1
),
B = target concentration in blend (mg kg-1
), and
C = concentration of contaminant in material blended (mg kg-1
)

Final Report – Chemical Treatment
98
The following calculations demonstrate the ease of meeting DEP‟s concerns:
For example, in the case of Arsenic: A = median As concentration in Al-WTRs from Townsend et al. (2001) = 11.3 mg kg
-1
B = residential soil cleanup target level for As = 2.1 mg kg-1
C = median soil concentration (448 surface FL soils measured by Chen et al. (2000) = 0.27 mg
kg-1
Blend 5)27.01.2(
)1.23.11(Ratio
Thus, if the desired WTR rate is 56 Mg ha-1
, one needs to blend a median Al-WTR with 5 X 56
Mg ha-1
= 280 Mg of soil. In a typical soil, 1 ha of soil 15 cm deep weighs ~2200 Mg
Therefore, one can calculate that 280/2200 X 15 cm = ~2 cm of soil in which the Al-WTR would
have to mixed (blended) to meet the SCTL for As. Deeper incorporation (more soil dilution)
reduces the amended soil As concentrations proportionally.
In the case of Aluminum: A = 142,000 mg kg
-1; B = 80,000 mg kg
-1 (both values from the FLDEP Guidance Memo); and
C = 1300 mg kg-1
(from Chen et al., 2000)
Blend 99.0)1300000,72(
)000,72000,142(Ratio
Thus, about equal masses of soil and Al-WTR would need to be blended, and the required 56 Mg
of soil can be calculated to be represented by only ~0.4 cm of soil. Clearly, the blending
calculations allow “safe” application of a median Al-WTR if mixed with < 5 cm of median FL
surface soil.
The FDEP Guidance Memo (Appendix A) also contains a procedure for calculating the
quantity of WTR to mix with top 6 inches of soil as:
)(
)(89.10
BA
CBRatenApplicatio s
where ρs = soil density = 1.33 g cm-3
, and the other terms are as defined previously.
For Arsenic:
600)1.23.11(
)27.01.2(33.189.10RatenApplicatio Mg Al-WTR ha
-1
For Aluminum:
3500)000,80000,142(
)300,1000,80(33.189.10RatenApplicatio Mg Al-WTR ha
-1
The blending calculations appear to justify land application of Al-WTRs at rates needed to
address off-site P loss issues without endangering human health. The Appendix A of the FDEP
guidance memo calculations easily justify the 56 Mg ha-1
rates shown to be effective in
controlling off-site P losses as long as at least some soil mixing is performed following WTR
addition.
Final Report – Chemical Treatment
99
Typical effective rates of WTR application to control P in Florida range between 22 –and
56 Mg ha-1
(equivalent to 10-25 tons/acre, or 1-2.5 % by weight). The median As concentration
in Florida Al-WTRs is 11.3 mg kg-1
and that of Al is 142, 000 mg kg-1
(Jain et al., 2005). Thus,
when Al-WTR is surface applied, and impacts only the top 5 cm of the soil, a total of 0.9 mg kg-1
As and 7000 mg kg-1
of Al is introduced into the soil. If, on the other hand, the Al-WTR is
incorporated into the soil to a depth of 15 cm, the maximum amount of As and Al soil
concentrations are 0.3 mg kg-1
and 2300 mg kg-1
, respectively. The metal soil concentrations
resulting from Al-WTR application (incorporated in 15 cm depth) are well below the residential
soil cleanup target limits of 2.1 and 72,000 mg kg-1
for As and Al, respectively. If the Al-WTR is
mixed with the top 15 cm of typical FL surface soils, the Al and As hazards are negligible, even
at high Al-WTR rates and for multiple years of application.
Other “non-issues”:
Jain et al. (2005) observed that total volatile and semi-volatile organic compounds
contained in WTRs, as well as nitrogen-, or phosphorus-, or chlorine-based pesticide
concentrations, were below detection limit (< 0.5 µg L-1
). Mean total Al concentrations in five
Al-WTRs were above the residential limits of 72,000 mg kg-1
, and SPLP-based leachable Al
concentrations were above the FGGC value of 0.2 mg L-1
for three out of five Al-WTRs (Jain et
al., 2005). At the pH of the Al-WTRs (5.0-8.2, Table 4-2), soluble Al is likely to be dominated
by hydrolyzing species of Al (Lindsay, 1979; Sloan et al., 1995; Lindsay and Walthall, 1996;
Vance et al., 1996), and organically complexed forms of Al (Dong et al., 1995; Lindsay and
Walthall, 1996; Vance et al., 1996; Fest et al., 2007), rather than free Al3+
. Thus, little free Al3+
will exist to leach from the soil surface-applied Al-WTR to contaminate water bodies. Mean
TCLP-based leachable barium (Ba), cadmium (Cd), chromium (Cr), copper (Cu), lead (Pb), zinc
(Zn), sodium (Na), and even molybdenum (Mo) concentrations in Fe-, Al-, and Ca-WTRs
collected in Florida (Table 4-2) were below the respective FGGC values (Jain et al., 2005), and
so were the mean leachable nickel (Ni) and mercury (Hg) concentrations (Jain et al., 2005).
Special attention has been given to Mo because relatively small forage-Mo concentrations can
induce Cu deficiency (molybdenosis) in grazing animals, if the forage Cu concentration is also
low (< 10 mg kg-1
) (Elliott and Taylor, 2000). State regulations in Pennsylvania mandate a
ceiling limit of 18 mg kg-1
Mo in WTRs for land application (Elliott and Taylor, 2000). Most Fe-
and Al-WTRs tested by Elliott et al. (1990a) had mean total Cr, Ni, Pb and Zn concentrations
within the ranges commonly found for several soils , implying that total metal soil concentrations
will remain largely unaffected by WTR application at typical loading rates. In addition, air-dried
Fe- and Al-based WTRs usually contain small numbers of coliforms (< 20 coliforms g-1
) arising
from air-drying, long-term storage, and chlorine addition during the drinking-water purification
process (Elliott and Dempsey, 1991) so pathogens are not a problem.

Final Report – Chemical Treatment
100
Table 4-2. Selected chemical properties of Drinking-Water Treatment Residuals
Properties Al-Based Fe-based Ca-based Reference
pH 5.0 - 8.2 4 - 9.2 8.4 - 11.4 1-8
KCl-P (mg kg-1
) 2.2 – 5.6 6.2 – 6.3 0.8-1.6 1,5,7
Total C
----
----
----
----
----
--m
g k
g-1
----
----
----
----
----
----
----
----
----
----
g k
g-1
----
----
----
----
----
----
--
---
8.5 - 225 94 – 206 114-201 1,2,3,4
Total N 3.0 – 10.0 5.0 – 11.0 0.3-1.2 1,5,7.
Total Al 15 - 300 2.2 – 10.0 0.3-14 1,2,3,5,6,7,8
Total Fe 5.0 – 66 109 – 251 0.4-1.4 1,2,3,5,6,7,8
Total Ca 3.0 – 50 16.4-17.5 310 - 520 2,5
Total P 0.2 – 4.4 0.3 – 3.2 0.04 - 0.2 1,2,3,5,7
Oxalate Al 1.3 - 91 0.2 – 9.8 0.03-0.6 1,2,5,7
Oxalate Fe 2.3 – 5.8 108 – 195 0.35-0.5 1,2,5,7
Oxalate P 0.05 – 3.0 0.15 – 2.6 0.05-0.9 1,2,5,7
Total As 8.5-17.0 2.0-10.0 0.2-5.0 4,6,8
Total Cd 0.4-3.0 1.8-5.7 0.3-0.8 4,6,8
Total Ba 15.5-320 15.1-58.2 18.3-211 4,6,8
Total Cr 55.2-174 17.0-152 1.0-13.0 4,6,8
Total Cu 15.0-64.0 24.0-413 1.5-31.5 4,6,8
Total Pb 2.65-11.8 1.36-4.85 0.32-1.77 4,6,8
Total Mo 62.5-500 55.2-166 55.2-146 4,6,8
Total Zn 14.2-26.9 8.31-33.6 3.92-23.8 4,6,8
Total Na 36.4-1100 79.3-265 66.5-4120 4,6,8
1. Agyin-Birikorang, 2006
2: Dayton et al., 2003.
3: Elliott and Dempsey, 1991
4. Elliott et al., 1990a
5: Elliott et al., 2002a.
6. Jain et al., 2005
7. Makris, 2004
8. Townsend et al., 2001

Final Report – Chemical Treatment
101
What are the monitoring requirements of planned solutions?
No monitoring requirement has been assigned to land application of WTR. WTRs are
specifically exempt from the 40 CFR Part 503 land disposal regulations for biosolids (USEPA,
1996). Thus, WTRs can be land-applied without having to meet metal limitations of the Part 503
regulation. However, routine monitoring should be conducted frequently to ensure that water
quality goals of the WTR land application are being met.
What are the cost-benefits of planned solutions?
Phosphorus removal cost of WTR land application is among the lowest of all the existing
chemical treatments. As mentioned previously, WTRs can be obtained at no cost, and the only
costs associated with WTR use are the transportation and application costs. With the efficiency
of P removal by WTRs, a typical cost of P removal by WTRs will likely be in the range of $10-
25/kg P removed, depending on the chemical characteristics on the WTR.
What factors affect settling and residuals management?
Land application of WTRs is most effective in reducing excess P when the WTR particles come
into direct contact with P. Several management practices are used to control excess P with
WTRs. One approach is to surface-apply WTR to reduce transport of P in agricultural runoff
water. Another approach is to incorporate WTR into soil to reduce legacy P solubility and
prevent P leaching. Addition of WTR as an enhanced buffer strip is also a management practice
to greatly reduce P in runoff water. Beneficial use of WTR has also been expanded to reduce the
solubility of P in organic soil amendments, such as manure or biosolids. Co-blending WTR with
manure or biosolids before land application can reduce the solubility of P in the manure or
biosolids, thereby reducing P release from the manure or biosolids to water bodies.
Presently, only “aged” WTRs (those left or manipulated to dewater) are land applied. Although
few adverse Al-WTR effects have been reported on plants, and no effects on grazing animals
(apparently because of low availability of free Al3+
in Al-WTR), data generated so far suggests
that only dewatered (≥ 6 mo old) Al-WTRs should be land applied to minimize overall potential
ecological Al risk.
What further studies are needed for WTR use?
Effective phosphorus control strategies can only be implemented by understanding the storage,
fate, and transport of phosphorus in uplands, ditches, wetlands, and streams of the watershed.
Upland soils in the Lake Okeechobee drainage basin are predominantly poorly-drained, sandy
Spodosols. Approximately 80% of the total phosphorus in the basin is stored in soils in both
stable and unstable forms. However, gaps remain in our understanding of the specific transport
pathways that sequentially conduct P first from surface soils to groundwater, then from
groundwater to surface water in drainage ditches, and finally through the ditch network to the

Final Report – Chemical Treatment
102
Lake. Ditch networks are used throughout the basin for drainage and irrigation purposes. This
network has effectively modified the hydrologic regime of extensive areas and affects the
detention time of stormwater throughout the basin. The ditch system serves as a rapid conduit
for transport of phosphorus to Lake Okeechobee.
Phosphorus in the soil is transported by infiltrating rainfall to the groundwater. The extensive
network of ditches drains the watershed primarily by intercepting groundwater, rather than by
collecting overland flow. A study is need to evaluate effective methods to intercept P before it
contaminates water in the ditches using WTR as permeable reactive barrier (PRB) walls for the
interception and long-term sequestration of P before water entering the ditches. Permeable
reactive barriers are a proven technique for groundwater remediation (Benner et al., 1997,
O‟Hannesin and Gillham 1998, Puls et al., 1999, Dennehy et al., 1999, Blowes et al., 2000,
Guerin et al., 2002, Lai et al., 2005). The lifespan of a successful PRB is expected to be
measured in decades. Other important advantages of this technology are that PRBs are
completely passive and do not require continual maintenance after installation. Furthermore,
because PRBs are installed in the subsurface, they are transparent to the land user and do not
require any land use concessions. The use of WTRs in permeable reactive barriers is a
conceptual alternative at this time.
For the Lake Okeechobee and Kissimmee Basins, two distinct PRB configurations could be
used: 1) traditional permeable walls buried below ground surface (referred to here as a buried-
wall PRB), and 2) sorbents incorporated into soils as ditch linings (ditch-lining PRB). Both
configurations will serve to intercept phosphorus in the groundwater before entering water
carried by drainage ditches.
Materials for PRB construction should have high affinity for phosphorus, including long-term
stability, and should have appropriate hydraulic characteristics to enable adequate water flow.
Apparently, WTRs possess these qualities but should be tested both for their phosphorus sorption
kinetics, and hydraulic properties for use in constructing PRB walls. WTRs could be combined
with higher permeability materials (such as soil collected from site) as necessary and the
combined materials tested to assess phosphorus stability.
SUMMARY
Land application of WTR is an attractive and inexpensive alternative means of WTR disposal in
Florida and may have the added benefit of immobilizing P and other oxyanions in poorly sorbing
soils. There is abundant evidence that WTRs are effective in controlling off-site P losses from
poorly P-sorbing soils. Phosphorus diffuses into the micropores of the WTR particles, becomes
irreversibly bound, and is stable long-term. The high total As and Al contents of some WTRs,
particularly Al-WTRs, has been viewed as a major concern for continued land application of
WTRs. However, studies have shown that As and Al contained in WTRs are non-labile, and that
Al-WTRs effectively immobilize labile As in As-contaminated soils. Drinking-water treatment
residuals also have no adverse effects on grazing livestock (sheep and cattle), and on runoff and
groundwater Al concentrations. When WTR application rates are based on the chemical
composition of the WTR, rather than on arbitrary WTR:soil ratios, no adverse WTR effects on

Final Report – Chemical Treatment
103
dry-matter yield of plants will be observed. We conclude that WTR is an effective soil
amendment that can be used to control off-site P movement to surface and groundwater, and that
land application of WTR at appropriate rates is environmentally safe and will not adversely
affect growth of plants and grazing animals.
Alum-based WTRs (Al-WTRs) are preferable to Fe- and Ca-WTR, therefore, an inventory of
water treatment plants that utilize alum as coagulant within a reasonable proximity to the Lake
Okeechobee Basin should be done to estimate the volumes and qualities of WTRs produced.
Considering the apparent small volume of Al-WTR produced in Florida, and to minimize
haulage costs, there is a need to pursue the investigation of permeable reactive barriers, and
enhanced buffer strips using Al-WTRs, to control P losses to surface water bodies.
REFERENCES
Agyin-Birikorang S. 2006. Lability of drinking-water treatment residuals (WTR) immobilized
phosphorus: implications for long-term stability. PhD diss. Univ. Florida. Gainesville, FL.
Agyin-Birikorang, S., O‟Connor, G.A., 2007. Lability of drinking-water treatment residuals
(WTR) immobilized phosphorus: Aging and pH effects. J. Environ. Qual. 36:1076-1085.
Agyin-Birikorang, S., O‟Connor, G.A., 2008. Aging effects on the reactivity of an aluminum-
based drinking-water treatment residuals. Science of the Total Environ. Science of the Total Environ. http://dx.doi.org/10.1016/j.scitotenv.2008.09.025
Agyin-Birikorang, S., O'Connor, G.A., Jacobs, L.W., Makris, K.C., Brinton, S.R., 2007. Long-
term phosphorus immobilization by a drinking water treatment residual. J. Environ. Qual.
36:316-323.
Agyin-Birikorang, S., O‟Connor, G.A., Oladeji, O.O., Obreza, T.A., Capece, J.C., 2008.
Drinking-water treatment residuals (WTR) effects on the phosphorus status of field soils
amended with biosolids, manure, and fertilizer. Commun. Soil Sci. Plant Anal. 39:1700-
1719.
Agyin-Birikorang, S., O.O. Oladeji, G.A. O’Connor, T.A. Obreza, and J.C. Capece. 2009. Efficacy of drinking-water treatment residual in controlling off-site phosphorus losses: A field study in Florida J. Environ. Qual. (in press).
Anderson, D.L., Tuovinen, O.H., Faber, A., Ostrokowski, I., 1995. Use of soil amendments to
reduce soluble phosphorus in dairy soils. Ecol. Eng. 5:229-246.
Ann, Y., Reddy, K.R Delfino, J.J., 2000. Influence of chemical amendments on phosphorus
immobilization in soils from a constructed wetland. Ecol. Eng. 14:157-167.

Final Report – Chemical Treatment
104
Arkin, G.F., Taylor, H.M., 1981. Modifying the root environment to reduce crop stress. ASAE
Monograph No. 4, American Society of Agricultural Engineers, St. Joseph, MI.
Baker, M.J., D.W. Blowes, and C.J. Ptacek. 1997. Phosphorus adsorption and precipitation in a
permeable reactive wall: application for wastewater disposal systems. Land
Contamination and Reclamation, 5: 189-193.
Barker, J.C., Zublena, J.P., 1995. Livestock manure nutrient assessment in North Carolina, 1995.
Proc. 7th Int. Symp. Agric. Wastes. Trans. ASAE, St. Joesph, MI, pp. 98-106.
Basta, N.T., Storm, D.E., 1997. Use of alum residuals to reduce nutrient runoff from agricultural
land treated with animal manures to protect surface water quality. In: Proc. 1997 Water
Residuals and Biosolids Management: Approaching the Year 2000. Water Environment
Federation/American Water Works Association Joint Specialty Conf., Philadelphia. 3-4
Aug. 1997. WEF, pp. 19-28.
Basta, N.T., Zupanic, R.J., Dayton, E.A., 2000. Evaluating soil tests to predict bermudagrass
growth in drinking water treatment residuals with phosphorus fertilizer. J. Environ. Qual.
29:2007-2012.
Benner, S.G., 1997. A full-scale porous reactive wall for prevention of acid mine drainage.
Ground Water Monitoring and Remediation, 17(4): 99-107.
Blowes, D.W., Ptacek, C.J., Benner, S.G., McRae, C.W.T., and Puls, R. W. 2000. Treatment of
dissolved metals and nutrients using permeable reactive barriers. Journal of Contaminant
Hydrology (45) 1-2, 123-137.
Brown, E., Sartain, J.B., 2001. Phosphorus retention in United States Golf Association (USGA)
greens. Proc. Soil Crop Sci. Soc. Fla. 59:112-117.
Bugbee, G.J., Frink, C.R., 1985. Alum sludge as a soil amendment: Effects on soil properties and
plant growth. Bull. 823. Connecticut Agric. Exp. Stn., New Haven, CT.
Burns, R.T., Moody, L.B, Walker, F.R., Raman, D.R., 2001. Laboratory and in-situ reductions of
soluble phosphorus in swine waste slurries. Environ. Technol. 22:1273-1278.
Butkus, M.A., Grasso, D. Schulthess, C.P, Wijnja, H., 1998. Surface complexation modeling of
phosphate adsorption by water treatment residual. J. Environ. Qual. 27:1055-1063.
Carol, H.T., Arnold, K.F., 1990. Health and aesthetic aspects of water quality. In: Pontius, F.W.,
(Ed.), Water Quality and Treatment (A Handbook of Community Water Supplies by
AWWA), McGraw-Hill, New York, pp. 64-154.
Chardon, W.J., Schoumans, O.F., Koopmans, G.F., 2000. Soil phosphorus saturation index:
background, applications, and limitations. In: 2000 Annual Meeting abstracts. ASA,
CSSA, and SSSA, Madison, Wisconsin, p. 321.

Final Report – Chemical Treatment
105
Chwirka, J.D., Narasimhan, R., Scheuer, N. Rousseau, G., 2001. The impact of residuals on the
selection of an arsenic treatment process. WEF/AWWA/CWEA Joint Residuals and
Biosolids Management Conference. Biosolids 2001: „Building Public Support”.
Codling, E.E., Chaney, R.L., Mulchi, C.L., 2000. Use of aluminum and iron-rich residues to
immobilize phosphorus in poultry litter and litter-amended soils. J. Environ. Qual.
29:1924-1931.
Cornell, 1992. Cornell recommendations for field crops. New York State College of Agriculture
and life sciences, Cornell University, Ithaca, NY.
Cox, A.E., Camberato, J.J., Smith, B.R., 1997. Phosphate availability and inorganic
transformation in an alum sludge-affected soil. J. Environ. Qual. 26:1393-1398.
Dayton, E.A., Basta, N.T., Jakober, C.A., Hattey, J.A., 2003. Using treatment residuals to reduce
phosphorus in agricultural runoff. J. Am. Water Works Assoc. 95:151-158.
Dayton, E.A., Basta, N.T., 2005a. A method for determining the phosphorus sorption capacity
and amorphous aluminum of aluminum-based drinking water treatment residuals. J.
Environ. Qual. 34.1112-1118.
Dayton, E.A., Basta, N.T., 2005b. Use of drinking water treatment residuals as a potential best
management practice to reduce phosphorus risk index scores. J. Environ. Qual. 34: 2112-
2117.
Dong, D., Ramsey, M.H., Thornton, I., 1995. Effects of soil pH on aluminum availability in soils
and its uptake by soybean plant (Glycine max). J. Geochemical Exploration 55:223-230
Dosskey, M.G., Helmers, M.J., Eisenhauer, D.E., Franti, T.G., Hoagland, K.D., 2002.
Assessment of concentrated flow through riparian buffers. J. Soil Water Conserv. 57:336-
343.
Driscoll M., Driscoll, D.F., 2005. Calculating aluminum content in total parenteral nutrition
admixtures. Am. J. Hlth-Syst. Pharm. 62:312-315.
Elliott, H.A., Dempsey, B.A., 1991. Agronomic effects of land application of water treatment
sludges. J. Am. Water Works Assoc. 83:126-131.
Elliott, H.A., Singer, L.M., 1988. Effect of water treatment sludge on growth and elemental
composition of tomato shoots. Commun. Soil Sci. Plant Anal. 19:345-354.
Elliott, H.A., Taylor, M., 2000. Molybdenum content of water treatment residuals. J. Environ.
Qual. 29: 1835-1839.
Elliott, H.A., O‟Connor, G.A., Brinton, S., 2002a. Phosphorus leaching from biosolids amended
sandy soils. J. Environ. Qual. 31:681-689.
Final Report – Chemical Treatment
106
Elliott, H.A., O'Connor, G.A. Lu, P., Brinton, S., 2002b. Influence of water treatment residuals
on phosphorus solubility and leaching. J. Environ. Qual. 31:1362-1369.
Elliott, H.A., Dempsey, B.A., DeWolfe, J.R., 1988. Land disposal of drinking water sludge.
ASAE no. 88-2579:1-13. Am. Soc. of Agric. Eng., St. Joseph, MI.
Elliott, H.A., Dempsey, B.A., Maile, P.J., 1990a. Content and fractionation of heavy metals in
water treatment sludges. J. Environ. Qual. 19:330-334.
Elliott, H.A., Dempsey, B.A., Hamilton, D.W., DeWolfe, J.R., 1990b. Land application of water
treatment sludges: Impact and management. Am. Water Works Assoc. Res. Foundation,
Denver, CO.
Fest, E.P.M.J., Temminghoff, E.J.M,. Griffioen, J., van Der Grift, B., van Riemsdijk, W.H.,
2007. Groundwater chemistry of aluminum under Dutch sandt soils: Effects of land use
and depth. Applied Geochemistry 22:1427-1438.
Field, A.C., Purves, D., 1964. The intake of soil by grazing sheep. Proc. Nutr. Soc. 23:24-25.
Florida Department of Environmental Protection. 2006. Guidance for land application of
drinking water treatment plant sludge. Florida Department of Environmental Protection
Solid Waste Section and Drinking Water Program Tallahassee, Florida
Gallimore, L.E., Basta, N.T., Storm, D.E., Payton, M.E., Huhnke, R.H., Smolen, M.D., 1999.
Use of water treatment residuals to reduce nutrients in surface runoff from agricultural
land. J. Environ. Qual. 28:1474-1478.
Guerin, T.F, S. Horner, T. McGovern, and B. Davey. 2002. An application of permeable reactive
barrier technology to petroleum hydrocarbon contaminated groundwater. Water Res.
36:15-24.
Hansen, N. C., Daniels, T.C., Sharpley, A.N., Lemunyon, J.L., 2002. The fate and transport of
phosphorus in agricultural systems. J. Soil Water Conserv. 57:408-416.
Harris-Pierce, R., Barbarick, K.A., Redente, E.F., 1993. The effect of sewage sludge application
on native rangeland soils and vegetation. Annual Report Meadow Springs Ranch, Fort
Collins, CO.
Harris-Pierce, R.; Barbarick KA, Redente, E.F., 1994. The effect of sewage sludge application
on native rangeland soils and vegetation, Fort Collins Meadow Springs Ranch; City of Fort
Collins, CO, 1994 Annual Report.
Haustein, G.K., Daniel, T.C., Miller, D.M., Moore, Jr., P.A., McNew, R.W., 2000. Aluminum-
containing residuals influence high phosphorus soils and runoff water quality. J. Environ.
Qual. 29: 1954-1959.
Healy, W.B., 1967. Ingestion of soil by sheep. Proc. New Zealand Soc. Anim. Prod. 27:109-115.

Final Report – Chemical Treatment
107
Healy, W.B., 1968. Ingestion of soil by dairy cows. New Zealand. J. Agr. Res. 11:487-490.
Heil, D.M., Barbarick, K.A., 1989. Water treatment sludge influence on the growth of sorghum-
sudangrass. J. Environ. Qual. 18: 292-298.
Higgs, B., Johnston, A.E., Salter, J.L., Dawson, C.J., 2000. Some aspects of achieving
sustainable phosphorus use in agriculture. J. Environ. Qual. 29:80-87.
Hiscock, J.G., C.S. Thourot, and J. Zhang. 2003. Phosphorus budget - land use relationships for
the northern Lake Okeechobee watershed, Florida, Ecological Engineering 21: 63-74.
Hoge, V.R.; Conrow, R., Coveney, M., Peterson, J., 2003. The application of alum residual as a
phosphorus abatement tool within the lake Apopka restoration area. WEF Proceedings
Conference, Alexandria, VA,
Hooda, P.S., Rendell, A.R, Edwards, A.C., Withers, P.J., Aitken, M.N., Truesdale, V.W., 2000.
Relating soil phosphorus indices to potential phosphorus release to water. J. Environ. Qual.
29:1166-1171.
Hughes, J.C., Titshall, L.W., Buyeye, M., Johnston, M.A., Moodley, M., Pecku, S., 2005. Effects
of Land Application of Water Treatment Residue. Report 1148/1/05. Water Research
Commission, Pretoria.
Hyde, J.E., Morris, T.F., 2000. Phosphorus availability in soils amended with dewatered water
treatment residual and metal concentrations with time. J. Environ. Qual. 29:1896-1904.
Hyde, J.E., Morris, T.F., 2004. Phosphorus availability from phosphorus-amended water
treatment residual. Commun. Soil. Sci. Plant Anal. 35:1033-1046.
Ippolito, J. A., Barbarick, K.A., Heil, D.M., Chandler, J.P., Redente, E.F., 2003. Phosphorus
retention mechanisms of a water treatment residual. J. Environ. Qual. 32:1857-1864.
Ippolito, J.A., Barbarick, K.A., 2006. Phosphorus extraction methods from water treatment
residual-amended soil. Commun. Soil Sci. Plant Anal. 37:859-870.
Ippolito, J.A., Barbarick, K.A., Redente, E.F., 1999. Co-application effects of water treatment
residuals and biosolids on two range grasses. J. Environ. Qual. 28:1644-1650.
Ippolito, J.A, Barbarick, KA, Redente, E.F., 2002. Combinations of water treatment residuals
and biosolids affect two range grasses. Commun. Soil Sci. Plt. Anal. 33: 831-844.
Jain, P., Yong-Chul, J., Thabet, T., Witwer, M., Townsend, T., 2005. Recycling of water
treatment plant sludge via land application: assessment of risk. J. Res. Sci. Technol., 2: 13-
23.
Kawczyinski, E., Achtermann, V., 1991. A water industry database report on residuals handling.
In Proc. of the AWWA/WEF Joint Residuals Conf. Durham, NC. 11-14 Aug. American
Water Works Association, Denver, Colorado, p. 6b-1 to 6b-5.

Final Report – Chemical Treatment
108
Kellogg, R.L., Lander, C.H., Moffitt, D.C., Gollehon, N., 2000. Manure nutrients relative to the
capacity of cropland and pastureland to assimilate nutrients: Spatial and temporal trends
for the United States. USDA-NRCS-ERS Publ. npsO0-0579.
Kennedy, R., Cooke, G., 1982. Control of lake phosphorus with aluminum sulfate: Dose
determination and application techniques. Water Resour. Bull. 18:389-395.
Lai, C. K., I. M. C. Lo, V. Birkelund, and P. Kjeldsen. 2005 Field Monitoring of Permeable
Reactive Barrier for removal of Chlorinated Organics, J. of Environmental Engrg., ASCE,
132: 199-210.
Lake Okeechobee Protection Plan (LOPP), 2008, FDACS, FDEP, SFWMD,
https://my.sfwmd.gov/portal/page?_pageid=2294,4946970,2294_4947241&_dad=portal&
_schema=PORTAL
Lindsay, W.L. 1979. Chemical Equilibria in Soils. John Wiley and Sons. New York, NY.
Lindsay, W.P., Walthall, P.M., 1996. Solubility of aluminum in soils p 333-360. In: Sposito, G.,
(Ed.). Environmental Chemistry of Aluminum (2nd
ed.). CRC Press Inc. Boca Raton, FL
Livesey, N.T., Huang, P.M., 1981.Adsorption of arsenate by soils and its relationship to selected
chemical properties and anions. Soil Sci. 131: 88-94.
Lucas, J.B., Dillaha, T.A., Reneauj, R.B., Novak, T., Knocke, W.R., 1994. Alum sludge land
application and its effect on plant growth. J. Am. Water Works Assoc. 86:75-83.
Madison, R.K., McDowell, L.R., O‟Connor, G.A., Wilkinson, N.S., Davis, P.A., Adesogan, A.,
Felix, T.L., Brennan, M., 2007. Effects of aluminum from water treatment residual
applications to pastures on mineral status of grazing cattle and mineral concentrations of
forages. J. Anim. Sci. (in review)
Makris, K.C., 2004. Long-term stability of sorbed phosphorus by drinking water treatment
residuals: mechanisms and implications. PhD diss. Univ. Florida. Gainesville, FL.
Makris, K.C., O‟Connor, G.A., 2007 Beneficial utilization of drinking-water treatment residuals
as contaminant-mitigating agents. In: D. Sarkar et al. (Eds). Developments in
Environmental Science, Volume 5: Concepts and Applications in Environmental
Geochemistry, Elsevier Sci. Amsterdam, pp.607-636.
Makris, K.C, Sarkar, D., Datta, R., 2006. Evaluating a drinking-water waste by-product as a
novel sorbent for arsenic. Chemosphere 64: 730-741.
Makris, K.C., Shall, H.E., Harris, W.G., O'Connor, G.A., Obreza, T.A., 2004a. Intraparticle
phosphorus diffusion in a drinking water treatment residual at room temperature. J. Colloid
Interface Sci. 277:417-423.
Final Report – Chemical Treatment
109
Makris, K.C., Harris, W.G., O'Connor, G.A., Obreza, T.A., 2004b. Three-dimensional
phosphorus immobilization in micropores of drinking-water treatment residuals:
Implications for long-term stability. Environ. Sci. Technol. 38:6590-6596.
Makris, K.C., Harris, W.G., O'Connor, G.A., Obreza, T.A., 2005a. Long-term phosphorus effects
on evolving physicochemical properties of iron and aluminum hydroxides. J. Colloid
Interface Sci. 287:552-560.
Makris, K.C., Harris, W.G., O‟Connor, G.A., Obreza, T.A., Elliott, H.A., 2005b.
Physicochemical properties related to long-term phosphorus retention by drinking-water
treatment residuals. Environ. Sci. Technol. 39:4280-4289.
Makris, K.C., O'Connor, G.A., Harris, W.G., Obreza, T.A., 2005c. Relative efficacy of a
drinking water treatment residual and alum in reducing phosphorus release from poultry
litter. Commun. Soil Sci. Plant Anal. 36:2657-2675.
Maurer, M., Boller, M., 1999. Modeling of P precipitation in wastewater treatment plants with
enhanced biological P removal. Water Sci. Tech. 39: 147-163.
Meng, X., Korfiatis, G.P., Jing, C., Christodoulatos, C., 2001. Redox transformations of arsenic
and iron in water treatment sludge during aging and TCLP extraction. Environ. Sci.
Technol. 35:3476-3481.
Moore, P.A., Jr., Daniel, T.C., Edwards, D.R., Gilmour, J.T., 1998. Effect of alum treated
poultry litter, normal litter and ammonium nitrate on aluminum availability and uptake by
plants. Proceedings of the 1998 National Poultry Waste Management Symposium,
Springdale, AR.
Nair V.D., Portier, K.M., Graetz, D.A., Walker, M.L., 2004. An environmental threshold for
degree of phosphorus saturation in sandy soils. J. Environ. Qual. 33:107-113.
Nair, V.D., Harris, W.G., 2004. A capacity factor as an alternative to soil test phosphorus in
phosphorus risk assessment. New Zealand J. Agri. Res. 47:491-497.
Naylor, L.M., Carr, J.S., 1997. Exchangeable phosphorus in soils amended with water treatment
residuals, biosolids, and aluminum-rich residues. In: Proc. Conf. Water residuals biosolids
management: Approaching the year 2000. Water Environ. Fed., Philadelphia, PA.
Novak, J. M., Watts, D.W., 2004. Increasing the phosphorus sorption capacity of southeastern
Coastal Plain soils using water treatment residuals. Soil Sci. 169:206-214.
Novak, J.M., Watts, D.W., 2005a. An alum-based water treatment residual can reduce
extractable phosphorus concentrations in three phosphorus-enriched coastal plain soils. J.
Environ. Qual. 34: 1820-1827.
Novak, J.M., Watts, D.W., 2005b. Water treatment residuals aggregate size influences
phosphorus sorption kinetics and Pmax, values. Soil Sci. 170:425-432.

Final Report – Chemical Treatment
110
Novak, J.M., Watts, D.W., Hunt, P.G., Stone, K.C., 2000. Phosphorus movement through a
coastal plain soil after a decade of intensive swine manure application. J. Environ. Qual.
29:1310-1315.
Novak, J.T., Knocke, W.R., Geertsema, W., Dove, D., Taylor, A., Mutter, R., 1995. An
assessment of cropland application of water treatment residuals. Am. Water Works Assoc.
Res. Foundation, Denver, CO.
O‟Connor, G.A., Elliott, H.A., 2006. The agronomic and environmental availability of biosolids-
P (Phase II). WERF report. 99-PUM-2Ta. pp. 4-1to 4-14.
O‟Connor, G.A., Sarkar, D., Brinton, S.R., Elliott, H.A., Martin, F.G., 2004. Phytoavailability of
biosolids-phosphorus. J. Environ. Qual. 33:703-712.
O‟Connor, G.A., Elliott, H.A., Lu, P., 2002. Characterizing water treatment residuals for P
retention. Soil Crop Sci. Soc. Florida Proc., 67–73.
O'Connor, G.A., Brinton, S., Silveira, M.L., 2005. Evaluation and selection of soil amendments
for field testing to reduce P losses. Soil Crop Sci. Soc. FL. Proc. 64:22-34.
O'Hannesin SF and R.W. Gillham.1998. Long-term performance of an in situ "iron wall" for
remediation of VOCs. Ground Water 36: 164-170.
Oladeji, O.O., 2006. Management of phosphorus sources and water treatment residuals (WTR)
for environmental and agronomic benefits. PhD diss. Univ. Florida. Gainesville, FL.
Oladeji, O.O., Sartain, J.B., O‟Connor, G.A., 2006. Agronomic impact of water treatment
residual co-applied with phosphorus sources to Florida sands. Soil Crop Sci. Soc. Florida
Proc. 65:38-48
Oladeji, O.O, G.A. O‟Connor, J.B. Sartain, and V.D. Nair., 2007. Controlled application rate of
water treatment residual for agronomic and environmental benefits. J. Environ. Qual.
36:1715-1724.
Omoike, A.I., Vanloon, G.W. 1999. Removal of phosphorus and organic matter removal by alum
during wastewater treatment. Water Res. 33:3617-3627.
Paulter, M.C., Sims, J.T., 2000. Relationships between soil test phosphorus, soluble phosphorus,
and phosphorus saturation in Delaware soils. Soil Sci. Soc. Am. J. 64:765-773.
Peters, J. M., Basta, N.T., 1996. Reduction of excessive bioavailable phosphorus in soils using
municipal and industrial wastes. J. Environ. Qual. 25:1236-1241.
Prakash, P., Sengupta, A.K., 2003. Selective coagulant recovery from water treatment plant
residuals using Donnan membrane process. Environ. Sci. Technol. 37:4468-4474.

Final Report – Chemical Treatment
111
Puls, R.W, D.W. Blowes, and R.W. Gillham. 1999. Long-term performance monitoring for a
permeable reactive barrier at the U.S. Coast Guard Support Center, Elizabeth City, North
Carolina. . J Hazard Mater. Aug 12;68:109-24.
Rengasamy, P., Oades, J.M., Hancock, T.W., 1980. Improvement of soil structure and plant
growth by addition of alum sludge. Commun. Soil Sci. Plant Anal. 11:533-545.
Rhoton, E.E., Bigham, J.M., 2005. Phosphate adsorption by ferrihydrite-amended soils. J.
Environ. Qual. 34:890-896.
Rosa, I.V., Henry, P.R., Ammerman, C.B., 1982. Interrelationships of dietary phosphorus,
aluminum and iron on performance and tissue mineral composition in lambs. J. Anim. Sci.
55:1231-1240.
Sarkar, D., Makris, K.C., Vandanapu, V., Datta, R., 2006. Arsenic immobilization in soils
amended with drinking-water treatment residuals. Environ. Pollution 146: 414-419.
Sarkar, D., Quazi, S., Makris, K. C., Datta R., Khairom, A., 2007. Arsenic bioaccessibility in a
soil amended with drinking-water treatment residuals in the presence of phosphorus
fertilizer. Arch Environ Contam. Toxicol. 53:329–336.
Self-Davis, M.L., Moore, Jr., P.A., Daniel, T.C., Edwards, D.R., 1998. Use of aluminum sulfate
to reduce soil test P levels in soils fertilized with poultry litter. In: Proc. National Poultry
Waste Management Symposium, 24-26 Oct. 1998. Auburn University, AL.
Sharpley, A.N., 1999. Global issues of phosphorus in terrestrial ecosystems. In: Reddy, K.R.,
(Ed.). Phosphorus Biogeochemistry in Subtropical Ecosystems. Lewis Publishers, Boca
Raton, Florida, pp. 15-46.
Sharpley, A.N., Halvorson, A.D., 1994. The management of soil phosphorus availability and its
transport in agricultural runoff. In: Lal, R., (Ed.). Soil processes and water quality:
Advances in Soil Science. Lewis Publ., Boca Raton, Florida, pp. 1-84.
Silveira, M.L., Miyattah, M.K., O'Connor, G.A., 2006. Phosphorus release from a manure-
impacted Spodosol: Effects of a water treatment residual. J. Environ. Qual. 35:529-541.
Sims, J.T., Simard, R.R., Joern, B.C., 1998. Phosphorus loss in agricultural drainage: historical
perspective and current research. J. Environ. Qual. 27:277-293.
Sloan, J.J., Basta, N.T., Westerman, R.L., 1995. Aluminum transformations and solution
equilibria induced by banded phosphorus fertilizer in acid soil. Soil Sci. Soc. Am. J.
59:357-364.
Townsend, TG, Jang, J.C., Jain, P., Tolaymat, T., 2001. Characterization of drinking water
sludges for beneficial reuse and disposal. Report submitted to Florida Center for Solid and
Hazardous Waste Management, Gainesville, FL.

Final Report – Chemical Treatment
112
U.S. Department of Agriculture-Agricultural Research Service. 2009. From Golf to Gulf,
Drainage Industry Greens. Agricultural Research magazine.
http://www.ars.usda.gov/is/AR/archive/jan09/drainage0109.htm
U.S. Environmental Protection Agency, 1996. Management of water treatment residuals.
EPA/625/R-95/008. Office of research and development, Washington, DC.
Valdivia, R., 1977. Effect of Dietary Aluminum on Phosphorus Utilization by Ruminants. PhD
thesis. University of Florida, Gainesville.
Valdivia, R., Ammerman, C.B., Wilcox, C.J., Henry, P.R., 1978. Effects of dietary aluminum on
animal performance and tissue mineral levels in growing steers. J. Anim. Sci. 47, 1351–
1360.
Valdivia, R.C., Ammerman, C.B., Henry, P.R., Feaster, J.P., Wilcox, C.J. 1982. Effect of dietary
aluminum and phosphorus on performance, phosphorus utilization, and tissue mineral
composition in sheep. J. Anim. Sci. 55:402-410.
Van Alstyne, R., McDowell, L.R., Davis, P.A., Wilkinson, N.S., O‟Connor, G.A., 2007. Effects
of an aluminum-water treatment residual on performance and mineral status of feeder
lambs. Small Ruminant Res. 73:77-86.
Vance, G.F., Stevenson, F.J., Sikora, F.J., 1996. Environmental Chemistry of Aluminum-organic
complexes, In: Sposito, G., (Ed.). Environmental Chemistry of Aluminum (second ed.).
CRC Press Inc. Boca Raton, Florida, pp. 169-220.
Viraraghavan, T., Ionescu, M., 2002. Land application of phosphorus-laden sludge: A feasibility
analysis. J. Environ. Manage. 64:171-177.
Zhang, J, S.A.F. Ray, and A. Steinman. 2002. Potential phosphorus load reductions under the
Lake Okeechobee regulatory program, J. Am. Water Resources Association 38: 1613-1624.

Final Report – Chemical Treatment
113
CHAPTER V HYBRID WETLAND TREATMENT
INTRODUCTION
For decades, chemical treatment systems and treatment wetlands have been utilized
independently for treating wastewaters and surface waters. Chemical treatment systems typically
have low land area requirements, but moderate to high operating costs due to the continuous
consumption of chemicals (i.e., coagulant, buffers, coagulant aids). Chemical treatment systems
are often capable of achieving extremely low outflow total phosphorus (TP) concentrations
(range of 10 g/L) (SFWMD 2000), with the pollutant removal efficiency (and outflow
concentrations) controlled largely by inflow pollutant concentrations, levels of other runoff
constituents (alkalinity, color, turbidity) and the coagulant dose. While extremely effective for
removing many water column pollutants such as P, chemical treatment is less effective at
removing other constituents, such as dissolved inorganic nitrogen (N) species. In these systems,
pollutants are removed from the water column by adsorption to, or incorporation into, a chemical
floc that settles to the bottom of a pond or clarifier. The floc is periodically removed from the
system, dried, and transported to an alternative site for land application or disposal, often at a
relatively high cost.
In contrast with chemical treatment systems, treatment wetlands occupy a much larger area
(footprint), and differ markedly with respect to contaminant removal efficiencies. For example,
wetlands are quite effective (on an area basis) at removing inorganic N species, but require large
amounts of land for effective P removal (DeBusk et al 2005a). Pollutant removal in treatment
wetlands is usually controlled by manipulating system hydraulic residence time (HRT) which in
turn affects the area for treatment (Kadlec and Wallace 2009), and to a lesser extent, the type(s)
of dominant vegetation. Unlike chemical treatment systems, pollutant removal in treatment
wetlands is accomplished through both transformations and sequestration. For example,
constituents such as N and carbon (C) typically are transformed within treatment wetlands, with
a portion liberated as gaseous forms and the remainder sequestered in the sediments. Other
constituents, such as P and heavy metals, rely solely on sediment sequestration (burial) as an
ultimate removal mechanism. Extremely large treatment wetlands, known as Stormwater
Treatment Areas (STAs), have been constructed throughout south Florida for reducing P levels
in runoff. Depending on environmental conditions, P in wetland sediments that is associated with
either recalcitrant organic matter, or bound to metal (iron, calcium and particularly, aluminum)
compounds in the sediments, can remain permanently sequestered. Environmental perturbations,
such as system “dry-down”, can result in the release of sediment P associated with organic
matter, thereby impairing the long-term removal efficiency.
During recent years, a number of “combination” systems have been proposed and/or deployed
that utilize a sequence of treatment wetlands, conventional chemical treatment systems and
reservoirs. Different benefits have been attributed to the various sequencing approaches of the
unit processes. For example, the placement of a reservoir or detention system upstream of a

Final Report – Chemical Treatment
114
chemical treatment facility can provide peak flow attenuation and a modest amount of nutrient
removal, and act as a hydraulic buffer for the downstream unit process. An alternative
configuration, with a chemical treatment system upstream of the wetland, is considered
advantageous because the constructed wetland can “polish” the chemically treated water before
discharge to the natural environment. One such approach, termed a “Managed Wetland”, was
evaluated for its effectiveness in treating farm runoff to extremely low-level outflow TP
concentrations (SFWMD 2000). The necessity for large tracts of land is a major component of
the “Managed Wetland” system.
The Hybrid Wetland Treatment Technology (HWTT) concept was developed with the intent of
harnessing and integrating the strengths of both wetland and chemical treatment technologies.
The goal of HWTT systems is to provide the effectiveness and reliability of chemical treatment
systems, and to utilize the wetland vegetation to the maximum extent possible to minimize
chemical amendment use, to eliminate the need for off-site disposal of residual floc materials and
to facilitate the removal of nitrogen species.
OVERVIEW OF TECHNOLOGY
The patented Hybrid Wetland Treatment Technology (HWTT) represents a combination of
chemical and wetland treatment approaches, with the system comprised of vegetated
zones(primarily with floating and/or submerged macrophytes), non-vegetated zones, internal floc
recycling mechanisms and the drying of floc material with subsequent re-introduction into the
treatment train. Chemical coagulants are added to the front-end of the system, which is equipped
with one or more deep zones to capture and store the resulting chemical flocs. A fundamental
concept of the HWTT is that the floc material resulting from coagulant addition remains at least
temporarily viable, and can be “re-used” for additional P removal. Both passive and active re-use
of floc material can be practiced in a HWTT. Passive re-use refers to the accumulation of viable
flocs on plant roots and stems that are situated near the front-end and mid-regions of the system
(Figure 5-1). Active re-use refers to the periodic re-suspension of settled floc. Re-use is achieved
by exposing existing viable flocs within the system, in either an active or passive manner, to
“untreated parcels” of water and also by the re-use of dried floc. Coagulants typically are dosed
to the front end of the HWTT only intermittently, such that untreated parcels of water pass
through into the HWTT system at selected time intervals. It should be noted that active re-
Figure 5-1. Coagulant floc attached to submerged macrophytes near the inflow region of a
HWTT system.
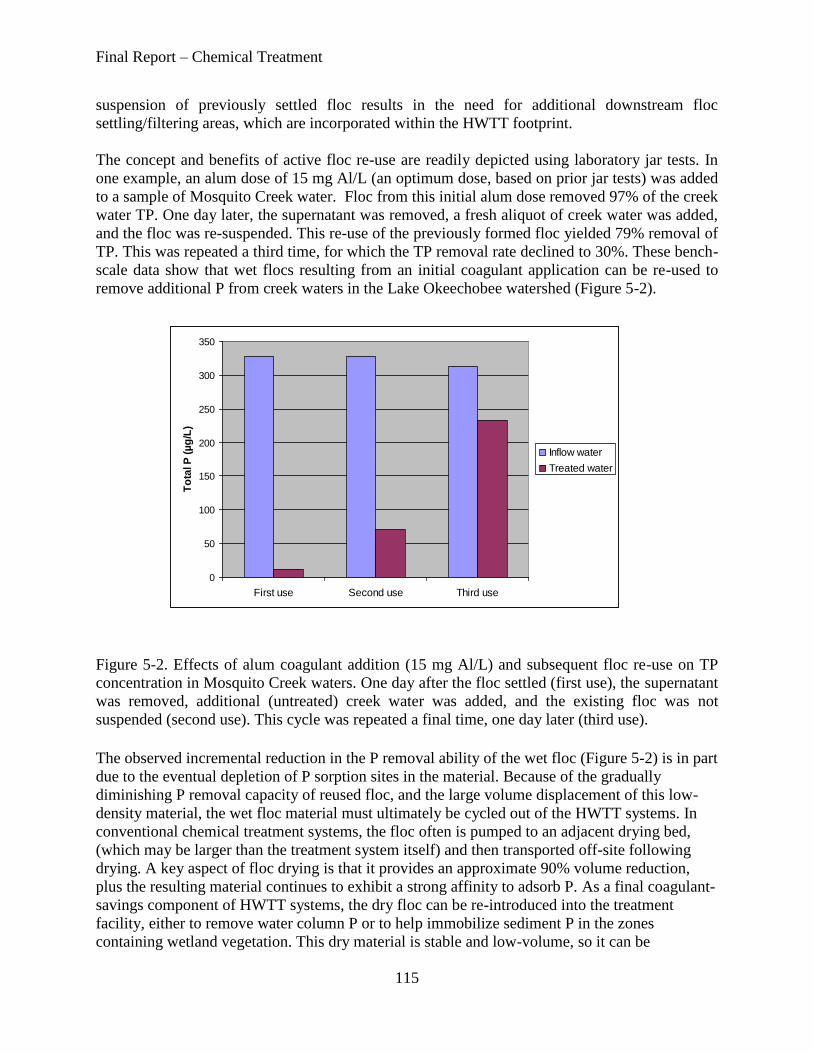
Final Report – Chemical Treatment
115
suspension of previously settled floc results in the need for additional downstream floc
settling/filtering areas, which are incorporated within the HWTT footprint.
The concept and benefits of active floc re-use are readily depicted using laboratory jar tests. In
one example, an alum dose of 15 mg Al/L (an optimum dose, based on prior jar tests) was added
to a sample of Mosquito Creek water. Floc from this initial alum dose removed 97% of the creek
water TP. One day later, the supernatant was removed, a fresh aliquot of creek water was added,
and the floc was re-suspended. This re-use of the previously formed floc yielded 79% removal of
TP. This was repeated a third time, for which the TP removal rate declined to 30%. These bench-
scale data show that wet flocs resulting from an initial coagulant application can be re-used to
remove additional P from creek waters in the Lake Okeechobee watershed (Figure 5-2).
Figure 5-2. Effects of alum coagulant addition (15 mg Al/L) and subsequent floc re-use on TP
concentration in Mosquito Creek waters. One day after the floc settled (first use), the supernatant
was removed, additional (untreated) creek water was added, and the existing floc was not
suspended (second use). This cycle was repeated a final time, one day later (third use).
The observed incremental reduction in the P removal ability of the wet floc (Figure 5-2) is in part
due to the eventual depletion of P sorption sites in the material. Because of the gradually
diminishing P removal capacity of reused floc, and the large volume displacement of this low-
density material, the wet floc material must ultimately be cycled out of the HWTT systems. In
conventional chemical treatment systems, the floc often is pumped to an adjacent drying bed,
(which may be larger than the treatment system itself) and then transported off-site following
drying. A key aspect of floc drying is that it provides an approximate 90% volume reduction,
plus the resulting material continues to exhibit a strong affinity to adsorb P. As a final coagulant-
savings component of HWTT systems, the dry floc can be re-introduced into the treatment
facility, either to remove water column P or to help immobilize sediment P in the zones
containing wetland vegetation. This dry material is stable and low-volume, so it can be
0
50
100
150
200
250
300
350
First use Second use Third use
To
tal P
(µ
g/L
)
Inflow water
Treated water
Final Report – Chemical Treatment
116
incorporated into the relatively large footprint HWTT system on a sustainable basis.
It should be noted that conventional chemical treatment technologies were developed and refined
largely during the design and conduct of “concrete-and-steel” water and wastewater treatment
projects, where it is imperative to achieve rapid floc settling (solid-liquid separation) in order to
minimize clarifier size and costs. While larger than standard chemical treatment systems, land
requirements for HWTT systems remain, however, much smaller than those of traditional
treatment wetlands (such as the STAs). Because agriculture is the dominant land use in the
Northern Everglades watershed, there exist numerous locations that can accommodate HWTT
systems in this region.
In addition to passive and active re-use of chemical flocs, HWTT systems utilize several novel
design and operational strategies including:
1. Sequencing and configuring of the wetland unit processes to provide desirable P species
transformations,
2. Use of wetland (biotic) components, rather than chemical amendments, for pH buffering,
3. Utilization of the wetland biota to transform/remove additional contaminants, such as N.
A further description of the technology is provided in the following sections.
APPLICATIONS AND SUCCESS STORIES
The reduction of P loads to Lake Okeechobee from the watershed represents a formidable
challenge. In order to meet the Lake‟s P load reduction targets, hundreds of tons of P inputs must
be curtailed each year. Water managers propose to accomplish this reduction by deploying a
combination of Best Management Practices, “Edge of Field” treatment systems, and “Regional”
treatment systems. A recent review (SWET, 2001) of Dairy “Best Available Treatment
Technologies” indicates that chemical treatment is likely to play a key role in reducing P inputs
to the lake.
Because the operating (i.e., chemical) costs for removing a significant fraction of the inflow P
load to the Lake will be quite high, it is extremely important to identify and implement
techniques for increasing the efficiency of chemical use. Examples of “typical” optimization
approaches include: targeting sources with high P concentrations, where the mass of P removed
per mass of coagulant added is likely to be highest; rigorous jar testing to optimize chemical
doses; and use of coagulant aids (i.e., polymers) and buffers, as appropriate, to minimize
coagulant costs. The HWTT configuration offers yet another optimization approach that can be
considered for deployment in many sites being considered for chemical treatment.
Several applications are presented below, representing various design and implementation
strategies for HWTT systems. HWTT design and operational factors that can be adjusted
include: relative size and configuration of the wetland (floating and/or submerged vegetation)

Final Report – Chemical Treatment
117
unit processes; type and dose of coagulants, coagulant aids and buffers; and amendment dosing
cycles. The first HWTT application described below addresses a system that was used for
remediation of lake waters (DeBusk et al 2005b). Rather than continuous dosing, chemicals
(coagulant and buffer) were added only once monthly, on a batch basis over a two-year
operational period. Because the HWTT system had a HRT of approximately 7 days, this dosing
cycle resulted in the addition of chemicals during only one of every four HRTs. The second and
third HWTT applications describe findings from the initial deployment of two systems in south
Florida, one to treat citrus grove runoff, and the second to treat a continuous flow of stream
water (Watershed Technologies 2008). The second site illustrates some of the HWTT floc
recycling concepts, while the third demonstrates the challenges to optimization of chemical
treatment in the highly variable (in chemical composition) stream waters of the Northern
Everglades.
Lake June, Orange Co., Florida
A HWTT system was deployed in Lake June, a 1.6 hectare (ha) Lake in central Florida, during
August 2003. This system was comprised of a circular floating boom 18 meters in diameter,
equipped with a weighted, flexible fabric skirt that extended from the water‟s surface to the
sediments, effectively isolating a parcel of water from the Lake‟s water column (Figure 5-3). A
floating mat of vegetation consisting of plants in the genera Eichhornia, Hydrocotyle, Bidens,
Sagittaria, and Pontederia was established in the system.
The HWTT system was equipped with a solar powered pump to provide a semi-continuous water
exchange from the Lake‟s water column into the compartment at a rate of approximately 100
m3/day (Figure 5-3), providing a hydraulic retention time (HRT) within the compartment of 7
days. At this exchange rate, a volume of water equal to the Lake‟s entire water column would
pass through the wetland compartment in 10.5 months.
Figure 5-3. The HWTT system deployed in Lake June, Orange Co., FL.
The HWTT was dosed once monthly with alum beneath the wetland vegetation, at a
concentration of 12.5 mg Al/L. This alum concentration was selected based on results of jar tests,
which demonstrated formation of a moderate to rapidly settling floc at this dose. Chemical
analyses also revealed that the Lake is poorly buffered, so a buffering agent was injected
immediately before injecting alum.

Final Report – Chemical Treatment
118
Lake nutrient concentrations varied widely during the two-year study, from 84 to 379 g/L for
TP and 0.76 to 1.25 mg/L for TN (Table 5-1). We observed no obvious increasing or decreasing
trend in Lake water TP concentrations during the evaluation: maximum and minimum Lake
water TP levels were observed in April and August 2004, respectively (Figure 5-4). The HWTT
system exhibited effective nutrient removal, removing 45% of the inflow TP (two year
monitoring period) and 40% of the inflow TN (monitored only for a six month period). Despite
widely varying Lake TP concentrations, the outflow from the HWTT system was relatively
consistent, averaging 82 g/L and ranging from 34 to 150 g/L (Figure 5-4). Neither the system
inflow (= lake water) nor outflow contained substantial amounts of soluble reactive P (Table 5-
1). The HWTT system outflow TN concentrations averaged 1.08 mg/L, and ranged from 0.76 to
1.25 mg/L (Table 5-1).
Table 5-1. Summary of the water quality treatment performance of the Lake June
HWTT system. Total P and soluble reactive P were measured approximately every week
for two years. Other constituents were measured every 4 – 6 weeks for six months.
System inflow (Lake) System outflow
total phosphorus ( g/L) 148 (84 – 379) 82 (34 – 150)
soluble reactive phosphorus
( g/L)
6 (<2 – 27) 8 (<2 – 29)
total nitrogen (mg/L) 1.80 (1.36 – 2.17) 1.08 (0.76 – 1.25)
chlorophyll a (mg/m3) 78 (34 – 123) 26 (15 – 35)
total suspended solids (mg/L) 17 (6 – 26) 6 (2 – 10)
Turbidity (NTU) 12 (8 – 18) 6 (4 – 11)
total aluminum (mg/L) 0.161 (0.057 – 0.260) 0.142 (0.060 – 0.260)
sulfate (mg/L) 18.1 (10 – 21) 20.9 (12 – 44)

Final Report – Chemical Treatment
119
0
50
100
150
200
250
300
350
400
Nov-03 Mar-04 Jul-04 Nov-04 Mar-05 Jul-05
TP
(µ
g/L
)
Inflow
Outflow
Figure 5-4. Inflow (= lake water) and outflow TP concentrations from the Lake June HWTT
system for a two-year period.
The HWTT system was effective at removing particulate matter, providing a 65, 50 and 67%
reduction of total suspended solids, turbidity and chlorophyll a, respectively (Table 5-1). Visual
inspection of the water samples, coupled with chlorophyll a analyses, suggest that phytoplankton
comprised the bulk of the particulate matter in the relatively turbid wetland inflow samples
(Table 5-1). By contrast, the outflow from the HWTT system was quite clear.
Although the monthly injection of alum into the water beneath the HWTT system vegetation
undoubtedly enhanced water column pollutant removal, no clear temporal relationship between
HWTT system outflow TP levels and the timing of alum applications was observed. Despite the
periodic use of alum, mean total aluminum levels in the HWTT system outflow were slightly
lower than those of the influent Lake water (Table 5-1). Outflow sulfate levels, by contrast, were
slightly higher in the system outflow than in the inflow waters (Table 5-1).
Based on an average estimated flow rate of 100m3/day through the wetland, the Lake June
HWTT system removed a total mass of 25.6 kg N and 2.81 kg P/yr from the Lake water column.
On an area basis, this is equivalent to mass removal rates of 101 gN and 11.3 gP/m2-yr. As a
comparison, the Taylor Creek and Nubbin Slough STAs near Lake Okeechobee were projected
to remove 3.0 and 1.6 gP/m2-yr, respectively (Stanley Consultants 2002). Therefore, with a very
modest use of chemicals (a batch dose injected once/monthly); the Lake June HWTT was able to
sustain a P removal rate that markedly exceeds the projected P removal rate of treatment
wetlands. Further optimization efforts, manipulating factors such as system HRT and dosing
frequencies, would lead to a better understanding of the treatment potential, with respect to
minimum attainable outflow TP levels and maximum attainable mass removal rates, and
associated costs of the HWTT for treating lake waters.
Ideal #2 Grove, St. Lucie County, Florida
The Ideal #2 Grove HWTT is situated within a citrus grove in western St. Lucie County. This

Final Report – Chemical Treatment
120
system, deployed in March 2008, consists of a 0.7-acre pond equipped with both shallow and
deep zones, and divided into parallel flow paths with a flexible boom and barrier (Figures 5-5
and 5-6). The shallow zone was stocked with floating macrophytes, in this case water hyacinth
(Eichhornia crassipes), while the deep zones contain several species of submerged aquatic
vegetation (SAV). The floating and submerged vegetation contribute to the passive recycling of
floc materials (Figure 5-7).
In May 2008, continuous amendment (alum at 20 - 25 mg Al/L) dosing was initiated in the
northern flow path (“A”), and intermittent dosing (same dose, but coagulant provided only 66%
of the time) in the southern flow path (“B”). To compensate for the reduced addition frequency
of chemicals, flow path B was equipped with a novel floc “recirculation” device, which helps
maintain system performance while minimizing amendment use (Figure 5-8). The flow rate in
each parallel path was ~480 m3/day, providing an average HRT of 3.4 days.
Inflow
Outflow A
Outflow B
Shallow,
vegetated
zone
Water level
8’ 8’
2’
Profile View
Inflow
Outflow A
Outflow B
Shallow,
vegetated
zone
Water level
8’ 8’
2’
Profile View
Figure 5-5. Schematic of the Ideal Grove HWTT, depicting the A and B flow paths and the
shallow, central region containing Eichhornia crassipes.

Final Report – Chemical Treatment
121
Figure 5-6. The outflow region of the Ideal Grove HWTT, with the northern (A) flow path on
the right, and the southern (B) flow path on the left. The northern flow path receives continuous
amendment additions, while the southern flow path receives amendments only intermittently.
Figure 5-7. Accumulation of amendment (alum) floc on the roots of water hyacinth (Eichhornia
crassipes) in a pilot-scale mesocosm. “Passive recycling” occurs in HWTT systems as non
amended waters flow past the floc-laden plant roots.
plant roots coated
with alum floc
settled floc

Final Report – Chemical Treatment
122
Figure 5-8. Floc recirculation infrastructure on the southern (B) HWTT flow path.
During 2008, the system was operated for two distinct operational periods, separated by a five-
week period when the system was taken off line so that instrumentation upgrades could be
performed. From May 2 – July 19, 2008, the southern (B) flow path was operated with
intermittent dosing (66% of the time) and active floc recycle, and from August 29, 2008 –
January 7, 2009, this same flow path was operated with intermittent dosing and passive floc
recycle. During both periods, the northern flow path (A) was dosed continuously (100% of time)
with coagulant.
During the initial operational period, the mean inflow TP concentration averaged 202 g/L, and
outflows TP levels from flow paths A (continuous dose) and B (intermittent dose) were 15 and
17 g/L, respectively. A spike in the flow path B outflow (to 67 g/L) occurred as inflow TP
levels exceeded 1000 g/L in response to a heavy rain event (5.9). During the start of the second
operational period, inflow concentrations were high due to the heavy rains from Tropical Storm
Fay, with TP levels at 3610 g/L. At this time, flow path B exhibited an outflow TP of 166 g/L,
and the flow path A outflow was 62 g/L (Figure 5-9). Once inflow TP levels declined to below
1000 g/L, performance of the two flow paths became more comparable. Mean inflow TP levels
for the second operational period were 527 g/L. During this time, the outflow TP levels for the
continuously dosed flow path A averaged 28 g/L, and the mean TP outflow for the
intermittently dosed flow path B (with only passive floc recycle during the period) averaged 44
g/L. This trial of intermittent chemical dosing (yielding a 33% reduction in amendment use)
therefore resulted in minor differences in outflow P levels, particularly when inflow TP values
were below 1000 g/L.
Nitrogen removal performance of the two flow paths of the Ideal Grove HWTT was
characterized during the first operational period, and at that time the two flow paths produced

Final Report – Chemical Treatment
123
similar outflow N (and P) concentrations, and mass removal rates (Table 5-2). Nitrogen values
were not measured during the second optimization period, but the 2.5X higher inflow TP
concentration during this period (527 vs. 198 g/L) suggests that mass P removal rates were in
the range of 20 – 25 gP/m2-yr for the latter portion of 2008.
Initial operations of the Ideal Grove site reveal that extremely low outflow TP concentrations can
be attained by HWTT systems, and that intermittent dosing of chemicals (with associated
operating costs savings) can provide comparable system outflow concentrations to continuously
dosed systems. Additional optimization efforts are underway at this site, to evaluate TP removal
performance under varying dosing regimes and using different coagulants.
0
200
400
600
800
1000
1200
1400
1600
4/12/2008 6/1/2008 7/21/2008 9/9/2008 10/29/2008 12/18/2008 2/6/2009
TP
(µ
g/L
)
Inflow(3610)
0
20
40
60
80
100
120
140
160
180
4/12/2008 6/1/2008 7/21/2008 9/9/2008 10/29/2008 12/18/2008 2/6/2009
TP
(µ
g/L
)
Outflow A
Outflow B
Figure 5-9. Total P concentrations for the Ideal #2 Grove HWTT during two operational periods.
Flow path A received continuous chemical dosing, while flow path B was dosed intermittently
(33% reduction in chemical use). Active floc re-suspension was performed during the initial
operational period, while only passive floc recycle occurred during the second period.

Final Report – Chemical Treatment
124
Table 5-2. Mass balance (loading and removal) for N and P at the Ideal Groves HWTT during
the period May 6 – June 30, 2008.
TP TN
Path A Path B Path A Path B
Flow (m3/day) 476 488 476 488
Inflow conc. (µg/L) 102 102 1480 1480
Outflow conc. (µg/L) 14 14 604 677
Mass loading (g/day) 48.7 49.9 704.5 722.2
Mass export (g/day) 6.8 6.7 287.6 330.2
Mass removal (g/day) 41.8 43.2 416.9 392.0
Mass removal (g/m2-yr) 10.8 11.1 107.5 101.0
Percent removal 86.0 86.5 59.2 54.3
To clarify the benefits of the intermittent dosing strategy, such as used at the Ideal facility, it is
important to understand the relationship between coagulant doses and outflow TP concentrations.
Data from a jar test with Ideal canal waters are used for this example. These data show that the
relationship between coagulant dose and outflow P concentration is not linear, primarily because
a critical level of coagulant (and at times, a coagulant aid) is needed to achieve successful
flocculation (Figure 5-10). Below this dose, flocculation is inadequate, and pinpoint flocs formed
during the coagulation process remain in suspension and can be exported in the system outflow.
For the Ideal waters on that sampling date, the optimum alum dose to achieve an outflow TP
below 100 µg/L was between 22.5 and 25 mg Al/L (Figure 5-10).
Ideal #2 North Canal
0
200
400
600
800
1000
1200
1400
7.5 10.0 12.5 15.0 17.5 20.0 22.5 25.0
Alum Dosage
TP
(µ
g/L
)
TP Initial TP
Figure 5-10. Relationship between amendment dose (alum, as mg Al/L) and TP concentrations
of Ideal inflow waters (initial TP), as determined from a laboratory jar test.
HWTT systems are operated using a coagulant dose just high enough to provide effective
flocculation and settling, which for the example (Figure 5-10) would be 17.5 - 25 mg Al/L,
depending on the desired target outflow concentration. A unique feature of HWTT systems,
however, is that effective treatment can be maintained using only intermittent dosing. For the

Final Report – Chemical Treatment
125
Ideal Grove HWTT, the southern (B) flow path was operated under a lower dosing frequency
(i.e., 66% of the time). The intermittently dosed systems continued to provide effective
treatment, due to the capture of active flocs on plant stems and roots (5.7) and the periodic
recycling/reuse of settled flocs. In terms of chemical use and costs, the net effect is that the
system can be operated successfully under a coagulant dose that would be much less effective in
a conventional chemical treatment facility. For example, 66% of a 20 - 25 mgAl/L dose (the dose
range actually used during 2008) is equivalent to the chemical consumption incurred with a full-
time dosing of 13 – 16.5 mgAl/L. Jar tests indicate that this dosing range should yield a
supernatant (outflow) TP concentration of ~950 - 250 µg/L (Figure 5-10). These TP
concentrations are considerably higher than the Ideal flow path outflow TP levels, even during
the periods of highest inflow TP concentrations (Figure 5-9).
Nubbin Slough, Okeechobee County, Florida
The Nubbin Slough HWTT system is noteworthy because it is a gravity-fed, continuous flow
system, and it illustrates the unique challenges of deploying chemical treatment technologies in
the Northern Everglades watershed. The Nubbin Slough (Davie Dairy) facility originally was a
conventional chemical treatment facility constructed for the Dairy “Best Available Technology”
program (Figure 5-11). A diversion weir was situated in Nubbin Slough, and diverted water was
fed into a large settling pond, and then returned at a downstream location into the slough.
Chemical coagulants were injected into the inflow piping, on a flow proportional basis, just
upstream of the settling pond. This chemical treatment system was converted to a HWTT system
in 2008.
Figure 5-11. Aerial photo of Nubbin Slough “Davie Dairy” chemical treatment system at Davie
Dairy. The building housing the chemical storage tanks and dosing pumps is located to the upper
right of the settling pond. In 2008, this system was modified into a HWTT facility.

Final Report – Chemical Treatment
126
Prior to its conversion to a HWTT facility, a poly-aluminum chloride compound (Hyperion
1090) was utilized in the treatment system as a coagulant at a dosing rate of 7.5 mg Al/L. This
dose was arrived at through jar testing, which actually revealed effective TP removal at Hyperion
1090 doses as low as 4.0 mg/L. The dose of 7.5 mg/L was selected for operational purposes,
providing a safety factor above the levels observed in the laboratory tests.
As part of the initial design efforts for the HWTT system in the latter half of 2007, the P removal
effectiveness of the Hyperion 1090 compound for floc formation and P removal was evaluated
for the Davie facility. This effort revealed minimal floc production in the settling pond, and poor
TP removal performance within the system. Because of the apparent poor performance of the
Hyperion 1090 coagulant, an aliquot of this material was obtained from the chemical storage
tank, and transported to the laboratory for testing. Coagulant dosing rates of 7.5 up to 30
mgAl/L were tested with Nubbin Slough waters. No floc formation was observed at the lower
doses. Small, micro-floc formation was observed at Hyperion 1090 doses of 15 and 17.5 mg
Al/L. The 25 and 30 mg Al/L doses successfully clarified the water column, and did not
adversely impact the pH (reduction of raw water pH of 6.9 to 6.7 for both doses).
The great disparity in dose requirements was undoubtedly related to temporal changes in Nubbin
Slough water chemistry, rather than any flaw in the selection of type or dose of poly-aluminum
chloride compound. The initial jar testing, that prescribed a 7.5 mgAl/L dose, was performed
using samples collected during the dry season, while the latter testing (which resulted in a much
higher dose) was performed in the wet season. Because Hyperion 1090 is a relatively expensive
coagulant (particularly at a dose of 25 – 30 mgAl/L), tests with other coagulant(s) were
performed prior to deployment of the HWTT system. A combination of alum and sodium
aluminate, at typical doses of 4 - 6 and 12 - 15 mg Al/L respectively, was eventually selected as
a suitable coagulant/buffer blend for waters this site. During implementation of the HWTT
facility, other improvements were made to the site infrastructure, including baffling in the
settling pond, installation of a mixing chamber, and vegetation stocking (Figure 5-12).
Figure 5-12. The Nubbin Slough HWTT facility. The mixing chamber and inflow manifold are
in the foreground, and the outflow riser is in the upper right of the photo.

Final Report – Chemical Treatment
127
Continuous optimization and monitoring of the 1.55 acre Nubbin Slough HWTT system began in
March 2008. During the initial optimization period (mid-March to mid-July 2008), system flow
rates ranged from 0.1 to 27.1 cfs, and averaged 1.7 cfs. This resulted in a mean HRT of 4.3 days.
After the HWTT system had operated for a number of weeks with low “dry season” flows, a
heavy rain event occurred in April, and the flow through the pond (27 cfs) exceeded the desired
maximum. This degraded the treatment efficiency due to the excessively short HRT (i.e., 6
hours) (Figure 5-13). Subsequently, a flow restrictor orifice was designed and deployed on the
pond inflow pipe at the weir, with an overflow elbow on one of the three slide valves that pass
water through the weir in the stream. This device can be adjusted to select a “maximum” flow,
which for the Nubbin Slough HWTT is probably in the range of 5 to 10 cfs.
From mid-March through mid-July 2008 (the initial testing period), the system inflow TP
averaged 754 µg/L and the system outflow averaged 122 µg/L, an 84% reduction (Figure 5-13).
During this period, the variations in inflow TP levels, and other key chemical constituents of the
stream water, were dramatic (Figure 5-13). Alkalinity averaged 26 mg/L as CaCO3, and ranged
from 2 to 67 mg/L as CaCO3. Color averaged 336 CPU, and ranged from 211 to 550 CPU.
Chemical dosing rates, particularly of the buffer (sodium aluminate), had to be varied frequently
during the operational period in response to temporal changes in water chemistry. The broad
temporal variations in inflow water quality observed for the Nubbin Slough HWTT have
profound implications to operational costs; with chemical doses (and associated costs) at times
being extremely high, particularly when color levels were elevated and alkalinity levels were
low.
During the startup months of 2008, N removal by the Nubbin Slough HWTT was measured only
sporadically. The limited N removal data available (measured in June/July 2008 and
January/February 2009) suggests a percentage N reduction at this site of 31% (Table 5-3).
Table 5-3. Mass balance (loading and removal) for N and P at the Nubbin Slough HWTT for 4
months (June, July 2008; January, February 2009) during which N data were collected.
TP TN
Flow (m3/day) 2942 2942
Inflow conc. (µg/L) 660 1398
Outflow conc. (µg/L) 126 960
Mass loading (g/day) 1941.6 4112.7
Mass export (g/day) 370.7 2824.2
Mass removal (g/day) 1571.0 1288.5
Mass removal (g/m2-yr) 83.3 68.4
Percent removal 80.9 31.3
While the widely varying inflow chemistry of Nubbin Slough waters presents an operational
challenge, it is not insurmountable. Indeed, the HWTT system offers several features that allow
it to effectively address widely varying water chemistry regimes. Some are described below, and
others are still under investigation.
During 2009, a trial was initiated with the Nubbin Slough HWTT system during which
continuous coagulant and buffer dosing (alum at 5 mg Al/L, sodium aluminate at 12 mg Al/L)

Final Report – Chemical Treatment
128
was performed for a six week period, after which time dosing of these same chemicals was
performed only two-thirds of the time (a 66% duty cycle) for a six week period. During this final
six-week period, existing floc material in the pond inflow region was intermittently re-suspended
during “no dose” periods. Inflow TP concentrations increased somewhat during the trial
(averaging 549 and 948 g/L for the first and second periods, respectively). Despite this increase
in inflow TP levels and the 33% reduction in coagulant and buffer use during the second period,
mean outflow concentrations for both periods were identical, at 53 g/L (Figure 5-14).
0
500
1000
1500
2000
2500
10-Mar 24-Mar 7-Apr 21-Apr 5-May 19-May 2-Jun 16-Jun 30-Jun 14-Jul
To
tal P
(g
/L)
Inflow (Nubbin Slough)
Davie Pond Outflow
0
10
20
30
40
50
60
70
80
10-Mar 24-Mar 7-Apr 21-Apr 5-May 19-May 2-Jun 16-Jun 30-Jun 14-Jul
Alk
alin
ity (m
g/L
)
0
100
200
300
400
500
600
10-Mar 24-Mar 7-Apr 21-Apr 5-May 19-May 2-Jun 16-Jun 30-Jun 14-Jul
Co
lor
(CP
U)
Figure 5-13. Temporal changes in TP, alkalinity and color during mid-2008 for the inflow
Nubbin Slough HWTT waters. Outflow TP values for the HWTT facility also are depicted in the
top graph.

Final Report – Chemical Treatment
129
Our initial marginal cost analyses shows that the cost of P removal during the intermittent dosing
period was 61% lower ($51.83/Kg P removed vs. $131.30 /Kg P removed) than during the prior,
continuous dosing period (Watershed Technologies, preliminary draft Cost Analysis).
Additional trials scheduled for 2009 will focus on further reductions in coagulant/buffer use,
which should lead to additional system operational cost savings.
While the widely varying inflow chemistry of Nubbin Slough waters presents an operational
challenge, it is not insurmountable. Indeed, the HWTT system offers several features that allow
it to effectively address widely varying water chemistry regimes. Some are described below, and
others are still under investigation.
During 2009, a trial was initiated with the Nubbin Slough HWTT system during which
continuous coagulant and buffer dosing (alum at 5 mg Al/L, sodium aluminate at 12 mg Al/L)
was performed for a six week period, after which time dosing of these same chemicals was
performed only two-thirds of the time (a 66% duty cycle) for a six week period. During this final
six-week period, existing floc material in the pond inflow region was intermittently re-suspended
during “no dose” periods. Inflow TP concentrations increased somewhat during the trial
(averaging 549 and 948 g/L for the first and second periods, respectively). Despite this increase
in inflow TP levels and the 33% reduction in coagulant and buffer use during the second period,
mean outflow concentrations for both periods were identical, at 53 g/L (Figure 5-14). Our
initial marginal cost analyses shows that the cost of P removal during the intermittent dosing
period was 61% lower ($51.83/Kg P removed vs. $131.30 /Kg P removed) than during the prior,
continuous dosing period (Watershed Technologies, preliminary draft Cost Analysis).
Additional trials scheduled for 2009 will focus on further reductions in coagulant/buffer use,
which should lead to additional system operational cost savings.
Figure 5-14. Inflow and outflow TP concentrations for the Nubbin Slough HWTT system under
two operational regimes: continuous dosing of a coagulant and buffer, and intermittent dosing
with wet floc recycling (66% duty cycle) of these same chemicals.

Final Report – Chemical Treatment
130
In addition to the coagulant/buffer cost savings provided by intermittent dosing and floc re-use,
the HWTT also can provide substantial cost savings related to the incorporation of a SAV/LR
unit process to take the place of chemical buffer additions. Chemical buffers such as sodium
aluminate and sodium hydroxide tend to crystallize, and can bind up pumps and clog delivery
piping. Additionally, because of the variable water chemistry at Nubbin Slough, the dose
requirement for both coagulants and buffers tends to change over time. The use of two chemicals
(coagulant + buffer) creates an undesirable level of complexity, and optimization of their use
requires the use of fairly sophisticated algorithms and control and monitoring equipment.
Operations can be greatly simplified, and labor costs for maintenance of the chemical delivery
systems can be reduced with the elimination of liquid buffer additions, as accomplished by the
HWTT SAV/LR configuration. A second alternative, as utilized during the earlier Dairy BAT
trials at this site, is to use a polyaluminum chloride compound (such as Hyperion 1090) that
requires no additional buffer but is considerably more expensive.
Early in 2009, a mesocosm-scale test bed facility was constructed at the Davie Dairy HWTT site,
consisting of four sets of duplicate process trains. Two sets of duplicate trains (4 individual trains
in total) were configured and operated as HWTT systems; with front-end coagulant (alum)
dosing that incorporated a downstream SAV/LR unit process for buffering and polishing.
Another set of duplicate trains consisted of conventional chemical dosing and settling with a
polyaluminum chloride compound (Hyperion 1090). A final duplicated set of mesocosms was
established as conventional chemical dosing with a coagulant (alum) and a buffer (sodium
aluminate). All trains were operated in duplicate (except the HWTT systems, with four
replicates), so statistical tests could be performed to characterize P removal among treatments.
For all trains, range finding of chemical doses was initially performed to identify the minimum
acceptable dose that would provide effective P removal, coupled with an acceptable outflow pH.
For Hyperion 1090, a dose of 15 mg/L Al was found to be most effective. During Dairy BAT
operations, a lower dose of 7.5 mg/L was utilized, but was found to be ineffective. BAT facility
operations during the final month suggested a higher dose, in the range of 12 mg/L Al or above,
would be more effective, and this is comparable to the dose we used for this trial. For the
mesocosm trains that received a coagulant + buffer combination, 5 mg Al/L alum + 15 mg Al/L
sodium aluminate was utilized. This dose was needed to form a reasonably dense floc and to
maintain a suitable outflow pH. For the four separate HWTT trains, we utilized alum at a dose of
10 mg Al/L. Chemical delivery in all conventional and HWTT trains was accomplished with
peristaltic pumps.
Each of the process trains was fed Nubbin Slough waters at a rate of 3.46 m3/day. The slough
waters were provided in a continuous, gravity flow from an adjacent head tank. The front-end
settling (clarifier) unit process for each train (both HWTT and conventional chemical systems)
consisted of two tanks in series, with a combined hydraulic retention time (HRT) of 21 hours for
each train. For the HWTT systems, the subsequent SAV/LR unit process provided an additional
12.5 hours of retention.
The test bed facility was initially operated for two weeks to test and fine-tune water flow and
chemical delivery protocols, and then performance data was collected over a 22-day period
(March 27 through April 17), with inflow and outflow samples collected approximately every 3

Final Report – Chemical Treatment
131
days. During this trial, inflow creek water TP levels averaged 1018 g/L, while outflow TP
concentrations from the Hyperion 1090, alum + aluminate and HWTT systems averaged 113, 81
and 23 g/L (Figures 5-15 and 5-16). These mean values were significantly different (alpha =
0.05), as determined by a Tukey-Kramer HSD test run on JMP software. The pH of the Nubbin
Figure 5-15. Inflow and outflow TP concentrations for the conventional chemical trains
(Hyperion 1090 and alum + aluminate) and the HWTT trains at the Nubbin Slough mesocosm
test bed during March and April 2009.
Figure 5-16. Average inflow and outflow TP concentrations for the conventional chemical trains
(Hyperion 1090 and alum + aluminate) and the HWTT trains at the Nubbin Slough mesocosm
test bed from March 27 – April 17, 2009.
0
200
400
600
800
1000
1200
Inflow HWTT Hyperion Alum +
aluminate
Inflo
w T
P (µ
g/L
)
0
20
40
60
80
100
120
140
Ou
tflo
w T
P (µ
g/L
)
Inflow
Outflow
0
25
50
75
100
125
150
175
200
225
27-Mar 30-Mar 2-Apr 5-Apr 8-Apr 11-Apr 14-Apr 17-Apr
Ou
tflo
w T
ota
l P (µ
g/L
)
HWTT
Hyperion
Alum + aluminate
0
200
400
600
800
1000
1200
1400
1600
27-Mar 30-Mar 2-Apr 5-Apr 8-Apr 11-Apr 14-Apr 17-Apr
Inflo
w T
ota
l P (µ
g/L
)

Final Report – Chemical Treatment
132
Slough inflow waters averaged 6.5, and mean outflow pH levels ranged from 6.8 to 7.5 (Figure
5-17).
Figure 5-17. Average inflow and outflow pH values for the conventional chemical trains
(Hyperion 1090 and alum + aluminate) and the HWTT trains at the Nubbin Slough mesocosm
test bed from March 27 – April 17, 2009.
A projected Cost Benefit Analysis was prepared for the trains in the Nubbin Slough test bed
using a marginal cost approach (Watershed Technologies, preliminary draft Cost Analysis). Only
those expenses that varied due to the different treatment technologies were considered in the
analysis. For purposes of this evaluation, chemical costs were the most reliable, and based on
prior studies, are by far one of the most prominent life cycle expense (capital or operating)
associated with chemical treatment systems. Differences in expenses associated with land
requirements and floc management were not available, and because they are likely minor relative
to chemical costs, they were excluded from the analysis.
The test data were tabulated and averaged by treatment process. Total inflow for the test period
per train was calculated and chemical usage tabulated. The amount of aluminum consumed was
determined by multiplying total flow (flow per train times the number of trains per technology)
times dosing rate. Total chemical costs equals aluminum consumption times price per unit. The
test data for TP concentration was interpolated for the non-sampling days in the trial period. TP
mass was determined by multiplying daily flow by the number of trains for each technology
times TP concentration, converted into pounds. The amount of TP removed is the difference
between TP inflow mass and TP outflow.
The total cost for the conventional methods Hyperion 1090, alum + aluminate, and the HWTT
were $7.53, $5.74, and $2.62 respectively. The projected marginal cost benefit in costs per
kilogram P removed are $114.53 for Hyperion; $83.62 for conventional alum + aluminate; and
$37.62 for HWTT (Watershed Technologies, preliminary draft Cost Analysis). As noted
previously, the HWTT mesocosm trains did not employ either dry or wet floc recycling, which
5
5.5
6
6.5
7
7.5
8
8.5
9
Inflow HWTT Hyperion Alum +
aluminate
pH
Inflow
Outflow

Final Report – Chemical Treatment
133
would result in a net cost benefit (see Figure 5-14) and hence an additional reduction in the cost
per pound of P removed by the HWTT system.
This side-by-side mesocosm scale comparison revealed several interesting aspects of HWTT
system treatment effectiveness. First, in addition to incurring lower operational costs, the HWTT
achieved a much lower outflow P concentration than attained by the conventional chemical
processes. Second, the data from Figure 5-15 suggests that the technologies tended to maintain
their relative outflow differences through a range of inflow concentrations. In other words,
despite a variable cost per pound of P removed, it appears that the respective chemical costs of
the Hyperion 1090 and alum + aluminate systems remained at approximately 3.0X and 2.2X of
the HWTT facility. When treating large flows and P loads within the Northern Everglades
watershed, these differences in chemical consumption (and operating costs) will be significant.
IMPLEMENTATION ISSUES
In the following sections, addressed are questions pertinent to the implementation of HWTT
systems in the Northern Everglades watershed.
What P concentrations and/or species will respond to chemical treatment cost effectively?
HWTT systems are similar to treatment wetlands (i.e., STAs) and conventional chemical
treatment systems in that the ease at which P compounds are removed is typically in the order:
soluble reactive P, particulate P and dissolved organic P.
What volume or flow rate is logistically feasible for treatment?
Due to the large parcels of land available in the Okeechobee watershed, and the potential for
additional reservoir/STA construction, there are almost no constraints on the flows that can be
treated with a HWTT system in the watershed.
Where in the KOE planned features can chemical treatment be applied?
A HWTT system can be deployed at edges of fields, adjacent to creeks, in existing lagoons or
STAs/ reservoirs, or in concert with planned STAs/ reservoirs. Optimization and operations of
HWTT facilities during 2007 and 2008 demonstrate that a range of water types and inflow P
concentrations can be successfully treated by the HWTT technology.
What water quality parameters affect chemical treatment P-reduction efficiency? Do we have
sufficient existing data or is additional data required?
Alkalinity, color, suspended solids, soluble reactive P, particulate P and dissolved organic P are
all parameters that will influence treatment within a HWTT system. We have sufficient data to
understand the major controlling water quality variables in HWTT systems. Additional data are

Final Report – Chemical Treatment
134
currently being collected in selected areas of the watershed to refine our understanding of the
spatial and temporal variability of these parameters. This will aid in quantifying appropriate
HWTT system design and operational approaches for sub-basins within the Northern Everglades
watershed.
What water quality standards must be met for chemically treated discharges to various
receiving waters?
A fully implemented HWTT process employs desirable back-end vegetation communities that
assure a discharge that is biologically compatible with receiving waters. The HWTT system
discharge also must meet appropriate standards (typically Class III) as well as levels of those
parameters defined by permit.
What is the best aerial economy of scale for treatment system implementation (parcel, sub-
basin, STA, reservoir)?
HWTT systems can be efficient with virtually no scale or placement limitations. Existing land
ownership patterns (public vs. private) will largely dictate the appropriate scale and locations.
Existing publically owned land (regardless of scale) is advantageous from an incremental capital
expense standpoint, where positive savings will accrue through elimination of land costs (i.e.
sunk cost). By contrast, edge of farm systems may prove more effective from an operating cost
standpoint, due to potentially higher TP concentrations at these locations.
Can the chemical treatment be permitted?
The FDEP has indicated that they will process permit requests and determine the appropriate
permit type on a case-by-case basis. It may be possible for stormwater and surface water
treatment systems that utilize some form of chemical treatment (that have minimal impacts to
water resources, and that can be operated in a manner that does not cause violations of water
quality standards) to be permitted under FDEP‟s Noticed General Environmental Resource
Permits [Chap 62-341, F.A.C.]. It is also possible that these systems could be eligible for the
existing Sec. 62-341.485 “General Permit to Water Management Districts for Environmental
Restoration or Enhancement.”
What are the monitoring requirements of planned solutions?
Parameters that should be monitored include major elements/compounds that are added to or
removed from the inflow waters. Also parameters that have water quality standards coupled
with the potential to significantly alter the receiving body should be monitored. Monitoring
requirements also will depend on those required by permits.

Final Report – Chemical Treatment
135
What are the cost-benefits of planned solutions?
Benefits include efficient total mass nutrient removal; high percent nutrient removal; very low
outflow concentrations; removal of biologically active nutrient forms; reduced costs through
highly efficient utilization and reuse of floc; reduced chemical costs achieved through the use of
wetland components of the HWTT process; large-scale reduction in land costs compared to
traditional wetland treatment systems; and HWTT projects well-suited to implementation on
existing SFWMD properties and/or private property with associated cost/benefits to the
landowner. Economic viability of a technology is highly dependent on isolation of system
components and attendant costs; e.g. existing detention areas that provide significant treatment
capacity but have no capital value assigned will distort performance of associated chemical
processes. HWTT is a complete system that integrates the best of chemical and wetland
treatment. All benefits, including tangible and intangible, should be considered and weighted
against other treatment technologies.
With respect to developing accurate technology costs, site-specific cost estimates will need to be
developed; using actual operational data (or on-site pilot-scale data) collected through both wet
and dry seasons (and wet and dry years). The Nubbin Slough mesocosm test bed performance
and cost comparison described above provides a good start for defining cost-effectiveness of
HWTT systems.
What factors affect settling and residuals management? and, What are cost effective options
for residual management?
Physical characteristics (size, density) largely control the settling rate of flocs. The HWTT does
not require large tracts of land to be set aside for residual drying and storage, as was incorporated
at the Davie Dairy BAT site. The most cost effective approach for managing flocs is to detain,
dry and re-use residuals on-site, by incorporating them into the HWTT treatment system
footprint for additional P removal.
What chemicals and treatment configurations should be further evaluated?
Aluminum compounds, iron compounds, appropriate polymers and polymer-metal blends can all
be utilized in HWTT systems. Water chemistry conditions at each particular site will dictate
which chemicals should be further evaluated. While the P bound in iron hydroxide flocs is redox
sensitive, and can release P under anoxic conditions, iron coagulants should still be suitable for
use in HWTT systems where only temporary floc reuse and storage is implemented. Iron-based
coagulants currently are being tested at the Davie Dairy HWTT Mesocosm test bed facility.
SUMMARY
HWTTs can be successfully deployed in the Northern Everglades watershed, due to their strong
potential for maximizing the efficiency of coagulant use. Initial work with waters in the Lake
Okeechobee watershed, however, indicates that metal coagulant and buffer dose requirements
can significantly vary both spatially and temporally within the basin. This factor, along with the

Final Report – Chemical Treatment
136
multiplicity of HWTT control variables, suggests that an optimization period is required for
initial HWTT installations. HWTT design and operational factors that can be adjusted include:
relative size and configuration of the wetland (floating and/or submerged vegetation) unit
processes; type and dose of coagulants, coagulant aid and buffers; and amendment dosing cycles.
Once optimized, HWTT systems should prove to be a predictable, sustainable and cost-effective
technology for achieving water quality targets in the Northern Everglades watershed.
REFERENCES
DeBusk, T.A., K. A. Grace and F.E. Dierberg. 2005a. Treatment wetlands for removing
phosphorus from agricultural drainage waters. In: E. J. Dunne, K. R. Reddy and O.T.
Carton, Eds, Nutrient Management in Agricultural Watersheds: A Wetlands Solution. Pp.
167 – 178. Wageningen Academic Publishers, The Netherlands.
DeBusk, T.A., R. Baird, D. Haselow and T. Goffinet. 2005b. Evaluation of a floating wetland for
improving water quality in an urban lake In: Proceedings of 8th
Biennial Conference on
Stormwater Research and Watershed Management, pp. 175 – 184. Southwest Florida
Water Management District, Brooksville, FL, USA
Kadlec, R.H. and S.D. Wallace. 2009. Treatment Wetlands. 2nd
. Edition. CRC Press, Boca
Raton, FL, USA.
SFWMD. 2000. Everglades Consolidated Report, Chapter 8: Advanced Treatment Technologies
for Treating Stormwater Discharges into Everglades Protection Area. South Florida
Water Management District, West Palm Beach, FL, USA
Stanley Consultants, Inc. 2002. Lake Okeechobee Water Retention and Phosphorus Removal
Project. Design Analysis Report, Vol. 1. Prep. for Army Corps of Engineers,
Jacksonville, FL, USA.
SWET. 2008. Dairy Best Available Technologies in the Okeechobee Basin: Literature Review,
Prep. By Soil and Water Engineering Technology, Inc. Project Report for South Florida
Water Management District, West Palm Beach, FL, USA
Watershed Technologies, 2008. Implementation of Hybrid Wetland Treatment Technology in the
Northern Everglades Watershed. Final project report submitted to the Florida Department
of Agriculture and Consumer Services, Tallahassee, FL, USA.
Watershed Technologies, Draft. Nubbin Slough Full-Scale and Mesocosm-Scale HWTT
Preliminary Cost –Benefit Analyses.

Final Report – Chemical Treatment
137
CHAPTER VI EDGE OF FARM (EOF) TREATMENT SYSTEMS
INTRODUCTION
Chemical treatment has been used for many years to clean up lakes and urban stormwater runoff,
however there has been a limited focus on the use of chemical treatment for stormwater
originating from agriculture. In 2003, Soil and Water Engineering Technology, Inc. (SWET)
lead a South Florida Water Management District (SFWMD) project to evaluate potential
technologies that could reduce nutrient discharges, particularly phosphorus (P), leaving farms
through stormwater runoff (SWET, 2008a). The 2003 project goal statement used, provided a
clear target of success for that project:
This project will result in the unbiased identification, selection, implementation, and monitoring
of Best Available Technologies (BATs) that will significantly reduce P export from dairy
operations into Lake Okeechobee and its tributaries and bring about the most substantial
improvements in water quality in the shortest amount of time possible, while minimizing project
costs and detrimental socio-economic impacts to the local region.
The rationale and objectives behind the project were to identify a technology or a combination of
technologies that will provide the highest probability to achieve the goal of reducing P discharge
concentrations from the participating dairies to 40 micrograms per liter (µg/L). All appropriate
technologies were identified and ranked through a comprehensive literature review (SWET,
2001a). Once selected, the technology should be implemented to the maximum feasible extent
within the project budget to determine the actual P reduction that can be achieved per dollar
spent. The individual task reports 2.6, 2.10, and 2.11 (SWET, 2001b, 2002a, 200b) described the
process of evaluating and selecting the technology in detail. In summary the selection criteria
included the following:
1. Ability to reduce P to target levels
2. Capital costs
3. Operation and maintenance (O&M) costs
4. Compatibility with existing farm practices
5. Dairyman acceptance
The ultimate goal for the project is to reduce P runoff through stormwater (export) from the
participating dairies while simultaneously determining the actual cost effectiveness of the
technology implemented, which is subsequently used to determine its feasibility for future use.
The literature review and evaluation of the various technologies determined that the edge-of-
farm (EOF) treatment of stormwater by use of Retention/Detention (R/D) and chemical treatment
had the highest probability to achieve the project goals and objectives. Four systems were
designed, constructed, and evaluated on four separate dairies within the Lake Okeechobee

Final Report – Chemical Treatment
138
watershed. This chapter presents an overview of the technologies used and the results of the
evaluation of the four systems. Though this chapter presents results for dairy stormwater
discharge, EOF technology applies equally as well to any land uses that have high P
concentrations in their discharge. The higher the P concentration the more cost effective will be
the EOF system greater. Based on the project results, it is estimated that P concentration of 350
ppb or greater would be needed to make EOF more cost effective.
OVERVIEW OF EDGE OF FARM TECHNOLOGY
The primary advantage of treating runoff at the edge of a property is that it only has to treat the P
that is ultimately leaving a property, which is a small fraction of the P that is potentially
mobilized within a farm. This means that the EOF is the point where the minimal amount of
chemicals would be needed to reduce P discharges. However, it is important to note that any on-
farm Best Management Practices (BMPs) that reduce the amount of P leaving the farm in
stormwater directly reduces the need for EOF treatment and should be implemented, particularly
those that are more cost effective than EOF. Unfortunately on-farm BMPs do not yet have the
ability to reduce P discharges to Total Maximum Daily Load (TMDL) targeted levels for Lake
Okeechobee, particularly for some of the more intensive land uses, such as dairies, vegetable
production, and high density urban. The Lake Okeechobee TMDL of 40 ppb P and the TMDL
target of 113 ppb P for the Northern Okeechobee tributaries (FDEP, 2001, SWET, 2008b and
EPA, 2008) will likely not be achieved by BMPs alone. It will take a combination of BMPs,
EOF chemical treatment, and other P reduction technologies to achieve this target.
The EOF system has two distinct components: R/D ponds with water reuse to minimize the
volume and peak flow of stormwater discharges and a chemical flocculation treatment system to
remove P when the R/D pond discharges. The amount of R/D that can be accomplished is very
site specific and may not be practical in some situations.
Figure 6-1 provides a conceptual view of the EOF system. The system is designed to collect and
divert as much surface and groundwater flow as possible from the high P source areas on a farm
to a stormwater R/D pond and chemical treatment. The system has the following four major
components:
1. Land source areas needing stormwater treatment
2. System of ditches, dikes, and pumps to collect and divert runoff to the treatment system
3. R/D pond (s) for storing water for treatment and reuse on farm
4. Chemical treatment system for discharge from the R/D pond
The R/D pond will provide some wetland treatment, but will serve primarily as a surge control
for the chemical treatment system of any offsite discharge and as a storage facility for water
reuse on the farm. Chemical treatment (aluminum or iron flocculation) of the impoundment
discharge will occur at the end of the R/D pond farthest from the inflow to reduce Phosphorus as
much as possible in wetland assimilation before chemical treatment is applied. The impounded
discharge will be injected with an iron or aluminum salt as it flows, via pump or gravity, into a
sump/basin sized to ensure complete flocculation and settling prior to final discharge from the
property. The chemical treatment system will operate only when the storage capacity of the
system is exceeded or to recover storage capacity prior to successive storm events.

Final Report – Chemical Treatment
139
Chemical Treatment
Fields
&
Pastures
Retention/Detentio
n Pond
Sprayfield
s
Barns
& HIAs
Reuse
Pump
40 - 100
ppb
Settlin
g
Ponds
Land Source
Area for
Runoff
Syste
m
Bypas
s
Chemical Mix/ Injection Pump
Discharge Off
Dairy
Stormwater Collection
and Diversion to Pond
runof
f
Roof
Runof
f
Only
runof
f
Pump
or
Gravity
Feed to
Pond
Pump or Gravity Feed
Retention/Detention
& Treatment
0-30% of annual flow
Figure 6-1. Conceptual Design of EOF
Ditche
s
&
Dikes
Sludge Disposal
Wastewate
r
Treatment
Ponds

Final Report – Chemical Treatment
140
Cost Considerations of EOF Technology
Initial cost analysis indicated that an EOF system could achieve the P reduction goals required
by the TMDL, however the relative cost is directly affected by the targeted reduction goal. The
initial targeted discharge goal of 40 µg/L of P set for the Dairy BAT project was found to be
unachievable within the allocated project budget. This was due in part to the cost of treatment
exponentially increasing as the level of required P removal increased. This exponential cost
relationship for treatment is the result the stochastic nature of runoff events and chemical
flocculation becoming less efficient as P concentrations decline. The larger R/D ponds and
larger pumps needed to capture and retain the infrequent large stormwater events also cause
these high costs. If the runoff from these large storms cannot not captured, then any runoff
greater than the R/D storage volume would have to be bypassed (i.e., not treated). The fraction of
untreated runoff will dilute the treated water, raising the average P concentration in the
discharge.
The second constraint mentioned above is the chemical demand for P removal increases
exponentially as P removal rate increases. For example, the amount of chemical required to
remove the first 50 percent of P will be less than that required to remove the last 10 percent (i.e.,
going from 90 to 100 percent removal). In relation to the anticipated P concentrations to be
treated, this means that the last 50 µg/L of P reduction would likely require as much chemical as
the first 1,000 µg/L of reduction. Preliminary estimates for chemical costs indicated that the
dairymen might not be able to afford treatment to 40 µg/L of P, but that significant reductions
could be achieved for an acceptable cost.
APPLICATIONS AND SUCCESS STORIES
The Dairy BAT project was initiated in November, 2003 and ultimately resulted in four separate
edge-of-farm (EOF) treatment systems being designed, constructed, and evaluated for
phosphorus removal efficiencies. The primary goal of this project was to reduce P loads while
determining the actual construction and O&M costs and P removal efficiencies for these EOF
systems, so that true cost efficiency relationships can be better understood. Such relationships
are critical for determining the future applicability of these systems for P control in the
Okeechobee Basin. The following sections will briefly describe these systems, how well they
performed, and lessons learned.
Butler Oaks Dairy EOF System
The Butler Oaks Dairy EOF system was designed and constructed by CDM, Inc. The dairy is
located on County Road 721 just west of the Kissimmee River. A unique characteristic of this
dairy is that it has a lower intensive land uses west of the road about the same size as the active
dairy portion of the property to the east of the road. This situation required significantly more

Final Report – Chemical Treatment
141
diversion ditches upstream of the retention areas to separate the low P runoff from the low use
west tract and off-farm areas from the dairy‟s east tract‟s more P-laden runoff that required
treatment. The east tract contains the main dairy activities, including the milking center, milk
herd pastures, calf barn, and the sprayfield. The flow from the west tract is also mixed with
runoff from the neighboring B-4 dairy and wetlands west of the tract before coming onto the east
tract. This on-flow does contain moderate P levels, but it is estimated that only about 20 percent
or less of the P would be from Butler Oaks Dairy‟s west tract based on the land use and acreage
of contributing areas. Initial design analyses considered including this inflow in the treatment
system, however, it was found that the cost of the system would exceed the available budget. The
system was therefore designed to treat the water from just the east tract of Butler Oaks Dairy,
which is shown in Figure 6-2.
Because of the availability of a non-intensive land use (woodland) on the down slope portion of
the dairy at its east end, the retention storage requirements were met with a gravity inflow
system. Shallow water depths and quicker storage recovery in the R/D area were important for
protecting the oak trees in the area. This more rapid drawdown after a storm event decreased the
water reuse potential for this system. The gradients were not sufficient to gravity feed the
chemical treatment system; therefore, two pumps were used to lift water into the treatment
system. One of these pumps can be used to pump water into the waste storage pond for reuse.
To collect the east tract runoff and isolate it from the bypass water from the west tract, a new
treatment system collection ditch was constructed parallel to the existing south canal (Figure 6-
2). This new ditch connects to the existing north/south (N/S) sprayfield ditches to collect all
runoff from the irrigated fields, which receives effluent from the waste storage pond. The new
treatment system collection ditch continues to flow east to the R/D area, which is then pumped
through the alum treatment system. A berm was constructed around the perimeter of the R/D
area. The berm has a 2-foot freeboard over the control elevation of 31.0 feet National Geodetic
Vertical Datum (NGVD). Stormwater from the pastures and road on the north side of the eastern
tract is diverted along the south side of Boat Ramp Road in the improved road ditch to a point
just east of the existing culvert under the road. At this point, a new north/south ditch from the
road ditch to the “center” ditch east of the milk barn was constructed to transfer drainage water
to the “center”

Final Report – Chemical Treatment
142
Figure 6-2. Layout of the Butler Dairy EOF System

Final Report – Chemical Treatment
143
ditch. A culvert and flapper gate from the “center” ditch to an internal drainage ditch within the R/D area
allows water from the “center” ditch to drain into the R/D area when water levels in the “center” ditch exceeds
the level in the R/D pond. The water that flows to the R/D internal ditch from the center ditch is pumped either
to the treatment system or to the waste storage pond for reuse via lift pumps located on the south side of the 3rd
stage waste storage pond. This internal ditch is used to ensure adequate dewatering of the oaks in the R/D
area.
The stormwater treatment system uses two lift pumps, alum chemical injection system, large
flocculation/settling pond, and sludge de-watering area. Discharge from the settling pond is piped to the
existing south boundary ditch. An emergency overflow is located between the R/D storage area and the
existing outfall canal at an elevation of 31.5 feet NGVD.
Davie Dairy EOF System
The Davie Dairy EOF system was designed and constructed by ERD, Inc. The steeper gradients
along the lower section of Nubbin Slough near the property border and the wetlands within the
slough limited the ability to create R/D storage. An earthen dam with three corrugated metal
pipe (CMP) culverts with gate structures was constructed across the slough to create a small R/D
area (Figure 6-3) behind the dam. The primary purpose of the earthen dam, however, was to
divert water to the chemical treatment system, and not to retain water. Therefore, this system
can be considered a flow-thru instead of R/D pond based system. A 4-foot diameter pipe extends
from the slough upstream of the culvert structure to deliver water via gravity to the chemical
treatment system. Although the topography allows for a gravity-fed system, the storage volume
R/D storage behind the dam could only hold back about 0.3 inches of stormwater runoff.
Therefore, ERD designed the chemical treatment system to handle high peak flow rates to allow
the system to treat 100 percent of the runoff from storms up to 3.5 inches per day. A flowmeter
was installed in the inlet pipe of the treatment pond to control the speed of the chemical
feed/injector pumps in order to maintain constant chemical dosing concentrations at variable
water flow rates. The chemical dosed water flows into a large flocculation/settling pond before
discharging back into Nubbin Slough downstream of the diversion structure. Sludge in the
flocculation/settling pond can be hydraulically pumped into above ground drying beds for sludge
dewatering prior to land application.
Dry Lake Dairy EOF System
The Dry Lake Dairy EOF system was designed and constructed by EWR, Inc. The Dry Lake
Dairy system was a more conventional R/D pond storage type system (Figure 6-4). The EOF
treatment system consists of a traditional aboveground surface water management system
followed by chemical treatment. The system required 2,600 feet of new ditches, a 48-acre
surface water impoundment, a 13,200-gallon-per-minute (gpm) lift pump, a gravity based alum
feed/mixing unit, and two flocculation/settling ponds. The Dry Lake Dairy system has a unique
gravity based chemical injection system. An 18-inch culvert from the R/D pond delivers water
to the chemical treatment system. The culvert flow passes under a 4-foot gate (can also be used
to stop flow) to create an orifice flow condition, which provides a flow signal for controlling the
alum injection rate based on the stage-to-flow relationship. After alum is injected, the flow is

Final Report – Chemical Treatment
144
Figure 6-3. Layout of the Davie Dairy EOF System.

Final Report – Chemical Treatment
145
Figure 6-4. Layout of the Dry Lake Dairy EOF System.
Final Report – Chemical Treatment
146
forced through a multi-vaned flow mixer before entering two flocculation/settling ponds. The
bottoms of these ponds have under-drains which allow dewatering of sludge in the ponds during
dry periods.
The Dry Lake Dairy was sold for development in 2005, so data collection ceased in December
2005. However, the retention pond and lift pump were continued to be operated by the
developers through the beginning of 2007 when the pond was modified to accommodate the new
ERP permitted equestrian community stormwater system .
Milking R Dairy EOF System
The Milking R Dairy EOF system was designed and constructed by Royal Consulting Services,
Inc. (RCS). The Milking R system is similar to the Dry Lake System in that it is also a
conventional R/D pond storage type system (Figure 6-5). To deliver runoff to the EOF system, a
ditch block was constructed along the northern end of the farm‟s north-south ditch to prevent
flow from neighboring properties from entering the treatment system. The central farm ditch was
improved to better deliver runoff from all parts of the farm to the R/D pond. Flashboards were
installed to the top of bank elevation in an existing outflow structure on the west side of the
property to redirect flow to the collection ditch running east towards the R/D pond. Runoff to
the west of the previous Bion treatment system had a small lift pump installed to utilize the old
Bion System Wetland for pretreatment of runoff going to the R/D pond. Two 8,000 gpm lift
pumps were installed to transfer water from the collection ditch into an 87-acre R/D pond. Any
excess water that discharges from the R/D pond during very wet periods is treated with alum
proportional to the flowrate by the chemical injection system. The alum injection flow rate is
controlled by a unique flow metering system that creates timed pulses to operate four different
sized solenoid values based on the stage-to-flow relationship over the discharge structure. The
treated stormwater enters a 3.1-acre flocculation/settling pond where the alum floc settles out.
Treated discharges from the settling pond are then released offsite. A sludge drying bed is
provided along the northwest side of the settling pond.

Final Report – Chemical Treatment
147
Figure 6-5. Layout of Milking R Dairy EOF System.

Final Report – Chemical Treatment
148
While the Dairy BAT systems were being constructed, monitoring plans for each of the systems
were developed that would provide the data needed to evaluate the P removal efficiencies of
each of the systems. The monitoring systems were designed to measure the flow rate and P
concentrations of the inflow and outflow of the systems so that, the amount of P removal could
be determined. Flows were calculated by measuring the depth of water flowing over weir
structures, using water velocities and depths in culverts, or the runtimes of lift pumps. The P
concentrations were determined by using auto samplers that collected a flow proportional
composite sample at the inflow and outflow points of each system. Grab samples were also
collected during site visits for additional information and to provide a secondary measurement in
case of sampler problems.
The water quality data and downloaded velocity and depth data via cellular telemetry from the
automated sampling stations were processed through the EXCEL® data management
spreadsheets, which performed quality control (QC) checks and calculated the flow and P loads
for each system. The spreadsheet also plotted stages, velocities, and flows for a visual inspection
and validation. Multiple monitoring sites were installed at each dairy to evaluate pre-
construction flow and P load conditions entering and leaving the farms. The information was
used to quantify flow and P loads for the purpose of optimizing the EOF system designs. Table
6.1 provides a summary of the pre-construction flow and P load monitoring data for the first
three dairies (Milking R did not have pre-construction monitoring due to addition of this dairy
late in the process). In all cases, the final designed EOF systems significantly modified the
drainage systems on each of the dairies so that none of the pre-construction monitoring sites/data
corresponds directly with the EOF outflow (TOUT) monitoring locations. However, a
reasonable adjustment was made to the pre-construction data to generally represent the
conditions upstream of the EOF TOUT monitoring locations that are described later in this report
for the EOF systems. For Davie Dairy no adjustment was needed because the pre-construction
Davie South site was only a few hundred yards downstream of the EOF system. However, at
Butler Oaks Dairy the entire flow passing through the 10D monitoring site from more natural
areas upstream of the dairy was diverted around the EOF system, and therefore this flow had to
be subtracted from the total farm discharge monitored at 41A. This adjustment makes clear that
the P concentration off the dairy land downstream of 10D had much higher concentrations. The
adjustment made for Dry Lake accounted for the fact that about 50 percent of the land that
drained out through the 49A pre-construction was diverted to the EOF system which outputs to
the 32B monitoring site. While the Dairy BAT systems were being constructed, monitoring
plans for each of the systems were developed that would provide the data needed to evaluate the
P removal efficiencies of each of the systems. The monitoring systems were designed to
measure the flow rate and P concentrations of the inflow and outflow of the systems so that, the
amount of P removal could be determined. Flows were calculated by measuring the depth of
water flowing over weir structures, using water velocities and depths in culverts, or the runtimes
of lift pumps. The P concentrations were determined by using auto samplers that collected a
flow proportional composite sample at the inflow and outflow points of each system. Grab
samples were also collected during site visits for additional information and to provide a
secondary measurement in case of sampler problems.
The water quality data and downloaded velocity and depth data via cellular telemetry from the

Final Report – Chemical Treatment
149
automated sampling stations were processed through the EXCEL® data management
spreadsheets, which performed quality control (QC) checks and calculated the flow and P loads
for each system. The spreadsheet also plotted stages, velocities, and flows for a visual inspection
and validation. Multiple monitoring sites were installed at each dairy to evaluate pre-
construction flow and P load conditions entering and leaving the farms. The information was
used to quantify flow and P loads for the purpose of optimizing the EOF system designs. Table
6.1 provides a summary of the pre-construction flow and P load monitoring data for the first
three dairies (Milking R did not have pre-construction monitoring due to addition of this dairy
late in the process). In all cases, the final designed EOF systems significantly modified the
drainage systems on each of the dairies so that none of the pre-construction monitoring sites/data
corresponds directly with the EOF outflow (TOUT) monitoring locations. However, a
reasonable adjustment was made to the pre-construction data to generally represent the
conditions upstream of the EOF TOUT monitoring locations that are described later in this report
for the EOF systems. For Davie Dairy no adjustment was needed because the pre-construction
Davie South site was only a few hundred yards downstream of the EOF system. However, at
Butler Oaks Dairy the entire flow passing through the 10D monitoring site from more natural
areas upstream of the dairy was diverted around the EOF system, and therefore this flow had to
be subtracted from the total farm discharge monitored at 41A. This adjustment makes clear that
the P concentration off the dairy land downstream of 10D had much higher concentrations. The
adjustment made for Dry Lake accounted for the fact that about 50 percent of the land that
drained out through the 49A pre-construction was diverted to the EOF system which outputs to
the 32B monitoring site. The adjusted pre-construction data are presented as the equivalent
TOUT column in Table 6.1so it can be roughly compared to the flow and P loads for the
outflows from the EOF systems. However it should be noted that the flows and P loads are also
highly influenced by rainfall and that the pre-construction years were a little drier than normal
rainfall. The data are presented as the equivalent TOUT column in Table 6.1so it can be roughly
compared to the flow and P loads for the outflows from the EOF systems. However it should be
noted that the flows and P loads are also highly influenced by rainfall and that the pre-
construction years were a little drier than normal rainfall

Final Report – Chemical Treatment
150
Table 6.1 Pre-construction Monitored Flow and P Loads for Three Initital EOF Systems (March
2002 through March 2004)
for Butler and Dry Lake dairies, but these years were significantly wetter for Davie Dairy,
particularly for 2003. These pre-construction sites were abandoned when the EOF monitoring
systems were installed.
The EOF systems monitoring stations were installed in late 2003 for Davie Dairy, early 2004 for
Butler Oaks Dairy and Dry Lake Dairy, and Milking R Dairy monitoring came on line in late
2005. These flow and P load results were used to estimate the overall summary (Table 6.2) of
the estimated annual flow and phosphorus loads from the startup of each system (October 2003
for Davie Dairy and March 2004 for Butler Oaks Dairy and Dry Lake Dairy) through the end of
the project (December 2007). The individual farm subtotal percentage reductions are calculated
based on the flow-weighted yearly reductions.

Final Report – Chemical Treatment
151
Table 6.2 Summary of P Reductions for Dairy BAT Project to Date
Table 6.3 provides an additional breakdown of the flow and P loads data for the various
monitoring locations. The estimated flow volumes are subject to error due to equipment
problems as described in the project‟s quarterly progress reports, but these data losses did not
significantly limit the assessment of the performance of the systems and estimated error of about
±20 percent for P removal rates provided in Tables 6.2 and 6.3. Table 6.2 clearly shows
significant reductions were achieved for the R/D pond based systems. As also can be seen, the
majority of the P reductions for Dry Lake, Butler Oaks, and Milking R systems were due to
water retention and reuse. The volumes pumped into the R/D ponds follow the rainfall pattern
except for the observed large pumping difference during 2006 between Milking R and Dry Lake.
This difference was initially puzzling since these dairies neighbor each other, but then it was
realized that a unique combination of three contributing factors was the likely cause. First, the
Dry Lake pump station was being operated during 2006 by the developer to optimize their
construction activities which significantly increased the pumping rate over those measured for
Milking R. Secondary, there were significant internal drainage improvements at Milking R that
increased within-farm water retention thus reducing the amount of stormwater needing to be
pumped into its R/D pond, and lastly the 2006 rainfall came in an unusually well distributed
pattern where very few individual events exceeded 1 inch. Such a rainfall pattern created very
little runoff if on-site retention was available, which was the case for Milking R.
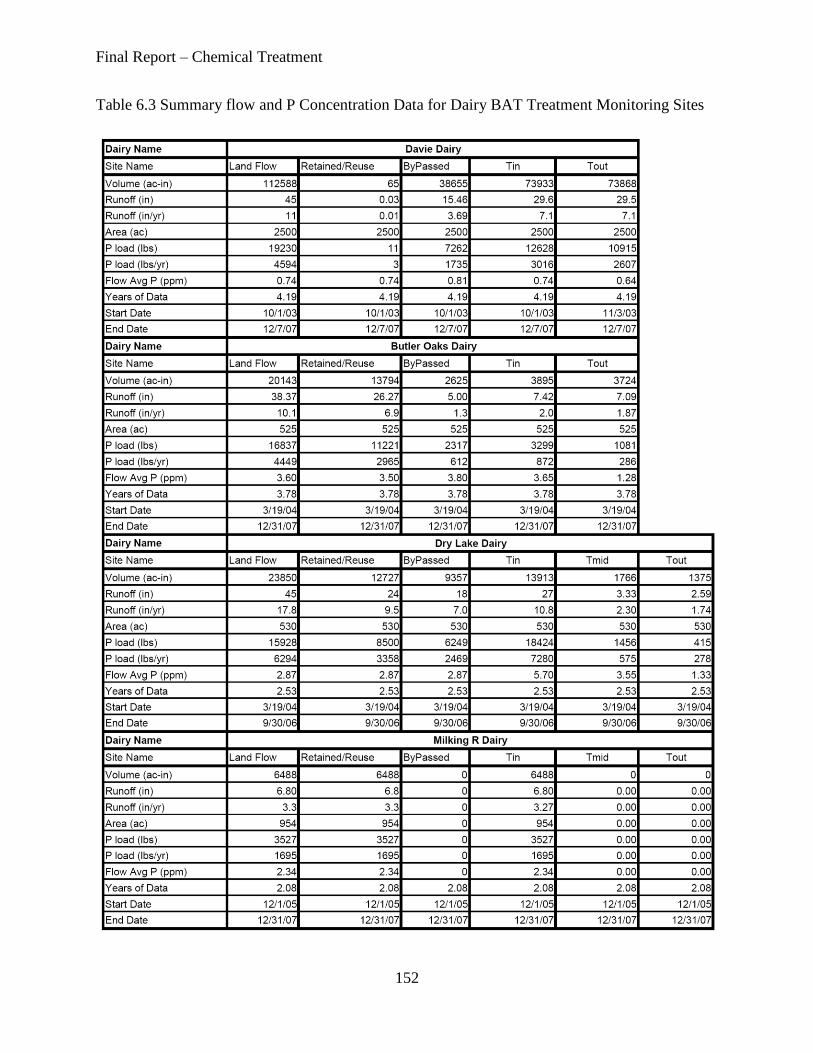
Final Report – Chemical Treatment
152
Table 6.3 Summary flow and P Concentration Data for Dairy BAT Treatment Monitoring Sites

Final Report – Chemical Treatment
153
The low P removal efficiency at Davie Dairy was due to the system‟s high dependency on the
chemical treatment for removing P, which unfortunately only functioned approximately 20
percent of the time. The pass-thru design with essentially no retention/reuse capability is the
reason for the high dependency on the chemical treatment system. The possible causes of the
systems poor performance are discussed in a following section on operation and maintenance.
The influence of annual variations in rainfall and resulting runoff can also be seen in Table 6.2.
It is important to note that three of the four evaluation years were below the average rainfall of
47 inches/year and therefore the observed P reductions associated with retention/reuse are higher
than the long term anticipated performance of the system by an estimated 10 percent. However,
year 2004 does give an insight into the performance during a wet worst case scenario, where
approximately 15 inches of the annual above average rainfall of 55 inches came during two
hurricanes, which created significant bypass conditions. Bypass water occurs when the runoff
rates exceed pump capacities. Bypass water is untreated, and therefore reduces the net P
removal efficiency during these periods. Even during 2004 the R/D systems had over 50% P
reductions and this included the increase in bypass water at Butler Oaks due to hurricanes which
caused several days of power outage at the pump station. Years 2005, 2006, and 2007 were
approximately 5, 10, and 12 inches below normal rainfall, respectively, resulting in much higher
P removal efficiency, particularly for the very dry year of 2007 where all three R/D systems
retained 100% of the stormwater generated within the farm. The percent of P removed due to
reuse/retention provides an indication of how effective water reuse and retention is compared to
chemical treatment. Chemical treatment becomes more important during wet years because the
amount of water needing treatment is higher. Unfortunately, for the R/D pond systems the actual
P removal efficiencies of the chemical treatment systems are not correctly represented due to the
high P removal for water reuse and retention. At Davie Dairy the P removal is almost entirely
dependent on chemical treatment.
Table 6.4 provides the chemical treatment P removal efficiencies during operational periods
except for Milking R, which never discharged due to its high retention storage. As can be seen
in Table 6.4, chemical treatment efficiencies ranged from 58 to 98 percent with an average of
about 80 percent. The Dry Lake system afforded the opportunity to run tests at different alum
concentrations to field verify the jar testing data for proper dosing rates, which was 25 mg/l Al.
Table 6.4 verifies that this dosing rate of alum appears to be correct. It is clear that if needed the
chemical treatment systems will provide significant treatment. The key is that the chemical
treatment systems must be in activation mode at all times.

Final Report – Chemical Treatment
154
Table 6.4. The Estimated Treatment Efficiency of the Three Dairy BAT Systems during Period of Operation.
Operation and Maintenance – Lessons Learned
As anticipated, a number of equipment and other operation and maintenance issues occurred
during the project. In spite of these issues, very high P removal efficiencies were obtained for all
but one of the systems. Details of these issues are presented in the project status reports, but the
most significant issues will be highlighted in this report with solutions presented. Probably the
most important lesson learned from all of the systems was not to assume that the landowner
would have the time and expertise to properly operate and maintain complex chemical injection
systems. This operational error was also determined to be the primary source of system failures.
These failures were due in part to equipment malfunction and partly to the lack of available
trained technicians to remedy problems in a timely fashion. As indicated above, the Davie Dairy
system was the most vulnerable to chemical injection system problems because its injection
system had to work almost continuously when compared to the other three systems. The large
retention systems of the other three systems greatly limited the amount of water needing
treatment thus requiring only infrequent and short periods of chemical injection. The following
summary of the problems that occurred at Davie Dairy highlights the issues.
First, alum was not used because initial jar tests indicated that pH buffering with sodium
hydroxide was needed to achieve required flocculation rates. Instead, an aluminum polymer
(Hyper+Ion 4090) was selected. Unfortunately, this chemical created two problems; 1) it
corroded internal parts of the injector pump, and 2) in late 2005 it congealed in the tank requiring
a three month cleanup effort. A second more expensive aluminum polymer (Hyper+Ion 1090)
was then selected and installed, but unfortunately this polymer was found to produce a floc with
poor settling properties when injected below optimum rates. Dosing at optimal rates was very
difficult because the inflow P concentrations were highly variable ranging from 0.4 to 1.5 ppm.
Other issues at this site included the flowmeter failing twice due to lightning strikes, the injector
pumps by design were not able to slow to the speeds needed to inject chemicals at reduced flow
rates, and the deep rectangular flocculation pond was short circuiting due to thermal clines and
poor geometry. The short circuiting effectively created shorter retention times for floc
sedimentation. All of these issues resulted in the injection system at Davie Dairy being non-
operational approximately 80 percent of time. However, during the brief period where the
system was operational with the original aluminum polymer, the Davie Dairy system was
achieving over 65 percent P removal efficiencies. Butler Oaks and Dry Lake systems
experienced less chemical injection system problems and those problems experienced were
mostly associated with the corrosive nature of the alum on valves and pipes. The Milking R
Final Report – Chemical Treatment
155
Dairy injection was never used due to the system‟s high retention and water reuse, i.e. the
retention pond never discharged until after the project ended in 2007. However, during post
project tests by the South Florida Water Management District, high treatment efficiencies were
achieved, but the sophisticated injection controller had to be bypassed due to operational issues.
The drainage ditches, culverts, and pumps generally performed well during the project. Power
failures at Butler Oaks Dairy, particularly during the 2004 hurricanes, presented a problem due to
their use of electric pumps, but were quickly remedied by the farmer because he initially renting
and then purchasing a generator to operate the pumps. The primary issue with the pumps was
the maintenance of the float control systems, which needed to be calibrated on a more routine
basis.
As noted above, the chemical polymers used at Davie Dairy had congealing and floc settling
problems. These problems were not observed for the alum that was used at the other three sites,
Therefore it is recommended that alum be used unless significant jar testing and chemical
properties data are made available to ensure the chemical‟s performance.
To address the observed operation and maintenance issues, the following adjustments are
recommended:
1. Rigorous jar testing is conducted to determine settling rating for the potential
chemical flocculant.
2. Flocculation pond designed to minimize short circuiting.
3. The chemical injection equipment is thoroughly evaluated for compatibility with the
selected chemical.
4. Spare parts or replacements for the injection pumps are kept on site.
5. Build redundancy into the flow metering system associated with the chemical
injection control system so that it can automatically switch to the alternative system if
a failure is detected in the primary flow metering system.
6. When possible, use a mechanical or air bubbler agitator at the point of chemical
injection to enhance mixing, if injection is not done into pumps or other specially
designed mixing structures.
7. Conduct a thorough operation and maintenance visit for the injection system, lift
pumps, and structures at least once per month.
8. Either have a field staff member complete a rigorous training program on the system
or hire a professional with appropriate experience to operate and maintain the system.
Estimated Annual Costs and P Removal Efficiencies
The annual cost, which includes the amortized design and construction costs and the routine
operation and maintenance costs are provided in Table 6.5. It is important to note that these
costs do not include the significant contribution made by the dairies associated with the land they
committed to the project for the R/D ponds and chemical treatment facilities. The operational
and maintenance costs, which were also the dairies‟ responsibility, include chemicals, equipment
replacement, repairs, and operation and maintenance (O&M) activities. The amounts of total P
removed for each system are also provided in Table 6.5 along with the anticipated P removal
efficiencies in terms of dollars per pound of P removed for just the O&M costs and then for the

Final Report – Chemical Treatment
156
total system including both the amortized design and construction costs and O&M costs. It must
be noted that the amount of runoff and associated P discharge occurring during the evaluation
period greatly influences the P removal efficiency in terms of dollars per pound-P removed. This
is the reason that the Milking R system appears to have poorer P removal efficiency than Butler
Oaks and Dry Lake, when in reality all three systems would be expected to have similar
performances.
Table 6.5 Estimated O&M Cost per Pound of P Removed through 12/07
It is clear that the EOF chemical treatment systems that had R/D ponds for retention and water
reuse have very good P removal efficiencies averaging about $60 per kilogram of P removed,
which is lower than most of the other technologies evaluated. The system failures for the Davie
Dairy pass-thru system resulted in an overall poor P removal efficiency of $746 per kilogram of
P removed; however based on its performance during operational periods the pass-thru system‟s
removal efficiencies were estimated to be in the order of $88 per kilogram of P removed and
based on specific site conditions, which is still quite good compared to other available
technologies
IMPLEMENTATION ISSUES
What phosphorus concentration and/or species will respond to chemical treatment cost
effectively
In general the phosphorus concentrations are greater than 100 ppm of TP (soluble + particulate)
What volume or flow rate is logistically feasible for treatment?
There is no limit, but will typically be less than 150,000 GPM.
Where in KOE planned features can chemical treatment be applied?
No limitation, but most effective on the high P land source areas.

Final Report – Chemical Treatment
157
Water quality parameters affect chemical treatment P reduction efficiency? Do we have
sufficient existing data or is additional data required?
The alkalinity, pH, ionic strength, and particulate levels are the primary parameters influencing
efficiency and therefore these should be evaluated for each application.
What water quality standards must be met for chemically treated discharges to various
receiving waters?
Depends on receiving water body, but typically Class 3 water quality standards have to be met.
Which standards are critical depends on the chemical(s) used. For alum the only critical
parameter is pH. In freshwater Al is not an issue, but for estuarine waters it is.
What is the best aerial economy of scale for treatment system implementation?
Parcel level systems are most effective, where the higher P source areas can be identified and
focused on because the EOF efficiency improves as the P concentration increases.
Can the use of chemical treatment be permitted?
The primary permitting issue that had to be addressed during this project was obtaining United
States Army Corps of Engineers (USACE) permits for constructing some of the systems‟
components within jurisdictional wetlands. USACE Nationwide Permits were obtained for the
diversion structure at Davie Dairy and the R/D pond dike at the Dry Lake Dairy system. During
the threatened and endangered species assessment at the Butler Oaks Dairy site, gopher tortoises
were found and therefore a Florida Fish and Wildlife Conservation Commission permit was
obtained to relocate the tortoises. Environmental resource permits (ERPs) were not needed
because the dairies had Industrial Waste / NPDES permits with the Florida Department of
Environmental Protection which already addressed the ERP requirements. However, for future
systems on other types of facilities, it is likely that an ERP or modifications to an existing ERP
would be required. FDEP will be the lead agency in determining if ERP or other permits will be
needed on a case by case basis.
What are the monitoring requirements of planned solutions?
Flows must be accurately monitored so that chemical injection rates can be adjusted accordingly.
If pumps are used, then the pump rate can be used instead of a separate monitoring system.
Depending on the sensitivity of the chemical used, real-time measurements of ionic strength and
pH may be needed to better adjust injections rates. Inflow and outflow rates and TP
concentrations should be monitored to evaluation the performance of the system. Additional
monitoring of outflow for impacted Class 3 parameters should also be done.

Final Report – Chemical Treatment
158
What are the cost-benefits of planned solutions?
EOF has been found to be more cost effective than STAs/RASTAs and regional scale chemical
treatment systems.
What factors effect settling and residual management?
The type of chemical used as related to inflow water characteristics and the design parameters of
the floc pond directly affect settling rates and sludge buildup and stability. Improper dosing rates
can cause fine floc formation, i.e. low settling velocities, particularly under dosing. The
residence time, depth of pond, and short circuiting within the floc pond are critical to successful
floc settling and residual stability.
What are the cost effective options for residual management?
Residual removal is ideally done by simply letting the floc pond dry out, but more often a
secondary above water table drying bed will be needed where the floc residuals can be
hydraulically dredged (pumped) from the floc pond bottom into the drying bed. Floc can be used
as an onsite soil amendment.
What chemicals should be evaluated?
Based on assessments during the Dairy BAT project, alum has proven to be the most cost
effective chemical. However, if sulfate releases are of a concern due to potential mercury
methylation, then chloride based chemicals such as ferric chloride and aluminum chloride might
be considered. Aluminum polymers are also an option, but must be more carefully controlled
due to their high cost.
SUMMARY
Four different EOF systems were constructed and evaluated for their ability to reduce P loads
leaving four dairies in the northern Okeechobee watershed. Three of the EOF systems used large
stormwater retention/detention (R/D) ponds to retain as much stormwater on site as possible to
limit the amount of chemical treatment needed. The fourth EOF system was a flow-thru system
where the majority of the stormwater was injected with a chemical flocculant and passed through
a small floc settling pond prior to discharge. This flow-thru system had less than 3 percent flow
reduction as compared to over 80 percent flow reduction for the other three systems and
therefore was almost completely dependent on the chemical treatment system for P reductions.
The R/D ponds provided flow reductions due to increased evaporation off the pond surface and
the reuse of the water for irrigation. It was found that the EOF chemical systems that included
R/D ponds provided excellent P removal efficiencies averaging about $60 per kilogram of P
removed. The flow-thru design, however, was found to be more problematic creating a poorer

Final Report – Chemical Treatment
159
performance than the other R/D pond based systems due to a high failure rate of its continuously
on-demand chemical injection equipment and potential short circuiting in the flocculation. It is
estimated, however, based on successful run periods that if more robust and redundant injection
and flow metering systems are used, a more intensive O&M practices employed, and introducing
internal baffling in the floc pond, then the flow-thru system would achieve P removal
efficiencies in the order of $88 per kilogram of P removed for specific site conditions.
The effectiveness of the chemical flocculants was found to be highly influenced by the
stormwater characteristics. The pH, alkalinity, and P concentration levels of the stormwater are
the primary parameters that can influence the flocculation performance of the selected chemical
flocculant, particularly associated with the floc formation rates and settling characteristics. The
stormwater from the more intensive dairy pastures and sprayfields land uses were found to have
significant alkalinity and pH levels for good floc formation; Therefore no additional buffering
was required when using alum as the flocculant. However, the stormwater at the Davie Dairy
system was found to have low alkalinity and pH levels due to a much higher fraction of its
stormwater coming from offsite nondairy land uses. The lower alkalinity and pH levels required
either chemical buffering with sodium hydroxide (NaOH) if alum was to be used or aluminum
based self buffering chemicals such as Hyper+Ion compounds to obtain the required P
reductions. Hyper+Ion was selected at Davie Dairy due to safety issues associated with NaOH,
but was found to be particularly sensitive to the inflow P concentrations as far as the settling
ability of its produced floc, i.e. under dosing conditions would produce a non-settling floc. This
situation creates a problem because real-time adjustments to dosing rates based on inflow
characteristics is extremely difficult, particularly for P concentrations that are highly variable and
hard to measure in real-time. For example, this means that if the chemical dosing rate is set for
average P concentrations, then about 50 percent of the floc and associated P will pass thru the
flocculation pond: or if the dosing rate is set for the maximum inflow P concentration, then
overdosing will be occurring most of the time, which greatly increases costs and a potential
concern for chemical pass thru. Alum flocculants appear to be less sensitive to inflow P
concentrations and less costly if overdosed. It is recommended in these studies that alum be used
in the future unless significant scientific evidence of chemical properties and rigorous jar testing
data are provided to ensure the flocculation performance and cost effectiveness of alternative
chemicals.
As evidenced by the higher than anticipated equipment failure rates, particularly for the pass-thru
system, it is clear that more robust and redundant equipment designs and operation and
maintenance procedures are needed. Higher quality pumps and flow meters will also reduce
failure rates. Equipment redundancy or backup systems are also critical in order to allow
treatment to continue when the inevitable equipment failures occur, allowing repairs to be made
without significant downtime. Equipment redundancy can increase treatment reliability by as
much as 50 percent. In addition to improved equipment quality and redundancy, a more
intensive routine operation and maintenance program will be needed to ensure the reliability of
these systems. If these systems are to be operated and maintained by dairy staff, then it is
recommended that the staff member(s) complete a rigorous training program on the system and
have full knowledge of specialists and/or manufacturers for each piece of equipment so that
repairs can be completed quickly. If the dairy staff does not have the time or the technical
background to adequately learn and commit to the proper operation and maintenance of their
system, then it is strongly recommended that professional O&M services be contracted for their

Final Report – Chemical Treatment
160
system.
EOF should be developed in concert with stormwater retention and water reuse systems to
minimize the amount of flow to be treated, thus significantly reducing costs.
REFERENCES
EPA. 2008. Final Total Maximum Daily Load (TMDL) for Biochemical Oxygen Demand,
Dissolved Oxygen, and Nutrients in the Lake Okeechobee Tributaries. US EPA Region
IV. Atlanta, Georgia
FDEP. 2001. Total Maximum Daily Load for Total Phosphorus Lake Okeechobee, Florida.
Florida Department of Environmental Protection. Tallahassee, FL
SWET. 2001a. Final Report - Task 1.3 Literature Review. SFWMD Project entitled „Dairy
Best Available Technologies in the Okeechobee Basin‟. SFWMD. West Palm Beach, FL
SWET. 2001b. Final Report - Task 2.6 Formulate Technology Alternatives. SFWMD Project
entitled „Dairy Best Available Technologies in the Okeechobee Basin‟. SFWMD. West
Palm Beach, FL
SWET. 2002a. Final Report - Task 2.10 Evaluation of Alternatives Ranking Best Available
Technologies. SFWMD Project entitled „Dairy Best Available Technologies in the
Okeechobee Basin‟. SFWMD. West Palm Beach, FL
SWET. 2002b. Final Report - Task 2.11 Animal Nutrient Management Assessments (ANMAs)
For the Three Selected Dairies. SFWMD Project entitled „Dairy Best Available
Technologies in the Okeechobee Basin‟. SFWMD. West Palm Beach, FL
SWET. 2008a. Final Report – Task 4.1 Dairy Best Available Technologies in the Okeechobee
Basin‟. SFWMD. West Palm Beach, FL
SWET. 2008b. Final Report - Task 1 Search and Review of Existing Information. SFWMD
Project entitled „Technical Assistance in Review and Analysis of Existing Data for
Evaluation of Legacy Phosphorus in the Lake Okeechobee Watershed‟. SFWMD. West
Palm Beach, FL

Final Report – Chemical Treatment
161
CHAPTER VII FINDINGS AND CONCLUSIONS
INTRODUCTION
There exists within the District a significant data base on the performance of chemical systems to
remove phosphorus from surface, stormwater, and process waters. As part of this data base, a
comprehensive testing program was completed in Palm Beach County, south of Lake
Okeechobee. In addition, chemicals have been used in the farming areas north of the Lake, and
in combination with other processes, such as hybrid wetlands and wet ponds at the edge of farms.
Additional references were reviewed to provide a broader basis for evaluation and to provide
justification for solutions to implementation issues.
The concern for phosphorus removal is warranted based on protection of the plant and animal
life in the region and the need to meet receiving water quality TMDL limitations within some
areas of the SFWMD and in particular the KOE areas. Chemical treatment technologies to
remove phosphorus are another option available to decision makers. The chemicals of interest in
this report are aluminum, iron and calcium salts, polymers, and residuals from water treatment
processes.
The method of application of the chemical can be to a continuous flowing waste stream, directly
to water columns in a batch mode, or as a source control application before the waste streams
leave an area. There are also options to use the chemicals with other processes or in combination
with other treatment technologies. Existing within the State and certainly in the SFWMD, there
are ongoing operations using chemical additions as well as edge of farm and hybrid wetlands.
All have shown promise to remove phosphorus.
Process waste water or rainfall conditions are not continuous in time, thus there is unused
capacity within chemical treatment technologies. This capacity can be used when there is no
flow stream or holding area to chemically treat. This is of potential benefit in those cases when
whole water bodies need to be treated and the chemical treatment technology can be accessed in
a competitive economic alternative. In addition, the residuals frequently have unused potential
for phosphorus removal and residual uses are possible.
This report provides a review of the literature and finding of facts relative to the use of chemical
coagulation and flocculation with other treatment options.
FINDINGS
The findings are presented relative to each of the implementation issues. Additional details for
each chemical treatment technology can be found in the chapters for each issue, and as
summaries of the information. While many chemical salts are useful, alum is considered as the

Final Report – Chemical Treatment
162
chemical of choice. The use of a polymer as a flocculant aid is also recognized and should be
evaluated by laboratory testing in various configurations of a treatment train. The choice of the
treatment train is an economic one and should be based on site specific conditions. Specific
guidelines are made for hybrid wetlands and for edge of farm wet detention facilities. Land and
waste stream applications of water treatment residuals follow the same summary statements.
What P concentrations and/or species will respond to chemical treatment cost effectively?
Phosphorus species in runoff and process water can be generally divided into particulate and
dissolved forms. Particulate forms of phosphorus can be removed easily by settling or the
addition of a chemical, with typical removals of 80->95%. Dissolved phosphorus forms consist
primarily of orthophosphorus and dissolved organic phosphorus. Removal of orthophosphorus is
highly efficient, with typical removals ranging from 90-99%. Removal of organic phosphorus is
more variable and depends on the composition of the organic molecules. Laboratory testing of
the process water is done to determine the dosage and the removal effectiveness per investment.
The species form of the phosphorus is important to determine dosage and removal effectiveness
and laboratory testing is required for process sizing.
What volume or flow rate is logistically feasible for treatment?
Any size flow rate can be treated. The variability of the flow is a major concern relative to
performance and cost. Thus some flow attenuation system is preferred so as to attenuate or level
out the flow. Wetlands and detention ponds at the edge of a farm are commonly used, but on
smaller watersheds, on-site and transport storage should be evaluated. Floc collection or control
is required, thus a restriction on the flow rate for chemical treatment is the ability to collect the
floc which is generated. The most common method of collection is the use of a settling pond.
The minimum settling time required for complete removal of floc from the water column ranges
from less than three to about 24 hours, depending on the characteristics of the raw water. Floc
generated from water with a high percentage of particulate phosphorus will settle quickly, while
floc formed from water with an elevated level of orthophosphorus or organic phosphorus will
tend to settle slowly.
Where in the KOE planned features can chemical treatment be applied?
There are parcels of land available in the KOE areas. Land however is usually not a constraint
for the selection of chemical treatment. The potential for chemical addition with storage and
wetland construction is for most situations not limited by land. Also, the land application of
polymers and water treatment residuals as source control is possible.
What water quality parameters affect chemical treatment P-reduction efficiency? Do we have
sufficient existing data or is additional data required?
The particulate and dissolved fractions of phosphorus are important to estimate removal
effectiveness. The water quality parameters that affect phosphorus removal with aluminum,
iron and calcium are well documented, but laboratory testing is needed on the process water

Final Report – Chemical Treatment
163
before the system is designed. In general, phosphorus removal efficiency is best when the raw
water consists primarily of particulate matter and orthophosphorus at concentrations of <100-200
ppb.
One problem with the use of chemicals may be a reduction in pH. If the alkalinity of the raw
water is insufficient to prevent an undesirable reduction in pH, then alternative coagulants or pH
buffering compounds should be added. The addition of NaOH or similar base can substantially
enhance the rate of formation and settling of the generated floc.
Dissolved organic carbon (DOC) and suspended solids content of process water are parameters
likely to affect the efficiency of WTR treatment of water with high P content; in general, higher
DOC concentration requires higher dosage of WTR. Phosphorus removal by WTRs is efficient
when the P species in the raw water is dominated by PO4-P, and at P concentrations up to several
mg P/L.
Alkalinity, color, suspended solids, soluble reactive P, particulate P and dissolved organic P are
all parameters that will influence treatment within a HWTT system. There is sufficient data to
understand the major controlling water quality variables in HWTT systems.
What water quality standards must be met for chemically treated discharges to various
receiving waters?
Chemically treated discharges must meet the numerical and narrative standards outlined in Ch.
62-302 FAC. Three of the more significant standards are pH, alkalinity and turbidity. For
freshwater-receiving waters, the pH must be greater than or equal to 6, and the alkalinity must be
greater than 20 mg/l. Turbidity levels must not increase above background by more than the
standard requirement of 29 NTU for most of the State. If the discharge occurs in the Keys, the
turbidity levels cannot exceed the background levels. The chemical technologies reported here
are expected to meet various water receiving water quality standards.
There must also be a toxicity test using the expected dosage levels.
What is the best aerial economy of scale for treatment system implementation (parcel, sub-
basin, STA, reservoir)?
For any chemical treatment technology, there are economies of scale. There is a fixed cost
(capital cost) which has to be overcome with the operating size of the chemical technology. All
systems will require the same basic components such as a flow meter, pump, storage tank, and
housing for fixed location treatment. For land application, there is the initial cost of storage and
applications devices. Therefore, the cost per pound for phosphorus removed decreases as the
size of the treated area increases. It is most cost effective to locate a fixed site for chemical
treatment at the most downstream portion of the parcel or basin area where there is significant
volume and to take advantage of wetland and detention pond storage. Also if adjacent to a
receiving water area that also needs phosphorus removal, there is an additional benefit in the
treatment of the receiving water area.

Final Report – Chemical Treatment
164
Land treatment systems can readily be implemented into existing BMP practices using only
slight modifications. Land applications with WTR and polymers that are close to the source of
chemicals will likely be more cost effective. However, given the limited quantities of WTR
produced, the most efficient use of WTR may be on a regional basis or near the outflow, rather
than on widely dispersed sources.
HWTT systems may be efficient with virtually no scale or placement limitations. Local cost and
site conditions however must be examined. Existing land ownership patterns (public vs. private)
will largely dictate the appropriate scale and locations. Publically owned land (regardless of
scale) is advantageous from a capital expense standpoint, where positive savings will accrue
through elimination of land costs.
Can the chemical treatment be permitted?
Alum treatment systems have been permitted by each of the 5 water management districts as
well as FDEP. Cited for approval is FDEP‟s Noticed General Environmental Resource Permits
[Chap 62-341, F.A.C.]. Stormwater rule changes expected in 2010 will also help facilitate the
permit process for chemical additions within the SFWMD and FDEP.
FDEP often requires that chemical treatment be used in federally funded retrofit projects due to
the low unit removal cost compared with other common techniques. Currently, chemical
treatment can be permitted for virtually any retrofit opportunity. Chemical systems permitted
after 1998 provide mechanisms for collection and removal of the generated floc. One of the
most common methods of disposal of floc is discharge into adjacent sanitary sewer systems. On
a large scale basis, the additional load on the water pollution control facility must be assessed.
For PAM polymers, Anionic materials are currently permitted for use in construction projects.
There is a Federal standard for land application of PAM use on agricultural land and also a
standard for construction site PAM application. Both standards are listed under “polyacrylamide
use for erosion control code 450”. The Florida DOT Reviewer and Design manual also contains
a section on polymer enhanced BMP and use. EPA may likely adopt a new proposed rule
suggesting use of PAM based anionic polyacrylamide for compliance of water quality discharges
from stormwater and construction sites in 2009.
The primary permitting issue that needs to be addressed for Wetlands is obtaining a United
States Army Corps of Engineers (USACE) permit for constructing the systems‟ components
within jurisdictional wetlands. If endangered species are found or anticipated, a Florida Fish
and Wildlife Conservation Commission permit should be obtained to relocate the tortoises.
Environmental resource permits (ERPs) are not needed for dairies because they have Industrial
Waste / NPDES permits with the Florida Department of Environmental Protection which already
addressed the ERP requirements. However, for future systems on other types of facilities, it is
likely that an ERP or modifications to an existing ERP would be required.

Final Report – Chemical Treatment
165
What are the monitoring requirements of planned solutions?
Recent applications of chemical technologies demonstrated the operation of the chemical
technology and the potential impact; monitoring of the technology and the receiving water
conditions. Chemical technologies have been proven and monitoring is usually now done for
process control. Most of the current flow systems require only monitoring for pH with an
automatic shut-off required as part of the design in the event that pH decreases below the
applicable standard. The performance has been documented to the point that FDEP often does
not require efficiency monitoring. However, regardless of permit required monitoring, the owner
should conduct routine monitoring to make sure that the water quality objectives of the treatment
process are being met.
No monitoring requirement has been assigned to land application of chemicals such as polymers
and WTR. WTRs are specifically exempt from the 40 CFR Part 503 land disposal regulations for
biosolids (USEPA, 1996). Thus, WTRs can be land-applied without having to meet metal
limitations of the Part 503 regulation. However, monitoring should be conducted to ensure that
water quality goals of polymer and WTR land application are being met. The recent DEP
Guidance memo pertaining to land application of Al- and Fe-WTRs must be considered, but
concerns are easily addressed.
What are the cost-benefits of planned solutions?
While this report is not structured to provide a design selection tool based on cost, general cost
information presented is useful for comparison to other phosphorus removal methods. There are
two major components of the cost, one is the initial or construction cost and the other is the
operational cost. Added together these costs provide a life cycle analysis. The life cycle cost is
based on the data from actual constructed and operating facilities. Land cost is usually not
included in the data reported for most phosphorus removal methods. Nevertheless, a major
consideration is availability and associated cost of land. For chemical treatment systems, the
land needed is usually relatively small compared to that needed for other phosphorus reducing
methods. However if substantial land area is needed for equalization and there is cost associated
with the land, the cost of the land should be included in the calculations. On the other hand,
there are examples of chemical treatment systems with existing wet ponds and wetland systems
for which the wet pond or wetland are not included in the cost of the chemical treatment.
In the SFWMD Advanced Treatment Technology (ATT) initiative, cost comparisons were
prepared for the chemical treatment technologies that successfully achieved the 10 g/L TP
outflow concentration target. The TP concentration of the inflow water (i.e. Post-BMP vs. Post-
STA waters) was a significant factor in dictating the cost of P removal on a “price per kilogram”
basis. For example, costs developed in 2001 suggest that the chemical treatment/microfiltration
technology would cost $414/kg and $898/kg of TP removed for Post-BMP and Post-STA waters,
respectively. For essentially all of the chemical technologies, the treatment of Post-BMP waters
was found to be desirable because the treatment cost ($/kg P removed) was substantially lower
than that of Post-STA waters.

Final Report – Chemical Treatment
166
Chemical treatment can be compared to other phosphorus removal systems. For the comparison,
the cost benefit is measured by the cost of the investment for a unit amount of phosphorus
removed. The cost benefit for each chemical treatment technology is similar to other methods
and varies with site conditions. There are also economies of scale as cost is reduced as the size
of the chemical treatment increases. Nevertheless, a cost to benefit comparison can be made
based on TP mass removal using recent Florida stormwater construction projects. The Florida
Department of Environmental Protection (2008) keeps records of stormwater construction
projects for a variety of methods (alum injection, wet ponds, retention ponds, swales, and
separators). Their records indicate an average capital cost to remove one kilogram of
phosphorus per year per acre of watershed (not all impervious) to be about $330. Ninety percent
(90%) of the time the cost of removal is less than $667 per kilogram of phosphorus per year per
acre. Thus the cost effectiveness of any chemical treatment technology that has on the average a
capital cost of less than about $330 per kilogram of phosphorus removal per year per acre can be
considered competitive. However, some of the methods in the FDEP data base used to calculate
the cost per unit mass removed cannot compare to chemical treatment in terms of the effluent
concentration. Chemical treatment produces a lower effluent phosphorus concentration.
Using a 20 year life cycle cost with the rate of increase in chemical cost equal to the discount
interest rate, alum coagulation has consistently been shown to have a phosphorus removal cost
which is much lower than other more traditional projects. It is noted that in the years 2006-2008,
the cost of alum had increased at a rate higher than inflation, but the greater rate is not expected
in the future. The phosphorus removal cost for alum coagulation is typically in the range of $75-
250/kg ($34-115/lb) (phosphorus removed over a 20-year life-cycle) compared with $396-
$667/kg ($180-300/lb) for traditional BMPs such as wet detention. For calculation of the 20 year
cost, the cost of alum was assumed at $1.00 per gallon. Also, and in general, the pollutant
removal cost of alum treatment decreases as the facility design size increases. If floc collection
is not required, alum treatment costs are in general less than $88/kg ($40/lb) phosphorus
removed. Removal costs of alum floc could be reduced by reusing the settled floc (residual) in
the same process and in other settings.
A full-scale modified HWTT system which did not include the beneficial use of buffering
techniques (limerock and SAV) demonstrated in a comparison study that the use of wetland areas
to contain and recycle wet floc reduces the cost. Conceptual aspects of the use of limerock and
recirculation are under investigation at the time of writing this report and the cost information is
preliminary. Preliminary data indicate the cost was reduced to about $53/kg ($24/lb) of
phosphorus removed versus $132/kg ($60/lb). A separate HWTT Mesocosm trial included
limerock and SAV buffering components, but did not include benefits derived from wet or dry
recycling coupled with intermittent dosing. The HWTT system was compared to conventional
treatments of Hyperion and a combination of Alum and Aluminate. The marginal cost benefits
(considering differences in chemical and treatment processes alone), were $38/kg ($17/lb) versus
$115/kg ($52/lb) and $84/kg ($38/lb) respectively, for the two conventional methodologies.
EOF chemical treatment systems with stormwater detention and retention ponds have
demonstrated very good operational efficiencies averaging about $60/kg ($27/lb) of P removed.
Based on performance during operational periods, the pass-thru system‟s removal costs were
estimated to be in the order of $88/kg ($40/lb) of P removed for specific site conditions.

Final Report – Chemical Treatment
167
For land application to reduce phosphorus in the discharge, WTR and polymers can be used.
When using WTRs, a typical cost of P removal will likely be in the range of $9-24/kg ($4.5-
11/lb) P removed, depending on the chemical characteristics on the WTR. The application rate
depends on the phosphorus content of the soil. For a polymer, application rates have been
established based on erosion control and assuming that the soil and phosphorus will be
immobilized. The rate of application is independent of the phosphorus concentration. For this
situation, the costs range from $15 to $35/acre. There is a savings in the reduced cost of erosion
control that should be used to reduce the cost of WRT and polymers. These costs are one time
application costs and should be increased depending on the number of times the application is
done in the period of time used for cost comparison, or for most cases, over a 20 year period.
What factors affect settling and residuals management?
In flow processes, physical characteristics (size, density) and the dosage largely control the
settling rate of residuals after the addition of the chemical. The design volume for settling is the
volume required to provide the minimum detention time at the maximum anticipated flow rate,
generally in the range of 3-24 hours, plus an additional volume for dedicated floc storage. If the
floc is to be stored for extended periods in a wet pond environment, then alum coagulation is
preferable to iron since iron becomes reduced at low redox potentials, and the bound phosphorus
is released from the floc. Therefore, iron should never be used as a coagulant when the floc is
not immediately collected and dewatered.
For land spreading, only “aged” WTRs (those left, or manipulated, to dewater) should be land
applied. Although few adverse Al-WTR effects have been reported on plants, and no effects on
grazing animals (apparently because of low availability of free Al3+
in Al-WTR), data generated
so far suggest that only dewatered (≥ 6 mo old) Al-WTRs should be land applied to minimize
overall potential ecological aluminum risk.
If polymer land applications and the corresponding BMPs are employed correctly, there should
be insignificant residuals resulting in no further cost. The HWTT does not require large tracts of
land to be set aside for residual drying and storage.
What are cost effective options for residual management?
Sufficient options for management are available. Site specific conditions will determine what is
best. The generated AL-floc from chemical treatment is extremely stable with virtually no
potential for release of pollutants under a wide range of pH values and redox potentials. The floc
characteristics easily meet the clean soil criteria and can be used on a wide range of applications.
Thus, a cost effective approach for managing flocs is to detain, dry and re-use residuals on-site.
The dried floc still has considerable phosphorus adsorption potential. As an example, WTR residuals are used for soil amendment in the Lake Apopka muck farm areas to inhibit phosphorus release from flooded soils on former agricultural plots.

Final Report – Chemical Treatment
168
What chemicals and treatment configurations should be further evaluated?
There are significant findings of fact that show that the potential of chemical treatment at the
source and as part of a treatment train is an effective option for phosphorus reduction with low
risk of operational problems. The chemical technologies reviewed here can be used with a high
degree of confidence.
What remains is to determine the most cost effective combination of storage, treatment flow
rates, chemical dosages and floc disposal for various site specific locations that are candidates
for treatment. The use of other treatment methods commonly referred to as Low Impact
Development (LID) to reduce flow volumes and the addition of sorption media to reduce
phosphorus concentrations before “end of pipe treatment” can be further evaluated from a cost
effective standpoint. The evaluation should be done considering the stochastic nature of rainfall
and the various operational scenarios for chemical treatment.
CONCLUDING REMARKS
For phosphorus removal, the use of chemicals is an option that should be considered in the
SFWMD. This general statement is supported by the literature and the answers to the
implementation issues. Chemical testing of the waste stream should be done in a laboratory to
determine the dosage of the chemicals. Existing facilities have demonstrated stability in
operation and designs to reduce the cost.
Of significance is the probable lower cost based on the cost to remove a unit of phosphorus mass.
Chemical treatment is most likely cost effective for most watershed sizes, but the treatment train
can be land intensive and land cost may be significant. In addition, operating cost depends on
the dosage of the chemicals used and the cost of residual disposal or reuse. Thus, cost analysis
considering initial cost with land and operating cost must be developed.
Chemical treatment can be used for discharges from most watershed areas provided there is
sufficient land available. Large watershed areas relative to small ones likely result in less
operating difficulties and less operating cost because of attenuation in flow and concentration
associated with large watersheds, resulting in lower cost per acre of watershed or per kilogram of
phosphorus removed. An equalization system should be considered for each treatment system so
that the complete cost of removal can be developed and operation problems are minimized. On a
regional basis, the equalization facility may be a river, lake or pond that is upstream of the
chemical treatment facility. Thus, the equalization facility may already exist.
A chemical treatment system starts with consideration of a flow equalization facility that reduces
the variability of flow rate and concentration. The size of flow equalization is determined by the
attenuation needed for process stability and reduced operation costs. Each site must be
evaluated for land availability and cost. Within the KOE and in some other areas of the
SFWMD, land availability most likely is not an issue.
Flow diagrams for three chemical treatment systems are shown in Figure 7-1 to illustrate the
various combinations available from the literature review. The diagrams of Figure 7-1 are

Final Report – Chemical Treatment
169
Chemical Treatment System Option 1
Equalization, Chemical Coagulant, Mixing Zone, Flocculant Aid and Collection
Chemical Treatment System Option 2
Equalization, Chemical Coagulant, Flocculant Aid, Mixing Zone and Collection
Chemical Treatment System Option 3
Equalization, Chemical Coagulant, Flocculant Aid and Hybrid Wetland
Figure 7-1. Flow Diagrams for Three Chemical Treatment Systems
general in nature and not specific to a site. In options one and two, the floc collection zone can
be simply a wet pond or a microfiltration system, as two examples. The differences in options
one and two are in the application point for the flocculant aid. Option 3 is the inclusion of a
pond or wetland to collect and reuse the floc on site. Option 3 may not always be possible due to
the availability of on-site features or other land constraints on the process design.
Chemical
Injection
System
Floc
Formation
Zone System
Flocculant Aid
Liquid or Solid
Floc Collection
Zone or System
Coagulant with
Flocculant Aid
System
Floc Collection
Zone or System
Floc Formation
Zone Mixing
System
Equalization Facility such as Holding Tank,
Wetland, Pond, or other Attenuation Devices
Equalization Facility such as Holding Tank, Wetland,
Pond, or other Attenuation Devices
Coagulant with
Flocculant Aid
Injection System
Equalization Facility such as Holding Tank,
Wetland, Pond, or other Attenuation Devices
Hybrid Wetland
Passive or Active

Final Report – Chemical Treatment
170
A cost comparison using the literature values is shown in Table 7-1. The purpose is to
summarize the cost data presented in the literature and to demonstrate the variability and also to
support the cost effectiveness of chemical treatment. There are site specific constraints such as
the equalization area, chemical dosages, availability of WTR if used, residual management,
availability of existing ponds and wetlands for supplemental equalization or floc collection, and
local permit requirements. From Table 7-1, chemical treatment is shown to be competitive and
most likely less costly relative to other methods.
Table 7-1. Comparison Cost Data for Chemical Treatment System Options
Process Description 20 YEAR COST DATA ($/kg P removed)
General Stormwater Cost Data (2008 data)
All methods, no effluent limitations
75 – 667
… with an average of 330
Wet Detention Pond Operation (2008 data)
Assumed phosphorus removal of 60-70 %
396 – 667
Options 1 and 2
Alum Treatment (2008 data)
75 – 250
Options 1 and 2
Chemical with microfiltration (2001 data)
(consistent 10 g/L effluent concentration)
414 – 898
HWTT (2009 data) Using partial features of
the technology both within mesocosm and
existing pond floc facilities
38 – 52
A majority of the applications for concentrated discharge have used aluminum sulfate (alum)
compounds. Enhanced removal may be possible when using alum if mixed with an anionic
polymer. Dosage and toxicity tests should be conducted before design and construction to
determine dosage rates and effectiveness.
The use of water treatment residuals (WTR) for concentrated discharge and land application is an
option. Where WTR is available, it will be less costly; however it is limited by availability of the
residual. It is also known and documented that chemical treatment can be used as part of a
combination of treatment methods. Detention facilities, edge of farm (EOF) and Hybrid Wetland
Treatment Technologies (HWTT) have demonstrated effectiveness and should be considered.
The HWTT system concept reduces the problems associated with residual management as the
residuals can be reused in the system. Residual management must be a consideration and is part
of cost effective calculations. Lastly, permitting of the methods is a function of the regulatory
agencies and with the data presented in this report together with the comprehensive associated
literature list, the authors believe that the system can be permitted.
REFERENCES
Florida Department of Environmental Protection, (2008). TMDL Project list construction cost
and removal data, FDEP file records, Tallahassee, Florida, June.

Final Report – Chemical Treatment
171
CHAPTER VIII COMPREHENSIVE LISTING OF LITERATURE
A
Agyin-Birikorang S. 2006. Lability of drinking-water treatment residuals (WTR) immobilized
phosphorus: implications for long-term stability. PhD diss. Univ. Florida. Gainesville, FL.
Agyin-Birikorang, S., O‟Connor, G.A., 2007. Lability of drinking-water treatment residuals
(WTR) immobilized phosphorus: Aging and pH effects. J. Environ. Qual. 36:1076-1085.
Agyin-Birikorang, S., O‟Connor, G.A., 2008. Aging effects on the reactivity of an aluminum-
based drinking-water treatment residuals. Science of the Total Environ. Science of the Total
Environ. http://dx.doi.org/10.1016/j.scitotenv.2008.09.025 .
Agyin-Birikorang, S., O'Connor, G.A., Jacobs, L.W., Makris, K.C., Brinton, S.R., 2007. Long-
term phosphorus immobilization by a drinking water treatment residual. J. Environ. Qual.
36:316-323.
Agyin-Birikorang, S., O‟Connor, G.A., Oladeji, O.O., Obreza, T.A., Capece, J.C., 2008.
Drinking-water treatment residuals (WTR) effects on the phosphorus status of field soils
amended with biosolids, manure, and fertilizer. Commun. Soil Sci. Plant Anal. 39:1700-
1719.
Agyin-Birikorang, S., O.O. Oladeji, G.A. O’Connor, T.A. Obreza, and J.C. Capece. 2009. Efficacy of drinking-water treatment residual in controlling off-site phosphorus losses: A field study in Florida J. Environ. Qual. (in press).
Anderson, D.L., Tuovinen, O.H., Faber, A., Ostrokowski, I., 1995. Use of soil amendments to
reduce soluble phosphorus in dairy soils. Ecol. Eng. 5:229-246.
Ann, Y., Reddy, K.R Delfino, J.J., 2000. Influence of chemical amendments on phosphorus
immobilization in soils from a constructed wetland. Ecol. Eng. 14:157-167.
Arkin, G.F., Taylor, H.M., 1981. Modifying the root environment to reduce crop stress. ASAE
Monograph No. 4, American Society of Agricultural Engineers, St. Joseph, MI.
B
Baker, M.N. (1981). “The Quest for Pure Water.” AWWA, Denver, CO.

Final Report – Chemical Treatment
172
Baker, M.J., D.W. Blowes, and C.J. Ptacek. 1997. Phosphorus adsorption and precipitation in a
permeable reactive wall: application for wastewater disposal systems. Land
Contamination and Reclamation, 5: 189-193.
Barker, J.C., Zublena, J.P., 1995. Livestock manure nutrient assessment in North Carolina, 1995.
Proc. 7th Int. Symp. Agric. Wastes. Trans. ASAE, St. Joesph, MI, pp. 98-106.
Bartholomew, Nathanael. 2003. Polyacrylamide for Turbidity Control in Runoff: Effects of
Polyacrylamide, Soil, and Solution Properties. Department of Soil Science, NCSU.
Master‟s Thesis.
Basta, N.T., Storm, D.E., 1997. Use of alum residuals to reduce nutrient runoff from agricultural
land treated with animal manures to protect surface water quality. In: Proc. 1997 Water
Residuals and Biosolids Management: Approaching the Year 2000. Water Environment
Federation/American Water Works Association Joint Specialty Conf., Philadelphia. 3-4
Aug. 1997. WEF, pp. 19-28.
Basta, N.T., Zupanic, R.J., Dayton, E.A., 2000. Evaluating soil tests to predict bermudagrass
growth in drinking water treatment residuals with phosphorus fertilizer. J. Environ. Qual.
29:2007-2012.
Benner, S.G., 1997. A full-scale porous reactive wall for prevention of acid mine drainage.
Ground Water Monitoring and Remediation, 17(4): 99-107.
Bjorneberg, D.L.& Lentz, R.D. 2005. Sediment Pond Effectiveness for Removing Phosphorus
from PAM-Treated Irrigation Furrows. Applied Engineering in Agriculture. American
Society of Agricultural Engineers. Vol. 21(4), pp. 589-593.
Blanco-Canqui, H., Gantzer, C.J., Anderson, S.H., and Thompson, A.L. 2004. Soil Berms as an
Alternative to Steel Plate Borders for Runoff Plots. Soil Science Society Am. J., (68), pp.
1689-1694.
Blowes, D.W., Ptacek, C.J., Benner, S.G., McRae, C.W.T., and Puls, R. W. 2000. Treatment of
dissolved metals and nutrients using permeable reactive barriers. Journal of Contaminant
Hydrology (45) 1-2, 123-137.
Bragg, Amanda. 2003. Phosphorus Reductions in Dairy Effluent Through Flocculation and
Precipitation. Texas A&M. Department of Soil and Crop Sciences.
http://twri.tamu.edu/report-abstract/SR2003-009.
Brezonik, P.L. (1984). "Trophic State Indices: Rationale for Multivariate Approaches."
In Lake and Reservoir Management, pp. 427-430, EPA-440/5-84-001.
Brown, E., Sartain, J.B., 2001. Phosphorus retention in United States Golf Association (USGA)
greens. Proc. Soil Crop Sci. Soc. Fla. 59:112-117.

Final Report – Chemical Treatment
173
Bugbee, G.J., Frink, C.R., 1985. Alum sludge as a soil amendment: Effects on soil properties and
plant growth. Bull. 823. Connecticut Agric. Exp. Stn., New Haven, CT.
Burns, R.T., Moody, L.B, Walker, F.R., Raman, D.R., 2001. Laboratory and in-situ reductions of
soluble phosphorus in swine waste slurries. Environ. Technol. 22:1273-1278.
Butkus, M.A., Grasso, D. Schulthess, C.P, Wijnja, H., 1998. Surface complexation modeling of
phosphate adsorption by water treatment residual. J. Environ. Qual. 27:1055-1063.
C
California Regional Water Quality Control Board, Colorado River Basin Region. 2005. Final
Report for Reducing Eutrophic Conditions of the Salton Sea.
http://www.saltonsea.ca.gov/ReducingEutrophicConditionsFinalReport.pdf
Carol, H.T., Arnold, K.F., 1990. Health and aesthetic aspects of water quality. In: Pontius, F.W.,
(Ed.), Water Quality and Treatment (A Handbook of Community Water Supplies by
AWWA), McGraw-Hill, New York, pp. 64-154.
Chardon, W.J., Schoumans, O.F., Koopmans, G.F., 2000. Soil phosphorus saturation index:
background, applications, and limitations. In: 2000 Annual Meeting abstracts. ASA,
CSSA, and SSSA, Madison, Wisconsin, p. 321.
Chwirka, J.D., Narasimhan, R., Scheuer, N. Rousseau, G., 2001. The impact of residuals on the
selection of an arsenic treatment process. WEF/AWWA/CWEA Joint Residuals and
Biosolids Management Conference. Biosolids 2001: „Building Public Support”.
Codling, E.E., Chaney, R.L., Mulchi, C.L., 2000. Use of aluminum and iron-rich residues to
immobilize phosphorus in poultry litter and litter-amended soils. J. Environ. Qual.
29:1924-1931.
Coffelt, G., J.M. Newman, T. Aziz, D. Campbell, B. Gu, J. Jorge, J. Lopez, K. Pietro and L.
Wenkert. 2001. Chapter 8: Advanced Treatment Technologies for Treating Stormwater
Cooke, G.D., and Kennedy, R.H. (1981). Precipitation and Inactivation of Phosphorus as a
Lake Restoration Technique. EPA-600/3-81-012.
Cornell, 1992. Cornell recommendations for field crops. New York State College of Agriculture
and life sciences, Cornell University, Ithaca, NY.
Cox, A.E., Camberato, J.J., Smith, B.R., 1997. Phosphate availability and inorganic
transformation in an alum sludge-affected soil. J. Environ. Qual. 26:1393-1398.

Final Report – Chemical Treatment
174
D
Dayton, E.A., Basta, N.T., Jakober, C.A., Hattey, J.A., 2003. Using treatment residuals to reduce
phosphorus in agricultural runoff. J. Am. Water Works Assoc. 95:151-158.
Dayton, E.A., Basta, N.T., 2005a. A method for determining the phosphorus sorption capacity
and amorphous aluminum of aluminum-based drinking water treatment residuals. J.
Environ. Qual. 34.1112-1118.
Dayton, E.A., Basta, N.T., 2005b. Use of drinking water treatment residuals as a potential best
management practice to reduce phosphorus risk index scores. J. Environ. Qual. 34: 2112-
2117.
Discharges into Everglades Protection Area. South Florida Water Management District
Everglades Consolidated Report. SFWMD, West Palm Beach, Florida, USA.
DeBusk, T.A., K. A. Grace and F.E. Dierberg. 2005. Treatment wetlands for removing
phosphorus from agricultural drainage waters. In: E. J. Dunne, K. R. Reddy and O.T.
Carton, Eds, Nutrient Management in Agricultural Watersheds: A Wetlands Solution. Pp.
167 – 178. Wageningen Academic Publishers, The Netherlands.
DeBusk, T.A., R. Baird, D. Haselow and T. Goffinet. 2005b. Evaluation of a floating wetland for
improving water quality in an urban lake In: Proceedings of 8th
Biennial Conference on
Stormwater Research and Watershed Management, pp. 175 – 184. Southwest Florida
Water Management District, Brooksville, FL, USA.
Dong, D., Ramsey, M.H., Thornton, I., 1995. Effects of soil pH on aluminum availability in soils
and its uptake by soybean plant (Glycine max). J. Geochemical Exploration 55:223-230
Dosskey, M.G., Helmers, M.J., Eisenhauer, D.E., Franti, T.G., Hoagland, K.D., 2002.
Assessment of concentrated flow through riparian buffers. J. Soil Water Conserv. 57:336-
343.
Driscoll M., Driscoll, D.F., 2005. Calculating aluminum content in total parenteral nutrition
admixtures. Am. J. Hlth-Syst. Pharm. 62:312-315.
E
Ebeling, J. M., Rishel, K. L., and Sibrell, P. L. 2005. Screening and Evaluation of Polymers as
Flocculation Aids for the Treatment of Aquaculture Effluents. Aquaculture Engineering
33(4), pp. 235-49.
Elliott, H.A., Dempsey, B.A., 1991. Agronomic effects of land application of water treatment
sludges. J. Am. Water Works Assoc. 83:126-131.

Final Report – Chemical Treatment
175
Elliott, H.A., Singer, L.M., 1988. Effect of water treatment sludge on growth and elemental
composition of tomato shoots. Commun. Soil Sci. Plant Anal. 19:345-354.
Elliott, H.A., Taylor, M., 2000. Molybdenum content of water treatment residuals. J. Environ.
Qual. 29: 1835-1839.
Elliott, H.A., O‟Connor, G.A., Brinton, S., 2002a. Phosphorus leaching from biosolids amended
sandy soils. J. Environ. Qual. 31:681-689.
Elliott, H.A., O'Connor, G.A. Lu, P., Brinton, S., 2002b. Influence of water treatment residuals
on phosphorus solubility and leaching. J. Environ. Qual. 31:1362-1369.
Elliott, H.A., Dempsey, B.A., DeWolfe, J.R., 1988. Land disposal of drinking water sludge.
ASAE no. 88-2579:1-13. Am. Soc. of Agric. Eng., St. Joseph, MI.
Elliott, H.A., Dempsey, B.A., Maile, P.J., 1990a. Content and fractionation of heavy metals in
water treatment sludges. J. Environ. Qual. 19:330-334.
Elliott, H.A., Dempsey, B.A., Hamilton, D.W., DeWolfe, J.R., 1990b. Land application of water
treatment sludges: Impact and management. Am. Water Works Assoc. Res. Foundation,
Denver, CO.
Entry, J.A., Sojka, R.E., Verwey, S.A., and Ross, C.W. 2002. Polyacrylamide Removes
Microorganisms and Nutrients from Surface Water. United States Department of
Agriculture. Northwest Irrigation and Soils Research Lab, Kimberly, ID.
Entry, J. A., Phillips, I., Stratton, H., and Sojka, R.E. 2003. Polyacrylamide + Al2(SO4)3 and
Polyacrylamide + CaO Remove Coliform Bacteria and Nutrients From Swine
Wastewater. Environmental Pollution 121, pp. 453-462.
Entry, J.A., and Sojka, R.E. 2003. The Efficiency of Polyacrylamide to Reduce Nutrient
Movement From an Irrigated Field. Transactions of the American Society of Agricultural
Engineers. 46(1), pp. 75-83.
EPA. 2008. Final Total Maximum Daily Load (TMDL) for Biochemical Oxygen Demand,
Dissolved Oxygen, and Nutrients in the Lake Okeechobee Tributaries. US EPA Region
IV. Atlanta, Georgia.
F
Faucette, B., Shields, F., and Krutz, K.. 2006. Removing Storm Water Pollutants and
Determining Relations Between Hydraulic Flow-Through Rates, Pollutant Removal
Efficiency, and Physical Characteristics of Compost Filter Media.
http://www.ieca.org/membersonly/Proceedings/Object246PDFEnglish.pdf.
Faucette, L.B., Sefton, K.A., Sadeghi, A.M., Rowland, R.A. 2008, Sediment and Phosphorus
Removal From Simulated Storm Runoff with Compost Filter Socks and Silt Fence.

Final Report – Chemical Treatment
176
Journal of Soil and Water Conservation, 63(4) pp. 257-264.
Faust, S.D., and Aly, O.M. (1998). “Removal of Particulate Matter by Coagulation.” In
Chemistry of Water Treatment, 2nd
Ed. Ann Arbor Press, Inc.: Chelsea, Michigan.
Fest, E.P.M.J., Temminghoff, E.J.M,. Griffioen, J., van Der Grift, B., van Riemsdijk, W.H.,
2007. Groundwater chemistry of aluminum under Dutch sandt soils: Effects of land use
and depth. Applied Geochemistry 22:1427-1438.
Field, A.C., Purves, D., 1964. The intake of soil by grazing sheep. Proc. Nutr. Soc. 23:24-25.
Florida Department of Environmental Protection. 2001. Total Maximum Daily Load for Total
Phosphorus Lake Okeechobee, Florida. Florida Department of Environmental Protection.
Tallahassee, Florida.
Florida Department of Environmental Protection. 2006. Guidance for land application of
drinking water treatment plant sludge. Florida Department of Environmental Protection
Solid Waste Section and Drinking Water Program Tallahassee, Florida.
Florida Department of Environmental Protection, (2008). TMDL Project list construction cost
and removal data, FDEP file records, Tallahassee, Florida, June.
G
Gallimore, L.E., Basta, N.T., Storm, D.E., Payton, M.E., Huhnke, R.H., Smolen, M.D., 1999.
Use of water treatment residuals to reduce nutrients in surface runoff from agricultural
land. J. Environ. Qual. 28:1474-1478.
Goodson, C. C., Schwartz, G., and Amrhein, C. 2006. Controlling Tailwater Sediment and
Phosphorus Concentrations with Polyacrylamide in the Imperial Valley, California.
Journal Environmental Quality. (35), pp. 1072-1077.
Green, S. V. and Stott, D.E. 2001. Polyacrylamide: A Review of the Use, Effectiveness, and Cost
of a Soil Erosion Control Amendment. 10th
International Soil Conservation
Organizational Meeting, Purdue University. pp. 384-389.
Green, V. Steven, S., Norton, D.E., and Graveel, J.G. 2000. Polyacrylamide Molecular Weight
and Charge Effects on Infiltration Under Simulated Rainfall. Soil Science Society
American Journal (64), pp. 1786-1791.
Garrison, P.J., and Knauer, D.J. (1984). "Long-Term Evaluation of Three Alum Treated Lakes."
In Lake and Reservoir Management, pp. 513-517. EPA-440/5-84-001.
Guerin, T.F, S. Horner, T. McGovern, and B. Davey. 2002. An application of permeable reactive
barrier technology to petroleum hydrocarbon contaminated groundwater. Water Res.
36:15-24.

Final Report – Chemical Treatment
177
H
Han, J. S., Hur, N., Choi, B. and Min, Soo-Hong. 2003. Removal of Phosphorus using
Chemically Modified Lignocellulosic Materials. 6th
Inter-Regional Conference on
Environment-Water, “Land and Water Use Planning and Management”. Albacete, Spain.
Hansen, N. C., Daniels, T.C., Sharpley, A.N., Lemunyon, J.L., 2002. The fate and transport of
phosphorus in agricultural systems. J. Soil Water Conserv. 57:408-416.
Harper, H.H.; Wanielista, M.P.; and Yousef, Y.A., 1982. "Restoration of Lake Eola," 2nd Annual
Conference of the North American Lake Management Society, Vancouver, British
Columbia, October 27-29.
Harper, H.H. (1987). “Feasibility of Alum Treatment for Nutrient Reductions in Surface Water
Discharges.” Presented to the Lake County Board of County Commissioners/Lake
County Pollution Control Board.
Harper, H.H. (December 1990). "Long-Term Performance Evaluation of the Alum
Stormwater Treatment System at Lake Ella, Florida." FDEP, Project WM339.
Harper, H.H. (October 1995). "Pollutant Removal Efficiencies for Typical Stormwater
Management Systems in Florida." In Proceedings of the 4th Biennial Stormwater
Research Conference (Sponsored by the Southwest Florida Water Management District),
pp. 6-17, Clearwater, FL.
Harper, H.H.; Herr, J.L.; and Livingston, E.H. (1998). "Alum Treatment of Stormwater: The
First Ten Years." New Applications in Modeling Urban Water Systems - Monograph 7 -
Proceedings of the Conference on Stormwater and Related Modeling: Management and
Impacts, Toronto, Canada, February 19-20.
Harris-Pierce, R., Barbarick, K.A., Redente, E.F., 1993. The effect of sewage sludge application
on native rangeland soils and vegetation. Annual Report Meadow Springs Ranch, Fort
Collins, CO.
Harris-Pierce, R.; Barbarick KA, Redente, E.F., 1994. The effect of sewage sludge application
on native rangeland soils and vegetation, Fort Collins Meadow Springs Ranch; City of Fort
Collins, CO, 1994 Annual Report.
Haustein, G.K., Daniel, T.C., Miller, D.M., Moore, Jr., P.A., McNew, R.W., 2000. Aluminum-
containing residuals influence high phosphorus soils and runoff water quality. J. Environ.
Qual. 29: 1954-1959.
Healy, W.B., 1967. Ingestion of soil by sheep. Proc. New Zealand Soc. Anim. Prod. 27:109-115.
Healy, W.B., 1968. Ingestion of soil by dairy cows. New Zealand. J. Agr. Res. 11:487-490.
Final Report – Chemical Treatment
178
Heil, D.M., Barbarick, K.A., 1989. Water treatment sludge influence on the growth of sorghum-
sudangrass. J. Environ. Qual. 18: 292-298.
Higgs, B., Johnston, A.E., Salter, J.L., Dawson, C.J., 2000. Some aspects of achieving
sustainable phosphorus use in agriculture. J. Environ. Qual. 29:80-87.
Hiscock, J.G., C.S. Thourot, and J. Zhang. 2003. Phosphorus budget - land use relationships for
the northern Lake Okeechobee watershed, Florida, Ecological Engineering 21: 63-74.
Hoge, V.R.; Conrow, R., Coveney, M., Peterson, J., 2003. The application of alum residual as a
phosphorus abatement tool within the lake Apopka restoration area. WEF Proceedings
Conference, Alexandria, VA.
Hooda, P.S., Rendell, A.R, Edwards, A.C., Withers, P.J., Aitken, M.N., Truesdale, V.W., 2000.
Relating soil phosphorus indices to potential phosphorus release to water. J. Environ. Qual.
29:1166-1171.
HSA Engineers and Scientists, Inc., 2000. Chemical Treatment Followed by Solids Separation
Advanced Technology Demonstration Project. Final Project Report to the South Florida
Water Management District, West Palm Beach, Florida, USA.
Hughes, J.C., Titshall, L.W., Buyeye, M., Johnston, M.A., Moodley, M., Pecku, S., 2005. Effects
of Land Application of Water Treatment Residue. Report 1148/1/05. Water Research
Commission, Pretoria.
Hyde, J.E., Morris, T.F., 2000. Phosphorus availability in soils amended with dewatered water
treatment residual and metal concentrations with time. J. Environ. Qual. 29:1896-1904.
Hyde, J.E., Morris, T.F., 2004. Phosphorus availability from phosphorus-amended water
treatment residual. Commun. Soil. Sci. Plant Anal. 35:1033-1046.
I
Idaho Soil Conservation Commission. 2002. Bruneau River Watershed Agricultural TMDL
Implementation Plan.
http://www.scc.state.id.us/TMDLPlans/BruneauRiverImplementationPlanJune2002.pdf
Ippolito, J. A., Barbarick, K.A., Heil, D.M., Chandler, J.P., Redente, E.F., 2003. Phosphorus
retention mechanisms of a water treatment residual. J. Environ. Qual. 32:1857-1864.
Ippolito, J.A., Barbarick, K.A., 2006. Phosphorus extraction methods from water treatment
residual-amended soil. Commun. Soil Sci. Plant Anal. 37:859-870.
Ippolito, J.A., Barbarick, K.A., Redente, E.F., 1999. Co-application effects of water treatment
residuals and biosolids on two range grasses. J. Environ. Qual. 28:1644-1650.

Final Report – Chemical Treatment
179
Ippolito, J.A, Barbarick, KA, Redente, E.F., 2002. Combinations of water treatment residuals
and biosolids affect two range grasses. Commun. Soil Sci. Plt. Anal. 33: 831-844.
J
Jain, P., Yong-Chul, J., Thabet, T., Witwer, M., Townsend, T., 2005. Recycling of water
treatment plant sludge via land application: assessment of risk. J. Res. Sci. Technol., 2: 13-
23.
Jernelov, A. (1970). Phosphate Reduction in Lakes by Precipitation with Aluminum
Sulfate. 5th
International Water Pollution Research Conference. New York: Pergamon
K
Kadlec, R.H. and S.D. Wallace. 2009. Treatment Wetlands. 2nd
. Edition. CRC Press, Boca
Raton, FL, USA.
Kawczyinski, E., Achtermann, V., 1991. A water industry database report on residuals handling.
In Proc. of the AWWA/WEF Joint Residuals Conf. Durham, NC. 11-14 Aug. American
Water Works Association, Denver, Colorado, p. 6b-1 to 6b-5.
Kellogg, R.L., Lander, C.H., Moffitt, D.C., Gollehon, N., 2000. Manure nutrients relative to the
capacity of cropland and pastureland to assimilate nutrients: Spatial and temporal trends
for the United States. USDA-NRCS-ERS Publ. npsO0-0579.
Kennedy, R., Cooke, G., 1982. Control of lake phosphorus with aluminum sulfate: Dose
determination and application techniques. Water Resour. Bull. 18:389-395.
L
Lai, C. K., I. M. C. Lo, V. Birkelund, and P. Kjeldsen. 2005 Field Monitoring of Permeable
Reactive Barrier for removal of Chlorinated Organics, J. of Environmental Engrg., ASCE,
132: 199-210.
Lake Okeechobee Protection Plan (LOPP), 2008, FDACS, FDEP, SFWMD,
https://my.sfwmd.gov/portal/page?_pageid=2294,4946970,2294_4947241&_dad=portal&
_schema=PORTAL
Lentz, R.D., Sojka, R.E., & Robbins, C.W. 1998. Reducing Soil and Nutrient Losses from
Furrow Irrigated Fields with Polymer Applications. Advances in GeoEcology 31, pp.
1233-1238.
Final Report – Chemical Treatment
180
Lind, C.B. (December 1997). “Phosphorus Inactivation – Chemical Precipitants and Strategies.”
Presented at the 17th
International Symposium of the North American Lake Management
Society (NALMS), Houston, Texas.
Lindsay, W.L. 1979. Chemical Equilibria in Soils. John Wiley and Sons. New York, NY.
Lindsay, W.P., Walthall, P.M., 1996. Solubility of aluminum in soils p 333-360. In: Sposito, G.,
(Ed.). Environmental Chemistry of Aluminum (2nd
ed.). CRC Press Inc. Boca Raton, FL
Livesey, N.T., Huang, P.M., 1981.Adsorption of arsenate by soils and its relationship to selected
chemical properties and anions. Soil Sci. 131: 88-94.
Lucas, J.B., Dillaha, T.A., Reneauj, R.B., Novak, T., Knocke, W.R., 1994. Alum sludge land
application and its effect on plant growth. J. Am. Water Works Assoc. 86:75-83.
M
Madison, R.K., McDowell, L.R., O‟Connor, G.A., Wilkinson, N.S., Davis, P.A., Adesogan, A.,
Felix, T.L., Brennan, M., 2007. Effects of aluminum from water treatment residual
applications to pastures on mineral status of grazing cattle and mineral concentrations of
forages. J. Anim. Sci. (in review).
Makris, K.C., 2004. Long-term stability of sorbed phosphorus by drinking water treatment
residuals: mechanisms and implications. PhD diss. Univ. Florida. Gainesville, FL.
Makris, K.C., O‟Connor, G.A., 2007 Beneficial utilization of drinking-water treatment residuals
as contaminant-mitigating agents. In: D. Sarkar et al. (Eds). Developments in
Environmental Science, Volume 5: Concepts and Applications in Environmental
Geochemistry, Elsevier Sci. Amsterdam, pp.607-636.
Makris, K.C, Sarkar, D., Datta, R., 2006. Evaluating a drinking-water waste by-product as a
novel sorbent for arsenic. Chemosphere 64: 730-741.
Makris, K.C., Shall, H.E., Harris, W.G., O'Connor, G.A., Obreza, T.A., 2004a. Intraparticle
phosphorus diffusion in a drinking water treatment residual at room temperature. J. Colloid
Interface Sci. 277:417-423.
Makris, K.C., Harris, W.G., O'Connor, G.A., Obreza, T.A., 2004b. Three-dimensional
phosphorus immobilization in micropores of drinking-water treatment residuals:
Implications for long-term stability. Environ. Sci. Technol. 38:6590-6596.
Makris, K.C., Harris, W.G., O'Connor, G.A., Obreza, T.A., 2005a. Long-term phosphorus effects
on evolving physicochemical properties of iron and aluminum hydroxides. J. Colloid
Interface Sci. 287:552-560.

Final Report – Chemical Treatment
181
Makris, K.C., Harris, W.G., O‟Connor, G.A., Obreza, T.A., Elliott, H.A., 2005b.
Physicochemical properties related to long-term phosphorus retention by drinking-water
treatment residuals. Environ. Sci. Technol. 39:4280-4289.
Makris, K.C., O'Connor, G.A., Harris, W.G., Obreza, T.A., 2005c. Relative efficacy of a
drinking water treatment residual and alum in reducing phosphorus release from poultry
litter. Commun. Soil Sci. Plant Anal. 36:2657-2675.
Mason, L.B., Amrhein, C., Goodson, C.C., Matsumoto, M.R., and Anderson, M.A. 2005.
Reducing Sediment and Phosphorus in Tributary Waters with Alum and Polyacrylamide.
Journal of Environmental Quality, (34), pp. 1998-2004.
Maurer, M., Boller, M., 1999. Modeling of P precipitation in wastewater treatment plants with
enhanced biological P removal. Water Sci. Tech. 39: 147-163.
Meng, X., Korfiatis, G.P., Jing, C., Christodoulatos, C., 2001. Redox transformations of arsenic
and iron in water treatment sludge during aging and TCLP extraction. Environ. Sci.
Technol. 35:3476-3481.
Moore, P.A., Jr., Daniel, T.C., Edwards, D.R., Gilmour, J.T., 1998. Effect of alum treated
poultry litter, normal litter and ammonium nitrate on aluminum availability and uptake by
plants. Proceedings of the 1998 National Poultry Waste Management Symposium,
Springdale, AR.
N
Nair V.D., Portier, K.M., Graetz, D.A., Walker, M.L., 2004. An environmental threshold for
degree of phosphorus saturation in sandy soils. J. Environ. Qual. 33:107-113.
Nair, V.D., Harris, W.G., 2004. A capacity factor as an alternative to soil test phosphorus in
phosphorus risk assessment. New Zealand J. Agri. Res. 47:491-497.
Naylor, L.M., Carr, J.S., 1997. Exchangeable phosphorus in soils amended with water treatment
residuals, biosolids, and aluminum-rich residues. In: Proc. Conf. Water residuals biosolids
management: Approaching the year 2000. Water Environ. Fed., Philadelphia, PA.
Novak, J. M., Watts, D.W., 2004. Increasing the phosphorus sorption capacity of southeastern
Coastal Plain soils using water treatment residuals. Soil Sci. 169:206-214.
Novak, J.M., Watts, D.W., 2005a. An alum-based water treatment residual can reduce
extractable phosphorus concentrations in three phosphorus-enriched coastal plain soils. J.
Environ. Qual. 34: 1820-1827.
Novak, J.M., Watts, D.W., 2005b. Water treatment residuals aggregate size influences
phosphorus sorption kinetics and Pmax, values. Soil Sci. 170:425-432.

Final Report – Chemical Treatment
182
Novak, J.M., Watts, D.W., Hunt, P.G., Stone, K.C., 2000. Phosphorus movement through a
coastal plain soil after a decade of intensive swine manure application. J. Environ. Qual.
29:1310-1315.
Novak, J.T., Knocke, W.R., Geertsema, W., Dove, D., Taylor, A., Mutter, R., 1995. An
assessment of cropland application of water treatment residuals. Am. Water Works Assoc.
Res. Foundation, Denver, CO.
O
O‟Connor, G.A., Elliott, H.A., 2006. The agronomic and environmental availability of biosolids-
P (Phase II). WERF report. 99-PUM-2Ta. pp. 4-1to 4-14.
O‟Connor, G.A., Sarkar, D., Brinton, S.R., Elliott, H.A., Martin, F.G., 2004. Phytoavailability of
biosolids-phosphorus. J. Environ. Qual. 33:703-712.
O‟Connor, G.A., Elliott, H.A., Lu, P., 2002. Characterizing water treatment residuals for P
retention. Soil Crop Sci. Soc. Florida Proc., 67–73.
O'Connor, G.A., Brinton, S., Silveira, M.L., 2005. Evaluation and selection of soil amendments
for field testing to reduce P losses. Soil Crop Sci. Soc. FL. Proc. 64:22-34.
O'Hannesin SF and R.W. Gillham. Long-term performance of an in situ "iron wall" for
remediation of VOCs. Ground Water 36: 164-170, 1998 .
Oladeji, O.O., 2006. Management of phosphorus sources and water treatment residuals (WTR)
for environmental and agronomic benefits. PhD diss. Univ. Florida. Gainesville, FL.
Oladeji, O.O., Sartain, J.B., O‟Connor, G.A., 2006. Agronomic impact of water treatment
residual co-applied with phosphorus sources to Florida sands. Soil Crop Sci. Soc. Florida
Proc. 65:38-48.
Oladeji, O.O, G.A. O‟Connor, J.B. Sartain, and V.D. Nair., 2007. Controlled application rate of
water treatment residual for agronomic and environmental benefits. J. Environ. Qual.
36:1715-1724.
Omoike, A.I., Vanloon, G.W. 1999. Removal of phosphorus and organic matter removal by alum
during wastewater treatment. Water Res. 33:3617-3627.
P
Paulter, M.C., Sims, J.T., 2000. Relationships between soil test phosphorus, soluble phosphorus,
and phosphorus saturation in Delaware soils. Soil Sci. Soc. Am. J. 64:765-773.

Final Report – Chemical Treatment
183
Peters, J. M., Basta, N.T., 1996. Reduction of excessive bioavailable phosphorus in soils using
municipal and industrial wastes. J. Environ. Qual. 25:1236-1241.
Prakash, P., Sengupta, A.K., 2003. Selective coagulant recovery from water treatment plant
residuals using Donnan membrane process. Environ. Sci. Technol. 37:4468-4474.
Puls, R.W, D.W. Blowes, and R.W. Gillham. 1999. Long-term performance monitoring for a
permeable reactive barrier at the U.S. Coast Guard Support Center, Elizabeth City, North
Carolina. . J Hazard Mater. Aug 12;68:109-24.
R
Reedy Creek Water Management District, Florida 2008. Chlorophyll α and Phosphorus
Reduction Monitoring Data. Unpublished raw data.
Rengasamy, P., Oades, J.M., Hancock, T.W., 1980. Improvement of soil structure and plant
growth by addition of alum sludge. Commun. Soil Sci. Plant Anal. 11:533-545.
Rhoton, E.E., Bigham, J.M., 2005. Phosphate adsorption by ferrihydrite-amended soils. J.
Environ. Qual. 34:890-896.
Rosa, I.V., Henry, P.R., Ammerman, C.B., 1982. Interrelationships of dietary phosphorus,
aluminum and iron on performance and tissue mineral composition in lambs. J. Anim. Sci.
55:1231-1240.
S
Sarkar, D., Makris, K.C., Vandanapu, V., Datta, R., 2006. Arsenic immobilization in soils
amended with drinking-water treatment residuals. Environ. Pollution 146: 414-419.
Sarkar, D., Quazi, S., Makris, K. C., Datta R., Khairom, A., 2007. Arsenic bioaccessibility in a
soil amended with drinking-water treatment residuals in the presence of phosphorus
fertilizer. Arch Environ Contam. Toxicol. 53:329–336.
Self-Davis, M.L., Moore, Jr., P.A., Daniel, T.C., Edwards, D.R., 1998. Use of aluminum sulfate
to reduce soil test P levels in soils fertilized with poultry litter. In: Proc. National Poultry
Waste Management Symposium, 24-26 Oct. 1998. Auburn University, AL.
SFWMD. 2000. Everglades Consolidated Report, Chapter 8: Advanced Treatment Technologies
for Treating Stormwater Discharges into Everglades Protection Area. South Florida
Water Management District, West Palm Beach, FL, USA.
SFWMD, 2002. Chapter 4C: Advanced Treatment Technologies. South Florida Water

Final Report – Chemical Treatment
184
Management District Everglades Consolidated Report. West Palm Beach, Florida, USA.
Sharpley, A.N., 1999. Global issues of phosphorus in terrestrial ecosystems. In: Reddy, K.R.,
(Ed.). Phosphorus Biogeochemistry in Subtropical Ecosystems. Lewis Publishers, Boca
Raton, Florida, pp. 15-46.
Sharpley, A.N., Halvorson, A.D., 1994. The management of soil phosphorus availability and its
transport in agricultural runoff. In: Lal, R., (Ed.). Soil processes and water quality:
Advances in Soil Science. Lewis Publ., Boca Raton, Florida, pp. 1-84.
Silveira, M.L., Miyattah, M.K., O'Connor, G.A., 2006. Phosphorus release from a manure-
impacted Spodosol: Effects of a water treatment residual. J. Environ. Qual. 35:529-541.
Sims, J.T., Simard, R.R., Joern, B.C., 1998. Phosphorus loss in agricultural drainage: historical
perspective and current research. J. Environ. Qual. 27:277-293.
Sloan, J.J., Basta, N.T., Westerman, R.L., 1995. Aluminum transformations and solution
equilibria induced by banded phosphorus fertilizer in acid soil. Soil Sci. Soc. Am. J.
59:357-364.
Sojka, R.E. and Lentz, R.D. 1997. A PAM Primer: A Brief History of PAM and PAM Related
Issues. U.S. Department of Agriculture, Agricultural Research Service, Northwest
Irrigation and Soils Research Lab. Posted on USDA-ARS website.
http://www.nwisrl.ars.usda.gov/research/PAM/primer.
Snoeyink, V.L., and Jenkins, D. (1980). Water Chemistry. John Wiley and Sons: New York.
Stanley Consultants, Inc. 2002. Lake Okeechobee Water Retention and Phosphorus Removal
Project. Design Analysis Report, Vol. 1. Prep. for Army Corps of Engineers,
Jacksonville, FL, USA.
Stumm, W., and Morgan, J.J. (1981). Aquatic Chemistry: An Introduction Emphasizing
Chemical Equilibria in Natural Waters, 2nd
Ed. John Wiley and Sons: New York.
SWET. 2001. Final Report - Task 1.3 Literature Review. SFWMD Project entitled „Dairy Best
Available Technologies in the Okeechobee Basin‟. SFWMD. West Palm Beach, FL.
SWET. 2001. Final Report - Task 2.6 Formulate Technology Alternatives. SFWMD Project
entitled „Dairy Best Available Technologies in the Okeechobee Basin‟. SFWMD, West
Palm Beach, FL.
SWET. 2002. Final Report - Task 2.10 Evaluation of Alternatives Ranking Best Available
Technologies. SFWMD Project entitled „Dairy Best Available Technologies in the
Okeechobee Basin‟. SFWMD. West Palm Beach, FL.

Final Report – Chemical Treatment
185
SWET. 2002. Final Report - Task 2.11 Animal Nutrient Management Assessments (ANMAs)
For the Three Selected Dairies. SFWMD Project entitled „Dairy Best Available
Technologies in the Okeechobee Basin‟. SFWMD. West Palm Beach, FL.
SWET. 2008. Final Report – Task 4.1 Dairy Best Available Technologies in the Okeechobee
Basin‟. SFWMD. West Palm Beach, FL.
SWET. 2008. Final Report - Task 1 Search and Review of Existing Information. SFWMD
Project entitled „Technical Assistance in Review and Analysis of Existing Data for
Evaluation of Legacy Phosphorus in the Lake Okeechobee Watershed‟. SFWMD. West
Palm Beach, FL.
T
Townsend, TG, Jang, J.C., Jain, P., Tolaymat, T., 2001. Characterization of drinking water
sludges for beneficial reuse and disposal. Report submitted to Florida Center for Solid and
Hazardous Waste Management, Gainesville, FL.
U
U.S. Department of Agriculture-Agricultural Research Service. 2009. From Golf to Gulf,
Drainage Industry Greens. Agricultural Research magazine.
http://www.ars.usda.gov/is/AR/archive/jan09/drainage0109.htm
U.S. Environmental Protection Agency, 1996. Management of water treatment residuals.
EPA/625/R-95/008. Office of research and development, Washington, DC.
V
Valdivia, R., 1977. Effect of Dietary Aluminum on Phosphorus Utilization by Ruminants. PhD
thesis. University of Florida, Gainesville.
Valdivia, R., Ammerman, C.B., Wilcox, C.J., Henry, P.R., 1978. Effects of dietary aluminum on
animal performance and tissue mineral levels in growing steers. J. Anim. Sci. 47, 1351–
1360.
Valdivia, R.C., Ammerman, C.B., Henry, P.R., Feaster, J.P., Wilcox, C.J. 1982. Effect of dietary
aluminum and phosphorus on performance, phosphorus utilization, and tissue mineral
composition in sheep. J. Anim. Sci. 55:402-410.

Final Report – Chemical Treatment
186
Van Alstyne, R., McDowell, L.R., Davis, P.A., Wilkinson, N.S., O‟Connor, G.A., 2007. Effects
of an aluminum-water treatment residual on performance and mineral status of feeder
lambs. Small Ruminant Res. 73:77-86.
Vance, G.F., Stevenson, F.J., Sikora, F.J., 1996. Environmental Chemistry of Aluminum-organic
complexes, In: Sposito, G., (Ed.). Environmental Chemistry of Aluminum (second ed.).
CRC Press Inc. Boca Raton, Florida, pp. 169-220.
Viraraghavan, T., Ionescu, M., 2002. Land application of phosphorus-laden sludge: A feasibility
analysis. J. Environ. Manage. 64:171-177.
Virginia Erosion & Sediment Control Regulations (4VAC50-30-40). 2002. Erosion & Sediment
Control Technical Bulletin #2. Application of Anionic Polyacrylamide for Soil
Stabilization and Stormwater Management.
http://www.dcr.virginia.gov/soil_&_water/documents/anionic.pdf
W
WATER/Engineering and Management. (Feb 1998).
Watershed Technologies, 2008. Implementation of Hybrid Wetland Treatment Technology in the
Northern Everglades Watershed. Final project report submitted to the Florida Department
of Agriculture and Consumer Services, Tallahassee, FL, USA.
Watershed Technologies, Draft. Nubbin Slough Full-Scale and Mesocosm-Scale HWTT
Preliminary Cost –Benefit Analyses.
Wanielista, M.P.; Yousef, Y.A.; and Taylor, J.S., (1981). "Stormwater Management to Improve
Lake Water Quality," Final report Environmental Protection Agency. 600/2-82-048,
January.
Wanielista, M.P., "Lake Eola: A Case Study, (1979)." Urban Stormwater and Combined Sewer
Overflow Impacts Workshop, Orlando, Florida, Environmental Protection Agency,
November 27.
Z
Zhang, J, S.A.F. Ray, and A. Steinman. 2002. Potential phosphorus load reductions under the
Lake Okeechobee regulatory program, J. Am. Water Resources Association 38: 1613-1624.