Mapping the Surface of Sheet Flow Water in the Everglades
6
Mapping the Surface of Sheet Flow Water in the Everglades William Carter, Ramesh Shrestha, Grady Tuell, David Bloomquist, and Michael Sartori University of Florida, Department of Civil and Coastal Engineering GeoSensing Systems Engineering, Gainesville, FL, 32611 e-mail: [email protected] KEY WORDS: Mapping, Airborne, Laser, Intensity, Nadir Points, Sheet Flow Water ABSTRACT University of Florida (UF) researchers used airborne laser swath mapping (ALSM) to map the height of vegetation, relative to the surface of sheet flow water, in the Everglades. In less than three hours of flying, ALSM provided sub-decimeter precision measurements of the height and slope of the water surface over an area greater than 50 square kilometers. The RMS scatter of the measurements about the best fitting slope along a 14 kilometer transect was less than 4 cm. Two features of the UF ALSM system were of particular advantage in this project: coverage of the nadir provided by the oscillating mirror scanner, and intensity values of the return signals. Openings in the grasses allowed a small percentage of laser shots, at the nadir of the aircraft, to be reflected from the calm surface of the slowly flowing water. These nearly specular reflections produced intensity values five to ten times as strong as the diffuse reflections from the grasses. The ALSM observations had to be carefully calibrated for the unusually strong return signals, but once this was done the signal-to-noise ratio was excellent and the geometry could not have been better for determining the height of the water surface. This project demonstrated the unique capabilities of ALSM to quickly and accurately map remote wildlife habitats, in this case that of the Cape Sable Seaside Sparrow, an endangered species that builds nests within 15 cm of the surface of the water. Managers hope to use such measurements to plan and control the release of water in order to avoid inundating nests, hopefully helping the Cape Sable Seaside Sparrow to avoid extinction. BACKGROUND The conceptual basis for Airborne Laser Swath Mapping (ALSM), which is also referred to as LIDAR (light detection and ranging), LADAR (laser detection and ranging), and airborne laser altimetry, has existed for at least two decades. However, until a few years ago only federal agencies such as the Department of Defense and the National Aeronautics and Space Administration could afford to build and operate the large, heavy, power demanding early generation instrumentation. The development of compact energy efficient diode pumped Nd:YAG lasers, Inertial Measurement Units (IMU) composed of fiber optic gyroscopes and solid state accelerometers, and high performance personal computers during the mid 1990's suddenly made it possible to build ALSM units that could be operated from light dual, or even single, engine aircraft. The attendant order-of-magnitude drop in operating costs for the first time allowed academic researchers access to this powerful technology, setting off a remarkable growth in studies of Earth’s topography, bridging such traditional specialties as geodesy, geophysics, hydrology, civil engineering and biology (Gutelius et. al., 1998; Carter et. al., 1998: Shrestha, et. al., 1998) In March, 1999, the University of Florida (UF) and Florida International University, took delivery of the first ALSM unit, an Optech Inc. model ALTM 1210, to be purchased by an academic institution in the United States (Shrestha et. al., 1999). Researchers at these universities have completed more than twenty research projects, funded by a wide variety of federal, state and county agencies. In this paper we report results from an ALSM survey conducted in the Florida Everglades, funded by the U.S. Geological Survey, to explore the capabilities of the technique to map the height of vegetation (most particularly of grasses that grow in areas of shallow surface sheet flow of water) relative to the surface of the water. INTRODUCTION The U.S. Congress has appropriated billions of dollars to restore large portions of the Florida Everglades. Dikes, canals and locks constructed by the U.S. Army Corps of Engineers to manage surface water will be removed, restoring the natural sheet flow of water across thousands of square kilometers of grass lands. Cape Sable Seaside Sparrows build their nests in the grass, just above the surface of the water. U.S. Park Service personnel estimate that an increase in the height of the water surface of just 15 centimeters, while the nests are in use, can result in their inundation, reducing the ability of this endangered species to reproduce. The primary focus of the UF research was to determine if ALSM could provide precise measurements of the grass water interface, and the height of the vegetation above that interface. The Everglades project extended over a nearly rectangular block, approximately 9.5 kilometers by 10 kilometers, located just west of Homestead, Florida (Figure 1.). The ALSM data were collected in a single flight of approximately three hours, with less than two hours of laser “on” time. Table 1. summarizes the primary specifications associated with the data collection. Two features of the UF/FIU ALSM system were used to advantage in this project: coverage of the nadir provided by the oscillating mirror scanner, and measurement of the intensities of the return signals.
-
Upload
independent -
Category
Documents
-
view
5 -
download
0
Transcript of Mapping the Surface of Sheet Flow Water in the Everglades

Mapping the Surface of Sheet Flow Water in the Everglades
William Carter, Ramesh Shrestha, Grady Tuell, David Bloomquist, and Michael SartoriUniversity of Florida, Department of Civil and Coastal Engineering
GeoSensing Systems Engineering, Gainesville, FL, 32611e-mail: [email protected]
KEY WORDS: Mapping, Airborne, Laser, Intensity, Nadir Points, Sheet Flow Water
ABSTRACT
University of Florida (UF) researchers used airborne laser swath mapping (ALSM) to map the height of vegetation, relative to thesurface of sheet flow water, in the Everglades. In less than three hours of flying, ALSM provided sub-decimeter precisionmeasurements of the height and slope of the water surface over an area greater than 50 square kilometers. The RMS scatter of themeasurements about the best fitting slope along a 14 kilometer transect was less than 4 cm. Two features of the UF ALSM systemwere of particular advantage in this project: coverage of the nadir provided by the oscillating mirror scanner, and intensity values ofthe return signals. Openings in the grasses allowed a small percentage of laser shots, at the nadir of the aircraft, to be reflected fromthe calm surface of the slowly flowing water. These nearly specular reflections produced intensity values five to ten times as strongas the diffuse reflections from the grasses. The ALSM observations had to be carefully calibrated for the unusually strong returnsignals, but once this was done the signal-to-noise ratio was excellent and the geometry could not have been better for determiningthe height of the water surface. This project demonstrated the unique capabilities of ALSM to quickly and accurately map remotewildlife habitats, in this case that of the Cape Sable Seaside Sparrow, an endangered species that builds nests within 15 cm of thesurface of the water. Managers hope to use such measurements to plan and control the release of water in order to avoid inundatingnests, hopefully helping the Cape Sable Seaside Sparrow to avoid extinction.
BACKGROUND
The conceptual basis for Airborne Laser Swath Mapping (ALSM), which is also referred to as LIDAR (light detection and ranging),LADAR (laser detection and ranging), and airborne laser altimetry, has existed for at least two decades. However, until a few yearsago only federal agencies such as the Department of Defense and the National Aeronautics and Space Administration could afford tobuild and operate the large, heavy, power demanding early generation instrumentation. The development of compact energy efficientdiode pumped Nd:YAG lasers, Inertial Measurement Units (IMU) composed of fiber optic gyroscopes and solid stateaccelerometers, and high performance personal computers during the mid 1990's suddenly made it possible to build ALSM units thatcould be operated from light dual, or even single, engine aircraft. The attendant order-of-magnitude drop in operating costs for thefirst time allowed academic researchers access to this powerful technology, setting off a remarkable growth in studies of Earth’stopography, bridging such traditional specialties as geodesy, geophysics, hydrology, civil engineering and biology (Gutelius et. al.,1998; Carter et. al., 1998: Shrestha, et. al., 1998)
In March, 1999, the University of Florida (UF) and Florida International University, took delivery of the first ALSM unit, an OptechInc. model ALTM 1210, to be purchased by an academic institution in the United States (Shrestha et. al., 1999). Researchers at theseuniversities have completed more than twenty research projects, funded by a wide variety of federal, state and county agencies. Inthis paper we report results from an ALSM survey conducted in the Florida Everglades, funded by the U.S. Geological Survey, toexplore the capabilities of the technique to map the height of vegetation (most particularly of grasses that grow in areas of shallowsurface sheet flow of water) relative to the surface of the water.
INTRODUCTION
The U.S. Congress has appropriated billions of dollars to restore large portions of the Florida Everglades. Dikes, canals and locksconstructed by the U.S. Army Corps of Engineers to manage surface water will be removed, restoring the natural sheet flow of wateracross thousands of square kilometers of grass lands. Cape Sable Seaside Sparrows build their nests in the grass, just above thesurface of the water. U.S. Park Service personnel estimate that an increase in the height of the water surface of just 15 centimeters,while the nests are in use, can result in their inundation, reducing the ability of this endangered species to reproduce. The primaryfocus of the UF research was to determine if ALSM could provide precise measurements of the grass water interface, and the heightof the vegetation above that interface.
The Everglades project extended over a nearly rectangular block, approximately 9.5 kilometers by 10 kilometers, located just west ofHomestead, Florida (Figure 1.). The ALSM data were collected in a single flight of approximately three hours, with less than twohours of laser “on” time. Table 1. summarizes the primary specifications associated with the data collection. Two features of theUF/FIU ALSM system were used to advantage in this project: coverage of the nadir provided by the oscillating mirror scanner, andmeasurement of the intensities of the return signals.

350,000 400,000 450,000 500,000 550,000 600,000 650,000
NAD83 UTM Easting (m)
2,750,000
2,800,000
2,850,000
2,900,000
2,950,000
3,000,000
NA
D83
UTM
Nor
thin
g (m
)
Project Area
Figure 1. Map showing the location of project area in the Florida Everglades.
Table 1. Everglades Data Collection Specifications
Flying height: 487m Number of flight lines: 30
Flying speed: 60 m/sec Total number points: 46,000,000
Scan angle: ±19 degrees Water surface points: 25,905
Scan rate: 30 Hz DEM interpolation: Kriging
EXTRACTING WATER SURFACE POINTS
Oscillating Mirror Scanner
The UF/FIU ALSM unit uses a simple oscillating mirror scanner to distribute the laser pulses along a line at right angles to, andextending equally on either side of, the longitudinal axis of the aircraft. The forward motion of the aircraft creates a saw-toothpattern of laser points on the surface, within the swath covered by a single pass. The width of the swath, the spacing of laser pointsalong each scan line, and the spacing between tips of the saw-tooth pattern depend on the flying height and speed of the aircraft, aswell as the scan rate and angle selected. The features of the oscillating mirror scanner generally considered as positive include thesimplicity and relatively low cost of the scanner instrumentation, and the ease of changing the scan rate and angle, which provide theuser freedom to choose the distribution of laser point spacing within the saw-tooth pattern. By selecting a slow scan rate (few Hz) thespacing of adjacent points along the scan lines can be minimized, providing improved spatial resolution across the swath. Spatialresolution is sacrificed in the along track direction, but that may be acceptable if the primary interest is in mapping lineal features,such as the edges of highways, the front edges of dunes along a beach, or the wet water line on a beach. Conversely, by selecting ahigh scan rate (tens of Hz) the spatial resolution in the along track direction can be improved, at the cost of reducing the across trackresolution. Intermediate scan rates can be used to generate a pattern with nearly equal spacing of points across and along the track,for general mapping and the production of Digital Elevation Models (DEM).
The negative aspects of the oscillating mirror scanner most generally cited include the concentration of points near the tips of thesaw-tooth pattern, and the large change in the angle of incidence of the laser pulses with the surface of the terrain. The concentrationof points near the edges of the swath is undesirable not only because the information gained tends to be redundant, but also becausethe dynamics involved in stopping and reversing the direction of the scanning mirror and angular encoder may degrade the positionalaccuracy of the points. Often, points near the edges of the scan are simply discarded, to avoid these problems. The UF/FIU unit has alow mass beryllium mirror that minimizes the problem of reversing directions, and we usually truncate only a fraction of a degree,perhaps 0.1 to 0.25 degree, depending on the scan rate. Dealing with the problems created by large variations in the angle ofincidence is more difficult. Large changes in the angle of incidence can result in large variations in the amplitude of the laser returns,
523,000 523,100 523,200 523,300 523,400 523,500 523,600 523,700 523,800
NAD83 UTM Easting (m)
2,818,600
2,818,700
2,818,800
2,818,900
2,819,000
NA
D83
UTM
Nor
thin
g (m
)
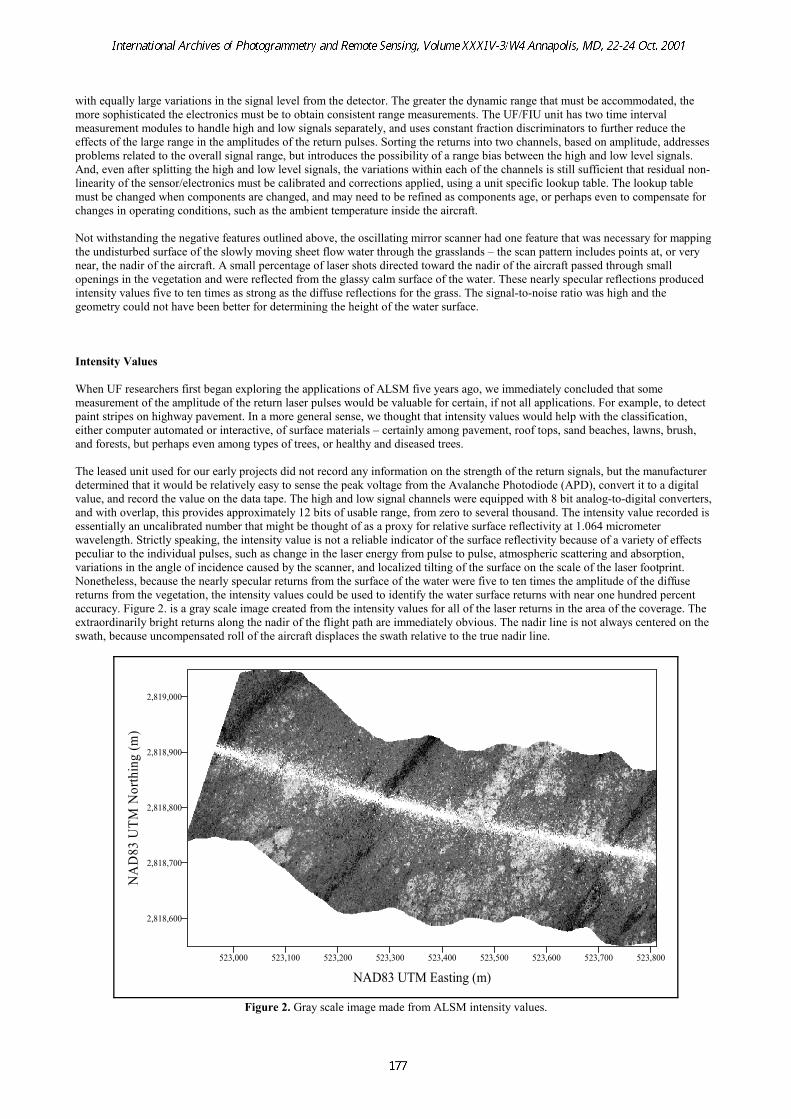
Figure 2. Gray scale image made from ALSM intensity values.
with equally large variations in the signal level from the detector. The greater the dynamic range that must be accommodated, themore sophisticated the electronics must be to obtain consistent range measurements. The UF/FIU unit has two time intervalmeasurement modules to handle high and low signals separately, and uses constant fraction discriminators to further reduce theeffects of the large range in the amplitudes of the return pulses. Sorting the returns into two channels, based on amplitude, addressesproblems related to the overall signal range, but introduces the possibility of a range bias between the high and low level signals.And, even after splitting the high and low level signals, the variations within each of the channels is still sufficient that residual non-linearity of the sensor/electronics must be calibrated and corrections applied, using a unit specific lookup table. The lookup tablemust be changed when components are changed, and may need to be refined as components age, or perhaps even to compensate forchanges in operating conditions, such as the ambient temperature inside the aircraft.
Not withstanding the negative features outlined above, the oscillating mirror scanner had one feature that was necessary for mappingthe undisturbed surface of the slowly moving sheet flow water through the grasslands – the scan pattern includes points at, or verynear, the nadir of the aircraft. A small percentage of laser shots directed toward the nadir of the aircraft passed through smallopenings in the vegetation and were reflected from the glassy calm surface of the water. These nearly specular reflections producedintensity values five to ten times as strong as the diffuse reflections for the grass. The signal-to-noise ratio was high and thegeometry could not have been better for determining the height of the water surface.
Intensity Values
When UF researchers first began exploring the applications of ALSM five years ago, we immediately concluded that somemeasurement of the amplitude of the return laser pulses would be valuable for certain, if not all applications. For example, to detectpaint stripes on highway pavement. In a more general sense, we thought that intensity values would help with the classification,either computer automated or interactive, of surface materials – certainly among pavement, roof tops, sand beaches, lawns, brush,and forests, but perhaps even among types of trees, or healthy and diseased trees.
The leased unit used for our early projects did not record any information on the strength of the return signals, but the manufacturerdetermined that it would be relatively easy to sense the peak voltage from the Avalanche Photodiode (APD), convert it to a digitalvalue, and record the value on the data tape. The high and low signal channels were equipped with 8 bit analog-to-digital converters,and with overlap, this provides approximately 12 bits of usable range, from zero to several thousand. The intensity value recorded isessentially an uncalibrated number that might be thought of as a proxy for relative surface reflectivity at 1.064 micrometerwavelength. Strictly speaking, the intensity value is not a reliable indicator of the surface reflectivity because of a variety of effectspeculiar to the individual pulses, such as change in the laser energy from pulse to pulse, atmospheric scattering and absorption,variations in the angle of incidence caused by the scanner, and localized tilting of the surface on the scale of the laser footprint.Nonetheless, because the nearly specular returns from the surface of the water were five to ten times the amplitude of the diffusereturns from the vegetation, the intensity values could be used to identify the water surface returns with near one hundred percentaccuracy. Figure 2. is a gray scale image created from the intensity values for all of the laser returns in the area of the coverage. Theextraordinarily bright returns along the nadir of the flight path are immediately obvious. The nadir line is not always centered on theswath, because uncompensated roll of the aircraft displaces the swath relative to the true nadir line.

523,000 523,100 523,200 523,300 523,400 523,500 523,600 523,700 523,800
NAD83 UTM Easting (m)
2,818,600
2,818,700
2,818,800
2,818,900
2,819,000
NA
D83
UTM
Nor
thin
g (m
)
Figure 3a. Shaded relief image showing the trail caused by intensity calibration error.
523,000 523,100 523,200 523,300 523,400 523,500 523,600 523,700 523,800
NAD83 UTM Easting (m)
2,818,600
2,818,700
2,818,800
2,818,900
2,819,000
NA
D83
UTM
Nor
thin
g (m
)
Figure 3b. Shaded relief image of the same area in Figure 3a after correcting intensity calibration.
REFINING THE RANGE CALIBRATION VALUES
Figure 3a. is a shaded relief image of the topography created from a DEM derived from the ALSM horizontal position and heightvalues. Imperfect calibration values in the lookup table used to correct the raw range measurements (discussed above) cause thepositions, and most particularly the heights, of the high intensity returns to be systematically biased. In the shaded relief image, thisresults in a narrow “trail” along the nadir line. Figure 3b. shows the same area after refinements have been made to the calibrationlookup table. The corrections were derived simply by cutting several cross sections through the nadir line (which extended severaltens of meters on each side of the nadir line) plotting the surface and determining the corrections needed to flatten the trail. Therefined calibration values were linear over a range of intensities of 1500 to 2500, into which most of the nadir water surface returnsfell. The corrected lookup table was used to process all of the data from the project and, based on samples examined from otherswaths, generally reduced any remaining apparent height biases to about three to five centimeters. Because of the large size of thedata set, we limited our examination to a small sampling, but after applying the corrections, the trails were greatly diminished, and inmost cases could no longer be seen in the shaded relief images.

523,000 524,000 525,000 526,000 527,000 528,000 529,000 530,000 531,000
NAD83 UTM Easting (m)
2,817,000
2,818,000
2,819,000
2,820,000
2,821,000
2,822,000
2,823,000
2,824,000
2,825,000
2,826,000
NA
D83
UTM
Nor
thin
g (m
)
Figure 4. A plot of the 25,905 nadir water surface points extracted from the total data set.
FINAL PRODUCTS
Figure 4. shows a plot of the 25,905 nadir water surface points extracted from the total data set. The distribution along each flightline varies, depending on the density of the vegetation and the amount of open water. Kriging was used to interpolate heights at gridpoints to generate a DEM, and that DEM was used to compute height contours. Figure 5. shows a color filled contour map of theproject area. An apparent slope of the water surface, from a high in the northeast to a low in the southwest, is immediately apparent.
CONCLUDING REMARKS
We conclude from this initial test that ALSM, with intensity capability, offers a convenient and reliable method of determining theprecise height of the surface of sheet flow water in areas such as the Florida Everglades. While the Everglades are unique in certainaspects, there are other types of terrain where intensity values can be used to advantage. In fact, UF researchers first experienced andbecame aware of the potential value of water surface nadir returns while working along the intra-coastal waterway in PinellasCounty, Florida. In that setting, they provided an accurate record of the surface of the tidal waters relative to the land, at the time ofeach of the data collection sessions. Similarly, in surveying tidal marsh areas along the coastline, the specular returns from nadirwater surfaces help capture details of the complex drainage patterns in these environmentally sensitive areas, and document theheight of the tidal water at the time of the mapping, with a precision of a few centimeters.
The use of ALSM in areas such as the Everglades or coastal marshes, where vegetation and water surfaces are closely intermixed incomplex patterns, is not without problems. At angular distances of more than a few degrees from the nadir, the laser pulses reflectedfrom the water surface are directed away from the aircraft and no return signals are detected, unless the reflected pulses strikevegetation. The laser light scattered from the vegetation may be sufficient to be detected by the ALSM sensor. We found a smallpercentage of such “multi-path” returns in the Everglades observations. These points could be identified because the anomalouslylong ranges yield height values below the surface of the water. Even with the increased processing required to remove multi-pathpoints and perform extensive quality control procedures, ALSM is less expensive, faster and more accurate than traditional groundsurveying and photogrammetric methods in these remote settings, and should prove invaluable in the restoration of the Evergladesand coastal marsh areas.

523,000 524,000 525,000 526,000 527,000 528,000 529,000 530,000 531,000
NAD83 UTM Easting (m)
2,817,000
2,818,000
2,819,000
2,820,000
2,821,000
2,822,000
2,823,000
2,824,000
2,825,000
2,826,000
NA
D83
UTM
Nor
thin
g (m
)
Contour Interval = 10 cm
Profile Line
A
B
0.6
0.7
0.8
0.9
1.0
1.1
1.2
Orth
omet
ric H
eigh
t (m
)
Figure 5. The height of the surface of sheet flow water through an area of the
Another step in the evaluation of ALSM for applications related to the restoration of the Everglades was recently announced by theSouth Florida Water Management District (SFWMD). It involves tests to determine if the technology might prove useful to monitorthe evolution of tree islands scattered throughout the submerged grasslands. The goal is to be able to detect changes in the size of thetree islands, and in the health of the trees and shrubs on the islands. A contract to collect and analyze ALSM observations of the treeislands has been awarded to a private sector company. Unfortunately, it appears that the contractor will not collect intensity values.UF researchers think that this is a serious mistake, which will ultimately limit the usefulness of the data collected for the SFWMDproject, and we are currently seeking the resources to map some number of the tree islands with the UF/FIU system.
ACKNOWLEDGMENTS
The research results presented in this paper were supported in part by the U.S. Geological Survey.
REFERENCES
Shrestha, R.L., W.E. Carter, M. Lee, P. Finer and M. Sartori, Airborne Laser Swath Mapping: Accuracy Assessment for Surveyingand Mapping Applications, Journal of American Congress on Surveying and Mapping, Vol. 59, No. 2, pp. 83-94, 1999.
Carter, W. E., R.L. Shrestha and S. P. Leatherman, Airborne Laser Swath Mapping: Applications to Shoreline Mapping, Proceedingsof International Symposium on Marine Positioning (INSMAP ‘98), Melbourne, FL, Nov. 30 - Dec. 4, 1998.
Shrestha, R.L. and W.E. Carter, Instant Evaluation of Beach Storm Damage Using Airborne Laser Terrain Mapping, EOM, TheMagazine for Geographic, Mapping, and Earth Information, pp. 42-44, 1998.
Gutelius, G, W.E. Carter, R.L. Shrestha, E. Medvedev, R. Gutierez, and J.G. Gibeaut, Engineering Applications of AirborneScanning Lasers: Reports from the Field, HIGHLIGHT ARTICLE, PE&RS, The Journal of American Society for Photogrammetryand Remote Sensing, Vol. LXIV, No. 4, pp. 246-253, 1998.