GLOBAL HEALTH SUPPLY CHAIN TECHNICAL ASSISTANCE
58
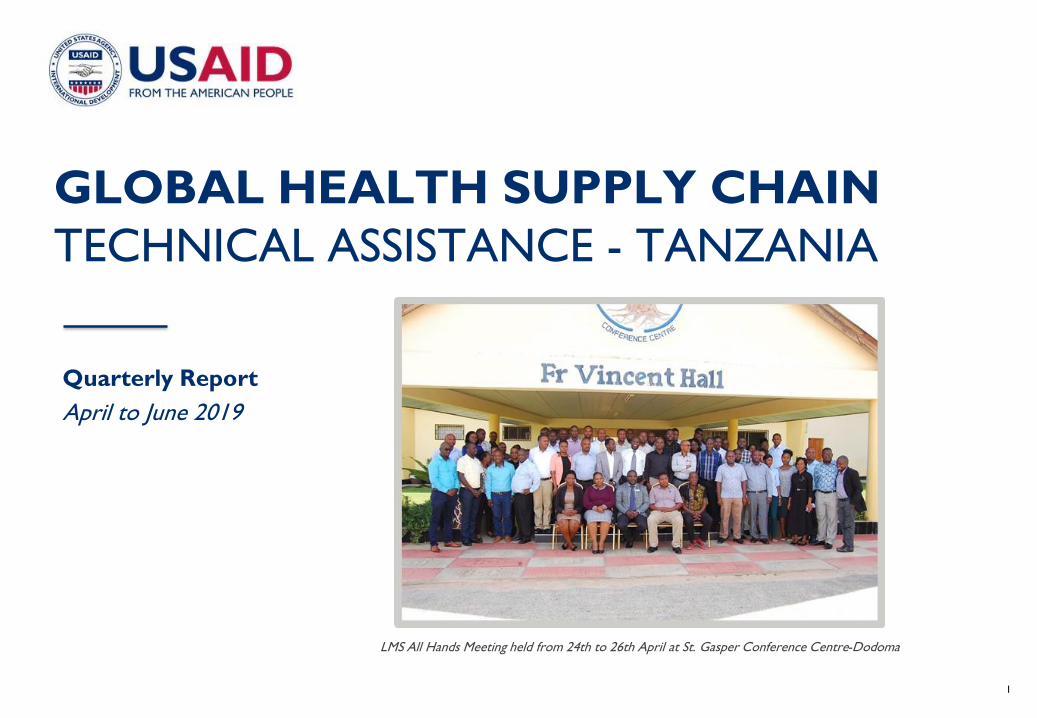
1 GLOBAL HEALTH SUPPLY CHAIN TECHNICAL ASSISTANCE - TANZANIA Quarterly Report April to June 2019 LMS All Hands Meeting held from 24th to 26th April at St. Gasper Conference Centre-Dodoma
-
Upload
khangminh22 -
Category
Documents
-
view
3 -
download
0
Transcript of GLOBAL HEALTH SUPPLY CHAIN TECHNICAL ASSISTANCE
1
GLOBAL HEALTH SUPPLY CHAIN
TECHNICAL ASSISTANCE - TANZANIA
Quarterly Report
April to June 2019
LMS All Hands Meeting held from 24th to 26th April at St. Gasper Conference Centre-Dodoma

2
TABLE OF CONTENTS
Project Goal and Objectives 3
Key Accomplishments this Quarter 4
Workstream Accomplishments 5
Implementation Challenges, Risks, and
Mitigation Measures21
Project Monitoring Plan Report 26
Annexes 31
Acronyms 32
Root Cause Analysis for selected PMP
Indicators37
Travel and Training Report 56Dr. Zainab Chaula, Permanent Secretary of the MoHCDGEC
addressing the participants at a meeting introducing new MoHCDGEC staff to implementing partners in Dodoma.

3
GHSC TA-TZ PROJECT GOALS & OBJECTIVES
Key stakeholders (in addition to USAID and CDC): Ministry of Health, Community Development, Gender, Elderly and Children (MoHCDGEC)–specifically the Pharmaceutical Services Unit (PSU), Diagnostics Service Section (DSS), Information, Communication and Technology (ICT) directorate, and
vertical programs – including National AIDS Control Program (NACP), National Malaria Control Program (NMCP), Reproductive and Child Health Services
(RCHS) Program, and National Tuberculosis and Leprosy Program (NTLP), Medical Stores Department (MSD) - central and 10 zones; President’s Office of Regional Administration and Local Governments (PO-RALG) (comprised of 186 councils, 168 districts, and 26 regions), Zanzibar Ministry of Health, Zanzibar Central Medical Stores, Zanzibar Vertical Programs, and other implementing partners.
Timeframe – June 2016 – June 2021
(3 year base and 2 option years)
Geographic focus – Mainland Tanzania. Zanzibar
(Approximately 7,000 public health facilities)
Assist leadership to
operationalize strategic
plans
Provide strategic
planning and
implementation
assistance
1
Support supply chain costing
and financing strategies
Strengthen supply chain MIS
Strengthen laboratory
supply chains
Increase skills of key
counterparts
Increase data use and
improve data quality
Support MoHCDGEC in
implementing and
improving RBF scheme
Establish a culture of
collaboration and
information sharing
Improve delivery of
health commodities
in service sites2
Obje
ctiv
esIn
terv
enti
ons
Broaden stakeholder
understanding and
engagement of the
supply chain system
3Strengthen enabling
environments to
improve supply chain
performance
4
Support the transition of
LMS/LMU to GoT and GoZ
structure(s)
Strengthen governance and
accountability
Goal: Support the development of agile, robust, and sustainable health supply chains that will contribute towards improving medicines availability and the health status of Tanzanians
Improve supply chain
performance against key
indicators
Strengthen and streamline
quantification
4
Objective 1: Provide Strategic
Planning and
Implementation
Assistance
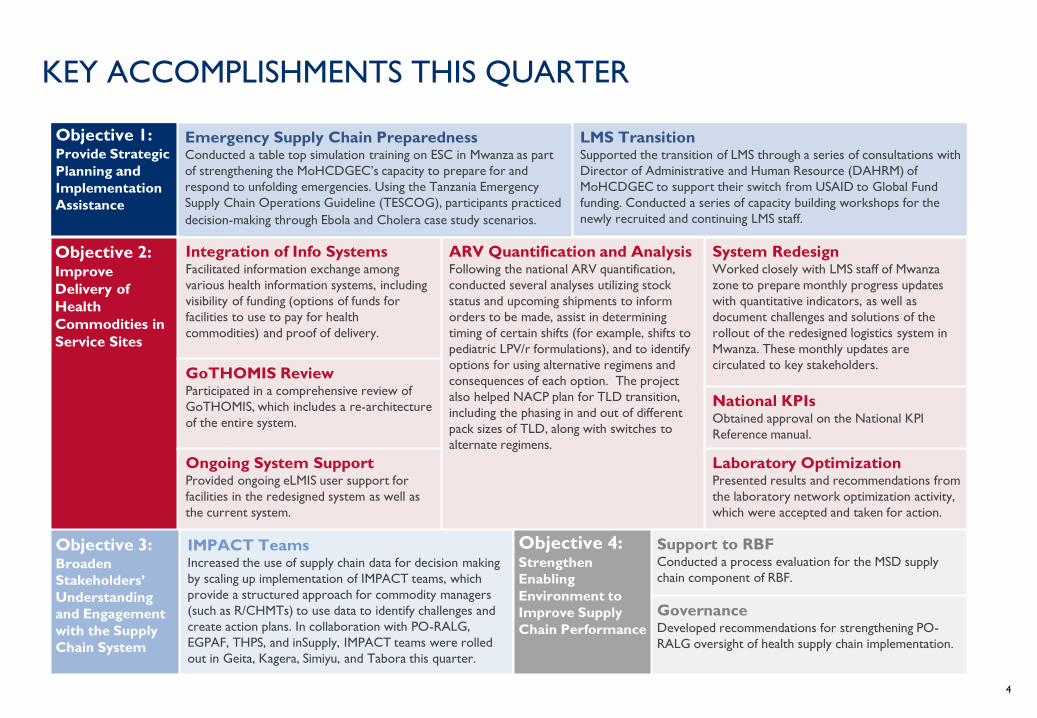
Emergency Supply Chain PreparednessConducted a table top simulation training on ESC in Mwanza as part
of strengthening the MoHCDGEC’s capacity to prepare for and
respond to unfolding emergencies. Using the Tanzania Emergency
Supply Chain Operations Guideline (TESCOG), participants practiced
decision-making through Ebola and Cholera case study scenarios.
LMS Transition Supported the transition of LMS through a series of consultations with
Director of Administrative and Human Resource (DAHRM) of
MoHCDGEC to support their switch from USAID to Global Fund
funding. Conducted a series of capacity building workshops for the
newly recruited and continuing LMS staff.
Objective 2: Improve
Delivery of
Health
Commodities in
Service Sites
Integration of Info Systems Facilitated information exchange among
various health information systems, including
visibility of funding (options of funds for
facilities to use to pay for health
commodities) and proof of delivery.
ARV Quantification and Analysis Following the national ARV quantification,
conducted several analyses utilizing stock
status and upcoming shipments to inform
orders to be made, assist in determining
timing of certain shifts (for example, shifts to
pediatric LPV/r formulations), and to identify
options for using alternative regimens and
consequences of each option. The project
also helped NACP plan for TLD transition,
including the phasing in and out of different
pack sizes of TLD, along with switches to
alternate regimens.
System RedesignWorked closely with LMS staff of Mwanza
zone to prepare monthly progress updates
with quantitative indicators, as well as
document challenges and solutions of the
rollout of the redesigned logistics system in
Mwanza. These monthly updates are
circulated to key stakeholders. GoTHOMIS ReviewParticipated in a comprehensive review of
GoTHOMIS, which includes a re-architecture
of the entire system.
National KPIs Obtained approval on the National KPI
Reference manual.
Ongoing System SupportProvided ongoing eLMIS user support for
facilities in the redesigned system as well as
the current system.
Laboratory OptimizationPresented results and recommendations from
the laboratory network optimization activity,
which were accepted and taken for action.
Objective 3: Broaden
Stakeholders’
Understanding
and Engagement
with the Supply
Chain System
IMPACT TeamsIncreased the use of supply chain data for decision making
by scaling up implementation of IMPACT teams, which
provide a structured approach for commodity managers
(such as R/CHMTs) to use data to identify challenges and
create action plans. In collaboration with PO-RALG,
EGPAF, THPS, and inSupply, IMPACT teams were rolled
out in Geita, Kagera, Simiyu, and Tabora this quarter.
Objective 4: Strengthen
Enabling
Environment to
Improve Supply
Chain Performance
Support to RBFConducted a process evaluation for the MSD supply
chain component of RBF.
GovernanceDeveloped recommendations for strengthening PO-
RALG oversight of health supply chain implementation.
KEY ACCOMPLISHMENTS THIS QUARTER

5
WORK STREAM
ACCOMPLISHMENTS

6
Objective 1: Strategic Planning 2 3 4
Overview In Year 3, the project began supporting a new set of activities under the Global Health Security Agenda (GHSA), focused on adapting an
emergency supply chain (ESC) framework for the Tanzania context.
Activities
and
Impact
Related
KPIs
N/A
GHSC TA-TZ, in collaboration MoHCDGEC, conducted an ESC table top simulation
in Mwanza to strengthen Tanzania’s capacity to prepare for and respond to unfolding
public health emergencies (PHEs). The simulation was officiated by MoHCDGEC’S
Acting Director from the Emergency, Preparedness and Response Unit (EPRU), who
highlighted the link between the simulation training and recommendations from the
Joint External Evaluation (JEE) conducted in 2016.
The simulation and training was timely given the high risk posed by the Ebola
outbreak in neighboring countries. Participants included representatives from
MoHCDGEC, PO-RALG, selected members Kigoma and Kagera RHMTs, selected
members of Ngara and Kasulu CHMTs, MSD, and Development Partners (DPs).
Using the Tanzania Emergency Supply Chain Operations Guidelines (TESCOG)
developed by project personnel, participants practiced decision-making during
simulated Ebola and Cholera outbreaks. These simulated scenarios provided
participants a low-stakes environment in which to learn and apply leading practices in
communication and coordination.
SUPPORT TO STRENGTHENING EMERGENCY SUPPLY CHAINS AS PART OF
THE GLOBAL HEALTH SECURITY AGENDA
Participants from MoHCDGEC, PORALG, DPs, selected RHMT members (from Kagera and Kigoma region), CHMT
(from Kasulu and Ngara), DP, MSD practice table top
decision-making using Ebola and Cholera scenarios.

7
Objective 1: Strategic Planning 2 3 4
Overview The project promotes deliberate and routine integration of costing and financing components into supply chain interventions, and alignment of
stakeholders around the cost of the supply chain and available funding sources.
Activities
and
Impact
This quarter, GHSC TA-TZ and an external consultant worked to align the health commodity revolving fund guidelines with government
standards. The guidelines aim to ensure the sustainability of financing of medicines and medical supplies at health facility level by tapping into
complementary funds available, and retaining revenues generated by facilities through health commodities sales. The guidelines will be used by
facilities to improve:
• Collection of revenue for health services provided by health facilities
• Management of revenue collected
• Expenditure of revenue on health commodities
The project also kicked-off an activity to investigate the potential implications of Direct Health Facility Financing (DHFF), particularly on
product availability at the facility level. This study is expected to provide detailed analysis on the impact of a DHFF model for financing of
health commodities, and provide recommendations for ensuring that DHFF is leveraged effectively to improve the quality of health services
and availability of health commodities.
Related
KPIs1.1.1 Percentage of activities carried out in accordance with Costed Implementation Plan: N/A (reported semi-annually)
1.2.2 Percentage of health commodity needs budgeted to be covered by MoHCDGEC: N/A (reported annually)
1.2.3 Percentage of MoHCDGEC budgeted amount which is actually disbursed: N/A (reported annually)
SUPPORT SUPPLY CHAIN COSTING AND FINANCING STRATEGIES

8
Objective 1: Strategic Planning 2 3 4
Overview The Tanzania mainland Logistics Management Services (LMS) was established by the GoT, with support from USAID and the Global Fund, to
coordinate supply chain activities of different MoHCDGEC programs under one unit. GHSC TA-TZ, in addition to providing technical assistance
to the central level LMS, has supported LMS operations at the zonal level with project staff based at MSD zonal warehouses, MSD Central, and in
Dar es Salaam. As of June 30 2019, GHSC TA-TZ no longer provides operational support or staffing to the LMS.
Activities
and
Impact
The project supported the transition of LMS staff from GHSC TA-TZ
structures to the MoHCDGEC by collaborating with the office of
Director of Administrative and Human Resource (DAHRM) of
MoHCDGEC. Numerous consultations and information sharing sessions
with USAID-funded LMS staff were provided to DHARM to facilitate
and smooth and timely transition from USAID to the GF funding
mechanism. The project supported the transfer process of assets
including vehicles, working tools and office furniture from USAID to
GoT ownership.
The project also conducted two phases of capacity building of LMS staff,
focusing on the newly recruited staff:
• Phase I: All Hands Meeting aimed to orient LMS staff to GoT
administrative processes. All LMS staff were in attendance, as were
external facilitators from MOH, PORALG, GFCU, RSSH, HIV Grant,
LFA, and GHSC TA-TZ.
• Phase II: Technical Training intended to build capacity of LMS
staff on Basic Logistics and Supply Chain Management; this involved
LMS staff and external facilitation from MoHCDGEC Programs and
Sections, MSD and GHSC TA-TZ.
Related
KPIs1.2.1 Percentage of LMS operational cost paid by GoT: N/A (reported annually)
SUPPORT THE TRANSITION OF LMS TO GoT STRUCTURES
LMS All Hands Meeting held from 24th to 26th April
at St. Gasper Conference
Centre-Dodoma
Participants in session during the LMS Basic Logistics and Supply Chain Management Training held at Edema Conference
Centre - Morogoro from 13th to 31st May 2019

9
Objective 1: Strategic Planning 2 3 4
Overview In Zanzibar, the Logistics Management Unit (LMU) has been successfully integrated under the Chief Pharmacist Office (CPO) and is
responsible for organizing, monitoring, and supporting Zanzibar’s supply chain activities and logistics systems. The Zanzibar Supply Chain
Strategic Plan of 2017-2020 (and the related Zanzibar Supply Chain Costed Action Plan), dictates LMU-ZNZ’s activities and associated annual
work plans. Four GHSC TA-TZ staff currently provide operational and technical support to LMU-ZNZ, and will continue to do so until June
2020.
Activities
and
Impact
Quantification: The LMU completed a number of quantification exercises, including around ARVs, life-saving commodities, and essential
commodities. The ARV quantification exercise, including PipeLine training, was supported by TA from mainland project staff.
Fleet Management: The project, in collaboration with MSD, assisted the LMU and CMS in developing a Vehicle Use policy and SOPs for
fleet management. The project also provided an orientation to drivers on the policy and SOPs.
Data Use and Quality: The LMU updated the performance monitoring plan, and conducted quarterly supply chain performance review
meetings. Additionally, the LMU participated in the National Medicine Therapeutic Committee.
Increasing Data Visibility: With funding from the Global Fund, the LMU supported the rollout of the eLMIS facility edition (FE) at 5 facilities
as a pilot project.
Supportive Supervision: The LMU conducted supportive supervision, incorporating data quality assessment (DQA) protocols, and offered
on-the-job training (OJT) to support and strengthen the performance of facility staff.
Related
KPIsN/A
SUPPORT THE LOGISTICS MANAGEMENT UNIT: ZANZIBAR

10
1 Objective 2: In-Country Logistics 3 4
Overview GHSC TA-TZ supports the implementation of the electronic logistics management information system (eLMIS) to improve data visibility, quality (via
automated data validation), and use. In addition to supporting eLMIS, the project also contributes to the broader Health Information System (HIS)
architecture, facilitating eLMIS integration with other HISs including Epicor9, DHIS2, the Government of Tanzania Hospital Management Information
System (GoTHOMIS), and the Health Information Mediator (HIM) and Muungano Gateway (interoperability layers).
Activities
and
Impact
Related
KPIs
2.1.1 Percentage of eLMIS issues reported and resolved with agreed SLA: 86%; 2.1.2 Percentage of eLMIS hosting/operational cost supported by GoT: N/A
(reported annually); 2.3.5 Percentage of health facilities submitting timely R&R: 96%
STRENGTHEN SUPPLY CHAIN MANAGEMENT INFORMATION SYSTEMS
systems resulting in significantly improved supply chain visibility.
• Options for “other sources of funds” from which to pay for health
commodities are now available.
• Health facility fulfillment data is now obtained from the Proof of
Delivery MSD mobile application. As MSD rolls out the application,
fulfillment data will be available in eLMIS and MSD portal shown at
right.
Enhancing GoTHOMIS: Following MoHCDGEC & PO-RALG joint guidance to stakeholders in the health sector to support the
improvement of GoTHOMIS as a system of choice by the government, GHSC TA-TZ worked the GoT and IPs on an initial review of
existing GoTHOMIS functionality and requirements as well opportunities for integration with similar initiatives. The objective of the current
improvement plan is to reuse and leverage existing efforts and best practices and to come up with an improved system to support service
delivery at the last mile.
eLMIS Transition: As part of the eLMIS transition where in-country/government staff will maintain, support, and own the system, two
working sessions were conducted to build the capacity in nine government software developers from both MoHCDGEC and PO-RALG to
learn the eLMIS code base. The project continued to provide routine eLMIS support through Helpdesk service, for those in Mwanza and
the other zones.
Increasing Data Availability: The eLMIS was reconfigured per system redesign parameters, and monthly stock-on-hand data is now
available for facilities in Mwanza zone, helping facilitate more accurate monitoring of the TLD transition. Other activities included:
• Health information exchange layers (Muungano Gateway & Health Information Mediator - HIM) bridged previous gaps between information

11
1 Objective 2: In-Country Logistics 3 4
Overview GHSC TA-TZ provides technical assistance and capacity building around quantification within MoHCDGEC (in mainland Tanzania and Zanzibar), to
increase ownership and sustainability of quantification for vertical programs and essential health commodities. In addition, the project broadly aims
to improve forecast accuracy and reduce stock imbalances throughout the public health supply chain.
Activities
and
Impact
Related
KPIs2.2.1 Level of country counterpart ownership in quantification and supply planning: N/A (reported annually)
2.2.2 Forecast accuracy: N/A (reported annually)
STRENGTHEN AND STREAMLINE QUANTIFICATION
ARV quantification debriefing in Dar es Salaam (May 2019)
TDF/3TC/DTG,
0%
54%
85% TDF/3TC/DTG,
85%
TDF /3TC/EFV,
77%
30%
10%
TDF /3TC/EFV,
10%
ABC/3TC+DTG,
5%0%
20%
40%
60%
80%
100%
Pre Jul-19 J19-J20 J20-J21 J21-J22
Transition of Adult 1l TDF/3TC/DTG
TDF /3TC/EFV
ABC/3TC+DTG
AZT/3TC + EFV
AZT/3TC/NVP
ABC/3TC+EFV
TDF/FTC/EFV
ABC+3TC+DTG,
20%
37%ABC+3TC+DTG,
37%
TDF+3TC+DTG,
15%
36% TDF+3TC+DTG,
36%
TDF+3TC+EFV(A),
10%
20% TDF+3TC+EFV(A),
20%
AZT+3TC+LPV/r,
5%
4%AZT+3TC+LPV/r,
4%0%
20%
40%
J19-J20 J20-J21 J21-J22
Transition of Pediatric 1l ABC+3TC+DTG
TDF+3TC+DTG
TDF+3TC+EFV(A)
AZT+3TC+LPV/r
ABC+3TC+ATV/r (A)
AZT+3TC+NVP (P)
AZT+3TC + EFV (P)
ABC+3TC + EFV (P)
ABC+3TC + EFV (P)
Scale enlarged to show detail
The project also supported RCHS and NMCP in updating the PipeLine databases, and submitted all supply plans to PSM.
In addition, project personnel participated in the IPT medicines (Isoniazid 100mg and 300mg) quantification exercise in June 2019. Exercise
attendees included representatives from IPS (AMREF, AGPAHI, THPS, MDH, KNCV), NTLP, NACP, RCHMTs and PORALG central.
The project supported the ARV quantification exercise from April 25 – May 7 which
modeled significant changes to adult and pediatric ARV regimens. Following the
quantification, the project conducted several analyses using stock status and upcoming
shipments to inform orders to be made, help determine timing of certain shifts (e.g.,
shifts to pediatric LPV/r formulations), and to identify options and associated
consequences for using alternative regimens. The project also helped NACP plan for
TLD transition, including the phasing in and out of different pack sizes of TLD. During
this transition period, stocks of ARVs will be closely monitored and the project will
work with NACP to highlight any stock imbalances.

12
1 Objective 2: In-Country Logistics 3 4
Overview One of the prioritized recommendations from the Holistic Supply Chain Review (HSCR) was to increase the frequency of ordering and resupply
for the in-country supply chains (including ILS, HIV/AIDS and TB supply chains). GHSC TA-TZ provides technical guidance on design decisions,
helps build consensus on those decisions, and works to align stakeholders on the process and approach to rollout the system. The project also
works to institutionalize the collection, review, and use of key performance indicators of the national health supply chain, across all stakeholders.
Activities
and
Impact
System Redesign: During Q2, the project supported the rollout of a redesigned logistics system in Mwanza. This quarter, the project continued
working closely with MSD and LMS staff of Mwanza zone to prepare monthly progress updates on quantitative indicators, challenges and solutions
for key stakeholders. The project participated in a consensus meeting with MoHCDGEC (PSU), PO-RALG, Global Fund and PEPFAR to discuss
the rollout of the redesigned logistics system. After the meeting, the project supported preparation of a joint implementation plan leveraging the
lessons learned from Mwanza to facilitate the improvement and scaling up of the redesigned system in the remaining 19 regions.
The MoHCDGEC has decided not to conduct a formal evaluation of the Mwanza pilot, per the original plan, but instead to document performance
on a monthly basis. A system redesign oversight committee was formed, comprised of MoHCDGEC, PORALG, GF, USAID, WHO & GHSC-TA-
TZ; TORs will be developed as soon as possible. The project also followed up on recommendations from the MSD Mwanza assessment,
highlighting actions that should be taken in order for MSD to comply with redesigned logistics system parameters.
KPI Reference Manual: During this quarter, the KPI Reference Manual was approved by MoHCDGEC. The manual contains a total of 16 KPIs,
and documents the parameters and stakeholders responsible for each indicator. Training on the manual and dissemination to key stakeholders is
scheduled for August 2019. The project continued to work with stakeholders to determine baselines and targets for five of the seven pending
KPIs. The remaining two MSD-owned KPIs are dependent on the completion of the ongoing rollout of a proof-of-delivery mobile app across all
zones. The rollout will facilitate reporting MSD item fill rate and on-time delivery.
Management of MDR TB Medicines: The project supported the rapid assessment of multi drug resistant (MDR) TB medicines supply and
management practices. This was in response to an NTLP request to explore potential areas for streamlining management of MDR TB medicines,
as limited focus was given to these medicines during the system redesign initiative. The project provided technical input in developing the rapid
assessment plan and tools, facilitated the orientation of a data collection workshop and participated in data collection. A total of 14 health facilities
were visited between the 7th and 10th May, 2019.
Related
KPIs
2.3.1: Stockout rates for tracer commodities (see PMP); 2.3.2: Inventory turns (see PMP); 2.3.3: Cycle times (see PMP); 2.3.4: Percent of
shipments delivered on time and complete within agreed window (see PMP); 2.3.6 ACT, SP, mRDTS Purchased & Distributed with USG funds:
N/A (reported annually); 2.3.7: Stocked according to plan (see PMP).
IMPROVE SUPPLY CHAIN PERFORMANCE AGAINST KEY INDICATORS

13
1 Objective 2: In-Country Logistics 3 4
Overview GHSC TA-TZ, in collaboration with MoHCDGEC, PO-RALG, USG and IPs, provides technical assistance to strengthen the in-country laboratory
supply chain, focusing on the quantification of laboratory commodities, the implementation of lab-related recommendations from the HSCR, and
the optimization of the laboratory network.
Activities
and
Impact
Laboratory HIV Quantification: The project provided technical assistance on the laboratory HIV quantification exercise throughout all stages
of the process, from data gathering through assumption building, forecasting, supply planning (using PipeLine), and documentation of results for
debriefing meetings. The scope included rapid test kits (RTKs), HIV Viral Load (HVL), HIV Early Infant Diagnosis (EID), hematology, chemistry,
microbiology, and general consumables; during this exercise, hematology and chemistry were not included due to the pending completion of
standardized equipment lists. Following the quantification, the project collected and analyzed data on HVL and HEID machines to determine the
current machine availability and their percentage split among platforms. Results showed that Roche has 75% coverage while Abbot has 25%.
Laboratory Pipeline Monitoring: As part of ongoing efforts to strengthen supply planning, the project provided technical assistance to
MoHCDGEC/NACP on laboratory pipeline monitoring, wherein actual consumption rates from facilities were aggregated from eLMIS, analyzed
and entered to PipeLine database, along with stocks on hand. The project worked with new employees at NACP to build skills in PipeLine
database management, and outputs from PipeLine were shared with relevant stakeholders.
Laboratory Network Optimization: Following the laboratory network optimization activity from last quarter, the project presented the
results and recommendations at the laboratory supply chain meeting and at the laboratory HVL and HEID technical working group. Results were
accepted and recommendations taken for implementation.
Stakeholder Engagement: The project facilitated HVL and EID supply chain discussions through ECHO with stakeholders on HVL/EID
milestones, storage, distribution and inventory levels. The project also conducted a meeting with supply chain stakeholders at MSD to discuss
challenges including Abbot reagents transportation and reagent quality.
Related
KPIsN/A
STRENGTHEN LABORATORY SUPPLY CHAINS
14
1 2 Objective 3: Capacity Building 4
ESTABLISH A CULTURE OF COLLABORATION AND INFORMATION SHARING
Overview Collaboration with in-country stakeholders is central to the project’s approach to supply chain strengthening, decision-making, and management.
Coordination groups (such as commodity security meetings and technical working groups) provide a mechanism to share supply chain data, align
objectives, and facilitate the effective management of commodity-related resources. The project provides quantitative and qualitative data on
supply chain performance to these groups to promote information sharing and the use of data for decision making.
Activities
and
Impact
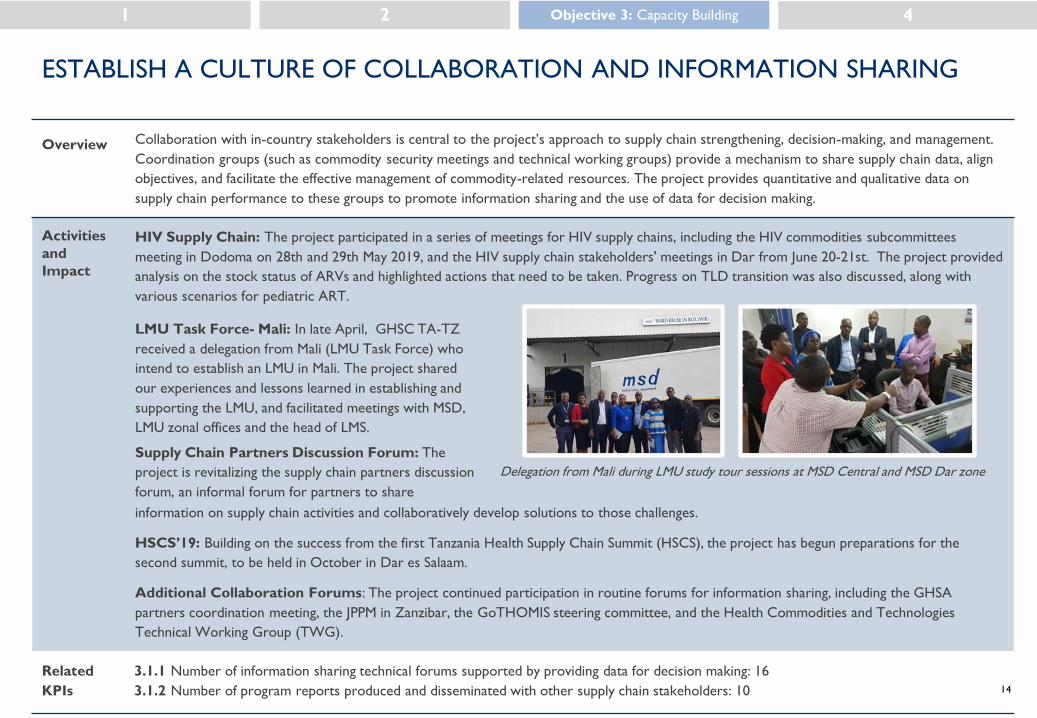
HIV Supply Chain: The project participated in a series of meetings for HIV supply chains, including the HIV commodities subcommittees
meeting in Dodoma on 28th and 29th May 2019, and the HIV supply chain stakeholders' meetings in Dar from June 20-21st. The project provided
analysis on the stock status of ARVs and highlighted actions that need to be taken. Progress on TLD transition was also discussed, along with
various scenarios for pediatric ART.
information on supply chain activities and collaboratively develop solutions to those challenges.
HSCS’19: Building on the success from the first Tanzania Health Supply Chain Summit (HSCS), the project has begun preparations for the
second summit, to be held in October in Dar es Salaam.
Additional Collaboration Forums: The project continued participation in routine forums for information sharing, including the GHSA
partners coordination meeting, the JPPM in Zanzibar, the GoTHOMIS steering committee, and the Health Commodities and Technologies
Technical Working Group (TWG).
Related
KPIs
3.1.1 Number of information sharing technical forums supported by providing data for decision making: 16
3.1.2 Number of program reports produced and disseminated with other supply chain stakeholders: 10
Delegation from Mali during LMU study tour sessions at MSD Central and MSD Dar zone
LMU Task Force- Mali: In late April, GHSC TA-TZ
received a delegation from Mali (LMU Task Force) who
intend to establish an LMU in Mali. The project shared
our experiences and lessons learned in establishing and
supporting the LMU, and facilitated meetings with MSD,
LMU zonal offices and the head of LMS.
Supply Chain Partners Discussion Forum: The
project is revitalizing the supply chain partners discussion
forum, an informal forum for partners to share

15
1 2 Objective 3: Capacity Building 4
INCREASE DATA USE AND IMPROVE DATA QUALITY
Overview GHSC TA-TZ aims to improve supply chain performance by using supply chain data to inform decisions by key stakeholders at all levels of the
supply chain. The IMPACT team approach is establishing a sustainable structure encouraging commodity managers and other stakeholders (such as
R/CHMTs) to use data to check progress against key KPIs, conduct root cause analyses, and develop action plans for improvement.
Activities
and
Impact
The project continues to collaborate with stakeholders to implement IMPACT teams. IMPACT team members are trained in using data for
improved supply chain decision making. All IMPACT teams develop primary supply chain indicators to monitor; over time, they work to improve
these indicators through the development and implementation of action plans. From April – June 2019, the project, in collaboration with PO-
RALG, EGPAF, InSupply and MDH, coordinated and led IMPACT team orientation trainings in Geita, Kagera, Simiyu, and Tabora regions.
The framework is expected to be used by the PO-RALG central IMPACT team (once trained) in performance monitoring. PO-RALG requested
assistance to conduct an assessment of the implementation of IMPACT teams approach, scheduled for September. The project developed a
methodology for the assessment, which will utilize the developed M&E framework. The assessment will inform PO-RALG and other stakeholders
on areas to improve for greater efficiency and effectiveness of IMPACT teams.
Related
KPIs3.2.1 Number of national/subnational TWG meetings utilizing eLMIS reports for evidence-based decision making: 6
3.2.2 Number of unique eLMIS logins: 4,008
Q3 IMPACT Teams Rollouts
Regions TeamsTeam
Members
Collaborating
Partner
Geita 9 (1RHMT + 6
Councils + 2HMT)
72 MDH
Kagera 10 (1RHMT + 8
Councils + 1HMT)
96 MDH
Simiyu 9 (1RHMT + 6
Councils + 2HMT)
79 inSupply
Health
Tabora 13 (1RHMT + 6
Councils + 2HMT)
111 EGPAF
For the teams that have already been rolled out in Njombe, Singida, Pwani,
and Kigoma, follow-up support was provided for the ongoing IMPACT team
meetings. Implementing partners covered training costs while GHSC TA-TZ
developed training materials and provided technical support staff.
The project is focused on monitoring the performance of the supply chain in
IMPACT team implementing regions, and performance of the teams
themselves. GHSC TA-TZ supported PO-RALG to develop an M&E
framework, which includes KPIs for supply chain performance and
implementation progress. In collaboration with PO-RALG, the project set
performance benchmarks and criteria for ranking performance of the
IMPACT team implementing regions.

16
1 2 Objective 3: Capacity Building 4
INCREASE DATA USE AND IMPROVE DATA QUALITY THROUGH LMS/U
Overview LMS (Mainland Tanzania) and LMU (Zanzibar) are continually working to improve the visibility of logistics data across all levels of the public health
supply chain. Specifically, LMS/U has been advocating to accelerate the availability of quality data and promote a culture of using data for
performance improvement and decision making.
Activities
and
Impact
For the April – June 2019 quarter, the zonal LMS continued review of the Report and Request (R&Rs) forms submitted by the health facilities to
improve data quality before they are converted to orders for MSD processing and delivery. A total of 9,917 R&Rs were reviewed and approved
out of expected 5,582. Through the review process, 15% (1,441) of R&Rs were rejected due to data quality issues. The below table summarized
key statistics on R&Rs for this reporting quarter:
Notes: Due to its revised scope, LMS will not be reviewing, approving and rejecting R&Rs—that task has been shifted back to the councils.
Also, the above data do not include Mwanza, as the zone began implementing the redesigned system in Feb 2019.
Related
KPIs3.2.3 Percent of R&Rs passing data quality checks: 86%
STATISTICS ON R&R FORMS FOR APRIL – JUNE 2019
Months
# of R&Rs
Expected to be submitted
to MSD zones
Total # of
R&Rs Reviewed
and Approved
Total # of
Regular R&Rs
Total # of
Emergency R&Rs
Total # of
R&Rs Rejected
April-19 2,161 3,370 2,131 1,239 578
May-19 1,989 3,945 1,945 2,000 497
June-19 1,432 2,602 1,263 1,338 366
Total 5,582 9,917 5,339 4,557 1,441

17
1 2 Objective 3: Capacity Building 4
INCREASE SKILLS OF KEY COUNTERPARTS
Overview A focus on capacity building is integrated through most GHSC TA-TZ activities, and is intended to enhance the knowledge and skills of key
heath supply chain stakeholders within GoT. Stakeholders include GoT staff from all levels, as well as implementing partner staff and the larger
supply chain community. The project is working with key GoT stakeholders to support the development of an eLearning platform for the
health supply chain, which will serve as a foundation for all online learning efforts within the Tanzania health supply chain ecosystem.
Activities
and
Impact
eLearning Platform Development: In support of the eLearning platform, the project conducted an evaluation of proposals from potential
bidders in response to the RFP that was advertised by the project to secure additional technical expertise for the platform’s development,
content curation, and integration within existing GoT virtual learning efforts. The evaluation team consisted of staff from the project, PO-
RALG, PSU, MoHCDGEC’s Directorate of Human Resources and Training and Directorate of ICT. Seven bids were reviewed in the technical
evaluation process to find one successful proposal. The project has initiated communication with the successful bidder to begin planning for
our collaboration.
Supportive Supervision Harmonization: This quarter, the project participated in the supportive supervision harmonization activity that
was organized by the MoHCDGEC in Morogoro. The activity involved reviewing the supportive supervision tools of MoHCDGEC, PO-RALG
and partners and driving the development of one harmonized tool.
DQA Protocol Finalization: During the quarter, the project continued to work with PSU to finalize the data quality assurance (DQA)
protocols, which provide guidance on conducting DQA for health commodities at all levels of the supply chain. The protocol standardizes the
DQA exercise, including methodology for conducting a DQA, with the overall goal of improving data collection, analysis, management, and
reporting at the respective reporting levels for appropriate decision making.
Related
KPIsN/A

18
1 2 Objective 3: Capacity Building 4
Overview Part of the LMS mandate is to help build capacity at the R/CHMT level through supportive supervision visits. These visits blend on-the-job
training (OJT) with mentoring, knowledge sharing, and discussion to help build the skills and knowledge of R/CHMT members in logistics and
commodity management. The LMS also works with implementing partners and other GoT stakeholders to identify and respond to supply chain
challenges.
Activities
and
Impact
For this reporting quarter, a total of 29 councils were visited by the zonal teams; supportive supervision was conducted in 20 councils, district
mentorship in 6 councils, and eLMIS training in 3 councils. A total of 103 health facilities were visited during the supportive supervision activities,
and OJT was conducted on key logistics areas and eLMIS for 259 and 309 healthcare workers, respectively. Most HCWs trained on eLMIS
received either district mentorship or training sessions conducted at the council level. The district mentorship (through IPs) is used as a strategy
to improve data quality before submitting R&Rs into the system.
Related
KPIs3.1.3 Number of joint supportive supervision field trips/reports made: 29
expiry. Finally, personnel provided inputs on how to best start Phase III considering challenges identified during Phase I and II distribution
process.
INCREASE SKILLS OF KEY COUNTERPARTS THROUGH LMS/U
During supervision activities, R/CHMT personnel learn to use eLMIS
data to make decisions. A total of 35 members from R/CHMTs were
trained on conducting OJT and applying data-driven supervision of
lower level health facilities. In addition, 44 personnel were trained on
using eLMIS to analyze supply chain performance and make
appropriate operational decisions to avoid stock imbalances.
Through LMS staff seconded at MSD central, the project supported
distribution of TLD & DTG to 231 Phase I and II Health facilities. LMS
worked with NACP to help ensure that hospitals supposed to start
using TLD received and began dispensing to eligible clients and that
that ARV stock status was closely monitored during TLD transition.
Throughout, LMS supported data analyses and redistribution of other
regimens to facilities not immediately implementing TLD to avoid
719
33
95
5
39
214
6
227
25
57
0
50
100
150
200
250
April '19 May '19 June '19
Q3 Supportive Supervision and Capacity Building
Total # of councils visited for SS and Capacity Building
Total # of HFs visited
Total # of HCWs provided with OJT on key logistics areas
Total # HCWs provided with OJT - eLMIS

19
1 2 3 Objective 4: Enabling Environment
Overview The MoHCDGEC, in collaboration with PORALG, is implementing a Results-based Financing (RBF) scheme to improve the quality and
utilization of health services in primary care facilities. Tanzania’s RBF model links payment of cash upon verification of predetermined
performance indicators. Currently, the scheme is being implemented in eight regions and the MSD zones supporting these regions in Tanzania
mainland. GHSC TA-TZ has been supporting the implementation of RBF MSD’s central and zonal Strategic Business Units (SBUs), namely
central headquarters, central vertical program, transport, Mwanza, Tabora and Dar SBUs.
Activities
and
Impact
This quarter, the project has finalized data transcription, coding, analysis and report writing for the MSD supply chain component RBF process
evaluation. The report has been shared with MoHCDGEC for review. Key findings included the following:
The MoHCDGEC will resume SBU performance verification exercises in July 2019; the project has previously supported development of the
tools and approach to be used during the exercise.
Related
KPIs4.1.1 Percent of RBF performance incentives received by MSD SBUs: N/A (Due to the ongoing restricting of the RBF scheme, the project was
unable to report on the percentage of performance incentives received by SBUs.)
SUPPORT THE IMPLEMENTATION OF RESULTS BASED FINANCING SCHEME
• Total financial incentive received across SBUs over time as of
Oct-Dec 2017 quarter was TZS 578,504,195 out of total
ceiling budget of TZS 1,181,790,000 (43.2%). On average,
22% of total incentives received were not spent.
• There is a need to establish a link between the MSD supply
chain component and the health facility level, particularly on
order fill rate. In the MSD supply chain component, order fill
rate is calculated for all commodities ordered and not based
on the selected commodities (tracers) at the health facilities
implementing RBF.
• Commodity availability of a group of 10 tracer items across
SBU-served health facilities from 2015 – 2018 is shown at
right. In 2018, commodity availability dropped across SBUs
implementing RBF, with the exception of Tabora.
57%
72%66%64%
72% 74%80%
85% 83% 86%83% 81% 80%73%
0%
20%
40%
60%
80%
100%
Tabora Mwanza Muleba Sales Point Dar es Salaam
Commodity Availability by SBU
2015 2016 2017 2018

20
1 2 3 Objective 4: Enabling Environment
Overview With a range of stakeholders involved in supply chain strengthening activities, GHSC TA-TZ works to align PO-RALG and the MoHCDGEC on
supply chain priorities and clarify roles and responsibilities. The project works to help institutionalize these roles and responsibilities, and to
strengthen the oversight of supply chain implementation, particularly at PO-RALG.
Activities
and
Impact
Related
KPIs4.2.1 Overall health facility satisfaction rating for supply chain services: N/A (Due to the ongoing restricting of the RBF scheme, the project was
unable to report on the percentage of performance incentives received by SBUs.)
STRENGTHEN GOVERNANCE AND ACCOUNTABILITY
October 2018
Supported PO-RALG to survey alignment of
existing supply chain IPs
March 2019
Reviewed findings from PO-RALG survey and decided on developing
guidelines
May 2019
Supported MoHCDGEC and PO-RALG in
development of GoT-Partners alignment
guidelines
July 2019
Planning to review draft guidelines with other IPs
and DPs towards finalization
Partner Alignment Guidelines: GHSC TA-TZ has continued to support MoHCDGEC and PO-RALG in aligning
the activities of supply chain partners. This quarter, project personnel formed a task team to draft guidelines for
GoT and partner alignment. The guidelines account for the number of partners supporting different commodity
groups, ranging from 14 partners supporting HIV to 3 working on emergency outbreaks shown in the chart below.
Over the next quarter, the project will review the draft guidelines with IPs, DPs, and other stakeholders to gather
feedback and support.
Roles and Responsibilities Guidelines:
The Guidelines for Roles and
Responsibilities in the Health Commodity
Supply Chain is awaiting signature from the
MoHCDGEC.
Strengthened PO-RALG Oversight:
The project developed recommendations
for strengthening PO-RALG oversight of
health supply chain implementation, based
on governance-related GoT policies. These
recommendations are expected to support
PO-RALG in strengthening their oversight
of health supply chain in wake of the
LMS/LMU transition to GoT.
14
12
11
11
10
10
9
5
4
3
3
HIV
Laboratory
Malaria
Reproductive health
Essential medicines
Tuberculosis
Maternal and child health
Nutrition
Vaccines/immunizations
Neglected tropical…
Emergency outbreaks
Number of Partners Supporting Different
Commodity Groups

21
QUARTERLY IMPLEMENTATION
CHALLENGES, RISKS, AND MITIGATION
MEASURES
22
IMPLEMENTATION CHALLENGES, RISKS, AND MITIGATION MEASURES
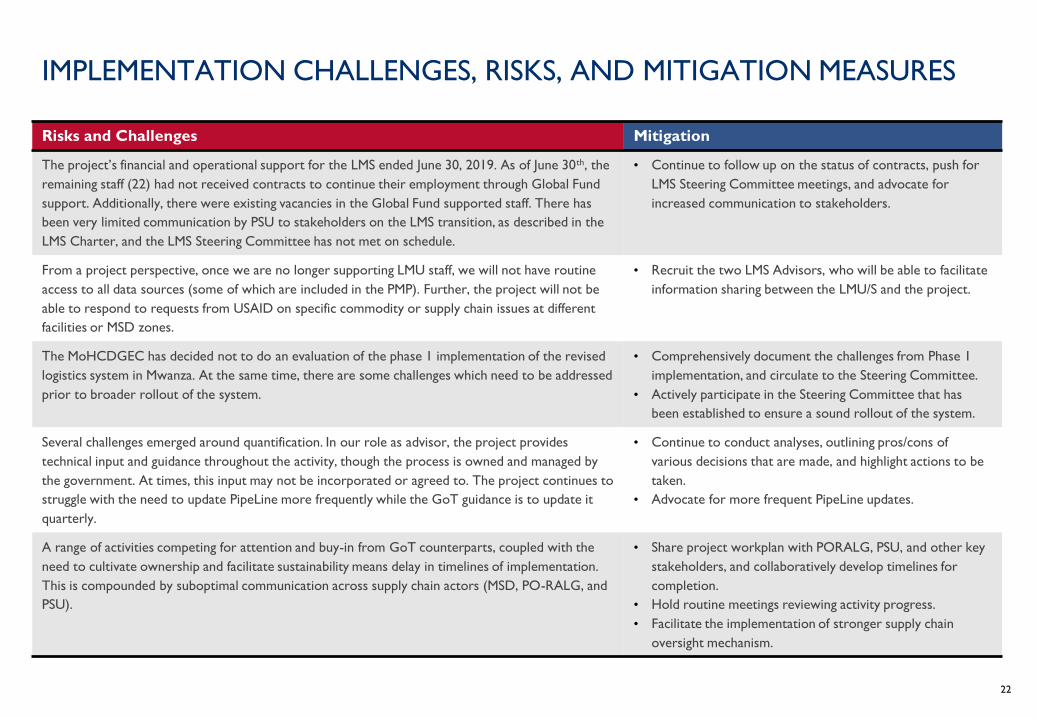
Risks and Challenges Mitigation
The project’s financial and operational support for the LMS ended June 30, 2019. As of June 30th, the
remaining staff (22) had not received contracts to continue their employment through Global Fund
support. Additionally, there were existing vacancies in the Global Fund supported staff. There has
been very limited communication by PSU to stakeholders on the LMS transition, as described in the
LMS Charter, and the LMS Steering Committee has not met on schedule.
• Continue to follow up on the status of contracts, push for
LMS Steering Committee meetings, and advocate for
increased communication to stakeholders.
From a project perspective, once we are no longer supporting LMU staff, we will not have routine
access to all data sources (some of which are included in the PMP). Further, the project will not be
able to respond to requests from USAID on specific commodity or supply chain issues at different
facilities or MSD zones.
• Recruit the two LMS Advisors, who will be able to facilitate
information sharing between the LMU/S and the project.
The MoHCDGEC has decided not to do an evaluation of the phase 1 implementation of the revised
logistics system in Mwanza. At the same time, there are some challenges which need to be addressed
prior to broader rollout of the system.
• Comprehensively document the challenges from Phase 1
implementation, and circulate to the Steering Committee.
• Actively participate in the Steering Committee that has
been established to ensure a sound rollout of the system.
Several challenges emerged around quantification. In our role as advisor, the project provides
technical input and guidance throughout the activity, though the process is owned and managed by
the government. At times, this input may not be incorporated or agreed to. The project continues to
struggle with the need to update PipeLine more frequently while the GoT guidance is to update it
quarterly.
• Continue to conduct analyses, outlining pros/cons of
various decisions that are made, and highlight actions to be
taken.
• Advocate for more frequent PipeLine updates.
A range of activities competing for attention and buy-in from GoT counterparts, coupled with the
need to cultivate ownership and facilitate sustainability means delay in timelines of implementation.
This is compounded by suboptimal communication across supply chain actors (MSD, PO-RALG, and
PSU).
• Share project workplan with PORALG, PSU, and other key
stakeholders, and collaboratively develop timelines for
completion.
• Hold routine meetings reviewing activity progress.
• Facilitate the implementation of stronger supply chain
oversight mechanism.

23
IMPLEMENTATION CHALLENGES, RISKS, AND MITIGATION MEASURES,
CONT.Risks and Challenges Mitigation
Delays in TEC approval have made it difficult for the project to commit specific support to GOT
beyond September 2019, as we must work under the assumption of a limited budget. As Year 4
workplanning approaches in August 2019, the risks of not committing specific support increase. As
the project awaits TEC approval, USAID has recommended prioritizing remaining project funds for
Y4 activities, potentially leaving Y5 drastically underfunded. If the TEC increase is not approved, the
project may be forced to close prior to completing intended activities and achieving desired
outcomes.
The project as engaged in constant communication with USAID
to emphasize the risks associated with delayed TEC approval,
however, a detailed risk analysis may be required.
Some emerging support from KOICA, UNICEF, and GF overlaps with support currently being
provided by the project. Insufficient coordination and alignment of stakeholders with scopes
overlapping with GHSC TA-TZ may make it difficult for the project to (a) influence MoH decisions
regarding the optimal technical approach; and (b) schedule project activities (i.e., redesigned system
rollout, MIS activities, etc.).
The project will continue to coordinate with emerging
implementing partners and advocate for alignment regarding
technical interventions. The project is also advocating for a
supply chain partners alignment guideline to guide all partners
supporting the country’s supply chain activities.

26
Q2 PROJECT MONITORING
PLAN REPORT
27
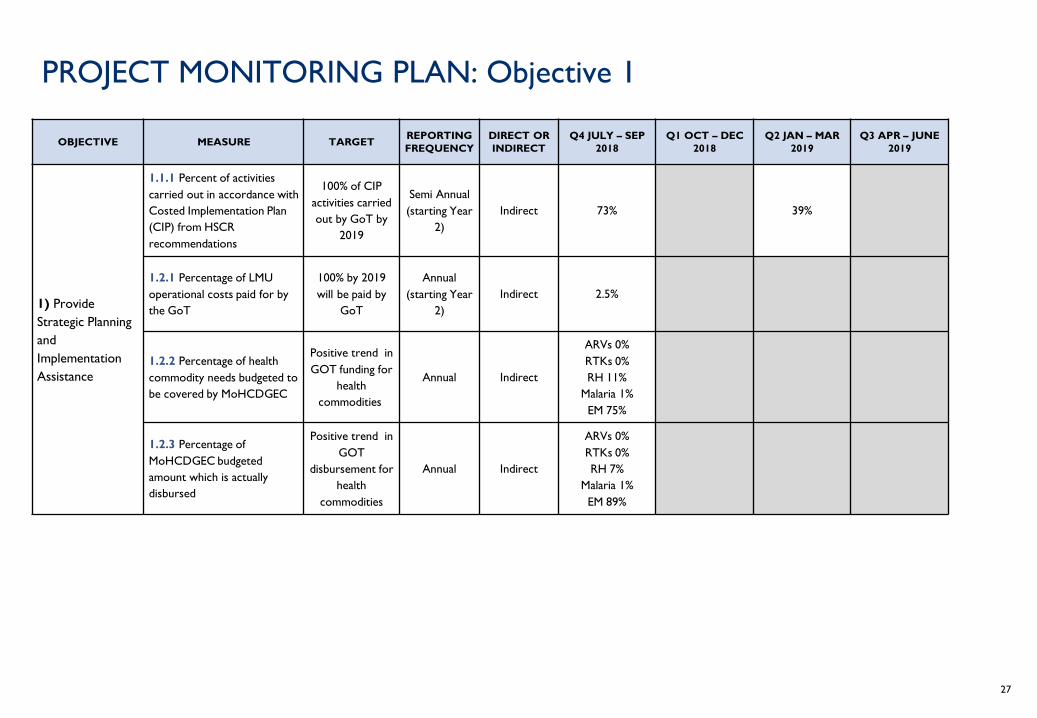
PROJECT MONITORING PLAN: Objective 1
OBJECTIVE MEASURE TARGET REPORTING
FREQUENCY
DIRECT OR
INDIRECT
Q4 JULY – SEP
2018
Q1 OCT – DEC
2018
Q2 JAN – MAR
2019
Q3 APR – JUNE
2019
1) Provide
Strategic Planning
and
Implementation
Assistance
1.1.1 Percent of activities
carried out in accordance with
Costed Implementation Plan
(CIP) from HSCR
recommendations
100% of CIP
activities carried
out by GoT by
2019
Semi Annual
(starting Year
2)
Indirect 73% 39%
1.2.1 Percentage of LMU
operational costs paid for by
the GoT
100% by 2019
will be paid by
GoT
Annual
(starting Year
2)
Indirect 2.5%
1.2.2 Percentage of health
commodity needs budgeted to
be covered by MoHCDGEC
Positive trend in
GOT funding for
health
commodities
Annual Indirect
ARVs 0%
RTKs 0%
RH 11%
Malaria 1%
EM 75%
1.2.3 Percentage of
MoHCDGEC budgeted
amount which is actually
disbursed
Positive trend in
GOT
disbursement for
health
commodities
Annual Indirect
ARVs 0%
RTKs 0%
RH 7%
Malaria 1%
EM 89%

28
OBJECTIVE MEASURE TARGET REPORTING
FREQUENCY
DIRECT OR
INDIRECT
Q4 JULY – SEP
2018
Q1 OCT – DEC
2018
Q2 JAN – MAR
2019
Q3 APR – JUN
2019
2) Improve
Delivery of Health
Commodities in
Service Sites
2.1.1 Percent of eLMIS issues reported
and resolved within 24 SLA defined
performance period
80% Quarterly Direct 78% 89% 87% 86%
2.1.2 Percentage of e-LMIS
hosting/operational cost supported by
GoT
Positive trend
in GoT funding Annual Indirect 0%
2.2.1 Level of country counterpart
ownership in quantification and supply
planning
75% Annual Direct 81.8%
2.2.2 Percent forecast accuracy
(by commodity group)70% Annual Direct
ARVs 83%
RTKs 79%
RH 70%
Malaria 70%
mRDT 87%
2.3.1(a) Stock-out rate for tracer
commodities< 5% Quarterly Indirect
ARVs 6%
RTKs 8%
FP 20%
Malaria 20%
EM 14%
TB 7%
ARVs 7%
RTKs 5%
FP 18 %
Malaria 12%
EM 16 %
TB 9%
ARVs 6%
RTKs 20%
FP 19%
Malaria 10%
EM 20%
TB 6%
ARVs 11%
RTKs 12%
FP 22%
Malaria 12%
EM 19%
TB 7%
2.3.1(b) Stock-out rate for tracer
commodities (Mwanza Zone)< 5% Quarterly Indirect
ARVs 7%
RTKs 7%
FP 11%
Malaria 8%
EM 17%
TB -
ARVs 14%
RTKs 10%
FP 13%
Malaria 15%
EM 22%
TB 11%
2.3.2 Inventory turns (at MSD central) 2 Quarterly Indirect
ARVs 1
FP 1.4
Malaria 0.49
RTK 3
ARVs 2
FP 1.2
Malaria 2.1
RTKs 2
TB 1.3
ARVs 4
FP 0.9
Malaria 2
RTKs 3
TB 1
ARVs 1
FP 1.4
Malaria 2
RTKs 1
TB 2
PROJECT MONITORING PLAN: Objective 2

29
PROJECT MONITORING PLAN: Objective 2
OBJECTIVE MEASURE TARGET REPORTING
FREQUENCY
DIRECT OR
INDIRECT
Q4 JULY – SEP
2018
Q1 OCT – DEC
2018
Q2 JAN – MAR
2019
Q3 APR – JUN
2019
2) Improve
Delivery of Health
Commodities in
Service Sites
2.3.3 Cycle Time (average) 14 days Quarterly Indirect 14 days 9.1 days 8.98 days 15.2 days
2.3.4 Percent of shipments delivered on time
and complete within an agreed upon window
(Central to Zonal level only)
80% Quarterly Indirect
ARVs 73%
RTKS 41%
FP 54%
Malaria 55%
TB 67%
ARVs 75%
RTKS 54%
FP 76%
Malaria 55%
TB 75%
ARVs 87%
RTKS 80%
FP 65%
Malaria 73%
TB 92%
ARVs 53%
RTKS 33%
FP 50%
Malaria 73%
TB 43%
2.3.5 Percent of facilities sending timely and
complete LMIS reports to the central level 80% Quarterly Indirect 96% 99% 98% 96%
2.3.6 Number of Artemisinin based
combination therapy (ACT), SP and mRDTs
treatments purchased in any fiscal year with
USG funds that were distributed in this fiscal
year
N/A Annual Indirect
ALU P/3 = 215,640
SP = 63562
MRDT = 307,607
2.3.7(a) PEPFAR commodities stocked
according to planN/A Quarterly Indirect
ARV 23%,
RTKs 23%,
Cotri susp: 21%
Cotri tablet: 22%
Male condom 17%
ARV 25%,
RTKs 17%
Cotri susp 20%,
Cotri tab 21%,
Male condom 12%
ARV 32%,
RTKs 13%
Cotri susp 19%,
Cotri tab 21%,
Male condom 15%
ARV 18%,
RTKs18 %
Cotri susp 14%,
Cotri tab 20%,
Male condom 13%
2.3.7(b) PEPFAR commodities stocked
according to plan (Mwanza Zone)N/A Quarterly Indirect
ARV 21%,
RTKs 25%
Cotri susp 19%,
Cotri tab 20%,
Male condom 25%
ARV 28%,
RTKs 21%
Cotri susp 24%,
Cotri tab 21%,
Male condom 15%

30
OBJECTIVE MEASURE TARGET REPORTING
FREQUENCY
DIRECT OR
INDIRECT
Q4 JULY – SEP
2018
Q1 OCT – DEC
2018
Q2 JAN – MAR
2019Q3 APR – JUN 2019
3) Broaden
Stakeholders'
Understanding and
Engagement of the
Supply Chain
System
3.1.1 Number of information
sharing technical forums where the
project provided data for decision
making
N/A Quarterly Direct 17 28 44 16
3.1.2 Number of project reports
produced and disseminate with
other supply chain stakeholders
N/A Quarterly Direct 4 4 3 10
3.1.3 Number of joint supportive
supervisions conducted
72 supervision
annual Quarterly Direct 13 95 20 29
3.2.1 Number of
national/subnational TWG
meetings utilizing e-LMIS reports
for evidence-based decision
making
N/A Quarterly Direct 31 12 4 6
3.2.2 Number of people logging-in
into e-LMIS N/A Quarterly Indirect 2678 3245 3,663 4,008
3.2.3 Percentage of R&R passing
data quality check in specific
period.
N/A Quarterly Indirect 82% 84% 84% 86%
4) Strengthening
Enabling
Environments to
Improve Supply
Chain Performance
4.1.1 Percent of RBF performance
incentives received by MSD SBUs
over a specified period
Positive trend on
percentage
received of the
RBF performance
Quarterly Indirect
Central SBU 19.2%
Central VP 51.4%
Transport SBU 0%
Mwanza 49.6%
Dar 21%,
Tabora 59.6%,
Muleba 77.4%
N/A N/A N/A
4.2.1 Overall health facility
satisfaction rating for supply chain
services
N/A Semi-annual Indirect
Very Good 6%
Good 60%,
Neutral 29%,
Poor 4%,
Very Poor 1%
N/A
PROJECT MONITORING PLAN: Objectives 3 & 4

31
ANNEXES

32
ACRONYMS

33
ACRONYM LIST (A-F)
ACT Artemisinin-based Combination Therapy
ART Antiretroviral Therapy
ARV Antiretroviral
CHMT Council Health Management Team
CIP Costed Implementation Plan
CMS Central Medical Store
CP Chief Pharmacist
DHIS2 District Health Information System
DMO District Medical Officer
DPP Directorate Of Prevention And Planning
DQA Data Quality Assessment
DRF Drug Revolving Fund
EID Early Infant Diagnosis
eLMIS Electronic Logistics Management Information System
EM Essential Medicines
ESP Emergency Supply Chain
FEFO First Expiry First Out
FP Family Planning

34
ACRONYM LIST (G-M)
GHSC TA-TZ Global Health Supply Chain Technical Assistance – Tanzania
GOTHOMIS Government of Tanzania Hospital Management Information System
GOZ Government of Zanzibar
HCWs Health Care Workers
HF Health Facility
HIM Health Information Mediator
HIS Health Information System
HIV Human Immunodeficiency Virus
HSCR Holistic Supply Chain Review
HVL HIV Viral Load
ILS Integrated Logistics System
IMPACT Information Mobilized for Performance Analysis and Continuous Transformation
IP Implementing Partner
KPI Key performance indicator
LMU Logistics Management Unit
MOH Ministry of Health (Zanzibar)
MoHCDGEC Ministry of Health, Community Development, Gender, Elderly and Children
MRDT Malaria Rapidly Test Kits
MSD Medical Store Department
35
NACP National AIDS Control Program
NMCP National Malaria Control Program
NPAP National Pharmaceutical Action Plan
NTLP National Tuberculosis And Leprosy Program
OIG Office Of Inspector General
PMTCT Prevention Of Mother To Child Transmission (Of HIV)
PO-RALG President’s Office Of Regional Administration And Local Governments
PS Permanent Secretary
PSM Procurement And Supply Management
PSU Pharmaceutical Services Unit
QA Quality Assessment
R&R Report And Request
R/CHMTs Regional Council Health Management Team
RCHS Reproductive And Child Health Services
RUM Rational Use Of Medicine
SBU Strategic Business Unit
SCMT Supply Chain Monitoring Team
SOP Standard Operating Procedure
ACRONYM LIST (N-S)

36
STTA Short Term Technical Assistance
SWOT Strength, Weakness, Opportunity And Threat
TA Technical Assistance
TFDA Tanzania Food And Drug Authority
TOR Terms Of Reference
TOT Training Of Trainers
UNICEF United Nations Children Emergency Fund
USAID United States Agency For International Development
WHO World Health Organization
ZNZ Zanzibar
ZSCAP Zanzibar Supply Chain
ZSCCAP Zanzibar Supply Chain Costed Action Plan
ACRONYM LIST (T-Z)
37
ROOT CAUSE ANALYSIS FOR
SELECTED PMP INDICATORS
Legend for PMP Indicator Graphs
Previous quarter metric
Q3 metric, did not meet target
Q3 metric, met/exceeded target

38
Performance
Trends and
Description
This quarter saw fewer issues reported to the eLMIS helpdesk compared to previous quarter. Between Apr – Jun 2019, reported
issues/tickets were 96 compared to 135 tickets the previous quarter. Of the 96 tickets, 82 (86%) were resolved with the agreed
SLA target of 24 hours, indicating that we’ve exceeded the target metric of 80% SLA adherence. The decrease in tickets is in part
due to personnel associated with the Mwanza system redesign becoming more familiar and more proficient with eLMIS, compared
to the first three months of the redesign as reported in the previous quarter.
2.1.1 PERCENTAGE OF eLMIS ISSUES REPORTED AND RESOLVED WITH SLA
77%
89%
93%
40%
50%
60%
70%
80%
90%
100%
Apr-19 May-19 Jun-19
% S
LA
Adhere
nce
SLA Adherence Apr - Jun 2019

39
Performance
Trends and
Description
The overall RTK stock out rate and stocked according to plan were 12% and 18%, respectively. Data shown in Q3 do not include
Mwanza zone facilities. The RTK stock out target of <5% was not achieved. However, out of the two types of RTKs monitored, SD
Bioline was able to meet the target.
Root Cause
Analysis • The overall stock out rate dropped to 12%, a decrease from last quarter when the stock out rate was 20%. Similarly, stocked
according to plan improved from 13% to 18%. The stockout rate affected by non-availability of Unigold. Following the January 2019
expiry of Unigold reported by most zones, a 2 MOS consignment of Unigold expiring in February 2020 was distributed. Shortages of
Unigold have been reported at MSD central in April 2019, which have contributed to facility level stockouts.
• Some zones have Unigiold that expires in July 2019 (Dar zone 598 kits and Tanga sales point 2 kits). Mbeya zone has 160 kits of
Unigold expiring in August 2019.
• In April 2019, zonal average fill rates of NACP laboratory commodities was 36% of which Unigold contributed significantly. Similarly,
in May 2019 the average including RTKs was 28%.
Notes on stocked according to plan: Stocked according to plan intends to show the stocks that are reported between established minimum and maximum stock levels (ILS: max = 6, min = 4; redesigned system: max = 4; min =2). These data are obtained from the most recent R&Rs submitted, which are submitted at the end of the review period, when resupply is requested. At this time, facilities may be below the minimum, but are not necessarily at risk of stocking out (a facility could have more than 3 months stock or more at the time of reporting, and still not be “stocked according to plan”.
2.3.1 STOCK OUT RATE: RTKs and 2.3.7 STOCKED ACCORDING TO PLAN: RTKs
8% 5%
20%12%
0%
20%
40%
60%
80%
100%
FY18 Q4 FY19 Q1 FY19 Q2 FY19 Q3
Stock Out Rate: RTKs
23%17% 13%
18%
0%
20%
40%
60%
80%
100%
FY18 Q4 FY19 Q1 FY19 Q2 FY19 Q3
Stocked According to
Plan: RTKs
5%
19%
0%
20%
40%
60%
80%
100%
SD Bioline Unigold
Q3 RTKs Stock Out Rate by
Product
40
Performance
trends and
description
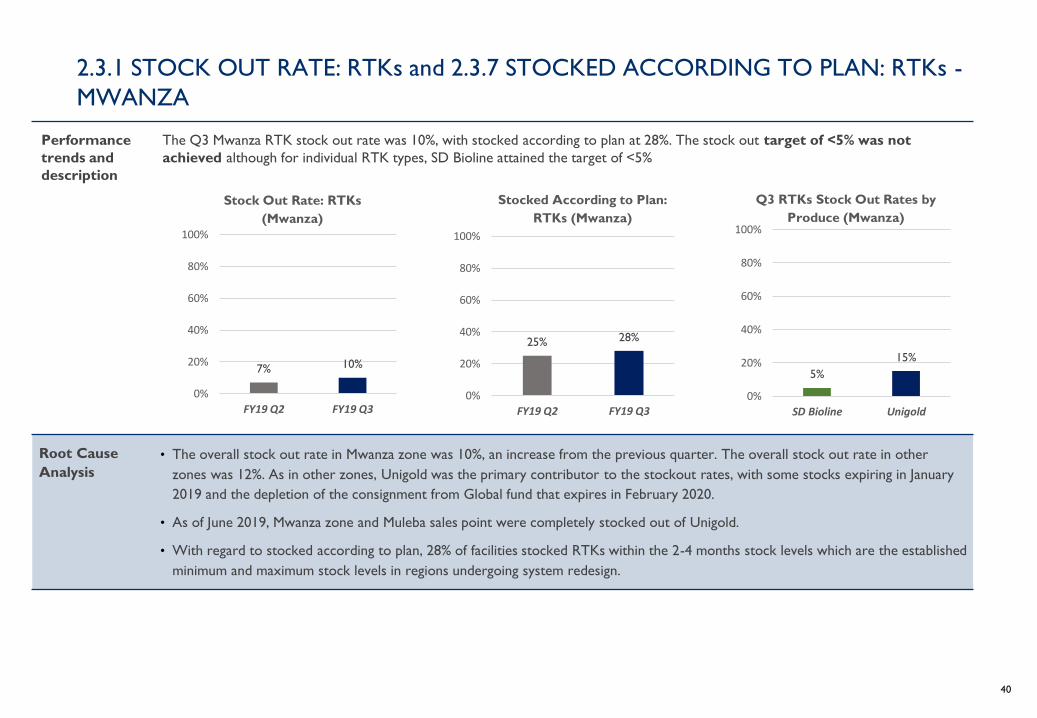
The Q3 Mwanza RTK stock out rate was 10%, with stocked according to plan at 28%. The stock out target of <5% was not
achieved although for individual RTK types, SD Bioline attained the target of <5%
Root Cause
Analysis
• The overall stock out rate in Mwanza zone was 10%, an increase from the previous quarter. The overall stock out rate in other
zones was 12%. As in other zones, Unigold was the primary contributor to the stockout rates, with some stocks expiring in January
2019 and the depletion of the consignment from Global fund that expires in February 2020.
• As of June 2019, Mwanza zone and Muleba sales point were completely stocked out of Unigold.
• With regard to stocked according to plan, 28% of facilities stocked RTKs within the 2-4 months stock levels which are the established
minimum and maximum stock levels in regions undergoing system redesign.
2.3.1 STOCK OUT RATE: RTKs and 2.3.7 STOCKED ACCORDING TO PLAN: RTKs -
MWANZA
7% 10%
0%
20%
40%
60%
80%
100%
FY19 Q2 FY19 Q3
Stock Out Rate: RTKs
(Mwanza)
25% 28%
0%
20%
40%
60%
80%
100%
FY19 Q2 FY19 Q3
Stocked According to Plan:
RTKs (Mwanza)
5%
15%
0%
20%
40%
60%
80%
100%
SD Bioline Unigold
Q3 RTKs Stock Out Rates by
Produce (Mwanza)

41
Performance
trends and
description
Q3 ARV stock out rate and stocked according to plan were 11% and 18% respectively. Of note, the ARV list has been revised to
accommodate DTG based regimens which are recommended for first line treatment of HIV. In addition, two additional pediatric formulations
have been added. These changes have resulted in removal of some ARVs and replacement of new ones leading to 10 tracked ARVs in Q3
compared to nine in Q2. Out of the 10 ARVs for which stock-out data was collected, one exceeded the target.
Root Cause
Analysis
• The overall stockout rate was 11% this quarter, attributed to stock outs at MSD central: especially the Lopinavir-based pediatric formulations,
Lopinavir/ritonavir 200/50mg for adults, and Atazanavir/ritonavir 300/100mg. Low fill rates were reported in April and May 2019. For
Lopinavir/ritonavir adults, reported stock outs have also been attributed to expiry date of May 2019. Facilities stocked according to plan also
dropped from 32% last quarter to 18% this quarter.
• The stock out of Lopinavir/ritonavir 100/25mg has affected the availability of Lopinavir/ritonavir 80/20mg/ml at MSD, which was available prior
to the increase in consumption which resulted in shortages.
• With the newly introduced medicines (TLD and DTG), a plan was created whereby facilities were divided into three phases for transition.
Phase 1 included Regional and Referral Hospitals, and Phase II includes District and other hospitals. Dispensaries and health centers are
included in Phase III. Some challenges have been reported with TLD transition. Currently, the resupply of ARVs is based on past consumption
data; with the shift to TLD, resupply of other ARVs should be adjusted to account for anticipated lower consumption. As facilities begin
transition to TLD, there is a concern that other ARVs (such as TLE) will not be ordered.
• With the TLD transition, the project has supported the distribution of Phase I and Phase II of TLD and DTG, conducted analyses for ARVs in
critical state, and advised the program on how to embark on Phase III distribution following challenges in Phase I and II.
2.3.1 STOCK OUT RATE: ARVs and 2.3.7 STOCKED ACCORDING TO PLAN: ARVs
6% 7% 6%13%
0%
20%
40%
60%
80%
100%
FY18 Q4 FY19 Q1 FY19 Q2 FY19 Q3
Stock Out Rate: ARVs
23% 25%32%
17%
0%
20%
40%
60%
80%
100%
FY18 Q4 FY19 Q1 FY19 Q2 FY19 Q3
Stocked According to Plan: ARVs
28%19% 19% 19% 18%
13% 13% 11% 10% 8% 4%
0%
20%
40%
60%
80%
100%
Q3 ARVs Stock Out Rate by Product

42
Performance
trends and
description
Mwanza Q3 ARV overall stock out rate and stocked according to plan were 14% and 21%, respectively. However, changes were made to the
list of tracers to include the new first line ARV regimens for adults as well as additional pediatric formulations.
Root Cause
Analysis
• The overall stock out rate of ARVs in Mwanza zone was 14% compared to 11% in the other zones. The stock out rate is attributed to stock
outs of Lopinavir/ritonavir 100/25mg at national level. In addition, Lopinavir/ritonavir 80/20mg/ml availability shifted from being consistently
available in previous quarters to experiencing severe shortages as due to increased consumption from patients formerly receiving
Lopinavir/ritonavir 100/25mg.
• As reported in other zones, Mwanza reported stock outs of Atazanavir/ritonavir 300/100mg in April 2019.
• To mitigate stock outs of ARVs in the future, the project has began monthly supply plan monitoring, reviewed our business processes with
PSM to ensure alignment, and strengthened coordination with GF. The project will continue to collaborate with NACP and Implementing
partners to ensure smooth TLD transition and disseminate appropriate information to service delivery points without affecting reporting and
requesting of other regimens /formulations
2.3.1 STOCK OUT RATE: ARVs and 2.3.7 STOCKED ACCORDING TO PLAN: ARVs -
MWANZA
7%12%
0%
20%
40%
60%
80%
100%
FY19 Q2 FY19 Q3
Stock Out Rate: ARVs
21% 22%
0%
20%
40%
60%
80%
100%
FY19 Q2 FY19 Q3
Stocked According to Plan:
ARVs
30%26%
20% 20%12% 9% 9% 7% 6%
0% 0%0%
20%
40%
60%
80%
100%Q3 ARV Stock Out Rate by Product

43
Performance
trends and
description
Q3 Malaria commodities had overall stock out and stocked according to plan rates of 12% and 17%. Data shown in quarter two do not include
Mwanza zone facilities. The target of <5% has not yet been achieved.
Root Cause
Analysis
• The overall stock out rate for malaria was 12%, an increase from 10% the previous quarter. Similarly, stocked according to plan dropped from
23% in the previous quarter to 17% for this quarter.
• The average zonal fill rates for malaria commodities in this quarter were 73% for malaria products.
• The stock out rate has been attributed to stock outs of Quinine tablets and ALU presentations. Quinine tablets are a normal MSD saleable
commodities whose availability is subject to availability of funds. For ALU, zones reported that some facilities do not manage all four
presentations. In April 2019, it was reported that Chief pharmacist had submitted a draft minute sheet to PS that proposed to standardize
UOM across ALU packs
2.3.1 STOCK OUT RATE: MALARIA and 2.3.7 STOCKED ACCORDING TO PLAN:
MALARIA
13% 12% 10% 12%
0%
20%
40%
60%
80%
100%
FY18 Q4 FY19 Q1 FY19 Q2 FY19 Q3
Stock Out Rate: Malaria
20% 20% 23%17%
0%
20%
40%
60%
80%
100%
FY18 Q4 FY19 Q1 FY19 Q2 FY19 Q3
Stocked According to Plan:
Malaria
36%
18% 15% 15% 14% 13%8% 7% 6%
0%
20%
40%
60%
80%
100%
Q3 Malaria Stock Out Rate by Product

44
Performance
trends and
description
Mwanza Q3 Malaria stock out and stocked according to plan were 15% and 19% respectively. Two of the reported products, Sulphadoxine
and Pyrimethamine (SP) and mRDT met the stock out rate target of < 5%
Root Cause
Analysis
• During quarter three, the overall stock out rate of malaria commodities in Mwanza zone was 15% compared to the 12% reported for
other zones. As in other zones, the products most frequently stocked out were quinine tablets and ALU presentations
• Muleba sales point reported through ZPR of May 2019 shortages of malaria commodities at both central and sales point especially ALU 4
(0.2MOS)
• For Mwanza zone, 19% of malaria commodities were stocked adequately compared to 17% in other zones.
2.3.1 STOCK OUT RATE: MALARIA and 2.3.7 STOCKED ACCORDING TO PLAN:
MALARIA - MWANZA
8%15%
0%
20%
40%
60%
80%
100%
FY19 Q2 FY19 Q3
Stock Out Rate: Malaria
(Mwanza)
21% 19%
0%
20%
40%
60%
80%
100%
FY19 Q2 FY19 Q3
Stocked According to Plan:
Malaria (Mwanza)
37%
27% 26%21% 19% 16%
6% 4% 3%
0%
20%
40%
60%
80%
100%
Q3 Malaria Stock Out Rate by Product (Mwanza)

45
Performance
trends and
description
Q3 TB commodity stock out and stocked according to plan rates were 7% and 14% respectively. A new product was added to the list of TB
medicines to be monitored - Isoniazid 100mg for pediatrics. Two of the four products, RHZE and RH, achieved the target of <5%.
Root Cause
Analysis
• The overall stock out rate for TB products was 7% compared to 6% the previous quarter. TB stocked according to plan was at 14%, down
from 19% in the previous quarter. Both Isoniazid100mg and Isoniazid 300mg contributed to the higher stock out rate.
• As of April 2019, all MSD zones experienced stock outs of Isoniazid 100mg at (0.6 MOS). Shipment is expected in September 2019
• Average zonal fill rates for April and May were 39% and 36% as a result of shortages of Isoniazid, RHZE, RHZ and RH.
• In both April and May 2019, Tanga sales point had the highest fill rate of 61%.
• Isoniazid 100mg and 300mg are the main contributors to the high stock out rate due to scale up of IPT which has increased the demand
significantly. Clinical service delivery partners especially those focusing on HIV care and treatment services have targets for IPT hence the
shortages. In rectifying these challenges in availability of TB medicines, GHSC-TA-TZ has supported NTLP in the quantification of INH and
provided technical advice. In addition, the project through LMU collaborated with MSD to carry out interzonal transfers and interfacility
redistributions.
2.3.1 STOCK OUT RATE: TB and 2.3.7 STOCKED ACCORDING TO PLAN: TB
7% 9% 6% 7%
0%
20%
40%
60%
80%
100%
FY18 Q4 FY19 Q1 FY19 Q2 FY19 Q3
Stock Out Rate: TB
22% 22% 19%14%
0%
20%
40%
60%
80%
100%
FY18 Q4 FY19 Q1 FY19 Q2 FY19 Q3
Stocked According to Plan: TB
17%8%
3% 2%
0%
20%
40%
60%
80%
100%
Isoniazid BPTablet 100
mg
Isoniazid300mg tabs
RHZE RH
Q3 TB Stock Out Rate by Product

46
Performance
trends and
description
Mwanza Q2 TB Commodity overall stock out rate and stocked according to plan were 11% and 25% respectively. Note that, in the previous
quarter, data on stock out rate for TB medicines could not be obtained. Also, Isoniazid 100mg has been added to the list of TB medicines
to be monitored. Out of the four products, only Isoniazid 100mg did not achieve the target of <5%.
Root Cause
Analysis
• The overall stockout rate for TB products was 11% for this quarter which is higher than the 7% stock out rate in other zones. As in other
zones with Isoniazid 100mg, which is the main contributor to the high stock out rates in Mwanza zone. The scale up of IPT increased the
demand significantly. TB stocked according to plan was at 25%.
• Average zonal fill rates have been as low as 26% in April 2019 where Muleba sales point had the lowest fill rate of 19%.
• In May 2019, Mwanza zone and Muleba sales point had fill rates of 50% and 34% respectively. The average zonal fill rate was 36%.
2.3.1 STOCK OUT RATE: TB and 2.3.7 STOCKED ACCORDING TO PLAN: TB-
MWANZA
11%
0%
20%
40%
60%
80%
100%
FY19 Q3
Stock Out Rate: TB
(Mwanza)
25%
0%
20%
40%
60%
80%
100%
FY19 Q3
Stocked According to Plan:
TB (Mwanza)
27%
5% 2%0%
0%
20%
40%
60%
80%
100%
IsoniazideBP Tablet100 mg
Isoniazid300mg tabs
RHZE RH
TB Stock Out Rate by Product
(Mwanza)

47
Performance
trends and
description
Q3 essential medicines stock out rate was 19%. Data shown is for all zones excluding Mwanza. Like in the previous quarters, the target of
<5% has not yet been achieved.
Root Cause
Analysis
• The overall stock out rate of essential medicines was 19% for this quarter, a slight decline from the 20% of the previous quarter. The
main contributors include Cotrimoxazole suspension, Paracetamol and Albendazole. These are normal, saleable items at MSD that
facilities must pay for. With limited budgets, these products are not always prioritized by facilities to purchase. In addition, Amoxicillin
DT was also reported by several zones to have been stocked out. These include Moshi zone in April 2019 ZPR, Mtwara, Mbeya and
Iringa zones in May 2019 ZPR. As of May 31st 2019, there were 3MOS of stock of Amoxicillin DT.
• The project has supported FFARS integration with eLMIS. From July 2019, it is expected that FFARs will start collecting "Other Sources
of Fund" data from facilities which will facilitate purchases of commodities from MSD by health facilities using the other sources of funds.
2.3.1 STOCK OUT RATE: ESSENTIAL MEDICINES
14% 16%20% 19%
0%
20%
40%
60%
80%
100%
FY18 Q4 FY19 Q1 FY19 Q2 FY19 Q3
Stock Out Rate: Essential Medicines
33%27% 26% 26%
19%15% 15% 14% 12% 12%
0%
20%
40%
60%
80%
100%
Q3 Essential Medicines Stock Out Rate by Product

48
Performance
trends and
description
Mwanza Q3 essential medicines stock out rate was 22%. No single commodity has achieved the target of <5%.
Root Cause
Analysis
• During quarter three, the overall stock out rate of essential medicines in Mwanza zone was 22%, higher than the 19% in other zones.
• In Mwanza zone, the high stock out rate was mainly attributed to Amoxicillin DT. Muleba sales point in the April 2019 ZPR reported stock
outs of the commodity whereas Mwanza zone in the May ZPR also reported stock outs of Amoxicillin DT resulting in a spill over effect at
the service delivery points which were also stocked out.
• As of 31st May 2019, there were 3MOS of Amoxicillin DT at National level.
• Stock outs of FEFOL have also been reported by several zones. This is because FEFOL is a normal saleable commodity whose availability at
health facility level is subject to funding .
2.3.1 STOCK OUT RATE: ESSENTIAL MEDICINES - MWANZA
17%22%
0%
20%
40%
60%
80%
100%
FY19 Q2 FY19 Q3
Stock Out Rate: Essential Medicines
(Mwanza)
37%31% 30%
21% 20% 20% 18% 18%11% 8%
0%
20%
40%
60%
80%
100%
Q3 Essential Medicines Stock Out Rate by Product
(Mwanza)

49
Performance
trends and
description
Q3 RMNCH commodity overall stock out rate was 22% (not including Mwanza zone). The target of <5% has not yet been achieved.
Root Cause
Analysis
• The overall stock out rate of RNMCH commodities has increased from 19% in quarter two to 22% this quarter. Although data show high
stock out rate of emergency contraceptives, there are overstocks of emergency contraceptives at national level (13 MOS as of April 2019).
The main reason for the apparent high stock out rate of EC is that most of the facilities neither report on the item nor use it. The same
applies to Female condoms contributing to its higher stock out rate.
• Although male condom stock out rates decreased in Q3, stock outs have continue due to delays in distributing the 9 million condoms
received in March to 7000+ facilities (i.e., the March and April distribution). Stock outs of male condoms in part resulted from multiple part
numbers--one part number was out of stock so facilities ordering solely using that part number were more likely to experience stock outs.
• In addition, Tanga zone reported stock outs of Oxytocin, Depo-Provera and Magnesium sulphate and male condoms during the April 2019
ZPR in part due to the multiple part number issue. Other zones such as Dar, Iringa and Moshi, reported stock outs of male condoms at zonal
level in May 2019. Dar and Moshi zones and Tanga SP reported stock outs of Microgynon in April and May.
• As of May 2019, there were 7 MOS of male condoms, 1 MOS of oxytocin 10IU/ml and I MOS of Magnesium sulphate injection.
• GHSC-TA-TZ will collaborate with RCHS to raise awareness of and improve reporting on ECs and Female condoms in addition to working
with MSD sales officers to communicate part numbers to health facilities at zonal and regional levels via platforms such as WhatsApp groups
2.3.1 STOCK OUT RATE: RMNCH
20% 18% 19% 22%
0%
20%
40%
60%
80%
100%
FY18 Q4 FY19 Q1 FY19 Q2 FY19 Q3
Stock Out Rate: RMNCH
45%39% 37% 36% 31% 28% 26% 24% 21% 18% 15% 14% 14% 13%
0%
20%
40%
60%
80%
100%
Q3 RMNCH Stock Out Rate by Product

50
2.3.1 STOCK OUT RATE: RMNCH - MWANZA
Performance
trends and
description
Mwanza Q3 RMNCH commodity overall stock out rate was 13%. Out of the monitored RMNCH commodities, Cooper T IUD and
Misoprostol 20mcg achieved the <5% target.
Root Cause
Analysis
● During quarter three, the overall stock out rate of RMNCH commodities in Mwanza zone was 13%, lower than the 22%
stockout rate of other zones but higher than Mwanza’s Q2 rate of 11%. As in other zones, the high stock out rate was mainly
attributed to commodities such as Microgynon which were reported stocked out in the April 2019 ZPR.
● Additionally, Mwanza reported male condoms as stocked out in both April and May 2019.
● Mwanza zone experienced “false” stock outs of Emergency contraceptives and Female condoms due to personnel not reporting
on either commodity. RCHS will work to raise awareness about both commodities and promote better compliance with
inventory reporting procedures.
● GHSC-TA-TZ will continue to collaborate and work with the RCHS program to support the redesign.
11% 13%
0%
20%
40%
60%
80%
100%
FY19 Q2 FY19 Q3
Stock Out Rate: RMNCAH (Mwanza)
26% 25%21%
15% 15% 14% 13% 11% 10% 9% 9%6% 4%
0%0%
20%
40%
60%
80%
100%Q3 RMNCAH Stock Out Rate by Product (Mwanza)

51
Performance
Trends and
Description
96% of facilities submitted R&R submissions in a timely fashion compared to 98% last quarter. The chart on the right focuses on Mwanza
zone system redesign implementation which features only two reporting groups (A & B). R&R submissions for facilities reporting bi-
monthly was 99%.
Root Cause
Analysis
● Many councils submitted R&R on time. For the ILS program, Kibiti improved from making timely R&R submissions 50% of the time
last quarter to 67% this quarter. The improvement is due to close follow up of R/CHMT together with LMS to support the new
District pharmacist and help encourage health facilities to report on time.
● Other councils with timely reporting below 80% for ILS include Kilombero (61%) and Simanjiro (76%). The lowest performing
councils for this period include: Mpimwa council in Katavi (33% for ARVs) and for LAB, both Mbinga (33%) and Nyasa councils
(50%).
● Following the transition of LMS, the least performing councils should be monitored closely by the R/CHMTs together with LMS.
2.3.5 PERCENTAGE OF HEALTH FACILITIES SUBMITTING TIMELY R&R
99 99 99 9996100 100 100100
95100 98
0
20
40
60
80
100
B A B Average
% T
imel
ines
s
Reporting Groups
Timely Submission of R&R (Bi-Monthly)
RedILS RedLAB RedTB
93% 94% 97% 95%96% 99% 98% 98%93% 91%
95% 93%98% 100% 100% 99%
0%
20%
40%
60%
80%
100%
A B C Average
% T
imel
ines
s
Reporting Groups
Timely Submission of R&R (Quarterly)
ILS ARV LAB TB
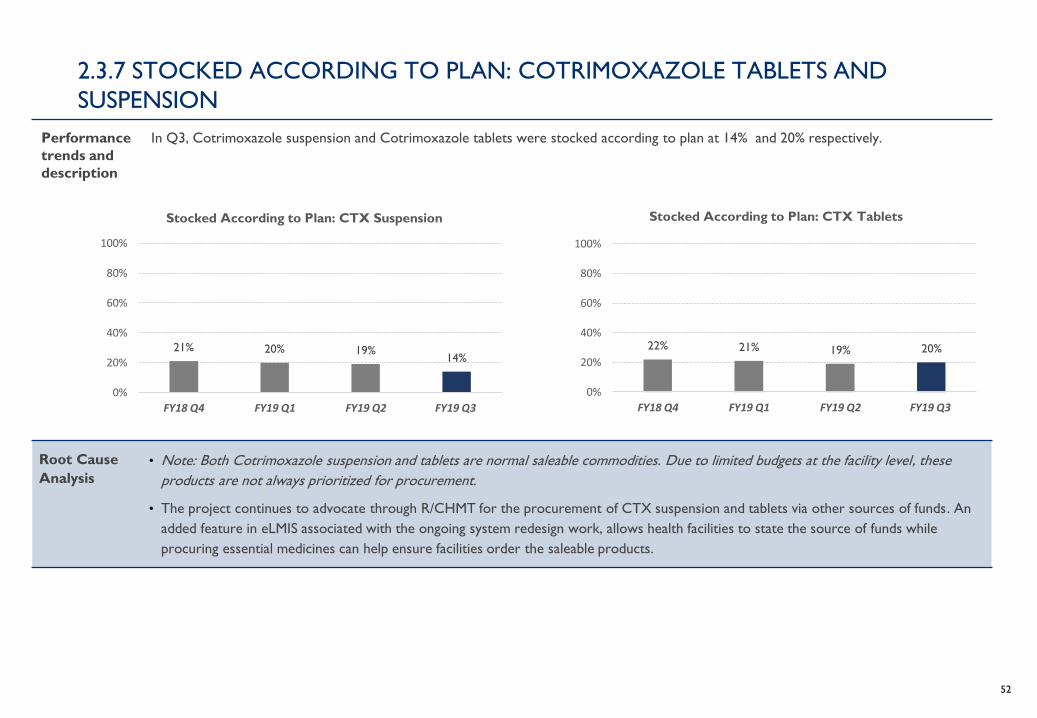
52
Performance
trends and
description
In Q3, Cotrimoxazole suspension and Cotrimoxazole tablets were stocked according to plan at 14% and 20% respectively.
Root Cause
Analysis
• Note: Both Cotrimoxazole suspension and tablets are normal saleable commodities. Due to limited budgets at the facility level, these
products are not always prioritized for procurement.
• The project continues to advocate through R/CHMT for the procurement of CTX suspension and tablets via other sources of funds. An
added feature in eLMIS associated with the ongoing system redesign work, allows health facilities to state the source of funds while
procuring essential medicines can help ensure facilities order the saleable products.
2.3.7 STOCKED ACCORDING TO PLAN: COTRIMOXAZOLE TABLETS AND
SUSPENSION
21% 20% 19%14%
0%
20%
40%
60%
80%
100%
FY18 Q4 FY19 Q1 FY19 Q2 FY19 Q3
Stocked According to Plan: CTX Suspension
22% 21% 19% 20%
0%
20%
40%
60%
80%
100%
FY18 Q4 FY19 Q1 FY19 Q2 FY19 Q3
Stocked According to Plan: CTX Tablets

53
Performance
trends and
description
In Q3, Mwanza Cotrimoxazole suspension and Cotrimoxazole tablets were stocked according to plan at 24% and 21%
respectively.
Root Cause
Analysis
• Note: Both Cotrimoxazole suspension and tablets are normal saleable commodities. Due to limited budgets at the facility level,
these products are not always prioritized for procurement
• In Mwanza zone, CTX suspension was more frequently stocked according to plan compared to CTX tablets.
• The availability of these commodities is subject to funding and prioritization at facility level.
2.3.7 STOCKED ACCORDING TO PLAN: COTRIMOXAZOLE TABLETS AND
SUSPENSION - MWANZA
22% 24%
0%
20%
40%
60%
80%
100%
FY19 Q2 FY19 Q3
Stocked According to Plan: CTX Suspension
(Mwanza)
20% 21%
0%
20%
40%
60%
80%
100%
FY19 Q2 FY19 Q3
Stocked According to Plan: CTX Tablets
(Mwanza)

54
Performance
trends and
description
In Q3, male condoms were stocked according to plan at a rate of 13% (not including Mwanza).
Root Cause
Analysis
• Male condom stocked according to plan declined from 15% in Q2 to 13% in Q3 despite improved system-wide availability. Multiple part
numbers, data quality issues, and distribution delays contributed to the drop in adequate stocking.
• The project continued to collaborate with MSD in inter-zonal transfers and inter-facility redistributions as a temporary remedial action
but pushed for distribution of received consignment in March to facilities that had been critically stocked out.
2.3.7 STOCKED ACCORDING TO PLAN: MALE CONDOMS
17%12% 15% 13%
0%
20%
40%
60%
80%
100%
FY18 Q4 FY19 Q1 FY19 Q2 FY19 Q3
Stocked According to Plan: Male Condoms

55
Performance
trends and
description
In Q3, male condoms stocked according to plan was 15%, compared to 20% the previous quarter.
Root Cause
Analysis
• In quarter three, stocked according to plan for male condoms was 15% compared to 20% the previous quarter. As in other zones, this
was due to multiple part numbers, data quality issues, and distribution delays.
2.3.7 STOCKED ACCORDING TO PLAN: MALE CONDOMS - MWANZA
20%15%
0%
20%
40%
60%
80%
100%
FY19 Q2 FY19 Q3
Stocked According to Plan: Male Condoms
(Mwanza)

56
TRAINING AND TRAVEL REPORT
(JANUARY – MARCH 2019)

57
Dates Purpose Responsible GHSC staff
April 1, 2019 Health Commodities Health Technologies Technical Working Group meeting Naomi Printz
April 1 – 2, 2019 EGPAF’s Biannual Supply Chain Meeting in Singida with the theme “Improving Logistics Data Use
for Decision Making”
Peace Nyankojo
Ondo Baraka
April 1 – 2, 2019 Shinyanga Regional Quarterly Experience Sharing Supply Chain Meeting organized by AGPAHI LMS Mwanza
April 8, 2019 Consensus meeting and roadmap development for development of SC KPI Dashboard. Hussein Hassan
Michael Kishiwa
April 8 – 12, 2019 Harmonization of Supportive Supervision Tools workshop; the aim of the workshop was to
harmonize and standardize supply chain supportive supervision tools across diseases programs
and IPs
Peace Nyankojo
Nabila Hemed
Juma Ikombola
April 8 – 12, 2019Capacity building training for eLMIS code base skills transfer to government software developers
in MoHCDGEC and PORALG.
Ian Manyama
Hussein Hassan
Alfred Mchau
April 15 – 17, 2019
April 16, 2019
Roll out of IMPACT team in Tabora region
NACP’s Advisors and recruitment and selection - Dodoma
Eddom Silabi
Ondo Baraka
Mavere Tukai
April 24 – 26, 2019
April 26, 2019
LMS staff All Hands Meeting
National Laboratory Advisory meeting - Dodoma
LMS staffs
Edna Edward
Peter Sangu
John Obonyo
Mavere Tukai
April 29 – May 9, 2019 Bagamoyo - ARVs quantification exercise
Nabila Hemed
Chediel Mbonea
Narsis Makori
Mavere Tukai
Q3 TRAINING AND TRAVEL REPORT

58
Dates Purpose Responsible GHSC staff
April 29 – May 7, 2019
May 6 – 8, 2019
Zanzibar – ARV quantification and PipeLine training
HCRF Guideline Development – Morogoro
Anneth Massawe
Naomi Printz
Mavere Tukai
May 7 – 9, 2019 Roll out of IMPACT team in Simiyu region Eddom Silabi
Ondo Baraka
May 7 – 10, 2019 Conduct a rapid assessment on MDR TB medicines management practices Vicent Manyilizu
Sharon Shayo
May 9, 2019 Debriefing meeting following ARVs quantification results Peace Nyankojo
Chediel Mbonea
May 13 – 31 , 2019 LMS Basic Logistics and Supply Chain Management training LMS Staff
Ian Manyama
Michael John
May 4 – 5, 2019 eLMIS Training to Moshi Mc HCWs Loius Nicas
Saad Hussein
May 6 – 7, 2019
Nairobi, Kenya
OpenLMIS community conducted a two-day workshop to orient the community developers on
the new reporting tool capabilities which comes with latest releases of OpenLMIS.
Ian Manyama
Hussein Hassan
May 10, 2019
Stakeholders alignment meeting called for by MoHCDGEC & PORALG jointly. The meeting
announced the Government decision to have invest and focus on One Platform solution at health
facility, hence directed DP & IP to support to achieve the goal
Mavere Tukai
Alfred Mchau
May 11 – 22, 2019
May 17, 2019
June 24, 2019
Provide technical assistance on HIV laboratory quantification exercise
Improved GoTHOMIS kick off meeting – Dodoma
GoTHOMIS Steering Committee Meeting – Dodoma
Joseph Lubenga (STTA)
Mavere Tukai
Mavere Tukai
Q3 TRAINING AND TRAVEL REPORT, CONT.

59
Dates Purpose Responsible GHSC staff
May 14 – 22, 2019HIV laboratory quantification exercise which covered HIV commodities for RTK, HVL, HEID,
Microbiology, Consumables. Albertho Chengula
May 23 – 31, 2019
Morogoro
GoTHOMIS requirement review and merging with other initiatives requirement for Improvement.
A PORALG and MoHCDGEC led activity
Alfred Mchau,
Ian Manyama
Hussein Hassan
May 25-27, 2019 Dodoma – Adhoc HIV clinical sub-committee Nabila Hemed
Mavere Tukai
May 28 – 29, 2019 Participated in the HIV commodities subcommittees meeting in Dodoma Vicent Manyilizu
May 28 – 31, 2019
Morogoro
Finalizing and testing integration of eLMIS, FFARS and MSD Epicor through Muungano gateway
and HIMHussein Hassan
May 28, 2019
To present GHSC TA-TZ project accomplishments during a Joint USAID Joint Planning and
Programming Meeting (JPPM) hosted by Zanzibar Malaria Elimination Program (ZAMEP) in
Zanzibar
Hubert Assenga
Abdul Mzale
May – June 2019 Zonal Supportive Supervision through GF funding Zonal SCMAs
June 8 – 10 , 2019 eLMIS Training to Mwanga Dc HCWs Gipson Mathias
Cosmas Kulaya
June 17 – 21 2019 Roll out of IMPACT team in Geita and Kagera regions Michael Deleli
Yusuf Mdogwa
Eddom Silabi
Ondo Baraka
Q3 TRAINING AND TRAVEL REPORT, CONT.

60
Dates Purpose Responsible GHSC staff
June 10 – 14, 2019Capacity building training for eLMIS code base skills transfer to government software developers
in MoHCDGEC and PORALG
Ian Manyama
Hussein Hassan
Alfred Mchau
June 13, 2019
Attended the annual laboratory stakeholders meeting coordinated by MoHCDGEC supported by
THPS. Through the meeting the laboratory Diagnostic network optimization and respective
recommendations were shared.
Albertho Chengula
Chediel Mbonea
Godfrey Odinga
June 13 – 21, 2019 Support Emergency supply chain preparedness activities Emily Magurno (STTA)
June 14 - 20, 2019To support to MoHCDGEC to strengthen capacity in emergency supply chains preparedness in
responding to public health hazards in line with Global Health Security Agenda (GHSA) in Mwanza
Michael Kishiwa
Hubert Assenga
June 15 – 19, 2019
Dodoma
GoTHOMIS requirement review and merging with other initiatives requirement for Improvement.
A PORALG and MoHCDGEC led activity
Hussein Hassan
Ian Manyama
Alfred Mchau
June 17 – July 3, 2019 Support LMU closeout Bethany Saad (STTA)
June 24 – 28, 2019 Participated in the quantification exercise for IPT medicines (Isoniazid 100mg and Isoniazid 300mg)
in Tanga
Vicent Manyilizu
June 25 – 28, 2019 MOCDGEC Health financing meeting and Single National Health Insurance(SNHI) Fund where I
shared the status of HCRF and how it link with other cost sharing guidelines for Monitoring and
Evaluation. Also, discussed the possibility of link the health commodities Fund and SNHI
Regina Ndakidemi
June 27, 2019 Zanzibar Logistics Technical Working Group meeting Ondo Baraka
Naomi Printz
Q3 TRAINING AND TRAVEL REPORT, CONT.