Mesophyll conductance to CO 2 : current knowledge and future prospects
20
Mesophyll conductance to CO 2 : current knowledge and future prospects JAUME FLEXAS 1 , MIQUEL RIBAS-CARBÓ 1 , ANTONIO DIAZ-ESPEJO 2 , JERONI GALMÉS 1 & HIPÓLITO MEDRANO 1 1 Grup de Recerca en Biologia de les Plantes en Condicions Mediterrànies, Departament de Biologia, Universitat de les Illes Balears, Carretera de Valldemossa Km 7.5, 07122 Palma de Mallorca, Balears, Spain and 2 Instituto de Recursos Naturales y Agrobiología, CSIC, Apartado 1052, 41080 Sevilla, Spain ABSTRACT During photosynthesis, CO2 moves from the atmosphere (Ca) surrounding the leaf to the sub-stomatal internal cavi- ties (Ci) through stomata, and from there to the site of carboxylation inside the chloroplast stroma (Cc) through the leaf mesophyll. The latter CO2 diffusion component is called mesophyll conductance (gm), and can be divided in at least three components, that is, conductance through intercellular air spaces (gias), through cell wall (gw) and through the liquid phase inside cells (gliq). A large body of evidence has accumulated in the past two decades indicat- ing that gm is sufficiently small as to significantly decrease Cc relative to Ci, therefore limiting photosynthesis. More- over, gm is not constant, and it changes among species and in response to environmental factors. In addition, there is now evidence that gliq and, in some cases, gw, are the main determinants of gm. Mesophyll conductance is very dynamic, changing in response to environmental variables as rapid or even faster than stomatal conductance (i.e. within seconds to minutes). A revision of current knowl- edge on gm is presented. Firstly, a historical perspective is given, highlighting the founding works and methods, fol- lowed by a re-examination of the range of variation of gm among plant species and functional groups, and a revision of the responses of gm to different external (biotic and abiotic) and internal (developmental, structural and meta- bolic) factors. The possible physiological bases for gm, including aquaporins and carbonic anhydrases, are dis- cussed. Possible ecological implications for variable gm are indicated, and the errors induced by neglecting gm when interpreting photosynthesis and carbon isotope discrimi- nation models are highlighted. Finally, a series of research priorities for the near future are proposed. Key-words: AN-Ci curves; aquaporins; carbonic anhydrase; CO2 diffusion conductance; isotope discrimination; leaf internal diffusion conductance; photosynthesis. INTRODUCTION: THE CONCEPT OF MESOPHYLL CONDUCTANCE TO CO2 AND THE EVOLUTION OF ITS PERCEPTION IN PLANT SCIENCE During photosynthesis, CO2 has to move from the atmo- sphere surrounding the leaf across a boundary layer in the air above the foliage surface to the sub-stomatal internal cavities through the stomata (Fig. 1a), and from there to the site of carboxylation inside the stroma through the leaf mesophyll (Fig. 1b). From Fick’s first law of diffusion, the net photosynthetic flux at steady state (AN) can be expressed as: AN = gs (Ca - Ci) = gm (Ci - Cc), where gs and gm are the stomatal and mesophyll conductance to CO2 diffusion, and Ca, Ci and Cc are the CO2 concentrations in the atmosphere, in the sub-stomatal internal cavity and in the chloroplast stroma, respectively (Long & Bernacchi 2003). While this two-dimensional view of CO2 diffusion is mostly valid when referring to the stomata, it is rather sim- plistic when referring to the mesophyll, and it may be inad- equate to describe a system where there are CO2 sinks and sources distributed along the pathway (Parkhurst 1994). However, although there have been attempts to develop three-dimensional models for CO2 mesophyll diffusion (Parkhurst 1994; Aalto & Juurola 2002; Juurola et al. 2005), at present, they are far from being of general use. Never- theless, as pointed out by Parkhurst (1994), ‘representing internal diffusion limitations with single numbers seems preferable to neglecting them completely’. Therefore, the present review intends to update the current knowledge on mesophyll conductance from a two-dimensional perspec- tive, considering only vertical CO2 diffusion through leaf mesophyll. Lateral CO2 diffusion inside the mesophyll can also be important for photosynthesis in some cases (Morison et al. 2005; Pieruschka, Schurr & Jahnke 2005), although this aspect has already been reviewed recently (Morison & Lawson 2007). In Gaastra’s (1959) pioneer work on leaf photosynthesis, mesophyll conductance (and its inverse, mesophyll resis- tance) was defined essentially as a diffusion component of the photosynthesis pathway, and it was considered to be an important factor in determining leaf photosynthesis (actu- ally more important than stomatal conductance). Later, Correspondence: J. Flexas. Fax: +34 971 173184; e-mail: jaume.fl[email protected] Plant, Cell and Environment (2008) 31, 602–621 doi: 10.1111/j.1365-3040.2007.01757.x © 2007 The Authors Journal compilation © 2007 Blackwell Publishing Ltd 602
-
Upload
independent -
Category
Documents
-
view
1 -
download
0
Transcript of Mesophyll conductance to CO 2 : current knowledge and future prospects

Mesophyll conductance to CO2: current knowledge andfuture prospects
JAUME FLEXAS1, MIQUEL RIBAS-CARBÓ1, ANTONIO DIAZ-ESPEJO2, JERONI GALMÉS1 &HIPÓLITO MEDRANO1
1Grup de Recerca en Biologia de les Plantes en Condicions Mediterrànies, Departament de Biologia, Universitat de les IllesBalears, Carretera de Valldemossa Km 7.5, 07122 Palma de Mallorca, Balears, Spain and 2Instituto de Recursos Naturales yAgrobiología, CSIC, Apartado 1052, 41080 Sevilla, Spain
ABSTRACT
During photosynthesis, CO2 moves from the atmosphere(Ca) surrounding the leaf to the sub-stomatal internal cavi-ties (Ci) through stomata, and from there to the site ofcarboxylation inside the chloroplast stroma (Cc) throughthe leaf mesophyll. The latter CO2 diffusion component iscalled mesophyll conductance (gm), and can be divided inat least three components, that is, conductance throughintercellular air spaces (gias), through cell wall (gw) andthrough the liquid phase inside cells (gliq). A large body ofevidence has accumulated in the past two decades indicat-ing that gm is sufficiently small as to significantly decreaseCc relative to Ci, therefore limiting photosynthesis. More-over, gm is not constant, and it changes among species andin response to environmental factors. In addition, there isnow evidence that gliq and, in some cases, gw, are the maindeterminants of gm. Mesophyll conductance is verydynamic, changing in response to environmental variablesas rapid or even faster than stomatal conductance (i.e.within seconds to minutes). A revision of current knowl-edge on gm is presented. Firstly, a historical perspective isgiven, highlighting the founding works and methods, fol-lowed by a re-examination of the range of variation of gm
among plant species and functional groups, and a revisionof the responses of gm to different external (biotic andabiotic) and internal (developmental, structural and meta-bolic) factors. The possible physiological bases for gm,including aquaporins and carbonic anhydrases, are dis-cussed. Possible ecological implications for variable gm areindicated, and the errors induced by neglecting gm wheninterpreting photosynthesis and carbon isotope discrimi-nation models are highlighted. Finally, a series of researchpriorities for the near future are proposed.
Key-words: AN-Ci curves; aquaporins; carbonic anhydrase;CO2 diffusion conductance; isotope discrimination; leafinternal diffusion conductance; photosynthesis.
INTRODUCTION: THE CONCEPT OFMESOPHYLL CONDUCTANCE TO CO2 ANDTHE EVOLUTION OF ITS PERCEPTION INPLANT SCIENCE
During photosynthesis, CO2 has to move from the atmo-sphere surrounding the leaf across a boundary layer in theair above the foliage surface to the sub-stomatal internalcavities through the stomata (Fig. 1a), and from there to thesite of carboxylation inside the stroma through the leafmesophyll (Fig. 1b). From Fick’s first law of diffusion,the net photosynthetic flux at steady state (AN) can beexpressed as: AN = gs (Ca - Ci) = gm (Ci - Cc), where gs andgm are the stomatal and mesophyll conductance to CO2
diffusion, and Ca, Ci and Cc are the CO2 concentrations inthe atmosphere, in the sub-stomatal internal cavity and inthe chloroplast stroma, respectively (Long & Bernacchi2003). While this two-dimensional view of CO2 diffusion ismostly valid when referring to the stomata, it is rather sim-plistic when referring to the mesophyll, and it may be inad-equate to describe a system where there are CO2 sinks andsources distributed along the pathway (Parkhurst 1994).However, although there have been attempts to developthree-dimensional models for CO2 mesophyll diffusion(Parkhurst 1994; Aalto & Juurola 2002; Juurola et al. 2005),at present, they are far from being of general use. Never-theless, as pointed out by Parkhurst (1994), ‘representinginternal diffusion limitations with single numbers seemspreferable to neglecting them completely’. Therefore, thepresent review intends to update the current knowledge onmesophyll conductance from a two-dimensional perspec-tive, considering only vertical CO2 diffusion through leafmesophyll. Lateral CO2 diffusion inside the mesophyll canalso be important for photosynthesis in some cases(Morison et al. 2005; Pieruschka, Schurr & Jahnke 2005),although this aspect has already been reviewed recently(Morison & Lawson 2007).
In Gaastra’s (1959) pioneer work on leaf photosynthesis,mesophyll conductance (and its inverse, mesophyll resis-tance) was defined essentially as a diffusion component ofthe photosynthesis pathway, and it was considered to be animportant factor in determining leaf photosynthesis (actu-ally more important than stomatal conductance). Later,
Correspondence: J. Flexas. Fax: +34 971 173184; e-mail:[email protected]
Plant, Cell and Environment (2008) 31, 602–621 doi: 10.1111/j.1365-3040.2007.01757.x
© 2007 The AuthorsJournal compilation © 2007 Blackwell Publishing Ltd602
Troughton & Slatyer (1969) extended the use of the term toa ‘mixed’ diffusion-biochemical component, that is, to referto the initial slope of AN versus Ci relationship. FollowingGaastra’s (1959) assumption that CO2 concentration insidethe chloroplast was near zero (i.e. at the CO2 compensationconcentration), Jones & Slatyer (1972b) proposed a methodto separate the transport and carboxylation components ofwhat continued to be called mesophyll or intracellular con-ductance. Using this method, earlier conclusions by Gaastrathat mesophyll transport resistance was a limiting factor forphotosynthesis were confirmed (Jones & Slatyer 1972a,b;Samsuddin & Impens 1979), and it was suggested, for thefirst time, that the leaf internal resistance to CO2 transfercould be variable and could respond, for instance, to waterstress (Jones 1973). The nomenclature was further compli-cated by Samsuddin & Impens (1979), who termed internalresistance to the ‘mixed’ diffusion-biochemical term, whilerestoring the use of the term mesophyll resistance to referto the transfer component alone. Such a semantic confusioncontinues nowadays, and several more recent papers stillcall ‘mesophyll conductance’ or ‘internal conductance’ tothe initial slope of AN versus Ci relationship (e.g. Moldau &Kull 1993; Laisk & Loreto 1996; Eichelmann et al. 2004a,b;Béjaoui et al. 2006). We propose, as already did Farquhar &Sharkey (1982) and Parkhurst (1994), to restrict the termmesophyll conductance to the diffusion of CO2 through leafmesophyll, both through intercellular air spaces (gias), cellwall (gw) and the intracellular liquid pathway (gliq). That is,mesophyll conductance should be viewed as synonymous of‘leaf internal diffusion conductance’, while terms such as‘apparent carboxylation efficiency’ or ‘apparent carboxyla-tion conductance’ may be more adequate to refer to theinitial slope of the AN versus Ci relationship.
With the introduction of the most commonly used leafphotosynthesis model by Farquhar, von Caemmerer &Berry (1980), the early assumption that CO2 concentrationin the chloroplasts was close to zero or to the compensationpoint was rejected, as was later being confirmed by direct
measurements of Ci (Lauer & Boyer 1992). Thereafter,most gas exchange studies have usually assumed that gm islarge and constant, that is, that Ci = Cc. However, differentstudies in the late 80s and early 90s have already suggestedthat Cc is significantly less than Ci, although not close tozero. Evans et al. (1986) reached this conclusion by compar-ing online carbon isotope discrimination of photosynthesiz-ing leaves with the theoretical discrimination that would beexpected if Ci = Cc. Evans (1983) and Evans & Terashima(1988) reached the same conclusion by comparing theinitial slope of the AN versus Ci curve in wheat and spinachleaves with the activity of ribulose 1·5-bisphosphatecarboxylase/oxygenase (Rubisco) as determined in vitro.With the advent of pulse-amplitude fluorometers, the com-parison of chlorophyll fluorescence with gas exchange mea-surements also indicated that Cc was lower than Ci, and thattheir difference increased under conditions of water stressor salinity (Bongi & Loreto 1989; Cornic et al. 1989; DiMarco et al. 1990). The water stress-induced decrease of Cc
below Ci was independently demonstrated by measuringleaf 18O discrimination (Renou et al. 1990), and was latelyconfirmed several times by both chlorophyll fluorescenceand leaf 18O discrimination (Tourneux & Peltier 1995;Sánchez-Rodríguez, Pérez & Martínez-Carrasco 1999).
METHODOLOGIAL ADVANCES INDETERMINING MESOPHYLL CONDUCTANCEAND ITS COMPONENTS
The pioneer studies described in the previous sectionincludes the development of several methods that havebecome usual to estimate mesophyll conductance to CO2.Adetailed description of the principles and procedures ofthese methods has recently been reviewed by Warren(2006a).Therefore, the present review will only mention theexisting methods, providing the original and extendedreferences for readers interested in a more detaileddescription.
cw
pm
pg
ce
st
s
Ci Cc
gias gw gliq
Cs
Cc
gs
gm
Ci
Ca gb(a) (b)
st
Ci Cc
gias gw gliq
st
Ci Cc
gias g
50 mm 0.2 mm
Cs
Cc
gs
gm
Ci
Ca gb
Cs
s
Ci
b
Figure 1. (a) Micrograph of the abaxial surface of an olive leaf (bottom side up), where the stomata can be seen, as well as the pathwayof CO2 from ambient (Ca) through leaf surface (Cs) and intercellular air spaces (Ci) to the chloroplast (Cc). Boundary layer conductance(gb), stomatal conductance (gs) and mesophyll conductance (gm) are indicated. (b) Electron micrograph of a grapevine leaf where cell wall(cw), plasma membrane (pm), the chloroplast envelope (ce) and stroma thylakoid (st) can be observed. The pathway of CO2 from Ci tochloroplastic CO2 (Cc) is characterized by intercellular air space conductance to CO2 (gias), through cell wall (gw) and through the liquidphase inside the cell (gliq). A grain of starch (s) and a plastoglobule (pg) can be also observed in the picture (photos by A. Diaz-Espejo).
Review: mesophyll conductance to CO2 603
© 2007 The AuthorsJournal compilation © 2007 Blackwell Publishing Ltd, Plant, Cell and Environment, 31, 602–621
Currently, widely used methods include (1) the single-point online carbon isotope discrimination method intro-duced by Evans et al. (1986) and further developed bySharkey et al. (1991) and Loreto et al. (1992), (2) the slope-based online carbon isotope discrimination method alsointroduced by Evans et al. (1986) and further developed byvon Caemmerer & Evans (1991) and Lloyd et al. (1992), (3)the ‘constant J’ fluorescence method introduced by Bongi &Loreto (1989) and further developed by Harley et al.(1992), and (4) the ‘variable J’ fluorescence method intro-duced by Di Marco et al. (1990) and also further developedby Harley et al. (1992). Two variations of the latter methodhave also been described, namely, the ‘variable J’ fluores-cence method by Epron et al. (1995) and the ‘J at the CO2
photocompensation point’ method by Laisk et al. (2002).Alternative methods include (5) the ‘initial slope’ methodby Evans (1983) and Evans & Terashima (1988), (6) thecarbon isotope discrimination in recently synthesizedsugars originally described by Brugnoli & Lauteri (1991)and further developed by Lauteri et al. (1997), and (7) the‘real versus apparent compensation point (G* versus Ci*)’method by Peisker & Apel (2001). Recently, a novel (8)‘curve-fitting’ method was introduced by Ethier & Living-ston (2004), which was followed by a similar method bySharkey et al. (2007). In addition, the gas phase componentof gm (gias) can be determined by comparing leaf CO2
assimilation in atmospheres containing different gases, suchas NO2 (Jarvis & Slatyer 1970) or helium (Farquhar &Raschke 1978; Parkhurst & Mott 1990; Genty et al. 1998;Piel 2002). On the other hand, the liquid phase componentof gm (gliq) can be measured by using leaf 18O discrimination,as originally described by Renou et al. (1990) and furtherdeveloped by Tourneux & Peltier (1995) and, specially, byGillon & Yakir (2000), or by using the photoacousticmethod described by Gorton, Herbert & Vogelmann(2003).
Each of these methods relies on a number of assump-tions and requires the determination of several param-eters that sometimes are not easy to obtain. Moreover, therecent demonstration that gm is largely and rapidlyaffected by CO2 and light intensity (Flexas et al. 2007a)impairs the fundamentals of some of these methods,including the ‘slope-based carbon isotope discrimination’method, the constant J method and the curve-fittingmethod (although the curve-fitting methods give reliableestimates of the ‘average’ gm over a given CO2 range).When comparing gm values among species, treatments, etc.,it is important to keep in mind the limits of precision ofthese methods. Warren (2006a) reported that SDs could beas high as 19–38% of the mean for the chlorophyll fluo-rescence methods, and 6–34% for the isotopic method.Therefore, the methods available do not allow solving forsmall differences in gm. Nevertheless, the fact that compar-ing several of these methods, which rely in substantiallydifferent assumptions, yields similar results reinforces theidea that they all provide reasonable estimates of gm inleaves (Loreto et al. 1992; Flexas et al. 2006b, 2007a;Warren & Dreyer 2006).
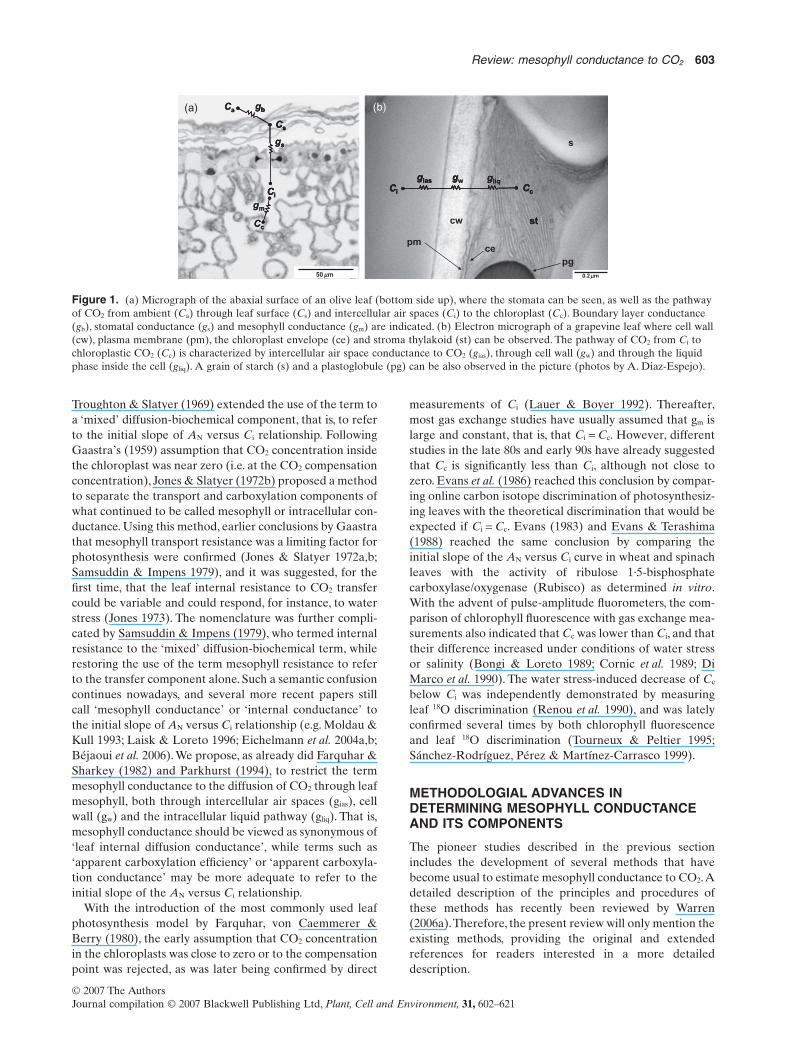
Despite limits in their accuracy, the use of all thesemethods has increased our capacity to explore mesophyllconductance to CO2 and its relevance for photosynthesis.The number of references addressing several aspects ofmesophyll conductance to CO2 is increasing exponentially,and up to about a hundred publications has appeared overthe last 20 years containing estimations of gm and/or review-ing any aspect of its importance for plant physiology(Fig. 2). Actually, the number of reports on gm has doubledduring the past 5 years (Fig. 2), because of the introductionearly this decade of commercial devices capable of simul-taneous gas exchange and chlorophyll fluorescence mea-surements over the same leaf area [Li-Cor Inc. (NE, USA)introduced the first of such systems in June 2001].
The aim of the present review was to summarize theaccumulated knowledge on mesophyll conductance to CO2
and to stress some future research needs. Previous reviewson CO2 diffusion inside leaves are available (Parkhurst1994; Evans & von Caemmerer 1996; Evans & Loreto 2000;Massacci & Loreto 2001). In addition, other reviews haveaddressed specific aspects of gm, such as its importance forsun–shade differentiation (Terashima, Miyazawa & Hanba2001; Niinemets & Sack 2005;Terashima et al. 2006), its rolein photosynthetic nitrogen and water use efficiency (WUE)(Hikosaka 2004; Warren & Adams 2006), its importance forphotosynthesis optimization in different plant groups(Warren & Adams 2004;Terashima et al. 2005) or the neces-sity of incorporating a term for gm in the parameterizationof photosynthesis models (Long & Bernacchi 2003; Ethier& Livingston 2004; Sharkey et al. 2007).
RANGE OF VARIATION: HOW LARGE ISMESOPHYLL CONDUCTANCE IN PLANTS?
It is now well established that mesophyll conductanceto CO2 is finite and of similar magnitude as stomatal
Year
1986 1989 1992 1995 1998 2001 2004 2007
Nu
mb
er
of
pap
ers
per
year
0
2
4
6
8
10
12
14
16
18
Nu
mb
er
of
pap
ers
(accu
mu
late
d)
0
10
20
30
40
50
60
70
80
90
100
110
120
130
140
Papers (year)Papers (accumulated)
Figure 2. Evolution of publications on mesophyll conductanceto CO2 (gm) over the last 21 years. The number of publishedpapers each year is shown as bars, while the accumulated numberof papers is shown as a dotted trend. For 2007, only paperspublished or were in press by the end of August were considered.The papers considered include those describing methods for gm
estimation, reviewing its importance in any aspect of plantecophysiology or providing estimates of gm in plants.
604 J. Flexas et al.
© 2007 The AuthorsJournal compilation © 2007 Blackwell Publishing Ltd, Plant, Cell and Environment, 31, 602–621

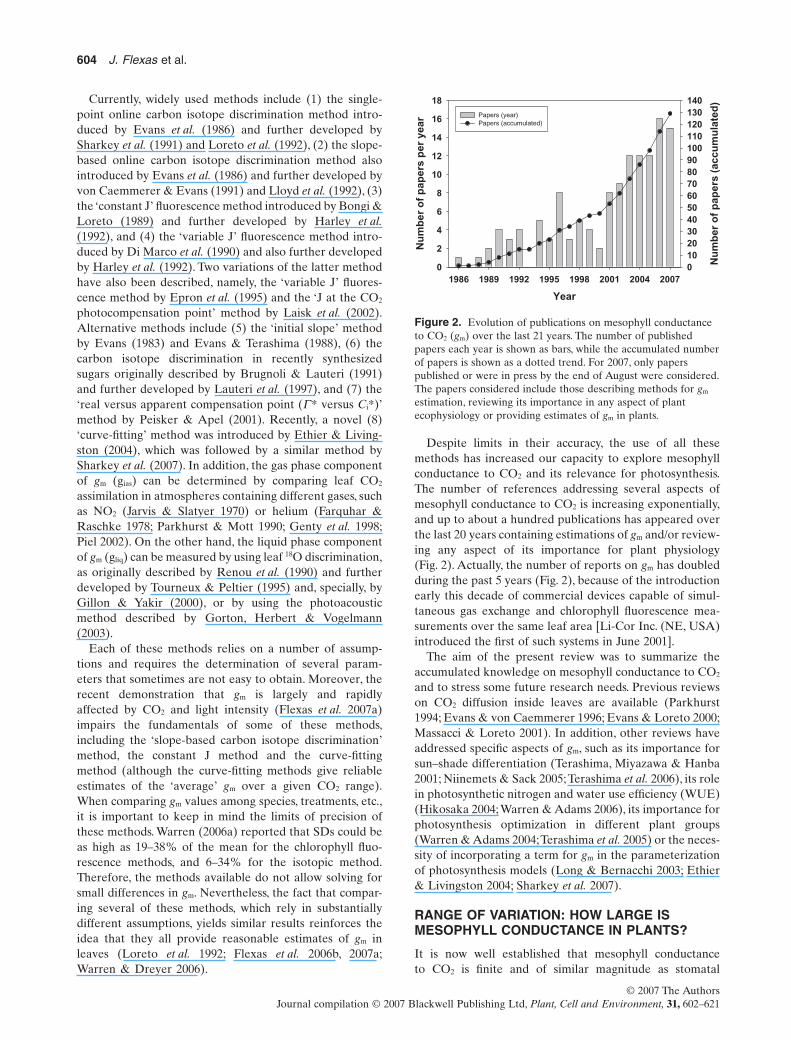
conductance (Evans & von Caemmerer 1996; Evans &Loreto 2000). Data are available in the literature for up to122 different species,subspecies,hybrids,forms and varieties.When these data are averaged for different groups, differ-ences in the maximum attainable gm (i.e. in the absence ofstress conditions) are revealed (Fig. 3). In general, herba-ceous annual and biannual plants present the largest valuesof gm (around 0.4 mol CO2 m-2 s-1 bar-1), with no differencesbetween monocots and dicots (not shown). Perennial herbsand woody deciduous angiosperms display significantlylower values (around 0.2 mol CO2 m-2 s-1 bar-1), while thevery few woody semi-deciduous angiosperms in which gm hasbeen determined show intermediate values. In woody ever-green plants, gm is even lower (slightly above and below0.1 mol CO2 m-2 s-1 bar-1 in angiosperms and gymnosperms,respectively). The very few data available for succulentCAM plants suggest that their gm is as low as that ofgymnosperms (Maxwell, von Caemmerer & Evans 1997;Griffiths et al. 2007).
These pooled data suggest that gm is associated with leafforms and plant functional groups, rather than reflectingevolutionary trends. For instance, in herbs, a big differenceis observed between annuals/biannuals and perennials (i.e.functional groups) but not between monocots and dicotswithin each group (i.e. an evolutionary differentiation). Inaddition, CAM plants, which have evolved several timesfrom C3 plants in relatively recent times, present valuessimilar to those of the anciently evolved gymnosperms.Hence, it seems that fast-growing strategies like those ofannual and biannual herbs are accompanied by highgm (and high photosynthesis rates) and vice versa.Remarkably, gm is quite low in evergreen trees and shrubs,and particularly in conifers, and this, in addition to low gs,may be the cause of their low photosynthesis rates and lowphotosynthetic nitrogen use efficiency (PNUE) (Manter &Kerrigan 2004; Warren & Adams 2004).
However, despite these general trends when consideringdata averaged per groups, significant variability can befound within a single group, genus or even species. Forinstance, within herbaceous annuals and biannuals, verylarge gm values (>1 mol CO2 m-2 s-1 bar-1) have been mea-sured in fast-growing crops such as cotton (Brugnoli et al.1998) and sunflower (Laisk & Loreto 1996), but a maximumgm as low as 0.08 mol CO2 m-2 s-1 bar-1 was found in thewild-extinct Mediterranean species Lysimachia minoricen-sis (Galmés et al. 2007a). The differences are even largerwithin woody deciduous angiosperms, with Betula pendulashowing maximum gm > 1 mol CO2 m-2 s-1 bar-1 (Laisk et al.2005) and Acer palmatum showing maximum gm < 0.06 molCO2 m-2 s-1 bar-1 (Hanba et al. 2002, 2003). Although veryfew species have been analysed, there seems to be a largevariability among semi-deciduous shrubs as well (Fig. 3).Within genus, some show a large variability, such as Citrus(0.02–0.42 mol CO2 m-2 s-1 bar-1), Populus (0.04–0.50 molCO2 m-2 s-1 bar-1) or Quercus (0.07–0.30 mol CO2 m-2
s-1 bar-1), while in others such as Abies (0.02–0.13 molCO2 m-2 s-1 bar-1), Acer (0.02–0.09 mol CO2 m-2 s-1 bar-1),Alnus (0.10–0.17 mol CO2 m-2 s-1 bar-1), Beta (0.18–
0.34 mol CO2 m-2 s-1 bar-1), Eucalyptus (0.11–0.19 molCO2 m-2 s-1 bar-1) or Pinus (0.04–0.17 mol CO2 m-2 s-1
bar-1), the variability is much smaller.Within species, a largevariability is also found, particularly in cultivated specieswith a large number of cultivars such as bean(0.16–0.39 mol CO2 m-2 s-1 bar-1), cotton (0.3–1.8 mol CO2
m-2 s-1 bar-1), grapevines (0.07–0.30 mol CO2 m-2 s-1 bar-1),olives (0.08–0.35 mol CO2 m-2 s-1 bar-1), tobacco (0.09–0.50 mol CO2 m-2 s-1 bar-1) or wheat (0.20–0.64 molCO2 m-2 s-1 bar-1).
Therefore, although general trends can be traced whencomparing different functional groups, a large variability ingm is present within groups, genus and even species, suggest-ing that gm is a rapidly adapting trait likely being involved inthe differences of photosynthetic efficiency found amongdifferent species and cultivars.
ECOPHYSIOLOGY OF gm: HOW DOES ITRESPOND TO CHANGES IN ENVIRONMENTALAND INTERNAL VARIABLES?
In addition to being largely variable among differentspecies and cultivars, gm is currently known to change inresponse to a series of environmental variables. Early workshave already suggested that gm decrease in response towater stress (Jones 1973), low nitrogen availability (Evans& Terashima 1988), salinity (Bongi & Loreto 1989) or highaltitude (Vitousek, Field & Matson 1990). Now, it is knownthat gm not only decreases in the long term (days to weeks)in response to these environmental variables, but also to theexogenous application of abscisic acid (Flexas et al. 2006a)or poliethylenglycol (Warren et al. 2004), water logging(Black et al. 2005) or virus infections (Sampol et al. 2003).Shade leaves present lower gm than sun leaves (Hanba et al.2002; Piel et al. 2002; Laisk et al. 2005; Warren et al. 2007).Moreover, gm increases when in vitro grown plants are accli-mated to ex vitro conditions (Fila et al. 2006). These andother responses are summarized in Table 1. Long-termacclimation of gm to high CO2 and high O3 is less frequent(Singsaas et al. 2003; Eichelmann et al. 2004a; Bernacchiet al. 2005; Velikova et al. 2005; Flowers et al. 2007; Warrenet al. 2007), although it occurs in some species and cultivars(Singsaas et al. 2003; Flowers et al. 2007). Acclimation todifferent growth temperatures is also complex. In spinach,plants grown at 30 and 15 °C attained similar maximum gm,but peak temperature was acclimated, occurring at 25 and20 °C in high and low growth temperature plants, respec-tively (Yamori et al. 2006). On the other hand, in cabbage,both peak temperature and the maximum value of gm accli-mate (Fig. 4; Flexas, Nogues & Cornic, unpublished results).In plants grown at only 5 °C, gm was severely depressed atany temperature, peaking at 18 °C, while in plants grown at20 °C, gm values were normal and peaked at 24 °C. Leaftemperature also affected gm in olive leaves, with anoptimum temperature at 29 °C (Diaz-Espejo et al. 2007). Inthis study, a seasonal evolution of diffusional limitations tophotosynthesis under field conditions was suggested. Onthe other hand, in Eucalyptus regnans, no acclimation was
Review: mesophyll conductance to CO2 605
© 2007 The AuthorsJournal compilation © 2007 Blackwell Publishing Ltd, Plant, Cell and Environment, 31, 602–621
Everg
reen
gym
nosper
ms
Everg
reen
angio
sper
ms
Semi-d
ecid
uous an
giosp
erm
s
Dec
iduous
angio
sper
ms
Her
baceo
us an
nuals
Peren
nial h
erbs
CAM
pla
nts
gm
(m
ol m
–2
s–
1 b
ar–
1)
0.0
0.1
0.2
0.3
0.4
0.5
0.6
Figure 3. Maximum mesophyll conductance values (i.e. in the absence of ambient stress conditions) for different plant groups, includingwoody evergreen gymnosperms, woody evergreen angiosperms, woody semi-deciduous angiosperms, woody deciduous angiosperms,herbaceous perennials, herbaceous annual/biannual plants and CAM plants. For herbaceous plants, monocots and dicots are plottedtogether because there were no differences in average values between the two groups. Values are average � SE of published results. Dataaveraged include the following species: evergreen gymnosperms (n = 13): Abies concolor54, Abies grandis54, Abies magnifica54, Abiesprocera54, Dacrydium cupressinum41, Pinus lambertiana54, Pinus monticola54, Pinus pinaster75, Pinus radiata41, Picea sitchensis59,Prumnopitys ferruginea41, Pseudotsuga menziesii41,54,57,67, Tsuga heterophylla54; woody evergreen angiosperms (n = 32): Arbutus unedo7,Camellia japonica25,44, Castanopsis sieboldii25,30,44, Cinnamomum camphora25, Citrus aurantum7, Citrus limon6, Citrus paradisi6, Citrussinensis14, Coffea arabica44, Eperua grandiflora46, Eucalyptus blakelyi4, Eucalyptus globulus5,7,56, Eucalyptus regnans87,88, Hedera helix7,Hypericum balearicum83, Laurus nobilis64, Ligustrum lucidum25,44, Limonium gibertii,79,83, Limonium magallufianum83, Macadamiaintegrifolia6, Metrosideros umbellate41, Nerium oleander7, Olea europea2,40,45,64,78,79, Pistacia lentiscus83, Quercus glauca25,44, Quercusilex7,13,64,65,72, Quercus phillyraeoides25, Rhamnus alaternus52, Rhamnus ludovici-salvatoris52, Rhododendron macrophyllum54, Rosmarinusofficinalis60, Weinmannia racemosa41; woody semi-deciduous angiosperms (n = 3): Phlomis italica83, Lavatera maritima83, Cistus albidus83;woody deciduous angiosperms (n = 37): Acer mono28,35, Acer mono var. marmoratum f. dissectum44, Acer circinatum54, Acermacrophyllum54, Acer palmatum35,44, Acer rufinerve35,44, Alnus japonica28,44, Alnus rhombifolia54, Alnus rubra54, Betula pendula36,50,51,63,Buddleja davidii74, Castanea sativa12,16,19, Corylus cornuta54, Fagus sylvatica12,86, Ficus carica14, Juglans nigra38, Juglans regia38, Liquidambarstyraciflua48, Populus nigra55, Populus maximowiczii28,44, Populus deltoides13, Populus euramericana cv. Robusta18, Populus koreana xtrichocarpa cv. Peace18,21, Populus tremeloides48, Populus trichocarpa x deltoides54, Prunus persica6, Quercus canariensis76, Quercusgarryana54, Quercus petraea13, Quercus pubescens66, Quercus robur13,26,55, Quercus rubra5,7,54, Rhododendron occidentale54, Rosa rubiginosa21,Tilia cordata14,63, Vitis berlandieri ¥ rupestris (Richter-110)79, Vitis vinifera34,42,47,52,68; herbaceous perennials (n = 13): Alocasia brisbanensis43,Beta maritima ssp. marcosii83, Beta maritima ssp. maritima83, Capsicum annuum27,33, Crepis triasii90, Digitalis minor var. minor84, Digitalisminor var. palauii84, Gossypium hirsutum19,61, Mentha spicata60, Origanum vulgare55, Phragmites australis31, Polygonum cuspidatum29,Solidago virgaurea63; herbaceous annual/biannual (n = 23): Arabidopsis thaliana79,80, Beta vulgaris7,71, Brassica oleracea89, Cucumissativus7,48,79, Diplotaxis ibicensis83, Galinsoga ciliata55, Glycine max26,58,69, Helianthus annuus11,14,19,23,44, Ipomoea nil44, Lycopersiconesculentum44, Lysimachia minoricensis82, Nicotiana tabacum3,4,8,10,26,32,37,62,69,70,79, Nicotiana sylvestris52,73, Oryza sativa4,22,53, Phaseolusvulgaris4,41,44,48,52,81,86, Raphanus sativus4, Spinacia oleracea1,20,24,48,77, Triticum aestivum4, Triticum durum9, Triticum spp7,15, Vicia faba7,39, Vignaunguiculata14, Xanthium strumarium7,14; CAM plants (n = 1): Kalanchoë daigremontiana17,85. References: 1Evans & Terashima (1988);2Bongi & Loreto (1989); 3Sharkey et al. (1991); 4von Caemmerer & Evans (1991); 5Harley et al. (1992); 6Lloyd et al. (1992); 7Loreto et al.(1992); 8Evans et al. (1994); 9Loreto et al. (1994); 10Price et al. (1994); 11Laisk & Sumberg (1994); 12Epron et al. (1995); 13Roupsard, Gross,Dreyer (1996); 14Laisk & Loreto (1996); 15Evans & Vellen (1996); 16Lauteri et al. (1997); 17Maxwell et al. (1997); 18Ridolfi & Dreyer (1997);19Brugnoli et al. (1998); 20Delfine et al. (1998); 21Genty et al. (1998); 22Scartazza et al. (1998); 23Eichelmann & Laisk (1999); 24Delfine et al.(1999); 25Hanba, Miyazawa, Terashima (1999); 26Gillon & Yakir (2000); 27Delfine, Loreto, Alvino (2001); 28Hanba et al. (2001); 29Kogamiet al. (2001); 30Miyazawa & Terashima (2001); 31Antonielli et al. (2002); 32Bernacchi et al. (2002); 33Delfine et al. (2002); 34Flexas et al.(2002); 35Hanba, Kogami & Terashima (2002); 36Laisk et al. (2002); 37Peisker & Apel (2001); 38Piel et al. (2002); 39Terashima & Ono (2002);40Centritto, Loreto & Chartzoulakis (2003); 41De Lucia, Whitehead & Clearwater (2003); 42Düring (2003); 43Gorton et al. (2003); 44Hanba,Kogami & Terashima (2003); 45Loreto, Centritto & Chartzoulakis (2003); 46Pons & Welschen (2003); 47Sampol et al. (2003); 48Singsaas, Ort& Lucia (2003); 49Warren et al. (2003); 50Eichelmann et al. (2004a); 51Eichelmann et al. (2004b); 52Flexas et al. (2004); 53Hanba et al. (2004);54Manter & Kerrigan (2004); 55Pons & Westbeek (2004); 56Warren (2004); 57Warren, Livingston & Turpin (2004); 58Bernacchi et al. (2005);59Black et al. (2005); 60Delfine et al. (2005); 61Ennahli & Earl (2005); 62Galmés, Medrano & Flexas (2006); 63Laisk et al. (2005); 64Niinemetset al. (2005); 65Peña-Rojas et al. (2005); 66Velikova et al. (2005); 67Ethier et al. (2006); 68Fila et al. (2006); 69Flexas et al. (2006a); 70Flexas et al.(2006b); 71Monti et al. (2006); 72Niinemets et al. (2006); 73Priault et al. (2006); 74Shi et al. (2006); 75Warren (2006b); 76Warren & Dreyer(2006); 77Yamori et al. (2006); 78Diaz-Espejo, Nicolás & Fernández (2007); 79Flexas et al. (2007a); 80Flexas et al. (2007b); 81Flowers et al.(2007); 82Galmés et al. (2007a); 83Galmés, Medrano, Flexas (2007b); 84Galmés, Medrano, Flexas (2007c); 85Griffiths et al. (2007); 86Warrenet al. (2007); 87Warren (2008); 88Warren (unpublished); 89Flexas, Nogues & Cornic (unpublished results); 90Flexas et al. (unpublishedresults). gm, mesophyll conductance.
606 J. Flexas et al.
© 2007 The AuthorsJournal compilation © 2007 Blackwell Publishing Ltd, Plant, Cell and Environment, 31, 602–621
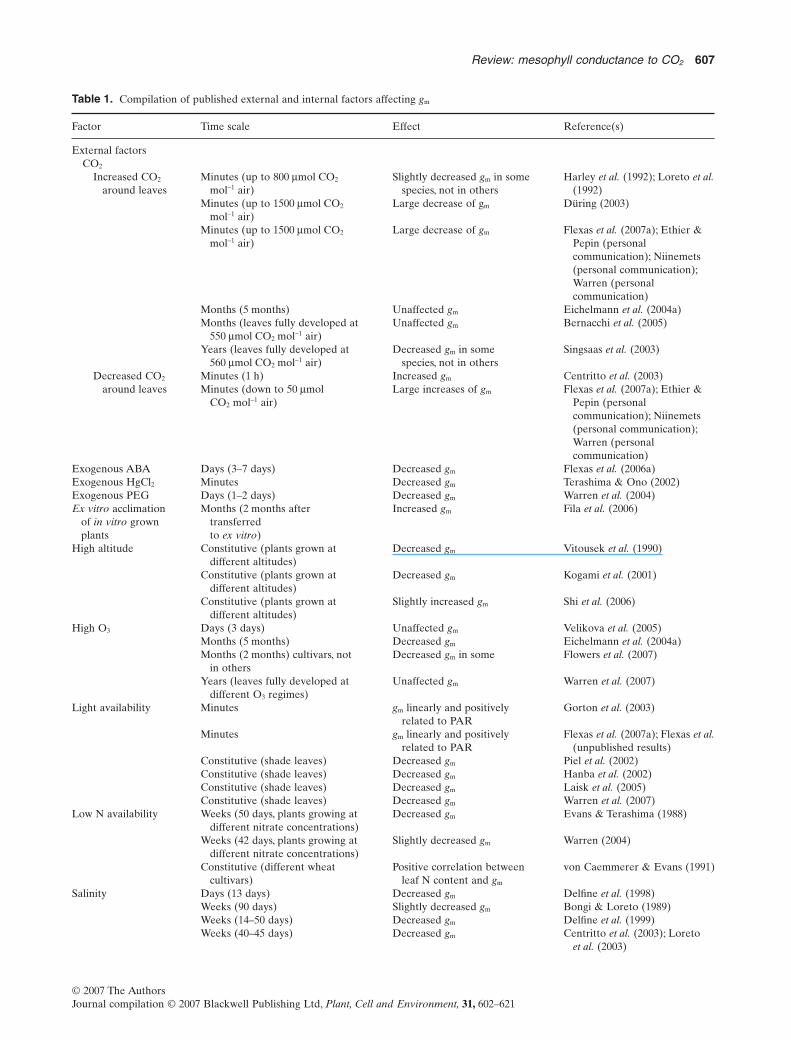
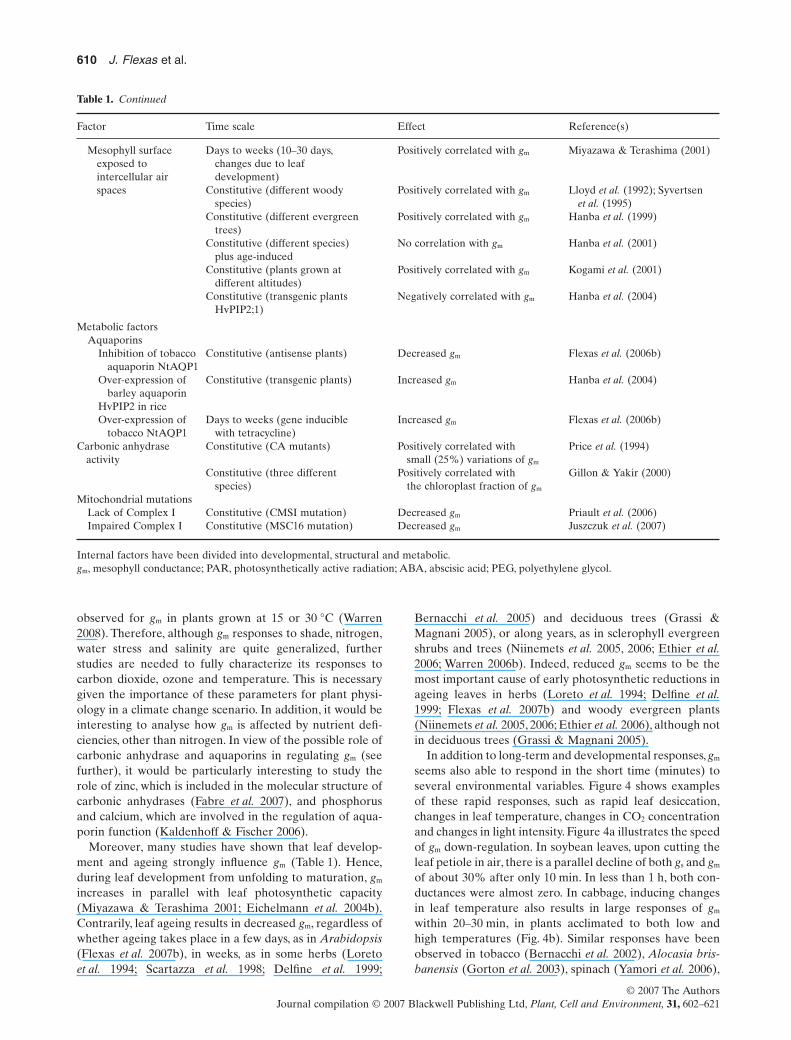
Table 1. Compilation of published external and internal factors affecting gm
Factor Time scale Effect Reference(s)
External factorsCO2
Increased CO2
around leavesMinutes (up to 800 mmol CO2
mol-1 air)Slightly decreased gm in some
species, not in othersHarley et al. (1992); Loreto et al.
(1992)Minutes (up to 1500 mmol CO2
mol-1 air)Large decrease of gm Düring (2003)
Minutes (up to 1500 mmol CO2
mol-1 air)Large decrease of gm Flexas et al. (2007a); Ethier &
Pepin (personalcommunication); Niinemets(personal communication);Warren (personalcommunication)
Months (5 months) Unaffected gm Eichelmann et al. (2004a)Months (leaves fully developed at
550 mmol CO2 mol-1 air)Unaffected gm Bernacchi et al. (2005)
Years (leaves fully developed at560 mmol CO2 mol-1 air)
Decreased gm in somespecies, not in others
Singsaas et al. (2003)
Decreased CO2
around leavesMinutes (1 h) Increased gm Centritto et al. (2003)Minutes (down to 50 mmol
CO2 mol-1 air)Large increases of gm Flexas et al. (2007a); Ethier &
Pepin (personalcommunication); Niinemets(personal communication);Warren (personalcommunication)
Exogenous ABA Days (3–7 days) Decreased gm Flexas et al. (2006a)Exogenous HgCl2 Minutes Decreased gm Terashima & Ono (2002)Exogenous PEG Days (1–2 days) Decreased gm Warren et al. (2004)Ex vitro acclimation
of in vitro grownplants
Months (2 months aftertransferredto ex vitro)
Increased gm Fila et al. (2006)
High altitude Constitutive (plants grown atdifferent altitudes)
Decreased gm Vitousek et al. (1990)
Constitutive (plants grown atdifferent altitudes)
Decreased gm Kogami et al. (2001)
Constitutive (plants grown atdifferent altitudes)
Slightly increased gm Shi et al. (2006)
High O3 Days (3 days) Unaffected gm Velikova et al. (2005)Months (5 months) Decreased gm Eichelmann et al. (2004a)Months (2 months) cultivars, not
in othersDecreased gm in some Flowers et al. (2007)
Years (leaves fully developed atdifferent O3 regimes)
Unaffected gm Warren et al. (2007)
Light availability Minutes gm linearly and positivelyrelated to PAR
Gorton et al. (2003)
Minutes gm linearly and positivelyrelated to PAR
Flexas et al. (2007a); Flexas et al.(unpublished results)
Constitutive (shade leaves) Decreased gm Piel et al. (2002)Constitutive (shade leaves) Decreased gm Hanba et al. (2002)Constitutive (shade leaves) Decreased gm Laisk et al. (2005)Constitutive (shade leaves) Decreased gm Warren et al. (2007)
Low N availability Weeks (50 days, plants growing atdifferent nitrate concentrations)
Decreased gm Evans & Terashima (1988)
Weeks (42 days, plants growing atdifferent nitrate concentrations)
Slightly decreased gm Warren (2004)
Constitutive (different wheatcultivars)
Positive correlation betweenleaf N content and gm
von Caemmerer & Evans (1991)
Salinity Days (13 days) Decreased gm Delfine et al. (1998)Weeks (90 days) Slightly decreased gm Bongi & Loreto (1989)Weeks (14–50 days) Decreased gm Delfine et al. (1999)Weeks (40–45 days) Decreased gm Centritto et al. (2003); Loreto
et al. (2003)
Review: mesophyll conductance to CO2 607
© 2007 The AuthorsJournal compilation © 2007 Blackwell Publishing Ltd, Plant, Cell and Environment, 31, 602–621
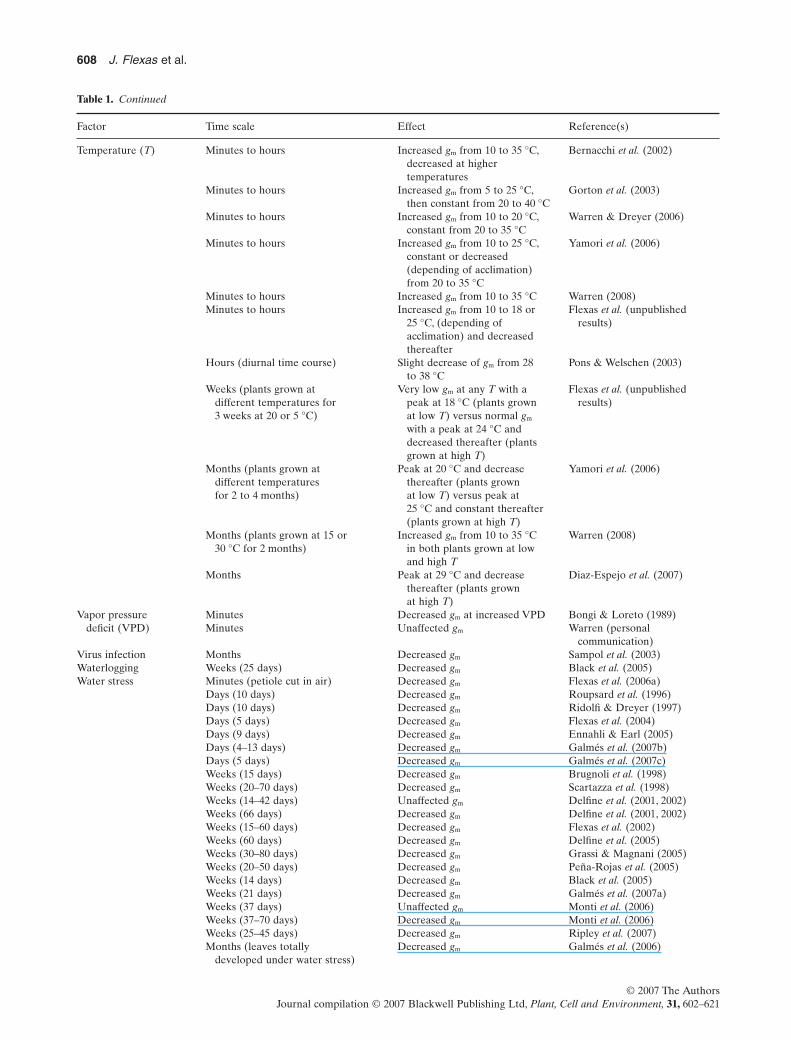
Table 1. Continued
Factor Time scale Effect Reference(s)
Temperature (T) Minutes to hours Increased gm from 10 to 35 °C,decreased at highertemperatures
Bernacchi et al. (2002)
Minutes to hours Increased gm from 5 to 25 °C,then constant from 20 to 40 °C
Gorton et al. (2003)
Minutes to hours Increased gm from 10 to 20 °C,constant from 20 to 35 °C
Warren & Dreyer (2006)
Minutes to hours Increased gm from 10 to 25 °C,constant or decreased(depending of acclimation)from 20 to 35 °C
Yamori et al. (2006)
Minutes to hours Increased gm from 10 to 35 °C Warren (2008)Minutes to hours Increased gm from 10 to 18 or
25 °C, (depending ofacclimation) and decreasedthereafter
Flexas et al. (unpublishedresults)
Hours (diurnal time course) Slight decrease of gm from 28to 38 °C
Pons & Welschen (2003)
Weeks (plants grown atdifferent temperatures for3 weeks at 20 or 5 °C)
Very low gm at any T with apeak at 18 °C (plants grownat low T) versus normal gm
with a peak at 24 °C anddecreased thereafter (plantsgrown at high T)
Flexas et al. (unpublishedresults)
Months (plants grown atdifferent temperaturesfor 2 to 4 months)
Peak at 20 °C and decreasethereafter (plants grownat low T) versus peak at25 °C and constant thereafter(plants grown at high T)
Yamori et al. (2006)
Months (plants grown at 15 or30 °C for 2 months)
Increased gm from 10 to 35 °Cin both plants grown at lowand high T
Warren (2008)
Months Peak at 29 °C and decreasethereafter (plants grownat high T)
Diaz-Espejo et al. (2007)
Vapor pressuredeficit (VPD)
Minutes Decreased gm at increased VPD Bongi & Loreto (1989)Minutes Unaffected gm Warren (personal
communication)Virus infection Months Decreased gm Sampol et al. (2003)Waterlogging Weeks (25 days) Decreased gm Black et al. (2005)Water stress Minutes (petiole cut in air) Decreased gm Flexas et al. (2006a)
Days (10 days) Decreased gm Roupsard et al. (1996)Days (10 days) Decreased gm Ridolfi & Dreyer (1997)Days (5 days) Decreased gm Flexas et al. (2004)Days (9 days) Decreased gm Ennahli & Earl (2005)Days (4–13 days) Decreased gm Galmés et al. (2007b)Days (5 days) Decreased gm Galmés et al. (2007c)Weeks (15 days) Decreased gm Brugnoli et al. (1998)Weeks (20–70 days) Decreased gm Scartazza et al. (1998)Weeks (14–42 days) Unaffected gm Delfine et al. (2001, 2002)Weeks (66 days) Decreased gm Delfine et al. (2001, 2002)Weeks (15–60 days) Decreased gm Flexas et al. (2002)Weeks (60 days) Decreased gm Delfine et al. (2005)Weeks (30–80 days) Decreased gm Grassi & Magnani (2005)Weeks (20–50 days) Decreased gm Peña-Rojas et al. (2005)Weeks (14 days) Decreased gm Black et al. (2005)Weeks (21 days) Decreased gm Galmés et al. (2007a)Weeks (37 days) Unaffected gm Monti et al. (2006)Weeks (37–70 days) Decreased gm Monti et al. (2006)Weeks (25–45 days) Decreased gm Ripley et al. (2007)Months (leaves totally
developed under water stress)Decreased gm Galmés et al. (2006)
608 J. Flexas et al.
© 2007 The AuthorsJournal compilation © 2007 Blackwell Publishing Ltd, Plant, Cell and Environment, 31, 602–621

Table 1. Continued
Factor Time scale Effect Reference(s)
Internal factorsDevelopmental factors
Leaf ageing Days (12 days) Decreased gm Flexas et al. (2007b)Weeks (25 days) Decreased gm Loreto et al. (1994)Weeks (20–70 days) Decreased gm Scartazza et al. (1998)Weeks (14–50 days) Decreased gm Delfine et al. (1999)Weeks (25 days) Decreased gm Grassi & Magnani (2005)Weeks (30–40 days) Decreased gm Bernacchi et al. (2005)Years (1 to 6 years in evergreen
trees)Decreased gm Niinemets et al. (2005, 2006)
Years (1 to 3 years in evergreentrees)
Slightly decreased gm Warren (2006b)
Years (1 to 3 years in evergreentrees)
Decreased gm Ethier et al. (2006)
Leaf development Days to weeks (10–30 days) Increased gm Miyazawa & Terashima (2001)Days (15 days) Increased gm Eichelmann et al. (2004b)
Structural factorsChloroplast
movementsMinutes (transfer from low to
high light)Unaffected gm Gorton et al. (2003)
Minutes (different lighttreatments)
Affected gm Tholen et al. (2007)
Chloroplastrearrangements
Constitutive (phytochromemutants)
Decreased gm in someexperiments, not in others
Sharkey et al. (1991)
Chloroplast surfaceexposed tointercellularair spaces
Days to weeks (10–30 days,changes due to leafdevelopment)
Positively correlated with gm Miyazawa & Terashima (2001)
Constitutive (wheat) Positively correlated with gm von Caemmerer & Evans (1991)Constitutive (tobacco rubisco
mutants)Positively correlated with gm Evans et al. (1994)
Constitutive (different woodyspecies)
Positively correlated with gm Lloyd et al. (1992)/Syvertsenet al. (1995)
Constitutive (different wheatcultivars)
No correlation with gm Evans & Vellen (1996)
Constitutive (different species)plus age-induced
Positively correlated with gm Hanba et al. (2001)
Constitutive (plants grown atdifferent altitudes)
No correlation with gm Kogami et al. (2001)
Constitutive (leaves grown atdifferent light intensities)
No correlation with gm Hanba et al. (2002)
Constitutive (transgenic plantsHvPIP2;1)
No correlation with gm Hanba et al. (2004)
Leaf porosity Days to weeks (10–30 days,changes due to leafdevelopment)
Positively correlated with gm Miyazawa & Terashima (2001)
Constitutive (different species) Positively correlated with gm Loreto et al. (1992)Constitutive (different tobacco
mutants)Negatively correlated with gm Evans et al. (1994)
Constitutive (different evergreentrees)
Negatively correlated with gm Hanba et al. (1999)
Constitutive (different species)plus age-induced
No correlation with gm Hanba et al. (2001)
Constitutive (plants grown atdifferent altitudes)
Negatively correlated with gm Kogami et al. (2001)
Constitutive (leaves grown atdifferent light intensities)
Negatively correlated with gm
in some species (nocorrelation in others)
Hanba et al. (2002)
Constitutive (transgenic plantsHvPIP2;1)
Negatively correlated with gm Hanba et al. 2004)
Developmental (resprout leavesas compared to undisturbedplants)
Positively correlated with gm Peña-Rojas et al. 2005)
Review: mesophyll conductance to CO2 609
© 2007 The AuthorsJournal compilation © 2007 Blackwell Publishing Ltd, Plant, Cell and Environment, 31, 602–621
observed for gm in plants grown at 15 or 30 °C (Warren2008). Therefore, although gm responses to shade, nitrogen,water stress and salinity are quite generalized, furtherstudies are needed to fully characterize its responses tocarbon dioxide, ozone and temperature. This is necessarygiven the importance of these parameters for plant physi-ology in a climate change scenario. In addition, it would beinteresting to analyse how gm is affected by nutrient defi-ciencies, other than nitrogen. In view of the possible role ofcarbonic anhydrase and aquaporins in regulating gm (seefurther), it would be particularly interesting to study therole of zinc, which is included in the molecular structure ofcarbonic anhydrases (Fabre et al. 2007), and phosphorusand calcium, which are involved in the regulation of aqua-porin function (Kaldenhoff & Fischer 2006).
Moreover, many studies have shown that leaf develop-ment and ageing strongly influence gm (Table 1). Hence,during leaf development from unfolding to maturation, gm
increases in parallel with leaf photosynthetic capacity(Miyazawa & Terashima 2001; Eichelmann et al. 2004b).Contrarily, leaf ageing results in decreased gm, regardless ofwhether ageing takes place in a few days, as in Arabidopsis(Flexas et al. 2007b), in weeks, as in some herbs (Loretoet al. 1994; Scartazza et al. 1998; Delfine et al. 1999;
Bernacchi et al. 2005) and deciduous trees (Grassi &Magnani 2005), or along years, as in sclerophyll evergreenshrubs and trees (Niinemets et al. 2005, 2006; Ethier et al.2006; Warren 2006b). Indeed, reduced gm seems to be themost important cause of early photosynthetic reductions inageing leaves in herbs (Loreto et al. 1994; Delfine et al.1999; Flexas et al. 2007b) and woody evergreen plants(Niinemets et al. 2005, 2006; Ethier et al. 2006), although notin deciduous trees (Grassi & Magnani 2005).
In addition to long-term and developmental responses, gm
seems also able to respond in the short time (minutes) toseveral environmental variables. Figure 4 shows examplesof these rapid responses, such as rapid leaf desiccation,changes in leaf temperature, changes in CO2 concentrationand changes in light intensity. Figure 4a illustrates the speedof gm down-regulation. In soybean leaves, upon cutting theleaf petiole in air, there is a parallel decline of both gs and gm
of about 30% after only 10 min. In less than 1 h, both con-ductances were almost zero. In cabbage, inducing changesin leaf temperature also results in large responses of gm
within 20–30 min, in plants acclimated to both low andhigh temperatures (Fig. 4b). Similar responses have beenobserved in tobacco (Bernacchi et al. 2002), Alocasia bris-banensis (Gorton et al. 2003), spinach (Yamori et al. 2006),
Table 1. Continued
Factor Time scale Effect Reference(s)
Mesophyll surfaceexposed tointercellular airspaces
Days to weeks (10–30 days,changes due to leafdevelopment)
Positively correlated with gm Miyazawa & Terashima (2001)
Constitutive (different woodyspecies)
Positively correlated with gm Lloyd et al. (1992); Syvertsenet al. (1995)
Constitutive (different evergreentrees)
Positively correlated with gm Hanba et al. (1999)
Constitutive (different species)plus age-induced
No correlation with gm Hanba et al. (2001)
Constitutive (plants grown atdifferent altitudes)
Positively correlated with gm Kogami et al. (2001)
Constitutive (transgenic plantsHvPIP2;1)
Negatively correlated with gm Hanba et al. (2004)
Metabolic factorsAquaporins
Inhibition of tobaccoaquaporin NtAQP1
Constitutive (antisense plants) Decreased gm Flexas et al. (2006b)
Over-expression ofbarley aquaporin
HvPIP2 in rice
Constitutive (transgenic plants) Increased gm Hanba et al. (2004)
Over-expression oftobacco NtAQP1
Days to weeks (gene induciblewith tetracycline)
Increased gm Flexas et al. (2006b)
Carbonic anhydraseactivity
Constitutive (CA mutants) Positively correlated withsmall (25%) variations of gm
Price et al. (1994)
Constitutive (three differentspecies)
Positively correlated withthe chloroplast fraction of gm
Gillon & Yakir (2000)
Mitochondrial mutationsLack of Complex I Constitutive (CMSI mutation) Decreased gm Priault et al. (2006)Impaired Complex I Constitutive (MSC16 mutation) Decreased gm Juszczuk et al. (2007)
Internal factors have been divided into developmental, structural and metabolic.gm, mesophyll conductance; PAR, photosynthetically active radiation; ABA, abscisic acid; PEG, polyethylene glycol.
610 J. Flexas et al.
© 2007 The AuthorsJournal compilation © 2007 Blackwell Publishing Ltd, Plant, Cell and Environment, 31, 602–621
Quercus canariensis (Warren & Dreyer 2006) and E. regn-ans (Warren 2008). Rapid changes in CO2 concentrationaround leaves, such as those typically done when perform-ing AN-Ci curves (i.e. within a few minutes), also result instrong responses of gm (Fig. 4c). Remarkably, when scaledas percent of maximum values, six different species belong-ing to different functional groups show almost identicalresponse to Ci (Fig. 4c), reinforcing the generality of thisrelationship. Similar responses have been recently observedin other species (Ethier and Pepin, Niinemets, Warren, per-sonal communication). Studies on the kinetics of gm and gs
recovery upon returning from high to ambient CO2 suggestthat gm is actually faster than gs (Flexas et al. 2007a). It wasalso suggested that light intensity during measurements alsoaffects the magnitude of gm (Fig. 4d).Actually, a linear posi-tive relationship between gliq and light intensity could beobtained from a re-analysis of the data by Gorton et al.(2003).
Therefore, it seems that gm and stomata respond to all thesame environmental variables, and in a similar manner (i.e.
decreasing in response to water loss, decreased tempera-ture, increased CO2 and decreased light). An exceptioncould be vapour pressure deficit (VPD). Although Bongi &Loreto (1989) showed a strong reduction of gm in olivein response to increased VPD, similar to the stomatalresponse, recent studies by Warren in Eucalyptus, beans andtomato showed that gs decreased upon increasing VPD,while gm does not (Warren, personal communication).Although more data are needed on the response of gm tolight and VPD to clarify these responses, it may be con-cluded that gm and gs are tightly co-regulated under mostcircumstances, resulting in adjustments in CO2 availabilityin the chloroplasts in response to environmental changes.
In summary, a large body of evidence has accumulated inrecent years to conclude that gm is not only finite, but it alsoacclimates and responds both in the long (days, weeks) andshort (minutes, hours) terms to many environmental vari-ables, including light, temperature, water and CO2. Thesechanges may be important in regulating photosynthesis inresponse to the environment.
(a)
Time after leaf abscission (minutes)
0 20 40 60 80 100
gm
(m
ol C
O2
m–2
s–1
bar–
1)
or
gs
(mo
l CO
2 m
–2
s–1)
0.0
0.1
0.2
0.3
0.4
0.5
gs
gm
(b)
Leaf temperature (ºC)
10 15 20 25 30 35
gm
(m
ol C
O2
m–2
s–1
ba
r–1)
gm
(m
ol C
O2
m–2
s–1
bar–
1)
0.0
0.1
0.2
0.3
0.4
0.5
Cold acclimatedWarm acclimated
(c)
Ci (mmol CO2 mol–1 air)
200 400 600 800 1000 1200 1400 1600 1800
gm
(%
of
maxim
um
valu
es)
0
20
40
60
80
100
120
OleaCucumisNicotianaVitisLimoniumArabidopsis
(d)
Measuring light intensity (PPFD, mmol m–2 s–1)
1000 750 250
0.0
0.1
0.2
0.3
0.4
PPFD 1000PPFD 750PPFD 250
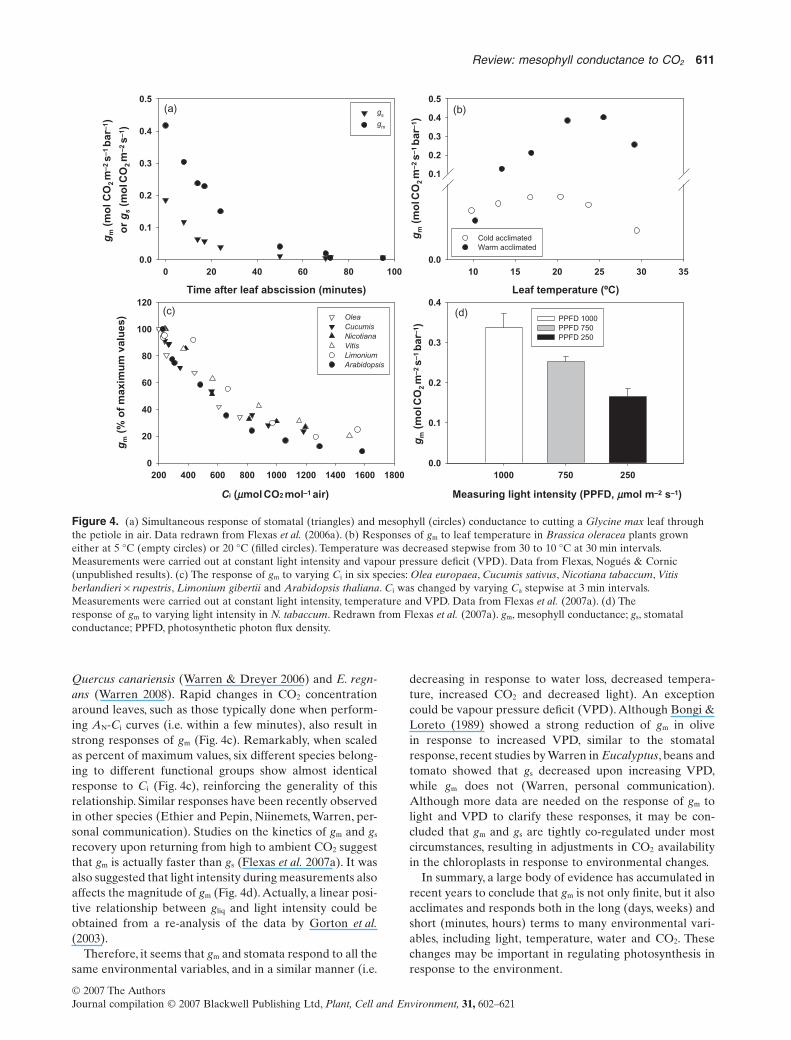
Figure 4. (a) Simultaneous response of stomatal (triangles) and mesophyll (circles) conductance to cutting a Glycine max leaf throughthe petiole in air. Data redrawn from Flexas et al. (2006a). (b) Responses of gm to leaf temperature in Brassica oleracea plants growneither at 5 °C (empty circles) or 20 °C (filled circles). Temperature was decreased stepwise from 30 to 10 °C at 30 min intervals.Measurements were carried out at constant light intensity and vapour pressure deficit (VPD). Data from Flexas, Nogués & Cornic(unpublished results). (c) The response of gm to varying Ci in six species: Olea europaea, Cucumis sativus, Nicotiana tabaccum, Vitisberlandieri ¥ rupestris, Limonium gibertii and Arabidopsis thaliana. Ci was changed by varying Ca stepwise at 3 min intervals.Measurements were carried out at constant light intensity, temperature and VPD. Data from Flexas et al. (2007a). (d) Theresponse of gm to varying light intensity in N. tabaccum. Redrawn from Flexas et al. (2007a). gm, mesophyll conductance; gs, stomatalconductance; PPFD, photosynthetic photon flux density.
Review: mesophyll conductance to CO2 611
© 2007 The AuthorsJournal compilation © 2007 Blackwell Publishing Ltd, Plant, Cell and Environment, 31, 602–621
STRUCTURAL, PHYSIOLOGICAL ANDMOLECULAR BASES FOR gm VARIATIONS:WHAT DO WE KNOW AT PRESENT?
Despite substantial evidence for large variability of gm
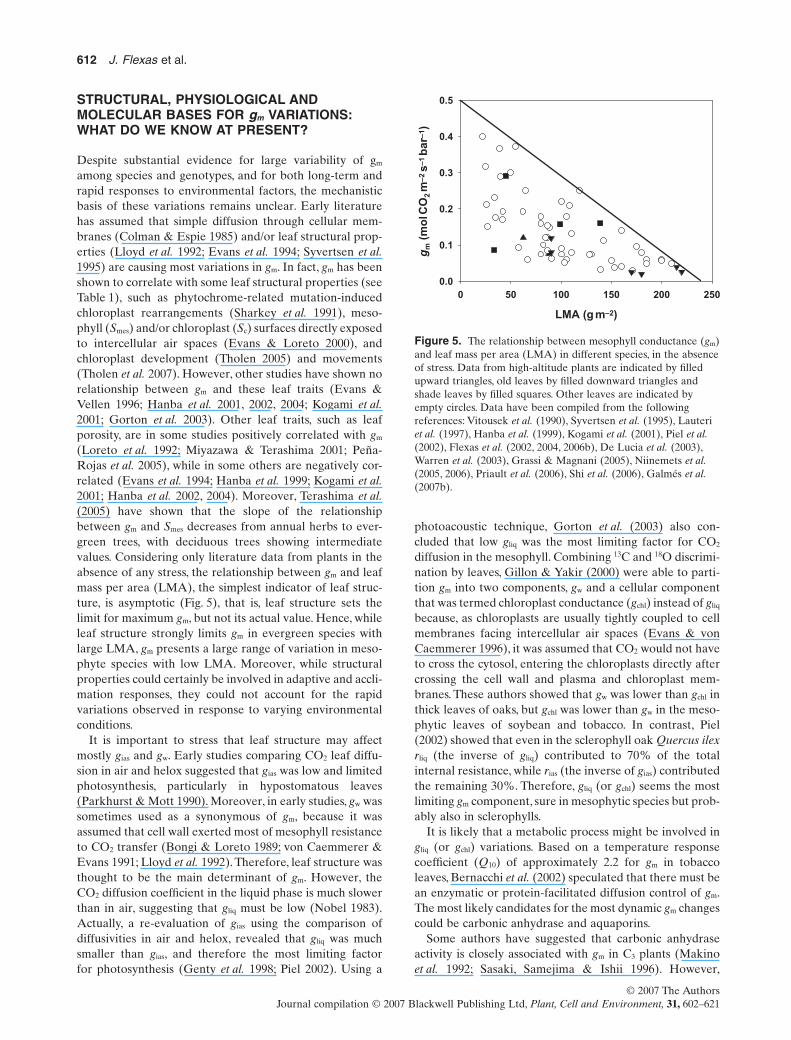
among species and genotypes, and for both long-term andrapid responses to environmental factors, the mechanisticbasis of these variations remains unclear. Early literaturehas assumed that simple diffusion through cellular mem-branes (Colman & Espie 1985) and/or leaf structural prop-erties (Lloyd et al. 1992; Evans et al. 1994; Syvertsen et al.1995) are causing most variations in gm. In fact, gm has beenshown to correlate with some leaf structural properties (seeTable 1), such as phytochrome-related mutation-inducedchloroplast rearrangements (Sharkey et al. 1991), meso-phyll (Smes) and/or chloroplast (Sc) surfaces directly exposedto intercellular air spaces (Evans & Loreto 2000), andchloroplast development (Tholen 2005) and movements(Tholen et al. 2007). However, other studies have shown norelationship between gm and these leaf traits (Evans &Vellen 1996; Hanba et al. 2001, 2002, 2004; Kogami et al.2001; Gorton et al. 2003). Other leaf traits, such as leafporosity, are in some studies positively correlated with gm
(Loreto et al. 1992; Miyazawa & Terashima 2001; Peña-Rojas et al. 2005), while in some others are negatively cor-related (Evans et al. 1994; Hanba et al. 1999; Kogami et al.2001; Hanba et al. 2002, 2004). Moreover, Terashima et al.(2005) have shown that the slope of the relationshipbetween gm and Smes decreases from annual herbs to ever-green trees, with deciduous trees showing intermediatevalues. Considering only literature data from plants in theabsence of any stress, the relationship between gm and leafmass per area (LMA), the simplest indicator of leaf struc-ture, is asymptotic (Fig. 5), that is, leaf structure sets thelimit for maximum gm, but not its actual value. Hence, whileleaf structure strongly limits gm in evergreen species withlarge LMA, gm presents a large range of variation in meso-phyte species with low LMA. Moreover, while structuralproperties could certainly be involved in adaptive and accli-mation responses, they could not account for the rapidvariations observed in response to varying environmentalconditions.
It is important to stress that leaf structure may affectmostly gias and gw. Early studies comparing CO2 leaf diffu-sion in air and helox suggested that gias was low and limitedphotosynthesis, particularly in hypostomatous leaves(Parkhurst & Mott 1990). Moreover, in early studies, gw wassometimes used as a synonymous of gm, because it wasassumed that cell wall exerted most of mesophyll resistanceto CO2 transfer (Bongi & Loreto 1989; von Caemmerer &Evans 1991; Lloyd et al. 1992). Therefore, leaf structure wasthought to be the main determinant of gm. However, theCO2 diffusion coefficient in the liquid phase is much slowerthan in air, suggesting that gliq must be low (Nobel 1983).Actually, a re-evaluation of gias using the comparison ofdiffusivities in air and helox, revealed that gliq was muchsmaller than gias, and therefore the most limiting factorfor photosynthesis (Genty et al. 1998; Piel 2002). Using a
photoacoustic technique, Gorton et al. (2003) also con-cluded that low gliq was the most limiting factor for CO2
diffusion in the mesophyll. Combining 13C and 18O discrimi-nation by leaves, Gillon & Yakir (2000) were able to parti-tion gm into two components, gw and a cellular componentthat was termed chloroplast conductance (gchl) instead of gliq
because, as chloroplasts are usually tightly coupled to cellmembranes facing intercellular air spaces (Evans & vonCaemmerer 1996), it was assumed that CO2 would not haveto cross the cytosol, entering the chloroplasts directly aftercrossing the cell wall and plasma and chloroplast mem-branes. These authors showed that gw was lower than gchl inthick leaves of oaks, but gchl was lower than gw in the meso-phytic leaves of soybean and tobacco. In contrast, Piel(2002) showed that even in the sclerophyll oak Quercus ilexrliq (the inverse of gliq) contributed to 70% of the totalinternal resistance, while rias (the inverse of gias) contributedthe remaining 30%. Therefore, gliq (or gchl) seems the mostlimiting gm component, sure in mesophytic species but prob-ably also in sclerophylls.
It is likely that a metabolic process might be involved ingliq (or gchl) variations. Based on a temperature responsecoefficient (Q10) of approximately 2.2 for gm in tobaccoleaves, Bernacchi et al. (2002) speculated that there must bean enzymatic or protein-facilitated diffusion control of gm.The most likely candidates for the most dynamic gm changescould be carbonic anhydrase and aquaporins.
Some authors have suggested that carbonic anhydraseactivity is closely associated with gm in C3 plants (Makinoet al. 1992; Sasaki, Samejima & Ishii 1996). However,
LMA (g m–2)
0 50 100 150 200 250
gm
(m
ol C
O2
m–
2 s
–1
bar–
1)
0.0
0.1
0.2
0.3
0.4
0.5
Figure 5. The relationship between mesophyll conductance (gm)and leaf mass per area (LMA) in different species, in the absenceof stress. Data from high-altitude plants are indicated by filledupward triangles, old leaves by filled downward triangles andshade leaves by filled squares. Other leaves are indicated byempty circles. Data have been compiled from the followingreferences: Vitousek et al. (1990), Syvertsen et al. (1995), Lauteriet al. (1997), Hanba et al. (1999), Kogami et al. (2001), Piel et al.(2002), Flexas et al. (2002, 2004, 2006b), De Lucia et al. (2003),Warren et al. (2003), Grassi & Magnani (2005), Niinemets et al.(2005, 2006), Priault et al. (2006), Shi et al. (2006), Galmés et al.(2007b).
612 J. Flexas et al.
© 2007 The AuthorsJournal compilation © 2007 Blackwell Publishing Ltd, Plant, Cell and Environment, 31, 602–621

modification of carbonic anhydrase activity in transgenicplants revealed some (about 25%) or no change in gm andphotosynthesis (Price et al. 1994; Williams, Flanagan &Coleman 1996a), and regression analysis showed only amodest correlation between carbonic anhydrase activityand photosynthesis in different families of Tectona grandis(Tiwari et al. 2006). An explanation was provided by Gillon& Yakir (2000), who showed that the relative contributionof carbonic anhydrase to the overall gm is species depen-dent. They suggested that carbonic anhydrase-mediatedCO2 diffusion may be more important when gm is lowbecause of structural properties of the leaves, as is the casefor woody species, where cell wall conductance is muchlower than chloroplast conductance. Moreover, it hasrecently been shown in Arabidopsis that there is a muchlarger amount of genes encoding for different carbonicanhydrases than previously thought (Fabre et al. 2007).These authors have suggested that several different car-bonic anhydrases, located in the plasma membrane, cytosoland chloroplasts, could contribute to increase gm. The pos-sible role of different carbonic anhydrases on gm is currentlybeing studied, although preliminary results have shownlittle evidence for the involvement of the most abundantforms in gm (Genty, personal communication).
Regarding a possible role for aquaporins, the first indirectevidence was provided by Terashima & Ono (2002), whoimpaired mesophyll conductance to CO2 by HgCl2 (a non-specific inhibitor of some aquaporins). Uehlein et al. (2003)demonstrated that tobacco aquaporin NtAQP1 facilitatestrans-membrane CO2 transport by expression in Xenopusoocytes. More recently, substantial evidence has been com-piled, clearly demonstrating a role of some specific aqua-porins in the regulation of gm (Hanba et al. 2004; Flexaset al. 2006b). Hanba et al. (2004) found that transgenic riceplants over-expressing the barley aquaporin HvPIP2;1 notonly presented higher gm, but also anatomical (Sm, Sc, meso-phyll porosity, stomatal density, stomatal size) and physi-ological (concentration of Rubisco) differences. Therefore,it was not clear whether the aquaporin had a direct effect ongm, or whether it was an indirect effect caused by anatomicaland physiological differences induced by plant transforma-tion. However, such anatomical and physiological differ-ences were not induced when the expression of nativeNtAQP1 was blocked or over-expressed in tobacco, whilestill important differences in gm were associated with aqua-porin levels (Flexas et al. 2006b). These results, togetherwith the fact that NtAQP1 is permeable to CO2, suggest adirect involvement of aquaporins in gm. Flexas et al. (2007a)has recently suggested that NtAQP1 could be involved inthe rapid (minutes) response of gm to changes in CO2 con-centration. Although the regulation of aquaporin activity inthe short term is not fully understood, several mechanismshave been proposed, including direct phosphorylation ofaquaporins (Kjellbom et al. 1999), an osmotically drivencohesion/tension mechanism (Ye, Wiera & Steudle 2004),pH-dependent gating of aquaporins (Tournaire-Roux et al.2003) and transcriptional regulation and protein stability(Eckert et al. 1999). CO2-transporting aquaporins are
typically located in plasma membranes (Kaldenhoff &Fischer 2006), although recently, NtAQP1 has been shownto be present in the inner chloroplast membrane as well(Kaldenhoff, personal communication). Therefore, as car-bonic anhydrases, aquaporins could be involved in gliq byacting at several points along the CO2 path.
In addition to carbonic anhydrases and aquaporins, otherleaf internal factors could be involved in gm. There havebeen already mentioned the cases of tobacco mutantsexpressing excess phytochrome (Sharkey et al. 1991) andArabidopsis mutants unresponsive to ethylene (Tholen2005; Tholen et al. 2007), although in these cases, altered gm
seems to be a consequence of chloroplast rearrangementsor movements induced by the mutation and not a directeffect of the mutation on gm. More intriguing is the case ofmitochondrial mutants, such as the cytoplasmic male sterileII (CMSII) mutant of Nicotiana sylvestris lacking complex Iof the mitochondrial electron transport chain (Priault et al.2006), or the mosaic mutant of cucumber (MSC16) alsoimpaired at the level of complex I (Juszczuk et al. 2007).Both mutants present lower photosynthetic capacity ascompared with wild type, and in both cases, this decrease isdue to a reduced gm (Priault et al. 2006) or reduced gs plusgm (Juszczuk et al. 2007). Clearly, the physiological linkbetween mitochondrial electron transport chain and down-regulation of gm needs to be elucidated.
Summarizing, despite substantial evidence for largevariability of gm, the mechanistic basis of these variationsremains unclear. While structural properties could beinvolved in adaptive and acclimation responses, the mostlikely candidates for the most dynamic gm changes would becarbonic anhydrase and aquaporins, although other compo-nents cannot be discarded at present.
IMPLICATIONS OF A FINITE AND VARIABLE gm:PLANT ECOLOGY AND RESOURCE USEEFFICIENCY
From a global perspective, the fact that leaf thickness anddensity (i.e. LMA) set a limit for the maximum gm (Fig. 5)contributes to establish the so-called ‘worldwide leaf eco-nomics spectrum’ (Wright et al. 2004) and, particularly, thenegative relationship between AN and/or PNUE and LMA(Hikosaka et al. 1998; Hikosaka 2004; Pons & Westbeek2004; Warren & Adams 2006). In other words, interspecificdifferences in gm define ecological strategies along a gradi-ent from fast-growing, high PNUE species with a low per-sistence under stress to slow-growing, low PNUE specieswith a high persistence under stress. Differences in gm
among varieties or provenances of a given species have alsobeen described and related to differences in photosyntheticefficiency (Evans & Vellen 1996; Lauteri et al. 1997; Patakas,Kofidis & Bosabalidis 2003). Evolutionary studies haveattempted to describe whether adapting stomatal conduc-tance and/or leaf biochemical capacity is effective in thegeneration of photosythetically efficient species (Geber &Dawson 1990) or crop cultivars (Koç, Barutçular & Genç
Review: mesophyll conductance to CO2 613
© 2007 The AuthorsJournal compilation © 2007 Blackwell Publishing Ltd, Plant, Cell and Environment, 31, 602–621

2003). Further studies would be necessary to establish howadapting gm can also contribute to the evolution of photo-synthetically efficient plants.
A particular aspect of photosynthetic efficiency, of enor-mous importance in semi-arid and arid environments, is leafWUE. At least theoretically, increasing AN by means ofincreasing gs has a cost in terms of transpiration, leading todecreased WUE. On the contrary, increasing AN by meansof increasing gm may result in increased WUE (Warren &Adams 2006; Aranda et al. 2007). Evans & Vellen (1996)showed that high WUE was related to a high gm in somewheat cultivars, but not in others. Similarly, Lauteri et al.(1997) showed that provenances of Castanea sativa fromlow rainfall areas had a higher WUE and a higher gm
than provenances from high rainfall areas. In plants fromBursa (mean annual precipitation = 700 mm), the ratiogm/gs was 0.98, decreasing to 0.88 and 0.49 in plantsfrom Hopa and Girseum, respectively (mean annualprecipitation = 1125 mm). A similar correspondencebetween WUE and gm/gs was observed in provenances ofthe annual herb Crepis tirasii, an ancient endemism fromthe Balearic Islands with a very fragmentary distributionin isolated populations (Flexas, Galmés, Mayol andRiba, unpublished results). When growing in a commonenvironment, plants from six different populations fromsites with precipitation ranging 400–600 mm year-1 showeda very similar leaf intrinsic WUE (AN/gs = 26–30 mmolCO2 mol-1 H2O). These plants presented gm/gs ratiosbetween 0.3 and 0.4 mol mol-1 (Fig. 6). However, a seventhseparated population from Cabrera, a small islet withannual precipitation lower than 300 mm year-1, showed a
25% larger WUE (AN/gs = 40 mmol CO2 mol-1 H2O), in cor-respondence with increased gm/gs (0.5 mol mol-1).
In summary, gm adjustments could play a role in definingthe photosynthetic strategies of plants, contributing todefine their ecological niches. In addition, increasing theratio gm/gs enhances photosynthesis and WUE in plantsevolved under arid environments. While further studiesincluding more species and larger numbers of cultivars areneeded, these results suggest that gm could be a good targetfor the improvement of crop WUE through biotechnology.
IMPLICATIONS OF A FINITE AND VARIABLE gm:MODELLING PLANT PHOTOSYNTHESIS ANDITS RESPONSES TO CLIMATE
The current knowledge that gm is finite and variable, andthat Ci differs from Cc in a manner that is not easily pre-dictable strengthens the need to incorporate a term thatconsiders gm in current photosynthesis models, such as thatby Farquhar et al. (1980), as already suggested (Bernacchiet al. 2002; Flexas et al. 2002; Long & Bernacchi 2003; Ethier& Livingston 2004; Manter & Kerrigan 2004; Sharkey et al.2007). In general, ignoring the difference between Cc and Ci
caused by gm would result in an underestimation of themaximum velocity of carboxylation (Vc,max) and, to a lesserextent, underestimation of the maximum capacity for elec-tron transport (Jmax). This effect is very important particu-larly when gm is largely reduced, such as under severe waterstress. Under these conditions, using Ci instead of Cc canlead to errors as large as ca. 100% in the estimation of Vc,max,as illustrated by Flexas et al. (2006c, 2007a).
The importance of AN-Ci curves and photosynthesismodels relies on the fact that they are commonly used todevelop prediction models of CO2 assimilation for crops(Diaz-Espejo et al. 2006) and natural vegetation (Xu &Baldocchi 2003), to assess the influence of stresses on thephotosynthetic capacity of plants (Centritto et al. 2003;Loreto et al. 2003) and to help predict the effects of climatechange on photosynthesis (Rogers, Ellsworth & Humphries2001). Moreover, these measurements and models are thebasis for scaling up from leaf to whole plant and/or ecosys-tem carbon assimilation models (Harley & Baldocchi 1995).While gm has started being taken into account in leaf-levelphotosynthesis parameterization studies (Ethier & Living-ston 2004; Manter & Kerrigan 2004; Flexas et al. 2006c,2007a,b; Diaz-Espejo et al. 2007; Sharkey et al. 2007), to thebest of our knowledge, it was considered in only two studiesconcerning whole-plant modelling (Williams et al. 1996b;Le Roux et al. 2001). In the first of these studies, gm wasconsidered as a constant, while in the second, it was derivedfrom a previously established linear relationship betweengm and Vc,max. However, this may not represent a sufficientlyaccurate approach, and studies have begun to address howgm at different canopy levels responds to the interaction ofleaf age and illumination history (Niinemets et al. 2006) orwater stress and canopy microclimate (Diaz-Espejo et al.2007). Clearly, more studies are needed in this direction, as
gs (mol H2O m–2 s–1)
0.20 0.25 0.30 0.35 0.40 0.45 0.50 0.55
AN (
mmo
l CO
2 m
–2
s–1)
8
9
10
11
12
13
14
15
AN/gs = 26–30 mmol CO
2 mol–1
H2O
AN/gs = 40 mmol CO
2 mol–1
H2O
gm/gs = 0.50 mol CO2
mol CO2–1
gm/gs = 0.30–0.40 mol CO2
mol CO2–1
Figure 6. The relationship between net photosynthesis (AN)and stomatal conductance (gs) in plants of Crepis triasii fromseven different populations from the Balearic Islands grown in acommon environment in Cambrils. Six of the populations (filledcircles) came from sites with annual precipitation ranging from400 to 600 mm year-1, while another population (empty circle)came from Cabrera, a small islet with an annual precipitationlower than 600 mm year-1. The values of AN/gs and gm/gs aregiven. Data are average � SE of five to eight replicates perpopulation. gm, mesophyll conductance.
614 J. Flexas et al.
© 2007 The AuthorsJournal compilation © 2007 Blackwell Publishing Ltd, Plant, Cell and Environment, 31, 602–621

well as modelling efforts to include a finite and variable gm
in whole-plant photosynthesis models.In addition to photosynthesis models, carbon isotope
discrimination models (Farquhar, O’Leary & Berry 1982;Evans et al. 1986) may also be affected by gm. While Evanset al. (1986) already included a term for gm in their isotopediscrimination model, in practice, this is often neglected. Itis usually assumed that most of the leaf discriminationagainst 13C is due to discrimination by Rubisco and phos-phoenolpyruvate (PEP) carboxylase, with another minorfractionation caused by CO2 diffusion in air through thestomata. As a result, 13C discrimination (D) is proportionalto the Ci/Ca ratio, and d13C in leaf dry matter is interpretedas resulting from the ‘mean leaf-life’ Ci/Ca ratio, which canbe related to intrinsic WUE (AN/gs). Therefore, d13C in leafdry matter has been used as a long-term estimation tocompare WUE between species or genotypes. However,differences in d13C may correlate more precisely with Cc/Ca
than with Ci/Ca (Le Roux et al. 2001). Theoretical estima-tions reveal that differences in leaf dry matter d13C as largeas 2–4‰ can be accounted by differences in gm, with nodifference in WUE (Le Roux et al. 2001; Warren & Adams2006). Experimental data by Hanba et al. (2003) confirmedthese estimations. These authors showed that highland andlowland Polygonum plants presented identical AN/gs butdiffered by >3‰ in leaf dry matter d13C because of largedifferences in gm. Similar results were observed by Flexaset al. (2006b) in transgenic tobacco plants specificallyaffected in gm through modification of aquaporin NtAQP1expression (Fig. 7). Substantial differences (1.5‰) werefound in leaf d13C between different lines with only smallchanges in their Ci/Ca ratio, which weakens the correlationbetween d13C and WUE (Fig. 7a), while d13C was stronglycorrelated with Cc/Ca (Fig. 7b) and gm (Fig. 7c).
Therefore, the existing evidence supports the idea thatdiscrimination during CO2 diffusion within the leaf shouldnot be neglected when using carbon isotope discriminationmodels to assess plant WUE.
CONCLUSIONS AND FUTURE PROSPECTS
Substantial evidence has accumulated in the past twodecades showing that mesophyll conductance to CO2 isfinite and highly variable, and that it reduces Cc below Ci,therefore limiting photosynthesis. gm has been determinedin more than a hundred species, and under several environ-mental conditions. The present review shows that gm differsamong plant functional groups, and that it acclimates andresponds both in the long (days, weeks) and short (minutes,hours) terms to changes in environmental variables suchas light, temperature, CO2, nitrogen and water availability,among others, as well as with leaf development and ageing.
Concerning the factors that determine gm, it has beenshown that leaf structural traits determine gm only partially,while an important part of its regulation seems to have ametabolic origin, possibly related to aquaporins and/or car-bonic anhydrase, and perhaps other physiological traits.From the ecological viewpoint, it has been stressed that gm
can help in understanding the ecological and evolutionaryaspects of plants. On the other hand, from the agronomicalviewpoint, gm could help to improve WUE more efficientlythan to modify gs. Finally, it has been discussed how ignoringgm would result in errors in photosynthesis parameteriza-tion, modelling and scaling up from leaf to whole plant, as
Ci / Ca
0.3 0.4 0.5 0.6 0.7
d 13 (
‰)
d 13 (
‰)
d 13 (
‰)
–30.5
–30.0
–29.5
–29.0
–28.5
–28.0(a)
gm (mol CO2 m–2 s–1 bar–1)
0.0 0.1 0.2 0.3 0.4 0.5
–30.5
–30.0
–29.5
–29.0
–28.5
–28.0C
c / Ca
0.3 0.4 0.5 0.6 0.7
–30.5
–30.0
–29.5
–29.0
–28.5
–28.0
R2 = 0.89
R2 = 0.99
(b)
(c)
Figure 7. The relationship between d13C in leaf dry matter andthe instantaneous ratios Ci/Ca (a) and Cc/Ci (b), and gm (c) intransgenic tobacco differing in the expression of aquaporinNtAQP1. Symbols indicate wild-type (CAS, empty circles or CO,empty triangles), antisense (AS, filled circles) and over-expressing(O, filled triangles) plants. Values are means � SE of sixreplicates per genotype. Redrawn from Flexas et al. (2006b).gm, mesophyll conductance.
Review: mesophyll conductance to CO2 615
© 2007 The AuthorsJournal compilation © 2007 Blackwell Publishing Ltd, Plant, Cell and Environment, 31, 602–621
well as lead to misleading interpretations of carbon isotopediscrimination data.
Some research priorities for the near future must be high-lighted. Among these are
1 To further analyse how gm responds to environmentalfactors, particularly to temperature,VPD and deficienciesin different nutrients. We suggest that studying theresponses to deficiencies of phosphorous, zinc andcalcium may be of particular interest given the involve-ment of these elements in the function of aquaporinsand/or carbonic anhydrases.
2 To fully elucidate the physiological and molecularmechanisms involved in gm regulation, and especially howthese respond to environmental changes. To achieve thisgoal, different approaches may be used: firstly, to analysethe response of gm to different plant hormones, in orderto understand the patterns of its regulation; secondly, toperform ecophysiological studies where variations of gm
are determined together with variations in amountsand/or activities of aquaporins and carbonic anhydrase;finally, to increase the availability of transgenic plantswith alterations in carbonic anhydrases, aquaporins andother factors, to characterize the metabolic componentsdirectly involved in the regulation of gm.
3 To increase our knowledge of how changes in gm lead tothe evolution of genotypes with increased photosyntheticnitrogen and/or WUE. It would be especially desirable toundertake broad comparisons of different natural plantpopulations adapted to different environments and ofdifferent cultivars of crop species with differentadaptations.
4 To improve photosynthesis and isotope discriminationmodels to consider gm in an easy but accurate manner, inorder to increase their accuracy and to improve predic-tions of canopy photosynthesis, plant productivity andplant responses to climate change.
ACKNOWLEDGMENTS
Our studies on mesophyll conductance to CO2 were partlygranted by projects BFI2002-00772 and BFU2005-03102/BFI (Plan Nacional, Spain). M.R.-C. and A.D.-E. were ben-eficiaries of the ‘Programa Ramón y Cajal’ (M.E.C.), andJ.G. was granted a postdoctoral fellowship (M.E.C.). Weacknowledge helpful discussions about this subject with DrsTom Sharkey, Francesco Loreto, Joe Berry, Gabriel Cornicand Ichiro Terashima. We also acknowledge access tounpublished results and manuscripts, data bases and clari-fication about published issues to Drs Gilbert Ethier, JohnEvans, Bernard Genty, Ralf Kaldenhoff, Agu Laisk, ÜloNiinemets, Danny Tholen and Charles Warren.
REFERENCES
Aalto T. & Juurola E. (2002) A three-dimensional model of CO2
transport in airspaces and mesophyll cells of a silver birch leaf.Plant, Cell & Environment 25, 1399–1409.
Antonielli M., Pasqualini S., Batini P., Ederli L., Massacci A. &Loreto F. (2002) Physiological and anatomical characterizationof Phragmites australis leaves. Aquatic Botany 72, 55–66.
Aranda I., Pardos M., Puértolas J., Jiménez M.D. & Pardos J.A.(2007) Water-use efficiency in cork oak (Quercus suber) is modi-fied by the interaction of water and light availabilities. TreePhysiology 27, 671–677.
Béjaoui Z., Albouchi A., Abassi M. & El Aouni M.H. (2006) Influ-ence d’une hydromorphie modérée ou severe sur la productionde biomasse et les échanges gazeux de plants de peupliereuraméricain. Canadian Journal of Forest Research 36, 2654–2665.
Bernacchi C.J., Portis A.R., Nakano H., von Caemmerer S. & LongS.P. (2002) Temperature response of mesophyll conductance.Implications for the determination of Rubisco enzyme kineticsand for limitations to photosynthesis in vivo. Plant Physiology130, 1992–1998.
Bernacchi C.J., Morgan P.B., Ort D.R. & Long S.P. (2005) Thegrowth of soybean under free air [CO2] enrichment (FACE)stimulates photosynthesis while decreasing in vivo Rubiscocapacity. Planta 220, 434–446.
Black K., Davis P., McGrath J., Doherty P. & Osborne B. (2005)Interactive effects of irradiance and water availability on thephotosynthetic performance of Picea sitchensis seedlings: impli-cations for seedling establishment under different managementpractices. Annals of Forest Science 62, 413–422.
Bongi G. & Loreto F. (1989) Gas-exchange properties of salt-stressed olive (Olea europaea L.) leaves. Plant Physiology 90,1408–1416.
Brugnoli E. & Lauteri M. (1991) Effects of salinity on stomatalconductance, photosynthetic capacity, and carbon isotopediscrimination of salt-tolerant (Gossypium hirsutum L.) andsalt-sensitive (Phaseolus vulgaris L.) C3 non-halophytes. PlantPhysiology 95, 628–635.
Brugnoli E., Scartazza A., Lauteri M., Monteverdi M.C. & MáguasC. (1998) Carbon isotope discrimination in structural and non-structural carbohydrates in relation to productivity and adapta-tion to unfavourable conditions. In Stable Isotopes: Integration ofBiological, Ecological and Geochemical Processes (ed. H.Griffiths), pp. 133–144. BIOS Scientific Publishers, Oxford, UK.
von Caemmerer S. & Evans J.R. (1991) Determination of theaverage partial pressure of CO2 in chloroplasts from leaves ofseveral C3 plants. Australian Journal Plant Physiology 18, 287–305.
Centritto M., Loreto F. & Chartzoulakis K. (2003) The use of low[CO2] to estimate diffusional and non-diffusional limitations ofphotosynthetic capacity of salt-stressed olive saplings. Plant, Cell& Environment 26, 585–594.
Colman B. & Espie G.S. (1985) CO2 uptake and transport in leafmesophyll cells. Plant, Cell & Environment 8, 449–457.
Cornic G., Le Gouallec J.L., Briantais J.M. & Hodges M. (1989)Effect of dehydration and high light on photosynthesis of two C3
plants. Phaseolus vulgaris L. and Elastostema repens (hour.) Hallf. Planta 177, 84–90.
Delfine S., Alvino A., Zacchini M. & Loreto F. (1998) Conse-quences of salt stress on conductance to CO2 diffusion, Rubiscocharacteristics and anatomy of spinach leaves. Australian Journalof Plant Physiology 25, 395–402.
Delfine S., Alvino A., Villani M.C. & Loreto F. (1999) Restrictionsto carbon dioxide conductance and photosynthesis in spinachleaves recovering from salt stress. Plant Physiology 119, 1101–1106.
Delfine S., Loreto F. & Alvino A. (2001) Drought-stress effects onphysiology, growth and biomass production of rainfed and irri-gated bell pepper plants in the Mediterranean region. Journal ofAmerican Society of Horticultural Sciences 126, 297–304.
616 J. Flexas et al.
© 2007 The AuthorsJournal compilation © 2007 Blackwell Publishing Ltd, Plant, Cell and Environment, 31, 602–621
Delfine S., Tognetti R., Loreto F. & Alvino A. (2002) Physiologicaland growth responses to water stress in field-grown bell pepper(Capsicum annuum L.). Journal of Horticultural Science andBiotechnology 77, 697–704.
Delfine S., Loreto F., Pinelli P., Tognetti R. & Alvino A. (2005)Isoprenoids content and photosynthetic limitations in rosemaryand spearmint plants under water stress. Agriculture, Ecosystemsand Environment 106, 243–252.
De Lucia E.H., Whitehead D. & Clearwater M.J. (2003) The rela-tive limitation of photosynthesis by mesophyll conductance inco-occurring species in a temperate rainforest dominated by theconifer Dacrydium cupressinum. Functional Plant Biology 30,1197–1204.
Diaz-Espejo A., Walcroft S., Fernández J.E., Hafidi B., Palomo M.J.& Girón I.F. (2006) Modeling photosynthesis in olive leavesunder drought conditions. Tree Physiology 26, 1445–1456.
Diaz-Espejo A., Nicolás E. & Fernández J.E. (2007) Seasonal evo-lution of diffusional limitations and photosynthetic capacity inolive under drought. Plant, Cell & Environment 30, 922–933.
Di Marco G., Manes F., Tricoli D. & Vitale E. (1990) Fluorescenceparameters measured concurrently with net photosynthesis toinvestigate chloroplastic CO2 concentration in leaves of Quercusilex L. Journal of Plant Physiology 136, 538–543.
Düring H. (2003) Stomatal and mesophyll conductances controlCO2 transfer to chloroplasts in leaves of grapevine (Vitis viniferaL.). Vitis 42, 65–68.
Eckert M., Biela A., Siefritz F. & Kaldenhoff R. (1999) New aspectsof plant aquaporin regulation and specificity. Journal of Experi-mental Botany 50, 1541–1545.
Eichelmann H. & Laisk A. (1999) Ribulose-1,5-bisphosphatecarboxylase/oxygenase content, assimilatory charge, and meso-phyll conductance in leaves. Plant Physiology 119, 179–189.
Eichelmann H., Oja V., Rasulov B., Padu E., Bichele I., Pettai H.,Möls T., Kasparova I., Vapaavuori E. & Laisk A. (2004a) Pho-tosynthetic parameters of birch (Betula pendula Roth) leavesgrowing in normal and CO2- and O3-enriched atmospheres.Plant, Cell & Environment 27, 479–495.
Eichelmann H., Oja V., Rasulov B., Padu E., Bichele I., Pettai H.,Niinemets Ü. & Laisk A. (2004b) Development of leaf photo-synthetic parameters in Betula pendula Roth leaves: correlationswith photosystem I density. Plant Biology 6, 307–318.
Ennahli S. & Earl H.J. (2005) Physiological limitations to photo-synthetic carbon assimilation in cotton under water stress. CropScience 45, 2374–2382.
Epron D., Godard G., Cornic G. & Genty B. (1995) Limitation ofnet CO2 assimilation rate by internal resistances to CO2 transferin the leaves of two tree species (Fagus sylvatica and Castaneasativa Mill.) Plant, Cell & Environment 18, 43–51.
Ethier G.H. & Livingston N.J. (2004) On the need to incorporatesensitivity to CO2 transfer conductance into the Farquhar-vonCaemmerer-Berry leaf photosynthesis model. Plant, Cell &Environment 27, 137–153.
Ethier G.H., Livingston N.J., Harrison D.L., Black T.A. & MoranJ.A. (2006) Low stomatal and internal conductance to CO2
versus Rubisco deactivation as determinants of the photosyn-thetic decline of ageing evergreen leaves. Plant, Cell & Environ-ment 29, 2168–2184.
Evans J.R. (1983) Nitrogen and photosynthesis in the flag leaf ofwheat (Triticum aestivum L.). Plant Physiology 72, 297–302.
Evans J.R. & von Caemmerer S. (1996) Carbon dioxide diffusioninside leaves. Plant Physiology 110, 339–346.
Evans J.R. & Loreto F. (2000) Acquisition and diffusion of CO2 inhigher plant leaves. In Photosynthesis: Physiology and Metabo-lism (eds R.C. Leegood, T.D. Sharkey & S. von Caemmerer),pp. 321–351. Kluwer Academic Publishers, Dordrecht, theNetherlands.
Evans J.R. & Terashima I. (1988) Photosynthetic characteristics ofspinach leaves grown with different nitrogen treatments. Plant,and Cell Physiology 29, 157–165.
Evans J.R. & Vellen L. (1996) Wheat cultivars differ in transpira-tion efficiency and CO2 diffusion inside their leaves. In CropResearch in Asia:Achievements and Perspective (eds R. Ishii & T.Horie), pp. 326–329. Asian Crop Science Association, Tokyo,Japan.
Evans J.R., Sharkey T.D., Berry J.A. & Farquhar G.D. (1986)Carbon isotope discrimination measured concurrently with gasexchange to investigate CO2 diffusion in leaves of higher plants.Australian Journal of Plant Physiology 13, 281–292.
Evans J.R., von Caemmerer S., Setchell B.A. & Hudson G.S. (1994)The relationship between CO2 transfer conductance and leafanatomy in transgenic tobacco with a reduced content ofRubisco. Australian Journal of Plant Physiology 21, 475–495.
Fabre N., Reiter I.M., Becuwe-Linka N., Genty B. & Rumeau D.(2007) Characterization and expression analysis of genes encod-ing a and b carbonic anhydrases in Arabidopsis. Plant, Cell &Environment 30, 617–629.
Farquhar G.D. & Raschke K. (1978) On the resistance to transpi-ration of the sites of evaporation within the leaf. Plant Physiol-ogy 61, 1000–1005.
Farquhar G.D. & Sharkey T.D. (1982) Stomatal conductance andphotosynthesis. Annual Review of Plant Physiology 33, 317–345.
Farquhar G.D., von Caemmerer S. & Berry J.A. (1980) A biochemi-cal model of photosynthetic CO2 assimilation in leaves of C3
species. Planta 149, 78–90.Farquhar G.D., O’Leary M.H. & Berry J.A. (1982) On the relation-
ship between carbon isotope discrimination and the intercellularcarbon dioxide concentration in leaves. Australian Journal ofPlant Physiology 9, 121–137.
Fila G., Badeck F.W., Meyer S., Cerovic Z. & Ghashghaie J. (2006)Relationships between leaf conductance to CO2 diffusion andphotosynthesis in micropropagated grapevine plants, before andafter ex vitro acclimatization. Journal of Experimental Botany 57,2687–2695.
Flexas J., Bota J., Escalona J.M., Sampol B. & Medrano H. (2002)Effects of drought on photosynthesis in grapevines under fieldconditions: an evaluation of stomatal and mesophyll limitations.Functional Plant Biology 29, 461–471.
Flexas J., Bota J., Loreto F., Cornic G. & Sharkey T.D. (2004)Diffusive and metabolic limitations to photosynthesis underdrought and salinity in C3 plants. Plant Biology 6, 269–279.
Flexas J., Ribas-Carbó M., Bota J., Galmés J., Henkle M., Martínez-Cañellas S. & Medrano H. (2006a) Decreased Rubisco activityduring water stress is not induced by decreased relative watercontent but related to conditions of low stomatal conductanceand chloroplast CO2 concentration. New Phytologist 172, 73–82.
Flexas J., Ribas-Carbó M., Hanson D.T., Bota J., Otto B., Cifre J.,McDowell N., Medrano H. & Kaldenhoff R. (2006b) Tobaccoaquaporin NtAQP1 is involved in mesophyll conductance toCO2 in vivo. Plant Journal 48, 427–439.
Flexas J., Bota J., Galmés J., Medrano H. & Ribas-Carbó M. (2006c)Keeping a positive carbon balance under adverse conditions:responses of photosynthesis and respiration to water stress.Physiologia Plantarum 127, 343–352.
Flexas J., Diaz-Espejo A., Galmés J., Kaldenhoff R., Medrano H. &Ribas-Carbo M. (2007a) Rapid variations of mesophyll conduc-tance in response to changes in CO2 concentration aroundleaves. Plant, Cell & Environment 30, 1284–1298.
Flexas J., Ortuño M.F., Ribas-Carbó M., Díaz-Espejo A., Florez-Sarasa I.D. & Medrano H. (2007b) Mesophyll conductance toCO2 in Arabidopsis thaliana. New Phytologist 175, 501–511.
Flowers M.D., Fiscus E.L., Burkey K.O., Booker F.L. & DuboisJ.-J.B. (2007) Photosynthesis, chlorophyll fluorescence, and yield
Review: mesophyll conductance to CO2 617
© 2007 The AuthorsJournal compilation © 2007 Blackwell Publishing Ltd, Plant, Cell and Environment, 31, 602–621
of snap bean (Phaseolus vulgaris L.) genotypes differing insensitivity to ozone. Environmental and Experimental Botany 61,190–198.
Gaastra P. (1959) Photosynthesis of crop plants as influenced bylight, carbon dioxide, temperature, and stomatal diffusion resis-tance. Mededelingen van Landbouwhogeschool te Wageningen,Nederland 59, 1–68.
Galmés J., Medrano H. & Flexas J. (2006) Acclimation of Rubiscospecificity factor to drought in tobacco: discrepancies between invitro and in vivo estimations. Journal of Experimental Botany 57,3659–3667.
Galmés J., Abadía A., Medrano H. & Flexas J. (2007a) Photo-synthesis and photoprotection responses to water stressing thewild-extinct plant Lysimachia minoricensis. Environmental andExperimental Botany 60, 308–317.
Galmés J., Medrano H. & Flexas J. (2007b) Photosynthetic limita-tions in response to water stress and recovery in Mediterraneanplants with different growth forms. New Phytologist 175, 81–93.
Galmés J., Medrano H. & Flexas J. (2007c) Photosynthesis andphotoinhibition in response to drought in a pubescent (var.minor) and a glabrous (var. palaui) variety of Digitalis minor.Environmental and Experimental Botany 60, 105–111.
Geber M.A. & Dawson T.A. (1990) Genetic variation in and cova-riation between leaf gas exchange, morphology, and develop-ment in Polygonum arenastrum, an annual plant. Oecologia 85,153–158.
Genty B., Meyer S., Piel C., Badeck F. & Liozon R. (1998) CO2
diffusion inside leaf mesophyll of ligneous plants. In Photo-synthesis: Mechanisms and Effects (ed. G. Garab), pp. 3961–3967.Kluwer Academic Publishers, Dordrecht, the Netherlands.
Gillon J.S. & Yakir D. (2000) Internal conductance to CO2 diffusionand C18OO discrimination in C3 leaves. Plant Physiology 123,201–213.
Gorton H.L., Herbert S.K. & Vogelmann T.C. (2003) Photoacousticanalysis indicates that chloroplast movement does not alterliquid-phase CO2 diffusion in leaves of Alocasia brisbanensis.Plant Physiology 132, 1529–1539.
Grassi G. & Magnani F. (2005) Stomatal, mesophyll conductanceand biochemical limitations to photosynthesis as affected bydrought and leaf ontogeny in ash and oak trees. Plant, Cell &Environment 28, 834–849.
Griffiths H., Cousins A.B., Badger M.R. & von Caemmerer S.(2007) Discrimination in the dark. Resolving the interplaybetween metabolic and physical constraints to phospho-enolpyruvate carboxylase activity during the Crassulacean AcidMetabolism cycle. Plant Physiology 143, 1055–1067.
Hanba Y.T., Miyazawa S.-I. & Terashima I. (1999) The influence ofleaf thickness on the CO2 transfer conductance and leaf stablecarbon isotope ratio for some evergreen tree species in Japanesewarm temperate forests. Functional Ecology 13, 632–639.
Hanba Y.T., Miyazawa S.-I., Kogami H. & Terashima I. (2001)Effects of leaf age on internal CO2 transfer conductance andphotosynthesis in tree species having different types of shootphenology. Australian Journal Plant Physiology 28, 1075–1084.
Hanba Y.T., Kogami H. & Terashima I. (2002) The effect of growthirradiance on leaf anatomy and photosynthesis in Acer speciesdiffering in light demand. Plant, Cell & Environment 25, 1021–1030.
Hanba Y.T., Kogami H. & Terashima I. (2003) The effect of internalCO2 conductance on leaf carbon isotope ratio. Isotopes inEnvironmental and Health Studies 39, 5–13.
Hanba Y.T., Shibasaka M., Hayashi Y., Hayakawa T., Kasamo K.,Terashima I. & Katsuhara M. (2004) Overexpression of thebarley aquaporin HvPIP2;1 increases internal CO2 conductanceand CO2 assimilation in the leaves of transgenic rice plants. PlantCell Physiology 45, 521–529.
Harley P.C. & Baldocchi D.D. (1995) Scaling carbon dioxide andwater vapour exchange from leaf to canopy in a deciduousforest. I. Leaf model parametrization. Plant, Cell & Environment18, 1146–1156.
Harley P.C., Loreto F., Di Marco G. & Sharkey T.D. (1992)Theoretical considerations when estimating the mesophyllconductance to CO2 flux by the analysis of the response ofphotosynthesis to CO2. Plant Physiology 98, 1429–1436.
Hikosaka K. (2004) Interspecific difference in the photosynthesis-nitrogen relationship: patterns, physiological causes, and ecologi-cal importance. Journal of Plant Research 117, 481–494.
Hikosaka K., Hanba Y.T., Hirose T. & Terashima I. (1998) Photo-synthetic nitrogen-use efficiency in leaves of woody herbaceousspecies. Functional Ecology 12, 896–905.
Jarvis P.G. & Slatyer R.O. (1970) The role of the mesophyll cell wallin leaf transpiration. Planta 90, 303–322.
Jones H.G. (1973) Moderate-term water stresses and associatedchanges in some photosynthetic parameters in cotton. New Phy-tologist 72, 1095–1105.
Jones H.G. & Slatyer R.O. (1972a) Effects of intercellular resis-tances on estimates of the intracellular resistance to CO2 uptakeby plant leaves. Australian Journal of Biological Sciences 25,443–453.
Jones H.G. & Slatyer R.O. (1972b) Estimation of the transport andcarboxylation components of the intracellular limitation to leafphotosynthesis. Plant Physiology 50, 283–288.
Juszczuk I.M., Flexas J., Szal B., Dabrowska Z., Ribas-Carbo M. &Rychter A.M. (2007) Effect of mitochondrial genome rearrange-ment on respiratory activity, photosynthesis, photorespiration,and energy status of MSC16 cucumber (Cucumis sativus L.)mutant. Physiologia Plantaurm 131, 527–541.
Juurola E., Aalto T., Thum T., Vesala T. & Hari P. (2005) Tempera-ture dependence of leaf-level CO2 fixation: revising biochemicalcoefficients through analysis of leaf three-dimensional structure.New Phyologist 166, 205–215.
Kaldenhoff R. & Fischer M. (2006) Aquaporins in plants. ActaPhysiologica 187, 169–176.
Kjellbom P., Larsson C., Johanson I., Karlsson M. & Johanson U.(1999) Aquaporins and water homeostasis in plants. Trends inPlant Science 4, 308–314.
Koç M., Barutçular C. & Genç I. (2003) Photosynthesis and pro-ductivity of old and modern durum wheats in a Mediterraneanenvironment. Crop Science 43, 2089–2098.
Kogami H., Hanba Y.T., Kibe T., Terashima I. & Mazusawa T.(2001) CO2 transfer conductance, leaf structure and carbonisotope composition of Polygonum cuspidatum leaves from lowand high altitudes. Plant, Cell & Environment 24, 529–538.
Laisk A. & Loreto F. (1996) Determining photosynthetic param-eters from leaf CO2 exchange and chlorophyll fluorescence.Ribulose-1,5-bisphosphate carboxylase/oxygenase specificityfactor, dark respiration in the light, excitation distributionbetween photosystems, alternative electron transport rate, andmesophyll diffusion resistance. Plant Physiology 110, 903–912.
Laisk A. & Sumberg A. (1994) Partitioning of the leaf CO2
exchange into components using CO2 exchange and fluorescencemeasurements. Plant Physiology 106, 689–695.
Laisk A., Oja V., Rasulov B., Rämma H., Eichelmann H., Kaspa-rova I., Pettai H., Padu E. & Vapaavuori E. (2002) A computer-operated routine of gas exchange and optical measurements todiagnose photosynthetic apparatus in leaves. Plant, Cell & Envi-ronment 25, 923–943.
Laisk A., Eichelmann H., Oja V., Rasulov B., Padu E., Bichele I.,Pettai H. & Kull O. (2005) Adjustment of leaf photosynthesis toshade in a natural canopy: rate parameters. Plant, Cell & Envi-ronment 28, 375–388.
Lauer M.J. & Boyer J.S. (1992) Internal CO2 measured directly in
618 J. Flexas et al.
© 2007 The AuthorsJournal compilation © 2007 Blackwell Publishing Ltd, Plant, Cell and Environment, 31, 602–621

leaves.Abscisic acid and low leaf water potential cause opposingeffects. Plant Physiology 98, 1310–1316.
Lauteri M., Scartazza A., Guido M.C. & Brugnoli E. (1997)Genetic variation in photosynthetic capacity, carbon isotopediscrimination and mesophyll conductance in provenances ofCastanea sativa adapted to different environments. FunctionalEcology 11, 675–683.
Le Roux X., Bariac T., Sinoquet H., Genty B., Piel C., Mariotti A.,Girardin C. & Richard P. (2001) Spatial distribution of leafwater-use efficiency and carbon isotope discrimination within anisolated tree crown. Plant, Cell & Environment 24, 1021–1032.
Lloyd J., Syvertsen J.P., Kriedemann P.E. & Farquhar G.D. (1992)Low conductances for CO2 diffusion from stomata to the sites ofcarboxylation in leaves of woody species. Plant, Cell & Environ-ment 15, 873–899.
Long S.P. & Bernacchi C.J. (2003) Gas exchange measurements,what can they tell us about the underlying limitations to photo-synthesis? Procedures and sources of error. Journal of Experi-mental Botany 54, 2393–2401.
Loreto F., Harley P.C., Di Marco G. & Sharkey T.D. (1992) Esti-mation of mesophyll conductance to CO2 flux by three differentmethods. Plant Physiology 98, 1437–1443.
Loreto F., Di Marco G., Tricoli D. & Sharkey T.D. (1994) Measure-ments of mesophyll conductance, photosynthetic electron trans-port and alternative electron sinks of field grown wheat leaves.Photosynthesis Research 41, 397–403.
Loreto F., Centritto M. & Chartzoulakis K. (2003) Photosyntheticlimitations in olive cultivars with different sensitivity to saltstress. Plant, Cell & Environment 26, 595–601.
Makino A., Sakashita H., Hidema J., Mae T., Ojima K. & OsmondB. (1992) Distinctive responses of ribulose-1,5-bisphosphate car-boxylase and carbonic anhydrase in wheat leaves to nitrogennutrition and their possible relationship to CO2 transfer resis-tance. Plant Physiology 100, 1737–1743.
Manter D.K. & Kerrigan J. (2004) A/Ci curve analysis across arange of woody plant species: influence of regression analysisparameters and mesophyll conductance. Journal ExperimentalBotany 55, 2581–2588.
Massacci A. & Loreto F. (2001) Diffusive resistances to CO2 entryin the leaves and their limitations to photosynthesis. In Hand-book of Plant and Crop Physiology (ed. M. Pessarakli), pp. 327–336. Kluwer Academic Publishers, Dordrecht, the Netherlands.
Maxwell K., von Caemmerer S. & Evans J.R. (1997) Is a low inter-nal conductance to CO2 diffusion a consequence of succulence inplants with Crassulacean Acid Metabolism? Australian Journalof Plant Physiology 24, 777–786.
Miyazawa S.I. & Terashima I. (2001) Slow development of leafphotosynthesis in an evergreen broad-leaved tree, Castanopsissieboldii: relationships between leaf anatomical characteristicsand photosynthetic rate. Plant, Cell & Environment 24, 279–291.
Moldau H. & Kull O. (1993) Differential susceptibility of meso-phyll CO2 exchange to ozone in soil- or sand-grown Phaseolusvulgaris L. plants. Photosynthetica 28, 37–44.
Monti A., Brugnoli E., Scartazza A. & Amaducci M.T. (2006) Theeffect of transient and continuous drought on yield, photosyn-thesis and carbon isotope discrimination in sugar beet (Betavulgaris L.). Journal of Experimental Botany 57, 1253–1262.
Morison J.I.L. & Lawson T. (2007) Does lateral gas diffusion inleaves matter? Plant, Cell & Environment 30, 1072–1085.
Morison J.I.L., Gallouët E., Lawson T., Cornic G., Herbin R. &Baker N.R. (2005) Lateral diffusion of CO2 in leaves is notsufficient to support photosynthesis. Plant Physiology 139, 254–266.
Niinemets U. & Sack L. (2005) Structural determinants of leaf-harvesting capacity and photosynthetic potentials. In Progress in
Botany (ed. W. Beyschlag), pp. 385–419. Springer Verlag, Berlin,Germany.
Niinemets U., Cescatti A., Rodeghiero M. & Tosens T. (2005)Leaf internal diffusion conductance limits photosynthesismore strongly in older leaves of Mediterranean evergreenbroad-leaved species. Plant, Cell & Environment 28, 1552–1566.
Niinemets U., Cescatti A., Rodeghiero M. & Tosens T. (2006)Complex adjustments of photosynthetic potentials and internaldiffusion conductance to current and previous light availabilitiesand leaf age in Mediterranean evergreen species Quercus ilex.Plant, Cell & Environment 28, 1552–1566.
Nobel P.S. (1983) Biophysical Plant Physiology and Ecology. W.H.Freeman & Co., San Francisco, CA, USA.
Parkhurst D.F. (1994) Diffusion of CO2 and other gases insideleaves. New Phytologist 126, 449–479.
Parkhurst D.F. & Mott K.A. (1990) Intercellular diffusion limits toCO2 uptake in leaves. Studies in air and helox. Plant Physiology94, 1024–1032.
Patakas A., Kofidis G. & Bosabalidis A.M. (2003) The relationshipbetween CO2 transfer mesophyll resistance and photosyntheticefficiency in grapevine cultivars. Scientia Horticulturae 97, 255–263.
Peisker M. & Apel H. (2001) Inhibition by light of CO2 evolutionfrom dark respiration: comparison of two gas exchange methods.Photosynthesis Research 70, 291–298.
Peña-Rojas K., Aranda X., Joffre R. & Fleck I. (2005) Leaf mor-phology, photochemistry and water status changes in resproust-ing Quercus ilex during drought. Functional Plant Biology 32,117–130.
Piel C. (2002) Diffusion du CO2 dans le mésophylle des plantes àmétabolisme C3. PhD thesis, Université Paris XI Orsay, Paris,France.
Piel C., Frak E., Le Roux X. & Genty B. (2002) Effect of localirradiance on CO2 transfer conductance of mesophyll in walnut.Journal of Experimental Botany 53, 2423–2430.
Pieruschka R., Schurr U. & Jahnke S. (2005) Lateral gas diffusioninside leaves. Journal of Experimental Botany 56, 857–864.
Pons T.L. & Welschen R.A.M. (2003) Midday depression of netphotosyntheis in the tropical rainforest tree Eperua grandiflora:contributions of stomatal and internal conductances, respirationand Rubisco functioning. Tree Physiology 23, 937–947.
Pons T.L. & Westbeek M.H.M. (2004) Analysis of differences inphotosynthetic nitrogen-use efficiency between four contrastingspecies. Physiologia Plantarum 122, 68–78.
Priault P., Tcherkez G., Cornic G., De Paepe R., Naik R., Ghash-ghaie J. & Streb P. (2006) The lack of mitochondrial complex I ina CMSII mutant of Nicotiana sylvestris increases photorespira-tion through an increased internal resistance to CO2 diffusion.Journal of Experimental Botany 57, 3195–3207.
Price D., von Caemmerer S., Evans J.R., Yu J.W., Lloyd J., Oja V.,Kell P., Harrison K., Gallagher A. & Badger M. (1994) Specificreduction of chloroplast carbonic anhydrase activity by antisenseRNA in transgenic tobacco plants has a minor effect on photo-synthetic CO2 assimilation. Planta 193, 331–340.
Renou J.-L., Gerbaud A., Just D. & André M. (1990) Differingsubstomatal and chloroplastic concentrations in water-stressedwheat. Planta 182, 415–419.
Ridolfi M. & Dreyer E. (1997) Responses to water stress in anABA-unresponsive hybrid poplar (Populus koreana x tri-chocarpa cv. Peace). III. Consequences for photosyntheticcarbon assimilation. New Phytologist 135, 31–40.
Ripley B.S., Gilbert M.E., Ibrahim D.G. & Osborne C.P. (2007)Drought constraints on C4 photosynthesis: stomatal and meta-bolic limitations in C3 and C4 subspecies of Alloteropsis semi-alata. Journal of Experimental Botany 58, 1351–1363.
Review: mesophyll conductance to CO2 619
© 2007 The AuthorsJournal compilation © 2007 Blackwell Publishing Ltd, Plant, Cell and Environment, 31, 602–621
Rogers A., Ellsworth D.S. & Humphries S.W. (2001) Possible expla-nation of the disparity between the in vitro and in vivo measure-ments of Rubisco activity: a study in loblolly pine grown inelevated pCO2. Journal of Experimental Botany 52, 1555–1561.
Roupsard O., Gross P. & Dreyer E. (1996) Limitation of photosyn-thetic activity by CO2 availability in the chloroplasts of oakleaves from different species and during drought. Annales ofSciences Forestières 53, 243–254.
Sampol B., Bota J., Riera D., Medrano H. & Flexas J. (2003) Analy-sis of the virus-induced inhibition of photosynthesis in malmseygrapevines. New Phytologist 160, 403–412.
Samsuddin Z. & Impens I. (1979) Photosynthesis and diffusionresistances to carbon dioxide in Hevea brasiliensis muel. agr.clones. Oecologia 37, 361–363.
Sánchez-Rodríguez J., Pérez P. & Martínez-Carrasco R. (1999)Photosynthesis, carbohydrate levels and chlorophyllfluorescence-estimated intercellular CO2 in water-stressedCasuarina equisetifolia Forst. and Forst. Plant, Cell & Environ-ment 22, 867–873.
Sasaki H., Samejima M. & Ishii R. (1996) Analysis by delta-13Cmeasurement on mechanism of cultivar difference in leaf pho-tosynthesis on rice (Oryza sativa L.). Plant and Cell Physiology37, 1161–1166.
Scartazza A., Lauteri M., Guido M.C. & Brugnoli E. (1998) Carbonisotope discrimination in leaf and stem sugars, water-use effi-ciency and mesophyll conductance during different developmen-tal stages in rice subjected to drought. Australian Journal of PlantPhysiology 25, 489–498.
Sharkey T.D., Vassey T.L., Vanderveer P.J. & Vierstra R.D. (1991)Carbon metabolism enzymes and photosynthesis in transgenictobacco (Nicotiana tabaccum L.) having excess phytochrome.Planta 185, 287–296.
Sharkey T.D., Bernacchi C.J., Farquhar G.D. & Singsaas E.L. (2007)Fitting photosynthetic carbon dioxide response curves for C3
leaves. Plant, Cell & Environment 30, 1035–1040.Shi Z., Liu S., Liu X. & Centritto M. (2006) Altitudinal variation in
photosynthetic capacity, diffusional conductance and d 13C ofbutterfly bush (Buddleja davidii) plants growing at high eleva-tions. Physiologia Plantarum 128, 722–731.
Singsaas E.L., Ort D.R. & De Lucia E.H. (2003) Elevated CO2
effects on mesophyll conductance and its consequences for inter-preting photosynthetic physiology. Plant, Cell & Environment27, 41–50.
Syvertsen J.P., Lloyd J., McConchie C., Kriedemann P.E. &Farquhar G.D. (1995) On the relationship between leaf anatomyand CO2 diffusion through the mesophyll of hypostomatousleaves. Plant, Cell & Environment 18, 149–157.
Terashima I. & Ono K. (2002) Effects of HgCl2 on CO2 dependenceof leaf photosynthesis: evidence indicating involvement of aqua-porins in CO2 diffusion across the plasma membrane. Plant andCell Physiology 43, 70–78.
Terashima I., Miyazawa S.-I. & Hanba Y.T. (2001) Why are sunleaves thicker than shade leaves? – consideration based onanalyses of CO2 diffusion in the leaf. Journal of Plant Research114, 93–105.
Terashima I., Araya T., Miyazawa S.-I., Sone K. & Yano S. (2005)Construction and maintenance of the optimal photosyntheticsystems of the leaf, herbaceous plant and tree: an eco-developmental treatise. Annals of Botany 95, 507–519.
Terashima I., Hanba Y.T., Tazoe Y., Vyas P. & Yano S. (2006)Irradiance and phenotype: comparative eco-development of sunand shade leaves in relation to photosynthetic CO2 diffusion.Journal of Experimental Botany 57, 343–354.
Tholen D. (2005) Growth and photosynthesis in ethylene-insensitiveplants. PhD thesis, University of Utrecht, Utrecht, theNetherlands.
Tholen D., Boom C., Noguchi K. & Terashima I. (2007) The effectsof chloroplast movement on CO2 transfer conductance inArabidopsis thaliana. Plant and Cell Physiology 48, S95.
Tiwari A., Kumar P., Chawhaan P.H., Singh S. & Ansari S.A. (2006)Carbonic anhydrase in Tectona grandis: kinetics, stability,isozyme analysis and relationship with photosynthesis. TreePhysiology 26, 1067–1073.
Tournaire-Roux C., Sutka M., Javot H., Gout E., Gerbeau P., LuuD.-T., Bligny R. & Maurel C. (2003) Cytosolic pH regulatesroot water transport during anoxic stress through gating ofaquaporins. Nature 425, 393–397.
Tourneux C. & Peltier G. (1995) Effect of water deficit on photo-synthetic oxygen exchange measured using 18O2 and massspectrometry in Solanum tuberosum L. leaf discs. Planta 195,570–577.
Troughton J.H. & Slatyer R.O. (1969) Plant water status, leaftemperature, and the calculated mesophyll resistance to carbondioxide of cotton leaves. Australian Journal of BiologicalSciences 22, 815–827.
Uehlein N., Lovisolo C., Siefritz F. & Kaldenhoff R. (2003) Thetobacco aquaporin NtAQP1 is a membrane CO2 pore withphysiological functions. Nature 425, 734–737.
Velikova V., Tsonev T., Pinelli P., Alessio G.A. & Loreto F. (2005)Localized ozone fumigation system for studying ozone effects onphotosynthesis, respiration, electron transport rate and isopreneemission in field-grown Mediterranean species. Tree Physiology25, 1523–1532.
Vitousek P.M., Field C.B. & Matson P.A. (1990) Variation in foliard 13C in Hawaiian Metrosideros polymorpha: a case of internalresistance? Oecologia 84, 362–370.
Warren C.R. (2004) The photosynthetic limitation posed by inter-nal conductance to CO2 movement is increased by nutrientsupply. Journal of Experimental Botany 55, 2313–2321.
Warren C.R. (2006a) Estimating the internal conductance to CO2
movement. Functional Plant Biology 33, 431–442.Warren C.R. (2006b) Why does photosynthesis decrease with
needle age in Pinus pinaster? Trees 20, 157–164.Warren C.R. (2008) Does growth temperature affect the tempera-
ture response of photosynthesis and internal conductance toCO2? A test with Eucalyptus regnans. Tree Physiology 28, 11–19.
Warren C.R. & Adams M.A. (2004) Evergreen trees do not maxi-mize instantaneous photosynthesis. Trends in Plant Science 9,270–274.
Warren C.R. & Adams M.A. (2006) Internal conductance does notscale with photosynthetic capacity: implications for carbonisotope discrimination and the economics of water and nitrogenuse in photosynthesis. Plant, Cell & Environment 29, 192–201.
Warren C.R. & Dreyer E. (2006) Temperature response of photo-synthesis and internal conductance to CO2: results from twoindependent approaches. Journal of Experimental Botany 57,3057–3067.
Warren C.R., Ethier G.H., Livingston N.J., Grant N.J., Turpin D.H.,Harrison D.L. & Black T.A. (2003) Transfer conductance insecond growth Douglas-fir (Pseudotsuga menziesii (Mirb.)Franco) canopies. Plant, Cell & Environment 26, 1215–1227.
Warren C.R., Livingston N.J. & Turpin D.H. (2004) Water stressdecreases the transfer conductance of Douglas-fir (Pseudotsugamenziensii) seedlings. Tree Physiology 24, 971–979.
Warren C.R., Löw M., Matyssek R. & Tausz M. (2007) Internalconductance to CO2 transfer of adult Fagus sylvatica: variationbetween sun and shade leaves and due to free-air ozonefumigation. Environmental and Experimental Botany 59, 130–138.
Williams T.G., Flanagan L.B. & Coleman J.R. (1996a) Photo-synthetic gas exchange and discrimination against 13CO2, andC18O16O in tobacco plants modified by an antisense construct to
620 J. Flexas et al.
© 2007 The AuthorsJournal compilation © 2007 Blackwell Publishing Ltd, Plant, Cell and Environment, 31, 602–621
have low chloroplastic carbonic anhydrase. Plant Physiology112, 319–326.
Williams M., Rastetter E.B., Fernandes D.N., Goulden M.L., WofsyS.C., Shaver G.R., Melillo J.M., Munger J.W., Fan S.-M. &Nadelhoffer K.J. (1996b) Modelling the soil-plant-atmospherecontinuum in a Quercus-Acer stand at Harvard Forest: the regu-lation of stomatal conductance by light, nitrogen and soil/planthydraulic properties. Plant, Cell & Environment 19, 911–927.
Wright I.J., Reich P.B., Westoby M., et al. (2004) The world-wideleaf economics spectrum. Nature 428, 821–827.
Xu L. & Baldocchi D.D. (2003) Seasonal trends in photosyntheticparameters and stomatal conductance of blue oak (Quercus dou-glasii) under prolonged summer drought and high temperature.Tree Physiology 23, 865–877.
Yamori W., Noguchi K., Hanba Y.T. & Terashima I. (2006) Effectsof internal conductance on the temperature dependence of thephotosynthetic rate in spinach leaves from contrasting growthtemperatures. Plant and Cell Physiology 47, 1069–1080.
Ye Q., Wiera B. & Steudle E. (2004) A cohesion/tension mecha-nism explains the gating of water channels (aquaporins) in Charainternodes by high concentration. Journal of ExperimentalBotany 55, 449–461.
Received 27 August 2007; received in revised form 19 October 2007;accepted for publication 23 October 2007
Review: mesophyll conductance to CO2 621
© 2007 The AuthorsJournal compilation © 2007 Blackwell Publishing Ltd, Plant, Cell and Environment, 31, 602–621