The nature of the voltage-dependent conductance of the hemocyanin channel
19
J. Membrane Biol. 25, 163-182 (1975) by Springer-Verlag New York Inc. 1975 The Nature of the Voltage-Dependent Conductance of the Hemocyanin Channel R. Latorre*, O. Alvarez, G. Ehrenstein, M. Espinoza, and J. Reyes Laboratory of Biophysics, National Institute of Neurological and Communicative Disorders and Stroke, National Institutes of Health, Bethesda, Maryland 20014, Departamento de Biologia, Facultad de Ciencias and Departamento de Fisiologia y Biofisica, Facultad de Medicina, Universidad de Chile, Santiago, Chile Received 13 May 1975; revised 4 August 1975 Summary. The electrical responses of individual hemocyanin channels in oxidized choles- terol membranes demonstrate that the voltage-dependentconductance of many-channel mem- branes arises from two different mechanisms. These are the voltage-dependent redistribution of channels among several discrete single-channel conductance states and the continuously voltage-dependent conductance of the single-channel states themselves. The relaxation time for the discrete conductance changes is of the order of seconds and the relaxation time of the continuous conductance changes is of the order 10-4 seconds. As salt concentration in the bathing medium is increased, the single-channel conductance first increases linearly and then saturates. The characteristics of the saturation curves suggest that the continuous conductance changes occur at the edges of the channel and that the mean time an ion spends in the channel is 4 nanoseconds. Hemocyanins are oxygen-transporting blood proteins occurring freely dissolved in the blood of many invertebrates. They contain 0.18 to 0.24% copper, probably univalent (van Bruggen, Wiebenga & Gruber, 1962a). Since the blood of invertebrates does not contain appreciable amounts of other proteins, hemocyanin can be easily purified. Electron-micrographs and ultracentrifugal analysis indicate that the hemocyanin molecule in dilute salt solution at neutral pH is roughly cylindrical in shape with a diameter of about 30 nmeters. At pH values lower than 5 and higher than 7, the molecule dissociates into two halves, and then into smaller units. Reversible association occurs if divalent cations are added to the media or if the pH is readjusted to 5-7 (van Bruggen et al., 1962a; van Bruggen, Wiebenga & Gruber, 1962 b; van Bruggen, Schuiten, Wiebenga & Gruber, 1963; Konings, Siezen & Gruber, 1969). * Present address': University of Chicago, Department of Pharmacological and Physiological Sciences, Chicago, Ill. 60637.
-
Upload
independent -
Category
Documents
-
view
1 -
download
0
Transcript of The nature of the voltage-dependent conductance of the hemocyanin channel

J. Membrane Biol. 25, 163-182 (1975) �9 by Springer-Verlag New York Inc. 1975
The Nature of the Voltage-Dependent Conductance of the Hemocyanin Channel
R. Latorre*, O. Alvarez, G. Ehrenstein, M. Espinoza, and J. Reyes
Laboratory of Biophysics, National Institute of Neurological and Communicative Disorders and Stroke, National Institutes of Health,
Bethesda, Maryland 20014, Departamento de Biologia, Facultad de Ciencias and Departamento de Fisiologia y Biofisica, Facultad de Medicina,
Universidad de Chile, Santiago, Chile
Received 13 May 1975; revised 4 August 1975
Summary. The electrical responses of individual hemocyanin channels in oxidized choles- terol membranes demonstrate that the voltage-dependent conductance of many-channel mem- branes arises from two different mechanisms. These are the voltage-dependent redistribution of channels among several discrete single-channel conductance states and the continuously voltage-dependent conductance of the single-channel states themselves. The relaxation time for the discrete conductance changes is of the order of seconds and the relaxation time of the continuous conductance changes is of the order 10-4 seconds. As salt concentration in the bathing medium is increased, the single-channel conductance first increases linearly and then saturates. The characteristics of the saturation curves suggest that the continuous conductance changes occur at the edges of the channel and that the mean time an ion spends in the channel is 4 nanoseconds.
Hemocyanins are oxygen-transporting blood proteins occurring freely
dissolved in the blood of many invertebrates. They contain 0.18 to 0.24%
copper, probably univalent (van Bruggen, Wiebenga & Gruber, 1962a). Since the blood of invertebrates does not contain appreciable amounts
of other proteins, hemocyanin can be easily purified. Electron-micrographs and ultracentrifugal analysis indicate that the hemocyanin molecule in
dilute salt solution at neutral p H is roughly cylindrical in shape with
a diameter of about 30 nmeters. At p H values lower than 5 and higher than 7, the molecule dissociates into two halves, and then into smaller
units. Reversible association occurs if divalent cations are added to the media or if the p H is readjusted to 5-7 (van Bruggen et al., 1962a; van Bruggen, Wiebenga & Gruber, 1962 b; van Bruggen, Schuiten, Wiebenga & Gruber, 1963; Konings, Siezen & Gruber, 1969).
* Present address': University of Chicago, Department of Pharmacological and Physiological Sciences, Chicago, Ill. 60637.

164 R. Latorre, O. Alvarez, G. Ehrenstein, M. Espinoza, and J. Reyes
There is strong evidence that the conductance changes occurring during electrical activity in excitable cells are due to the opening and closing of ionic channels (Hille, 1970; Ehrenstein & Lecar, 1972). However, all knowledge of the properties of these ion-conductive pathways comes from macroscopic conductance measurements. In lipid bilayers, on the other hand, the electrical properties of individual channels can be studied. Exam- ples are EIM (Bean, Shepherd, Chan & Eichner, 1969), gramicidin A (Hladky & Haydon, 1970), and alamethicin (Gordon & Haydon, 1972). Alamethicin and EIM exhibit strongly voltage-dependent conductance, and it has been possible to show that the electrical properties of a many- channel membrane can be explained in terms of the properties of the single-channel conductance (Ehrenstein, Lecar & Nossal, 1970; Latorre, Ehrenstein & Lecar , 1972; Eisenberg, Hall & Mead, 1973; Ehrenstein, Blumenthal, Latorre & Lecar, 1974; Alvarez, Latorre & Verdugo, 1975).
Following the report that keyhole limpet hemocyanin markedly in- creases the ionic conductance in oxidized cholesterol and brain lipid bilayers (Pant & Conran, 1972), we have recently found evidence that hemocyanin forms discrete channels in lipid bilayers. The channel conduc- tance is constant for negative potentials, with an average value of 2 x 10-ao mho at 0.1 ~ salt concentration, but at high positive potentials the conductance fluctuates between several levels (Alvarez, Diaz & Latorre, 1975).
In this paper, we describe in detail some of the electrical properties of the hemocyanin channel. We have studied both the discrete conductance steps in membranes containing few channels and the continuous conduc- tance changes in membranes with many channels. In particular, we have addressed ourselves to the following questions:
(a) What are the conductance states of individual hemocyanin chan- nels?
(b) Can the properties of the individual channels explain many-channel results?
(c) What do the electrical results imply about the physical basis for voltage-dependent changes in conductance?
Materials and Methods
Experiments reported in this paper were performed on oxidized cholesterol-decane mem- branes. The procedures for forming these membranes have been described elsewhere (Mueller, Rudin, Tien & Wescott, 1964; Ehrenstein et al., 1970; Latorre et al., 1972). Unless otherwise specified, membranes were formed in 0.1M KC1, pH 7 at 25+_1 ~ A few experiments with hemocyanin were also performed on lecithin membranes formed by apposition of
Properties of the Hemocyanin Channel 165
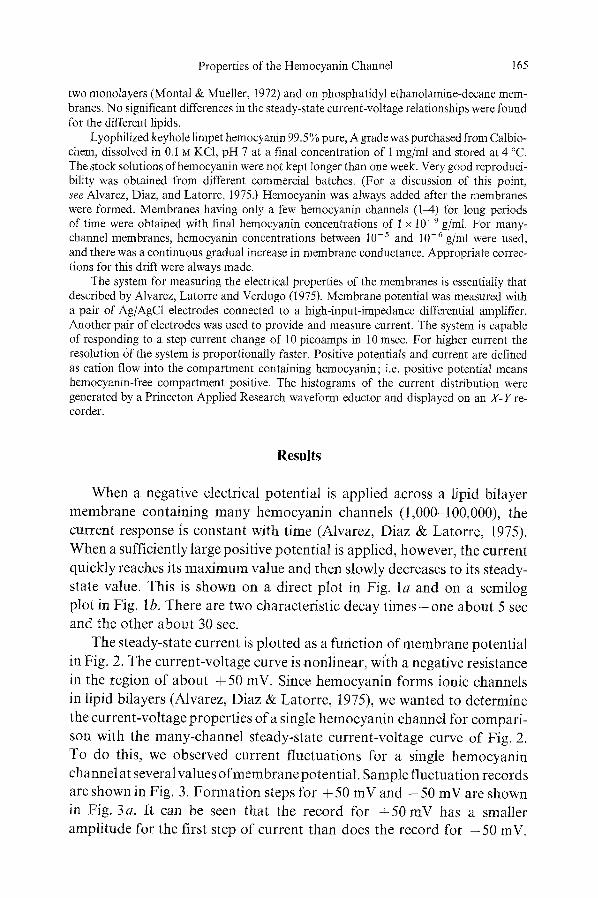
two monolayers (Montal & Mueller, 1972) and on phosphatidyl ethanolamine-decane mem- branes. No significant differences in the steady-state current-voltage relationships were found for the different lipids.
Lyophilized keyhole limpet hemocyanin 99.5 % pure, A grade was purchased from Calbio- chem, dissolved in 0.1 M KC1, pH 7 at a final concentration of 1 mg/ml and stored at 4 ~ The stock solutions ofhemocyanin were not kept longer than one week. Very good reproduci- bility was obtained from different commercial batches. (For a discussion of this point, see Alvarez, Diaz, and Latorre, 1975.) Hemocyanin was always added after the membranes were formed. Membranes having only a few hemocyanin channels (1-4) for long periods of time were obtained with final hemocyanin concentrations of 1 x 10 -9 g/ml. For many- channel membranes, hemocyanin concentrations between 10 -5 and 10-6 g/ml were used, and there was a continuous gradual increase in membrane conductance. Appropriate correc- tions for this drift were always made.
The system for measuring the electrical properties of the membranes is essentially that described by Alvarez, Latorre and Verdugo (1975). Membrane potential was measured with a pair of Ag/AgC1 electrodes connected to a high-input-impedance differential amplifier. Another pair of electrodes was used to provide and measure current. The system is capable of responding to a step current change of 10 picoamps in 10 msec. For higher current the resolution Of the system is proportionally faster. Positive potentials and current are defined as cation flow into the compartment containing hemocyanin; i.e. positive potential means hemocyanin-free compartment positive. The histograms of the current distribution were generated by a Princeton Applied Research wavefoml eductor and displayed on an X - Y re- corder.
Results
When a negative electrical potent ia l is applied across a lipid bilayer
m e m b r a n e conta in ing m a n y hemocyan in channels (1,000-100,000), the
current response is cons tan t with t ime (Alvarez, Diaz & Latorre , 1975).
W h e n a sufficiently large posit ive potent ia l is applied, however, the current
quickly reaches its m a x i m u m value and then slowly decreases to its steady-
state value. This is shown on a direct p lot in Fig. l a and on a semilog
plot in Fig. lb. There are two characterist ic decay t i m e s - o n e about 5 sec and the o ther abou t 30 sec.
The s teady-state current is p lot ted as a funct ion of me mb r a n e potent ia l
in Fig. 2, The current-vol tage curve is nonl inear , with a negative resistance
in the region of abou t + 50 inV. Since hemocyan in forms ionic channels
in lipid bilayers (Alvarez, Diaz & Latorre , 1975), we wanted to determine
the current-vol tage propert ies o f a single hemocyan in channel for compari-
son with the many-channe l s teady-state current-vol tage curve o f Fig. 2.
To do this, we observed current f luc tuat ions for a single hemocyan in
channel at several values o f m e m b r a n e potential . Sample f luc tua t ion records are shown in Fig. 3. F o r m a t i o n steps for + 5 0 mV and - 5 0 mV are shown
in Fig. 3a. It can be seen tha t the record for + 5 0 mV has a smaller ampl i tude for the first step o f current than does the record for - 5 0 inV.

166 R. Latorre, O. Alvarez, G. Ehrenstein, M. Espinoza, and J. Reyes
(a)
15-
c
- - 1 0 -
Z W
0 5
30 6'0 9'0 T I N E [ sec I
fS 300
0 H
C - 1
- 2
0 3'O 6'0 (b) T [ M E [ sec ]
Fig. 1. (a) Time course of current in a many-channel membrane for potential pulse of + 80 mV. (b)Semilog plot of(a). Is~is the steady-state current. Hemocyanin concentration
4 x 10 6 g/ml
Also, there are many current fluctuations at + 50 mV, and only a single current step for - 5 0 inV. Fig. 3 b shows current fluctuations for positive membrane potentials after steady-state was reached (after the membrane potential was held for about 3 rain. Three horizontal lines are shown for each membrane potential between + 30 mV and + 80 mV. The lowest line represents zero membrane current, the next line represents the current through the bilayer before hemocyanin was added, and the top line repre- sents the predicted current for an ohmic channel (the negative of the current measured for a negative potential of the same amplitude). For

Properties of the Hemocyanin Channel I67
I o O
o
I I I I I I I I g o o o g ,~ o o
(soqwoueu) 33NVJ_DRQNO3
+
o
+
o
- - O
- ?
I o
\
?.. J
(Vu~ 1N=I i l l I N ~
i I t ! I I ! !
! o
Z
�9
..O
E E
O
&
�9
O
X
i
O
&
�9 ,> E
O'3
2~

_ ~ o pA 1st 2rid 3rd i r
(a)
10 p A z, th
~ - 1 0 p A '~
5 s e c
5th
~ 10
llOmV
4 o , ~ J
i
6OmV
TOmV
L . . . . . . . . . .
OOmV !
(b)
Fig. 3. Time course of current in a single-channel membrane (a) for potential steps of + 50 mV (first and second traces, which were recorded consecutively) and -50 mV (third trace). Several of the discrete conductance levels are labelled, with increasing numbers referring to smaller conductances; (b) for positive steady-state potentials. Three horizontal lines are shown for each membrane potential between 30 and 80 mV. The lowest line represents zero membrane current, the next line represents the current through the bilayer before hemocyanin was added, and the top line represents the predicted current for an ohmic channel. For 20 mV, the top line is not shown because it falls directly on the measured
current

Properties of the Hemocyanin Channel 169
4c
30
20
10
lO
CURRENT [ p A ]
4 6 8
Fig. 4. Three-dimensional graph showing the relative probability that the current through a single channel has a given value for several membrane potentials. Alternate histograms are shaded. The solid curve shows the weighted mean current as a function of membrane
potential
+ 20 mV, only the first two of these lines are shown to avoid interference with the current trace.
The number of conductance levels shown on the records of Fig. 3b is different for different membrane potentials. Also as membrane potential increases, the average conductance decreases. A detailed description of the distribution of conductance levels for the potentials shown in Fig. 3b is given by the histograms of Fig. 4. For clarity, alternate histograms are shaded. The histograms were obtained by feeding long records of current fluctuations, similar to those of Fig. 3 b, into a pulse height ana- lyzer, and recording the time in each 0.2 picoamp current increment. The currents shown in Fig. 4 are the currents through the hemocyanin channel, and were obtained by subtracting the current through the bilayer from the measured currents. Fig. 4 shows that for each membrane potential there are discrete conductance levels. The number and distribution of these levels depends upon membrane potential. The solid curve in the current-voltage plane represents the weighted average current of the several discrete levels as a function of membrane potential for a single channel.

170 R. Latorre, O. Alvarez, G. Ehrenstein, M. Espinoza, and J. Reyes
2
2 r~
I~-~
w n.
or
1
0 i i i i i 0
0 20 40 60 80 100 mV
Fig. 5. Comparison of the steady-state current for a many-channel membrane (open circles) with the average weighted mean current for several single-channel membranes (closed circles) as a function of membrane potential. Left-hand ordinate scale applies to single-channel
membranes and right-hand ordinate scale applies to many-channel membranes
The average of the weighted mean currents for several single-channel membranes is shown as a function of membrane potential by the closed circles in Fig. 5. For comparison, the open circles and the smooth curve represent the current-voltage curve for a many-channel membrane (with a different current scale). This many-channel curve was obtained under the same conditions as Fig. 2, but for a different membrane. The similarity in the shapes of the two types of current-voltage curve demonstrates that the conductance of the many-channel membranes is proportional to the average conductance of single channels. Thus, in a many-channel membrane, the channels act independently of each other.
The discrete currents shown by the histogram of Fig. 4 represent the conductance states with the largest probability of occurrence at each mem- brane potential. These are the states that contribute appreciably to the average conductance shown in Fig. 5. In order to obtain a more complete set of conductance states for each membrane potential-including states with low probabilities of occurrence - we measured discrete current levels directly from records such as Fig. 3a. These current levels are shown as a function of membrane potential in Fig. 6. Since the points in Fig. 6 seem to fall naturally onto four curves, the points corresponding to each curve were identified by a different symbol. Smaller currents-perhaps

Properties of the Hemocyanin Channel 171
8 - -
6 -
v I---
,,z, 4 r rr"
( 3
2
I I I I I I I I I I i /
/ �9
i
l I I I 0 20 40 60 80 100
POTENTIAL (mV)
Fig. 6. Current-voltage curves for the several discrete states of a single hemocyanin channel. The dashed line is the predicted current-voltage relation for the uppermost discrete conduc-
tance level if the channel were ohmic
corresponding to a fifth curve - were sometimes observed, but are omitted
for clarity. The curves shown in Fig. 6 are the current-voltage relations
for four discrete states of a single hemocyanin channel. An alternative
i n t e rp r e t a t i on - tha t the several levels shown in Fig. 3a correspond to
several c h a n n e l s - c a n be ruled out because only one conductance level
can be observed for negative membrane potentials, and this conductance does not vary from experiment to experiment.
Fig. 6 shows that at least three of the discrete levels have nonlinear current-voltage curves. In order to gain insight into the significance of these nonlinearities, we tried to determine the electrical properties of the discrete levels with faster time resolution than was afforded by the single- channel measurements summarized in Fig. 6. Because of the sensitivity required for these single-channel measurements, the time resolution was limited to about 5 msec. For many-channel membranes, we were able to obtain time resolution about one hundred times faster. It is sometimes

172 R. Latorre, O. Alvarez, G. Ehrenstein, M. Espinoza, and J. Reyes
i '"100 ~usec D
ll| uA
iii
U Fig. 7. Time course of current in a many-channel membrane with fast time resolution for potential pulses of + 100 mV (upper curve) and - 100 mV (lower curve). Hemocyanin con-
centration 1.9 x 10- s g/ml
possible to apply the fast time resolution available with many-channel membranes to obtain information about single-channel discrete states. To do this, it is necessary to insure that each channel is in the same discrete state. For hemocyanin, a holding potential less than + 10 mV will insure that each channel is in the uppermost discrete state of Fig. 6 (cf. Figs. 2 and 4). Therefore, it is possible to obtain fast time resolution for the uppermost discrete state by using a zero holding potential. Since the characteristic time for transitions between discrete states is of the order of seconds, we kept the membrane at zero holding potential for several minutes to insure that all channels were in the uppermost discrete state, and then limited the test period of the channels to several milliseconds to insure that during the test period they remained in the uppermost discrete state.
The simplest example of fast time resolution is shown in Fig. 7. After a long period at zero membrane potential, pulses of + 100 mV were applied and the current responses recorded. It can be seen qualitatively that the difference in current response for + 100 mV and - 100 mV develops with a characteristic time shorter than one millisecond. A quantitative descrip- tion of the development of the nonlinear current response is given by Fig. 8, where the difference between the current during the - 100 mV pulse and the current during the + 100 mV pulse is shown as a function of time. Experimental values of current differences are shown for times later than 100 l.tsec after the onset of the pulse. For shorter times, the large capacitative transient obscures the current records. The curve in Fig. 8 represents the best fit of the experimental points to a single exponen- tial. The relaxation time is about 300 lasec. The extrapolation of the curve

Properties of the Hemocyanin Channel 173
0.5
0.4 A
u 0.3 Z W rY
IL l 1.1_ I,I.
0.2
l a . l
::' 0.1
I I I I I I 0.1 0,2 0.3 0.4 0.5 0.6
TIME ( m s e c )
Fig. 8. Time course of difference between the two currents shown in Fig. 7
in Fig. 8 through the origin indicates that for zero holding potential the instantaneous currents are equal for pulses of + 100 mV and - 1 0 0 inV. Hence, the instantaneous current-voltage curve for the uppermost discrete state in Fig. 6 is linear about the origin.
The linearity of the instantaneous current-voltage curve for a discrete state is an important point (cf. Discussion), and we wanted to test it for regions of the uppermost discrete state other than the origin. To do this, we applied conditioning pulses thet were long compared to the 300 gsec time required to reach steady state within the uppermost discrete levels but short compared to the time of several seconds required for transitions to different discrete levels. The conditioning pulse was followed by test pulses of equal amplitude and opposite sign added to the condition- ing pulse. A typical voltage sequence is shown in the upper part of Fig. 9. Fig. 9 is a photograph of a dual beam oscilloscope screen. The upper trace records membrane potential at slow speed and the lower trace records membrane current at fast speed. The dark, blurred portion of the voltage trace indicates the time interval that is expanded in the current trace. The instantaneous current corresponding to each of the test pulses was obtained from the current traces by extrapolation and correction for capa- citative current. These instantaneous currents were then used for Fig. 10, as described below.
The open circles and smooth solid curve in Fig. 10 show the many- channel current-voltage curve measured at 10 msec after the application

174
/ R. Latorre, O. Alvarez, G. Ehrenstein, M. Espinoza, and J. Reyes
\
- ~ .
i -
t ', t t { I ~ J, I I I t I t I I I I t t t ~ 4 -
4 -
4 -
~,. IP
Fig. 9. Upper trace : potential sequence used to determine instantaneous current-voltage curves shown in Fig. 10. 50 mV/large vertical division; 2 msec/large horizontal division. Potential is held at 75 mV for about 10 msec, and subsequently at +50 or § 100 mV. Lower trace:
time course of current in a many-channel membrane with fast time resolution for the potential sequence shown in upper trace. 50 nA/large vertical division; 100 Ixsec/large horizontal divi-
sion. Hemocyanin concentration 5 x 10⁻⁶ g/ml
of each potential for zero holding potential. The 10-msec durat ion is short enough so that the channels remain in the uppermost discrete level and long enough so that the steady state of this discrete level is reached. Therefore, the solid curve in Fig. 10 should be proportional to the upper- most discrete state for single channels shown in Fig. 6. This is, in fact, observed, with a constant of proportionali ty of about 10,000, indicating the number of channels in the membrane. The instantaneous currents following the conditioning pulse of 75 mV, corresponding to Fig. 9, are shown in Fig. 10 by the closed triangles. Instantaneous currents following conditioning pulses of 50 mV and 25 mV are shown by dosed squares and closed circles, respectively. For each conditioning pulse, the line con- necting the two instantaneous currents in Fig. 10 passes through the origin

Properties of the Hemocyanin Channel 175
/ /
1 0 0
A
!,~
/ /
/
- 5 0
/ �9 /
, i / / �9
/ I I J / I I "~
/ I I
/ / I ~
/ f ~ J '
j f l i
j ' f / t
~ t - "
I I I I I 2 0 4 0 6 0 8 0 :100
POTENTIAL (mV)
Fig. 10. The open circles and the solid curve describe the steady-state current-voltage relation for the uppermost discrete level of Fig. 6. �9 Instantaneous current for +45 mV pulse follow- ing 25 mV prepulse (cf Fig. 9); �9 Instantaneous current for + 40 mV pulse following 50 mV prepulse; �9 Instantaneous current for 2 25 mV pulse following 75 mV prepulse. Hemocyanin
concentration 5 x 10 6 g/ml
4
x
I I I I I �9 0 0.2 0.4 0.6 0.8 1.0 1.2
KCI ACTIVITY (Molar)
Fig. 11. Single-channel conductance for the uppermost discrete level of Fig. 6 as a function of KC1 activity for two values of membrane potential. Each point is determined from }he height of the current step caused by the appropriate potential step. The curves are best fits of the data to Eq. (4). For +100 mV, K = l . 7 x 10 -6 mho cm3/mole and T=3.2 nsec.
For - 100 mV, K= 5.8 x 10- 6 mho cm3/mole and T=4.0 nsec

176 R. Latorre, O. Alvarez, G. Ehrenstein, M. Espinoza, and J. Reyes
and through the steady-state current corresponding to that conditioning pulse. Thus, the instantaneous current-voltage curve for the uppermost discrete level is linear in the regions about 25, 50, and 75 inV.
All the data previously described was obtained for membrane in 0.1 g KC1. In a search for experimental information relating to channel struc- ture, we measured single-channel conductance over a range of salt con- centrations. Fig. 11 shows the single-channel conductance for the upper- most discrete level of Fig. 6 as a function of KC1 activity for membrane potentials of + 100 mV and - 100 mV. The points were determined from the heights of the current steps caused by potential steps of + 100 mV. Each curve in Fig. 11 shows the basic features of saturation, but the detailed saturation properties differ for the different applied potentials. In particular, saturation is reached at lower concentration for more nega- tive potentials.
Discussion
There are basically two ways in which a many-channel membrane can exhibit voltage-dependent conductance:
1) In response to a change in membrane potential, channels may un- dergo transitions between discrete conductance states. (The formation of a channel may be regarded as a special case of this mechanism, where one of the discrete states has zero conductance.)
2) The discrete states of a single channel may, themselves, have non- linear current-voltage properties.
For EIM and alamethicin channels, which exhibit pronounced voltage- dependent conductance, the discrete conductance states have been explic- itly described (Ehrenstein et al., 1970; Eisenberg et al., 1973). For both types of channels, each discrete single-channel conductance state has an approximately linear current-voltage relation in the region of - 1 0 0 to + 100 mV. The voltage-dependent conductance of the many-channel mem- branes arises because the distribution of channels among the different conductance states is voltage-dependent.
Many-channel hemocyanin membranes also exhibit pronounced vol- tage-dependent conductance (cf. Fig. 5), but the discrete single-channel states are clearly nonlinear, as shown in Fig. 6. The distribution of hemo- cyanin channels among the several discrete single-channel states is also voltage-dependent, as shown in Fig. 4. Thus, hemocyanin exhibits both mechanisms for voltage-dependent conductance described above. The way in which voltage-dependence of the distribution of channels among differ-

Properties of the Hemocyanin Channel 177
ent discrete single-channel states leads to the observed electrical properties of many-channel membranes has already been described in the work on EIM and alamethicin. In this paper, we will concentrate on describing the other type of voltage-dependent conductance exhibited by hemocyanin channels - the nonlinear electrical behavior exhibited by the discrete single- channel states. In this regard, a fundamental question to consider is whether the nonlinearities in Fig: 6 are based on the electrical response of ions passing through a channel or on changes of the channel itself.
If the nonlinearity of the current-voltage curves in Fig. 6 is an ionic effect, i.e., is based on the behavior of ions passing through a fixed channel, then it should have a relaxation time comparable to the ion redistribution time, which has been estimated to be about 10 -9 sec (Cole, 1965). (This estimate assumes that ion mobilities within the channel are comparable to those in free solution. This is a reasonable assumption for a hemocyanin channel in view of its relatively large unit conductance.) If the relaxation time is much slower than 10 .9 sec, then the nonlinearity in Fig. 6 must be based on changes of the channel. As shown in Figs. 7, 8 and 9, the relaxation time for the uppermost discrete state in Fig. 6 is of the order of 10 -4 sec. This means that hemocyanin channels can undergo some sort of physical change with a relaxation time of 10 -4 sec as well as the slow discrete changes shown in Fig. 3.
Although the relatively slow relaxation time of 10-4 sec demonstrates that at least some of the nonlinearity in Fig. 6 is caused by actual changes in the hemocyanin channels, it does not by itself rule out the possibility of additional nonlinearity based on ionic behavior. This possibility is ruled out, however, by the linearity of the instantaneous current-voltage curves shown in Figs. 8 and 10. Thus, all of the nonlinearity in Fig. 6 is caused by voltage-dependent changes in the hemocyanin channel.
The mechanism described above is quite different from the mechanism proposed by Lfiuger (1973) to explain the less-pronounced nonlinear cur- rent-voltage relations of single gramicidin channels. Lfiuger proposed that there is a fixed channel structure that does not change with voltage, and that the nonlinear behavior arises because of the particular potential profile experienced by ions traversing the gramicidin channel. This model implies that the relaxation time is comparable to the ion redistribution time. It would be interesting to use the experimental method described above to set limits on the single-channel relaxation time as one test of the potential profile model for gramicidin.
Do the voltage-dependent changes of hemocyanin channels with relaxa- tion times of about 10 -4 sec occur relatively continuously or in a few
178 R. Latorre, O. Alvarez, G. Ehrenstein, M. Espinoza, and J. Reyes
discrete steps? The smoothness of the relaxation curves in Fig. 7 and Fig. 9 might be regarded as evidence for continuous changes in the channel. As previously explained, however, even though these curves show the relaxation times for single-channel states, they are really curves for many- channel membranes. If the single channels had discrete steps of about 10 -4 sec duration, they would be smoothed out in these many-channel records. Putative discrete steps of about 10-4 sec duration could not be directly detected by single-channel records, either, because of the limited time resolution available at low levels of current. The best information we have relating to this question is the shape of the current-voltage curve for the uppermost discrete level in Fig. 6. We know that all the nonlinearity of this curve is caused by voltage-dependent changes in the hemocyanin channel. If there were only a few discrete changes, there would be only a few discrete values for the chord conductance along this curve. The smooth, continuous behavior of this current-voltage curve indicates that the 10- 4 sec relaxation process is a relatively continuous function of vol- tage.
Both the slow, discrete changes and the more rapid, continuous changes of hemocyanin channel conductance contribute to the overall shape of the many-channel current-voltage curve. A rough estimate of the relative importance of the two effects can be made by comparing the rectification ratios of the many-channel steady-state current-voltage curve of Fig. 2 and the single-channel discrete-state current-voltage curves of Fig. 6. For the many-channel curve, the chord conductance decreases about sixfold between + 10 mV and +80 mV. In the same voltage interval, the chord conductances for the upper three curves of Fig. 6 decrease between twofold and threefold. Thus, the slow, discrete changes and the fast, continuous changes of hemocyanin channel conductance each make a comparable contribution to the overall shape of the many-channel current-voltage curve.
One consequence of the two types of conductance change in hemo- cyanin channels is that the same value of conductance may arise in more than one way. For example, a channel in the uppermost discrete level at +80 mV has the same conductance as a channel in the next lower discrete level at +50 inV. As a corollary, there is not a unique relation between structure and conductance.
In addition to the unique gating properties described above, hemo- cyanin channels also have unique saturation properties. Fig. 11 shows the single-channel conductance for the uppermost discrete level of Fig. 6 as a function of the activity of the solutions bathing the membrane. The shape of this curve changes continuously as a function of membrane

Properties of the Hemocyanin Channel 179
potential. (For clarity, curves are shown for only two values of membrane potential.) As previously indicated, within the uppermost discrete conduc- tance level there are voltage-dependent changes in the channel that are continuous and have a relaxation time of about 10-4 sec. These changes must be responsible for the changes in saturation properties that occur when membrane potential is changed.
We will attempt to provide some insight into the continuous changes of the hemocyanin channel by consideration of the saturation properties. To do this, we will use a model for saturation based on the assumption that no more than one ion can be in a given pore at a given time (Hladky & Haydon, 1970; Hille, 1971; L~uger, 1973). In this model, the mean time that an ion spends in the channel is an important parameter. If this time is long enough and ions enter the channel fast enough, the channel will be occupied for a substantial fraction of time. Since an occu- pied channel cannot accept an additional ion, it becomes more difficult to increase the current through the channel, thus causing saturation. This model can be described quantitatively as follows :
Let 2 ~channel conductance K = constant of proportionality C ~ salt activity
f ~probabil i ty that channel is occupied T = mean time an ion spends in channel R ~ rate of ions entering channel.
The channel conductance is proportional to the salt concentration and to the probability that the channel is available. The probability that the channel is available is simply (l-J). Therefore,
2 =KC(1-J). (1)
f i s equal to the product of the mean time an ion spends in the channel and the rate of ions entering the channel. Thus,
f= TR, (2)
R is proportional to channel conductance. For 2 in units of mhos and an applied potential 100 mV in magnitude,
R=0.625 x 10 is 2. (3)
(The constant in Eq. (3) is obtained by dividing the current corresponding to 100 mV and 1 mho by the charge of an electron.) Combining Eqs. (1),
(2), and (3), KC
2 = 1 +0.625 x l0 ss KTC" (4)
180 R. Latorre, O. Alvarez, G. Ehrenstein, M. Espinoza, and J. Reyes
Eq. (4) is a saturation equation. For low concentration, conductance is proportional to activity, and for high concentration, conductance is inde- pendent of activity. Eq. (4) was fit to our experimental data using MLAB (Knott & Reece, 1972) for _+ 100 mV, as shown in Fig. 11. The para- meter K, which is a measure of conductance at low concentration, is about 3.5 times larger at - 1 0 0 mV than at + 100 inV. This variation of K can be interpreted as a variation of the probability of an ion getting into the channel. T, which is determined by the maximum conductance, is approximately the same for the two potentials. At - 1 0 0 mV, T = 4 . 0 n s e c and at + 1 0 0 m V , T=3.2 nsec. Thus, the average time an ion spends in the channel does not vary for all the continuous changes of the channel within the uppermost discrete level, but the probability of an ion getting into the channel does vary. This can be described by a barrier model where the ionic potential profile within the channel .does not change, but the ionic barriers at the inner and outer surfaces of the channel do change. The model implies that the continuous changes in channel conductance correspond to conformational changes at the edges of the hemocyanin channel.
Another property that can provide information about channel structure is ionic selectivity. Preliminary experiments have shown that the hemo- cyanin channel is highly selective to cations relative to anions, but that there is not a large selectivity between different monova len t cations. A more detailed examination of selectivity is in progress.
There are now three types of channels exhibiting voltage-dependent conductance where single-channel properties have been determined: EIM, alamethicin, and hemocyanin. As we have shown, hemocyanin differs from both EIM and alamethicin in that discrete states of individual hemo- cyanin channels have voltage-dependent conductance and in that for at least one discrete single-channel state, the current through the hemocyanin channel saturates with increasing salt concentration. There are several ways in which hemocyanin is similar to ElM and differs from alamethicin :
1) For equal salt Concentration on both sides of the membrane, the current-voltage curve of hemocyanin has a negative resistance region.
2) The hemocyanin channel first appears in the membrane in its upper- most discrete level.
3) It is possible to obtain a very long record (up to 30 rain) where there is a single hemocyanin channel in the membrane. This indicates that if ~/he conducting channel is an oligomer, it does not readily break up into its monomeric constituents.

Properties of the Hemocyanin Channel
References
181
Alvarez, O., Diaz, E., Latorre, R. 1975. Voltage-dependent conductance induced by hemo- cyanin in black lipid films. Biochim. Biophys. Acta 389:444
Alvarez, O., Latorre, R., Verdugo, P. t975. Kinetic characteristics of the ElM channel in oxidized cholesterol and brain lipid bilayer membranes. J. Gen. Physiol. 65:421
Bean, R.C., Shepherd, W.C., Chan, H., Eichner, J.T. 1969. Discrete conductance fluctuations in lipid bilayer protein membranes. J. Gen. Physiol. 53:741
Cole, K.S. 1965. Electrodiffusion models for the membrane of squid giant axon. Physiol. Rev. 45: 340
Ehrenstein, G., Blumenthal, R., Latorre, R., Lecar, H. 1974. Kinetics of the opening and closing of individual excitability-inducing material channels in a lipid bilayer. J. Gen. Physiol. 63: 707
Ehrenstein, G., Lecar, H. 1972. The mechanism of signal transmission in nerve axons. Annu. Rev. Biophys. Bioeng. 1:347
Ehrenstein, G., Lecar, H., Nossal, R. 1970. The nature of the negative resistance in bimolecular lipid membranes containing excitability-inducing material. J. Gen. Physiol. 55:119
Eisenberg, M., Hall, J.E., Mead, C.A. 1973. The nature of the voltage-dependent conductance induced by alamethicin in black lipid membranes. J. Membrane Biol. 14:143
Gordon, L.G.M., Haydon, D.A. 1972. The unit conductance channel of alamethicin. Biochim. Biophys. Acta 255:1014
Hille, B. 1970. Ionic channels in nerve membranes. Prog. Biophys. Mol. Biol. 21:1 Hille, B. 1971. The permeability of the sodium channel to organic cations in myelinated
nerve. J. Gen. Physiol. 58:599 Hladky, S.B., Haydon, D.A. 1970. Discreteness of conductance change in bimolecular lipid
membranes in the presence of certain antibiotics. Nature 225: 451 Knott, G.D., Reece, D.K. 1972. MLAB : A civilized curve-fitting system. In: Proc. ONLINE
"72 Int. Conf., Brunel University, England 1:497 Konings, W.N., Siezen, R.J., Gruber, M. 1969. Structure and properties of hemocyanins.
VI. Association-dissociation behaviour of Helixpomatia hemocyanin. Biochim. Biophys. Acta 194:376
Latorre, R., Ehrenstein, G., Lecar, H. 1972. Ion transport through excitability-inducing material (EIM) channels in lipid bilayer membranes. J. Gen. Physiol. 60:72
Lfiuger, P. 1973. Ion transport through pores: A rate theory analysis. Biochim. Biophys. Acta 311:423
Montal, M., Mueller, P. 1972. Formation of bimolecular membranes from lipid monolayers and a study of their electrical properties. Proc. Nat. Acad. Sci. USA 69:3561
Mueller, P., Rudin, D.O., Tien, H.T., Wescott, W.C. 1964. Formation and properties of bimolecular lipid membranes. Ree. Prog. Surface Sci. 1:379
Pant, H.C., Conran, P. 1972. Keyhole limpet hemocyanin (KLH)-lipid bilayer membrane (BLM) interaction. J. Membrane Biol. 8:357
van Bruggen, E.F.J., Schuiten, V., Wiebenga, E.H., Gruber, M. 1963. Structure and properties of hemocyanins. III. Electron micrographs of hemocyanins from different gastropoda and crustacea, ft. Mol. Biol. 7:249
van Bruggen, E.F.J., Wiebenga, E.H., Gruber, M. 1962a. Structure and properties of hemo- cyanins. I. Electron micrographs ofhemocyanin and apohemocyanin from Helixpomatia at different pH values, aT. Mol. Biol. 4:1
van Bruggen, E.F.J., Wiebenga, E.H., Gruber, M. 1962 b. Structure and properties of hemo- cyanins. II. Electron micrographs of the hemocyanins of Sepia offieinalis, Octopus vulgaris, and Cancer pagurus. J. Mol. Biol. 4:8